Presentation type:
CL – Climate: Past, Present & Future

The abrupt transient centennial to millennial coolings of the North Atlantic region first described in Greenland ice core isotope records by Hans Oeschger and Willy Dansgaard are now widely recognized as recurrent, abrupt weakenings of the Atlantic meridional overturning circulation (AMOC). A hierarchy of climate models has shown that freshening in the North Atlantic can trigger AMOC collapse or condition unforced AMOC variability.  Yet, the existence of a freshwater trigger is largely untested for most events, and it is also uncertain whether a reduction in freshwater fluxes was necessary to permit the recovery of AMOC.  Decadally resolved stalagmite oxygen isotope records from coastal caves in NW Iberia record changes in the δ18O of the surface eastern North Atlantic which are highly sensitive to the freshwater balance.   Careful refinement of stalagmite carbon isotope proxies to correct for in-cave fractionation effects, has provided an indicator of the abrupt temperature changes caused by AMOC in this region.  These dual indicators resolve the detailed phasing of freshening and past AMOC variations. In stalagmite records spanning late MIS 7 and MIS 6, nearly half of the abrupt coolings have no significant freshening event within a hundred years of the onset of cooling.  In contrast, the millennial coolings at the start of Termination II deglaciation are synchronous with abrupt freshening events.  Thus, triggers of abrupt AMOC weakenings and recoveries may be diverse, and the sensitivity to different triggers may change with the evolution of climatic boundary conditions.  A longer set of stalagmite records provide evidence for more dynamic variations of Northern Hemisphere ice sheets and a succession of positive and negative feedbacks on ice melting rate during deglaciations. 

The recognition of past variation in atmospheric CO2 in ice core archives, first characterized by Hans Oeschger, catalyzed efforts to estimate past atmospheric CO2 from indirect proxies in the deeper past, to better estimate the earth system and cryosphere sensitivity to atmospheric CO2 in warmer than preindustrial periods.  Over the last decades, the challenging path of deriving proxy CO2 records has led to numerous paradoxes in the relationship between climate variables and estimated CO2.  From the marine alkenone-based CO2 proxy, a better representation of the biological processes imprinted on the proxy has improved the relationship between CO2 and climate trends since the mid Miocene.  Such a representation allows more robust estimates of the scope of changes in atmospheric CO2 across climate transitions, although estimates of absolute CO2 still feature high uncertainty.  As orbital resolution CO2 proxy records emerge for past warmer time periods, we are presented with new questions about the relationship between ice growth on Antarctica and CO2, and the carbon cycle processes shifting carbon into and out of the atmosphere on orbital timescales.

How to cite: Stoll, H.: Clarifying past AMOC and climate sensitivity with paleoclimate archives, EGU General Assembly 2025, Vienna, Austria, 27 Apr–2 May 2025, EGU25-4861, https://doi.org/10.5194/egusphere-egu25-4861, 2025.

EGU25-1813 | Orals | CL4.3 | Milutin Milanković Medal Lecture

Understanding Paleoclimatic Inference of Stable Water Isotopes using iTRACE Simulation 

Zhengyu Liu

Stable water isotopes (δ18O) in precipitation are one of the most abundant paleoclimate proxies and have been used to infer temperature changes at high latitude and hydrological changes in the tropics. In spite of much progress, however, fundamental questions on the paleoclimate interpretation of stable water isotopes still remain open. Combing water isotope observations and an isotope-enabled TRAnsient ClimatE simulation of the last 21,000 years (iTREACE-21), I will discuss some recent progresses towards the understanding of paleoclimatic inferences of  δ18O.

I will first discuss the δ18O for the pan-Asian monsoon region. We show that the widespread δ18O variability that is coherent over the Asian monsoon continental region is accompanied by a coherent hydroclimate footprint, with spatially opposite signs in rainfall. This footprint is generated as a dynamically coherent response of the Asian monsoon system to meltwater forcing and insolation forcing, reinforced by atmospheric teleconnections. As such, a widespread δ18O depletion in the Asian monsoon region is accompanied by a northward migration of the westerly jet and enhanced southwesterly monsoon wind, as well as increased rainfall from South Asia to northern China, but decreased rainfall in southern China. 

I will then discuss the temperature effect of polar ice core δ18O, quantitatively, in a new framework called the Unified Slope Equations (USE) that illustrates the general relationship between spatial and temporal δ18O-temperature slopes. The application of USE to the Antarctica in model simulations and observations shows that the comparable Antarctica-mean spatial slope with deglacial temporal slope in δ18O-surface temperature is caused accidentally by the compensation responses between the δ18O-inversion layer temperature relation and the inversion layer temperature itself.  This finding further leads us to propose a paleothermometer that is more accurate and robust than the spatial slope as the present day seasonal slope of -inversion layer temperature, suggesting the possibility of reconstructing past polar temperature changes using present observations.

I will finally discuss the climate interpretation of tropical alpine ice core δ18O by combining proxy records with climate models, modern satellite measurements and radiative-convective equilibrium theory. I show that the tropical ice core δ18O is an indicator of the temperature of the middle and upper troposphere, with a glacial cooling of ~7oC . Furthermore, it severs as a Goldilocks indicator of global mean surface temperature change, providing the first estimate of glacial stage cooling that is independent of marine proxies as ~6oC .


How to cite: Liu, Z.: Understanding Paleoclimatic Inference of Stable Water Isotopes using iTRACE Simulation, EGU General Assembly 2025, Vienna, Austria, 27 Apr–2 May 2025, EGU25-1813, https://doi.org/10.5194/egusphere-egu25-1813, 2025.

EGU25-16597 | Orals | CL3.2.4 | CL Division Outstanding ECS Award Lecture

Physical drivers and statistical properties of high impact climate extremes  

Kai Kornhuber

Accurately modeling emerging physical climate risks to natural and societal systems—such as global supply chains, the food system, health, and critical infrastructures—is essential for effective preparedness and honest discussions about the consequences of rising greenhouse gas emissions.

A series of anomalous weather events that shattered previous records by wide margins has —yet again—highlighted the need for an improved understanding of the physical processes behind weather and climate extremes, their statistical characteristics, and our ability to project them under future emission scenarios using climate models.

In this Award lecture, I will present an overview of recent studies and preliminary findings that explore the mechanisms and physical drivers of high-impact climate extremes, as well as their statistical characteristics, such as simultaneous or sequential occurrences, which can lead to high societal impacts under current and future climate conditions and will reflect on our capacity to reproduce such events in climate models.

How to cite: Kornhuber, K.: Physical drivers and statistical properties of high impact climate extremes , EGU General Assembly 2025, Vienna, Austria, 27 Apr–2 May 2025, EGU25-16597, https://doi.org/10.5194/egusphere-egu25-16597, 2025.

Tomato production is vital to Central India's agricultural output and plays a significant role in the region's economy. However, the escalating impacts of climate change pose a serious threat to the sustainability and productivity of tomato farming in this region. This study assesses the effects of variations in solar radiation and temperature on tomato yields utilizing a calibrated process-based crop simulation model (CSM). Climate forecasts utilizing SSP4.5 and SSP8.5 pathways were applied to model yields in near (2010-2039) and mid-future (2040-2069) scenarios. Significant findings indicate a large reduction in yield potential, particularly under mid-future high-emission scenarios (SSP8.5), accompanied by considerable geographical variability. Regions such as Damoh and Western Nimar demonstrate enhanced resilience owing to advantageous local climatic circumstances, whilst areas like the Kymore Plateau and Bundelkhand Agro-Climatic zone display the most significant decreases. Key developmental phases, including flowering and fruit set, are especially susceptible to elevated temperatures and diminished solar radiation. This research highlights the need for region-specific adaptation techniques to alleviate climate impacts, including modifying planting schedules and adopting heat-tolerant varieties. These insights offer a crucial basis for policymakers and farmers to guarantee the sustainability of tomato production in Central India under changing climate circumstances.

Keywords: Crop Simulation Model (CSM), Tomato Yields, GCMs, Central India, policymakers

How to cite: Singh, P. N. and Srivastava, P. K.: Quantifying Climate Impact on Tomato Production in Central India: A Process-Based Yield Simulation for Near and Mid-Future Scenarios, EGU General Assembly 2025, Vienna, Austria, 27 Apr–2 May 2025, EGU25-544, https://doi.org/10.5194/egusphere-egu25-544, 2025.

EGU25-1831 | ECS | Posters virtual | VPS5

Quanatifying the contributions of internal varibility in South Asian near-surface wind speed 

Hui-Shuang Yuan and Cheng Shen

Near-surface wind speed (NSWS) plays a critical role in water evaporation, air quality, and energy production. Despite its importance, NSWS changes in South Asia, a densely populated region, remain underexplored. This study aims to understand and quantify the uncertainties in projections of NSWS over South Asia, particularly in relation to internal variability. Utilizing a 100-member large ensemble simulation from the Max Planck Institute Earth System Model, we identified the Interdecadal Pacific Oscillation (IPO) as the leading mode of internal variability influencing South Asian NSWS in the near future. Our findings reveal that the IPO could significantly impact future NSWS, with its positive phase being linked to strengthened westerly flows and increased NSWS across South Asia. Notably, the study shows that accounting for the IPO's impact could reduce NSWS projection uncertainty by up to 8% in the near future and 15% in the far future. This underscores the key role of internal variability, particularly the IPO, in shaping regional NSWS projections. By reducing uncertainties in these projections, our findings can inform climate adaptation strategies for South Asia, helping optimize wind resource assessments in the context of changing wind patterns.

How to cite: Yuan, H.-S. and Shen, C.: Quanatifying the contributions of internal varibility in South Asian near-surface wind speed, EGU General Assembly 2025, Vienna, Austria, 27 Apr–2 May 2025, EGU25-1831, https://doi.org/10.5194/egusphere-egu25-1831, 2025.

EGU25-1959 | Posters virtual | VPS5

A Comparative Analysis of Data-Driven Machine Learning Models for Rainfall Forecasting in Bangladesh 

Mir Mahmid Sarker, Arish Morshed Zobeyer, Tasnuva Rouf, and S M Mahbubur Rahman

Accurate rainfall forecasting is crucial for effective urban planning and disaster management in Dhaka, the capital of Bangladesh, a city highly vulnerable to urban flooding and extreme weather events. Traditional forecasting methods often struggle to capture the region's complex rainfall patterns, resulting in inaccurate rainfall forecasts. This study evaluates the performance of two traditional machine learning algorithms, Random Forest Regression and Multi-layer Perceptron (MLP), alongside one deep learning algorithm, the Long Short-Term Memory (LSTM) network. These models are trained and tested to forecast rainfall over 1 to 5-day lead times, emphasizing their ability to handle temporal dependencies in time series data. Atmospheric and hydrologic variables, including temperature, surface pressure, evaporation, solar surface radiation, total column rainwater, large-scale precipitation, and total cloud cover, from the ECMWF (European Centre for Medium-Range Weather Forecasts) Reanalysis v5 (ERA5) dataset, were used as model inputs. Model forecasts were validated against ERA5 rainfall data and compared with the forecasts from the Global Forecast System (GFS) model. Results indicate that the Random Forest model outperforms all others, achieving an RMSE of 6.11 mm and Pearson’s correlation coefficient (R) of 0.74 for a 1-day lead time. The LSTM model achieved an RMSE of 7.46 mm, while the MLP performed less effectively than both RF and LSTM, with an RMSE of 7.61 mm. In comparison, the GFS forecasts displayed an RMSE of 9.16 mm. The RF model outperformed the other models at all lead times; however, its accuracy decreased as the lead time increased. This study highlights the potential of machine learning to improve short to medium range rainfall forecasts, contributing to timely decision-making for urban resilience and resource management.

How to cite: Sarker, M. M., Zobeyer, A. M., Rouf, T., and Rahman, S. M. M.: A Comparative Analysis of Data-Driven Machine Learning Models for Rainfall Forecasting in Bangladesh, EGU General Assembly 2025, Vienna, Austria, 27 Apr–2 May 2025, EGU25-1959, https://doi.org/10.5194/egusphere-egu25-1959, 2025.

EGU25-2071 | ECS | Posters virtual | VPS5

Enhancing Heavy Rainfall Predictions Over Vulnerable Regions in Assam Using a Spatial Attention-Based Deep Learning Network 

Dhananjay Trivedi, Sandeep Pattnaik, and Omveer Sharma

Forecasting extreme rainfall events (EREs) locally is a major difficulty for meteorological organizations in India's diverse topography, including Assam, Uttarakhand, and Himachal Pradesh. Flash floods cause major socioeconomic damage in certain areas. These extremes are increasingly commonplace during the southwest monsoon season in the country and one of the most destructive EREs occurred in June 2022 and 2023 over Assam. This work explores deep learning (DL) models, specifically spatial attention-based U-Net, in conjunction with simulated daily collected rainfall outputs from different parametrization schemes rainfall output from the Weather Research and Forecasting (WRF) model, considering the limitations of deterministic numerical weather models in accurately forecasting these events. The model trained over the districts of Assam for all days (days 1-4) except the districts where the EREs occurred. The suggested model exhibited a greater ability to predict rainfall at the district scale with a mean absolute error of less than 10 mm over four days in June 2022, outperforming both individual and ensemble outputs of WRF. Furthermore, the suggested model had a high prediction accuracy of 91.9% in categorical rainfall prediction, outperforming WRF models by 51.3%. Furthermore, by accurately forecasting EREs at the district level, including Barpeta, Kamrup, Kokrajhar, and Nalbari, the suggested model has shown improved spatial variation when compared to the WRF model. The suggested DL model is tested for real-time ERE events over Assam in June 2023. In the second part, the model has trained for ERE occurred in 2022 and tested for 2023 over Assam at the district level. The district-level performance of the DL and WRF models is compared, and the DL model performs better than the WRF model in capturing EREs, with a noteworthy accuracy of 54.4% compared to only 22.8% for the WRF model. Notably, the DL model accurately represents the amount and severity of rainfall in Assam's western and southern regions. In summary, the study's conclusions directly affect the development of effective strategies for increased preparedness, mitigation, and adaptation measures over complex hilly regions to lessen the loss of life and property, as well as the improvement of early warning systems and related follow-up action.

How to cite: Trivedi, D., Pattnaik, S., and Sharma, O.: Enhancing Heavy Rainfall Predictions Over Vulnerable Regions in Assam Using a Spatial Attention-Based Deep Learning Network, EGU General Assembly 2025, Vienna, Austria, 27 Apr–2 May 2025, EGU25-2071, https://doi.org/10.5194/egusphere-egu25-2071, 2025.

EGU25-3766 | Posters virtual | VPS5

Seasonal Predictability of Late-Spring Precipitation in the Southern Great Plains  

Yoshimitsu Chikamoto, Simon Wang, Hsin-I Chang, and Christopher Castro

The Southern Great Plains are subject to fluctuating precipitation extremes that pose significant challenges to agriculture and water management. Despite advancements in forecasting, the mechanisms driving these climatic variations remain incompletely understood. This study investigates the relative contributions of the tropical Pacific and Atlantic Oceans to April-May-June precipitation variability in this region. Using partial ocean assimilation experiments within the Community Earth System Model, we identify a substantial influence of inter-basin interactions, with the Pacific and Atlantic contributing approximately 70% and 30%, respectively, to these variations. Our statistical analysis suggests that these tropical inter-basin contrasts offer a more reliable indicator for late-spring precipitation anomalies than the El Niño-Southern Oscillation. This finding is corroborated by analyses from seven climate forecasting systems in the North American Multi-Model Ensemble, providing a promising outlook for improving real-time forecasting in the Southern Plains. However, the predictive skill of these inter-basin contrasts is currently limited by the lower predictability of the tropical Atlantic, underscoring the need for future research to enhance climate prediction models.

How to cite: Chikamoto, Y., Wang, S., Chang, H.-I., and Castro, C.: Seasonal Predictability of Late-Spring Precipitation in the Southern Great Plains , EGU General Assembly 2025, Vienna, Austria, 27 Apr–2 May 2025, EGU25-3766, https://doi.org/10.5194/egusphere-egu25-3766, 2025.

The Eddy-Diffusivity Mass-Flux (EDMF) parameterization (Giordani et al., 2020) offers a new, coherent way to simultaneously parameterize local (diffusivity) and non-local (convective thermal) vertical mixing. This second component parametrizes sub-grid-scale convective plumes propagating through the water column which, through energy conservation, can propagate counter to the stratification gradient. The EDMF scheme is assessed in a 13-year global ¼° coupled NEMO4.2-SI3 simulation, forced by ERA5 atmospheric reanalysis. Its performance in representing observed ocean temperatures is compared to that of a twin simulation using the commonly applied Enhanced Vertical Diffusivity (EVD) parameterization.

The EDMF simulation shows globally reduced temperature biases relative to in-situ observations (0–700 m) compared to the EVD simulation, with similar RMSD (Root Mean Square Deviation) values between the two. By better representing tropical night-time shallow convection, EDMF reduces the cold bias typically observed in EVD simulations within the tropical ocean. We show that the horizontal scales (convective areas), penetration depths and vertical velocities of the simulated plumes agree with measurements of deep convective plumes in the Labrador Sea, and with diurnal convection in the equatorial Pacific Ocean. Additionally, first estimates of convection's contribution to Ocean Heat Content are proposed.

How to cite: Piton, V., Bourdallé-Badie, R., and Giordani, H.: The Eddy-Diffusivity Mass-Flux parameterization: improved representation of convective mixing, global evaluations and implications for Ocean Heat Content, EGU General Assembly 2025, Vienna, Austria, 27 Apr–2 May 2025, EGU25-4069, https://doi.org/10.5194/egusphere-egu25-4069, 2025.

EGU25-6364 | Posters virtual | VPS5

The double emergence of TCRE 

Andrew MacDougall and Alexander MacIsaac

The TCRE relationship underlies the necessity of net zero emissions for climate stabilization and the utility of carbon budgets as a policy tool. TCRE emerges near universally from Earth system models, and is consistent with observations. However, recent work has systematically dismantled the leading hypothesis explaining the phenomenon, concluding “that this proportionality is not amenable to a simple physical explanation, but rather arises because of the complex interplay of multiple physical and biogeochemical processes.'' (Gillett, 2023). Here we set two intermediate complexity Earth system models (EMICs) to abiotic states, then turn on broad components of Earth's biogeochemical cycles one at a time to see which combination of processes cause TCRE to emerge.

We find that TCRE emerges when ocean alkalinity is set to observed values, without life on land. TCRE likewise emerges independently when the terrestrial biosphere is turned on, with the ocean in an abiotic low alkalinity state. Idealized experiments with the EMICs show that TCRE occurs for configurations of the Earth system where characteristic timescales of carbon absorption and heat absorption are nearly the same. Our results suggest that the emergence of TCRE does in-fact rely on a simple physical mechanism, but why the living components of Earth system are matching the characteristic timescale of carbon absorption to that of heat remains mysterious.

Gillett, N.P.: Warming proportional to cumulative carbon emissions not explained by heat and carbon sharing mixing processes. Nature Communications 14(1), 6466 (2023)

How to cite: MacDougall, A. and MacIsaac, A.: The double emergence of TCRE, EGU General Assembly 2025, Vienna, Austria, 27 Apr–2 May 2025, EGU25-6364, https://doi.org/10.5194/egusphere-egu25-6364, 2025.

EGU25-7421 | ECS | Posters virtual | VPS5

Integrating Climate Projections and Geospatial Analysis to Identify Rainwater Harvesting Suitability in Lombok Island, Indonesia 

Afriyas Ulfah, James Renwick, and Restu Patria Megantara

Water scarcity is a growing challenge exacerbated by climate change, particularly in regions like Lombok Island, Indonesia, where water resources are crucial for sustainable development. This research aims to identify suitable locations for Rainwater Harvesting (RWH) by integrating geospatial analysis, the Analytic Hierarchy Process (AHP), and climate projections using CMIP6 data. The study utilizes multiple parameters, including rainfall, land use/land cover (LULC), slope, drainage density, soil texture, and runoff depth, to develop a comprehensive suitability map for RWH.

Historical rainfall data from CHIRPS (1981–2010) and future rainfall projections for mid-century (2031–2060) and end-century (2071–2100) under SSP2-4.5 and SSP5-8.5 scenarios were analyzed to account for climatic variations. Each parameter was processed using geospatial tools, with weights assigned through AHP based on expert input, ensuring a robust multi-criteria decision-making framework. Suitability maps were generated for each temporal scenario, highlighting areas with high to very high potential for RWH, particularly in North and East Lombok.

The results reveal dynamic shifts in RWH site suitability over time, with increasing precipitation under SSP5-8.5 scenarios expanding high-suitability areas. These findings highlight the potential for RWH to manage water resources adaptively in response to projected climate variability. By aligning the outputs with existing water management infrastructure, such as dams, the study provides actionable insights for regional planners and policymakers.

How to cite: Ulfah, A., Renwick, J., and Patria Megantara, R.: Integrating Climate Projections and Geospatial Analysis to Identify Rainwater Harvesting Suitability in Lombok Island, Indonesia, EGU General Assembly 2025, Vienna, Austria, 27 Apr–2 May 2025, EGU25-7421, https://doi.org/10.5194/egusphere-egu25-7421, 2025.

Precisely predicting weather parameters is crucial for precision horticulture, especially in horticultural lands where timely environmental insights significantly impact crop yield and quality. This study presents a novel hybrid modeling approach employing 1D Transformer networks integrated with traditional machine learning techniques to predict hourly temperature variations. Utilizing the ERA5 reanalysis dataset spanning from 1940 to December 2024, the hybrid model efficiently captures location-specific spatiotemporal dependencies and nonlinear trends in historical weather data.

The predicted weather data generated by the hybrid model is used in FarmD, a web-based user interface developed for farmer-centric applications. FarmD provides real-time visualization of critical weather parameters, including temperature, relative humidity, wind patterns, rainfall, and soil temperature, specifically tailored to horticultural regions. Through its intuitive interface, users can query predicted and historical data by selecting attributes, dates, and times, with an option for location-specific searches to support targeted agricultural decision-making.

This integration of predicted data with an accessible web platform highlights significant advancements in delivering actionable insights to end users. By combining advanced computational methods with user-focused design, FarmD enables horticulturists to adopt data-driven practices, contributing to sustainable and efficient agricultural management.

How to cite: Ramalingam, S.: FarmD: A Web Interface for Visualization of Predicted Weather Parameters Using 1D Transformer Hybrid Models, EGU General Assembly 2025, Vienna, Austria, 27 Apr–2 May 2025, EGU25-10613, https://doi.org/10.5194/egusphere-egu25-10613, 2025.

EGU25-11584 | Posters virtual | VPS5

Role of Earth system processes in the Transient Climate Response to cumulative Emissions 

Spencer Liddicoat, Chris Jones, Lina Mercado, Eddy Robertson, Stephen Sitch, and Andy Wiltshire

Estimates of remaining carbon emissions budgets to limit global warming to 1.5°C or 2°C rely on the near-linear relationship between the change in global mean temperature and total CO2 emitted since the pre-industrial era. This relationship is known as the Transient Climate Response to cumulative Emissions (TCRE). Previous estimates of TCRE are derived from Earth System Models (ESMs) which are known to lack key processes that affect warming and therefore diagnosed CO2 emissions. Here we use the UK Earth System Model to quantify, for the first time, the impact on TCRE of including six Earth system processes in isolation (results in parenthesis): fire-vegetation interactions (TCRE increased 14.6%); nitrogen limitation of vegetation (+9.7%); diffuse radiation effects on vegetation (+8.5%); changes in vegetation distribution (-1.5%); climate impacts from wetland methane emissions (+5.1%) and from biogenic volatile organic compounds (-1.4%). From these results we recalculate the TCRE of 11 ESMs of the 6th Coupled Model Intercomparison Project (CMIP6) as though each included all six processes. Averaged over the 11 models, TCRE increased by 23.7%, reducing by 19% the associated remaining carbon budget to both 1.5°C and 2°C.

How to cite: Liddicoat, S., Jones, C., Mercado, L., Robertson, E., Sitch, S., and Wiltshire, A.: Role of Earth system processes in the Transient Climate Response to cumulative Emissions, EGU General Assembly 2025, Vienna, Austria, 27 Apr–2 May 2025, EGU25-11584, https://doi.org/10.5194/egusphere-egu25-11584, 2025.

EGU25-12181 | ECS | Posters virtual | VPS5

Seasonal changes in evaporation and potential evapotranspiration under different scenarios of climate change on the territory of Ukraine 

Valeriia Rybchynska, Larysa Pysarenko, Hanna Pushkar, Mykhailo Savenets, and Volodymyr Osadchyi

Evaporation and potential evapotranspiration are components of hydrological cycle that represent the loss of water from the surface and vegetation to the atmosphere. Potential evapotranspiration is a theoretical index that demonstrates the maximum evaporation and transpiration rates assuming sufficient water availability in soil and canopy. Six identical Regional Climate Models (RCMs) of Euro-CORDEX project were selected in order to obtain a unified ensemble for both characteristics for estimation under RCP2.6, RCP4.5 and RCP8.5 scenarios for the middle (2021-2050) and the end of the 21st century (2071-2100) for Ukraine. ERA5 observational dataset is used as a baseline climate normal (1991-2020) for tracking the future changes. In this study we applied a quantile mapping approach for bias correction for smoothing systematic errors between observational and simulated datasets. For the baseline period, the sums of evaporation varied mainly between 20-30 mm in winter to 250-290 mm in summer, with the exception of the Carpathians and southern regions near marine coastal areas (more than 300 mm). Climate normals of evapotranspiration were zonally distributed with the exception of mountainous region and varies from 20-50 mm in winter to 290-550 mm in summer. The most tremendous changes of evaporation are expected to occur in winter. In general, during the following 30-year period of 2021-2050, the most significant increase by 8-18% (compared to 1991-2020 baseline) would be expected for RCP4.5 with more pronounced increase during 2071-2100, reaching its highest values up to 40% under RCP8.5 The maximum rates are observed in the Carpathians and the northeast of Ukraine. In contrast, evapotranspiration in winter is expected to increase only by 1-6% during 2021-2050 for all RCPs and 12-22% by the end of the century. The Carpathians will face even a decrease by -4%. Changes in evaporation will be lower for the spring season, with changes by 2-4% in 2021-2050 and 6-12% by the end of the century. The highest spring changes up to 28% also will occur in the Carpathians. The same rates are estimated for evapotranspiration, for which the sharpest changes are 10-16% under RCP 8.5 for 2081-2100 In comparison to winter and spring, summer and autumn seasons will face much slower changes. Moreover, summer season will be characterized by a decrease in evaporation at a rate up to -2..-4% under RCP2.6 and varying within ±1% for other scenarios by the mid-century, showing the typical tendencies for so called “evaporation paradox”. In 2071-2100, the decrease can reach by up to-6% for RCP4.5 and RCP8.5. It must be noted the different tendency for evapotranspiration with an increase by 1-6% in general for all RCPs in 2021-2050, and maximum up to 14% by the end of the century. For autumn the most typical increase in both parameters is within 2-6% for all RCPs, with the highest rates of evaporation in the Carpathians up to 15%.  The obtained results show the importance of considering evaporation in future water management, agriculture and food security in Ukraine, highlighting the seasons and regions with it significant changes.  

How to cite: Rybchynska, V., Pysarenko, L., Pushkar, H., Savenets, M., and Osadchyi, V.: Seasonal changes in evaporation and potential evapotranspiration under different scenarios of climate change on the territory of Ukraine, EGU General Assembly 2025, Vienna, Austria, 27 Apr–2 May 2025, EGU25-12181, https://doi.org/10.5194/egusphere-egu25-12181, 2025.

EGU25-14457 | Posters virtual | VPS5

Evaluating the extrapolation capability of deep learning in rainfall-runoff 

Shichida Junsei

Deep learning, a prominent artificial intelligence method, is increasingly applied in research addressing the impacts of global warming in the future. However, it is widely acknowledged that deep learning exhibits limitations in extrapolation, as it typically predicts accurately only within the range of the training data. When future scenarios extend beyond this range, the reliability of predictions can diminish significantly. In Japan, for example, the annual maximum precipitation is reported to be increasing, according to the Japan Meteorological Agency, indicating a potential for future values to exceed historical records. Despite this, limited studies have explored the extent to which deep learning methods can reliably extrapolate beyond the training data range. This study quantitatively evaluates the extrapolation capability of deep learning in hydrology, specifically focusing on rainfall-runoff modeling at the watershed scale. Meteorological data, including precipitation and temperature, are utilized as inputs, while river flow serves as the output. The Long Short-Term Memory (LSTM) model, which is well-suited for time-series data, was employed as the deep learning framework. Data were partitioned into training, validation, and test datasets, with river flow values categorized using threshold percentiles of 90, 95, 97, 98, and 99, rather than conventional time-based splits. This approach allows for a focused investigation into the range of accurate extrapolation beyond the training dataset. Preliminary findings reveal that the LSTM model successfully captured peak river flows up to 250.1% higher than the maximum values of the observed river flow discharge in the training-validation dataset. These results demonstrate the potential for deep learning to extrapolate in hydrological modeling, though further research is necessary to assess the performance of alternative deep learning methods and additional case studies. 

How to cite: Junsei, S.: Evaluating the extrapolation capability of deep learning in rainfall-runoff, EGU General Assembly 2025, Vienna, Austria, 27 Apr–2 May 2025, EGU25-14457, https://doi.org/10.5194/egusphere-egu25-14457, 2025.

EGU25-18989 | ECS | Posters virtual | VPS5

Enhancing Hydrological Processes in Earth System Models: Implementing Groundwater Dynamics for Improved Climate Representations 

Vincenzo Senigalliesi, Andrea Alessandri, Stefan Kollet, Simone Gelsinari, Annalisa Cherchi, and Emanuele Di Carlo

In the context of climate change, a global, widespread shift to increased water limitation is expected over approximately 73% of terrestrial ecosystems, with important implications for food and water security, CO2 uptake, and evaporative cooling. Water-limited regions, exposed to climate-change-related increasing droughts and intense anthropogenic water use, are extremely vulnerable to transitions towards drier eco-hydro-climatological regimes. In the longer term, the ongoing drought conditions may intensify the decline of groundwater levels, threatening groundwater-dependent ecosystems and exacerbating the risk of desertification, thereby amplifying a positive feedback on regional climate change. In some Mediterranean climate-type regions, such as SouthWestern Australia, a dry and warm transition has already been observed. Recent findings are a clear warning that also over the Euro-Mediterranean sector groundwater level may have a negative trend resulting from a decrease in precipitation and/or increasing withdrawal. 

Soil water storage  and groundwater dynamics represent important hydrological processes related to these transitions but they are greatly simplified in state-of-the-art Earth System Models (ESMs). Therefore, it is  essential to improve the representation of hydrological processes and their coupling with the atmosphere and the land surface in ESMs. In this respect, the land surface model included in EC-Earth (ECLAND) still lacks a representation of groundwater and instead implements a free drainage condition at the bottom of the unsaturated soil column. 


In this work, we intend to implement a more realistic groundwater representation in EC-Earth by including a global-scale water table to replace the free drainage bottom boundary condition. As a preliminary measure, the impact of groundwater on the shallow, unsaturated zone is evaluated by constraining the vertical water fluxes with a static water table depth (WTD) derived from a global estimate simulation based on observations. We evaluated the effects of this implementation on water and energy fluxes against a network of stations in land-only simulations from 1979 to the present, with boundary forcing taken from ERA5 reanalysis. First findings suggest that including a WTD has an impact on water exchanges between saturated and unsaturated soil in water-limited regions, particularly in semi-arid and transitional climates, which can not be neglected in Earth system models.

How to cite: Senigalliesi, V., Alessandri, A., Kollet, S., Gelsinari, S., Cherchi, A., and Di Carlo, E.: Enhancing Hydrological Processes in Earth System Models: Implementing Groundwater Dynamics for Improved Climate Representations, EGU General Assembly 2025, Vienna, Austria, 27 Apr–2 May 2025, EGU25-18989, https://doi.org/10.5194/egusphere-egu25-18989, 2025.

EGU25-456 | Posters virtual | VPS6

Temporal characteristics of extreme high temperatures in Wuhan since 1881 

Xiang Zheng, Guoyu Ren, Jiajun He, Yuxinzi Zhao, Yuyu Ren, and Guowei Yang

The construction and analysis of daily temperature data series in long enough a time period is important to understand decadal to multi-decadal variability and changing trends in extreme temperature events. This paper reports a new analysis of extreme temperature indices over the last 140 yr in Wuhan, China, with an emphasis on changes in extreme high temperature changes. The daily temperature data from 9 stations from 1881 to 1950 and 1 modern station from 1951 to 2020 were used for the analysis. Based on the data, and the commonly used extreme temperature indices, the variations and long-term trends of extreme high temperature events in Wuhan since 1881 were analyzed. The results show that there was no clear warming trend in maximum temperature, but a quite large inter-annual and inter-decadal fluctuation. In contrast, there was a very significant increase in minimum temperature, with a large upward trend overall. The extreme temperature indices exhibit a periodic variability, and frequent extreme heat events have been experienced over the last 140 yr in Wuhan. Most extreme temperature indices did not exhibit remarkable changes during the first half of the period analyzed. However, the majority of the extreme temperature indices showed significant upward trends over the latter half of the 140 yr period. The possible causes of the observed changes in the extreme high temperature events in the different time periods are also discussed.

How to cite: Zheng, X., Ren, G., He, J., Zhao, Y., Ren, Y., and Yang, G.: Temporal characteristics of extreme high temperatures in Wuhan since 1881, EGU General Assembly 2025, Vienna, Austria, 27 Apr–2 May 2025, EGU25-456, https://doi.org/10.5194/egusphere-egu25-456, 2025.

EGU25-1411 | Posters virtual | VPS6

Spatial downscaling of urban temperatures: evaluation of an approach using satellite and reanalysis data 

Dominik Kortschak, Heinz Gallaun, Michael Kernitzkyi, Judith Köberl, Petra Miletich, and Manuel Strohmaier

Climate change is expected to exacerbate heat stress, particularly in urban areas where the urban heat island (UHI) effect tends to amplify warming compared to surrounding rural regions. Due to the heterogeneity of urban environments, heat stress can vary significantly within cities. Heat vulnerability maps, which combine data on heat sensitivity, heat exposure and adaptive capacity, are valuable tools for identifying areas that should be prioritized for heat stress mitigation measures. One important component of such heat vulnerability maps is data on the spatial distribution of heat. The present study explores the use of satellite data to generate high-resolution temperature maps, addressing two key challenges in the process.

The first challenge arises from the fact that satellites measure land surface temperature (LST) rather than air temperature (AT), whereas the latter is needed as input for most heat stress indicators. While linear models calibrated with weather station data are frequently used to estimate AT from LST, there are cities where the availability of weather stations is insufficient for calibrating models with multiple control variables. Additionally, the LST-AT relationship depends on the prevailing atmospheric conditions. The second challenge of using satellite data is that satellite images are usually not available on an hourly or daily basis due to factors such as satellite scheduling or excessive cloud cover.

To address the first challenge, we adopt a technique introduced by the ECOSTRESS mission, which leverages reanalysis data (GEOS-5) to estimate AT using LST, the normalized difference vegetation index (NDVI), and albedo. We apply this method to spatially downscaled LST data (100m) from the VIIRS instrument aboard the Suomi NPP satellite, AT reanalysis data from ERA5-Land (9km), as well as NDVI and albedo derived from Harmonized Landsat Sentinel (HLS) data (aggregated to 100m). Applying the method to individual satellite images enables day-specific adjustments for varying atmospheric conditions. To overcome the second challenge, we utilize high-resolution AT maps derived from LST images to calculate spatial patterns of air temperature distribution, which are then used to downscale ERA5-Land AT data for those times without satellite images available.

To evaluate the approach described, it is exemplary applied to various cities, whereby the downscaled temperature estimates are validated against (i) temperature estimates based on alternative methods than the ECOSTRESS technique to derive AT from LST, (ii) weather station data, and (iii) existing results from urban climate models.

How to cite: Kortschak, D., Gallaun, H., Kernitzkyi, M., Köberl, J., Miletich, P., and Strohmaier, M.: Spatial downscaling of urban temperatures: evaluation of an approach using satellite and reanalysis data, EGU General Assembly 2025, Vienna, Austria, 27 Apr–2 May 2025, EGU25-1411, https://doi.org/10.5194/egusphere-egu25-1411, 2025.

EGU25-3194 | Posters virtual | VPS6

IoT-Enabled Underwater Devices and Crowdsourcing for Monitoring Climate Risks at Submerged Heritage Sites 

Marios Vlachos, Panagiotis Michalis, Iasonas Mourounas, Pavlos Koukio, Apostolos Gkatzogias, Anastasios Georgakopoulos, and Angelos Amditis

Underwater cultural heritage, such as ancient shipwrecks and submerged archaeological sites, faces increasing risks from climate-driven environmental changes. Salinity shifts, temperature anomalies, and biofouling contribute to the degradation of these resources [1]. This study explores deploying two IoT-enabled devices with a crowdsourcing strategy to monitor and address these challenges effectively.

The first device, designed for divers, measures pressure, temperature, and salinity during underwater campaigns and can be placed on the seabed for long-term data collection [2]. The second device, used by local communities like fishers and diving centers, is deployable from boats to 2-3 meters, capturing salinity, temperature, and chlorophyll concentration. Each device incorporates a data logger built on a microcontroller, connected to sensors via robust serial interfaces such as RS485. This configuration ensures reliable communication and minimizes signal degradation in challenging underwater conditions. The microcontroller interfaces with sensors to record measurements, storing data locally until retrieval. Both devices feature a power management system with custom-designed PCBs for efficient energy use.

Data gathered by the devices is stored locally and transferred to a cloud platform via an intuitive mobile app. Communication between the devices and the smartphone uses Bluetooth Low Energy (BLE), while data uploads to the cloud via LTE. This simplifies retrieval and reduces the need for complex equipment or infrastructure.

Community participation plays a central role in this system. Local communities deploy and retrieve boat-based sensors, improving the coverage and frequency of monitoring activities. By pooling data from various contributors, detailed information of environmental conditions near cultural heritage sites is acquired.

The devices undergo rigorous calibration to ensure reliable data collection. Conductivity sensors are standardized with salinity benchmarks, temperature sensors tested with laboratory-grade instruments, pressure sensors calibrated in controlled chambers, and chlorophyll sensors validated using fluorescence references.

Field trials at two underwater sites tested the system under diverse conditions, providing a robust environment to assess device performance and crowdsourcing effectiveness. Feedback from divers, local participants, and heritage professionals refined functionality. Adjustments included stronger enclosures, improved BLE connection stability, and an enhanced mobile app interface.

This study demonstrates the potential of combining smart sensor technology with community engagement to protect underwater heritage. Leveraging IoT devices and collaboration expands monitoring, reduces costs, and fosters local stewardship, offering a scalable, sustainable solution to mitigate environmental impacts on submerged cultural treasures.

References:

[1] P. Michalis, C. Mazzoli, V. Karathanassi, D. I. Kaya, F. Martins; M. Cocco, A. Guy and A. Amditis, "THETIDA: Enhanced Resilience and Sustainable Preservation of Underwater and Coastal Cultural Heritage," IGARSS 2024 - 2024 IEEE International Geoscience and Remote Sensing Symposium, Athens, Greece, 2024, pp. 2208-2211, doi: 10.1109/IGARSS53475.2024.10642229.

[2] L. Pavlopoulos, P. Michalis, M. Vlachos, A. Georgakopoulos, C. Tsiakos and A. Amditis, "Integrated Sensing Solutions for Monitoring Heritage Risks," IGARSS 2024 - 2024 IEEE International Geoscience and Remote Sensing Symposium, Athens, Greece, 2024, pp. 3352-3355, doi: 10.1109/IGARSS53475.2024.10641101.

Acknowledgement:

This research has been funded by European Union’s Horizon Europe research and innovation programme under THETIDA project (Grant Agreement No. 101095253).

How to cite: Vlachos, M., Michalis, P., Mourounas, I., Koukio, P., Gkatzogias, A., Georgakopoulos, A., and Amditis, A.: IoT-Enabled Underwater Devices and Crowdsourcing for Monitoring Climate Risks at Submerged Heritage Sites, EGU General Assembly 2025, Vienna, Austria, 27 Apr–2 May 2025, EGU25-3194, https://doi.org/10.5194/egusphere-egu25-3194, 2025.

EGU25-3882 | ECS | Posters virtual | VPS6

Climate Change and Cultural Heritage: Assessing Future Risks of Damage at Selected European Cultural Heritage Sites 

Efstathia Tringa, Aristeidis K. Georgoulias, Dimitris Akritidis, Haralambos Feidas, and Prodromos Zanis

Assessing the risks posed by climate change to cultural heritage (CH) is crucial for developing effective strategies to preserve this non-renewable heritage. This study provides a comprehensive approach to assess climate change-related risks to cultural heritage across five selected sites in Europe: Choirokoitia, Aegina, Epidaurus, Kalapodi, and Ventotene. By applying the Heritage Outdoor Microclimate (HMRout) and Predicted Risk of Damage (PRD) indices, the study quantifies potential damage to inorganic materials due to long-term changes in temperature and relative humidity (RH). Climate projections are based on high-resolution EURO-CORDEX Regional Climate Model (RCM) simulations under three Representative Concentration Pathways (RCP2.6, RCP4.5, and RCP8.5) for the periods 2021–2050, and 2071–2100. Results reveal a significant increase in temperature and the related indices under all emission scenarios highlighting a warming trend and intensified heat stress across the CH sites. The projected rise in temperature leads to an increase in the HMRout index across all the CH sites, with the rate of change differing between time periods and scenarios. This rise in the HMRout index suggests an increase in the predicted risk of damage (PRD) to monuments made of inorganic materials due to heat stress. In contrast, RH and the associated PRD index are expected to decrease. Overall, the projected changes in the HMRout and PRD indices provide a deeper insight into how climate change may influence preservation of cultural heritage sites constructed from stone and marble.

This work is based on procedures and tasks implemented within the project “Toolbox for assessing and mitigating Climate Change risks and natural hazards threatening cultural heritage - TRIQUETRA”, which is a Project funded by the EU HE research and innovation program under GA No. 101094818.


How to cite: Tringa, E., Georgoulias, A. K., Akritidis, D., Feidas, H., and Zanis, P.: Climate Change and Cultural Heritage: Assessing Future Risks of Damage at Selected European Cultural Heritage Sites, EGU General Assembly 2025, Vienna, Austria, 27 Apr–2 May 2025, EGU25-3882, https://doi.org/10.5194/egusphere-egu25-3882, 2025.

EGU25-3943 | ECS | Posters virtual | VPS6

Optimizing Corn and Soybean Yield Predictions in Illinois Using the AquaCrop Model  

Vishal Gautam and Shray Pathak

Crop yield is important for agricultural productivity and country’s economy. Accurate crop yield estimation is critical for policymakers, farmers, and governments because it allows better management techniques, decision making and the implementation of practicable agricultural policies. While crop yield estimation is an essential aspect of modern agriculture, it continues to be one of the most challenging tasks to manage effectively. In this study, we used the Food and Agriculture Organization (FAO) of the United Nations developed AquaCrop model to estimate the crop yields of corn and soybean crops in Illinois, United States (US). Data of various meteorological parameters as precipitation, maximum and minimum temperature, relative humidity, wind speed, solar radiation datasets were collected from NASA Prediction of Worldwide Energy Resources (POWER), for a period of 25-years from 2000 to 2024. Whereas, reference evapotranspiration was calculated by using the modified Hargreaves method. The objective of this study is to assess the accuracy of yield estimation of corn and soybean by using the AquaCrop model. The AquaCrop model was simulated for the growing period of corn and soybean from May to September. Using the AquaCrop model, the maximum and minimum corn yields were found to be 14.49 tons/ha in the year 2022 and 7.60 tons/ha in the year 2005, respectively. Similarly, the maximum yield of soybean was found to be 4.33 tons/ha in the year 2022, while the minimum yield was 2.26 tons/ha in the year 2012. The coefficient of determination (R2) values of 0.72 for maize and 0.76 for soybean, gives a satisfactory level of model accuracy. The model's performance can be improved further by incorporating more ground-truth data and appropriate parameters. This study demonstrates the AquaCrop model's ability to estimate crop production with few input parameters, as well as suggest opportunities for improvement. To improve prediction accuracy and promote informed agricultural planning and food security, future study might use sophisticated methodologies, localized farming practices, crop phenology, and specific soil data. 


Keywords:  AquaCrop, Crop yield, Illinois, Yield Predictions.

How to cite: Gautam, V. and Pathak, S.: Optimizing Corn and Soybean Yield Predictions in Illinois Using the AquaCrop Model , EGU General Assembly 2025, Vienna, Austria, 27 Apr–2 May 2025, EGU25-3943, https://doi.org/10.5194/egusphere-egu25-3943, 2025.

Climate change is reshaping the species composition, distribution and extent of forests worldwide. Across vast areas in Central Europe widespread Norway spruce (Picea abies) has exhibited large-scale decline, primarily due to its vulnerability to drought events. Forest management is thus facing important questions related to the replacement of Norway spruce, especially in areas where it was introduced due to its high economic value.

This study investigates the potential of Douglas fir (Pseudotsuga menziesii), a drought- and pest-tolerant non-native species, as a more resilient alternative for use in production forests. At the experimental plot in Jable, central Slovenia where both species coexist, we monitored the xylogenesis of five Douglas firs and five Norway Spruces from March to October 2024 by sampling phloem, cambium and xylem tissue every two weeks using the Trephor tool. Additionally, we collected tree cores from 20 trees of each species to perform dendrochronological analyses. These analyses aim to assess climate-growth correlations and growth-based resilience indicators (resilience, resistance, recovery and recovery period).

 The main objective of this study is to determine whether Douglas fir is to compare 1) interannual growth dynamics, 2) intra-annual growth dynamics of xylem and phloem, 3) climate-growth relationships, and 4) resilience components of both species. We hypothesize that non-native Douglas fir will exhibit greater growth rates and better resilience indicators and could thus be considered as a replacement for Norway Spruce at similar forest sites in central Slovenia and beyond. By addressing critical knowledge gaps regarding the responses of these species to climate variability, this research can provide important insights to support the strategic adaptation of forestry practices and improve the resilience of ecosystems in the face of environmental change.

How to cite: Balzano, A., Partemi, R., Jevšenak, J., Krže, L., and Merela, M.: Douglas Fir (Pseudotsuga menziesii) as an alternative species for the declining Norway spruce (Picea abies) in central Europe: Dendrochronological and xylogenetic insights from Slovenia, EGU General Assembly 2025, Vienna, Austria, 27 Apr–2 May 2025, EGU25-4269, https://doi.org/10.5194/egusphere-egu25-4269, 2025.

Coastal sea level changes have profound impacts on coastal ecosystems, infrastructure, and communities. Interannual sea level variations along the U.S. East Coast are influenced by a combination of dynamic and thermodynamic processes, including local wind forcing, Gulf Stream variability, regional ocean circulation changes, and thermosteric contributions. These processes are interconnected and strongly modulated by large-scale climate modes such as the North Atlantic Oscillation (NAO), El Niño-Southern Oscillation (ENSO), and Atlantic Multi-decadal Oscillation (AMO). This study leverages machine-learning-based predictive models to quantify and forecast interannual sea level variability by integrating diverse climate indicators. By incorporating indices of large-scale climate modes alongside local and regional oceanographic parameters, the model quantifies the relative contributions of each factor and identifies the dominant processes driving observed variability. The results demonstrate the potential of machine-learning approaches to capture complex nonlinear relationships between climate modes and regional sea level changes. NAO-driven atmospheric forcing and ENSO-related ocean-atmosphere interactions emerge as key predictors, with the models successfully replicating observed variability along different sections of the U.S. East Coast. The findings highlight the importance of integrating large-scale climate dynamics into regional sea level prediction frameworks and suggest new opportunities for improving forecast accuracy at interannual timescales.

How to cite: Ye, Z., Ye, Z., and Zhao, J.: Predicting Interannual Sea Level Variations Along the U.S. East Coast Using Machine Learning and Climate Indicators, EGU General Assembly 2025, Vienna, Austria, 27 Apr–2 May 2025, EGU25-7561, https://doi.org/10.5194/egusphere-egu25-7561, 2025.

EGU25-8577 | Posters virtual | VPS6

A review of climate change impacts in the Canary Islands 

Judit Carrillo, José Barrancos, Pierre S Tondreau, Juan C Pérez, Albano González, Francisco J Expósito, and Juan P Díaz

Environmental and socioeconomic factors increase small islands' exposure and vulnerability to climate change. This study reviews issues related to current and future climatic change and its impacts on the small island environments in the Canary Islands. Convection-permitting regionalized projections driven by data from three global climate models included in the Coupled Model Intercomparison Project (CMIP5) have been performed, covering the recent past (1980–2009) and future (2070–2099) periods, under two Representative Concentration Pathways, 4.5 and 8.5. The impact analysis includes water resources, energy, ecosystems and biodiversity, natural hazards, and health issues. We provide a succinct review of sectors that warrant particular attention, due to their weight in the gross domestic product, agriculture and tourism. The concluding section discusses adaptation and response strategies, and the portfolio of research that needs to be addressed. 

How to cite: Carrillo, J., Barrancos, J., Tondreau, P. S., Pérez, J. C., González, A., Expósito, F. J., and Díaz, J. P.: A review of climate change impacts in the Canary Islands, EGU General Assembly 2025, Vienna, Austria, 27 Apr–2 May 2025, EGU25-8577, https://doi.org/10.5194/egusphere-egu25-8577, 2025.

EGU25-9608 | Posters virtual | VPS6

On the links between large-scale atmospheric circulation and extreme precipitation in the middle and lower Danube basin 

Ileana Mares, Venera Dobrica, Constantin Mares, and Crisan Demetrescu

The aim of this study was to find the connection between the large-scale atmospheric circulation in the winter season and the occurrence of extreme precipitation in the spring months at the regional scale. For the large-scale circulation, climate indices (GBOI and NAOI) associated with the Greenland-Balkan Oscillation and the well-known North Atlantic Oscillation were considered, and for the regional scale, certain representative stations for the middle and lower Danube basins were considered. The tests were carried out for a 120-year interval (1901-2020), by applying the extreme value theory (EVT). The modelling of maximum precipitation was carried out through the generalized extreme value (GEV) distribution. In order to see the impact of the large-scale circulation, the results obtained by incorporating NAOI as covariate into the location parameter of GEV distribution, were compared with the results obtained considering GBOI as covariate. For extreme precipitation in the lower basin area, the influence of GBOI is much more significant than that of NAOI, while for the middle basin area, the differences between the two indices are not so significant.

How to cite: Mares, I., Dobrica, V., Mares, C., and Demetrescu, C.: On the links between large-scale atmospheric circulation and extreme precipitation in the middle and lower Danube basin, EGU General Assembly 2025, Vienna, Austria, 27 Apr–2 May 2025, EGU25-9608, https://doi.org/10.5194/egusphere-egu25-9608, 2025.

Since Shi et al. proposed that the climate in the drylands of Northwest China experienced a significant transition from a “warming and drying” trend to a “warming and wetting” trend in the 1980s, researchers have conducted numerous studies on the variations in precipitation and humidity in the region and even in arid Central Asia. In particular, the process of the “warming and wetting” trend by using obtained measurement data received much attention. However, there remain uncertainties about whether the “warming and wetting” trend has paused and what its future variations may be. In this study, we examined the spatiotemporal variations in temperature, precipitation, the aridity index (AI), vegetation, and runoff during 1950–2019. The results showed that the climate in the drylands of Northwest China and the northern Tibetan Plateau is persistently warming and wetting since the 1980s, with an acceleration since the 1990s. The precipitation/humidity variations in North China, which are mainly influenced by summer monsoon, are generally opposite to those in the drylands of Northwest China. This reverse change is mainly controlled by an anomalous anticyclone over Mongolia, which leads to an anomalous easterly wind, reduced water vapor output, and increased precipitation in the drylands of Northwest China. While it also causes an anomalous descending motion, increased water vapor divergence, and decreased precipitation in North China. Precipitation is the primary controlling factor of humidity, which ultimately forms the spatiotemporal pattern of the “westerlies-dominated climatic regime” of antiphase precipitation/humidity variations between the drylands of Northwest China and monsoonal region of North China. The primary reasons behind the debate of the “warming and wetting” trend in Northwest China were due to the use of different time series lengths, regional ranges, and humidity indices in previous analyses. Since the EC-Earth3 has a good performance for simulating precipitation and humidity in Northwest and North China. By using its simulated results, we found a wetting trend in the drylands of Northwest China under low emission scenarios, but the climate will gradually transition to a “warming and drying” trend as emissions increase. This study suggests that moderate warming can be beneficial for improving the ecological environment in the drylands of Northwest China, while precipitation and humidity in monsoon-dominated North China will persistently increase under scenarios of increased emissions.

How to cite: Xie, T.: Discussion of the “warming and wetting” trend and its future variation in the drylands of Northwest China under global warming, EGU General Assembly 2025, Vienna, Austria, 27 Apr–2 May 2025, EGU25-10025, https://doi.org/10.5194/egusphere-egu25-10025, 2025.

The Himalayan region of India is experiencing warmer winters and hotter summers, which are causing reduced yields and putting the production of traditional fruit species in danger. In order to gain an understanding of the thermal growing conditions, it is essential to have chill and heat accumulation monitored. In the current investigation, the Dynamic model is utilized to compute the chill accumulation, while the Growing Degree Days (GDD) method is utilized to compute the heat accumulation. In order to calculate these indices, gridded hourly temperature data from the European Centre for Medium-Range Weather Forecasts (ERA)5 dataset was utilized. The time period covered by this dataset is from 1940 to 2023. The study's findings revealed the best elevation ranges for several of the region's most significant fruits, such as citrus fruits, almond trees, and fresh fruits. Furthermore, places with elevations ranging from 1000 to 2000 are good for growing fresh fruits. This is due to the fact that 70 percent of the Chilling Portion (CP) values are high enough to be greater than 60.

How to cite: Shukla, Y. and Gupta, V.: Assessing Climate Change Effects on Fruit Growing Conditions in the Northwestern Himalayan Region of India, EGU General Assembly 2025, Vienna, Austria, 27 Apr–2 May 2025, EGU25-14951, https://doi.org/10.5194/egusphere-egu25-14951, 2025.

EGU25-15465 | Posters virtual | VPS6

Soil heating under wildfires and prescribed burns and their relevance to archaeological investigations 

Stefan Doerr, David Badia-Villas, Rob Bryant, Dickinson Matthew, Girona-Garcia Antonio, Mataix-Solera Jorge, Miesel Jessica, Sanchez-Garcia Carmen, Santin Cristina, Stoof Cathelijne, and Robichaud Pete

Fires can alter the properties of soil and other material via heat transfer. The identification of soil heating effects in hearths, for example, has long been a cornerstone in archaeological investigations. However, wildfires can also alter soils, and there is a surprising level of uncertainty into what degree soils are heated and to which depth this occurs in wildfires. This can lead to erroneous assumptions regarding the potential impact of wildfires when attributing heat induced changes in the soil, especially when laboratory heating results are extrapolated to field conditions.

To address this research gap, we compiled and examined new and published field data on maximum temperatures and heating durations for mineral soils during wildfires and prescribed burns in forests, shrublands and grasslands around the globe; and compared these to data obtained from laboratory heating experiments.

Most fires heated only the uppermost centimetres of the mineral soil, rarely exceeding 300 °C below 1 cm depth. Their heat pulses were shorter (<500 s) than those often applied in laboratory studies (1800-3600 s). The highest near-surface temperatures occurred in shrubland wildfires, whereas the longest heating durations in forests with deep organic layers and high fuel loads.

While it is clear that smouldering logs, tree trunks and root systems, or slash pile burns can impart intense heating to substantial depths akin to that under hearths, most landscape-scale fires generate short and shallow heat pulses that are unlikely to lead to detectable lasting changes in the mineral soil. 

How to cite: Doerr, S., Badia-Villas, D., Bryant, R., Matthew, D., Antonio, G.-G., Jorge, M.-S., Jessica, M., Carmen, S.-G., Cristina, S., Cathelijne, S., and Pete, R.: Soil heating under wildfires and prescribed burns and their relevance to archaeological investigations, EGU General Assembly 2025, Vienna, Austria, 27 Apr–2 May 2025, EGU25-15465, https://doi.org/10.5194/egusphere-egu25-15465, 2025.

Fires are among the most significant causes leading to significant alterations, both at the level of the natural and built landscape. These in fact induce significant alterations not only on the vegetation cover, but also on fauna, soil, atmosphere, artifacts and, inevitably, economic losses as well. In the context of the archaeological heritage, fires are a cause of extensive damage especially at the territorial scale, on sites and fragments not yet subject to either excavation or reconnaissance campaigns, but also on known sites that suffer from insufficient protection actions.

Traditional methods of assessing fire severity and property damage incur costs in terms of money and time because of the necessary field survey activities. A combination of geodata science and remote sensing, on the other hand, turns out to be an inexpensive and effective tool for modeling fires, understanding their causes and fire evolution.

In this work we use the potential of geodata science methods applied to spatial and satellite data, to analyse past trends and its correlation with environmental and anthropic factors and to forecast fire risk in the context of climate change, considering the evolution of environmental parameters stated from the Intergovernmental Panel on Climate Change (IPCC, 2022). These findings can be the starting point for the development of forecasting models also with a view to proposing prevention and protection strategies for the archaeological heritage of the Basilicata Region.


Reference

IPCC, 2022: Climate Change 2022: Impacts, Adaptation, and Vulnerability. Contribution of Working Group II to the Sixth Assessment Report of the Intergovernmental Panel on Climate Change [H.-O. Pörtner, D.C. Roberts, M. Tignor, E.S. Poloczanska, K. Mintenbeck, A. Alegría, M. Craig, S. Langsdorf, S. Löschke, V. Möller, A. Okem, B. Rama (eds.)]. Cambridge University Press. Cambridge University Press, Cambridge, UK and New York, NY, USA, 3056 pp., doi:10.1017/9781009325844.

How to cite: Danese, M., Florio, V., Masini, N., and Lasaponara, R.: Impact of fire risk on archaeological heritage in the Age of climate change. Geodata science for prediction and development of strategies for protection., EGU General Assembly 2025, Vienna, Austria, 27 Apr–2 May 2025, EGU25-16429, https://doi.org/10.5194/egusphere-egu25-16429, 2025.

EGU25-16568 | ECS | Posters virtual | VPS6

Preliminary analysis for energy efficiency assessment. Deriving technical parameters with spatial analysis and GEE 

Valentina Florio, Maria Danese, and Marilisa Biscione

When discussing climate change and cultural heritage, the focus often lies exclusively of the vulnerability aspects of the latter. However, cultural heritage can also play an active role in activating strategies and actions to increase its sustainability and mitigate environmental impacts.

Energy rehabilitation and reuse of existing buildings hold the potential to contribute to sustainable heritage conservation while embracing new energy efficiency principles.

According to literature, energy rehabilitation and retrofitting of the building envelope need to be carried out with respect to historic and cultural features and the protection of cultural heritage. This applies as much to listed buildings as to those that, although not formally protected, are part of the historical heritage and define the identity and the skyline of the place (Magrini, Franco, 2016).

In this work, starting from the spatial modeling of the territory and use of satellite data thank to the free-cloud application Google Earth Engine (GEE), it is possible to perform some preliminary analysis. These ones are useful to derive some formal characteristics that directly influence both the energy requirements and the choice of some technological solutions for integrating renewable energy sources (Forster et al.,2025).

References

Forster et al.,2025: Forster, J., S. Bindreiter, B. Uhlhorn, V. Radinger‐peer, and A. Jiricka‐pürrer. 2025. 'A Machine Learning Approach to Adapt Local Land Use Planning to Climate Change', Urban Planning, 10.

Magrini, Franco, 2016: Magrini, A., and G. Franco. 2016. 'The energy performance improvement of historic buildings and their environmental sustainability assessment', Journal of Cultural Heritage, 21: 834-41.

How to cite: Florio, V., Danese, M., and Biscione, M.: Preliminary analysis for energy efficiency assessment. Deriving technical parameters with spatial analysis and GEE, EGU General Assembly 2025, Vienna, Austria, 27 Apr–2 May 2025, EGU25-16568, https://doi.org/10.5194/egusphere-egu25-16568, 2025.

EGU25-19591 | ECS | Posters virtual | VPS6

Downscaling Earth Observation Operational Soil Moisture Products Using multi-sensor Satellite Data: “A Triangle Inversion Approach" 

Spyridon E. Detsikas, George P. Petropoulos, Panteleimon Saviolakis, Christina Lekka, Efthimios Karymbalis, Petros Katsafados, and Freideriki Georgaki

Monitoring key parameters that drive land-surface processes, such as surface soil moisture (SSM)), is essential for understanding global biogeochemical cycles, including those of water, energy, and carbon. While Earth Observation (EO)-based SSM products have demonstrated significant potential, their practical application is often limited by coarse spatio-temporal resolution. Therefore, downscaling these operational products is a critical scientific challenge for enabling their effective use in regional and local-scale applications.

This study’s aims at presenting an innovative approach for downscaling operational soil moisture products using a variant of the so-called “triangle” method, named the “simplified” triangle. The use of the proposed technique is demonstrated herein using the European Space Agency's (ESA) operational soil moisture product from the Soil Moisture and Ocean Salinity (SMOS) and optical data from ESA’s Sentinel-3 platform. The enhanced spatial SSM estimates are compared against near collocated reference ground data from multiple validated experimental sites across Europe. The results obtained indicate a satisfactory agreement, confirming the proposed approach's promising potential to accurately estimate key land-surface interaction parameters. Conceptually the proposed herein methodological framework is applicable to any operational product, a topic of further investigation.

How to cite: Detsikas, S. E., Petropoulos, G. P., Saviolakis, P., Lekka, C., Karymbalis, E., Katsafados, P., and Georgaki, F.: Downscaling Earth Observation Operational Soil Moisture Products Using multi-sensor Satellite Data: “A Triangle Inversion Approach", EGU General Assembly 2025, Vienna, Austria, 27 Apr–2 May 2025, EGU25-19591, https://doi.org/10.5194/egusphere-egu25-19591, 2025.

EGU25-21175 | Posters virtual | VPS6

Advancing our understanding of land surface interactions via the development of innovative geoinformation tools  

Georgios Gkatzios, George P. Petropoulos, Spyridon E Detsikas, Christina Lekka, Efthimios Karymbalis, and Petros Katsafados

Advances in geo-information technologies, including Earth Observation (EO), GIS, cloud computing and software tool development, have shown great potential towards addressing key societal challenges faced today associated with the study of land-atmosphere interactions. Accurate information on spatially explicit, distributed estimates of land-atmosphere fluxes and soil surface moisture is essential in a wide range of disciplines, including meteorology, hydrology, agriculture and ecology.

Use of simulation process models has played a key role in extending our abilities to study Earth system processes and enhancing our understanding on how different components of it interplay. A special category of such models includes the so-called Soil Vegetation Atmosphere Transfer (SVAT) models. Those are deterministic simulation models that describe the physical processes controlling energy and mass transport in the soil/vegetation/atmosphere system.


SimSphere is such a software toolkit written in Java for simulating the interactions of soil, vegetation and atmosphere layers of the Earth’s land surface. Its use is at present continually expanding worldwide both as an educational and as a research tool for scientific investigations. It is being used either as a stand-alone application or synergistically with EO data and important advancements particularly in the recent years have been implemented to the model.


Herein, we present state of the art advancements introduced recently to SimSphere SVAT model aiming at making its use more robust when integrated with EO data via the so-called “triangle” method. Use of the recently developed add-on to SimSphere is illustrated herein using a variety of examples that involve both satellite and UAV data. The presented work  is of key significance to the users' community of the model and very timely, given that variants of the so-called “triangle” method being considered for deriving operationally regional estimates of energy fluxes and soil moisture from EO data provided by non-commercial vendors.

KEYWORDS: land surface interactions, geoinformation, earth observation, triangle, SimSphere   Acknowledgements The research presented herein has been conducted in the framework of the project LISTEN-EO (DeveLoping new awareness and Innovative toolS to support efficient waTer rEsources man- agement Exploiting geoinformatiOn technologies), funded by the Hellenic Foundation for Research and Innovation programme (ID 15898). 

How to cite: Gkatzios, G., Petropoulos, G. P., Detsikas, S. E., Lekka, C., Karymbalis, E., and Katsafados, P.: Advancing our understanding of land surface interactions via the development of innovative geoinformation tools , EGU General Assembly 2025, Vienna, Austria, 27 Apr–2 May 2025, EGU25-21175, https://doi.org/10.5194/egusphere-egu25-21175, 2025.

EGU25-2329 | Posters virtual | VPS7

Cryptotephra fingerprinting of 1458 CE and 426 BCE volcanic events in East Antarctic ice cores 

Jean-Robert Petit, Joël Savarino, Barbara Delmonte, Elsa Gautier, Patrick Ginot, and Valentina Batanova

Powerful volcanic eruptions inject into the stratosphere sulphur and tephra that may be spread globally and affect the Earth’s climate. Over the last 2500 years, Sigl et al. (2015) made a synthesis of the polar ice core atmospheric sulphur record and climate anomalies from dendrochronological records. Aside from a few historical events, most large eruptions with a bipolar imprint and a significant climate anomaly are from the tropical latitudes, but their sources are unknown.

We analysed the micron-size crytotephra composition accompanying the (stratospheric) sulphate of the 1458 CE and 426 BCE volcanic events recorded in three Antarctic ice cores. The 1458 CE event occurred within a cool climate and was initially attributed to the Kuwae (Vanuatu) eruption. This link is however questioned by Hartman et al. (2019) from their study of a South Pole ice core. The 426 BCE event appears concomitant with a significant global climate cooling, but its source is unknown.

Within the sulphate peak, the particle size distribution, when available, helps documenting the dynamics of the arrival of the stratospheric plume. Cryptotephra are collected by filtration and after carbon-coating, analysed by an EPMA microprobe. We applied the analytical procedure of Narcisi et al. (2019) (who identified the 1257 CE Samalas eruption), adapted to the micron-size of the crytotephra.

For the 1458 CE event, a medium-K dacite to rhyolite composition is consistently observed from Vostok and Dome C ice core samples (218 values). The dacite patch (SiO2~68%) fits well the composition of proximal Kuwae deposits as well as that of an ash layer (~140 values) on Efate Island (Standberg et al, 2023). The rhyolite composition patch (SiO2~72%) is unlikely from a South American source, but appears discretely represented in proximal Kuwae deposits as well as in sediments in the nearby Epi Submarine zone. We suggest that rhyolite is a daughter product from dacite by evolving in the upper layers of the magmatic chamber, and it was spread out first and far away by the eruption.  

 For the 426 BCE event, the cryptotephra composition (220 values) is consistently found within the three ice cores (Vostok, Dome C, Talos Dome) and belongs to high-K rhyodacite. Coincidentally such composition is very close to Kuwae’s (except for higher K) suggesting it was issued from a very similar magmatic chamber. The 10 km wide Ambrym caldera located 50 km north of Kuwae, collapsed ~2000 years ago appears the best candidate. 

References

Hartman et al. (2019). Nature Sci. Rep. 9. https://doi.org/10.1038/s41598-019-50939-x.

Narcisi, B. et al., 2019. Quat. Sci. Rev. 210, 164-174 https://doi.org/10.1016/j.quascirev.2019.03.005.

Sigl, M., et al. Nature 523, 543–549 (2015). https://doi.org/10.1038/nature14565

Strandberg NA et al., (2023). Front. Ecol. Evol. 11: 1087577.doi: 10.3389/fevo.2023.1087577


How to cite: Petit, J.-R., Savarino, J., Delmonte, B., Gautier, E., Ginot, P., and Batanova, V.: Cryptotephra fingerprinting of 1458 CE and 426 BCE volcanic events in East Antarctic ice cores, EGU General Assembly 2025, Vienna, Austria, 27 Apr–2 May 2025, EGU25-2329, https://doi.org/10.5194/egusphere-egu25-2329, 2025.

EGU25-3477 | ECS | Posters virtual | VPS7

Unusual mass-occurrence of small, uncoiled ammonites in a black shale of the Maiolica Formation in the Umbria-Marche Basin (Central Italy) 

Christian Conti, Paolo Faraoni, Alan Maria Mancini, Martire Luca, and Alessandra Negri

The unique mass-occurrence of tiny heteromorph ammonites found in a single layer in the Mt. Cipollara locality of Cerreto d'Esi (Maiolica Formation, Umbro-Marchean Basin, Italy) provides critical insights into the depositional environments of the Cretaceous upper Maiolica Formation. The mechanisms behind the formation and preservation of these ammonite assemblages within black shales remain poorly understood. To solve this knowledge gap, we constrained by means of biostratigraphy and stable Carbon isotopes the whole sections hosting the ammonites-rich layer. The latter was then subjected a high-resolution paleoecological analyses. Samples were collected systematically across multiple stratigraphic levels to ensure comprehensive coverage. The ammonite assemblages were documented, focusing on their morphology, abundance, and associated sedimentary structures. Additionally, sedimentological petrographic examinations were conducted to elucidate depositional processes. Our results reveal a rich assemblage dominated by the family Leptoceratoididae, exhibiting relatively good preservation within a predominantly dysoxic low-energy environment at the bottom. Calcareous nannofossils data suggest the presence of a well-stratified water column, with a low salinity water cap. The multidisciplinary analyses indicates that these black shales served not only as a repository for ammonite remains but also reflected localized paleoecological conditions characterized by reduced turbulence and increased organic deposition. This unique sedimentary context suggests that the deposition of these assemblages could have been influenced by both regional sea-level fluctuations and local hydrographic conditions. In conclusion, the study of the Mt. Cipollara heteromorph ammonites underscores the complexity of Cretaceous paleoenvironments and provides an enhanced understanding of the occurrence of black shales within the Maiolica Formation.


How to cite: Conti, C., Faraoni, P., Mancini, A. M., Luca, M., and Negri, A.: Unusual mass-occurrence of small, uncoiled ammonites in a black shale of the Maiolica Formation in the Umbria-Marche Basin (Central Italy), EGU General Assembly 2025, Vienna, Austria, 27 Apr–2 May 2025, EGU25-3477, https://doi.org/10.5194/egusphere-egu25-3477, 2025.

Aeolian mineral dust and diatom influxes at the summit of Roosevelt Island (79.364°S, 161.706°W, 550 m a.s.l.) were investigated over the last 2 kyrs from the RICE ice core (Bertler et al., 2018). Mineral dust at the site is mainly related to large-scale atmospheric circulation patterns within the Eastern Ross and Amundsen Seas, while aeolian diatoms, mainly consisting of Fragilariopsis spp. (F. nana , F. cylindrus, , F. curta), depend on the local oceanic influence of air masses from the marine boundary layer. Thus, the complementarity of these proxies allows appreciating climatic and atmospheric changes experienced at Roosevelt Island over the last 2000 years, in response to some major forcing factors such as ENSO. During the 550-1470 CE period, when higher/less depleted stable water isotope values are observed, the increased importance of blocking ridges in the Amundsen Sea and a weakened Amundsen Sea Low promoted dust-rich air mass advection to RICE. This pattern was accompanied by an increasing trend in snow accumulation and reduced sea ice in the Eastern Ross and Amundsen Seas. At about 1300 CE, the maximum expression of the Ross Sea dipole is reached, with enhanced katabatic outflow in the Western Ross Sea and reactivation of the Ross Sea polynya. At the same time,  the Eastern part of the Ross Sea was still under the influence of blocking ridges promoting maritime air mass advection to RICE and southward shift of the South Westerly Winds. After 1470 CE, unprecedented peaks of aeolian diatom concentration suggest a rapid reorganization of local atmospheric circulation, that probably occurred in relation to the eastward enlargement of the Ross Sea polynya culminating with the opening of the  Roosevelt Island polynya.
For the RICE site, we suggest that several drivers contribute to the long-term dust, sea-ice and polynya variability, but ENSO-driven teleconnections are particularly prominent. On a longer (multidecadal) timescale it seems that El Niño-dominating conditions promoted the establishment of the Ross Sea dipole, while La Niña conditions favored a deeper Amundsen Sea Low and an eastward expansion of the polynya. 

How to cite: Delmonte, B., Lagorio, S., Tetzner, D., Malinverno, E., and Bertler, N.: Aeolian dust and diatoms at Roosevelt Island (Ross Sea, Antarctica) over the last two millennia reveal the local expression of climate changes and the history of the Ross Sea polynya., EGU General Assembly 2025, Vienna, Austria, 27 Apr–2 May 2025, EGU25-8574, https://doi.org/10.5194/egusphere-egu25-8574, 2025.

EGU25-10067 | ECS | Posters virtual | VPS7

Potential for a 300-year drought reconstruction in the Zagros Mountains, Iran based on the tree-ring width of Quercus brantii Lindl.  

Firoozeh Hatami, Stefan Klesse, Kerstin Treydte, Anne Verstege, Vahid Etemad, Kambiz Pourtahmasi, Arthur Gessler, and Yaghob Iranmanesh

Drought significantly affects the growth and physiological responses of Zagros forests, one of the most important natural habitats in Iran. The Brants oak (Quercus brantii Lindl), a widely distributed and dominant tree species in the Central Zagros Mountains of western Iran, serves as a valuable natural archive for studying historical climate variability and ecological changes. For climate-growth analysis, 30 Q. brantii trees cored from Lordegan area (1820 to 2280 m a.s.l.) in the southwest of Zagros forests of Iran. After preparing the samples, measuring the tree ring widths and cross-dating developed the tree ring chronology (1710-2023) using dplR. The relationships between tree-ring widths (TRW) and monthly mean temperature and precipitation values and the Standardized Precipitation Evapotranspiration Index (SPEI) were analyzed. The strongest climate signal of SPEI was found from previous September until April, representing the pre-growing and early-growing seasons. Among these reconstructions were acknowledged extremely narrow rings in 1870, 1923, 1960, 1964, and 2018, while extremely large rings were found in 1784, 1852, 1957, and 1976. Based on preliminary calculations showing a strong winter SPEI signal, this chronology could be used for climate reconstruction, but further analysis is required. These studies indicate the vulnerability of oak forests in the Zagros Mountains to ongoing climate change and a pressing need for sustainable forest management strategies to preserve these vital ecosystems.

 Keywords: Zagros forests, Iran, Quercus brantii, reconstruction, tree-ring widths

How to cite: Hatami, F., Klesse, S., Treydte, K., Verstege, A., Etemad, V., Pourtahmasi, K., Gessler, A., and Iranmanesh, Y.: Potential for a 300-year drought reconstruction in the Zagros Mountains, Iran based on the tree-ring width of Quercus brantii Lindl. , EGU General Assembly 2025, Vienna, Austria, 27 Apr–2 May 2025, EGU25-10067, https://doi.org/10.5194/egusphere-egu25-10067, 2025.

Oases are critical locations for human survival in desert areas. With heavily reliant on runoff from the surrounding mountains, oases in the hyperarid Tarim Basin are especially fragile and sensitive to both climatic–environmental changes and human activity. However, the local evolution process of oases in desert area remains unclear due to strong erosion and contemporaneous heterogeneity, which restricts our understanding of the coupling relationship among climate change, oasis evolution, and human activity. Here, we reconstruct the evolution of oases since the last deglacial period (~15 ka) in the Tarim Basin. The results indicate that oases advanced during 15–11.5 ka, 9–4.5 ka, and 2–1 ka. Through the integration of multiple records of palaeoclimate, palaeoenvironment, archaeology and history, we found that human activity dominated and decoupled oasis evolution from climate change since ~2 ka in the Tarim Basin. Oasis were artificially expanded to sustain the flourishing society during the Han–Tang period, but they declined synchronously afterward. More attention should be paid to the proper management of land and water resources to achieve sustainable development in hyperarid areas.

How to cite: Sun, A.: Human activity has decoupled oasis evolution from climate change since ~2 ka in the Tarim Basin, EGU General Assembly 2025, Vienna, Austria, 27 Apr–2 May 2025, EGU25-10215, https://doi.org/10.5194/egusphere-egu25-10215, 2025.

EGU25-11624 | Posters virtual | VPS7

Early Cretaceous Oceanic Anoxic Events (OAEs) in Peri-Tethyan shallow-water carbonate systems: Evidence from the Latium-Abruzzi Carbonate Platform (Ernici Mts, Central Italy) 

Federico Artegiani, Paola Cipollari, Domenico Cosentino, Ahmad Rabiee, Marcel Guillong, Federico Rossetti, Angelo Cipriani, and Simone Fabbi

While the effects of OAEs are well known for the pelagic successions of the Tethys Ocean, little is known about their impact on the Peri-Tethyan shallow water carbonate systems. Here we present the preliminary results of a study related to the geological mapping of the sheet 390 – Frosinone of the Geological Map of Italy (CARG Project), focussed on the identification and description of the perturbation induced in the Lower Cretaceous shallow water carbonate succession of the Latium-Abruzzi Carbonate Platform by the well-known Early Cretaceous Oceanic Anoxic Events (OAEs).

In the Ernici Mts. (central Apennines, Italy), an Upper Triassic to Upper Cretaceous shallow-water carbonate succession is exposed (Cosentino et al., 2010; Fabbi et al., 2023). This study specifically examines the Lower Cretaceous "calcari ciclotemici a gasteropodi" fm. (CCG - Berriasian p.p. - lower Aptian p.p.), which mainly consists of whitish limestones with intercalations of light grey dolostones. Within this succession, a layer of black dolostone, about ten centimetres thick, has been observed in several outcrops of the dolomitic lithofacies (CCGa) of CCG, at the same stratigraphic position.

Two stratigraphic sections were measured to characterise the microfacies and compositional variations observed between the light-coloured (whitish to light grey) and black layers. SEM images, along with Energy-Dispersive X-ray Spectroscopy (EDS) and Wavelength-Dispersive X-ray Spectroscopy (WDS) analysis indicated the presence of siderite and pyrite aggregates (Meng et al. 2024). These aggregates appear in high concentration starting from the basal part of the blackish dolostone layer and gently decrease towards the upper part of the study interval. TOC and sulphates show similar trends.

Changes in chemical composition between the whitish and blackish dolostones (CCGa) were investigated in situ using the laser ablation inductively coupled plasma mass spectrometry (LA-ICP-MS) facility at Roma Tre University. The results show a significant increase in elemental concentration of P, Fe, Zn, As, Ba, Pb, and U, as well as in the Fe/Al ratio in the blackish dolostones. These elements are generally considered as redox-sensitive proxies associated with anoxic paleoenvironments (Bodin et al., 2007; Craigie, 2018).

Biostratigraphic calibration performed on the collected samples has established a Hauterivian p.p. age for the investigated CCGa levels. A preliminary attempt for U-Pb dating of the CCGa black dolostone was carried out through LA-ICP-MS investigations at Roma Tre and ETH facilities. In the Tera-Wasserburg diagram, the U-Pb measurements on CCGa black dolostone yielded a lower intercept age of 125.7± 1.8 Ma (MSWD=1.6; N=19). These promising results suggest that the changes in the elemental concentration of the redox-sensitive proxies observed in the CCGa black dolostone were induced by the late Hauterivian Faraoni Oceanic Anoxic Event.

How to cite: Artegiani, F., Cipollari, P., Cosentino, D., Rabiee, A., Guillong, M., Rossetti, F., Cipriani, A., and Fabbi, S.: Early Cretaceous Oceanic Anoxic Events (OAEs) in Peri-Tethyan shallow-water carbonate systems: Evidence from the Latium-Abruzzi Carbonate Platform (Ernici Mts, Central Italy), EGU General Assembly 2025, Vienna, Austria, 27 Apr–2 May 2025, EGU25-11624, https://doi.org/10.5194/egusphere-egu25-11624, 2025.

EGU25-12114 | Posters virtual | VPS7

Reconstruction of dust activity using geochemical proxy from cave stalagmite in the northern Taklimakan Desert 

Xiaokang Liu, Shengqian Chen, Jianhui Chen, Haipeng Wang, Chuan-Chou Shen, Xianfeng Wang, and Fahu Chen

Located in the arid inland of Asia, the eastern part of the Silk Road is marked by certain routes being close to or even crossing large deserts, such as the Taklimakan Desert, one of the largest deserts worldwide. As a result, sand and dust activities have a considerable impact on the transport routes, the desert-oasis ecosystem, and human society along the Silk Road. However, the evolution of dust activity over the past two millennia and its relation to the changes of the Silk Road civilization remains ambiguous. Here, we present a high-resolution (~3 yr) stalagmite record from Xinjiang (northwest China) spanning the past 2,500 years, dated with 19 U/Th ages. Although the stable isotopes and trace elemental ratios of the stalagmite reveal remarkable decadal- to centennial-scale variability of the regional hydroclimate, the Mg/Ca ratio shows a quite different variation pattern compared with other geochemical proxies. Considering various factors that might influence the Mg/Ca ratio of stalagmites, our analysis reached the conclusion that the geographical location close to the desert made the imported dust likely to predominate the increase of Mg/Ca in stalagmites during many characteristic periods. For instance, we found significant increases in the Mg/Ca ratios lasting for more than two centuries during approximately 650-850 CE and 1650-1950 CE (i.e., the Little Ice Age). This generally demonstrates a pattern of reduced dust activities during the Medieval Warm Period and enhanced dust activities throughout the Little Ice Age, which is supported by evidence from the eolian sedimentary section in the southern margin of the Taklimakan Desert that directly reflects dust activity. We further found that the enhanced dust activity during the 650-850 CE might have caused the route shift of the Silk Road from south to north in the Tarim Basin. In addition, the rapid drying of Lop Nur in recent decades could also be attributed to abnormally increased dust activity, as this period was characterized by the most intense dust activity in our records over the last 2,000 years. Our findings further substantiate the argument regarding the association between societal and climatic change along the Silk Road, where the dust production from large deserts poses challenges to sustainable development in the present and the future.

How to cite: Liu, X., Chen, S., Chen, J., Wang, H., Shen, C.-C., Wang, X., and Chen, F.: Reconstruction of dust activity using geochemical proxy from cave stalagmite in the northern Taklimakan Desert, EGU General Assembly 2025, Vienna, Austria, 27 Apr–2 May 2025, EGU25-12114, https://doi.org/10.5194/egusphere-egu25-12114, 2025.

EGU25-12407 | ECS | Posters virtual | VPS7

A Multi-Proxy Approach to Reconstructing Long-Term Climate and Environmental Dynamics in the Canary Islands: Inter-Island Comparisons 

Carmen Ocón-Bermúdez, Marcel Galofre-Penacho, Blas Valero-Garcés, Ildefonso Armenteros-Armenteros, Antonio Herrera-Herrera, Natalia Égüez, María Candelaria Martín-Luis, Ramón Casillas Ruiz, Juana Vegas, Lucía Castellano-Rotger, Andrés Diez-Herrero, Roberto Casado-Vara, and Margarita Jambrina-Enríquez

The Canary Islands, located in the central North Atlantic, provide an exceptional setting for investigating long-term climate dynamics within the Macaronesian region. This study presents sedimentary records from volcanic lacustrine basins across Tenerife, La Gomera and La Palma, analyzed using a multi-proxy approach including magnetic susceptibility, XRF geochemistry, elemental composition (TOC, TN, TS), mineralogy, lipid biomarkers, and updated age models. Preliminary age models suggest that the sequences of La Vega Lagunera (northern Tenerife) extend back up to 400,000 years, and El Malpaís de La Rasca (southern Tenerife), Garajonay (La Gomera), and Playa de Taburiente (La Palma) span the Holocene.
Preliminary results from La Vega Lagunera, a Pleistocene clastic lake, indicate colder conditions during MIS 2 and MIS 4, warmer conditions during the Holocene, MIS 3, and MIS 5, and millennial-scale cycles during MIS 3 and MIS 4. Climate during the Last Glacial Maximum (MIS 2) was notably drier, resembling mid-latitude records. 
Holocene records from paleolacustrine deposits of two closed-drainage basins located in two volcanic craters (La Gomera and Malpaís de La Rasca) and the lacustrine-marsh system of Playa de Taburiente showed coherent patterns of Holocene regional climate variability, with increased fluvial and alluvial activity during the Greenlandian (11.7 to 8.2 ka), a decline during the Northgrippian (8.2 to 4.2 ka), and reduced clastic input during the Meghalayan (last ~4.2 ka). These trends suggest increasing aridity throughout the Holocene. 
These new sedimentary sequences from Tenerife, La Gomera, and La Palma provide further evidence of rapid climate dynamics during glacial and interglacial intervals. Improved age models (OSL, 14C) are still being developed to characterize the cyclic patterns better, while multi-proxy analyses are enhancing our understanding of past climate dynamics. Further research is needed to clarify the roles of regional climate and local factors.
This work is supported by TED2021-129695A-I00 project funded by MICIU/AEI/10.13039/501100011033 and by the European Union NextGenerationEU/PRTR; PALEOMOL (2915/2022) and IVRIPARC (2779/2021), both funded by the Spanish National Parks Organism, and IMPACT (2022CLISA04, Fundación CajaCanarias and Fundación La Caixa).

How to cite: Ocón-Bermúdez, C., Galofre-Penacho, M., Valero-Garcés, B., Armenteros-Armenteros, I., Herrera-Herrera, A., Égüez, N., Martín-Luis, M. C., Casillas Ruiz, R., Vegas, J., Castellano-Rotger, L., Diez-Herrero, A., Casado-Vara, R., and Jambrina-Enríquez, M.: A Multi-Proxy Approach to Reconstructing Long-Term Climate and Environmental Dynamics in the Canary Islands: Inter-Island Comparisons, EGU General Assembly 2025, Vienna, Austria, 27 Apr–2 May 2025, EGU25-12407, https://doi.org/10.5194/egusphere-egu25-12407, 2025.

EGU25-15403 | Posters virtual | VPS7

Past analogues of deoxygenation events in the Mediterranean Sea: Comparison between shallow and deep settings  

Francesca Lozar, Alan Maria Mancini, Caterina Morigi, Rocco Gennari, and Alessandra Negri

Human-induced carbon emissions are altering the modern climate, with severe repercussions on ecosystems. Among others, anthropogenic pressure is causing deoxygenation of the bottom water, with the widespread establishment of hypoxic zones in several Mediterranean areas. The geological archives allow the investigation of past deoxygenation dynamics (sapropel events) and their impact on marine ecosystems. Here, we compare the causes and the evolution of deoxygenation dynamics that occurred during two different time periods (Messinian and Holocene) in different paleoceanographic settings based on their micropaleontological content. The Messinian sapropel events are the result of increased export productivity during a relatively cold and arid context, triggering bottom anoxic conditions. The Holocene sapropel formed in response to weakening/stopping of the thermohaline circulation due to increasing temperature and freshwater input. Our results suggest that the deoxygenation dynamics in the Mediterranean in the near future will not follow the trend characteristic of the Holocene deep-sea sapropel because of the predicted drying trend. Differently, the paleoceanographic setting triggering the Messinian shallow-sea sapropels is comparable with the modern situation in different Mediterranean areas, where human-induced eutrophication is promoting deoxygenation. Based on these results, we suggest that the patchy deoxygenation trend in the Mediterranean Sea caused by climate warming may lead to a drastic change in the ecosystem services which would likely impact human activities.

How to cite: Lozar, F., Mancini, A. M., Morigi, C., Gennari, R., and Negri, A.: Past analogues of deoxygenation events in the Mediterranean Sea: Comparison between shallow and deep settings , EGU General Assembly 2025, Vienna, Austria, 27 Apr–2 May 2025, EGU25-15403, https://doi.org/10.5194/egusphere-egu25-15403, 2025.

The Pliensbachian/Toarcian event (P/T-E) and the Toarcian Oceanic Anoxic Event (T-OAE) are two intervals of carbon cycle perturbations linked to massive 12C-enriched carbon emissions, causing severe biotic and environmental changes. Here organic carbon isotope, mineralogical composition and sedimentology have been analyzed across the Pliensbachian-Toarcian transition from the Monte Serrone section (Umbria-Marche Basin), which was deposited in a pelagic setting in the western Tethys. A marked negative carbon-isotope excursion occurred across the Pliensbachian-Toarcian boundary and lower Toarcian, respectively, which can be used to identify PTE and T-OAE in the study area. The P/T-E and T-OAE intervals witnessed carbonate production crisis revealed by reduced carbonate contents. We hold that the 0.5 m-thick laminated black shales indicated that the T-OAE was a highly condensed succession because it included the full duration of the T-OAE. Therefore, the T-OAE interval at Monte Serrone coincided not only with diminished carbonate production but also with reduced siliciclastic input, forming quite thin black shale deposition. Abundant marine organisms were present preceding the T-OAE. Nevertheless, none of them survived during the most negative carbon-isotope excursion of the T-OAE, revealing a biotic crisis at this time. Elevated seawater temperature could induce this crisis in the study area. The recovery of benthic foraminifera was delayed at Monte Serrone.

How to cite: Nie, Y., Fu, X., and Rigo, M.: Carbon cycle perturbations during the Pliensbachian-Toarcian transition in the Monte Serrone section (Northern Apennines, Italy), EGU General Assembly 2025, Vienna, Austria, 27 Apr–2 May 2025, EGU25-16338, https://doi.org/10.5194/egusphere-egu25-16338, 2025.

The climatic signals recorded by loess sequences vary between different regions, which makes it important to study loess sequences worldwide. The loess deposits in northern Iran are situated in the transitional zone between the European loess and Central Asian loess. However, the depositional dynamics and paleoenvironmental significance of the loess deposits in this region are not well understood, making it difficult to establish detailed correlations with loess deposits elsewhere, partly due to the lack of systematic and high-resolution chronological control. We used K-feldspar pIR50IR290 and MET-pIRIR250 luminescence dating protocols to date fifty-two K-feldspar samples from the Toshan-19 section in the northern foothills of the Alborz Mountains, northern Iran. These chronological data, along with the climate proxies of magnetic susceptibility and redness, combined with a comparison with published loess records from various regions, indicate the following: (1) K-feldspar luminescence ages obtained using pIRIR and MET-pIRIR protocols are consistent, and their luminescence ages up to ~200 ka are deemed dependable. The loess at Toshan was primarily deposited during 78–24 ka, corresponding to MIS 4–2, and the paleosols developed during 139–78, and 24–1.7 ka, corresponding respectively to MIS 5, and late MIS 2–MIS 1. (2) Drier conditions prevailed during the last glacial and wetter conditions dominated during the last interglacial. Moisture variations during the substages of MIS 5 in this region indicate cold-dry and warm-wet climatic characteristics. The reasons for increased moisture from late MIS 2 onwards in this region still require further investigation. (3) The loess-paleosol records indicate a consistent pattern of climate change over Eurasia on the scale of the last interglacial-glacial cycle. During the substages of MIS 5, warm-wet and cold-dry conditions in northern Iran were in-phase with those on the Chinese Loess Plateau, Europe, and southern Tajikistan; however, they were anti-phased or out-of-phase with those in Xinjiang.  

How to cite: Li, D., zhao, H., and Xie, H.: Loess-paleosol sedimentological characteristics in northern Iran since the last interglacial and their paleoenvironmental significance, EGU General Assembly 2025, Vienna, Austria, 27 Apr–2 May 2025, EGU25-16630, https://doi.org/10.5194/egusphere-egu25-16630, 2025.

EGU25-19922 | Posters virtual | VPS7

The Lagoa Real Uranium Province: polycyclic evolution in the Brazilian geochronological record 

Renata Augusta Azevedo and Francisco Javier Rios

The Lagoa Real uranium province (LRUP) is the main Brazilian target for uranium. Their geochronological studies began in the 80s and provided controversial ages for mineralization. Since then, advances in geochronological methods, increased local petrological data, and knowledge of the uranium cycle have helped geosciences understand crust and mantle behavior over time. As a result, recent geochronological studies developed by CDTN researchers have now begun to reinterpret the evolution of the LRUP.

These studies dated metasomatic  U-ore bodies providing ages between 545 Ma to 520 Ma (in situ U–Pb dating of andradite and titanite, Santos et al., 2023; Journal of South America Earth Science) coeval with the late Pan-African Cycle. Geochronological studies were also carried out on the host rocks (A-Type granites) of the mineralized bodies, providing ages between 1762 Ma to 1741 Ma (U–Pb dating of magmatic Zircon, Amorim et al., 2022; Journal of South America Earth Science), coeval to bimodal magmatism well documented in Brazil and Africa.

Although some of the data obtained suggest that granites might not be the source of uranium, their volcanic expression (metaryolites located to the NW of the LRUP) could be a good candidate. Thus, the uranium mobilization began before the metasomatism, through magmatic processes, coeval with the Post-Archean Uranium Recycling, a global event that incorporates U in the crust from the mantle. Furthermore, preliminary macroscopic and microscopic data from gneisses show evidence of partial melting related to regional metamorphism that may have occurred before metasomatism. This process generated Neoproterozoic uranium deposits in Namibia, at the Southern of the African counterpart of Brazil. Therefore, LRUP could result from overlapping processes in central Brazil accompanied by crustal differentiation episodes leading to a polycyclic evolution.

How to cite: Azevedo, R. A. and Rios, F. J.: The Lagoa Real Uranium Province: polycyclic evolution in the Brazilian geochronological record, EGU General Assembly 2025, Vienna, Austria, 27 Apr–2 May 2025, EGU25-19922, https://doi.org/10.5194/egusphere-egu25-19922, 2025.

CL0 – Inter- and Transdisciplinary Sessions

Heatwaves and extreme precipitations are the two prevalent types of weather-related extreme events globally. Compared with univariate extremes, impacts of compound extreme precipitations preconditioned by heatwaves (CHEPs) on the society and economy can be amplified. Previous studies demonstrated that heatwaves can trigger extreme precipitations by enhancing atmospheric instability and moisture-holding capacity. Other studies projected future changes in CHEPs under various greenhouse gas emission scenarios. However, there is a lack of studies assessing the time of emergence (ToE) of CHEP change signals, especially for record-shattering events. Since current water resource management strategies and infrastructures are based on historical data, it is crucial to understand when hydro-meteorological conditions will surpass unprecedented levels to develop effective adaptation and mitigation strategies for climate change.

Here, we present a global analysis of ToE for record-shattering CHEPs as well as their exposed GDP and population (POP). Both the frequency and magnitude of observed CHEPs have substantially increased during the past 65 years at the global scale. Using climate models from Detection and Attribution Model Intercomparison Project, we find that rarer CHEPs are increasingly attributable to anthropogenic greenhouse gas emissions, while aerosol emissions have a mitigating effect on their occurrences. To detect when historical record-shattering events will become normal, we develop a novel framework based on advanced Single Model Initial-condition Large Ensemble simulations. Our results indicate that CHEP hotspots, including East and Southeast Asia, North-central South America, and Central Africa, are likely to experience earlier ToE compared to other regions. In contrast, arid regions, such as North Africa, West Asia, and southwestern Australia, show no signs of ToE until at least 2100. GDP and POP exposure to such events reveal an alarming upward trend throughout the 21st century. By the late 21st century, 41% (29%) of sub-regions defined by the Sixth Assessment Report of the Intergovernmental Panel on Climate Change are projected to experience GDP exposure exceeding 4,000 billion USD (at 2010 purchasing power parity) to record-shattering frequency (magnitude), while 34% (27%) are expected to have POP exposure exceeding 100 million under the SSP2-4.5 scenario. Record-shattering CHEPs pose a distinct threat to the economy between 21.75°N and 53.25°N, with the most significant impact between 35.25°N and 39.75°N. Compared to the GDP exposure, the POP exposure hotspots shift toward lower latitudes, with a broader range extending from 0.75°S to 53.25°N. Additionally, we classify areas based on the Human Development Index and income levels defined by the World Bank. The unequal distribution of GDP and POP exposure reveals the poorest and least developed countries will experience more extended impacts compared to wealthier nations. This study highlights the urgent need for region-specific mitigation and adaptation strategies to combat climate change, especially for the vast high-risk and low-income regions.

How to cite: Liu, J., Chen, J., and Yin, J.: Time of Emergence of Record-shattering Compound Extreme Precipitations Preconditioned by Heatwaves and Their Socio-economic Exposures, EGU General Assembly 2025, Vienna, Austria, 27 Apr–2 May 2025, EGU25-2350, https://doi.org/10.5194/egusphere-egu25-2350, 2025.

EGU25-2385 | ECS | Orals | ITS2.1/CL0.1

Accelerated Shifts from Heatwaves to Heavy Rainfall in a Changing Climate 

Jian Li, Shuo Wang, Jinxin Zhu, Dagang Wang, and Tongtiegang Zhao

Consecutive heatwave and heavy rainfall (HW-HR) events are occurring with increasing frequency in a warming climate. The time interval affects both environmental conditions and the regional recovery between two consecutive extreme events. However, the dynamics of the transition between consecutive HW-HR events remain poorly understood. In this study, we examine the changes in the time interval of consecutive HW-HR events in China from 1990 to 2019, using meteorological data from over 2,000 stations across mainland China. Our results reveal that the time interval has significantly shortened at 28.2% of the stations. The increased proportion of short-time events (STEs), defined by consecutive events with time intervals of 1 to 2 days, is the primary driver of this trend. From 1990 to 2019, the proportion of STEs increased significantly, at a rate of 2.2% per decade. We also find that climate change-induced anomalies in atmospheric variables during the consecutive HW-HR events may contribute to this rise in the proportion of STEs. Additionally, we assess changes in population exposure to STEs over the past two decades. Exposure has increased at more than three-quarters of the stations, with the increased STEs contributing to over 80% of the rise in exposure. Our findings highlight the need for policymakers to prioritize disaster response during consecutive HW-HR events and implement effective risk management strategies to mitigate population exposure to extreme events.

How to cite: Li, J., Wang, S., Zhu, J., Wang, D., and Zhao, T.: Accelerated Shifts from Heatwaves to Heavy Rainfall in a Changing Climate, EGU General Assembly 2025, Vienna, Austria, 27 Apr–2 May 2025, EGU25-2385, https://doi.org/10.5194/egusphere-egu25-2385, 2025.

EGU25-4810 | ECS | Orals | ITS2.1/CL0.1

Investigating the relationship between compound cold events and impacts on the Scottish rail sector.  

Kanzis Mattu, Christopher White, Hannah Bloomfield, and Joanne Robbins

Winter weather events can result in costly damages and severe disruption to affected regions. While compound events research has strongly focused on heat-related events, less focus has been placed on extreme cold hydrometeorological hazards. Cold events impact a range of sectors from energy and agriculture to transport and health. The rail sector is particularly sensitive to cold weather hazards resulting in service delays and cancellations. Snowfall can lead to blocked tracks, points failures and issues with electricity supply. Loss of traction, braking issues and frozen infrastructure can arise from ice formation. The impacts of these cold events can be amplified by the compounding effect of another meteorological variable, such as whether heavy precipitation is present or not, with subsequent impacts dependent on the nature of the cold event. For example, a cold-wet event could incur heavy snowfall, whereas a cold-dry event could result in extreme low temperatures and icy conditions. In this study, we analyse the occurrence of 10,000 rail incidents in Scotland over an extended winter period of October to March for 2006-2023 to investigate the relationship between impacts and compound cold events. We use an impact dataset from Network Rail to categorise high-impact days based on two classifications: (1) days with the highest number of aggregated incidents; (2) days with the highest number of accumulated customer minutes lost. Using daily gridded observations from HadUK-Grid at a 5 km resolution we then apply a localised percentile-based methodology to determine the occurrence of cold-dry and cold-wet events on these high-impact days. Initial results show that the majority of high-impact days consisted of incidents caused by severe snow and icing. Analysis reveal that these incidents occurred under hydrometeorological conditions that can be classified as cold-dry and/or cold-wet events. These findings highlight the importance of considering co-occurring hazards rather than single hazards. The results of this study provide a useful insight into compound cold events for rail sector early warning systems, with valuable information on cold weather event hazard characterisation and their associated impacts across varying timescales.

How to cite: Mattu, K., White, C., Bloomfield, H., and Robbins, J.: Investigating the relationship between compound cold events and impacts on the Scottish rail sector. , EGU General Assembly 2025, Vienna, Austria, 27 Apr–2 May 2025, EGU25-4810, https://doi.org/10.5194/egusphere-egu25-4810, 2025.

EGU25-5209 | ECS | Orals | ITS2.1/CL0.1

Surrogate flood models for compound flood risk assessments and early warning 

Dirk Eilander, Niels Fraehr, Tim Leijnse, and Roel de Goede

Probabilistic flood risk assessments (PFRA) and flood early warning systems (FEWS) are essential tools for managing and responding to disastrous flood events, particularly in coastal deltas where flooding is often compound, resulting from the interplay of coastal and riverine water levels and local rainfall. PFRA and FEWS require assessing the compound flood hazard under a broad range of plausible or forecasted hydro-meteorological conditions. While efficient hydrodynamic models for compound flooding have been developed, such as SFINCS (Leijnse et al. 2021; van Ordmondt et al. 2024), trade-offs in the model resolution or number of simulations or stochastic variables are often required for PFRA and FEWS, at the cost of model accuracy.

The physics-guided  hybrid  LSG model (Fraehr et al. 2022, 2023) uses a Sparse Gaussian Process model trained on Empirical Orthogonal Functions (EOF) derived from simulations with a high- and low- resolution hydrodynamic model. For new events to simulate, the approach combines a simulation of the low-resolution hydrodynamic model with the trained surrogate model, to predict high-resolution water depths at low computational costs. While this model has successfully been applied for riverine flooding, it has not yet been used to predict compound flooding from multiple drivers.

This study tests the surrogate SFINCS-LSG model for compound PFRA and FEWS. We investigate the optimal choice of events to train the model and test the model for case studies in Brisbane, Australia and Charleston (NC), USA. We validate the surrogate model against the high-resolution SFINCS model for different historical compound events, hypothetical compound flood scenarios, and compound PFRA.

Based on preliminary results, we find that compared to the course-resolution SFINCS model, the surrogate model provides a significant improvement at very low computation costs, while compared to the high-resolution SFINCS model it achieves a large speedup with only a small drop in accuracy. While the results are promising for individual simulations, the surrogate model struggles to capture the transition zone based on the difference between model simulations. Nonetheless, the surrogate SFINCS-LSG models seem a promising approach to improve compound PFRA and FEWS.

References

Fraehr et al. (2022). Upskilling low-fidelity hydrodynamic models of flood inundation through Spatial analysis and Gaussian Process learning. WRR, https://doi.org/10.1029/2022WR032248

Fraehr et al (2023). Development of a fast and accurate hybrid model for floodplain inundation simulations. WRR, https://doi.org/10.1029/2022WR033836

Leijnse et al. (2021). Modeling compound flooding in coastal systems using a computationally efficient reduced-physics solver: Including fluvial, pluvial, tidal, wind- and wave-driven processes. Coastal Engineering, https://doi.org/10.1016/j.coastaleng.2020.103796

van Ormondt et al. (2024). A subgrid method for the linear inertial equations of a compound flood model, EGUsphere [preprint], https://doi.org/10.5194/egusphere-2024-1839


How to cite: Eilander, D., Fraehr, N., Leijnse, T., and de Goede, R.: Surrogate flood models for compound flood risk assessments and early warning, EGU General Assembly 2025, Vienna, Austria, 27 Apr–2 May 2025, EGU25-5209, https://doi.org/10.5194/egusphere-egu25-5209, 2025.

Cyclonic systems in the Eastern Mediterranean often produce compound extremes of heavy precipitation and strong winds, significantly impacting socio-economic systems. This study leverages traditional atmospheric analysis and dynamical systems theory to investigate these “wet” and “windy” extremes (Vakrat and Hochman, 2023). Using the co-recurrence ratio (α; De Luca et al., 2020) and persistence (1/θ; Faranda et al., 2017), we quantify atmospheric state dynamics and link them to extreme weather events. Results reveal that compound extremes exhibit higher co-recurrence and persistence than individual extremes, with anomalies in these metrics increasing the likelihood of extreme weather events by up to 18-fold. A case study of the mid-February 2012 Eastern Mediterranean compound event highlights the role of persistent upper-level dynamics in driving these extremes. Our findings emphasize the value of dynamical systems metrics in enhancing the predictability of compound extremes and their application to other regions and extreme weather events (Hochman et al., 2019). 

References

De Luca P, Messori G, Pons FME, Faranda D. Dynamical systems theory sheds new light on compound climate extremes in Europe and Eastern North  America. Quarterly Journal of the Royal Meteorological Society 146: 1636–1650. https://doi.org/10.1002/qj.3757

Faranda D, Messori G, Yiou P. Dynamical proxies of North Atlantic predictability and extremes. Scientific Reports 7: 41278. https://doi.org/10.1038/srep41278

Hochman A, Alpert P, Harpaz T, Saaroni H, Messori G. 2019. A new dynamical systems perspective on atmospheric predictability: eastern Mediterranean weather regimes as a case study. Science Advances 5(6): eaau0936.  https://doi.org/10.1126/sciadv.aau0936 

Vakrat, E. Hochman, A. 2023.Dynamical systems insights on cyclonic compound “wet” and “windy” extremes in the Eastern Mediterranean. Quarterly  Journal of the Royal Meteorological Society 149(757): 3593–3606. https://doi.org/10.1002/qj.4575


How to cite: Hochman, A. and Vakrat, E.: Understanding Cyclonic Compound “Wet” and “Windy” Extremes in the Eastern Mediterranean through Dynamical Systems Theory, EGU General Assembly 2025, Vienna, Austria, 27 Apr–2 May 2025, EGU25-5532, https://doi.org/10.5194/egusphere-egu25-5532, 2025.

EGU25-6437 | Orals | ITS2.1/CL0.1

Severe convective outbreaks and heatwaves – a continental-scale compound event 

Monika Feldmann, Daniela I.V. Domeisen, and Olivia Martius

Recent summers in Europe were accompanied by significant convective storm outbreaks with widespread large hail, flash floods, and severe wind phenomena. Particularly severe outbreaks have occurred upstream of heatwaves. On a continental scale, this leads to considerable compound hazards from heatwaves and thunderstorm hazards. 

Utilizing reanalysis data, we investigate the link between heat anomalies and severe convective environments (SCE), which have the potential for severe convection. Our analysis reveals that SCE across Central and Western Europe are preceded by high temperatures and a slow-moving upper-level wave pattern. More strikingly, they reveal a strongly increased heatwave frequency downstream of SCE. Indeed, 75% of SCE are associated with a heatwave, usually ~500km downstream. The remaining 25% take place in much cooler, predominantly low-pressure situations, with less persistent SCE. Inversely, >80% of heatwaves are associated with upstream SCE. These heatwaves are significantly hotter by >1°C than those not associated with convection. 

This strong co-occurrence of severe convective outbreaks and heatwaves implies a dynamical link. From the large scale, the upper-level wave pattern may drive both the SCE through the advection of unstable airmasses and high wind shear in the prefrontal zone, as well as the heatwave by warm air advection, radiative heating, and a strong ridge. Further feedback between heatwaves and SCE is possible via diabatic heating processes and soil moisture feedback. 

How to cite: Feldmann, M., Domeisen, D. I. V., and Martius, O.: Severe convective outbreaks and heatwaves – a continental-scale compound event, EGU General Assembly 2025, Vienna, Austria, 27 Apr–2 May 2025, EGU25-6437, https://doi.org/10.5194/egusphere-egu25-6437, 2025.

EGU25-6508 | Posters on site | ITS2.1/CL0.1

The impacts and future changes of near-freezing precipitation events in Québec 

Raphaël Rousseau-Rizzi and Philippe Roy

Near-freezing precipitation (NFP) events, a type of multivariate event compounding temperature and precipitation, are associated with widespread power outages. In a society undergoing an energy transition towards electrification, outages are associated with large impacts. Thus, understanding the impacts and the future evolution of NFP events in a changing climate is increasingly important. In this study, we first establish the relation between outages and NFP events, based on reanalysis data and on a Québec-based utility outage dataset. The highest density of outages in the region is found to occur in association with mixed precipitation near the freezing point. Next, daily NFP totals in various reanalyses are evaluated against Environment Canada weather stations in power-line-dense regions of Québec, to select a gridded reference. The Canadian Surface Reanalysis (CaSR) performs best and is selected. Then, a 28 member CMIP6 ensemble, bias-adjusted using CaSR, is used to evaluate future regional changes in the frequency of near-freezing precipitation events, as a function of time and as a function of local warming. In general, it is found that warmer areas south of Québec see a decline in the frequency of events, while colder northern areas see an increase. The number of days with near-freezing precipitations over 5 mm liquid equivalent varies non monotonically with annual temperature. This number will decrease by up to 40% south of Québec in the future and increase in the north. At the latitude of Montréal, the number of days may first increase and peak before decreasing again at the end of the century, as more wet snow turns to rain. However, rare events show a more uniform pattern of increasing intensity than NFP indicator, with slight decreases mostly near the coasts in the south. For Montréal, end of century NFP increases are more preeminent in ssp245, than in the warmer scenarios, which are likely further past the maximum risk. These findings on the impact of NFP events on the grid, as well as on the future evolution of these events, can directly inform the costly grid-hardening strategies considered for future adaptation.

How to cite: Rousseau-Rizzi, R. and Roy, P.: The impacts and future changes of near-freezing precipitation events in Québec, EGU General Assembly 2025, Vienna, Austria, 27 Apr–2 May 2025, EGU25-6508, https://doi.org/10.5194/egusphere-egu25-6508, 2025.

EGU25-9949 | ECS | Posters on site | ITS2.1/CL0.1

Joint Occurrence of Extreme Rainfall and Storm Surge along the Croatian Coast: Exploring Seasonal Variations 

Marta Marija Gržić, Ivona Petković, Nevenka Ožanić, and Nino Krvavica

High storm surges, extreme sea waves, high river discharges and intense short-term rainfall are flood drivers that make densely populated coastal areas especially vulnerable to flooding. An additional increase of flood hazard and risk in coastal areas is expected due to changes in storminess, mean sea level rise, land subsidence and urbanisation. The simultaneous or consecutive occurrence of two or more flood drivers can lead to an event known as compound flooding.

In Croatia, compound flooding caused by the co-occurrence of high river discharges and storm surges is the only combination of compound flood drivers investigated to date. Consequently, other combinations of compound flood drivers remain unexplored. This study aims to address this gap by conducting further research on compound flooding in Croatia, specifically investigating the co-occurrence of extreme storm surges and rainfall along the Croatian coast. This study will provide insights into the compound flood potential due to extreme storm surges and rainfall at 42 locations along the Croatian coast. The rainfall data was obtained from rain gauge stations and the sea level data was obtained from Coastal Extremes in the Mediterranean Sea reanalysis and has been corrected by tide gauge data using machine learning.

High storm surges and heavy rainfall are flood drivers that often originate from the same weather system. Neglecting their seasonality can lead to a significant underestimation of the dependency and consequently the underestimation of the compound flood potential. With its pronounced seasonality, the Croatian coast is a great example for investigating seasonal correlation and co-occurrence of storm surges and rainfall. By disaggregating the time series into the individual seasons and analysing them separately, we gained a more detailed insight into the co-occurrence patterns of these flood drivers through maps with assigned correlation coefficients and a number of co-occurrences for each location.

As a result of this analysis, we will be able to identify the vulnerable areas with the highest probabilities of co-occurrence of high storm surges and intense rainfall more precisely. The selected locations will be eligible for a more detailed analysis of compound flood risk at the local level in future studies.

How to cite: Gržić, M. M., Petković, I., Ožanić, N., and Krvavica, N.: Joint Occurrence of Extreme Rainfall and Storm Surge along the Croatian Coast: Exploring Seasonal Variations, EGU General Assembly 2025, Vienna, Austria, 27 Apr–2 May 2025, EGU25-9949, https://doi.org/10.5194/egusphere-egu25-9949, 2025.

EGU25-9994 | ECS | Orals | ITS2.1/CL0.1

Spatiotemporal Variations and Potential Drivers of European Summer Heat Stress 

Qiyun Ma, Yumeng Chen, and Monica Ionita

Heat stress is projected to intensify with global warming, causing significant socioeconomic impacts and threatening human health. Wet-bulb temperature (WBT), which combines temperature and humidity effects, is a useful indicator for assessing regional and global heat stress variability and trends. However, the variations of European WBT and their underlying mechanisms remain unclear. Using observations and reanalysis datasets, we demonstrate a remarkable warming of summer WBT during the period 1958-2021 over Europe. We find that the increase in European summer WBT is driven by both near-surface warming temperatures and increasing atmospheric moisture content. We identify dominant modes of European summer WBT variability and investigate their linkage with the large-scale atmospheric circulation and sea surface temperature anomalies. The first two leading modes of the European WBT variability exhibit prominent interdecadal to long-term variations, mainly driven by a circumglobal wave train and concurrent sea surface temperature variations. The last two leading modes of European WBT variability mainly show interannual variations, indicating a direct and rapid response to large-scale atmospheric dynamics and nearby sea surface temperature variations. We also present the role of global warming and changes in mid-latitude circulations in the variations of European summer WBT. Our findings can enhance the understanding of plausible drivers of heat stress in Europe and provide valuable insights for future climate adaptation planning.

How to cite: Ma, Q., Chen, Y., and Ionita, M.: Spatiotemporal Variations and Potential Drivers of European Summer Heat Stress, EGU General Assembly 2025, Vienna, Austria, 27 Apr–2 May 2025, EGU25-9994, https://doi.org/10.5194/egusphere-egu25-9994, 2025.

EGU25-10126 | ECS | Posters on site | ITS2.1/CL0.1

Developing a flood typology for Denmark with practical applications for public warnings and communication 

Jonas Wied Pedersen, Jian Su, Ida Margrethe Ringgaard, and Morten Andreas Dahl Larsen

Denmark has experienced several significant compound flood events in recent years, and in parallel the Danish Meteorological Institute (DMI) has been developing a new flood warning system. This has led to a reassessment of how floods are conceptualized, predicted, and communicated. To support this, we here propose a framework for a flood typology tailored to both single-source and compound flood phenomena, with practical applications for public warnings and communication.

Our methodology builds upon the internationally acknowledged UNDRR/ISC hazard classes, which we filter for flood-related hazards relevant to Northern European coastal, lowland conditions. We then consider the organization of Denmark’s national agencies, local emergency response, and insurance structures. From this, we develop a flood typology for communication. As a part of the study, historical occurrences of compound flood phenomena are meticulously assessed by reviewing textual descriptions from a historical flood register (1990–2020) and conducting detailed case studies of recent events. Additionally, we examine the spatial and temporal overlap of flood-generating processes through a quantitative analysis of historical severe weather warning occurrences (2014–2024) addressing events of rainfall, storms, and sea levels.

Our findings reveal overlapping definitions within the UNDRR/ISC hazard classes, particularly regarding flood-generating processes and their geographic context. While DMI oversees severe weather warnings, observation networks are divided among four national agencies within the fields of: meteorology, oceanography, inland surface water, and groundwater. The emergency response in Denmark, as managed by 98 municipalities, is generally infrastructure-focused rather than flood-type-specific. For instance, urban water utilities often manage flood operations in cities. The insurance sector distinguishes between pluvial floods (private market) and fluvial or storm surge floods (covered by a national public disaster fund). We propose five general flood types for communication: (1) pluvial, (2) fluvial, (3) coastal, (4) groundwater, and (5) technological hazards (infrastructure failures of pumps, sluice gates, etc.). The historical flood register indicates two predominant compound flood types in Denmark: "coastal + fluvial" (driven by extratropical cyclones in winter) and "pluvial + fluvial" (caused by convective rainfall extremes in summer). It also shows that the key preconditioning variables include soil moisture, snow depth, and Baltic Sea water levels. The analysis of historical weather warnings reveals distinct regional patterns in compound flood risks. The detailed case studies provide storylines of how spatial compounding of flood types can overwhelm both national and local emergency responses. 

By integrating these insights, our study establishes a typology that is locally relevant for the Danish context, enhances the understanding of compound floods, and informs strategies for improved compound forecasting and communication.

How to cite: Pedersen, J. W., Su, J., Ringgaard, I. M., and Larsen, M. A. D.: Developing a flood typology for Denmark with practical applications for public warnings and communication, EGU General Assembly 2025, Vienna, Austria, 27 Apr–2 May 2025, EGU25-10126, https://doi.org/10.5194/egusphere-egu25-10126, 2025.

EGU25-10158 | ECS | Posters on site | ITS2.1/CL0.1

Understanding coastal-pluvial compound floods associated with extra-tropical cyclones in Denmark  

Niels Agertoft, Jonas Wied Pedersen, Jian Su, Ida Margrethe Ringgaard, and Morten Andreas Dahl Larsen

Compound events leading to significant coastal flooding have become a major concern in recent years. Storm surges caused by extra-tropical cyclones and coastal precipitation are key drivers of such events. While previous research has developed various methods for storm tracking, these have not sufficiently focused on impact-relevant storm tracking that directly addresses coastal flood risks. Motivated by this research gap, we initiated our analysis by identifying storm surges from 1991 to 2021 and tracked associated low-pressure systems and the associated impact-related compound dynamics. This approach not only enables the understanding of storm impacts but also offers potential for application to downscaled regional climate-scale products.

As a case study, we use Denmark, known for its complex ocean-circulation patterns due the North-Sea/Baltic Sea interface, narrow straits and fjords, and diverse coastline orientation. We clustered 32 sea level stations in Denmark by analyzing the co-occurrence of extreme storm surge events in the period 1990-2023. We then tracked extra-tropical cyclones over Northern Europe using the CERRA mean sea level pressure dataset, by identifying minimas at each time interval and reconstructing tracks by minimizing the distance between candidate points, through the use of Mixed Integer Programming. Finally, we investigate coastal precipitation in different regions of Denmark, as defined by the clustering of sea water level stations, with precipitation estimates from the CERRA-Land dataset.

Our analysis successfully identified storm tracks associated with extreme storm surge events, which were categorized into four distinct clusters. Similarly, Danish water level stations were grouped into three clusters based on the co-occurrence of extreme surge events: (1) the West coast of Jutland, (2) Kattegat and Inner Danish water, and (3) Baltic sea coastlines. By examining the dominant storm track types and station clusters, we revealed significant differences in impacted regions associated with different storm tracks.

We conclude that storm tracks have markedly different impacts on the occurrence of storm surge events across the Danish sub-regions. Precipitation levels associated with these storm surge events, and type of storm track, can uncover the need to consider both storm track characteristics and regional vulnerabilities when assessing compound and multi-variate coastal flood risks as opposed to storm surges in isolation.

How to cite: Agertoft, N., Pedersen, J. W., Su, J., Ringgaard, I. M., and Dahl Larsen, M. A.: Understanding coastal-pluvial compound floods associated with extra-tropical cyclones in Denmark , EGU General Assembly 2025, Vienna, Austria, 27 Apr–2 May 2025, EGU25-10158, https://doi.org/10.5194/egusphere-egu25-10158, 2025.

EGU25-11037 | Orals | ITS2.1/CL0.1

Atmospheric Rivers and Compound Inland Flooding under Climate Change 

Mohammad Reza Najafi, Mohammad Fereshtehpour, Andrew Grgas-Svirac, and Alex Cannon

Compound Inland Flooding (CIF) arises from the interactions between multiple hydrometeorological drivers, often magnified by landfalling Atmospheric Rivers (ARs) along the Pacific Northwest coast and interior basins of North America. This study investigates the mechanisms behind two primary CIF types, Rain-on-Snow (ROS) and Saturation Excess Flooding (SEF), using the CanRCM4 large ensemble under global warming levels of +1.5°C, +2°C, and +4°C. By examining the joint occurrence of ARs with ROS and SEF across key sub-regions, including the Cascade Range, Sierra Nevada, and the Great Lakes Basin, we assess the probabilities, seasonal shifts, and hydrological impacts of CIFs in the 21st century. Results show distinct regional patterns, with ROS events projected to decrease in frequency across the Pacific Northwest and Great Lakes Basin but remain significant in high-elevation regions prone to seasonal snowmelt, such as the Canadian Rockies. Conversely, SEF events are projected to increase substantially, particularly in the eastern U.S. and southern Great Lakes, driven by intensified precipitation and persistently saturated soils. The findings indicate that under higher warming levels, the contribution of ROS to extreme runoff can decrease, while SEF-driven flood events become dominant. Signal-to-noise ratio analysis shows that internal climate variability contributes considerable uncertainty to CIF projections in transitional climate zones but is overshadowed by external climate forcing at higher warming levels, particularly in coastal regions. By capturing the compounded effects of precipitation extremes, snowmelt dynamics, and soil moisture conditions, this study underscores the necessity of integrating AR-driven compound events into regional flood risk management strategies. 

How to cite: Najafi, M. R., Fereshtehpour, M., Grgas-Svirac, A., and Cannon, A.: Atmospheric Rivers and Compound Inland Flooding under Climate Change, EGU General Assembly 2025, Vienna, Austria, 27 Apr–2 May 2025, EGU25-11037, https://doi.org/10.5194/egusphere-egu25-11037, 2025.

EGU25-11126 | ECS | Posters on site | ITS2.1/CL0.1

Impacts of Climate Change on Precipitation and Marine Heatwaves: Insights from High-Resolution Earth System Models 

Xiuwen Guo, Yang Gao, Shaoqing Zhang, Wenju Cai, Ruby Leung, Jakob Zscheischler, Luanne Thompson, Deliang Chen, Chuncheng Guo, Huiwang Gao, and Lixin Wu

This study investigates the impacts of climate change on marine heatwaves and extreme precipitation events associated with atmospheric rivers. First, our findings demonstrate that high-resolution models are more adept at simulating mesoscale eddies in the ocean, thereby facilitating more accurate predictions of future changes in marine heatwaves. Under climate warming, the intensity and annual days of marine heatwaves are projected to increase significantly. Even if organisms within large coastal marine ecosystems fully adapt to long-term mean warming, the escalating intensity of marine heatwaves would nonetheless pose substantial threats to these ecosystems. Furthermore, with global warming, the intensity and annual days of subsurface marine heatwaves are also expected to rise markedly on a global scale. This increase is primarily driven by the long-term rise in subsurface temperatures and changes in their variability. After accounting for the effects of long-term warming, the magnitude of increases in the intensity and annual days of subsurface marine heatwaves is notably greater than those at the surface, further exacerbating the risks posed by global warming to marine ecosystems.

Additionally, the study explores the influence of global warming on atmospheric river events in the Northern Hemisphere. High-resolution Earth system model simulations indicate that, under approximately 4°C of global warming, elevated sea surface temperatures enhance ocean-to-atmosphere moisture flux, thereby intensifying atmospheric river events. This intensification is projected to result in a doubling of the area affected by extreme precipitation events along the western coasts of Europe and North America. By disentangling the thermodynamic and dynamic contributions to intense precipitation associated with atmospheric rivers, the study identifies differences in the direction of vertical wind velocity changes as the primary source of regional disparities in dynamic contributions.

How to cite: Guo, X., Gao, Y., Zhang, S., Cai, W., Leung, R., Zscheischler, J., Thompson, L., Chen, D., Guo, C., Gao, H., and Wu, L.: Impacts of Climate Change on Precipitation and Marine Heatwaves: Insights from High-Resolution Earth System Models, EGU General Assembly 2025, Vienna, Austria, 27 Apr–2 May 2025, EGU25-11126, https://doi.org/10.5194/egusphere-egu25-11126, 2025.

EGU25-13057 | ECS | Orals | ITS2.1/CL0.1

Causal Links Between El Niño–Southern Oscillation and European Compound Events: A Focus on False Spring Events 

Niklas Luther, Eduardo Zorita, Jürg Luterbacher, Odysseas Vlachopoulos, and Elena Xoplaki

Extreme weather and climate events are increasingly linked to severe socio-economic impacts, and their combination in space and/or time can further amplify these effects. This has heightened attention on compound events, which are combinations of multiple, potentially non-extreme climate events that collectively result in significant socio-economic consequences. A prominent example of a compound event in agriculture are false spring event. These occur when anomalous warm and wet conditions prevail in late winter, triggering early crop growth, followed by spring frost or severe drought. Such conditions can lead to substantial agricultural losses. To enable early warnings for such events, seasonal predictability is essential, as these phenomena typically unfold over a period of a couple of months. Seasonal predictability typically stems from slowly varying factors, such as sea surface temperatures and teleconnections, which influence the likelihood and timing of such events.

 One of the most globally influential teleconnections is the El Niño–Southern Oscillation (ENSO), with well-documented influence on climate systems worldwide. ENSO's impact on European climate, particularly during late winter, has been extensively studied, raising the question whether ENSO could play a role in triggering false spring events. Investigating these mechanisms offers valuable insights into ENSO's influence on European climate and enhances the potential for improved seasonal predictions of such events. To identify these large-scale patterns and non-linear relationships with other teleconnection patterns and modes of variability, like the North Atlantic Oscillation (NAO), we employ advanced statistical techniques, such as Kernel Regularized Generalized Canonical Correlation Analysis and Bayesian neural networks. By leveraging preimages and Accumulated Local Effect (ALE) plots, we uncover large-scale mechanisms relevant to European climate that exhibit strong interactions with the Niño3.4 region. Finally, we perform a causal analysis to trace the chain of interactions and pathways through which ENSO modulates European false spring events. 

 Our preliminary analysis focused on the first phase of the compound events, late winter. Results revealed significant interactions between the Niño3.4 region and atmospheric circulation patterns in the Euro-Atlantic region. These interactions involve a combination of well-known patterns such as the NAO, the East Atlantic/West Russia pattern, and the Scandinavian pattern. Second-order ALE plots obtained from a Bayesian neural network highlight that the interplay of these components can drive increasingly warm and wet conditions during late winter. These conditions create a favorable environment for the onset of false spring events, advancing our understanding of the mechanisms behind these impactful phenomena.

How to cite: Luther, N., Zorita, E., Luterbacher, J., Vlachopoulos, O., and Xoplaki, E.: Causal Links Between El Niño–Southern Oscillation and European Compound Events: A Focus on False Spring Events, EGU General Assembly 2025, Vienna, Austria, 27 Apr–2 May 2025, EGU25-13057, https://doi.org/10.5194/egusphere-egu25-13057, 2025.

EGU25-13893 | ECS | Orals | ITS2.1/CL0.1

Patterns of Snow Drought Under Climate Change: From Dry to Warm Dominance 

Chuan Wang, Zhi Li, Nicolas Guyennon, Yaning Chen, and Yupeng Li

Global warming may trigger more frequent snow droughts (SD). SD can result from low total precipitation (dry-SD), from high temperature leading to less solid precipitation (warm-SD) or from the combination of both (dry-warm compound SD). Each of those SD type pose different ecological threats. Nevertheless, the regions dominated by SD types, transition patterns, and the future risks under climate change remain unclear. Here, we investigated the dominant SD types and clarify the transition patterns among the three SD types during the historical and the future period. The results suggest a global increase in SD frequency by about 1.5-fold and 2-fold under SSP2-4.5 and SSP5-8.5 respectively. Moreover, the shares of warm SD is increasing and may become dominant by 2050 and probability of dry-warm compound SD may reach 4–10 times that of the historical period. The global transition from dry to warm dominated SD is attributed to greenhouse gases. Those findings provide a scientific reference for addressing climate change risks on SD.

How to cite: Wang, C., Li, Z., Guyennon, N., Chen, Y., and Li, Y.: Patterns of Snow Drought Under Climate Change: From Dry to Warm Dominance, EGU General Assembly 2025, Vienna, Austria, 27 Apr–2 May 2025, EGU25-13893, https://doi.org/10.5194/egusphere-egu25-13893, 2025.

EGU25-13915 | ECS | Posters on site | ITS2.1/CL0.1

Spatial structures of emerging hot and dry compound events over Europe from 1950 to 2023 

Joséphine Schmutz, Mathieu Vrac, and Bastien François

Compound events (CE), characterized by the combination of climate phenomena that are not necessarily extreme individually, can result in severe impacts when they occur concurrently or sequentially. Understanding past and potential future changes in their occurrence is thus crucial. The present study investigates historical changes in the probability of hot and dry compound events over Europe and North Africa, using ERA5 reanalyses spanning the 1950-2023 period. Two key questions are addressed: (1) Where and when did the probability of these events emerge from natural variability, and what is the spatial extent of this emergence? This is explored through the analysis of “time” and “periods” of emergence, noted ToE and PoE, defined as the year from which and the moments during which changes in compound event probabilities exceed natural variability. The new concept of PoE allows for more in-depth signal analysis. (2) What drives the emergence? More specifically, what are the relative contributions of changes in marginal distributions versus in the dependence structure to the change of compound events probability? The signal is modelled with bivariate copula, allowing for the decomposition of these contributions. A focus on the dependence component is explored to quantify its effect on the signal’s emergence. 

The results reveal clear spatial patterns in terms of emergence and contributions. Five areas are studied in greater depth, selected for their similar signal behaviors. For example, the frequency of hot and dry events sharply increased in Maghreb and in the Iberian peninsula (ToE around 1980) and this rise is mainly due to a change in the marginals. Conversely, in eastern Europe the signal experienced a long PoE lower the natural variability, and this decline of CE probability is mainly driven by a change in the drought index. Although the dependence component is rarely the main contributor to PoE, it remains necessary to detect signal’s emergence. The date of ToE and the duration of PoE can be overestimated as well as underestimated (even more than 20 years) without considering this component. These findings provide new insights into the drivers of CE probability changes and open avenues for advancing attribution studies, ultimately improving assessments of risks associated with past and future climate change. 

How to cite: Schmutz, J., Vrac, M., and François, B.: Spatial structures of emerging hot and dry compound events over Europe from 1950 to 2023, EGU General Assembly 2025, Vienna, Austria, 27 Apr–2 May 2025, EGU25-13915, https://doi.org/10.5194/egusphere-egu25-13915, 2025.

EGU25-14385 | ECS | Orals | ITS2.1/CL0.1

Drought-flood abrupt alternation events and their impacts in China 

Wuxia Bi, Baisha Weng, Dawei Zhang, Fan Wang, Weiqi Wang, Wenqing Lin, Xin Qi, and Mingda Lu

Drought-flood abrupt alternation (DFAA), characterized by a period of persistent drought followed by sudden heavy precipitation at a certain level, has significant impacts on ecosystems and socioeconomic environment. As previous studies mainly focused on the monthly scale and regional scale, our study proposed a multi-indicator daily-scale method for identifying the DFAA occurrence. Then we applied the method on exploring the DFAA events over China from 1961 to 2018. The results show that: i) The DFAA events mainly occurred in the center and southeast of China. ii) The spatial coverage has a statistically significant (p < 0.05) increasing trend over China, of 0.355 %/decade. iii) The occurrence and spatial coverage of DFAA events increased by decades, and were mainly concentrated in summer (around 85%). Meanwhile, we conducted field experiments in typical area. The measurements revealed that DFAA events increased the soil nitrogen and phosphorus pollution in surface water.

How to cite: Bi, W., Weng, B., Zhang, D., Wang, F., Wang, W., Lin, W., Qi, X., and Lu, M.: Drought-flood abrupt alternation events and their impacts in China, EGU General Assembly 2025, Vienna, Austria, 27 Apr–2 May 2025, EGU25-14385, https://doi.org/10.5194/egusphere-egu25-14385, 2025.

EGU25-14749 | ECS | Orals | ITS2.1/CL0.1

Structural and Transient Compoundness in Natural Systems 

Elisa Ragno and Carlo De Michele

In recent years, compound events, i.e., events resulting from the interaction between multiple physical drivers, have gained great attention in the scientific community especially as they can lead to greater impacts than events controlled by a main single physical driver. The majority of the studies relied on the use of statistical measures of dependence and multivariate analyses to show potential for compound events across diverse climatic and geographical regions. However, these approaches provide limited insights into the system being investigated and its behavior.

Here, we propose an approach to characterize the 'compoundness' of a system in terms of two components: structural compoundness, which refers to the overall tendency of physical drivers to jointly occur and interact, and transient compoundness, which refers to the specific occurrence or manifestation of interacting physical drivers. We provide example applications of the proposed characterization and discuss their implications for developing climate-resilient adaptation strategies.

How to cite: Ragno, E. and De Michele, C.: Structural and Transient Compoundness in Natural Systems, EGU General Assembly 2025, Vienna, Austria, 27 Apr–2 May 2025, EGU25-14749, https://doi.org/10.5194/egusphere-egu25-14749, 2025.

Drought episodes combined with hot events usually trigger dramatic impacts on ecosystems and agricultural production. However, most existing studies on climate stress focus primarily on individual events, leading to a neglect of compound information. Based on various combinations of climate conditions, we investigate the impact of 6 modes of events, namely, compound dry and cold events, compound wet and hot events, compound dry and hot events (CDHEs), compound wet and cold events, droughts, and hot events, on maize yield in China. Evidence from both country–level and province–level yield data indicates that CDHEs have emerged as a major threat to maize yield, with higher yield reduction than the other 5 modes of climate events. Negative maize yield anomalies caused by CDHEs have increased over the past decades, partly due to the rising frequency, spatial extent, and severity of compound events. Moreover, the El Niño–Southern Oscillation (ENSO) has recently intensified yield losses associated with CDHEs. Findings from this investigation underscore the urgent need for adaptation strategies to prevent the occurrence of CDHEs, and to mitigate their impacts.

How to cite: Wu, X.: Increasing impact of compound dry and hot events on maize yield in China, EGU General Assembly 2025, Vienna, Austria, 27 Apr–2 May 2025, EGU25-15475, https://doi.org/10.5194/egusphere-egu25-15475, 2025.

EGU25-15803 | ECS | Posters on site | ITS2.1/CL0.1

Future evolution of compound low wind and cold events in winter impacting the French electricity system in CMIP6 climate models 

François Collet, Julien Boé, Margot Bador, Laurent Dubus, and Bénédicte Joudier

With the expected rapid growth of renewables in the French power system, periods of prolonged low renewable energy generation are expected to have a greater impact on the power system, especially if compounded with high electricity demand. In particular, compound winter low wind and cold events are identified by the French electricity transmission system operator as events that can drive major risks to the future French power system. Using CMIP6 climate simulations, the scope of this study is to characterize the future changes of these climate compound events in the mid- and long-term and assess the associated uncertainties.

To identify compound low wind and cold events, a wind power capacity factor and an electricity demand indices are derived using near-surface wind speed and temperature data from CMIP6 models, including several Single Model Initial-condition Large Ensemble (SMILE), for the 1950-2099 period. Due to large differences between observed and modeled indices, bias adjustment is first applied to raw temperature and near-surface wind speed data. The benefit of multivariate bias adjustment over univariate methods is assessed.

First, we characterize the future changes of compound low wind and cold events frequency in the mid- and the long-term, and which of the marginal characteristics (i.e., cold or low wind events) primarily drive these changes. Then, we assess the associated uncertainties, including uncertainties from internal variability, climate models, emission scenarios, and bias correction methods. Finally, we identify the role of climate drivers, including the global warming level, and exposure drivers, including the installed wind power capacity and the electricity demand parameters. This work demonstrates the relevance of CMIP6 large ensemble of simulations and methodologies currently used in the compound weather and climate events community to assess future risks for the power system.

How to cite: Collet, F., Boé, J., Bador, M., Dubus, L., and Joudier, B.: Future evolution of compound low wind and cold events in winter impacting the French electricity system in CMIP6 climate models, EGU General Assembly 2025, Vienna, Austria, 27 Apr–2 May 2025, EGU25-15803, https://doi.org/10.5194/egusphere-egu25-15803, 2025.

EGU25-16140 | ECS | Posters on site | ITS2.1/CL0.1

Evaluation and projection of hot-dry compound extreme events in a warmer climate 

Miriam Fuente-Gonzalez, Rodrigo Manzanas, Javier Diez-Sierra, Adrian Chantreux, and Ana Casanueva

Compound extreme events are characterized by the combination of two or more events (not necessarily extreme) that can increase their respective individual impact. These phenomena can be of temporal nature (events that occur at the same time or in close succession), spatial nature (what happens in a place affects another) and/or multivariable nature (combination of several variables). This work focuses on the analysis of hot-dry compound extreme events —characterized by the simultaneous occurrence of high daily maximum temperature and low precipitation— and assesses their frequency, duration and severity.


For this purpose, both observational data (for a recent historical period) and climate model simulations provided by the CORDEX initiative, which gathers international efforts devoted to regional climate modeling, are considered. In particular, we use the CORDEX-CORE (CORDEX Coordinated Output for Regional Evaluations) ensemble, which comprises two Regional Climate Models (RCMs) driven by three Global Climate Models (GCMs) under two distinct emission scenarios, covering most continental CORDEX domains at 0.22º spatial resolution (approx. 25km). Systematic biases, typically present in these simulations, have been alleviated with the application of bias adjustment, using a semi-parametric, trend-preserving, quantile mapping method (ISIMIP). 


Our overall results show that hot-dry compound extreme events are enhanced over the next decades, with a general but region-dependent increase in frequency, duration and severity for different levels of global warming (+1.5, +2, +3 and +4 ºC, with respect to pre-industrial conditions), which can have important  impacts across various sectors such as health, economy, tourism and agriculture, among others. 


This work is part of Project COMPOUND (TED2021-131334A-I00) funded by MCIU/AEI/10.13039/501100011033 and by the European Union NextGenerationEU/PRTR. A. C. and R. M. acknowledge support from PID2023-149997OA-I00 funded by MICIU/AEI/10.13039/501100011033 and by ERDF/EU.


Keywords: compound events, regional climate models, climate change, extreme climate.

How to cite: Fuente-Gonzalez, M., Manzanas, R., Diez-Sierra, J., Chantreux, A., and Casanueva, A.: Evaluation and projection of hot-dry compound extreme events in a warmer climate, EGU General Assembly 2025, Vienna, Austria, 27 Apr–2 May 2025, EGU25-16140, https://doi.org/10.5194/egusphere-egu25-16140, 2025.

EGU25-16288 | ECS | Orals | ITS2.1/CL0.1

A generalized method for the analysis of non-stationary joint extremes based on the transformed-stationary extreme value analysis 

Mohammad Hadi Bahmanpour, Lorenzo Mentaschi, Alois Tilloy, Michailis Vousdoukas, Ivan Federico, Giovanni Coppini, and Luc Feyen

Extreme value analysis (EVA) includes a range of methods used to study the frequency and magnitude of rare but catastrophic events, with applications in science and engineering. These methods rely on mathematical theories that assume stable input data over time. However, many long-term datasets, especially those related to natural hazards, show clear changes over time (non-stationarity). With the availability of long-term climate records, there is a need for a reliable approach to analyze non-stationary extreme events that occur together (compound events), which is crucial for hazard assessment. This study introduces a method to analyze non-stationary joint extremes by combining Transformed-Stationary Extreme Value Analysis (tsEVA) with copula theory. This approach accounts for changes in the relationship between variables over time. The method includes sampling strategies to select relevant events, applying tsEVA for non-stationary univariate distributions, and using time-varying copulas to model the evolving relationships between variables. It thus considers all possible sources of non-stationarity that may affect joint extremes. The framework also incorporates statistical tools like the Mann-Kendall test to assess the significance of trends and Monte Carlo resampling for model validation and uncertainty analysis. Using this approach, the joint distribution of extremes in various natural hazards, such as river discharge, wave height, temperature, and drought, was successfully analyzed. The results highlighted the method's effectiveness in addressing diverse sources of non-stationarity and revealed dynamic patterns in variable interrelationships. Furthermore, the methodology developed in this study offers a viable tool for future research focused on generating statistically consistent hazard scenarios to support comprehensive risk assessments.

How to cite: Bahmanpour, M. H., Mentaschi, L., Tilloy, A., Vousdoukas, M., Federico, I., Coppini, G., and Feyen, L.: A generalized method for the analysis of non-stationary joint extremes based on the transformed-stationary extreme value analysis, EGU General Assembly 2025, Vienna, Austria, 27 Apr–2 May 2025, EGU25-16288, https://doi.org/10.5194/egusphere-egu25-16288, 2025.


Abstract. Droughts significantly affect socioeconomic conditions globally. As a multifaceted phenomenon, droughts are assessed through various indices distinguished in meteorological, agricultural, and hydrological typologies, each designed to capture distinct aspects. So, there is a strong demand for comprehensive drought monitoring tools that integrate multiple aspects to offer a holistic view of drought conditions. Typically, when introducing a new composite drought index, it is evaluated in comparison to existing indices, however this approach cannot allow to evaluate its accuracy in actual conditions. Therefore, shifting the paradigm from model-by-model evaluations to impact-oriented analysis is crucial. This work introduces a drought index based on deep learning where economic losses induced by drought are used as a key metric in assessing the index performance. The introduced index is calculated using cutting-edge deep learning algorithms based on various drought-related variables. Different types of self-supervised learning models, including Convolutional Neural Networks (CNN), Artificial Neural Networks (ANN), and Variational Autoencoders, are employed to enhance the model's accuracy and robustness. We use reanalysis data (ERA5) spanning from 1980 to 2022 for Italy, coupled with the EM-DAT database, to conduct impact analysis. The performance of each model is outlined based on their accuracy in estimating economic losses induced by droughts. 

Keywords: Drought Index, Deep learning, Autoencoder, impact-oriented analysis.


How to cite: Khosh Chehreh, M. and De Michele, C.: Development of a Composite Drought Index using deep learning: A Unified Framework for Multi-Dimensional Drought Characterization, EGU General Assembly 2025, Vienna, Austria, 27 Apr–2 May 2025, EGU25-16322, https://doi.org/10.5194/egusphere-egu25-16322, 2025.

EGU25-17021 | ECS | Orals | ITS2.1/CL0.1

Spatially compounding heat and precipitation extremes under omega blocking in Europe 

Magdalena Mittermeier, Yixuan Guo, Laura Suarez-Gutierrez, Emanuele Bevacqua, and Erich Fischer

In early September 2023, Europe experienced a pronounced atmospheric omega-blocking event, which led to spatially compounding precipitation and heat extremes across Europe. Omega-blocking is characterized by a persistent anticyclone at its core, flanked by two low-pressure systems to the southwest and southeast. During the September 2023 event, the center of the omega block was positioned over Central Europe and Southern Scandinavia, which experienced a significant heatwave during the first week of September 2023. Conversely, regions on the southwestern flanks (Spain) and southeastern flanks (Greece, Bulgaria, and subsequently Libya) were affected by extreme precipitation events, leading to severe flooding.

We employ the method of ensemble boosting to explicitly simulate omega-blocking situations with spatially compounding extremes (heatwave and extreme precipitation) with the Community Earth System Model 2 (CESM2). We therefore select analogs to the September 2023 event in a 30-member initial condition large ensemble of the CESM2 and use the model re-initialization approach of ensemble boosting to introduce slight perturbations to initial conditions 10 to 25 days prior to the event. This enables the generation of hundreds of coherent physical event trajectories, supporting the investigation of two key research questions: the first focuses on assessing the capability of the climate model to reproduce the 2023 event in its severity, while the second focuses on identifying the key characteristics of the omega block and its emergence that contribute to the most severe impacts on the ground.

In our talk, we introduce the research concept and address the following research questions: Is the CESM2 model capable of reproducing an omega blocking event with spatially compounding heat and precipitation extremes in the magnitude of the September 2023 event? Could the September 2023 event have been even more devastating by chance? What characteristics of the omega block and its emergence precondition the occurrence of the most extreme spatially compounding impacts in terms of heatwaves and extreme precipitation within the boosted ensemble?

How to cite: Mittermeier, M., Guo, Y., Suarez-Gutierrez, L., Bevacqua, E., and Fischer, E.: Spatially compounding heat and precipitation extremes under omega blocking in Europe, EGU General Assembly 2025, Vienna, Austria, 27 Apr–2 May 2025, EGU25-17021, https://doi.org/10.5194/egusphere-egu25-17021, 2025.

As global warming intensifies, high-latitude and mid-to-high-elevation watersheds are increasingly experiencing compound low-snow high-temperature events, posing serious challenges to water resources and ecosystem stability. However, the spatiotemporal characteristics of these events and their impacts on vegetation productivity and physiological processes remain insufficiently understood. In this study, drawing on multiple reanalysis datasets and hydrological models, we systematically evaluated the historical and future trajectories of low-snow high-temperature events across the Northern Hemisphere, including their potential lagged effects on ecosystems. By integrating diverse Gross Primary Productivity (GPP) datasets derived from observations, satellite products, and models—and employing an explainable causal machine learning framework—we identified key climatic and plant physiological drivers influencing GPP under these compound conditions. The findings highlight an increasingly frequent and persistent occurrence of low-snow high-temperature events, along with significant effects on vegetation functions, such as water-use efficiency, carbon uptake, and community structural adaptations. Overall, this research not only traces the upward trend of these compound events but also underscores their profound ecological implications, offering valuable insights for advancing global carbon cycle assessments and informing future climate adaptation strategies.

How to cite: Yang, Y.: Rising Compound Low-Snow High-Temperature Events: Drivers, Ecosystem Responses, and Future Outlook, EGU General Assembly 2025, Vienna, Austria, 27 Apr–2 May 2025, EGU25-17066, https://doi.org/10.5194/egusphere-egu25-17066, 2025.

EGU25-17367 | ECS | Orals | ITS2.1/CL0.1

Cascading impacts across the coupled climate, ecological, agricultural and socioeconomic systems 

Laura Suarez-Gutierrez, Ana Bastos, and Gabriele C. Hegerl

The complexity of climate risk can lead to cascading impacts across the coupled climate, ecological, agricultural, and socioeconomic systems, which may involve potentially unprecedented outcomes and feedbacks, nonlinear behaviors or tipping points. While advances have been made in understanding such interconnected risks, particularly within specific disciplines, significant gaps remain in our understanding and modelling of such risks, and especially of how they cascade across systems. 

Several of such examples of cascading impacts can be found across the world, just in the last few years. The Australian bushfires of 2019-2020, fueled by extreme heat and prolonged drought, caused massive biodiversity loss, widespread air pollution, and significant economic damages. The 2021 Himalayan glacier collapse led to catastrophic flooding, infrastructure damage, and disruptions to local livelihoods, highlighting the fragility of mountain ecosystems in a warming climate. The global food and energy crisis of 2022, driven by geopolitical conflict and the disruption of supply chains compounded by low crop yields revealed the vulnerability of interconnected supply chains, with far-reaching implications for global stability. The 2024 DANA flooding in Spain, caused by a record-breaking atmospheric instability event and delayed emergency response, resulted in devastating loss of human lives and damage to infrastructure, agriculture, and urban areas, which eventually led to civil unrest in the region. All these examples underscore the need for comprehensive risk assessment, modelling and projection that better captures how shocks may compound and cascade across systems leading to high-impact outcomes larger than the sum of their parts. 

Existing frameworks and methodologies frequently fail to account for nonlinearities and worst-case outcomes or compartmentalize risks, in part to make an extremely complex problem simpler. This limits our ability to capture effects and impacts cascading to and from other sectors and systems, resulting in an incomplete understanding of the systemic nature of risk. Here, we assess to which extent cascading impacts have been included in impact assessments across sectors given our current methodologies and frameworks, to which extent our current methodologies and frameworks are insufficient for the task, and the cases where, even though current technology may allow it, cascading risks may have been overlooked. We reflect on recent examples of cascading impacts and their drivers, and outline critical directions for improving their integration into future risk assessments.

How to cite: Suarez-Gutierrez, L., Bastos, A., and Hegerl, G. C.: Cascading impacts across the coupled climate, ecological, agricultural and socioeconomic systems, EGU General Assembly 2025, Vienna, Austria, 27 Apr–2 May 2025, EGU25-17367, https://doi.org/10.5194/egusphere-egu25-17367, 2025.

EGU25-17762 | ECS | Orals | ITS2.1/CL0.1

Understanding compound weather and climate risks facing electricity networks 

Colin Manning, Sean Wilkinson, and Hayley Fowler

Electricity networks are an important component of critical national infrastructure. Their failure, leading to power outages, can cascade through other infrastructure networks and compromise the function of other critical services. Electricity networks are facing a massive transformation to handle the increased demands placed on them by net zero commitments. Alongside this, future increases in the frequency and intensity of extreme weather will test electricity infrastructure that is already perceived to have insufficient resilience. Transforming networks as part of the net zero transition presents an opportunity to increase their resilience: this requires an understanding of the causes of network failures, the challenges that utility operators face in managing infrastructure risks, and the quantification of weather driven risks.

In this presentation, we present results from two projects. The first project used interviews and round-table discussions with energy industry experts in the UK to understand their needs from climate science as well as to uncover what they consider to be the largest weather and climate risks, the operational difficulties these present to electricity networks and what they believe to be low-regret options for enhancing climate resilience. The second project used statistical analysis to predict damage to electricity infrastructure from key weather hazards (windstorms, heat waves) and assessed how electricity infrastructure risks may change in the future using high-resolution 2.2 km climate simulations.

We discuss the main outcomes, strengths and limitations of both approaches and conclude that 1) expert elicitation provides a detailed and nuanced understanding of the range and severity of societal consequences produced by extreme weather and various compounding factors, and 2) probabilistic impact models that do not include multi-hazard and compounding effects underestimate the potential damages of extreme weather to electricity infrastructure – specifically the effects of wind direction, soil moisture and leaf cover during windstorms.

How to cite: Manning, C., Wilkinson, S., and Fowler, H.: Understanding compound weather and climate risks facing electricity networks, EGU General Assembly 2025, Vienna, Austria, 27 Apr–2 May 2025, EGU25-17762, https://doi.org/10.5194/egusphere-egu25-17762, 2025.

EGU25-18021 | ECS | Posters on site | ITS2.1/CL0.1

Increasing frequency and intensity of compound droughts in the Amazon region 

Vanessa Ferreira, Allan Buras, Jakob Zscheischler, Miguel Machecha, and Anja Ramming

The Amazon rainforest, a critical global ecosystem, is increasingly threatened by climate change and extreme weather events. Over recent decades, the region has experienced record-high temperatures and unprecedented droughts. Compound drought and heatwave events (CDHWs), characterized by simultaneous dry and hot conditions, along with soil moisture (SM) deficits and high vapor pressure deficits (VPD), exacerbate ecosystem stress and intensify drought severity. This study investigates the climatology of CDHWs and compound low-SM/high-VPD events in the Amazon from 1981 to 2024 using the ERA5 dataset. Most compound events occurred during well-known drought years, including 1983, 1997/1998, 2010, 2015/2016, and 2023/2024. While compound events rarely impacted more than 20% of the region before 2010, subsequent years saw widespread effects, with the 2023/2024 drought ranking as the most extreme on record. During the austral summer of 2023/2024, CDHWs affected 70% of the Amazon's area, compared to 40% in 2015/2016. Similarly, low-SM/high-VPD conditions impacted 30% of the region in 2015/2016 and an unprecedented 60% in 2023/2024. Our results suggest an increase in the frequency, extent, and duration of compound extremes in the Amazon region, particularly over the last two decades, which could have critical implications for ecosystem resilience and climate adaptation strategies. The previous record compound event of 2015/2016 was particularly significant due to its ecological impacts, including tree mortality, biomass growth decline, and reductions in net primary productivity (NPP), gross primary productivity (GPP), and carbon uptake. Therefore, the ongoing record-breaking CDHW and low-SM/VPD conditions in 2023/2024 are expected to have even more severe impacts on the Amazon rainforest.

How to cite: Ferreira, V., Buras, A., Zscheischler, J., Machecha, M., and Ramming, A.: Increasing frequency and intensity of compound droughts in the Amazon region, EGU General Assembly 2025, Vienna, Austria, 27 Apr–2 May 2025, EGU25-18021, https://doi.org/10.5194/egusphere-egu25-18021, 2025.

EGU25-18415 | ECS | Posters on site | ITS2.1/CL0.1

Spatially compound and local extreme precipitation events: behaviors and trends  

Tiantian Xing and Carlo De Michele

Spatially compound extreme precipitation events can result in more severe impacts than individual extremes, posing significant challenges to both human and natural systems. Understanding their spatial distribution and trends is crucial for developing effective mitigation and adaptation strategies. In this study, we analyze multiple datasets, including reanalysis datasets (ERA-5, MERRA-2) and gridded networks derived from meteorological station data, to investigate long-term trends in precipitation over land and oceans at global, regional, and gridded scales. Using fixed thresholds, we assess the joint occurrence of extreme precipitation events and examine how these events change relative to temperature in different regions. 

Our findings show that the proportion of areas affected by spatially compound extreme precipitation events has increased significantly, particularly in tropical and coastal regions. Moreover, the growth trend in areas experiencing co-occurring extreme precipitation exceeds the trend observed at individual pixel scales, highlighting that focusing solely on pixel-scale changes underestimates the full extent of natural disasters caused by extreme precipitation. This synthesis underscores the escalating risks of compound climate extremes under global warming, driven by the complex interplay of joint precipitation occurrences. 

How to cite: Xing, T. and De Michele, C.: Spatially compound and local extreme precipitation events: behaviors and trends , EGU General Assembly 2025, Vienna, Austria, 27 Apr–2 May 2025, EGU25-18415, https://doi.org/10.5194/egusphere-egu25-18415, 2025.

EGU25-18746 | Posters on site | ITS2.1/CL0.1

Global Compound Climate Events: Intensified Air Pollution During Simultaneous Extreme Events 

Ana Russo, Virgilio Bento, Daniela Lima, and João Careto

The increasing frequency and intensity of extreme environmental and climatic stressors, such as heatwaves, droughts, wildfires, and air pollution episodes, highlight the urgency of understanding their interconnected nature. Traditionally studied in isolation, these stressors often interact in complex ways, amplifying their individual and cumulative impacts on ecosystems, economies, and public health. This study explores the global occurrence of compound events involving heatwaves, droughts, wildfires, and poor air quality, identifying their key drivers, spatial distribution, and associated consequences.

ERA5 reanalysis were used to identify drought periods using the Standardized Precipitation-Evapotranspiration Index (SPEI) and detected heatwaves based on temperature anomalies. Fire activity was assessed using Fire Radiative Power (FRP) data from the Moderate Resolution Imaging Spectroradiometer (MODIS) aboard the Terra and Aqua satellites, while air pollution levels, specifically particulate matter (PM2.5), were derived from the Copernicus Atmosphere Monitoring Service (CAMS) global reanalysis (EAC4). The co-occurrence of these phenomena was analyzed to pinpoint regions experiencing compound hot, dry, fire, and pollution events.

Our findings reveal distinct global hotspots where multiple stressors interact. Heatwaves and air pollution events were predominantly observed in regions such as India, the Arabian Peninsula, and eastern China. Meanwhile, the Brazilian Cerrado, northern Australia, and South African savannas frequently experienced simultaneous heatwave and wildfire occurrences. The Mediterranean region, particularly Greece, Portugal, and Italy, exhibited a high prevalence of concurrent heat, drought, wildfire, and air pollution episodes. Notably, in North America and Asia, PM2.5 concentrations reached significantly higher levels during simultaneous extreme events compared to isolated pollution occurrences.

The interplay of compound hot and dry conditions with wildfires, and ultimately with pollution events, presents critical challenges for public health and environmental management. The cascading effects of these interactions underscore the need for integrated approaches that encompass climate adaptation strategies, wildfire risk mitigation, and stringent air quality regulations. Understanding these linkages is essential for formulating policies that enhance climate resilience and safeguard communities against the escalating threats posed by climate-driven extreme events.

This research was funded by the Portuguese Fundação para a Ciência e a Tecnologia, FCT, I.P./MCTES through national funds (PIDDAC): UID/50019/2025 and LA/P/0068/2020 https://doi.org/10.54499/LA/P/0068/2020. This study was conducted within the scope of project https://doi.org/10.54499/2022.09185.PTDC (DHEFEUS) and supported by national funds through FCT. DL and AR acknowledge FCT I.P./MCTES for grants https://doi.org/10.54499/2022.03183.CEECIND/CP1715/CT0004 and https://doi.org/10.54499/2022.01167.CEECIND/CP1722/CT0006, respectively.


How to cite: Russo, A., Bento, V., Lima, D., and Careto, J.: Global Compound Climate Events: Intensified Air Pollution During Simultaneous Extreme Events, EGU General Assembly 2025, Vienna, Austria, 27 Apr–2 May 2025, EGU25-18746, https://doi.org/10.5194/egusphere-egu25-18746, 2025.

EGU25-18782 | Posters on site | ITS2.1/CL0.1

Identifying climate related hazards relevant for the Norwegian Energy System  

Stephanie Mayer, Iva Ridjan Skov, Alessandro Mati, Tara Botnen Holm, Carlo Aall, and Camille Deciron

Renewable energy production plays a major role in Norway’s energy sector accounting for approximately 98% of the national electricity production. Unusually little precipitation in southern Norway in year 2021 resulted in reduced filling of the hydropower reservoirs. Accompanied with calm wind conditions over major wind-energy producing areas of Europe this led to exceptionally high electricity prices in Norway during winter 2021/2022.

As most renewable energy sources depend inherently on weather and climate condition, they are sensitive to large-scale weather regimes, natural climate variability, climate change and extreme weather events that can threaten the renewable energy system’s stability and reliability. By transitioning to more renewable sources such as hydro, wind and solar power, societies may expose themselves to an increased risk of potential instabilities and unreliability in the power supply. Within the SusRenew project we expand on the concept of compound events by looking at climate hazards that are specifically relevant for the energy system in Norway, and by looking at the possible joint occurrence of hazard pairs in different regions that are linked in the northern European energy system.

How to cite: Mayer, S., Ridjan Skov, I., Mati, A., Botnen Holm, T., Aall, C., and Deciron, C.: Identifying climate related hazards relevant for the Norwegian Energy System , EGU General Assembly 2025, Vienna, Austria, 27 Apr–2 May 2025, EGU25-18782, https://doi.org/10.5194/egusphere-egu25-18782, 2025.

Extreme compound events, defined as the “combination of multiple drivers and/or hazards that contributes to societal or environmental risk”, present a
growing concern for the scientists and the civil society (Zscheischler et al. 2020). Climate models provide physical simulations of the climate until 2100, which permits to better understand the evolution of the extreme events under climate change. This study proposes a novel modeling of bivariate extreme events using bivariate Generalized Pareto Distributions (biGPD), with Extended GPD for the univariate part (EGPD). This novel semi-parametric modeling is applied to an extreme event: the flooding of the Seine and the Loire watersheds in June 2016. This event is a spatially compound event between the accumulated precipitations over the two watersheds. The accumulation of rain over several days is approximated by the Antecedent Precipitation Index (API), and high values of API are considered to lead to flooding. This approach is compared to a more classic copula modeling over simulations in Jacquemin et al. (2025, submitted). As climate simulations often have statistical biases, they must be corrected using bias correction algorithms. This is also the case for their simulations of compound events. This study compares several multivariate bias correction algorithms (CDF-t, dOTC and R2D2) on this event. dOTC seems to perform better than R2D2 for extreme values. The proposed methodology illustrates how compound events can be analyzed, and their evolution in frequency projected. As a perspective, this method can be applied to more diverse compound events, and it could be generalized to events in higher dimensions.

Bibliography:
Zscheischler, J., Martius, O., Westra, S., Bevacqua, E., Raymond, C., Horton, R. M., van den Hurk, B., AghaKouchak, A., Jézéquel, A., Mahecha, M.
D., et al.: A typology of compound weather and climate events, Nature reviews earth & environment, 1, 333–347, 2020.
Jacquemin, G., Vrac, M., Allard, D., and Freulon, X.: Estimating the return period of climate compound events using a non parametric bivariate Generalized Pareto representation. Submitted

How to cite: Jacquemin, G., Vrac, M., Allard, D., and Freulon, X.: Projecting frequencies of extreme rainfall compound events under climate change using bivariate extreme value modeling and multivariate bias corrections, EGU General Assembly 2025, Vienna, Austria, 27 Apr–2 May 2025, EGU25-19231, https://doi.org/10.5194/egusphere-egu25-19231, 2025.

EGU25-19481 | ECS | Orals | ITS2.1/CL0.1

Towards a storyline of compound flood events over Italy: the role of precipitation-soil moisture pre-conditioning 

Antonio Giordani, Claudia Butera, Paolo Ruggieri, and Silvana Di Sabatino

The urgency for deeper understanding compound hydro-meteorological extreme events is growing, as these events are increasingly recognized for their potential to exacerbate impacts compared to single hazards. Characterized by the concomitance of multiple natural hazards or drivers, compound events are further intensified by climate change, which influences their severity and increases their frequency of occurrence. These hydro-meteorological extremes pose a significant risk to terrestrial ecosystems and have devastating consequences for socio-territorial systems. In Italy, recent extreme events have highlighted this threat, as demonstrated by the unprecedented sequence of heavy precipitation events in 2023-2024 that led to widespread flooding in the region of Emilia Romagna in central-northern Italy. These low-probability events, which resulted in several fatalities and damages amounting to tens of billions of euros, were amplified by antecedent precipitation that saturated soils, significantly enhancing the runoff response and, consequently, flood severity and extension. Indeed, the pre-condition given by soil imbibition preceding heavy rainfall occurrences is crucial in determining the potential severity of the event, but its comprehensive understanding is still limited.

This study investigates the relationship between precipitation and soil moisture conditions in Italy, with the goal to quantitatively characterize their role in the occurrence of historical and plausible compound hydro-meteorological extremes. We employ state-of-the-art reanalysis datasets (ERA5 and ERA5-Land) to analyze a series of representative extreme precipitation events, focusing on their antecedent soil moisture conditions and estimating the typical temporal scales of the associated co-variation. The link between these hydro-meteorological quantities and riverine flood occurrences is assessed considering streamflow discharge data from EFAS hydrological reanalysis dataset. The prevailing large-scale conditions driving these events, in terms of the 500-hPa geopotential height and the integrated water vapor transport column, are explored to identify the key dynamical features responsible for the occurrence of compound flooding. Additionally, a large ensemble of seasonal numerical weather forecasts is employed to sample the phase space of precipitation-soil moisture conditions applying the so-called UNSEEN (Unprecedented Simulated Extremes using ENsembles) approach. Within this framework, the probability of compound precipitation-soil moisture extremes is assessed through a statistical event coincidence analysis to understand the dominant spatio-temporal patterns of their interaction; moreover, physical storylines of rare, yet plausible, extreme flood events will be built through ensemble pooling.

How to cite: Giordani, A., Butera, C., Ruggieri, P., and Di Sabatino, S.: Towards a storyline of compound flood events over Italy: the role of precipitation-soil moisture pre-conditioning, EGU General Assembly 2025, Vienna, Austria, 27 Apr–2 May 2025, EGU25-19481, https://doi.org/10.5194/egusphere-egu25-19481, 2025.

EGU25-19486 | Posters on site | ITS2.1/CL0.1

Review article: The growth in compound weather events research inthe decade since SREX (2012-2022) 

Lou Brett, Christopher White, Daniela Domeisen, Philip Ward, Jakob Zscheischler, and Bart van den Hurk

Compound events occur when multiple drivers or hazards combine, creating societal or environmental risks, with high-impact occurrences such as simultaneous heatwaves and droughts often leading to more severe consequences than isolated incidents. A systematic review of 366 peer-reviewed papers published between 2012 and 2022 reveals an annual average increase of 60% in research focused on compound events, particularly for multivariate (co-occurring) events. Studies primarily focus on Europe, Asia, and North America, while significant gaps remain in Africa, South America, and Oceania. Key modulators, such as the El Niño Southern Oscillation, along with event types like compound floods and high-temperature, low-precipitation events, are highlighted as the most studied within the literature. Recommendations from the review include expanding research in underrepresented regions and studying a broader range of typologies, events and modulators. Furthermore, it also calls for enhanced cross-disciplinary and sectoral collaboration to better understand and manage the growing risks posed by compound events in a changing climate.

How to cite: Brett, L., White, C., Domeisen, D., Ward, P., Zscheischler, J., and van den Hurk, B.: Review article: The growth in compound weather events research inthe decade since SREX (2012-2022), EGU General Assembly 2025, Vienna, Austria, 27 Apr–2 May 2025, EGU25-19486, https://doi.org/10.5194/egusphere-egu25-19486, 2025.

EGU25-19545 | ECS | Orals | ITS2.1/CL0.1

Amplified agricultural impacts from increasingly sequential heat extremes 

Raed Hamed, Carmen B. Steinmann, Qiyun Ma, Daniel Balanzategui, Ellie Broadman, Corey Lesk, and Kai Kornhuber

As the climate warms, interacting weather extremes such as sequential heat events pose complex risks to societies. Regarding the global food system, laboratory experiments suggest that crop exposure to spring heat may either confer tolerance or enhance vulnerability to subsequent summer heat events. We show, under historic conditions that hot springs benefit crop yield but amplify the impacts of summer heat by 3% to 36% across crops and regions compared to average spring conditions. This increasing sensitivity results in impacts outweighing hot spring benefits when summer temperature anomalies exceed 2-4°C. Analyzing projected temperature increases, we find an eight-fold rise in the frequency of sequential heat extremes under the Shared Socioeconomic Pathway 3-7.0. Accounting for the compounding effect of sequential heat on crop yields increases projected losses by 1 to 71% depending on crop and region. This underlines the emerging nonlinear risk of sequential heat extremes to food security, which can largely be avoided when limiting warming to 1.5°C globally.

How to cite: Hamed, R., Steinmann, C. B., Ma, Q., Balanzategui, D., Broadman, E., Lesk, C., and Kornhuber, K.: Amplified agricultural impacts from increasingly sequential heat extremes, EGU General Assembly 2025, Vienna, Austria, 27 Apr–2 May 2025, EGU25-19545, https://doi.org/10.5194/egusphere-egu25-19545, 2025.

EGU25-1118 | ECS | Posters on site | ITS1.6/CL0.3

Comparative Analysis of GCM Selection Approaches for Climate Change Impact Assessment in India 

Sachin Kumar, Mahendra kumar Choudhary, and Thomas Thomas

Reliable climate projections are crucial for informed decision-making in water resource planning and management. However, selecting suitable Global Climate Models (GCMs) remains challenging due to inherent uncertainties and computational constraints. This study introduces a novel hybrid approach for GCM selection, focusing on models that exhibit consistency in projecting future climate changes and skill in representing current climate conditions, including average climate, seasonal patterns, and climatic variations. GCM performance in simulating these critical properties was evaluated for rainfall, maximum temperature, and minimum temperature using the Kling-Gupta Efficiency (KGE) metric, resulting in a structured 3×3 performance matrix for each GCM. The matrix distances, quantifying the disparities between each GCM's performance matrix and the ideal reference matrix, were used to represent overall model performance. GCMs were then ranked based on these differences using the Jenks natural breaks classification method to identify the top-performing models for ensemble construction. The proposed method was tested by selecting GCMs for Nigeria from 19 CMIP6 GCMs. Results indicate that 15 GCMs consistently projected future climate within a 95% confidence interval. Further evaluation reveals that ACCESS.ESM1.5, BCC.CSM2.MR, CMCC.ESM2, and MRI.ESM2.0 are the most suitable for simulating Nigeria's climate. The multi-model ensemble means of the selected GCMs projected a notable increase in rainfall by 10 to 40% over most of the country and maximum and minimum temperatures by 1.0 to 3.5°C and 0.5 to 4.0°C, respectively. The proposed approach offers an effective tool for GCM selection to enhance climate projection reliability.

How to cite: Kumar, S., Choudhary, M. K., and Thomas, T.: Comparative Analysis of GCM Selection Approaches for Climate Change Impact Assessment in India, EGU General Assembly 2025, Vienna, Austria, 27 Apr–2 May 2025, EGU25-1118, https://doi.org/10.5194/egusphere-egu25-1118, 2025.

EGU25-3831 | ECS | Orals | ITS1.6/CL0.3

Historical stratospheric aerosol optical properties and volcanic sulfur emissions for CMIP7 Fast Track 

Thomas Aubry, Matthew Toohey, Anja Schmidt, Mahesh Kovilakam, Michael Sigl, Sujan Khanal, Man Mei Chim, Ben Johnson, Simon Carn, Magali Verkerk, Zebedee Nicholls, and Isabel Smith

Stratospheric aerosols, most of which originate from explosive volcanic sulfur emissions into the stratosphere, are a key natural driver of climate variability. They are thus one of the forcings provided by the Coupled Model Intercomparison Project (CMIP) Climate Forcings Task Team for the CMIP7 Fast Track, a set of climate model experiments designed to deliver the Intergovernmental Panel on Climate Change (IPCC) 7th assessment cycle. In this work, we document the final version of the stratospheric aerosol forcing datasets delivered to modelling groups for CMIP7 Fast Track. Our datasets cover the 1750-2023 period to meet to the need of modelling groups who might run extended historical simulations starting in 1750 instead of 1850. We produced one volcanic stratospheric sulfur emission dataset catering for the needs of models which have a prognostic interactive stratospheric aerosol scheme, as well as a stratospheric sulfate aerosol optical property dataset required by models that cannot interactively simulate stratospheric sufate aerosols. For the satellite era (from 1979 onwards), sulfur emissions and sufate aerosol optical properties are based on the MSVOLSO2L4 and GloSSAC datasets, respectively. For the pre-satellite era (1750-1978), the emission dataset is based on ice-core datasets complemented by the geological record for small-moderate magnitude eruptions not captured in ice-core records. Although inferring emissions of these eruptions from the geological record is highly uncertain, our approach minimizes an important bias in the pre-satellite era forcing, both in terms of mean and variability. The pre-satellite aerosol optical property dataset is directly derived from emissions using an updated version of EVA_H, a reduced-complexity volcanic aerosol model. This ensures methodological consistency between our emission and optical property datasets, and maximizes consistency with methodologies used in the paleoclimate (PMIP) and volcanic forcing (VolMIP) model intercomparison projects in CMIP6. We will present extensive comparison between our CMIP7 Fast Track dataset and the CMIP6 dataset. Last, we will discuss the main challenges to improve stratospheric aerosol datasets in the future and to move to high frequency (yearly or less) extension and update instead of an ad-hoc production for each CMIP phase.

How to cite: Aubry, T., Toohey, M., Schmidt, A., Kovilakam, M., Sigl, M., Khanal, S., Chim, M. M., Johnson, B., Carn, S., Verkerk, M., Nicholls, Z., and Smith, I.: Historical stratospheric aerosol optical properties and volcanic sulfur emissions for CMIP7 Fast Track, EGU General Assembly 2025, Vienna, Austria, 27 Apr–2 May 2025, EGU25-3831, https://doi.org/10.5194/egusphere-egu25-3831, 2025.

EGU25-4053 | Posters on site | ITS1.6/CL0.3

Research on Key Technologies of 3D Geological Model Rendering in Cloud Environment 

Yue Song, Zhenji Gao, Guoxi Song, and Jingchao Li

3D model is a 3D digital representation of objective things, which has been widely applied in fields like urban construction, disaster prevention and mitigation, medical research, biological science, industrial manufacturing, agricultural production, etc. As a special 3D model, 3D geological model possesses the characteristics of 3D model and plays a fundamental role in geological survey, mineral exploitation, underground engineering and smart city construction.With the development of intelligent sensing technology and 3D geological modeling technology, the scale of 3D geological model data increases exponentially. Meanwhile, with the pace of large-scale underground engineering and smart city continuing to increase, 3D geological model with fine large scenes is being eagerly required. The rapid growth of data and the refinement of large application scenes bring new challenges to the real-time dynamic visualization of 3D geological models. These challenges are mainly reflected in the new technical problems related to 3D geological model rendering.This study focuses on 3D geological model rendering and puts forward the corresponding solutions. The validity of the technology has been proved by the simulation test of cluster cloud environment consisting of 5 computers. The technique has been applied in the construction of 3D geological information and visualization system in transparent Xiong’an.Firstly, the data organization mode of two common structures of 3D geological model (3D geological structure model and 3D geological high-precision grid model) is analyzed, and a distributed storage strategy of 3D geological model based on MongoDB is proposed. Aiming at the characteristics of multi-layer data in z-direction of 3D geological structure model, an octree index mechanism is proposed to improve the efficiency of data scheduling according to the z-direction spatial information and layer information. The rendering optimization of a single node 3D geological model is studied. The rendering in the cloud environment still needs the cooperation of each sub-node. Therefore, the overall rendering efficiency in the cloud environment can be improved by adopting efficient rendering optimization strategies for the 3D geological model of each node and selecting an effective node scheduling strategies. Single-node 3D geological model rendering is mainly performed by transferring data from memory to GPU. The communication between memory and GPU is a bottleneck, which will affect the overall rendering efficiency. Through the strategies of visibility elimination, LOD establishment, data merging and instance rendering optimization, this thesis effectively reduces the number of drawing calls and communication times. How to optimize and improve the overall performance of 3D geological model rendering in cloud environment from a global perspective is studied, and a multi-level distributed SCMP framework is proposed, which integrates the advantages of cluster, GPU, distributed storage, etc., to maximize the distributed computing ability of existing machines and improve the rendering efficiency in cloud environment. From the experimental data, the node invocation optimization strategy with “GPU+CPU” can ensure that the frame rate of the four rendering nodes and the end-user scene in the cloud environment is stable at about 35 frames per second, and can achieve satisfactory cluster load balancing effect.

How to cite: Song, Y., Gao, Z., Song, G., and Li, J.: Research on Key Technologies of 3D Geological Model Rendering in Cloud Environment, EGU General Assembly 2025, Vienna, Austria, 27 Apr–2 May 2025, EGU25-4053, https://doi.org/10.5194/egusphere-egu25-4053, 2025.

EGU25-5383 | Posters on site | ITS1.6/CL0.3

Research and application of key technologies of geological data platform 

ning cui and zhenji gao

As a data-intensive science, earth system science has been focusing on the research of living environment and constituent element’s characteristics, including its forming time, location and evolution. With big data and AI boosting, there are more opportunities and challenges for geological research transformation. And it is more likely to improve geological survey and geological research by means of information method such as AI algorithm, methods, tools, software, and etc.. As for the storage, distribution and application of different format and discipline data, the key is to set up a series of rules and tools to realize the data services’ flexible using in security. It adopts hybrid data management framework to build up an unified index to support the spatial geological data finding. The matching platform is also developed to realize the geological achievements distribution. Moreover, it can significantly benefit faster and more efficient research. In all, the technique has been applied successful on Chinese geological survey information platform with great reuse adaptability on other platforms.

How to cite: cui, N. and gao, Z.: Research and application of key technologies of geological data platform, EGU General Assembly 2025, Vienna, Austria, 27 Apr–2 May 2025, EGU25-5383, https://doi.org/10.5194/egusphere-egu25-5383, 2025.

EGU25-5765 | ECS | Orals | ITS1.6/CL0.3

CMIP7 historical greenhouse gas forcing and steps towards sustained releases 

Zebedee Nicholls, Mika Pflüger, and Malte Meinshausen

Climate forcings are the input drivers to coupled climate models (AGOCMs) and earth system models (ESMs). They are routinely used as part of the coupled model intercomparison project (CMIP). Here we present the historical greenhouse gas forcing used in the seventh phase of CMIP (CMIP7) and compare it to its predecessors from CMIP6 and CMIP5. We show that revised methods and input data have had little effect on historical estimates of greenhouse gas forcing, but that greenhouse gas forcing has continued to increase since 2015 (the end of the CMIP6 historical experiment), even if forcing from some specific gases has decreased. Beyond the greenhouse gas forcings, there are a number of other forcings involved in CMIP. Following on from our involvement in the CMIP Forcings Task Team, we present an outline for moving towards sustained, roughly annual, releases of these forcings and discuss the challenges for realising this possibility.

How to cite: Nicholls, Z., Pflüger, M., and Meinshausen, M.: CMIP7 historical greenhouse gas forcing and steps towards sustained releases, EGU General Assembly 2025, Vienna, Austria, 27 Apr–2 May 2025, EGU25-5765, https://doi.org/10.5194/egusphere-egu25-5765, 2025.

With the major challenges posed by climate change and significant shifts in Earth systems, the need for high-precision and diverse climate predictions has grown. These predictions aim to explore a variety of scenarios, such as the Shared Socioeconomic Pathways (SSPs). Advances in computational power have enabled the development of sophisticated coupled physical-biogeochemical-ecological models of marine systems. However, these models remain computationally intensive and energy-demanding, raising questions about the appropriate level of complexity relative to the availability of independent data for accurate calibration, and calls for simplification to reduce execution time. Here, we aim to simplify the Eco3M-MED model, which is a complex biogeochemical model representing the low trophic levels (up to mesozooplankton) in the ocean through 37 state variables, and which is intended to be run at the scale of the Mediterranean basin.

Common simplification methods include conservation analysis, lumping, time exploration, and sensitivity analysis. Since most of these simplification methods reduce or even penalize the ability to interpret model results, or require complex implementation, we have chosen a simple, classic method, based on the local sensitivity analysis (One-Factor-At-A-Time, OFAT) method that does not impair this ability. This work's originality lies in the approach adopted to obtain different declinations of the reduced model. This approach indeed benefits from an original strategy for parametrizing the Eco3M-MED model, initiated several years ago and recently implemented in practice. This strategy consists of the construction of a set of consistent parameters, resulting in the establishment of relations between the so-called core parameters and dependent parameters. Core parameters are perturbed based on the level of knowledge of each parameter. The main objective of this study is to apply this novel approach to identify the biogeochemical processes that can be removed with minimal impact on model performance, thereby enabling model simplification and reducing computational costs. We also apply the principle that a single simplified model is not necessarily the best solution, and aim instead to derive a family of simplified models associated with different usage objectives, ensuring that the simplified model reproduces certain quantities well in particular.  The criteria used to derive a simplified model from the sensitivity analysis are also subject to analysis to identify their influence on the degree of simplification. Finally, the computational efficiency and accuracy of simplified models were compared with the full model to determine optimal simplification for specific applications. Future research will focus on performing global sensitivity analysis on high-impact core parameters to assess uncertainties in both the full and simplified models.

How to cite: Zhang, Y., Baklouti, M., and Brasseur, P.: Sensitivity-driven simplification of complex ecosystem models: Integrating mechanistic insights for cost reduction and predictive accuracy, EGU General Assembly 2025, Vienna, Austria, 27 Apr–2 May 2025, EGU25-6300, https://doi.org/10.5194/egusphere-egu25-6300, 2025.

Earth system reconstructions are key to understanding past climate dynamics, environmental variability, and biogeochemical cycles, revealing how Earth responds to natural and human influences. These reconstructions require integrating geological, geophysical, and geochemical data with advanced computational models.

Recent advancements in Large Language Models (LLMs) enhance the processing of complex datasets, improving the accuracy and predictive power of Earth system reconstructions. To leverage this, we develope GeoGPT, a domain-specific LLM for geosciences, trained on open-source data. This open-source, non-profit project encourages broad collaboration among experts in broad branches of the geoscience and AI. GeoGPT helps advance Earth system reconstructions, offering deeper insights into Earth's past and future, and guiding responses to environmental challenges.

By harnessing the combined strengths of Geoscientists, AI experts, and the broader research community, GeoGPT aspires to unlock new avenues of exploration, accelerate breakthrough discoveries.

How to cite: Chen, H.: GeoGPT and Its Potential Applications for Earth system Reconstructions, EGU General Assembly 2025, Vienna, Austria, 27 Apr–2 May 2025, EGU25-7628, https://doi.org/10.5194/egusphere-egu25-7628, 2025.

EGU25-9233 | Orals | ITS1.6/CL0.3

Reconstructing the Topographic Evolution of Active Margins Since the Devonian Using Artificial Intelligence 

Satyam Pratap Singh, Maria Seton, Sabin Zahirovic, and Nicky M. Wright

Active margin topography has profoundly shaped Earth’s climate, biodiversity, and natural resource distribution over geological time. However, reconstructing paleotopography in these regions remains challenging due to the sparse and uneven distribution of proxies like stable isotope paleoaltimetry, palynology, paleobotany, and thermochronology. These traditional methods often leave large spatial and temporal gaps, with uncertainties in paleoelevation estimates reaching up to 2,000–3,000 m. To address these challenges, we introduce an innovative workflow utilizing artificial intelligence to reconstruct paleotopography at active margins since the Devonian. Using Explainable Boosting Machines (EBMs), we identify key factors such as plate kinematics, mantle dynamics, and climate that govern active margin topography. Insights from the EBM analysis guided the development of a Random Forest (RF)-based regressor which was then used to predict paleotopography through time. Our RF model achieved a mean error of 554 m when validated against present-day ETOPO elevation data. Our model highlights time-evolving subduction flux, trench migration rates, and upper mantle temperature as the primary controls on active margin topography. To validate our approach, we compare our reconstructions with existing paleotopographic models and geological proxies in two regions: the Cenozoic Andes and Mesozoic-Cenozoic Eastern China. For the Andes, our model closely matches the existing reconstructions, highlighting a ~4,000 km rapid rise of the Altiplano since the late Oligocene, driven by an increase in subduction flux (from 0.03 km³/yr to 0.10 km³/yr) and a transition in trench migration from retreating (2 cm/yr) to stationary, likely due to slab anchoring. In Eastern China, our model predicts sustained high topography (>2,500 m) during much of the Cretaceous, attributed to high subduction flux (>0.12 km³/yr) from the Pacific Plate and an advancing trench. A subsequent shift to trench retreat (-2 cm/yr) in the Late Cretaceous–Early Cenozoic led to back-arc extension and a decline in elevation to ~1000 m. Our study offers a transformative approach to bridging gaps in paleotopographic constraints, improving our understanding of the interplay between surface and interior processes. By providing a robust framework for reconstructing past landscapes, our model has significant implications for studying ecosystems, biodiversity evolution, and the metallogenesis of convergent margins.

How to cite: Singh, S. P., Seton, M., Zahirovic, S., and Wright, N. M.: Reconstructing the Topographic Evolution of Active Margins Since the Devonian Using Artificial Intelligence, EGU General Assembly 2025, Vienna, Austria, 27 Apr–2 May 2025, EGU25-9233, https://doi.org/10.5194/egusphere-egu25-9233, 2025.

EGU25-10752 | Posters on site | ITS1.6/CL0.3

Preparing AWI-CM3 for CMIP7: Implementing anthropogenic aerosol forcing (MACv2-SP) 

Nadine Wieters, Jan Streffing, Helge Goessling, and Thomas Jung

Earth system modelling is an important instrument to investigate climate change in an integrated way, taking into account the interactions between the different compartments of the Earth system. It is also an important tool to perform climate projections for different climate scenarios in order to take appropriate mitigation and adaptation measures. Such climate simulations are coordinated internationally as part of the World Climate Research Programme’s (WCRP) Coupled Model Intercomparison Project Phase 7 (CMIP7).

Climate forcings are key for defining the main drivers of climate change in climate simulations. A very important aspect of the CMIP7 intercomparison is that all participating models were run under similar experimental conditions. In particular, in using the same climate forcings in the different models.

The Alfred Wegener Institute (AWI) will participate in the CMIP7 project with two state-of-the-art Earth system models AWI-CM3 and AWI-ESM3. This is being done as part of the German contribution to the Coupled Model Intercomparison Project (CAP7). The AWI contribution to CAP7 includes the adaptation of the AWI-CM3 model to be able to use different forcing data (such as greenhouse gases, solar forcing, O3, and aerosol forcing) to fulfil the requirements of CMIP7. One task is therefore the implementation of the climate forcing dataset for anthropogenic aerosols MACv2-SP (currently available for CMIP6plus [Fiedler and Sudarchikova, 2024]) provided for CMIP7. For this purpose, an aerosol interface will be implemented in the AWI-CM3 climate model to read and process the aerosol forcing data provided by the MACv2-SP dataset.

In this presentation we will discuss the implementation of the MACv2-SP data into the AWI-CM3 climate model and present first results of the responses to these forcings.

How to cite: Wieters, N., Streffing, J., Goessling, H., and Jung, T.: Preparing AWI-CM3 for CMIP7: Implementing anthropogenic aerosol forcing (MACv2-SP), EGU General Assembly 2025, Vienna, Austria, 27 Apr–2 May 2025, EGU25-10752, https://doi.org/10.5194/egusphere-egu25-10752, 2025.

EGU25-11291 | ECS | Orals | ITS1.6/CL0.3

Climate Models Underestimate Satellite Era Land-ocean Warming Contrast in the Tropics 

Masaki Toda, Sarah Kang, and Tiffany Shaw

General circulation models (GCM) can reasonably reproduce the global mean temperature trend during the historical period. In this study, we examine the performance of CMIP6 models in reproducing the changes in land-ocean temperature contrast between 1979-2014 during the comprehensive satellite observation era. The observed land-ocean warming contrast, defined as the land warming trend divided by the ocean warming trend, is completely outside the model spread of the historical scenario, indicating that the models severely underestimate land temperature increase relative to global mean temperature warming. Even when sea surface temperatures are prescribed to observations in AMIP experiments, the land warming trend remains outside the model spread, particularly between 15S and 15N. This was shown to be because GCM overestimates the increase in specific humidity on tropical land and underestimates the drying trend on tropical land. Since future projections over land have a significant impact on human activity, improving the representation of tropical land surface processes in GCMs is essential.

How to cite: Toda, M., Kang, S., and Shaw, T.: Climate Models Underestimate Satellite Era Land-ocean Warming Contrast in the Tropics, EGU General Assembly 2025, Vienna, Austria, 27 Apr–2 May 2025, EGU25-11291, https://doi.org/10.5194/egusphere-egu25-11291, 2025.

EGU25-12178 | ECS | Orals | ITS1.6/CL0.3

 Economic consequences of CMIP diversity and targets for CMIP7 

Jonathan Rosser and David Stainforth

The CMIP ensembles represent a partial exploration of our uncertainty in the future physical climate under various scenarios for future greenhouse gas emissions. They are thus valuable tools for exploring the potential consequences of climate change for society. One aspect of this is the impact on global and national economies. In the economics literature this is often addressed through a “damage function” which relates economic damages to national, regional or global changes in temperature.

Here we will present an assessment of the economic damages implied by the CMIP6 ensemble for various nations/regions, different Shared Socio-Economic pathways, and, crucially, a variety of different damage functions. A number of important factors will be highlighted including:

  • The uncertainty in economic damages which arises from the chaotic nature of the climate system, characterised by those CMIP6 models with relatively large initial condition ensembles.
  • The relative consequences for economic assessments of uncertainty in the damage function, the choice of CMIP6 model (model uncertainty), chaotic uncertainty (initial condition uncertainty), and scenario uncertainty.
  • How these factors vary by country and region.


CMIP6 only represents a limited exploration of uncertainty in the physical climate response and there is also considerable uncertainty in the damage functions beyond that currently explored in the literature. These represent deep uncertainty. We will present plans for future work to embed more thorough explorations of epistemic uncertainty into future analyses, including the consequences of crossing tipping points. These considerations are valuable when considering the design and implementation of the CMIP7 project. What would be the most useful design characteristics if the target were economic assessments? We will address this question in terms of both the size of initial condition sub-ensembles, the diversity of models included, and the value of a mixture of higher and lower resolution model implementations.

How to cite: Rosser, J. and Stainforth, D.:  Economic consequences of CMIP diversity and targets for CMIP7, EGU General Assembly 2025, Vienna, Austria, 27 Apr–2 May 2025, EGU25-12178, https://doi.org/10.5194/egusphere-egu25-12178, 2025.

EGU25-12926 | ECS | Posters on site | ITS1.6/CL0.3

1950-control vs 1850-control: How do HighResMIP simulations relate to CMIP simulations? 

Michael Lai and Malcolm Roberts

A common set of simulation is important for intercomparison between different models. The ‘entry-card’ to participate in CMIP is to perform the baseline DECK simulations (1850-control, 1pctCO2, abrupt-4xCO2, historical-amip). However, performing the control and historical simulations from an 1850 baseline is prohibitively expensive for high-resolution, fully-coupled, general-circulation-models (GCMs). Therefore, HighResMIP chose to use a shorter experimental protocol based on 1950 conditions alongside a shorter spin-up length and simplified aerosols. Because of this difference in protocol, it is not clear exactly how the HighResMIP simulations relate to the other CMIP simulations. In this study we analyse the control and historical simulations of the HadGEM3-GC3.1 model, which performed control and historical simulations based on both 1950 and 1850 baselines. Our results show that the absolute temperature is sensitive to the different experimental protocol, but the anomalies are much more comparable. This opens an interesting discussion on whether climate change should be discussed in terms of absolute values or anomalies. The difference in the absolute value (and mean state) is largely due to the different aerosol scheme used in CMIP and HighResMIP for this particular model. The second phase of HighResMIP no longer require models to use Easy Aerosol, so modelling centres should use the same aerosol scheme if they would like their HighResMIP simulations to be comparable to CMIP simulations.

How to cite: Lai, M. and Roberts, M.: 1950-control vs 1850-control: How do HighResMIP simulations relate to CMIP simulations?, EGU General Assembly 2025, Vienna, Austria, 27 Apr–2 May 2025, EGU25-12926, https://doi.org/10.5194/egusphere-egu25-12926, 2025.

EGU25-14119 | ECS | Orals | ITS1.6/CL0.3

Constraints on regional projections of mean and extreme precipitation under warming 

Panxi Dai, Ji Nie, Yan Yu, and Renguang Wu

The projected changes in the hydrological cycle under global warming remain highly uncertain across current climate models. Here, we demonstrate that the observational past warming trend can be utilized to effectively constrain future projections in mean and extreme precipitation on both global and regional scales. The physical basis for such constraints relies on the relatively constant climate sensitivity in individual models and the reasonable consistency of regional hydrological sensitivity among the models, which is dominated and regulated by the increases in atmospheric moisture. For the high-emission scenario, on the global average, the projected changes in mean precipitation are lowered from 6.9% to 5.2% and those in extreme precipitation from 24.5% to 18.1%, with the inter-model variances reduced by 31.0% and 22.7%, respectively. Moreover, the constraint can be applied to regions in middle-to-high latitudes, particularly over land. These constraints result in spatially resolved corrections that deviate substantially and inhomogeneously from the global mean corrections. This study provides regionally constrained hydrological responses over the globe, with direct implications for climate adaptation in specific areas.

How to cite: Dai, P., Nie, J., Yu, Y., and Wu, R.: Constraints on regional projections of mean and extreme precipitation under warming, EGU General Assembly 2025, Vienna, Austria, 27 Apr–2 May 2025, EGU25-14119, https://doi.org/10.5194/egusphere-egu25-14119, 2025.

EGU25-14140 | Posters on site | ITS1.6/CL0.3

CMIP6 Models Properly Simulate the Emergence of Global Ocean Warming Pattern 

Huang-Hsiung Hsu and Yu-Lun Chen

The global sea surface warming pattern emerged since the early 1980s is characterized by a boomerang-shape warming in the western Pacific, the basin-wide warming in the Indian Ocean north of 30°S, and a triple-stripe warming in the North Atlantic. This pattern can be obtained with or without El Niño/La Niña signals, indicating the independence of El Niño/La Niña, and is the leading EOF with the El Niño/La Niña signals removed. A negative phase of this pattern started emerging in the early 1980s, switched to positive phase in the 1990s, and has been becoming more prominent for the past few years.

CMIP models have been found to have difficulty simulating observed global sea surface temperature (SST) trend, especially the cooling trend in the tropical eastern Pacific. However, the cooling trend in the tropical eastern Pacific in the past four decades is statistically insignificant in our trend analysis adopting a more stringent signal detection method (namely, the False Discovery Rate, FDR). By applying the same trend detection and EOF approach to the simulated SST in the historical simulations of forty CMIP6 models by removing El Niño/La Niña signals, we detected in the ensemble mean SST a trend pattern closely resembling the observed, which also changes from negative to positive phases in the late 1990s and continues becoming more positive into 2014. Whereas each model has slightly different performance in simulating this trend pattern, the ensemble time series of corresponding trend pattern in each model correctly reflects the emergence and enhancement of the warming pattern in the past four decades. However, this model ability seems to be masked by the large fluctuations of El Niño/La Niña, an intrinsic climate mode contributing large internal variability to the global domain, and its temporal fluctuations cannot be synchronized in the coupled models in the historical experiments, which are strongly driven by continuously increasing radiative effect of greenhouse gases concentration. On the other hand, The models seem to be capable of simulating the emergence of the global ocean warming pattern in response to the prescribed increasing greenhouse gas concentration.

How to cite: Hsu, H.-H. and Chen, Y.-L.: CMIP6 Models Properly Simulate the Emergence of Global Ocean Warming Pattern, EGU General Assembly 2025, Vienna, Austria, 27 Apr–2 May 2025, EGU25-14140, https://doi.org/10.5194/egusphere-egu25-14140, 2025.

GeoGPT is a non-profit domain-specific Large Language Model for geosciences, trained based on open-source data. It provides an effective solution to the challenges of managing large data volumes, complex formats, and low efficiency in the utilization of books and papers in the field of paleontology. Its powerful data extraction capabilities will significantly enhance the efficiency of extracting, analyzing, and building databases for data of various formats, sizes, and origins. This enables scientists to construct online fossil datasets and empowers paleontologists to develop innovative tools such as paleontological classification assistants. Not only does this accelerate scientific research progress, but it also makes the acquisition and application of paleontological data, such as invertebrate fossils, more convenient, ultimately driving comprehensive progress in the field of paleontology.

How to cite: Xiang, Z.: GeoGPT: Transforming Paleontology with AI-Powered Data Extraction and Analysis, EGU General Assembly 2025, Vienna, Austria, 27 Apr–2 May 2025, EGU25-14239, https://doi.org/10.5194/egusphere-egu25-14239, 2025.

One of the major challenges faced by the geotectonic community is how to determine the paleolongitude of continents and tectonic plates as we try to reconstruct Earth’s tectonic history back in time, because classic paleomagnetic record is only sensitive to paleolatitude.  Torsvik et al. (2014) previously used mantle structure as a reference frame for palaeolongitude constraints back in Earth history, assuming that the two equatorial and antipodal large low shear velocity provinces (LLSVPs) observed in present-day Earth’s lower mantle are fixed and stable ancient structures unrelated to plate tectonic history and subduction geometry. However, such an assumption is inconsistent with true polar wander (TPW) record (Li et al., 2004, 2023), the cyclic occurrence of global mantle plume activity coupled with the supercontinent cycle (Li et al., 2008; and Zhong, 2009), and geodynamic modelling results (Zhong et al., 2007; Zhang et al., 2010; Flament et al., 2017).

In a recent paper of Li et al. (2023), we utilized palaeomagnetically interpreted TPW record, particularly inertia interchange true polar wander (IITPW) events, and global mantle plume record, to develop a dynamic global mantle reference frame that not only provides a first-order mantle dynamic evolution for the past 2 billion years, but also for the first time provides a way to trace the longitudinal change of continents and tectonic plates back in time. In particular, through the recognition of newly-defined type-1 and type-2 IITPW events coupled with plume record checking, we are now able to hypothesis that: (1) in periods with type-1 IITPW, the concerned supercontinent had developed its own degree-2 mantle structure (e.g., the antipodal LLSVPs divided by concurrent circum-supercontinent subduction girdle); (2) in periods with type-2 IITPW, a young supercontinent or multiple plates during the assembly of that supercontinent were moving over a legacy degree-2 mantle structure of the immediate ancestor supercontinent prior to the maturity of its own mantle structure. In our model, Nuna (lifespan 1600–1300 Ma) assembled at about the same longitude as the latest supercontinent Pangaea (lifespan 320–170 Ma), with an equatorial degree-2 mantle structure starting to exist as early as ca. 1700 Ma. Rodinia (lifespan 900–720 Ma) formed through introversion assembly over the legacy Nuna subduction girdle either ca. 90 to the west or to the east before the subduction girdle surrounding it generated its own degree-2 mantle structure by ca. 780 Ma (but not before 800 Ma). Pangea assembled over the subduction girdle of legacy Rodinian degree-2 mantle structure, with its own degree-2 mantle structure (the one we still observe today) formed no much earlier than 270 Ma.

References

Flament, N., Williams, S., Müller, R.D. et al., 2017. Nat. Commun. 8, 14164.

Li, Z.-X., Liu, Y. and Ernst, R., 2023. Earth-Sci. Rev. 238, 104336.

Torsvik, T.H., van der Voo, R., Doubrovine, P.V. et al., 2014. Proc. Natl. Acad. Sci. 111 (24), 8735–8740.

Zhang, N., Zhong, S., Leng, W., Li, Z.-X., 2010. J. Geophys. Res. Solid Earth 115(B6), B06401.

How to cite: Li, Z.-X.: Absolute longitudinal constraints for palaeogeographic reconstruction based on a dynamic mantle reference frame, EGU General Assembly 2025, Vienna, Austria, 27 Apr–2 May 2025, EGU25-15897, https://doi.org/10.5194/egusphere-egu25-15897, 2025.

EGU25-15908 | Posters on site | ITS1.6/CL0.3

Solar forcing for CMIP7 

Bernd Funke, Thierry Dudok de Wit, Margit Haberreiter, Daniel Marsh, Ilaria Ermolli, Doug Kinnison, Hilde Nesse, Annika Seppälä, Miriam Sinnhuber, Ilya Usoskin, Timo Asikainen, Stefan Bender, Theodosios Chatzistergos, Odele Coddington, Sergey Koldoboskiy, Judith Lean, Max van de Kamp, and Pekka Verronen

Back in 2017, solar forcing recommendations for the 6th round of the Coupled Model Intercomparison Project (CMIP) were provided which covered, for the first time, all relevant solar irradiance and energetic particle contributions. Since then, this dataset has been extensively used in climate model experiments and has been tested in various intercomparison studies. Further, new datasets have been come available. An International Space Sciene Institute (ISSI) Working Group has been established to review these recent achievements in order to define the strategy for building a revised solar forcing dataset for the 7th round of CMIP. After receiving community feedback on this strategy, a historical solar forcing dataset for CMIP7 has been recently constructed. Major changes with respect to CMIP6 include the adoption of the new Total and Spectral Solar Irradiance Sensor (TSIS-1) solar reference spectrum for solar spectral irradiance and an improved description of top-of-the-atmosphere energetic electron fluxes, as well as their reconstruction back to 1850 by means of geomagnetic proxy data. Solar irradiance varaibility in the reference forcing dataset is based on historical reconstructions generated with the new empirical NASA NOAA LASP (NNL) Solar Spectral Irradiance Version 1 model, NNLSSI1. In adition, an alternative solar irradiance dataset, based on SATIRE, is provided for sensitivity experiments. In this talk we will discuss the applied modifications with respect to CMIP6 and their implication for climate modeling. Ongoing activities on solar forcing uncertainty quantification and the construction of future solar forcing scenarios will also be summarized.

How to cite: Funke, B., Dudok de Wit, T., Haberreiter, M., Marsh, D., Ermolli, I., Kinnison, D., Nesse, H., Seppälä, A., Sinnhuber, M., Usoskin, I., Asikainen, T., Bender, S., Chatzistergos, T., Coddington, O., Koldoboskiy, S., Lean, J., van de Kamp, M., and Verronen, P.: Solar forcing for CMIP7, EGU General Assembly 2025, Vienna, Austria, 27 Apr–2 May 2025, EGU25-15908, https://doi.org/10.5194/egusphere-egu25-15908, 2025.

EGU25-16299 | ECS | Orals | ITS1.6/CL0.3

Reconstructing paleogeography using site-level apparent polar wander paths 

Bram Vaes and Douwe van Hinsbergen

Paleomagnetism provides the main quantitative tool for reconstructing Earth’s paleogeography. Apparent polar wander paths (APWPs), derived from paleomagnetic data, trace the motion of tectonic plates relative to the Earth’s rotation axis through geological time, providing a paleogeographic framework for studying the evolution of Earth’s interior, surface, and atmosphere. Traditionally, APWPs are calculated from study-mean paleomagnetic poles that are assigned equal weight, regardless of the number of paleomagnetic sites used to compute it and the uncertainties in the position or age of the pole. Here, we introduce the next generation of APWPs that are calculated from site-level paleomagnetic data instead of from study-mean poles. This alternative approach assigns larger weight to larger data sets and allows the incorporation of spatial and temporal uncertainties. We demonstrate the advantages of this new method with recently published APWPs based on compiled (Gallo et al., 2023) and simulated site-level data (Vaes et al., 2023). We show how the latter, a global APWP for the last 320 Ma, provides more reliable estimates of the apparent polar wander rate of all major tectonic plates, and discuss its implications for the rate and magnitude of true polar wander since 320 Ma. In addition, we introduce APWP-online.org: an online, open-source environment that provides user-friendly tools to compute site-level APWPs and to use them to quantify relative paleomagnetic displacements. We showcase how these tools are currently used to compute site-level APWPs, e.g., for the North China block and Tibetan terranes. Finally, we provide future directions for the construction of APWPs and highlight opportunities for improving their quality and resolution.

How to cite: Vaes, B. and van Hinsbergen, D.: Reconstructing paleogeography using site-level apparent polar wander paths, EGU General Assembly 2025, Vienna, Austria, 27 Apr–2 May 2025, EGU25-16299, https://doi.org/10.5194/egusphere-egu25-16299, 2025.

EGU25-17597 | Posters on site | ITS1.6/CL0.3

Solar forcing for CMIP7: making of future scenarios 

Thierry Dudok de Wit, Bernd Funke, Margit Haberreiter, Dan Marsh, Ilaria Ermolli, Doug Kinnison, Hilde Nesse, Annika Seppälä, Miriam Sinnhuber, Ilya Usoskin, Timo Asikainen, Stefan Bender, Theodosios Chatzistergos, Odele Coddington, Sergey Koldoboskiy, Judith Lean, Max van de Kamp, and Pekka Verronen

The provision of solar forcing datasets for CMIP7 includes a dataset with scenarios from the present to 2300. This dataset contains daily values of the same variables as in the historical solar forcing for CMIP7, namely: solar spectral irradiance, medium energy electrons, solar energetic protons and galactic cosmic rays. In contrast to CMIP6, which had only two scenarios, for CMIP7 we will provide a large ensemble of scenarios to avoid selection bias.

Let us stress that we are providing scenarios, not forecasts: the reconstructions vary randomly in time, but their statistical and spectral properties are fully consistent with historical variations, providing realistic surrogates for solar forcing.

In this presentation we explain how historical observations are used to build these surrogate reconstructions. This process involves several steps, starting with the 14C reconstructions of past solar activity. These will be described in detail, together with the first version of the dataset. 

How to cite: Dudok de Wit, T., Funke, B., Haberreiter, M., Marsh, D., Ermolli, I., Kinnison, D., Nesse, H., Seppälä, A., Sinnhuber, M., Usoskin, I., Asikainen, T., Bender, S., Chatzistergos, T., Coddington, O., Koldoboskiy, S., Lean, J., van de Kamp, M., and Verronen, P.: Solar forcing for CMIP7: making of future scenarios, EGU General Assembly 2025, Vienna, Austria, 27 Apr–2 May 2025, EGU25-17597, https://doi.org/10.5194/egusphere-egu25-17597, 2025.

EGU25-18187 | ECS | Posters on site | ITS1.6/CL0.3

Linking small- and large-scale Digital Twins: A concept  

Aiden Durrant, William D. Harcourt, Bernhard Höfle, Hannah Weiser, and Ronald Tabernig

A Digital Twin (DT) is a data-driven model of a physical entity with two-information flows that enables the direct interaction between both. DTs of the natural environment are typically constructed by fusing multi-modal measurements of some physical phenomena using Artificial Intelligence (AI) methods. The physical entity interacts with the DT through natural changes whilst the DT interacts with the physical entity through automated changes in sensing systems and through decision-making processes. Large-scale DTs of the Earth system are currently in development through initiatives such as Destination Earth (DestinE) whilst small-scale DTs for local monitoring are in development for numerous applications such as hazard warning, agriculture and eco-hydrology. Currently these systems are being developed independently yet combining them offers opportunities for calibrating large-scale DTs and improving the resolution of large-scale DTs by replicating the dynamics of smaller systems using AI methods. In this contribution, we develop a new concept through which to link small- and large-scale DTs in order to automate an agile sensing system that can respond to natural environmental variability and directly measure changes of interest. Large-scale DTs are built primarily through Earth Observation (EO) data and describe regional to global scale changes in the Earth system whilst small-scale DTs simulate local variability using in situ sensors such as Terrestrial Laser Scanners (TLS). Linking the two means the large-scale DT can inform small-scale DTs by adapting their measurements (e.g. spatial and temporal resolution, focus area of interest, specific physical measurements) in response to regional changes in, for example, weather patterns. We focus on the following components: 1) using the small-scale DT to downscale the large-scale DT and ‘zoom’ into areas of interest; 2) using both the small- and large-scale DT to automatically detect changes in the environment and acquire new measurements without human intervention; and 3) using the small-scale DTs to calibrate large-scale DTs. With the increasing development of digital twin technology in the environmental sciences, our new concept will enable better integration of DTs and improve monitoring performance, which can improve decision-making. 

How to cite: Durrant, A., Harcourt, W. D., Höfle, B., Weiser, H., and Tabernig, R.: Linking small- and large-scale Digital Twins: A concept , EGU General Assembly 2025, Vienna, Austria, 27 Apr–2 May 2025, EGU25-18187, https://doi.org/10.5194/egusphere-egu25-18187, 2025.

EGU25-18925 | Posters on site | ITS1.6/CL0.3

Earth system responses to external forcings : opportunities from paleoclimate studies and the Paleoclimate Modelling Intercomparison Project (PMIP) for CMIP 

Masa Kageyama, Chris Brierley, and Jean-Yves Peterschmitt and the the PMIP community

Paleoclimate information has played a key role in demonstrating how the Earth System responds to a variety of external forcings and how the earth’s climate is tightly related to atmospheric greenhouse gas concentrations. Although no strict analogue of possible future climate states exists, testing our understanding of the earth system, as embedded in earth system models, for conditions widely different from the historical period, is made possible by the existence of paleoclimate and paleoenvironmental reconstructions. Since its start in 1995, PMIP, the Paleoclimate Modelling Intercomparison Project (https://pmip.lsce.ipsl.fr/), has fostered and coordinated model-model and model-data comparisons for key periods: the mid-Holocene, ~6000 years ago, the Last Glacial Maximum (LGM), 21,000 years ago, the last two millennia, the last interglacial, the mid-Pliocene warm period (MPWP) were the key periods for PMIP4-CMIP6, with specific targets for each period. For instance, the enhanced monsoons and response of the northern high latitudes for the mid Holocene, the fate of Arctic sea ice and climate of the last interglacial, large spatial gradients and equilibrium climate sensitivity for the LGM and MPWP. In addition, each of these periods stood as reference for further PMIP experiments aimed to better understand the response of the climate system to external forcings.

For the next CMIP phase, PMIP continues to contribute studies on the responses to external forcings. This poster will present the targets for the FastTrack last interglacial experiment (abrupt-127k) as well as future opportunities related to other periods (e. g. Kageyama et al., 2024). We look forward to discuss with the CMIP and PMIP communities to plan further cross-cutting work and analyses.

Acknowledgements and cited reference.

We are acknowledging the help of the PMIP community in building PMIP over the years.

Kageyama M, et al., (2024) Lessons from paleoclimates for recent and future climate change: opportunities and insights. Front. Clim. 6:1511997. doi: 10.3389/fclim.2024.1511997

How to cite: Kageyama, M., Brierley, C., and Peterschmitt, J.-Y. and the the PMIP community: Earth system responses to external forcings : opportunities from paleoclimate studies and the Paleoclimate Modelling Intercomparison Project (PMIP) for CMIP, EGU General Assembly 2025, Vienna, Austria, 27 Apr–2 May 2025, EGU25-18925, https://doi.org/10.5194/egusphere-egu25-18925, 2025.

EGU25-20295 | Orals | ITS1.6/CL0.3

CMIP7 solar forcing validation 

Margit Haberreiter and the CMIP7 Solar Forcing Validation Team

We present the CMIP7 solar forcing dataset and its validation both for the effects of solar irradiance and particle forcing. In particular we present the results from first simulation runs that use the new CMIP7 as well as the previous CMIP6 dataset for the period 2002-2012, covering two solar maxima and a deep solar minimum. Specifically, we present simulation runs carried out with the chemistry-climate models WACCM, SOCOL, EMAC, ICON and KASIMA to determine the response to the solar SSI and particle forcing. The performance of the CMIP7 recommendations with respect to atmospheric radiative heating and composition will be evaluated both compared to the CMIP6 recommendations, and to satellite observations of atmospheric trace gases. The different responses and their implications will be discussed.

How to cite: Haberreiter, M. and the CMIP7 Solar Forcing Validation Team: CMIP7 solar forcing validation, EGU General Assembly 2025, Vienna, Austria, 27 Apr–2 May 2025, EGU25-20295, https://doi.org/10.5194/egusphere-egu25-20295, 2025.

EGU25-21621 | Posters on site | ITS1.6/CL0.3

Tibetan Plateau paleogeographic reconstructions during the India-Asia collision: from paleoelevation proxies to geodynamic models 

Guillaume Dupont-Nivet, Jean-Charles Fidalgo, Kévin Moreau, Lucas Rivera, Zhantao Feng, Xiaomin Fang, Jérôme Lavé, and Alexis Licht

The past topographic evolution of the Tibetan-Himalayan orogen holds the key to understanding interactions between Earth, Climate and Life processes since deep times. This has been hindered so far by the lack of accurate paleogeographic reconstructions of the orogen through time based on well-dated reliable proxies of past elevations. In the sedimentary archives of the basins formed in the orogen during the collision, recovered fossil content including pollen, fish and mammals yielded first order estimates on elevations based on environmental conditions of nearest living relatives while leaf physiognomies provided more direct constraints. Stable isotope composition from ancient meteoric waters preserved in pedogenic carbonates and biomarkers have been recovered and interpreted in terms of paleoelevations assuming past meteoric lapse rates. Outside of the basins in the high massifs, synkinematic hydrous silicates preserving ancient rainfalls have been used for paleoaltimetry purpose, notably in the Himalayas. Despite these significant efforts, the new paleoelevation datasets have led more to controversy than consensus. Fierce debates currently involve several international groups. Widely different topographic growth scenarios have been proposed with end-members ranging from a high Plateau prior to the onset of the India-Asia collision (“Proto-Tibetan Plateau”), to a much more recent - mostly Miocene - uplift and the preservation of broad low elevation valleys late until the Neogene.

As part of the starting TIBETOP project (funded by the french ANR) we propose here a state-of-the-art review of paleoelevation proxies across the Tibetan-Himalayan orogen, ranging from surface records in sedimentary basins to deeper crustal rocks now exhumed in the relief and mountain belts bordering these basins. We present a compilation and reappraisal of the existing regional paleoelevation data including revised provenance, stratigraphy dating, and stable isotope data in basin records as well as structural context, exhumation and fluid-rock deformation interactions at different interfaces of the continental crust. The TIBETOP project thus aims to produce a set of interactive paleogeographic reconstructions through time with associated datasets constraining the Himalayan-Tibetan orogen since the India-Asia collision. These will be improved through the project to include new data and updated paleogeographic reconstructions made available to modelers of climatic, biotic and surface processes to enable testing the above cited fundamental hypotheses on the role of mountain and plateau building on Earth System processes over geologic time.

How to cite: Dupont-Nivet, G., Fidalgo, J.-C., Moreau, K., Rivera, L., Feng, Z., Fang, X., Lavé, J., and Licht, A.: Tibetan Plateau paleogeographic reconstructions during the India-Asia collision: from paleoelevation proxies to geodynamic models, EGU General Assembly 2025, Vienna, Austria, 27 Apr–2 May 2025, EGU25-21621, https://doi.org/10.5194/egusphere-egu25-21621, 2025.

The integration of big data, cloud models, and extensive knowledge to drive new knowledge discovery through data is a new paradigm for research in the field of Earth sciences. Although the advancement of big data technologies and infrastructures has simplified data acquisition, deep-time geoscience still faces challenges such as fragmented data, difficulties in visualization, and insufficient computing power. To assist the broad community of geoscientists, we propose the "Deep Platform," a one-stop online research platform that utilizes cloud computing and advanced technologies. The platform provides open access to deep-time geoscientific data, knowledge, models, and computing power. It is designed to promote collaborative innovation and discovery among global geoscientists. The "Deep Platform" represents a significant advancement in geoscientific exploration, fostering global collaboration and advancing a data-driven research paradigm within the framework of open science.

How to cite: Hu, L.: DEEP Platform: Empowering Global Geoscientists  in Data-Driven Research Era, EGU General Assembly 2025, Vienna, Austria, 27 Apr–2 May 2025, EGU25-21952, https://doi.org/10.5194/egusphere-egu25-21952, 2025.

Climate action (SDG 13) and reducing inequalities (SDG 10) are central goals of sustainable development. However, the distribution of climate risks and carbon emissions across regions is uneven, and this disparity poses significant challenges in global climate change governance. To address this issue, this study defines the concept of climate risk and introduces the "Mismatch Responsibility Index" to quantify the imbalance between carbon emissions (carbon footprint) and climate risk burdens. The study further examines the socio-economic and technological factors that drive this imbalance. The key findings include: (1) Climate risks and carbon footprints exhibit significant spatial and temporal variability, with the gap between cities expanding over time; (2) In China, more than half of the prefecture-level cities experience a significant mismatch in climate responsibility, with underdeveloped regions facing disproportionately high climate risks; (3) The main factors contributing to this mismatch are energy consumption patterns, population size, and the level of technological innovation. Further policy analysis indicates that local government policies, the promotion of regional green energy transitions, and technological innovation are essential to narrowing the gap in responsibility distribution. (4) Using simulations of different policy scenarios, the study proposes several recommendations, including strengthening local government climate policies, supporting green energy transitions, promoting technological innovation, and reallocating international climate finance. These measures are expected to reduce regional disparities in climate responsibility and contribute to more equitable climate governance.

How to cite: Li, Y., Liu, X., Hasi, E., Ji, R., Zhang, S., and Hao, Y.: The Climate Risk and Regional Carbon Emission Responsibility in China from the Perspective of "Mismatch Responsibility": Temporal-Spatial Variability and Driving Factors Analysis, EGU General Assembly 2025, Vienna, Austria, 27 Apr–2 May 2025, EGU25-383, https://doi.org/10.5194/egusphere-egu25-383, 2025.

Floods, as one of the most devastating natural disasters, have far-reaching impacts on property, safety, and mental health. This study employs Structural Equation Modeling (SEM) to explore the pathways linking flood experiences to psychological distress, focusing on mediating factors such as property loss, recovery efforts, and socioeconomic conditions. Drawing on data from the 2021 floods in Germany, the analysis provides insights into how direct and indirect factors interact to shape mental health outcomes.

Flood experience is conceptualized as direct exposure to flood hazards, including water depth, flow velocity, and contamination. These factors collectively capture the intensity and severity of the flood event. Key findings reveal that flood experience significantly predicts property loss (Estimate = 0.254, p < 0.001) and direct impacts such as self-injury, family injury, and uncertainty about the safety or whereabouts of family members or close friends during flood, which, in turn, exacerbate psychological effects. These direct impacts, alongside property loss, drive psychological impacts, measured through post-traumatic stress disorder (PTSD) screening and ongoing mental health effects, including persistent thoughts about the event and whether it continues to affect individuals' daily lives (Estimate = 2.227, p = 0.006). Socioeconomic factors, such as income and property ownership, influence recovery efforts, which mitigate psychological distress (Estimate = 0.294, p < 0.001). While recovery efforts mitigate distress (Estimate = 0.294, p < 0.001), property loss remains a substantial stressor. The total indirect effect of flood experience on psychological burden (Estimate = 0.304, p = 0.002) underscores the cumulative impact of material loss, immediate threats, and recovery challenges.

The model achieves strong fit indices (χ²/df = 2.15, RMSEA = 0.048, CFI = 0.925), validating its conceptual framework. These findings emphasize the critical role of flood experience in shaping mental health outcomes and the need for holistic disaster response strategies that address immediate impacts and foster long-term psychological recovery. By emphasizing both direct and cascading effects, this study informs policies aimed at enhancing resilience and mental health support in flood-prone areas.

How to cite: Pham, T. T. T. and Sairam, N.: Understanding the Psychological Impacts of Flooding: A Structural Equation Modeling Approach from the 2021 German Floods, EGU General Assembly 2025, Vienna, Austria, 27 Apr–2 May 2025, EGU25-830, https://doi.org/10.5194/egusphere-egu25-830, 2025.

EGU25-1449 | ECS | Orals | ITS2.6/CL0.4

Health and Economic Costs of Future Extreme Heat Risk 

Shupeng Zhu, Yida Sun, Daoping Wang, and Dabo Guan

Evidence shows an ongoing increase in the frequency and severity of global heatwaves, raising concerns about the future impacts of climate change and the associated socio-economic costs. Here, we develop a disaster footprint analytical framework by integrating climate models, epidemiological and hybrid input-output, and computable general equilibrium global trade models to estimate the mid-century socioeconomic impacts of heat stress. We consider health costs related to heat exposure, the value of heat-induced labor productivity loss, and indirect losses due to economic disruptions cascading through supply chains. We find that the global heatwave days would increase by 104% in 2060 compared to 2022 under SSP585, and the global average annual number of heat-induced deaths would increase to around 1.12 million (0.85 ~ 1.39 million). For economic impacts, we show that the global annual incremental loss increases exponentially from 0.03±0.01 (SSP245) ~ 0.05±0.03 (SSP585) percentage points during 2030 – 2040 to 0.05±0.01 ~ 0.15±0.04 percentage points during 2050 – 2060. By 2060, the expected global economic losses reach a total of 0.6% ~ 4.6% with losses attributed to health loss (37%~45%), labor productivity loss (18%~37%), and indirect loss (12%~43%) under different SSPs. Small and medium-sized developing countries in Southeast Asia and Africa suffer the most from heat risks as well as regional supply chain disruptions.

How to cite: Zhu, S., Sun, Y., Wang, D., and Guan, D.: Health and Economic Costs of Future Extreme Heat Risk, EGU General Assembly 2025, Vienna, Austria, 27 Apr–2 May 2025, EGU25-1449, https://doi.org/10.5194/egusphere-egu25-1449, 2025.

EGU25-3401 | Orals | ITS2.6/CL0.4

Reconsidering the macroeconomic damages of severe warming 

Timothy Neal, Ben Newell, and Andy Pitman

Projections of macroeconomic damage from future climate change tend to suggest mild to moderate impacts. This leads to welfare-optimal climate policies in Integrated Assessment Models (IAMs) that recommend very slow emissions reductions over the coming decades, in sharp contrast with the ambitions of the Paris Agreement. These econometric models assume that weather impacting a single country is all that affects the economy of that country. We examine whether the addition of global weather conditions in the empirical modelling of economic growth affects the projections of the impact of climate change on global GDP. In effect, we explore whether the interconnectedness of the global economy makes individual countries vulnerable to weather changes that impact other countries. Using three influential econometric models we add global weather to the regressions. We find that this leads to significant worsening of the projections of macroeconomic damage for given future emissions scenarios. Damage to world GDP in 2100 under SSP5-8.5, averaged across both econometric models and climate models increases from ~11%  under models without global weather to ~40% if global weather is included. Further, we demonstrate that when the damage function used in IAMs is estimated from empirical models augmented with global weather conditions, they reduce the welfare-optimal amount of climate change from ~2.7C to ~1.7C which is consistent with the Paris Agreement targets. Our results highlight the need for econometric modelling and climate science’s understanding of extreme events to be integrated much more consistently to ensure the costs of climate change are not underestimated. 

How to cite: Neal, T., Newell, B., and Pitman, A.: Reconsidering the macroeconomic damages of severe warming, EGU General Assembly 2025, Vienna, Austria, 27 Apr–2 May 2025, EGU25-3401, https://doi.org/10.5194/egusphere-egu25-3401, 2025.

EGU25-4445 | ECS | Orals | ITS2.6/CL0.4

Impact-Based Hail Forecasts for Switzerland in the scClim Project 

Valentin Gebhart, Timo Schmid, and David N. Bresch

Hail is a main contributor to weather-related damages to buildings, cars, and agriculture in Switzerland, demanding actionable information on hail risks and forecasts across sectors. The research project scClim addresses this demand by establishing a seamless model chain from observing, modelling and forecasting hail events to the quantification of hail impacts, including simulations to compare hail occurrence in current and future climate.

Within the project, we study several types of impact-based hail forecasts and warnings for Switzerland, addressing the interests of different stakeholder groups. We employ ensemble weather forecasts by the Swiss Meteorological Office combined with (a) impact-informed vulnerability thresholds to produce local hail warnings, and (b) information about exposed assets and their calibrated vulnerability to produce aggregated hail impact forecasts. While the impact-based forecasts would have to be thoroughly validated before operational use, the forecast products highlight how varying demands of different stakeholder groups shape the forecast product and the provided information.

How to cite: Gebhart, V., Schmid, T., and Bresch, D. N.: Impact-Based Hail Forecasts for Switzerland in the scClim Project, EGU General Assembly 2025, Vienna, Austria, 27 Apr–2 May 2025, EGU25-4445, https://doi.org/10.5194/egusphere-egu25-4445, 2025.

The aging agricultural labor force presents significant challenges to farm productivity and sustainability, particularly when compounded by climate change. This issue is especially critical in countries like Thailand, where the agricultural workforce is aging rapidly. Notably, 2.84 million older adults are engaged in the agricultural sector, representing 59.2% of all older adults participating in the economy. A Swiss Re Institute (2021) study ranked Thailand as the fifth most vulnerable country to GDP impacts from climate change. Furthermore, projections indicate that climate change could inflict cumulative damages on Thailand's agricultural sector, totaling 0.61–2.85 trillion baht from 2011 to 2045, averaging 17.9–83.8 billion baht annually. Without adequate preparation, Thailand risks significant economic downturns driven by agricultural productivity and production losses.


Effective local governance is one of the most crucial determinants of coping with the crisis above. This study used a mixed-methods approach, combining quantitative and qualitative research. The quantitative research included a survey of 2,500 older farmers in 2024 from three provinces in Thailand: Chiang Rai in the northern region, Buriram in the Northeastern region, and Uthai Thani in the central part, where extreme drought exists. The qualitative approach involved focus groups with older farmers and in-depth interviews with policymakers and older farmers.


The findings revealed that flexible and adaptable local governance is among the most critical factors contributing to the resilience of older farmers. Drought management for older farmers in Thailand requires coordination among multiple agencies with distinct roles, emphasizing the need for integration to ensure effective communication. Agencies must collaborate to share information and coordinate efforts to disseminate accurate, comprehensive, and timely information. Examples include broadcasting weather forecasts from the Meteorological Department, coordinating cloud-seeding operations, and providing water and resource management guidance through the Irrigation Department. More importantly, its communication strategies must specifically target older farmers. Various communication channels should be utilized, particularly platforms that older farmers can readily access, such as community radio, village loudspeakers, and local media. Additionally, digital platforms and social media can be leveraged to inform younger family members, who can relay the information to older adults. To ensure accessibility, communication materials should be simple, straightforward, and audience-specific. This includes tailored communication, such as using local dialects or translating complex information into user-friendly formats, as older farmers may have difficulty understanding formal language or technical terms. This effectively supports their resilience in drought.  After implementing drought management measures, the government must assess the effectiveness of its communication strategies. This evaluation should determine whether the information was delivered efficiently to older farmers and identify gaps or barriers in the communication process. Based on these insights, necessary adjustments should be made to enhance future communication efforts, ensuring they are tailored to this demographic's needs, preferences, and limitations.

Keywords: Adaptive Governance, Older Farmers, Risk Reduction, Resiliency, Drought

How to cite: Swangsilp, S.: Local Governance for Enhancing Resilience to Climatic Challenges Among Older Farmers: A Case Study from an Extreme Drought-Prone Area in Thailand, EGU General Assembly 2025, Vienna, Austria, 27 Apr–2 May 2025, EGU25-5150, https://doi.org/10.5194/egusphere-egu25-5150, 2025.

EGU25-5881 | ECS | Orals | ITS2.6/CL0.4

Past and Projected Climate Extremes Impacts on Human Development  

Marta Mastropietro, Jonathan Spinoni, and Massimo Tavoni

Climate change is increasing the frequency and intensity of extreme events and hazards, posing serious risks to societies and ecosystems worldwide. These phenomena do not only threaten economic systems but also broader dimensions of human well-being, including inequality, health, and education. Despite a growing recognition of these risks, the global mechanisms linking climate extremes to human development remain poorly understood. Furthermore, besides GDP, explicit estimation of future climate change damages and extremes on socio-economic projections remain limited. 

In this study, we focus on the impacts of climate extremes on human development, analyzing their effects on three main components of the Human Development Index (HDI): life expectancy, expected years of schooling, and gross national income per capita. Using a dataset covering 1,773 sub-national regions over three decades from 1990 to 2020, we employ high-resolution climate data to examine immediate and lagged socio-economic responses to extreme events and hazards, particularly rainfall extremes, heatwaves, and droughts. By exploiting fixed effects panel modeling, our approach accounts for the simultaneous inclusion of multiple extremes in damage functions and evaluates the integration of an adaptation proxy to capture regional differences in vulnerability.

Finally, we apply the derived impact functions to Shared Socioeconomic Pathways (SSP) scenarios, providing projections of climate-driven damages on HDI across different development and climatic narratives, capturing the key climatic and social uncertainties. 


How to cite: Mastropietro, M., Spinoni, J., and Tavoni, M.: Past and Projected Climate Extremes Impacts on Human Development , EGU General Assembly 2025, Vienna, Austria, 27 Apr–2 May 2025, EGU25-5881, https://doi.org/10.5194/egusphere-egu25-5881, 2025.

The "Early Warning for All" initiative, launched at COP27, aims to ensure global coverage by early warning systems (EWS) for hazardous weather, water, or climate events by 2027. This study evaluates the effectiveness of EWS in Northeast China focusing on six meteorological disasters: heavy rain, cold waves, high winds, high temperatures, hail, and frost over the past five years.

We analyze the evolution in the timeliness and content of early warnings, correlating these with the integration of new technologies. Our findings reveal significant variations in EWS performance across different disaster types and geographical areas. For instance, while some systems provide warnings with substantial lead times for events like heavy rain and cold waves, others, particularly for hail and frost, show less temporal advance or accuracy.

This research highlights the disparity between scientific advancements in EWS and their practical application, underscoring the need for improved communication and decision-making processes within the warning system framework. We discuss the reasons for these imbalances, such as technological adoption rates, regional infrastructure variances, and policy implementation challenges.

Our study suggests that while technological capabilities have advanced, the translation into operational EWS effectiveness remains uneven. We propose several strategies to bridge the gap between scientific potential and operational reality, aiming to enhance the third pillar of EWS—effective communication and decision-making. These insights are crucial for refining EWS to better protect communities from natural hazards, contributing to the global aim of universal early warning coverage by 2027.

Keywords: Early Warning Systems, Meteorological Disasters, Northeast China, Timeliness, Accuracy, Communication Strategies, Decision-Making, Climate Resilience

How to cite: li, C.: Enhancing Timeliness of EWS with new technology: A case study in Northeast China , EGU General Assembly 2025, Vienna, Austria, 27 Apr–2 May 2025, EGU25-7739, https://doi.org/10.5194/egusphere-egu25-7739, 2025.

EGU25-8356 | ECS | Posters on site | ITS2.6/CL0.4

Assessing the impact of hail on wheat production in Europe under climate change 

Ruoyi Cui, Raphael Portmann, Iris Thurnherr, and Pierluigi Calanca

Hailstorms have shown rising severity and frequency in recent years, posing a growing threat to crops and presenting significant challenges for the agricultural and insurance sectors in the face of climate change. As part of an interdisciplinary project (scCLIM, Seamless coupling of kilometer-resolution weather predictions and climate simulations with hail impact assessments for multiple sectors), this study focuses on assessing the impact of future hail occurrence on wheat across Europe.

We utilize results from high-resolution climate simulations with a grid spacing of 2.2 km, which were conducted using the COSMO regional climate model for both current and future climate. The future climate simulation, targeting a 3°C global warming scenario, was performed using the pseudo-global warming approach. Hail activity was simulated using the hail growth model HAILCAST, which was embedded within COSMO. A model of wheat phenology was used to estimate the wheat harvest dates based on COSMO outputs, enabling an assessment of the present and future exposure of wheat to hail.  By integrating high-resolution climate simulations with a crop phenology model, this approach bridges the gap between agricultural production and climate risks associated with extreme events. 

In this contribution, we examine the temporal and spatial alignment between hail events and crop development, with a particular focus on assessing the sensitivity of future risk of hail damage to wheat with respect to the interplay between changes in hail occurrence and earlier harvest dates. The results reveal regional variations in hail impacts on wheat across Europe, offering valuable insights into crop management, climate change adaptation strategies, and risk assessment within the insurance sector.

How to cite: Cui, R., Portmann, R., Thurnherr, I., and Calanca, P.: Assessing the impact of hail on wheat production in Europe under climate change, EGU General Assembly 2025, Vienna, Austria, 27 Apr–2 May 2025, EGU25-8356, https://doi.org/10.5194/egusphere-egu25-8356, 2025.

EGU25-8464 | ECS | Posters on site | ITS2.6/CL0.4

Data requirements for assessing global socio-economic wildfire impacts and risks 

Carmen B. Steinmann, Jonathan Koh, Chahan M. Kropf, David N. Bresch, and Stijn Hantson

Wildfires are an emerging peril in traditional natural hazard risk assessment. Increasingly extreme fire behavior, unprecedented mega-fires and rising economic damages are commonly attributed to a combination of climatic shifts, expansion in areas where human development meets natural landscapes (wildland-urban interface), and an accumulation of fuel. 

Remote sensing products provide the most comprehensive data source for the global assessment of wildfires and their impacts. However, scientists and practitioners in Disaster Risk Reduction are faced with several fire products from different satellite missions, whose differences, advantages and limitations can be difficult to assess and understand, especially for users outside the remote sensing domain. At best, this issue complicates the process of identifying the most appropriate dataset, making it a challenging and time-consuming endeavor; at worst, it can result in inaccurate results. 

We address these issues by offering a concise overview of remote sensing fire products and clarifying terms that are interpreted differently across scientific communities, with a focus on their application in risk assessment. Our analysis centers on products representing burned area and active fire locations. While burned area products leverage several satellite overpasses and reflect the area affected by large fires best, active fire location products provide the fire radiative power, a measure of the fire intensity, which is an important metric linked to impacts. 

We present a historic wildfire hazard set, which combines burned area data and fire radiative power recorded by the Moderate Resolution Imaging Spectroradiometer (MODIS) satellite product for the years 2002–2023. We join this hazard set with exposure datasets (representing physical assets and population) and damage records to calibrate socio-economic vulnerabilities to wildfires. This forms the basis for estimating wildfire impacts and risks, necessary for prioritising adaptation options and the pricing of insurance.

How to cite: Steinmann, C. B., Koh, J., Kropf, C. M., Bresch, D. N., and Hantson, S.: Data requirements for assessing global socio-economic wildfire impacts and risks, EGU General Assembly 2025, Vienna, Austria, 27 Apr–2 May 2025, EGU25-8464, https://doi.org/10.5194/egusphere-egu25-8464, 2025.

EGU25-8483 | Orals | ITS2.6/CL0.4

 A return period-based early warning index for extreme precipitation  

Jessica Keune, Francesca Di Giuseppe, Fredrik Wetterhall, and Chris Barnard

Extreme precipitation events often lead to local or downstream flooding and can have devastating impacts from infrastructure damage to loss of life. As climate change progresses, these events have become increasingly frequent and intense, posing significant challenges to societies. While warning systems for fluvial flooding such as the Global Flood Awareness System (GloFAS) exist, localised downpours over impermeable urban areas remain difficult to predict. Even in countries with advanced early warning systems, precipitation intensity is often underestimated, leading to misrepresentations of potential impacts. Further, many localised flood events driven by very intense precipitation are not predicted at all.  

Here, we present a novel warning index that predicts the likelihood of extreme precipitation and targets localised urban and pluvial flooding, thereby addressing a gap in existing warning systems. The presented warning index is based on a novel set of return period forecasts for extreme precipitation, that enable a correction of model biases. The index then estimates a risk through the mapping of likelihood and potential impacts, incorporating a fuzzy neighborhood approach that accounts for displacement errors in the prediction of extreme events as a function of lead time. Through this risk approach, the warning index aims to capture extreme but less probable events to improve the warnings’ reliability. Here, we present results for the 30 activations from the Copernicus Emergency Management System Rapid Mapping (CEMS RM) in 2024. The index shows reliable and actionable warnings for localised flooding events, offering significant advancements in risk management and preparedness for extreme precipitation impacts. 

This work was developed in the context of the Horizon Europe CENTAUR project https://centaur-horizon.eu/

How to cite: Keune, J., Di Giuseppe, F., Wetterhall, F., and Barnard, C.:  A return period-based early warning index for extreme precipitation , EGU General Assembly 2025, Vienna, Austria, 27 Apr–2 May 2025, EGU25-8483, https://doi.org/10.5194/egusphere-egu25-8483, 2025.

EGU25-8731 | Posters on site | ITS2.6/CL0.4

A simple approach for developing storylines of flood impacts under various global warming levels 

Martina Kauzlaric, Lukas Munz, Markus Mosimann, Olivia Martius, and Andreas Paul Zischg

The past few years have seen increasingly frequent and intense floods, culminating in 2024 with a year characterized by widespread and devastating inundations worldwide. In Europe despite major advancements in flood forecasting and flood protection measures undertaken in the past, in2024 heavy rainfall events resulted in severe flood impacts and massive socio-economic losses, claiming over three hundred lives. Extreme precipitation, breaking observed records, is expected to have an increased likelihood under global warming all the more we should question and scrutinize our knowledge about the frequency and severity of floods. Reliable estimates of these are challenging even for the current climate conditions, and disaster gaps can lead us to an underestimation of the risks. The use of the UNSEEN method (Thompson et al. 2017) has been proved to be very valuable in estimating both, unprecedented but plausible extreme floods and droughts.

Here we present a simple method to expand the UNSEEN method to develop storylines under various global warning levels. We selected precipitation scenarios with different spatial patterns for estimated return periods between 100 and 1000 years from pooled re-forecasts from ECMWF (ENSext and SEAS5), providing 8400 years of plausible weather sequences. The selected climate scenarios are perturbed by increasing the precipitation intensity according to the Clausius-Clapeyron relation for five different global warming levels, and used to run coupled hydrologic-hydraulic simulations. The results show that record-breaking, high-impact river floods are possible under the current atmospheric conditions, and climate change substantially aggravates flood impacts, as the relative increase in peak discharge can be significantly larger than the increase in precipitation, leading to a disproportionally high flood impact increase. The development of storylines of extreme flood events with a high spatial and temporal resolution are a valuable tool to explore, describe, and communicate extreme events and their dynamics. Such instruments are key for developing an informed vision and comprehensive protective measures in terms of flood risk management and emergency response.


References

Thompson, V., Dunstone, N. J., Scaife, A.A., Smith, D. M., Slingo, J. M., Brown, S. and Belcher, S.E.: High risk of unprecedented UK rainfall in the current climate. Nat Commun 8, 107, https://doi.org/10.1038/s41467-017-00275-3, 2017.

How to cite: Kauzlaric, M., Munz, L., Mosimann, M., Martius, O., and Zischg, A. P.: A simple approach for developing storylines of flood impacts under various global warming levels, EGU General Assembly 2025, Vienna, Austria, 27 Apr–2 May 2025, EGU25-8731, https://doi.org/10.5194/egusphere-egu25-8731, 2025.

EGU25-8932 | ECS | Posters on site | ITS2.6/CL0.4

Impact of Climate Extremes on Power Systems 

Sanja Duvnjak Zarkovic and Gabriele Messori

Society has become more dependent on reliable electricity infrastructure to function normally. The ascending trend of blackouts in recent years suggests that today’s power system is becoming increasingly vulnerable to severe weather and puts an accent on an emerging issue that deals with power system resilience. Resilience, in this context, refers to the system's capacity to limit the extent, severity, and duration of service disruptions following extreme events.

To better understand and improve power system resilience, this study presents a comprehensive analysis of outage statistics in Sweden from 2007 to 2021, utilizing data from Energiföretagen Sverige. The findings reveal that approximately 26% of all outages are attributable to weather-related events, affecting nearly one-third of customers and contributing significantly to customer outage durations. These disruptions directly undermine the reliability and resilience of the power grid.

This research examines the correlation between specific weather phenomena—such as storms, heavy snowfall, and high winds—and the frequency and severity of power outages. The analysis identifies a strong connection between severe weather patterns and prolonged outages, particularly in rural and forested regions where overhead power lines are more vulnerable. By analyzing spatial and temporal patterns, this study identifies vulnerable areas within Sweden's power infrastructure and emphasizes the need for targeted resilience strategies. Proposed measures include enhanced vegetation management, infrastructure reinforcement, and the adoption of advanced grid technologies to mitigate the impacts of extreme weather events. These insights contribute to developing a more robust and reliable electricity system, better equipped to withstand future climate challenges.

How to cite: Duvnjak Zarkovic, S. and Messori, G.: Impact of Climate Extremes on Power Systems, EGU General Assembly 2025, Vienna, Austria, 27 Apr–2 May 2025, EGU25-8932, https://doi.org/10.5194/egusphere-egu25-8932, 2025.

EGU25-8933 | Posters on site | ITS2.6/CL0.4

Climate Risk Analysis for Marmara Region, Türkiye 

Ayşegül Ceren Moral, Cemre Yürük Sonuç, and Yurdanur Ünal

Assessing climate risk due to climate change for the present and future periods has been the focus of both academic and applied research in recent years, reflecting its critical importance. In this study, we evaluated climate risks for the Marmara Region in northwestern Türkiye by integrating high-resolution climate projections with socio-economic data, aiming to inform and support regional climate policies.

To achieve this, we generated climate projections at a 0.025° x 0.025° resolution using the convection-permitting COSMO-CLM model, driven by EC-Earth3-Veg from CMIP6. These projections cover both the reference period (1995–2014) and a future period (2050–2059) under the SSP3-7.0 scenario) for a broader western part of Türkiye. The Marmara Region was selected as a focal area due to its vital economic significance, its diverse and densely populated urban centers, and its extensive agricultural areas. This approach allows for a comprehensive assessment of climate impacts on a region with critical socio-economic importance, providing actionable guidance to inform policy development and adaptation strategies.

We conducted a comprehensive climate risk assessment by integrating hazard data with components of sensitivity, vulnerability, and adaptive capacity components, which were derived from reliable socio-economic datasets provided by institutions such as the Turkish Statistical Institute and the Turkish State Meteorological Service. For the weighting phase, we employed multiple methodologies, including the Analytic Hierarchy Process (AHP), Principal Component Analysis (PCA), and variance-based distribution methods, to investigate their respective contributions to the final risk evaluation.

Preliminary findings reveal city-level climate risks for both the present and future periods, offering critical insights for key vulnerabilities and areas of concern. These results provide essential guidance for regional policymakers, enabling the identification of specific risk hotspots and developing targeted strategies that address the region-specific challenges. These results serve as a foundation for developing targeted strategies to mitigate climate risks, strengthening resilience, and enhance adaptation capacity in the Marmara Region.

How to cite: Moral, A. C., Yürük Sonuç, C., and Ünal, Y.: Climate Risk Analysis for Marmara Region, Türkiye, EGU General Assembly 2025, Vienna, Austria, 27 Apr–2 May 2025, EGU25-8933, https://doi.org/10.5194/egusphere-egu25-8933, 2025.

EGU25-9152 | Posters on site | ITS2.6/CL0.4

Healthcare organizations under heat stress: Risk assessment and solutions in Austria  

Marianne Bügelmayer-Blaschek, Katharina Ledebur, Andrea Hochebner, Martin Schneider, and Peter Klimek

The increase in the number of heat days caused by climate change leads to intensified thermal heat stress for the human population, especially for vulnerable groups such as the elderly, children, and people with chronic illnesses. As climate change progresses, the demand for healthcare services will rise sharply in the coming years, considering that the number of heat days (Tmax > 30 °C) and tropical nights (Tmin > 20 °C) has already doubled or tripled in recent decades in Austria.

A transdisciplinary team of health, climate, and complexity scientists is needed to comprehensively investigate the effects and risks of climate change, with the focus on heat, on the health system. In a first step, the correlations between meteorological conditions (temperature, humidity, etc.) and health outcomes are analysed. To assess the effect of heatwaves on hospital admissions and deaths, data of daily maximum temperature, deaths, and hospital admissions per care region in Austria for the months June-September of the period 2007-2019 are used. In the detailed analyses, various definitions of heat waves, latency periods, and other factors are examined.

The investigated correlations between prevailing climate conditions and their effects on health are used to investigate future climate scenarios with respect to their conditions. Thus, projections can be made about imminent risks for people and consequently healthcare organisations. For this purpose, the different impacts of heat stress on staff, clients and management assessed with the participating healthcare organizations of the research project. Climate impact chains are developed and applied to ensure a systemic understanding of the risk, exposure and vulnerabilities. Derived adaptation measures  are subsequently identified at an institutional level. In addition, areas are identified in which the institutions have no influence and need support, for example through urban planning (e.g. greening and unsealing of outdoor areas not owned by the institutions, shaded path to an existing cooling center).

The results of the correlation analysis show significantly higher risk ratios for deaths in hospitals and for hospital admissions during heatwaves. This applies both to the population as a whole and to elderly people (>= 75 years). However, the increased burden is not only noticeable for clients, but also for healthcare staff, as analysed with the healthcare organisations within climate impact chains. The results indicate that there are some fields of action in which the institutions can take measures, such as regular training on the topic of heat, adapted uniforms, or adapting work processes and medication during heatwaves.

However, there are also areas in which healthcare organisations are dependent on the support and implementation of measures at city/regional level. For example, Nature-based solutions (Nbs) such as large-scale greening and unsealing are measures to reduce heat stress in the long term, thus reducing the strain on people – positively impacting health conditions. Furthermore, outdoor retreats are created in this way, reducing the burden of poor living standards.

How to cite: Bügelmayer-Blaschek, M., Ledebur, K., Hochebner, A., Schneider, M., and Klimek, P.: Healthcare organizations under heat stress: Risk assessment and solutions in Austria , EGU General Assembly 2025, Vienna, Austria, 27 Apr–2 May 2025, EGU25-9152, https://doi.org/10.5194/egusphere-egu25-9152, 2025.

EGU25-9793 | Posters on site | ITS2.6/CL0.4

Early Warning System for Tree-Fall Hazards on Railways: An Example of a System Developed for the Czech Railway Infrastructure Administrator 

Michal Bíl, Vojtěch Nezval, Richard Andrášik, Jan Kubeček, Vojtěch Cícha, and Zdeněk Lepka

An early warning system Stromynazeleznici.cz (trees on railway tracks) has been developed to assist the national rail infrastructure administrator (Správa železnic, SZ) in managing the hazard of tree falls. A forecast of the tree-fall hazard on a 3-hour basis for the following three days is provided. The model incorporates data from weather forecasts (Aladin model) and a tree-fall susceptibility layer which delimits the locations where falling trees are capable of crossing railway tracks.

The tree-fall susceptibility layer is prepared from the raster of a normalized digital surface model. One-meter cells contain information about the absolute height of the surface above the relief model. All non-vegetated areas (all types of buildings, tall objects, bridges, masts, etc.) and areas with low vegetation that do not pose a hazard are filtered out. Impact zone buffers are defined for the remaining vegetation areas according to the actual height of the vegetation. The final output is a proportion of the length of railway lines per unit section which are threatened by falling vegetation.

Stromynazeleznici.cz contains tree fall evidence for recording, presenting, and exporting incidents. The forecast is based on a regression model programmed in R (server solution Project R). A multivariate logistic regression was chosen as the most suitable approach to construct the model according to cross-validation results and practical requirements. The following characteristics were selected as explanatory variables in the logistic regression: maximum daily wind gust, soil saturation index, snow index, the occurrence of thunderstorms, the season, the range of altitudes in the vicinity of the rail track, the median height of trees along the railway tracks, and the length of the rail track section with trees along the rail track.

The hazard level of tree falls is calculated for the "hectolines" (i.e., 100-meter segments) of the railway track. These are then aggregated into three levels of administrative units defined by SZ. The hazard level is calculated for three-hour intervals, covering a 45-hour forecast period – resulting in 15 time slots for each hectoline (the rail network in Czechia consists of 94,759 hectolines). The forecast is updated four times a day as new meteorological data become available.

The data is stored in a database and presented in the form of graphs, tables, and an interactive map. Hazard information can be found on the map: the tree-fall hazard level is represented by a five-level colour scale for individual administrative units. When zooming in, the risk is shown in relation to the hectolines. A timeline is located at the bottom of the screen, allowing users to switch between different time slots or aggregated time windows. Clicking on an administrative unit or hectoline will display the forecast and details for the selected element. The map also offers additional thematic layers — fallen trees, a layer showing vegetation susceptibility to falling onto the railway track, a tree health layer (derived from the Sentinel-2 data), and a forest tree species layer.

How to cite: Bíl, M., Nezval, V., Andrášik, R., Kubeček, J., Cícha, V., and Lepka, Z.: Early Warning System for Tree-Fall Hazards on Railways: An Example of a System Developed for the Czech Railway Infrastructure Administrator, EGU General Assembly 2025, Vienna, Austria, 27 Apr–2 May 2025, EGU25-9793, https://doi.org/10.5194/egusphere-egu25-9793, 2025.

One of the pressing challenges of our time is bridging the gap between climate science and decision-making to effectively manage risks from climate change, with weather and climate extremes being central to climate-related risk. Traditional climate science predominantly employs probabilistic approaches, generating large model ensembles to explore likely ranges of future conditions. While valuable, this approach often neglects low-likelihood, high-impact events that pose profound risks to society [1].

Strengthening the connection between climate science and decision-making is increasingly critical, particularly as the frequency and severity of extreme weather events rise. Integrated risk assessment and management require a holistic approach encompassing robust knowledge of potential impacts, hazard identification, risk monitoring, early warning and effective communication. While uncertainties in climate projections and predictions are unavoidable, they should not result in decision paralysis. Instead, the focus should be on interdisciplinary collaboration and enhancing links between climate science and decision-making through a better and more decision-relevant understanding of climate impacts [2].

This talk will address recent approaches, highlighting the importance of bridging disciplines and incorporating user-needs to address the complex challenges posed by climate risks. For instance, event-based storylines considering high-impact events, integrating system vulnerability and exposure to better assess risk will be discussed. When co-developed by climate scientists and stakeholders, storylines informed by physical climate and impact modeling provide actionable insights tailored to specific contexts.


References

[1] Sillmann J, Shepherd TG, van den Hurk B, Hazeleger W, Martius O, Zscheischler J, 2021: Event-based storylines to address climate risk, Earth’s Future, 9, doi: 10.1029/2020EF001783.

[2] Sillmann J, Raupach TH, Findell KL, Donat M, Alves LM, Alexander L, Borchert L, Borges de Amorim P, Buontempo C, Fischer EM, Franzke CL, Guan B, Haasnoot M, Hawkins E, Jacob D, Mahon R, Maraun D, Morrison MA, Poschlod B, Ruane AC, Shampa, Stephenson T, van der Wel N, Wang Z, Zhang X and Županić J, 2024: Climate extremes and risks: links between climate science and decision-making. Front. Clim. 6:1499765. doi: 10.3389/fclim.2024.1499765.

How to cite: Sillmann, J.: Climate Extremes and Risk: Connecting Climate Science and Decision-Making via Interdisciplinary Approaches Focusing on Climate Impacts, EGU General Assembly 2025, Vienna, Austria, 27 Apr–2 May 2025, EGU25-9881, https://doi.org/10.5194/egusphere-egu25-9881, 2025.

EGU25-11120 | ECS | Posters on site | ITS2.6/CL0.4

Knowledge Diversity for Climate Change Adaptation: A Social-Ecological-Technological Systems (SETS) Approach to Mental Models 

Pablo Herreros Cantis, Svetlana Khromova, Marta Olazabal, Timon McPhearson, Johannes Langemeyer, and Marc Neumann

As the frequency and intensity of extreme weather events continue to increase due to climate change, risk mitigation has become a critical aspect of climate change adaptation in cities. The impacts of extreme weather events in cities are extremely diverse. Consequently,  integrative, systems-based approaches have been praised given their capacity to structure holistic risk assessments, account for both qualitative and quantitative data, and for accounting for the interactions between system components. Given the diversity and complexity of urban systems, interdisciplinary knowledge integration is critical in order to account for varied perspectives related to the impacts of extreme weather events on urban systems. Despite advances made to integrate different strands of knowledge through systems-based approaches, few methods exist to contextualize, analyse and evaluate its diversity. Assessing knowledge diversity exposes varying ways in which stakeholders identify and problematize the impacts of extreme weather events uncovering knowledge gaps and dominant knowledge framings that might hinder risk governance processes.  This study presents a novel methodology that integrates mental models and the social-ecological-technological systems (SETS) framework to assess and compare individual stakeholder perceptions of urban systems under the lens of an extreme weather event. By classifying system components and interactions into social, ecological, and technological domains, mental models enable the visualization of knowledge diversity, as well as the identification of potential gaps and silos in stakeholder understanding. The methodology is applied to New York City as a case study, engaging 20 stakeholders from diverse disciplines and sectors involved in mitigating the impacts of extreme precipitation. Findings reveal significant variability in how stakeholders emphasize SET domains and interactions. This methodology offers a transferable framework for assessing knowledge diversity in urban climate adaptation, emphasizing the importance of reflecting on stakeholder perspectives to identify gaps and synergies. By supporting more holistic and inclusive co-production processes, this approach provides a theoretical and empirical foundation for advanced modelling efforts that are capable of addressing the multifaceted challenges posed by climate change in urban environments.

How to cite: Herreros Cantis, P., Khromova, S., Olazabal, M., McPhearson, T., Langemeyer, J., and Neumann, M.: Knowledge Diversity for Climate Change Adaptation: A Social-Ecological-Technological Systems (SETS) Approach to Mental Models, EGU General Assembly 2025, Vienna, Austria, 27 Apr–2 May 2025, EGU25-11120, https://doi.org/10.5194/egusphere-egu25-11120, 2025.

EGU25-12074 | ECS | Posters on site | ITS2.6/CL0.4

Enhancing crop yield simulations under extreme climate events using a hybrid model 

Baoying Shan, Haiyang Qian, Xiaoxiang Guan, and Carlo De Michele

Crop models currently have a limited capacity to accurately simulate the impacts of extreme climate events (ECEs), and there is considerable uncertainty across different models. Consequently, the assessment of food security risks from future climate extremes based on existing frameworks is less reliable. To address this issue at global scale, we are developing an advanced hybrid model that integrates process-based crop models with information on the occurrence of extreme climate events and a deep learning framework. Specifically, our model uses outputs from multiple crop models provided by the third round of the Inter-Sectoral Impact Model Intercomparison Project (ISIMIP 3a) as the initial input. The second input will consist of the daily occurrence of four types of extreme events: two related to temperature (heatwaves and coldwaves) and two related to precipitation (droughts and pluvials). We employ a Long Short-Term Memory (LSTM) network with an attention mechanism designed to dynamically capture the varying impacts of ECEs at different crop growth stages. The results are expected to offer a more precise simulation and deeper understanding of how ECEs affect food security. This study highlights the potential of AI-hybrid modeling to enhance the accuracy of crop impact assessments under climate change.

How to cite: Shan, B., Qian, H., Guan, X., and De Michele, C.: Enhancing crop yield simulations under extreme climate events using a hybrid model, EGU General Assembly 2025, Vienna, Austria, 27 Apr–2 May 2025, EGU25-12074, https://doi.org/10.5194/egusphere-egu25-12074, 2025.

EGU25-12539 | ECS | Posters on site | ITS2.6/CL0.4

A bottom-up approach to climate risk from the Global South: the case of the CONICET Argentina My Climate Risk Hub 

Lucía M. Cappelletti, Julieta Cánneva, Leandro Díaz, Maria Florencia Fossa Riglos, Carla Gulizia, Valeria Hernández, Chiara Incicco, María Sol Hurtado de Mendoza, Julia Mindlin, Dalia Pansa, Natalia Pessacg, Camila Prudente, Juan A. Rivera, Federico Robledo, Daira A. Rosales, Romina C. Ruscica, Anna A. Sörensson, and Nadia Testani

In order to advance new theoretical and practical integration of Earth and Social Sciences to address the climate crisis and its impacts on society, the World Climate Research Programme has created the My Climate Risk (MCR) Lighthouse activity. The goal of MCR is to develop and mainstream a bottom-up approach to climate risk. To progress in this path, MCR has assembled regional centres (‘Hubs’) from institutions/researchers with knowledge in the field of climate risk and that allow this approach to be taken to local and regional scales. These Hubs comprise a variety of forms and modes of operation depending on the local interests and needs. In March 2022, the MCR CONICET Argentina Regional Hub was created (https://sites.google.com/view/mcrhubconicet). Through MCR CONICET Argentina Regional Hub its members learn, participate and motivate a scientific-technical and social perspective to promote adaptation and face climate extremes in Argentina employing the co-production of knowledge, storylines and multiple lines of evidence.

This work aims to share initiatives and projects from the Global South that are rooted in inter- and transdisciplinary dialogue and the inclusion of actors and institutions of the region, to address climate risk research. The case studies presented here address Argentina's need to improve hydrometeorological services availability, accessibility and interpretation. The first case study presents the coproduction cycle that led to a subseasonal novel local prediction product in northeastern Argentina, co-produced between climatologists, anthropologists and family farming actors within the framework of the CLIMAX project. The successful experience of this development highlights the importance of involving local communities in the development of climate information products that can be socially appropriated. A case of use of climate storylines as a tool for improving decision making is presented. Physical Climate Storylines was put in dialogue with Socio-anthropological Narrative Analysis around a drought event in Southeastern South America. Finally, the strategy of multiple lines of evidence is used, showing results of the “A River All Waters” project, which integrated transversal lines of work to address the impact of climate change on the Chubut River in Argentine Patagonia. This project shows a reduction in precipitation and an increase in temperature since 1960, which caused a decrease in river flows. These three case studies showed the need to explore novel methodologies that favour a bottom-up approach to regional and local climate risk.

How to cite: Cappelletti, L. M., Cánneva, J., Díaz, L., Fossa Riglos, M. F., Gulizia, C., Hernández, V., Incicco, C., Hurtado de Mendoza, M. S., Mindlin, J., Pansa, D., Pessacg, N., Prudente, C., Rivera, J. A., Robledo, F., Rosales, D. A., Ruscica, R. C., Sörensson, A. A., and Testani, N.: A bottom-up approach to climate risk from the Global South: the case of the CONICET Argentina My Climate Risk Hub, EGU General Assembly 2025, Vienna, Austria, 27 Apr–2 May 2025, EGU25-12539, https://doi.org/10.5194/egusphere-egu25-12539, 2025.

EGU25-13534 | ECS | Posters on site | ITS2.6/CL0.4

Hamburg Pluvial Flood Risk Map 

Malte von Szombathely, Jörn Behrens, Franziska S. Hanf, Marc Lennartz, Benjamin Poschlod, Anastasia Vogelbacher, and Jana Sillmann

The "Hamburg Pluvial Flood Risk Map" aims to improve our understanding of the drivers, dynamics and interactions of climate-induced (disaster) risks in Hamburg. Following the risk framework of the IPCC, we calculate a risk index based on hazard, exposure and (social) vulnerability. In this sense, we combine data from the previously published Social Vulnerability Index (von Szombathely et al., 2023) with novel meter-scale hydraulic simulations of urban flooding provided by the heavy rain hazard map of the city of Hamburg (BKG/FHH 2023). We have enhanced the modeling of social vulnerability by applying the TOPSIS method and the Shannon Entropy procedure. and propose a high-resolution exposure modeling designed for urban flooding, with different exposure layers threatening health and restricting mobility and accessibility. We show that fundamentally new spatial patterns emerge for pluvial flood risk in Hamburg, which differ from familiar socio-economic urban structures and at the same time differ clearly from a pure representation of the hazard. Presented through high-resolution spatial maps, this analysis aids in identifying adaptation needs and prioritizing policy measures for climate change adaptation.


References:

BKG/FHH 2023. Eine Starkregen-Gefahrenkarte für Deutschland. https://www.business-geomatics.com/2023/02/02/eine-starkregen-gefahrenkarte-fuer-deutschland/

von Szombathely M., Hanf F. S., Janka B., Meier L., Ossenbrügge J., Pohl T. 2023. An Index-Based Approach to Assess Social Vulnerability for Hamburg, Germany: International journal of disaster risk science. 14, 5, p. 782-794 13 p. DOI: 10.1007/s13753-023-00517-7

How to cite: von Szombathely, M., Behrens, J., Hanf, F. S., Lennartz, M., Poschlod, B., Vogelbacher, A., and Sillmann, J.: Hamburg Pluvial Flood Risk Map, EGU General Assembly 2025, Vienna, Austria, 27 Apr–2 May 2025, EGU25-13534, https://doi.org/10.5194/egusphere-egu25-13534, 2025.

EGU25-14763 | ECS | Posters on site | ITS2.6/CL0.4

Impact of climatic variability on vegetable price in China during colder months 

Yun Qiu and Jin-soo Kim

Vegetables are full of nutrients that are difficult to obtain from meat or grains, such as vitamins, minerals, and dietary fiber, but they are vulnerable to abiotic stress, making it difficult to obtain consistent yields. Climate extreme events have caused a decline in vegetable production, often leading to elevated vegetable prices. Here, we investigate how climatic factors influence vegetable price changes in China, focusing on colder months when extreme weather impacts are more pronounced. We found three major patterns in vegetable consumer price index (VCPI) data, including data from 31 provinces in China from 2003 to 2023. The first empirical orthogonal function (EOF) mode shows that vegetable prices in all provinces vary together, and this is linked with temperature variations in China. The second EOF mode has a north-south dipole spatial pattern, and it is linked to low-temperature events in southern China, which are closely linked to Arctic warming during colder months and central Pacific La Niña occurrences, especially in December. In addition to temperature, precipitation also affects vegetable prices, with cold rain and snow contributing to VCPI increases resulting from the third EOF mode. Also, the third mode, showing an east-west dipole pattern, is associated with eastern Pacific El Niño occurrences during January and February. Major VCPI patterns and relevant climate factors will facilitate the prediction of vegetable prices on a seasonal time scale and can be used as scientific evidence to prepare for a surge in vegetable prices by combining with seasonal climate forecasts. As China accounts for half of the world’s vegetable production and fluctuations in its vegetable prices can profoundly affect global food security, our findings would be useful to support stable vegetable production, ensure food security, and minimize economic losses globally.

How to cite: Qiu, Y. and Kim, J.: Impact of climatic variability on vegetable price in China during colder months, EGU General Assembly 2025, Vienna, Austria, 27 Apr–2 May 2025, EGU25-14763, https://doi.org/10.5194/egusphere-egu25-14763, 2025.

EGU25-15952 | ECS | Orals | ITS2.6/CL0.4

Cross-Sectoral Climate Change Risk Hotspots in Europe: Insights from CROSSEU Case Studies 

Shreya Some, Kirsten Halsnæs, Sorin Cheval, Dana Micu, Per Skougaard Kaspersen, Mihai Adamescu, Georgia Arhire, Marco Borga, Alvaro Calzadilla, Sandrine Charousset, Olivier Dessens, Vladut Falcescu, Cristiano Franceschinis, Relu Giucă, Denisa Igescu, Katie Jenkins, Nicholas Vasilakos, Kristian Nielsen, Argentina Nertan, and Boutheina Oueslati and the et al.

This work investigates how the damages in cross-sectoral climate change risk hotspots can be assessed drawing on methodologies developed and applied to eight case studies conducted within the EU CROSSEU project. Hotspot analysis represents several key challenges in the assessment of the impacts of climate hazards and the focus here is on extreme climate events rather than on the impacts of gradual climate change. Hotspots are defined as areas where climate events are likely to generate high potential damages. The hotspot identification methodology provides a framework for identification of context specific vulnerabilities due to a combination of factors, including the magnitude of extreme climate events (physical aspects), the presence of critical infrastructure and vulnerable populations (socio-economic aspects), and the sector specific vulnerabilities as well as interconnectedness of different sectors (cross-sectoral aspects). The identification of hotspots is based on a combination of quantitative and qualitative data, including climate projections, socio-economic data, and stakeholder consultations.

The hotspot methodological framework is applied to a range of case study sectors and geographical settings. The case studies cover heat waves in Czech Republic and United Kingdom; drought in regions of Germany, Czech Republic, Poland, and Romania; floods in Denmark, Germany, and Italy; and snow avalanches in the Alps and Carpathian Mountains. While three other case studies addressed climate change impacts and spillover effects in the Lower Danube region and across Europe- particularly on renewable energy infrastructure and agriculture.

In terms of physical vulnerabilities, the case studies demonstrate that Prague and Southern Moravia in the Czech Republic, and London in the UK, are hotspots for heat-related mortality and morbidity, and specific social and structural vulnerabilities in these areas are related to high population densities, aging populations, and the urban heat island effect.  Several regions in Germany, Czech Republic, Poland, and Romania are identified as hotspots for drought. The economic vulnerability of these regions is primarily due to the reliance of agriculture on rainfed water sources. Coastal cities in Southern Denmark and Northern Germany are vulnerable to storm surges, impacting thousands of residents by disrupting daily life, socioeconomic activities, restricting movement and even necessitating temporary relocation. The mountainous areas of the Trentino Alto Adige region in Italy are hotspots for debris flows and flash floods, and are vulnerable due to their low-lying coastal areas, high population densities, and critical infrastructure. The Italian Alps and the Făgăraș Mountains in the Romanian Carpathians are hotspots for snow avalanches with potential high economic losses for tourism. The Lower Danube region is a hotspot for both droughts and floods, posing significant risks to a unique biodiversity ecosystem, as well as to agriculture, energy infrastructure, and human settlements.

This hotspot analysis in the CROSSEU project provides key comparative risk assessment measures, contributing to the establishment of effective adaptation strategies in the EU and also at regional levels.

This research received funds from the project “Cross-sectoral Framework for Socio-Economic Resilience to Climate Change and Extreme Events in Europe (CROSSEU)” funded by the European Union Horizon Europe Programme, under Grant agreement n° 101081377.

How to cite: Some, S., Halsnæs, K., Cheval, S., Micu, D., Skougaard Kaspersen, P., Adamescu, M., Arhire, G., Borga, M., Calzadilla, A., Charousset, S., Dessens, O., Falcescu, V., Franceschinis, C., Giucă, R., Igescu, D., Jenkins, K., Vasilakos, N., Nielsen, K., Nertan, A., and Oueslati, B. and the et al.: Cross-Sectoral Climate Change Risk Hotspots in Europe: Insights from CROSSEU Case Studies, EGU General Assembly 2025, Vienna, Austria, 27 Apr–2 May 2025, EGU25-15952, https://doi.org/10.5194/egusphere-egu25-15952, 2025.

EGU25-16239 | ECS | Orals | ITS2.6/CL0.4

Bridging Risk Knowledge and Operational Outcomes through Retrieval-Augmented Generation and Knowledge Graphs for Early Warning Systems 

Jean-Baptiste Bove, Roberto Rudari, Eva Trasforini, Mirko D'Andrea, Lorenzo Massucchielli, and Antonio Gioia

In emergency management, the gap between scientific risk knowledge and operational decision-making remains a persistent challenge for early warning systems. While vast amounts of data—ranging from risk assessments to historical event records—are available, they are often underutilized due to the complexity and fragmentation of information sources. This research proposes an innovative approach to bridge this gap by integrating Retrieval-Augmented Generation (RAG) with domain-specific knowledge graphs to enhance situational awareness and decision support in emergency operations centers.

The proposed solution focuses on developing a graph-based RAG pipeline that interacts with an external repository of risk data on Italy, specifically tailored for emergency response personnel, including civil protection agencies and the Italian Red Cross. The repository incorporates emergency plans, historical events, risk assessments, civil protection guidelines and legislation, and real-time updates from external sources such as news and media. By structuring the data through a knowledge graph aligned with established risk frameworks (e.g., RISK INFORM), the system enables precise, explainable, and contextual information retrieval.

Key features of the tool include an explainability module for transparency, a PDF parser for document integration, and a web interface that allows users to interact with the system through natural language queries. For example, an analyst responding to severe floods in Northern Italy could query the system for demographic data, flood risk hotspots, and critical infrastructure at risk, receiving actionable insights grounded in both historical and live data.

The project demonstrates how AI-driven approaches, when combined with structured domain knowledge, can make early warning systems more effective by improving accessibility, scalability, and interoperability across sectors. The use of knowledge graphs ensures data explainability and traceability, addressing key challenges in emergency management, such as trust in AI outputs and timely decision-making. The platform, currently under development, aims to serve as a proof-of-concept for future applications in multi-hazard early warning systems.

This research contributes to the evolving field of AI-enhanced early warning systems, offering a novel, trans-disciplinary methodology that combines data science, emergency management, and humanitarian operations to improve anticipatory action and disaster preparedness.

How to cite: Bove, J.-B., Rudari, R., Trasforini, E., D'Andrea, M., Massucchielli, L., and Gioia, A.: Bridging Risk Knowledge and Operational Outcomes through Retrieval-Augmented Generation and Knowledge Graphs for Early Warning Systems, EGU General Assembly 2025, Vienna, Austria, 27 Apr–2 May 2025, EGU25-16239, https://doi.org/10.5194/egusphere-egu25-16239, 2025.

EGU25-16945 | Posters on site | ITS2.6/CL0.4

Integrating value systems and place-based characteristics into climate risk assessments

Cristobal Reveco and Lola Kotova

EGU25-17829 | ECS | Posters on site | ITS2.6/CL0.4

Closing the Insurance Gap – Enhancing Access to the CAT Bond Market 

Kai O. Bergmüller, Victor Wattin Håkansson, Samuel Juhel, David N. Bresch, and Chahan M. Kropf

Low- and middle-income countries are often vulnerable to extreme weather events and simultaneously have limited access to insurance markets, leaving damages largely uncovered. To address the issue, the World Bank advocates for a risk-layering approach. Part of this approach is the issuance of catastrophe bonds (CAT bonds), especially for high-risk layers and when capital requirements are substantial. However, access to the CAT bond market remains limited. Market entry of potential issuers, but also investors, is hindered by the extensive, and most often, expensive technical knowledge needed. Additionally, high investor premium demands pose a great challenge for low- and middle-income countries, a situation likely to worsen with climate change intensification.
We propose three interdependent solutions to enhance countries and investors access to the CAT bond market. First, we develop an open-source and -access CAT bond tool and implement it within the CLIMADA environment, an open-source global risk assessment platform. The tool allows for the design and evaluation of either potential or already existing CAT bonds and was tested in a tropical cyclone insurance case study in Samoa. Second, we propose a multi-country CAT bond design, which pools risk across nations. We apply this design to a case study of tropical cyclone risk in Small Island States (SIDS). We find that such pooling allows to decrease both capital requirements and premiums by up to 27% and 17%, respectively, while still offering competitive returns to investors. Third, we introduce a financial scheme addressing premium support, capital supply, and greenhouse gas reduction incentives. We apply the scheme in a case study to the SIDS utilizing the previously developed CAT bond tool and the presented pooling approach. These solutions together aim to expand access to risk transfer for vulnerable countries, offering a more
sustainable and affordable pathway to disaster resilience.

How to cite: Bergmüller, K. O., Håkansson, V. W., Juhel, S., Bresch, D. N., and Kropf, C. M.: Closing the Insurance Gap – Enhancing Access to the CAT Bond Market, EGU General Assembly 2025, Vienna, Austria, 27 Apr–2 May 2025, EGU25-17829, https://doi.org/10.5194/egusphere-egu25-17829, 2025.

EGU25-18200 | Posters on site | ITS2.6/CL0.4

Assessment of Climate Fragility in Myanmar based on high-resolution regional climate model simulations 

Martina Messmer, Santos J. González-Rojí, Nay Chi Mo Aung, Glenn Hunt, and Sonia Leonard

Myanmar is highly vulnerable to climatic changes in extreme weather such as increased precipitation and extreme temperatures. During the dry season of the last two years, Myanmar has already suffered such events. High-resolution climate model simulations are urgently needed to understand the complexity of future impacts of extreme weather and climate change in Myanmar. While global climate model simulations cover the region with a horizontal resolution of around 100 km, most regional climate models available over this region have a resolution of up to 25 km. This is still not enough to accurately assess the vulnerability to climate change for such a diverse country with complex topography, and thus, new high-resolution simulations are needed to understand the effect of climate change on regional to local scales.

We are conducting dynamically downscaled climate simulations across a large part of Myanmar using the Weather Research and Forecasting (WRF) model. Downscaled climate data are generated for five simulation periods: one for the present (1981-2010) and two for each of two future periods (2031-2060 and 2071-2100), under both the intermediate-emission shared socioeconomic pathway (SSP2-4.5) and the very high-emission pathway (SSP5-8.5). The simulations are performed at a high spatial (5 km) and temporal resolution. Through these simulations, we can achieve more realistic precipitation patterns and detailed information on local precipitation and temperature extremes, considering also the daily cycle. 

We will present our preliminary findings from the downscaled modelling of weather extremes and information about heat stress and drought indices. This will provide insight into potential impacts on food security and fragility to climate change in general, both of great implications for local society and economy.

How to cite: Messmer, M., González-Rojí, S. J., Mo Aung, N. C., Hunt, G., and Leonard, S.: Assessment of Climate Fragility in Myanmar based on high-resolution regional climate model simulations, EGU General Assembly 2025, Vienna, Austria, 27 Apr–2 May 2025, EGU25-18200, https://doi.org/10.5194/egusphere-egu25-18200, 2025.

The private sector and industry are increasingly accessing physical climate data to a) identify and disclose climate risk as required by regulations and b) seek to estimate and limit both present and future economic impacts of physical risk on their business.

Projections of physical climate risk and associated changes in estimates in losses are typically provided to private sector stakeholders in isolation from the wider social and systemic picture. Whilst individual private sector stakeholders can take some measures to minimise impacts from climate hazards, a collective approach in conjunction with local communities and the public sector may be more effective, in terms of both risk reduction, and upfront cost.

We provide physical climate storylines and narratives as a complement to the typical physical risk data provided to private stakeholders. We work with many private stakeholders and are seeking interdisciplinary discussion and collaboration with a view to exploring and quantifying the cost- benefit of individual stakeholder action versus collective action.

How to cite: Sagoo, N. and Leach, N.: Exploring how physical climate storylines and narratives impact private stakeholder behaviour, EGU General Assembly 2025, Vienna, Austria, 27 Apr–2 May 2025, EGU25-20300, https://doi.org/10.5194/egusphere-egu25-20300, 2025.

The China-Pakistan Economic Corridor (CPEC), a cornerstone of China’s Belt and Road Initiative (BRI), has significantly enhanced economic connectivity, infrastructure, and mobility between China and Pakistan, with investments exceeding $60 billion. However, this rapid transformation raises critical questions about the intersection of climate, trade mobility, and public health. Increased connectivity under CPEC may amplify the risk of Japanese Encephalitis (JE), a zoonotic, mosquito-borne disease endemic to several Asian countries, including China. JE transmission is influenced by complex ecological and climatic factors, including temperature, precipitation, and land-use changes, which impact mosquito vectors (Culex tritaeniorhynchus) and their habitats.

This study evaluates the risk of JE outbreaks in Pakistan through a One Health framework, highlighting the interplay of climate, mobility, and health. Specifically, it focuses on cross-sectoral collaboration across public health, veterinary, and environmental agencies to mitigate emerging threats. Objectives include assessing JE transmission risks along CPEC and proposing climate-sensitive, One Health interventions for prevention and control.

The risk assessment integrates data from human health, veterinary, and environmental sectors using interdisciplinary methodologies:

  • Climate and environmental mapping of Culex breeding sites along CPEC using satellite imagery and meteorological data, identifying that over 50% of CPEC-associated regions, particularly in Sindh and Punjab, have optimal conditions for mosquito breeding due to rice paddies, irrigation systems, and seasonal climatic variability.
  • Analysis of trade and mobility data, showing a 240% increase in human and animal movement along CPEC, intensifying vector and amplifying host exposure.
  • Stakeholder interviews, revealing critical gaps in JE surveillance, real-time communication, and coordinated climate-informed response strategies.

Findings highlight that approximately 60% of identified high-risk areas are vulnerable to JE outbreaks, driven by favorable climatic and environmental conditions for vector proliferation. This underscores the urgent need for integrated strategies that account for climate variability and its impacts on vector dynamics.

Key recommendations include:

  • Developing GIS-based vector surveillance systems to monitor climate-driven changes in mosquito breeding habitats.
  • Establishing real-time data-sharing platforms for JE surveillance between China and Pakistan, incorporating climate and environmental data.
  • Promoting JE vaccination programs for vulnerable populations in high-risk, climate-sensitive areas.
  • Enhancing diagnostic and response capacity across public health and veterinary laboratories through climate-informed training initiatives.
  • Raising community awareness through public health campaigns on vector control, emphasizing climate adaptation strategies.
  • Formulating a joint JE outbreak preparedness and response framework, integrating climate projections, vector control, and rapid response teams.

This study demonstrates the critical need for interdisciplinary approaches to address health risks at the nexus of climate, trade mobility, and emerging infectious diseases. By integrating climate science into One Health strategies, the research underscores how transdisciplinary collaboration can build resilience against the multifaceted challenges of climate change and global connectivity.

How to cite: Ahmad, S. and Idrees, F.: From Trade Routes to Transmission Routes: Climate, Mobility, and Risk Assessment of Japanese Encephalitis Outbreak in Pakistan under the China-Pakistan Economic Corridor: A One Health Approach, EGU General Assembly 2025, Vienna, Austria, 27 Apr–2 May 2025, EGU25-529, https://doi.org/10.5194/egusphere-egu25-529, 2025.

EGU25-687 | ECS | PICO | ITS2.4/CL0.5

Association between exposure to fine particulate matter from different emission sources and mental health outcomes in India 

Payel Kundu, Sagnik Dey, Anand Krishnan, Santu Ghosh, Girish N Rao, Vivek Benegal, Mathew Varghese, and Gopalkrishna Gururaj

Growing evidence demonstrated that exposure to ambient fine particulate matter (PM2.5) increases mental health risk via neuroinflammation and oxidative stress. However, less is known about the relative contribution of PM2.5 originating from different emission sources on mental health, such as depression and anxiety, particularly in low- and middle-income countries like India. Therefore, we examined the associations of short- and long-term exposure to total and source-specific PM2.5 with depression and anxiety in Indian adults.

A cross-sectional analysis has been conducted in 12 Indian states using data from the National Mental Health Survey (NMHS), 2015-16, a nationally representative and population-based study in India. This study includes a total of 34,357 participants, 18 years and older. The 1-month and 12-month mean exposure to PM2.5 and its source originating from 8 emission sources were assessed using a 1 km x 1 km high-resolution satellite-derived database and the WRF-CMAQ model, respectively, at participants' residential addresses before the NMHS interview date. The Mini International Neuropsychiatric Interview (MINI) version 6.0.0 was used to evaluate depression and anxiety disorders in adults. Adjusted odds ratios (ORs) were estimated for depression and anxiety per IQR increase in PM2.5 using a logistic mixed-effects regression model after adjusting for the individual and household level covariates.

In this study, the weighted prevalence of the current depressive and anxiety disorders among adults was 2.69% (95% CI-2.66-2.72) and 2.96% (95% CI-2.93-2.99), respectively. The estimated mean PM2.5 exposure for 1-month and 12-months was 55.8±19.6 and 44.3±13.5 µg/m3 respectively. Each IQR increase in PM2.5 exposure was significantly and strongly associated with depressive disorder (OR = 1.13; 95% CI: 1.05–1.21) for a 1-month exposure window and anxiety disorder (OR = 1.16; 95% CI: 1.07–1.26) for a 12-month exposure after adjusting for potential confounders. PM2.5 originating from different emission sectors was associated with mental health outcomes, with the strongest associations for power, transport, international transboundary, and domestic sources for at least one health endpoint, whereas agricultural sources showed protective associations with both outcomes. Subgroup analyses showed stronger associations among individuals with lower household incomes and lower education.

Our study suggests that interventions to reduce PM2.5 from key emitting sources may reduce the burden of mental health in India, although cohort studies are recommended to determine the causal relationship.

How to cite: Kundu, P., Dey, S., Krishnan, A., Ghosh, S., N Rao, G., Benegal, V., Varghese, M., and Gururaj, G.: Association between exposure to fine particulate matter from different emission sources and mental health outcomes in India, EGU General Assembly 2025, Vienna, Austria, 27 Apr–2 May 2025, EGU25-687, https://doi.org/10.5194/egusphere-egu25-687, 2025.

EGU25-2188 | PICO | ITS2.4/CL0.5

Time of Emergence and Future Projections ofExtremes of Malaria Infections in Africa 

Christian Franzke and Ruchi Singh Parihar

The spread of malaria is a major health burden, affects many people in Africa, depends on climate but also socio-economic conditions. Thus, it is important to gauge the impact of anthropogenic global warming on malaria and attribute anthropogenic causes. Here we compute the Time Of Emergence (TOE) of vector density and of the Entomological Inoculation Rate (EIR) in the SSP3-7.0 scenario using 50 bias-corrected members of Community Earth System Model version 2 (CESM2) Large Ensemble simulations. This reveals that vector density, which depends on climate conditions, and EIR, which depends on both climate and population density, will rise significantly and permanently above the pre-industrial background variability due to anthropogenic causes in Africa. Both the vector density and EIR have areas, mainly in central Africa, where anthropogenic causes have already significantly changed, and many more areas will experience anthropogenic caused changes in the 2030 and 2040s and towards the end of this century. Our simulations also show clear evidence that extremes of vector density and EIR increase in the future by almost 100%, suggesting that major malaria epidemic outbreaks will become much more likely. We also perform simulations with constant population and with no climate change which partly reveal underlying malaria dynamics. Our results highlight the need to prepare for an expansion and intensification of the malaria burden if no health interventions are being taken.

How to cite: Franzke, C. and Parihar, R. S.: Time of Emergence and Future Projections ofExtremes of Malaria Infections in Africa, EGU General Assembly 2025, Vienna, Austria, 27 Apr–2 May 2025, EGU25-2188, https://doi.org/10.5194/egusphere-egu25-2188, 2025.

EGU25-2681 | PICO | ITS2.4/CL0.5

Impact of heat on neonatal mortality in India 

Sagnik Dey, Govind Gaur, and Sajeev Philip

While increasing heat is a direct impact of climate change on health, epidemiological studies are quite limited in India. Here we examined the impact of heat on neonatal (children less than 28 days) and very early (children died on the first day) neonatal mortality using the fifth round of the National Family Health Survey (NHFS-5) dataset for 2019-2021. For heat exposure, we used a global daily temperature dataset at 1-km by 1-km saptial scale. First, we evaulated the global temperature dataset with station-based measurements for India and found reasonable accuracy for further application. In the NHFS-5, health and demographic information was collected from 30456 clusters spanning across urban and rural India covering every district. The estimated very early neonatal mortality and neonatal mortality values were 17.1 and 23.4 per 1000 live births, respectively. We then assinged exposure to daily maximum and minimum temperature at household level, and using a generalized logistic regression model, estimated the effect of heat after adjusting for the covariates. For every 1 degree increase in maximum and minimum temperature, very early neonatal mortality increase by 2.7% (95% CI: 1.6-3.8) and 2.0% (1.0-2.9), respectively. We found larger effect of heat on neonates born in the 'poorest' households (3.3% and 3.0% highesr risk for every 1 degree increase in maximum and minum temperature) with the effect declining (but still significant) with an increase in wealth index. We also found larger effect on male child than on female child, and on neonates in rural region than in urban region, and the effect fizzles out with a few days lag. As temperature is expected to rise further due to climate change, adequate adaptation startegy is required to protect the most vulnerable group; without which India cannot meet the sustainable development goal of reducing very early neonatal mortality and neonatal below 7 and 10 per 1000 live births, respectively, by 2030.          

How to cite: Dey, S., Gaur, G., and Philip, S.: Impact of heat on neonatal mortality in India, EGU General Assembly 2025, Vienna, Austria, 27 Apr–2 May 2025, EGU25-2681, https://doi.org/10.5194/egusphere-egu25-2681, 2025.

EGU25-4125 | ECS | PICO | ITS2.4/CL0.5

The health effects of plastic burning particulate matter- the role of metals, Polycyclic aromatic hydrocarbons, environmentally persistent free radicals, reactive oxygen and chlorine species in inducing oxidative stress in human body 

Rizana Salim, Sukriti Kapur, Meredith Schervish, Kasey Edwards, Lena Gerritz, Ravikrishna Raghunathan, Sergey A. Nizkorodov, Sachin S. Gunthe, and Manabu Shiraiwa

Plastic burning can significantly contribute to the overall particulate matter (PM) burden in developing countries, where inadequate waste management and low public awareness often result in open refuse burning. However, their chemical composition and health-related properties are largely unelucidated. In this study, we generated PM through controlled combustion of five widely used plastic materials. Our findings reveal that metals and polycyclic aromatic hydrocarbons (PAHs) detected in the plastic samples may drive oxidative stress through ROS formation. We observed significant quantities of EPFRs and ROS in the aqueous extracts of the PM. Additionally, plastic burning PM showed excessively high levels of reactive chlorine species (RCS). The oxidative potential, a key metric for PM toxicity, was assessed using acellular assays- OP-DTT and OP-OH. A kinetic box model was employed to simulate OP-OH, focusing on the rate of hydroxyl radical (•OH) formation. The model integrated reactions involving PAHs, metals, EPFRs, ROS, and RCS, using rate constants from established literature. It reasonably predicted •OH formation rates for the five types of plastics tested. Our results suggest that radical production is driven by complex chemical mechanisms, including redox cycling of active components, ROS cycling, Fenton chemistry, and organic oxidation reactions. Given the widespread use of plastics and growing environmental concerns around plastic pollution, this study highlights the urgent need for stricter regulations and improved waste management practices, especially in developing countries. Further details will be presented.

How to cite: Salim, R., Kapur, S., Schervish, M., Edwards, K., Gerritz, L., Raghunathan, R., A. Nizkorodov, S., S. Gunthe, S., and Shiraiwa, M.: The health effects of plastic burning particulate matter- the role of metals, Polycyclic aromatic hydrocarbons, environmentally persistent free radicals, reactive oxygen and chlorine species in inducing oxidative stress in human body, EGU General Assembly 2025, Vienna, Austria, 27 Apr–2 May 2025, EGU25-4125, https://doi.org/10.5194/egusphere-egu25-4125, 2025.

EGU25-4778 | ECS | PICO | ITS2.4/CL0.5

Impact of global warming on the anemia among women of reproductive age in the global south 

Shan Jiang, Chaohui Li, and Xudong Wu

Climate anomalies in a warming world can directly or indirectly affect public health across genders, particularly among vulnerable groups such as women of reproductive age. However, it remains unclear whether global warming may exacerbate the widespread public health challenge of anemia in women of reproductive age (WRA), especially in low- and middle-income countries (LMICs) that are highly susceptible to socioeconomic, demographic, and geographical factors. In this study, we combined a high-resolution anemia prevalence dataset with climate data into a fixed-effect panel regression model to investigate the impact of global warming on anemia prevalence among WRA in LMICs between 2000 and 2018. We revealed how temperature variation affected anemia prevalence and examined whether these effects correlated to economic and policy developments. Furthermore, we projected future spatiotemporal trends of anemia prevalence among WRA in LMICs under diverse warming scenarios. These outcomes can help inform the decision-making of World Health Organization's strategies for anemia control and support the implementation of region-specific initiatives aimed at improving women's health.

How to cite: Jiang, S., Li, C., and Wu, X.: Impact of global warming on the anemia among women of reproductive age in the global south, EGU General Assembly 2025, Vienna, Austria, 27 Apr–2 May 2025, EGU25-4778, https://doi.org/10.5194/egusphere-egu25-4778, 2025.

EGU25-4878 | ECS | PICO | ITS2.4/CL0.5

Cognitive impacts of Ground Level Ozone (GLO) exposure in Delhi: Estimating a risk in the highly polluted urban environment 

Pareshbhai Dineshbhai Parmar, Mina Chandra, Shubham Sharma, and Sri Harsha Kota

Recent research has reported an increase in Ground Level Ozone (GLO) concentrations in South Asia, with ongoing climate change being one of the contributing factors to this rise. In the lower-middle income economies such as India, studies related to cognitive impacts of GLO are insignificant and scarce. This time-series study aims to quantify the risk of cognitive disorders associated with ozone exposure for Delhi. The high-resolution gridded (5km*5km) daily maximum 8-hour mean ozone concentration data (MDA8) retrieved from WRF-Chem simulation were linked to geocoded-anonymized daily hospital admissions data of several cognitive disorders (e.g., depression, anxiety, Parkinson's disease, etc.). The WRF-Chem model was simulated for the Delhi domain over a four-year (2016-2019), for the same period hospital admissions data were collected. The generalized additive model (GAM) with Poisson distribution was utilized for examine an association of O3 exposure with cognitive disorders. The delayed effect of exposure was assessed employing 20-days lag. The results of relative risk (RR) against lag days showed inverted-U shape curve with highest RR of 1.0092 (95% CI: 1.0051-1.0134) on 10th lag day. The age-gender-stratified analysis revealed that females (RR: 1.0085, lag-day: 17) exhibited slightly higher risk compared to males (RR: 1.0071, lag-day: 9), while the younger demographic (age≤60 years) were at marginally elevated risks than elderly (age>60 years). In India, the mitigation measures and policies are predominantly aimed at reducing particulate matter pollution. The findings of this study are pertinent to present and future contexts, whereby evidences of intensifying effects of climate change on ozone are more pronounced than particulate matter. The research offers significant insights into the relationship between ‘public health’ and ‘air pollution’, contributing to the existing literature on highly polluted urban environment like Delhi.

Keywords: Ground level ozone (GLO); Cognitive impacts; Generalized Additive Model (GAM); WRF-Chem

How to cite: Parmar, P. D., Chandra, M., Sharma, S., and Kota, S. H.: Cognitive impacts of Ground Level Ozone (GLO) exposure in Delhi: Estimating a risk in the highly polluted urban environment, EGU General Assembly 2025, Vienna, Austria, 27 Apr–2 May 2025, EGU25-4878, https://doi.org/10.5194/egusphere-egu25-4878, 2025.

EGU25-5254 | ECS | PICO | ITS2.4/CL0.5

Weed, Mosquito, Virus: The Ecological Triad Shaping Disease Transmission in Kenya 

Tasneem Osman, Tatenda Chiuya, Eric Fevre, and Christian Borgermeister


Background: Invasive alien plant species offer enormous ecological and public health risks worldwide, with Kenya experiencing some of the most severe consequences. Non-native flora outcompete indigenous species, reducing local biodiversity, agricultural production, and grazing areas, affecting food security and rural livelihoods. Parthenium hysterophorus (Asteraceae), a highly invasive weed, poses considerable concern due to its capacity to alter ecological systems. Climate change exacerbates these difficulties by altering rainfall patterns and temperatures, enabling invasive species to spread and thrive. As a result, these modifications frequently increase mosquito-breeding areas, which exacerbates the transmission of malaria, dengue, and other arbovirus diseases. Female mosquitoes, the primary vectors of these pathogens, require either blood meals or plant-derived sugars, despite the widespread acknowledgment that arboviral illnesses are highly recognized as serious public health concerns, little is known about how invasive plant species affect mosquito populations or arboviral transmission. This study examines the influence of P. hysterophorus on mosquito vector abundance, diversity, and arbovirus dynamics in the Kenyan Rift Valley area.

Methods: Mosquitoes were collected from six villages with varying levels of P. hysterophorus infestation—three heavily invaded and three free from P. hysterophorus. Using a combination of trapping techniques, approximately 50,000 mosquitoes representing 48 species were captured and identified. This comprehensive survey evaluated mosquito abundance and diversity, providing critical insights into the ecological impacts of invasive alien species on arboviral vector populations.

Conclusions: The findings will elucidate the complex interplay between invasive alien plants, land-use changes, and mosquito vector dynamics, shedding light on the mechanisms driving arbovirus transmission. This study will inform precise vector control strategies and deepen our understanding of the ecological impacts of invasive species on public health, including their role in the spread of diseases. This study will not only guide more targeted vector control strategies but also enhance our understanding of the broader ecological and public health impacts of invasive species in Kenya, particularly in disease spread.

How to cite: Osman, T., Chiuya, T., Fevre, E., and Borgermeister, C.: Weed, Mosquito, Virus: The Ecological Triad Shaping Disease Transmission in Kenya, EGU General Assembly 2025, Vienna, Austria, 27 Apr–2 May 2025, EGU25-5254, https://doi.org/10.5194/egusphere-egu25-5254, 2025.

EGU25-5618 | ECS | PICO | ITS2.4/CL0.5

Developing a prediction model for the relationship between climate, water resources, and mosquito dynamics: application to a case study in  a human-impacted Mediterranean wetland 

Jeewanthi Sirisena, Pascale Stiles, Julia Rodriguez, Susana B. Berenguer, Frederic Bartumeus, Maria M. Costa, and Laurens M. Bouwer

Climate change is a key determinant of public health, influencing disease patterns, and public and environmental well-being. Mosquito population dynamics are largely determined by climatic factors and water availability. Therefore, understanding the linkage between local water resources and mosquito dynamics is crucial for better predicting current and future health risks, and informing effective disease control and health risk reduction. Here, we investigate how temporal and spatial distribution of water availability affects mosquito populations in a natural wetland area under current and future climate r scenarios. The study was conducted in the natural park of the  Aiguamolls de l’Empordà,  connected to La Muga and El-Fluvia river basins in Catalonia, Northeast Spain. Empirical data on river runoff and local water levels were collected from several discharge stations, while abundance estimates of mosquito populations were obtained from mosquito traps spread across the study area. The hydrological assessment is carried out with the Soil Water Assessment Tool (SWAT). This model uses observed rainfall and air temperature from the gridded earth observation dataset over Europe (E-OBS) to simulate streamflow and hydrological responses of the study area. Based on the in situ data and hydrological simulation outputs, we derive a relationship between water availability and mosquito population abundance that can be used to predict future disease risk in the study area. Our results will be integrated within the “Infectious Disease decision-support tools and Alert systems to build climate Resilience to emerging health Threats (IDAlert)” project funded by the European Union. This decision-support tool plays a critical role in targeted interventions in water management and the health sector, directly contributing to reducing health risks due to mosquito-borne diseases.

Keywords: Health risk, SWAT, Spatial and temporal distribution of water, Mosquito populations, IDAlert

How to cite: Sirisena, J., Stiles, P., Rodriguez, J., Berenguer, S. B., Bartumeus, F., Costa, M. M., and Bouwer, L. M.: Developing a prediction model for the relationship between climate, water resources, and mosquito dynamics: application to a case study in  a human-impacted Mediterranean wetland, EGU General Assembly 2025, Vienna, Austria, 27 Apr–2 May 2025, EGU25-5618, https://doi.org/10.5194/egusphere-egu25-5618, 2025.

EGU25-6073 | ECS | PICO | ITS2.4/CL0.5

Developing climate extreme indicators for EpiOutlook, a climate-informed subseasonal-to-seasonal forecast platform for epidemiological risks 

Georgina Eva Ceres Charnley, Emily Ball, Alba Llabrés-Brustenga, Adrià San José Plana, Aimee Colgate, and Rachel Lowe

EpiOutlook is an epidemiological indicator platform currently under development as part of the IDAlert project, a research consortium taking a OneHealth approach to understanding the impacts of climate change on the emergence and spread of infectious diseases in Europe and Bangladesh. The aim of the platform is to provide short-term early warning indicators of epidemiological risks, including those related to extreme weather and climate-sensitive infectious diseases (CSIDs). Currently, one climatic extreme indicator is operational for use in EpiOutlook which relates to drought, and makes use of the Standardised Precipitation-Evapotranspiration Index. Here, we propose two new climate extreme indicators currently under development, one related to heat and a second related to flood risk. We make use of fine-scale climate data (0.25x0.25) to categorise grid cells by the two proposed indicators (heat and flooding), which can then be extrapolated to the scale of interest. The impacts of extreme heat on health are well documented (e.g., extreme low and high temperatures and humidity leading to more adverse health outcomes), particularly for vulnerable groups such as pregnant women and children. Less well established are specific temperature ranges which puts people at risk to the highest number of climate-related health risks including CSIDs. We propose making use of our current CSID indicators (malaria, tick-borne diseases, leishmaniasis, Vibrio spp., West Nile Virus and Aedes-borne diseases), all of which consider the impacts of temperature and humidity. We aim to categorise temperature and humidity ranges which create ideal conditions for the highest number of CSIDs, weighed against the non-communicable disease impacts such as heat stress/stroke and adverse pregnancy outcomes, to provide a comprehensive spatial and temporal outlook for the effects of heat on health. Flooding is a major climatic risk in Europe, leading to destruction of property and livelihoods and infectious disease risk. We aim to develop a simple categorisation of flood risk via fluvial and pluvial flooding over Europe, incorporating several elements of the traditional water balance model, but producing an output which will be more interpretable by a wider range of end users. Risk will be assessed based on precipitation, elevation, land cover, potential evapotranspiration/soil moisture, groundwater recharge rate, proximity to a river, and river runoff/flow. Coastal flooding will not be considered at this stage, due to different flooding mechanisms, and instead proximity to a coastline will be seen as preventative as a source of drainage. Flood risk will be validated using flood data, and if the categorisation is proved accurate in representing flood risk, the occurrence of a flood in the preceding years will be considered in the categorisation. We aim to use the results from the flood indicator to provide valuable input to a leptospirosis indicator, a water-borne disease which is closely related to flooding. We believe that these indicators will provide easy to interpret quantification of climate extremes which relate to health in Europe, useful for public health decision-makers to make necessary adjustments to the current and near future risks posed by climate change.

How to cite: Charnley, G. E. C., Ball, E., Llabrés-Brustenga, A., San José Plana, A., Colgate, A., and Lowe, R.: Developing climate extreme indicators for EpiOutlook, a climate-informed subseasonal-to-seasonal forecast platform for epidemiological risks, EGU General Assembly 2025, Vienna, Austria, 27 Apr–2 May 2025, EGU25-6073, https://doi.org/10.5194/egusphere-egu25-6073, 2025.

Vector-borne diseases are responsible for over 700,000 deaths annually and are expected to spread to new regions and become more frequent due to climate change. This is primarily because vectors (such as insects and ticks) are ectothermic ("cold-blooded") and highly influenced by environmental conditions.

We are broadly interested in better understanding how climate change, in combination with land use changes, will affect the spread and frequency of vector-borne diseases. This will be achieved by using machine learning models, such as random forest and deep learning algorithms, to predict disease spread and frequency. By adopting a One Health approach, where we consider human health as interconnected with animal and environmental health, we will integrate multiple data sources (e.g., climate, land use, socio-economic factors, human health, and animal health) to improve our predictions.

As an example, in the EU project Planet4Health, we will employ various machine learning models to predict outbreaks of vector-borne diseases (leishmania and mosquito-borne diseases) in the Iberian Peninsula. The project aims to identify the model that gives the most accurate and meaningful predictions, and later incorporate it as part of an early warning systems for predicting such outbreaks.  

How to cite: Fossen, E.: Using machine learning to predict vector-borne diseases in a changing climate, EGU General Assembly 2025, Vienna, Austria, 27 Apr–2 May 2025, EGU25-6441, https://doi.org/10.5194/egusphere-egu25-6441, 2025.

EGU25-7076 | PICO | ITS2.4/CL0.5

Impact of the atmospheric composition and climate changes on the evolution of diabetes in Central Italy: the Vitality project 

Piero Di Carlo, Eleonora Aruffo, Alessandra Mascitelli, and Piero Chiacchiaretta

In the framework of the Next Generation EU program, the Vitality project was founded to 
develop different research activities related to the sustainability and environmental protection. 
One of them, called One health: Telemedicine and Environment coordinated by the University 
‘G. d’Annunzio’, Italy, is focused on the impacts of climate changes and pollutant changes, on 
the evolution of some human health diseases. Here we report the infrastructure development to 
study how temperature and other meteorological parameters, air pollutant, such us ozone, 
nitrogen oxides, PM10, impact the evolution of diabetes. One of the main activities is putting 
together the last five years of meteorological and composition data and those of hospital 
admissions and clinical analyses of more that 13,000 patients. Another activity is to study the 
real life of diabetes patients monitoring continuously their physiological parameters, 
atmospheric parameters of the region where they live and indoor air quality of their houses. 
First results of the project, strengths and weakness will be discussed.

How to cite: Di Carlo, P., Aruffo, E., Mascitelli, A., and Chiacchiaretta, P.: Impact of the atmospheric composition and climate changes on the evolution of diabetes in Central Italy: the Vitality project, EGU General Assembly 2025, Vienna, Austria, 27 Apr–2 May 2025, EGU25-7076, https://doi.org/10.5194/egusphere-egu25-7076, 2025.

EGU25-8023 | PICO | ITS2.4/CL0.5

Assessment of health risks due to climate change in Germany 

Irena Kaspar-Ott, Fabio Álvarez, and Elke Hertig

As part of the AdaptNet project, which aims to adapt and network general practitioner and specialist medical care to the health impacts of climate change, interactive maps are being produced for Germany that estimate current and future health risks. For heat, flooding, air quality, allergens, vectors and forest fires, it will be possible to obtain corresponding hazard levels at the level of districts and independent cities (corresponding to the NUTS3 regions in Germany). Estimating the health risks associated with climate change helps to avoid over- and under-adaptation of ambulant care to the consequences of climate change.

The methodology developed is based on the assessment of the most important factors for each hazard. The high spatial resolution requires a correspondingly high-resolution data base to be able to represent regional characteristics in the risk assessment. For the assessment of the current situation, data from recent years was used to include the already advanced climate change of the early 21st century. The future estimates refer to data around the year 2050.

The methodology was evaluated using two test regions (urban and rural). Very complex and data-intensive risk assessments were carried out for the two test regions and compared with a simpler approach, which was then applied to the whole of Germany.

When developing risk assessments relevant to emergency and disaster risk management in the health sector, WHO recommends that three factors be considered: hazard, exposure and vulnerability. We ensured that hazard and exposure were covered by factors in the risk assessment itself. Vulnerable groups were deliberately not included in the risk assessment, because they are individually targeted in an adaptation toolbox developed in the AdaptNet project.

How to cite: Kaspar-Ott, I., Álvarez, F., and Hertig, E.: Assessment of health risks due to climate change in Germany, EGU General Assembly 2025, Vienna, Austria, 27 Apr–2 May 2025, EGU25-8023, https://doi.org/10.5194/egusphere-egu25-8023, 2025.

EGU25-8028 | PICO | ITS2.4/CL0.5

Wealth inequality amplified the anthropogenic dust mortality 

Lulu Lian, Siyu Chen, and Jianping Huang

Unlike natural dust (NDust), which primarily affects sparsely populated areas, mitigating health disparities from anthropogenic dust (ADust) fine particulate matter (PM2.5) is crucial. ADust PM2.5 has significant effects on public health and socio-economic conditions. With internal economic inequality widening within countries globally, urbanization, and aging populations exacerbating social vulnerability, assessing the health burden of ADust PM2.5 pollution is crucial for achieving Sustainable Development Goal 3.9. This study integrates annual population and economic data with dust (include ADust and NDust) PM2.5 concentrations to evaluate mortality due to this exposure and its relationship with income inequality. Our findings reveal a significant association between income inequality and mortality due to dust PM2.5 exposure, considering variables such as the Gini index, GDP per capita, and exposed population structure. Greater income inequality and significant demographic change amplify the public health impacts of dust PM2.5 pollution. Addressing wealth distribution inequalities is essential in pollution risk research and policy-making. Optimizing wealth distribution and enhancing control of ADust can effectively reduce health risks, fostering sustainable social development.

How to cite: Lian, L., Chen, S., and Huang, J.: Wealth inequality amplified the anthropogenic dust mortality, EGU General Assembly 2025, Vienna, Austria, 27 Apr–2 May 2025, EGU25-8028, https://doi.org/10.5194/egusphere-egu25-8028, 2025.

EGU25-8258 | PICO | ITS2.4/CL0.5

Modeling climate drivers of the current and future spread of sand flies in Europe and neighboring countries with the use of wavelet transform analysis 

Suzana M Blesic, Milica Tosic, Vasilije Matic, Yoni Waitz, Oscar Kirstein, Maria Antoniou, and Carla Maia

We used wavelet transform cross-correlation analysis to inform the model of the number of sand flies as a function of meteorological and environmental variables. To that end we used historical sand fly monitoring datasets from several past and ongoing collaborations in Europe, Turkey and Israel (projects EDENext, VectorNet, CLIMOS and PLANET4HEALTH), and correlated those with the corresponding temperature, precipitation, and soil moisture data.

We were looking into how the number of these disease vectors depends on all these variables and were interested to define the time lags between the changes of the meteorological and environmental drivers and change (particularly rise) in numbers of sand flies. We were additionally interested in how the change in climatic suitability for sand fly development will influence their spread in Europe. Finally, we researched if the modelled behavior can be universal across the sand fly species, or should be developed separately by species, and climatic regions.

Our results should assist development of the early warning systems for the spread of sand fly borne diseases that can be used by public health authorities for efficient and effective preparedness.


Funding: The CLIMOS consortium is co-funded by the European Commission grant 101057690 and UKRI grants 10038150 and 10039289. The six Horizon Europe projects, BlueAdapt, CATALYSE, CLIMOS, HIGH Horizons, IDAlert, and TRIGGER, form the Climate Change and Health Cluster. The PLANET4HEALTH consortium is co-funded by the European Commission grant 101136652. The five Horizon Europe projects, GO GREEN NEXT, MOSAIC, PLANET4HEALTH, SPRINGS, and TULIP, form the Planetary Health Cluster.

How to cite: Blesic, S. M., Tosic, M., Matic, V., Waitz, Y., Kirstein, O., Antoniou, M., and Maia, C.: Modeling climate drivers of the current and future spread of sand flies in Europe and neighboring countries with the use of wavelet transform analysis, EGU General Assembly 2025, Vienna, Austria, 27 Apr–2 May 2025, EGU25-8258, https://doi.org/10.5194/egusphere-egu25-8258, 2025.

EGU25-9016 | ECS | PICO | ITS2.4/CL0.5

Modeling the perception of green and blue space using spatial exposure measurement methods 

Csilla Vamos, Anke Huss, Simon Scheider, and Roel Vermeulen

The perception of green and blue spaces has been widely recognized for its positive impact on health and can be assessed through surveys that capture individuals’ experiences of their surrounding environment. While such surveys provide data that can be seen as ground truth, their implementation is often constrained by privacy concerns, time limitations, and inefficiencies. To address these challenges, quantitative datasets—such as the Normalized Difference Vegetation Index (NDVI) and land use data—can serve as inputs for spatial measurement methods, including buffer models, street view analyses, and viewshed analyses, to estimate green and blue space exposure. However, existing spatial measurement methods often fail to align with how people perceive green and blue spaces in their environment.

This study aims to address the question: How can green and blue space perception be modeled using spatial exposure measurement methods? To explore this, three spatial measurement approaches are applied: Euclidean buffer models, Streetview analyses, and viewshed analyses. These results are converted into Spearman correlation coefficients. Additionally, survey data collected in the Netherlands, where participants assessed green and blue spaces within their residential surroundings, are also analyzed using Spearman correlations. The correlations derived from spatial measurement methods are compared with those from the survey data to evaluate how well these methods capture perceived green and blue space exposure.

The findings aim to identify which spatial measurement methods best model individuals’ perceptions and offer insights into improving urban planning and policy. By enhancing the alignment between spatial models and human perception, this research contributes to more effective evaluations of green and blue space distribution in the Netherlands and highlights areas that may benefit from additional green and blue infrastructure.


How to cite: Vamos, C., Huss, A., Scheider, S., and Vermeulen, R.: Modeling the perception of green and blue space using spatial exposure measurement methods, EGU General Assembly 2025, Vienna, Austria, 27 Apr–2 May 2025, EGU25-9016, https://doi.org/10.5194/egusphere-egu25-9016, 2025.

EGU25-9655 | ECS | PICO | ITS2.4/CL0.5

Number of Sultry Days in the Territory of Slovakia 

Kristína Szabóová

Sultriness is formed by the interaction of several weather factors. It is the state of the atmosphere when the water vapor pressure exceeds 18.7 hPa. This condition has adverse physiological effects on plants, animals and especially on the human body. For this reason, in this research, emphasis was placed on the time evolution of sultriness at the meteorological station Hurbanovo in the Slovak Republic. The paper will examine the 40-year period (1981 – 2020). The study is a continuation of the work of Štefan Kveták, who examined the previous 30-year period (1951 – 1980). We hypothesized that the number of sultry days is also increasing due to climate change. The basis of the whole assumption was hourly data from meteorological stations in the database of the Slovak Hydrometeorological Institute. As the scientific goals of the project, we preferred the categorization of sultriness according to various criteria, the evaluation of their frequency and time trends of occurrence, and we compared their development with the previous period.

How to cite: Szabóová, K.: Number of Sultry Days in the Territory of Slovakia, EGU General Assembly 2025, Vienna, Austria, 27 Apr–2 May 2025, EGU25-9655, https://doi.org/10.5194/egusphere-egu25-9655, 2025.

EGU25-12304 | PICO | ITS2.4/CL0.5

A worldwide study to estimate the relative risk to develop type 2 Diabetes Mellitus because of atmospheric pollutants exposure 

Eleonora Aruffo, Alessandra Mascitelli, Piero Chiacchiaretta, Federica Carrieri, Maria Pompea Antonia Baldassarre, Gloria Formoso, Agostino Consoli, and Piero Di Carlo

Exposure to atmospheric compounds increases the risk of type 2 diabetes. In our study, we will show a derived exposure-response curve from the relative risk to develop type 2 diabetes because of exposure to different pollutants, i.e. particulate matter (PM2.5 and PM10), nitrogen dioxide (NO2), and ozone (O3). The curve is used to estimate a worldwide map of relative risk and the percentage of the attributable burden for each pollutant, using high resolution dataset of atmospheric pollutants from satellite observations. Finally, we will show the validation of the model comparing the modeled percentage of the numbers of patients that are affected by type 2 diabates also because of pollutants exposure with a regional analysis of the attributable patients affected by type 2 diabetes.

How to cite: Aruffo, E., Mascitelli, A., Chiacchiaretta, P., Carrieri, F., Baldassarre, M. P. A., Formoso, G., Consoli, A., and Di Carlo, P.: A worldwide study to estimate the relative risk to develop type 2 Diabetes Mellitus because of atmospheric pollutants exposure, EGU General Assembly 2025, Vienna, Austria, 27 Apr–2 May 2025, EGU25-12304, https://doi.org/10.5194/egusphere-egu25-12304, 2025.

EGU25-12362 | PICO | ITS2.4/CL0.5

Leveraging AI, Large Language Models, and Co-Authorship Network Visualization to Globally Understand the Water-Energy-Food-Health Nexus 

Ilya Zaslavsky, Wael Al-Delaimy, Rabi Mohtar, and Christine Kirkpatrick

Jordan is one of the most water-scarce regions in the world, facing climate change impacts on water, energy, and food—the core components of the WEF Nexus. Health, as an additional dimension of the nexus, is being investigated through the NIH-funded Global Center on Climate Change, Water, Energy, Food, and Health Systems (GC3WEFH). A key component of the Center is its Data Hub, which focuses on providing analytical access to datasets that reflect the WEFH nexus components and assembling an open-source software ecosystem to support integrative research while adhering to FAIR (Findable, Accessible, Interoperable, Reusable) principles.

This presentation demonstrates how large language models (LLMs) are transforming our ability to explore the complex interdependencies within the WEFH Nexus. By extracting insights from interdisciplinary sources—such as scientific articles, policy documents, and environmental and health datasets—LLMs provide powerful tools for integrated data analysis and decision-making across these critical domains. Built on the SuAVE (Survey Analysis via Visual Exploration, suave.sdsc.edu) platform, the Data Hub catalog enables intuitive browsing, querying, and faceted searches of Jordan-specific datasets. To enhance accessibility, LLM-based applications are integrated into the hub, allowing natural language queries to generate tables, maps, and visualizations, revealing interrelationships among nexus indicators such as the effects of climate change on water quality and health outcomes. Additional tools evaluate the AI-readiness of datasets and implement strategies to improve their usability for machine learning applications. These innovations enable deeper insights into the WEFH Nexus, supporting simulations of system sustainability and assessing the health impacts of water, food, and energy-focused strategies in environmentally stressed regions.

To further understand the global research landscape of the nexus, we constructed and analyzed a global co-authorship network of research articles referencing all four nexus components in their titles or abstracts. Using OpenAlex, an open-access bibliographic database, and the network analysis extension of the SuAVE platform, we visualized and examined the evolution of research collaborations, emerging topics, and knowledge gaps. Our analysis revealed that over 60% of WEFH-related publications have been produced in the last four years, reflecting a rapidly expanding but still fragmented field. The co-authorship network exhibits higher clustering and fragmentation compared to more established research areas, such as the Water-Energy-Food Nexus, which is characteristic of emerging disciplines. Key topics identified within the WEFH Nexus emphasize sanitation, water quality, and water treatment (water); wellness, safety, and public health systems (health); crop yields, food security, and nutrition (food); and renewable energy and emissions reduction (energy).

While the United States leads global contributions, accounting for nearly 30% of publications in the field, significant opportunities remain to foster stronger global collaborations and reduce fragmentation in the network. The GC3WEFH is leading this effort through a multi-institutional, international collaboration focused on modeling the climate impacts on vulnerable communities in water-scarce areas of Jordan.

This work is supported by the US National Institutes of Health, Fogarty International Center, under award # 1P20TW012709-01.

How to cite: Zaslavsky, I., Al-Delaimy, W., Mohtar, R., and Kirkpatrick, C.: Leveraging AI, Large Language Models, and Co-Authorship Network Visualization to Globally Understand the Water-Energy-Food-Health Nexus, EGU General Assembly 2025, Vienna, Austria, 27 Apr–2 May 2025, EGU25-12362, https://doi.org/10.5194/egusphere-egu25-12362, 2025.

EGU25-12913 | ECS | PICO | ITS2.4/CL0.5

Impact of Heat Exposure during Pregnancy in Ethiopian Cities 

Desalew Meseret Moges, Per-Ola Olsson, Ebba Malmqvist, Masresha Tessema, Eleni Papadopoulou, and Kristoffer Mattisson

Impact of Heat Exposure during Pregnancy in Ethiopian Cities

Desalew Meseret Moges1*, Per-Ola Olsson2, Ebba Malmqvist3, Masresha Tessema1, Eleni Papadopoulou4, Kristoffer Mattisson3

1 Nutrition, Environmental Health and Non-communicable Disease Research Directorate, Ethiopian Public Health Institute, Addis Ababa, Ethiopia.

2 Department of Physical Geography and Ecosystem Science, Lund University, Sweden.

3 Division of Occupational and Environmental Medicine, Lund University, Sweden.

4 Global Health Cluster, Norwegian Institute of Public Health, Oslo, Norway.

Abstract
Climate change poses a significant public health threat, particularly for vulnerable groups such as pregnant women and children. Heat stress, when the body struggles to regulate its internal temperature due to high temperatures, presents increased health risks during pregnancy. Exposure to heat stress during pregnancy can result in adverse health outcomes for both the mother and fetus, including preterm birth, low birth weight, stillbirth, and pregnancy complications. However, research on the effects of heat exposure in epidemiological studies remains limited and inconsistent in low-resource countries like Ethiopia. This is mainly due to a lack of comprehensive data and resources. These regions often face limited infrastructure, scarce ground monitors, unreliable data collection systems, and insufficient technological support.

To address these gaps, this heat exposure study, which is part of the EU-funded ENABLE (Enabling Environments for Non-communicable Disease (NCD) risk reduction in Ethiopia) project, with the overarching aim to investigate the impact of urban heat exposure on maternal health outcomes in four Ethiopian cities: Addis Ababa, Jimma, Adama, and Harar. The present study's primary objective is to utilize remote sensing data to evaluate heat exposure.

Land Surface Temperature (LST), which measures the Earth's surface temperature, and the Discomfort Index (DI), which combines air temperature and humidity, will be used to assess heat stress. Data will be collected from satellite sensors (Landsat, MODIS; Moderate Resolution Imaging Spectroradiometer), climate data (ERA5; the fifth generation of the European Centre for Medium-Range Weather Forecasts atmospheric reanalysis of the global climate), and ground measurement from PurpleAir monitors. Heat stress will be assessed using hot days or heat waves when LST and DI exceed the 95th, 97th, or 99th percentiles for two consecutive days. This will involve creating high spatial resolution maps of heat exposure hotspots in Ethiopian cities.

The results from the present study will later be used in the ENABLE project to assess individual exposure to heat stress and effects on pregnancy outcomes. The planned epidemiological studies will include pregnant women recruited within the ENABLE project, with a target enrollment of 5000 participants, following their pregnancies from initiation till birth. Pregnancy outcomes collected from hospitals and public health records will be linked to heat metrics using GPS data from maternal residential addresses. This research provides critical insights into the intersection of climate change and urban heat stress in Ethiopia. The results can potentially inform Ethiopia’s climate-resilient urban planning and maternal health policies.

How to cite: Moges, D. M., Olsson, P.-O., Malmqvist, E., Tessema, M., Papadopoulou, E., and Mattisson, K.: Impact of Heat Exposure during Pregnancy in Ethiopian Cities, EGU General Assembly 2025, Vienna, Austria, 27 Apr–2 May 2025, EGU25-12913, https://doi.org/10.5194/egusphere-egu25-12913, 2025.

EGU25-13356 | ECS | PICO | ITS2.4/CL0.5

Short-term health impacts of PM2.5 exposure on pediatric ambulance dispatches in India using air quality data developed by machine learning 

Ayako Kawano, Sam Heft-Neal, Srinivasa Janagama, Matthew Strehlow, and Eran Bendavid

Poor ambient air quality poses a significant global health concern. However, accurate measurement remains challenging, particularly in countries like India, where ground monitors are scarce despite high expected exposure and health burdens. This lack of precise measurements impedes understanding of changes in pollution exposure over time and across populations, limiting effective public health responses. India faces severe air pollution issues, with fine particulate matter (PM2.5) levels consistently exceeding the World Health Organization (WHO) guidelines, leading to various health problems, including respiratory and cardiovascular diseases, injuries, and deaths. Existing health impact research on PM2.5 in India is limited, particularly for pediatric populations in diverse and socioeconomically varied regions.

In this study, we developed an open-source daily PM2.5 dataset at a 10 km resolution for India from 2005 to 2023 using a two-stage machine learning model. This model integrates data from satellite sensors, meteorological variables, and land-use information, validated against held-out monitor data to generate accurate daily PM2.5 estimates. We then linked this dataset with over one million pediatric ambulance dispatch records across 11 states in India from 2013 to 2015 to investigate the short-term effects of PM2.5 exposure on pediatric emergency health outcomes. We employed a fixed-effects Poisson regression model combined with an instrumental variable (IV) approach to address potential endogeneity issues, such as reverse causality and omitted variable bias. The primary instrument used is thermal inversion, a meteorological phenomenon associated with elevated PM2.5 levels. Our outcome measure is the number of ambulance dispatches per 100,000 people per day, categorized by cause (illness or injury) to reduce misclassification bias. Our fixed-effects model controls for time-invariant differences and temporal confounders, isolating effects of PM2.5. Using thermal inversion as an instrument further confirms the robustness of the causal link between short-term exposure to PM2.5 and increased ambulance dispatches.

Our analysis reveals significant associations between short-term PM2.5 exposure and increased pediatric ambulance dispatches. For all-cause and illness-related calls, we observed more than a 2% increase in ambulance dispatches per 10 μg/m3 increase in PM2.5 exposure, with cumulative lagged effects up to 7 days. Furthermore, for injury-related dispatches, there was more than a 5% increase associated with a 10 μg/m3 increase in PM2.5 exposure, with cumulative effects observed within just 0 to 1 day of exposure. These findings emphasize the severe public health implications of PM2.5 exposure on vulnerable populations, particularly children, underscoring the necessity for stringent air quality regulations and public health interventions across India.

How to cite: Kawano, A., Heft-Neal, S., Janagama, S., Strehlow, M., and Bendavid, E.: Short-term health impacts of PM2.5 exposure on pediatric ambulance dispatches in India using air quality data developed by machine learning, EGU General Assembly 2025, Vienna, Austria, 27 Apr–2 May 2025, EGU25-13356, https://doi.org/10.5194/egusphere-egu25-13356, 2025.

EGU25-14502 | ECS | PICO | ITS2.4/CL0.5

Analysing changes in temperature and pollen concentrations in Melbourne over 30 years 

Arzoo Dhankhar, Darsy Darssan, Sagnik Dey, Edwin R Lampugnani, and Nicholas J Osborne

Background: Climate change has been associated with changes in pollen allergenicity, plant phenology, and overall pollen production levels highlighting its potential implications for public health. These changes can further lead to shifts in the duration, timing, and intensity of pollen seasons, affecting both allergenic and non-allergenic plant species. 

Objective: We analysed changes in grass and other pollen concentrations, pollen seasons and daily maximum temperatures over 32 years (1990 to 2023) in Melbourne.

Methods: Daily pollen counts were collected at Parkville, Melbourne every year for three months, October to December. Pollen was categorized as grass and other with other being trees and weeds. Seasonal trend decomposition was used to analyse long term trends in daily maximum temperatures and daily pollen concentrations. Linear regression was used to analyse changes in start, end and duration of core pollen season.

Results and discussion: According to preliminary results, the daily maximum temperature increased (Est slope = 0.0001/day, p <0.01) in Melbourne over the study years while the daily pollen concentrations depicted decreasing trend (p < 0.01). Core pollen season in Melbourne had an earlier start date (Est slope = -0.34 day/year, p < 0.01) and a longer duration (p < 0.01) over the decades 1990 to 2023. The results suggest climate change might be affecting the pollen seasons but the effect on pollen concentrations may have been masked by other environmental and climatic factors. These insights could have significant implications for vulnerable population, healthcare, research and urban planning.

How to cite: Dhankhar, A., Darssan, D., Dey, S., R Lampugnani, E., and J Osborne, N.: Analysing changes in temperature and pollen concentrations in Melbourne over 30 years, EGU General Assembly 2025, Vienna, Austria, 27 Apr–2 May 2025, EGU25-14502, https://doi.org/10.5194/egusphere-egu25-14502, 2025.

EGU25-15204 | ECS | PICO | ITS2.4/CL0.5

From climate variables to health information - Predicting and monitoring mosquito-borne disease outbreaks with AeDES2 

Javier Corvillo Guerra, Verónica Torralba, Carmen González Romero, Núria Pérez-Zanón, Alba Llabrés-Brustenga, Ana Riviére-Cinnamond, and Ángel Garikoitz Muñoz

Mosquito-borne arboviruses pose a grave threat to millions of people worldwide each year, with climate change rapidly expanding hotspots of deadly Aedes-related diseases. Aware of potential compound effects regarding other important diseases, it has become imperative for health authorities to maintain a detailed surveillance of key variables that can trigger Aedes-borne epidemic episodes. Disease transmission is generally conditioned by multiple socio-economic factors, and among them, the environmental suitability for vectors and viruses to proliferate is a necessary –although not sufficient– condition that needs to be closely monitored. As such, a comprehensive service that allows stakeholders to detect and predict environmental suitability on affected hotspots is crucial for communities to better prepare in the case of present and future outbreaks.

To this end, AeDES2 is a next generation climate-and-health operational service that reproduces and improves computation of Aedes-borne Diseases Environmental Suitability over its previous version (Muñoz et al., 2020), expanding its temporal and spatial scope while simultaneously enhancing observational and forecasting quality of Aedes-related disease transmissibility. Users can consult the historical evolution of the environmental suitability values on any grid point of interest, as well as the expected future evolution up to three seasons in advance. Aside from environmental suitability values, health authorities can additionally utilize AeDES2 to analyse the estimated percentage of population at risk –crucial for governing bodies to implement control measures in order to reduce the spread of the disease.

AeDES2 incorporates four different environmental suitability models, translating temperature and precipitation values into environmental suitability outputs while considering epidemiological factors for transmission probability. Its monitoring system generates an up-to-date 12-member ensemble reference, providing a continuously updated historical sequence of environmental suitability values. On the forecasting side, AeDES2 builds on its predecessor’s pattern-based multi-model calibration, by assimilating state-of-the-art calibration methods such as causality-based calibration or multi-calibration techniques, aiming to reliably reproduce key non-linear patterns that are used as predictors in the cross-validated forecast system.

How to cite: Corvillo Guerra, J., Torralba, V., González Romero, C., Pérez-Zanón, N., Llabrés-Brustenga, A., Riviére-Cinnamond, A., and Garikoitz Muñoz, Á.: From climate variables to health information - Predicting and monitoring mosquito-borne disease outbreaks with AeDES2, EGU General Assembly 2025, Vienna, Austria, 27 Apr–2 May 2025, EGU25-15204, https://doi.org/10.5194/egusphere-egu25-15204, 2025.

EGU25-16611 | PICO | ITS2.4/CL0.5

Predicting Vector-Borne Disease Risk using Earth Observation and Machine Learning: A Case Study in northern Italy 

Debhora Bonfiglio, Selene Bianco, Matteo Maragliano, Valeria Corcione, Giovanna Chiara Rodi, Stefano Marangoni, Paolo Roberto, and Andrea Mosca

Floodings exemplify the interconnection between climate change, environmental exposures, and human health. They are often characterized by the presence of stagnant water, which makes the habitat particularly favourable for the proliferation of vectors of arboviruses in during their reproductivity seasons. This poses significant threats to public health, because the geographical expansion of these vectors is responsible of an increase of the diffusion of imported infectious diseases such as dengue and chikungunya, together with other arbovirosis like West Nile, Usutu, Toscana virus infections and tick-borne encephalitis, which are endemic in Italy. This diffusion requires proactive monitoring and mitigation strategies. The monitoring of the distribution of these vectors is usually performed by installing attractive traps in the territory. However, the sites of these traps cannot be uniformly distributed over the territory. Therefore, it is useful to support them with other warning methods to identify areas with the ideal characteristics of ecological niches for these insects and thus at risk of becoming outbreaks for arbovirosis. 

The EASTERN project focuses on both direct and indirect consequences of flooding, by exploiting Earth Observation (EO) and meteorological data to implement Machine Learning (ML) models able to predict flood-related risks. One of the project’s use cases is dedicated to the implementation of ML-based predictive tools to identify areas suitable for vector proliferation, using meteorological parameters and satellite imagery.  

The meteorological parameters considered are humidity, temperature, wind speed and rain, which are known in literature as correlated with vector spreading. From optical imagery (Sentinel-2 constellation) ecological indexes like Normalized Difference Vegetation Index (NDVI) and Normalized Difference Moisture Index (NDMI) are retrieved. Entomological data were collected by IPLA S.p.A. The species of mosquitos that have been considered are Aedes caspius and Culex pipiens. Around 50 trap sites located in the Piedmont region have been monitored every two weeks from June to October. Data used for model training are referred to years from 2017 to 2023. 

The amount of collected mosquitos for each species has been divided into classes. Separated predictive models have been trained for each species. The dataset is highly unbalanced. Since most of the collected data have values proximal to 0 and only few sites collect up to thousands of vectors, the effect of the imbalance has need neutralized. For both species, temperature, NDMI, NDVI, wind speed and humidity are the predictors with the highest feature importance for this model. 

The synergy between satellite imagery, meteorological data and ML models, can be considered a promising tool to monitor vectors’ populations and assess associated health risks, enabling targeted interventions and strategic placement of monitoring traps. Our approach addresses the gaps in traditional monitoring methods, particularly in data-limited regions, and will be useful to provide risk maps and early warnings in case of flooding, crucial for informed decision-making. 
 
EASTERN project received funding from Cascade funding calls of NODES Program, supported by MUR - M4C2 1.5 of PNRR funded by the EU - NextGenerationEU (Grant ECS00000036) 

How to cite: Bonfiglio, D., Bianco, S., Maragliano, M., Corcione, V., Rodi, G. C., Marangoni, S., Roberto, P., and Mosca, A.: Predicting Vector-Borne Disease Risk using Earth Observation and Machine Learning: A Case Study in northern Italy, EGU General Assembly 2025, Vienna, Austria, 27 Apr–2 May 2025, EGU25-16611, https://doi.org/10.5194/egusphere-egu25-16611, 2025.

EGU25-17438 | ECS | PICO | ITS2.4/CL0.5

Assessing the Impact of Climate Change on Malaria Transmission in Kenya's Lake Victoria Basin 

Henry Engelhardt, Mame Diarra Bousso Dieng, Maximilian Schwarz, Martin Volk, and Fred Fokko Hattermann

In large parts of Africa, including the Lake Victoria Basin, malaria continues to be a major public health challenge, causing significant morbidity and mortality despite advancements in treatment and prevention. Climate change has the potential to exacerbate the problem because the disease vectors depend on non-permanent open water bodies for mosquito breeding and certain temperature thresholds for larval development. Climate-induced changes in hydrology, such as shifts in the timing and intensity of rainy seasons, combined with rising temperatures, may extend malaria risk to higher altitudes and new areas, necessitating preventive measures to counteract new transmission patterns.

In this study, we assess the impact of climate change on malaria transmission in the Lake Victoria Basin in Kenya, focusing on changes in mosquito breeding sites and temperature. To improve the representation of the breeding sites, the malaria transmission model VECTRI was coupled with the eco-hydrological model SWIM, which was enhanced with a pond module to capture non-permanent water bodies. We evaluated the model performance using Sentinel-1 satellite-derived water occurrence data and malaria incidence data obtained from health records in Kenya's Lake Victoria basin. To obtain high-resolution insights into the future of malaria transmission, projections were made using an ensemble of nine CMIP6 GCMs, downscaled to 1 km using the CHELSA downscaling method, covering several SSP scenarios.

The results of the coupled approach were promising in simulating water occurrence patterns and malaria incidence, demonstrating its potential as a valuable tool for predicting the effects of climate change on malaria transmission by capturing the interplay between climate, hydrology, and malaria dynamics. This research can guide the development of targeted public health interventions and adaptation strategies to mitigate the effects of climate change in malaria-endemic and at-risk regions.

How to cite: Engelhardt, H., Dieng, M. D. B., Schwarz, M., Volk, M., and Hattermann, F. F.: Assessing the Impact of Climate Change on Malaria Transmission in Kenya's Lake Victoria Basin, EGU General Assembly 2025, Vienna, Austria, 27 Apr–2 May 2025, EGU25-17438, https://doi.org/10.5194/egusphere-egu25-17438, 2025.

EGU25-18273 | PICO | ITS2.4/CL0.5

Impacts of tropical deforestation on local climate and human health 

Carly Reddington, Callum Smith, Edward Butt, Jessica Baker, Beatriz Oliveira, Edmund Yamba, and Dominick Spracklen

Tropical deforestation causes local climate warming and is a potential risk to human health. Previous studies have shown tropical deforestation causes increased heat stress and reduces safe outdoor working hours, but the excess mortality due to warming from deforestation has not been quantified. Here we use remote sensing Earth observations to make the first pan-tropical assessment of the population-weighted warming due to tropical deforestation and the associated heat-related mortality burden. We focus our analysis on tropical deforestation that has occurred during 2001 to 2020. We use spatially explicit satellite datasets of annual forest cover change and land surface temperature to identify areas of surface warming that are co-located with forest loss and use data on population distribution to map population-weighted exposure to this warming. We use data on non-accidental mortality combined with relationships between heat exposure and excess mortality from the literature, to estimate the heat-attributable excess mortality due to nearby tropical deforestation. We examine how population exposure to deforestation-induced warming varies by region and by the degree of tropical forest loss. Overall, our analysis shows tropical deforestation during 2001 to 2020 exposed over 350 million people to local climate warming with population-weighted daytime land surface warming of 0.27°C. We estimate this warming results in around 28,000 additional deaths per year, accounting for 39% of the total heat-related mortality burden caused by global climate change and deforestation combined. The impacted populations (those living near deforested areas) are predominantly from lower-income groups, often traditional and indigenous communities, with limited access to adaptive measures to protect against the impacts of climate warming. Our analysis provides important evidence of the negative human health impacts of tropical deforestation at local, regional and national scales.

How to cite: Reddington, C., Smith, C., Butt, E., Baker, J., Oliveira, B., Yamba, E., and Spracklen, D.: Impacts of tropical deforestation on local climate and human health, EGU General Assembly 2025, Vienna, Austria, 27 Apr–2 May 2025, EGU25-18273, https://doi.org/10.5194/egusphere-egu25-18273, 2025.

EGU25-19538 | ECS | PICO | ITS2.4/CL0.5

Storyline approaches to characterize population health impacts of future climate extremes 

Elena Raffetti, Gabriele Messori, and Maria Rusca

Building systems resilient to the societal and health impacts of future climate extremes requires actionable, context-based scenarios. Historically, public health and epidemiology have relied on retrospective analyses, which can be inadequate for preparing for unprecedented events.

To overcome this, we propose a methodology to develop context-based scenarios of health impacts (e.g. cardiovascular mortality) from future climate extremes also considering adaptation mechanisms (e.g. early warning system, health care improvements). This builds upon a methodology introduced by Shepherd et al. in 2018, which has been further developed for use on societal impacts including population health. The approach uses qualitative integration of various components to develop context-based scenarios. Here are some examples of these components:

  • Historical and Future Climate Data: Using historical climate data and numerical projections to create geographically situated scenarios of extreme weather events.
  • Analysis of Past Extremes: Considering health impacts from past extreme events of different magnitudes within the same geographic area.
  • Cross-contextual Analysis: Considering health impacts from past extreme events in different settings and conceptually applying those scenarios, while considering contextual differences.
  • Awareness: Considering the level of awareness within the population regarding climate extremes and their potential health impacts captured using semi-structure interviews, which can influence community preparedness and adaptation.

This approach is designed to leverage the insights from natural and critical social sciences while making room for methodological and epistemological differences. The integration of quantitative and qualitative data will occur through an iterative process, where both types of data complement each other in developing context-based scenarios. Quantitative data will provide the statistical foundation (e.g., projected cardiovascular mortality), while qualitative data will add depth by capturing social dynamics and adaptation strategies. The two will be synthesized in the final scenarios to ensure a comprehensive understanding of the impacts of climate extremes on different population groups.

How to cite: Raffetti, E., Messori, G., and Rusca, M.: Storyline approaches to characterize population health impacts of future climate extremes, EGU General Assembly 2025, Vienna, Austria, 27 Apr–2 May 2025, EGU25-19538, https://doi.org/10.5194/egusphere-egu25-19538, 2025.

EGU25-19612 | PICO | ITS2.4/CL0.5 | Highlight

Building a pathway to improve climate and health research: the case of the TRIGGER project  

Silvana Di Sabatino and the TRIGGER Consortium

The TRIGGER project aims to delve into the complexity inherent in climate-health interactions to gather sound knowledge to advice on policy priorities at local and European levels in consideration of the projected climate change (CC) in Europe. Specifically, the project focuses on achieving a better integration between personal health protection and the environment in which choices at personal level can be made to mitigate climate-related health risks. To address this challenge, TRIGGER has envisaged activities in a wide range of disciplines (supported by the diverse expertise of its consortium) developed in several real-world environments to account for the diversity of climate and social, economic and cultural richness of the European continent. TRIGGER's engines are the Climate-Health Connections Labs (CHC Labs): five selected Labs built in European cities, strategically distributed from south to north Europe to capture the above-mentioned diversity. The role of CHCL is to act as hub for the various TRIGGER activities. Each represents a specific environment and climate-related risks ranging from heat waves to ai pollution. Each Lab co-design and implement clinical studies, namely the CrossCLAVIS (cross-sectional study), the LongCLAVIS (longitudinal study) and a retrospective study (RetroCLAVIS) to gather new information about climate-related health conditions and use refined climate and health indicators to understand criticalities and work on mitigation of those. In this presentation we report on the progress achieved so far. The focus will be on the methodology to derive meteo-climate downscaled data and to provide examples of improved estimate of health risks through a number of selected indicators. The specific indicators refer to those calculated at the CHCL level based on output of downscaled simulations and health data collected during the CrossCLAVIS study. 

 This study is funded by the Horizon Europe TRIGGER project (grant no. 101057739) 

How to cite: Di Sabatino, S. and the TRIGGER Consortium: Building a pathway to improve climate and health research: the case of the TRIGGER project , EGU General Assembly 2025, Vienna, Austria, 27 Apr–2 May 2025, EGU25-19612, https://doi.org/10.5194/egusphere-egu25-19612, 2025.

Extremes in the Earth System are significant drivers of adverse population health outcomes. To fully understand potential future impacts on our health, Earth System Models (ESMs) and their output are increasingly integrated with and connected to Planetary Health applications.

To emphasize the role of ESM in understanding interactions between natural systems and their implications for human health, we conduct a systematic literature review focusing on the linkage between Earth System Modeling and Planetary Health applications.  By analyzing the use of ESM data in health applications, we identify variables across different Earth System spheres, evaluate their reliability, and highlight gaps in translating ESM outputs into health applications. Variables such as temperature, precipitation, and air quality are explored for their direct and indirect effects on health outcomes, including increased risks of infectious diseases, heat stress, and malnutrition.

The reviewed studies employ diverse Earth System Models (ESMs) and dynamic downscaling techniques to project future health scenarios, mainly relying on simple linkage rather than fully coupling Planetary Health applications. Key findings reveal substantial increases in mortality and morbidity rates linked to cardiovascular and respiratory diseases, exacerbated by prolonged exposure to extreme heat and degraded air quality. For instance, regional analyses indicate significant health risks in densely populated urban areas and low-income regions, emphasizing the need for tailored mitigation strategies. Notably, applications such as simulating the impacts of heatwaves on mortality in Europe and assessing adaptation measures like green space-based cooling systems exemplify the need for integration of ESM and Planetary Health.

Our synthesis highlights the critical interplay of socioeconomic, demographic, and Earth System factors in shaping health vulnerabilities, underscoring the importance of intersectionality in climate health research. Advancing the integration of ESM and Planetary Health is crucial for promoting climate resilience and equity in health outcomes.

How to cite: Thiele-Eich, I., Rahmen, M., and Falkenberg, T.: Linking Earth System Modeling and Planetary Health: A Systematic Literature Analysis of Interactions and Impacts on Human Health, EGU General Assembly 2025, Vienna, Austria, 27 Apr–2 May 2025, EGU25-19710, https://doi.org/10.5194/egusphere-egu25-19710, 2025.

For understanding localized hydrological and climatological processes, downscaling gridded precipitation data to finer spatial resolutions is a crucial prerequisite. For a densely populated country like India, accurate downscaled data is crucial for building resilience to climate change impacts, supporting adaptation efforts, and enhancing disaster management. In recent years, deep learning (DL) has emerged as a powerful tool for advancing Earth system modelling and climate data downscaling. This study presents a comprehensive intercomparison of deep learning architectures, for downscaling precipitation across India. A few efficient DL architectures from recent studies are chosen for intercomparison such as simple dense, simple convolutional neural network, Fast Super Resolution Convolutional Neural Network (FSRCNN), Super Resolution Deep Residual Network (SRDRN), U-Net, and Nest-U-Net. The experiments are designed in synthetic style by using coarsened ECMWF Reanalysis version 5 (ERA5; 1ox1o) daily variables as the inputs and high-resolution Indian Monsoon Data Assimilation and Analysis reanalysis (IMDAA; 0.12ox0.12o) daily precipitation as training labels and benchmarks for the evaluation. Training and validation are conducted for the period 1980-2014, afterwards the trained models are evaluated on data from 2015-2020. To reduce the biases induced by the highly positive-skewed precipitation data and to enhance the model performance on extreme events, a weighted mean absolute error is implemented for training. The performance of the DL models is also compared with the Bias Correction and Spatial Disaggregation (BCSD), a renowned statistical downscaling method. The results indicate that all deep learning DL models outperformed the BCSD method. Among the DL models, U-Net and Nest-U-Net demonstrated superior performance in capturing fine-scale precipitation patterns and extreme precipitation events, owing to their encoder-decoder architecture, which effectively learns spatial features at different scales. In contrast, the FSRCNN and SRDRN produced results with slightly lower precision than the U-Net models, but at a significantly reduced inference time, making them more efficient for faster data generation. The findings underscore the potential of deep learning for improving regional precipitation downscaling across India, offering a promising alternative to traditional statistical methods like BCSD in handling complex, non-linear relationships inherent in climate data.

How to cite: Murukesh, M. and Kumar, P.: Comparative analysis of deep learning architectures trained for downscaling gridded precipitation across India, EGU General Assembly 2025, Vienna, Austria, 27 Apr–2 May 2025, EGU25-676, https://doi.org/10.5194/egusphere-egu25-676, 2025.

EGU25-1650 | ECS | Posters on site | ITS1.1/CL0.9

DiffScale: Towards Continuous Downscaling and Bias Correction in Subseasonal Wind Speed Forecasts 

Maximilian Springenberg, Noelia Otero Felipe, and Jackie Ma

Renewable resources are strongly dependent on local and large-scale weather situations. Skillful subseasonal to seasonal (S2S) forecasts -beyond two weeks and up to two months- can offer significant socioeconomic advantages to the energy sector. In particular, accurate wind speed forecasts result in optimized generation of wind-based electric power. This study aims to enhance wind speed predictions using a diffusion model with classifier-free guidance to downscale S2S forecasts of surface wind speed. We propose DiffScale, a diffusion model that super-resolves spatial information for continuous downscaling factors and lead times. Leveraging weather priors as guidance for the generative process of diffusion models, we adopt the perspective of conditional probabilities on sampling super-resolved S2S forecasts. We aim to directly estimate the density, associated with the target S2S forecasts at different spatial resolutions and lead times without auto-regression or sequence prediction, resulting in an efficient and flexible model. Synthetic experiments were designed to super-resolve wind speed S2S forecasts from the European Center for Medium-Range Weather Forecast (ECMWF) from a coarse resolution to a finer resolution of data from ERA5, which serves as a high-resolution target, derived from reanalysis data. We achieve a significant increase in the quality of predictions, utilizing the proposed diffusion model for continuous downscaling and bias correction of the ECMWF forecasts.

How to cite: Springenberg, M., Otero Felipe, N., and Ma, J.: DiffScale: Towards Continuous Downscaling and Bias Correction in Subseasonal Wind Speed Forecasts, EGU General Assembly 2025, Vienna, Austria, 27 Apr–2 May 2025, EGU25-1650, https://doi.org/10.5194/egusphere-egu25-1650, 2025.

EGU25-2394 | Posters on site | ITS1.1/CL0.9

Machine Learning to Construct Daily, Gap-Free, Long-Term Stratospheric Trace Gases Data Sets 

Sandip Dhomse and Martyn Chipperfield

Understanding the complex relationship between trace gases as well as undestanding various source and sink pathways in the atmsophere need good qualtity continuous and reliable datasets. However, obtaining comprehensive long-term profiles for key trace gases is a significant challenge. We have initiated a new research strand to consrtuct  long term data using machine learning. Output from a  Chemical Transport Model (CTM) and observational data from satellite instruments (such as HALOE and ACE-FTS) is merged using machine learning. This integration results in the creation of daily, gap-free datasets for six crucial gases: ozone (O3), methane (CH4), hydrogen fluoride (HF), water vapour (H2O), hydrogen chloride (HCl), and nitrous oxide (N2O) from 1991 to 2021.

Chlorofluorocarbons (CFCs) are a critical source of chlorine that controls stratospheric ozone losses. Currently, ACE-FTS is the only instrument that provides sparse but daily measurements of these gases. Monitoring changes in these ozone-depleting substances, which are now banned, helps assess the effectiveness of the Montreal Protocol. We have initiated the construction of gap-free stratospheric profile data for CFC-11 as a subsequent step.

We use a regression model to estimate the relationship between various tracers in a CTM and the differences between the CTM output field and the observations, assuming all errors are due to the CTM setup. Once the regression model is trained for observational collocations, it is used to estimate biases for all the CTM grid points. To enhance accuracy, we employed various regression models and found that XGBoost regression outperforms other methods. ACE-FTS v5.2 data (2004-present) is used to train (70%) and test (30%) the XGBoost performance.

Our results demonstrate excellent agreement between the constructed profiles and satellite measurement-based datasets. Biases in TCOM data sets, when compared to evaluation profiles, are consistently below 10% for mid-high latitudes and 50% for the low latitudes, across the stratosphere. The constructed daily zonal mean profile datasets, spanning altitudes from 15 to 60 km (or pressure levels from 300 to 0.1 hPa), are publicly accessible through Zenodo repositories.

     CH4:       https://doi.org/10.5281/zenodo.7293740   
     N2O:          https://doi.org/10.5281/zenodo.7386001
     HCl :         https://doi.org/10.5281/zenodo.7608194
     HF:        https://doi.org/10.5281/zenodo.7607564
     O3:         https://doi.org/10.5281/zenodo.7833154 
     H2O:          https://doi.org/10.5281/zenodo.7912904
     CFC-11:    https://doi.org/10.5281/zenodo.11526073  
     CFC-12:      https://doi.org/10.5281/zenodo.12548528
     COF2:        https://doi.org/10.5281/zenodo.12551268


In an upcoming iteration, we are enhancing the algorithm as well as add more species in the current setup. We believe these data sets would provide valuable insights into the dynamics of stratospheric trace gases, furthering our understanding of their behaviour and impact on the climate.

References:

Dhomse, S. S., et al.,: ML-TOMCAT: machine-learning-based satellite-corrected global stratospheric ozone profile data set from a chemical transport model, Earth Syst. Sci. Data, 13, 5711–5729, https://doi.org/10.5194/essd-13-5711-2021, 2021.

Dhomse, S. S. and Chipperfield, M. P.: Using machine learning to construct TOMCAT model and occultation measurement-based stratospheri
c methane (TCOM-CH4) and nitrous oxide (TCOM-N2O) profile data sets, Earth Syst. Sci. Data, 15, 5105–5120, https://doi.org/10.5194/essd-15-5105-2023, 2023.

How to cite: Dhomse, S. and Chipperfield, M.: Machine Learning to Construct Daily, Gap-Free, Long-Term Stratospheric Trace Gases Data Sets, EGU General Assembly 2025, Vienna, Austria, 27 Apr–2 May 2025, EGU25-2394, https://doi.org/10.5194/egusphere-egu25-2394, 2025.

EGU25-3610 | ECS | Posters on site | ITS1.1/CL0.9

Uncertainty quantification through the climate analogue identification process by ClimaDist 

Chi-ju Chen, Pei-Chun Chen, Chien-Yu Tseng, and Li-Pen Wang

Analogue has been a widely-used concept in atmospheric science, particularly useful in weather forecasting and climate-related studies. The underlying idea is straightforward. An analogue is identified by determining its level of similarity to a reference weather or climate condition, traditionally, via computing a Euclidean distance. Recently, a deep-learning based framework, called ClimaDist, was proposed for climate analogue identification, found to outperform traditional Euclidean distance metrics. Despite the promising performance, similarly to many deep-learning models, it is challenging to estimate the uncertainty of the analogue searching process undertaken by ClimaDist. This hinders its applicability to real-world operations, especially for those requiring decision making.

To address this challenge, this study extends the capabilities of ClimaDist through incorporating a uncertainty quantification method, together with explainable AI (XAI) techniques. Specifically, the Evidential Deep Learning (EDL) approach is applied to the analogue searching process undertaken by the ClimaDist. This enables effective quantification of the uncertainty associated with data and model, respectively, while exploring their relationship with overall model performance. Two distinct scenarios are applied to these two models using data that were seen and unseen during the training processing. 

An experiment has been designed to verify the proposed approach using ERA5 data over a square domain centred at the Nettebach (Germany) covering the geographic range of 55°N to 47°N and 3°E to 11°E. Two ClimaDist models, one with the best validation performance and the other one best training performance, respectively, are used for comparison. These models are assessed based on the similarity of the found analogues and via under two distinct scenarios –with input data seen and unseen during the training process, respectively. Preliminary results suggest that the integration of uncertainty quantification enhances the interpretability and reliability of analogue identification, enabling improved downstream applications. Specifically, high model uncertainty can be highlighted by the proposed approach while fully unseen data is used as input. This not only provides valuable insight in knowing the capacity of the underlying model but also allows the optimization of resource usage.

How to cite: Chen, C., Chen, P.-C., Tseng, C.-Y., and Wang, L.-P.: Uncertainty quantification through the climate analogue identification process by ClimaDist, EGU General Assembly 2025, Vienna, Austria, 27 Apr–2 May 2025, EGU25-3610, https://doi.org/10.5194/egusphere-egu25-3610, 2025.

EGU25-4595 | ECS | Orals | ITS1.1/CL0.9

Climate data interpolation with deep neural networks: a comprehensive dataset of historical and future climate for Africa 

Sarah Namiiro, Andreas Hamann, Tongli Wang, Dante Castellanos-Acuña, and Colin Mahoney

Databases of high-resolution interpolated climate data are essential for analyzing the impacts of past climate events and for developing climate change adaptation strategies for managed and natural ecosystems.  To enable such efforts, we contribute an accessible, comprehensive database of interpolated climate data for Africa that includes monthly, annual, decadal, and 30-year normal climate data for the last 120 years (1901 to present) as well as multi-model CMIP6 climate change projections for the 21st century. The database includes variables relevant for ecological research and infrastructure planning, and comprises more than 25,000 climate grids that can be queried with a provided ClimateAF software package. In addition, 30 arcsecond (~1km) resolution gridded data, generated by the software, are available for download (https://tinyurl.com/ClimateAF). The climate grids were developed with a three-step approach, using thin-plate spline interpolations of weather station data as a first approximation, subsequent fine-tuning with deep neural networks to capture medium-scale local weather patterns, and lastly dynamic lapse-rate based downscaling to a user-selected resolution, or to scale-free point estimates with the ClimateAF software package. The study contributes a novel deep learning approach to model orographic precipitation, rain shadows, lake and coastal effects, including the influences of wind direction and strength. The climate estimates were optimized and cross-validated with a checkerboard approach to ensure that training data was spatially distanced from validation data. We conclude with a discussion of applications and limitations of this database.

How to cite: Namiiro, S., Hamann, A., Wang, T., Castellanos-Acuña, D., and Mahoney, C.: Climate data interpolation with deep neural networks: a comprehensive dataset of historical and future climate for Africa, EGU General Assembly 2025, Vienna, Austria, 27 Apr–2 May 2025, EGU25-4595, https://doi.org/10.5194/egusphere-egu25-4595, 2025.

EGU25-6462 | ECS | Orals | ITS1.1/CL0.9

Using machine learning to distinguish km-scale climate models and observations on a regional scale 

Maximilian Meindl, Aiko Voigt, and Lukas Brunner

The use of machine learning (ML) for climate science has attracted considerable attention within the last few years. A number of recent studies have used ML to extract information from global climate data (e.g. regional downscaling), predict future states of the climate system and evaluate models against observations. In particular, Brunner and Sippel (2023) showed that low-resolution global climate models and observations can reliably be distinguished based on the global distribution of daily temperature, even after removing the mean model bias. ML is thus able to isolate fundamental differences between models and observations even in the presence of substantial internal variability. This raises the questions of whether ML can also distinguish between model and observational data on a regional scale, whether ML is as successful for km-scale models as for coarse-resolution models, and whether more complex bias correction methods reduce the success of ML.

To answer these questions, we use daily temperature fields over Austria, a topographically very complex domain. As training data, we use 200 different, randomly drawn days from each of the 13 ÖKS15 bias-corrected EURO-CORDEX models with an output resolution of 1km, resulting in 2600 samples labeled “model” which are matched by the same number of random days labeled “observation” from the SPARTACUS observation dataset. We use the binary classification approach to distinguish between the two classes of models versus observations. A logistic regression classifier is trained to determine the probability that a daily temperature field belongs to one of the two classes. In order to evaluate the ML algorithm subsequently, all days from the out-of-sample 10-year period 2005-2014 are used as test data.

The ML algorithm succeeds in correctly identifying the overwhelming majority of the test data for the setup used, resulting in an accuracy of 99%. The  results remain consistent even when a different sample of 2x2600 random training days is used. In contrast to more complex classifiers, such as a convolutional neural network (CNN), the learned coefficients from the logistic regression allow insights into the spatial patterns that are crucial for distinguishing between models and observations. While the performance of climate models is typically evaluated on climatological timescales, our results highlight that such classifiers can be used to identify patterns of structural model biases. Our method hence offers a computationally efficient approach for model evaluation, especially when handling km-scale climate model data on a regional domain.

References:
Brunner L. and Sippel S. (2023): Identifying climate models based on their daily output using machine learning, Environmental Data Science, https://doi.org/10.1017/eds.2023.23

How to cite: Meindl, M., Voigt, A., and Brunner, L.: Using machine learning to distinguish km-scale climate models and observations on a regional scale, EGU General Assembly 2025, Vienna, Austria, 27 Apr–2 May 2025, EGU25-6462, https://doi.org/10.5194/egusphere-egu25-6462, 2025.

North Atlantic sea surface temperatures (NASST), particularly in the subpolar region, exhibit some of the highest predictability across global oceanic systems. However, the relative contributions of atmospheric versus oceanic influences on the long term NASST variability remains ambiguous. In this study, we utilize neural networks (NNs) to assess the significance of various atmospheric and oceanic predictors in forecasting the state of NASST within the CANARI Large Ensemble, which employs the Met Office CMIP6 physical climate model (HadGEM3-GC3.1) at a high-resolution atmospheric scale (N216, approximately 60 km at midlatitudes) and a 1/4° resolution for oceanic data. The ensemble comprises forty members, driven by CMIP6 historical data and SSP3-7.0 scenarios for the period from 1950 to 2099. First, we evaluate the ability of the NNs to anticipate the phases of long term (multidecadal variability) using observational datasets, thereby investigating the consistency of physical processes influencing NASST variability between modeled predictions and real-world observations. Second, the research delves into how the interplay between oceanic and atmospheric predictors, alongside external forcings and internal variability (atmospheric noise), impacts the machine learning-based predictions and we use explainable AI techniques to identify the sources of predictability and to pinpoint physical mechanisms and regions crucial for accurate NN forecasts.


How to cite: Colfescu, I.: Explainable neural nets for disentangling sources of predictability in the North Atlantic Sea Surface Temperature (NASST), EGU General Assembly 2025, Vienna, Austria, 27 Apr–2 May 2025, EGU25-6680, https://doi.org/10.5194/egusphere-egu25-6680, 2025.

EGU25-7404 | Posters on site | ITS1.1/CL0.9

Stochastic recurrent neural network for modeling atmospheric regimes 

Andrei Gavrilov, Dmitry Mukhin, Semyon Safonov, and Roman Samoilov

Complex multiscale dynamics of the atmosphere in extratropical latitudes includes various persistent atmospheric regimes with the residence time up to several weeks. Identification, simulation and prediction of such dynamics remains one of the challenging problems. In this work we use a stochastic recurrent neural network (RNN) with specific architecture to address this problem, appealing to RNN’s ability to handle memory effects well. The proposed RNN connects two types of variables: (i) a low-dimensional representation of the physical variables via Principal Component Analysis (PCA), and (ii) Kernel PCA variables which serve to better represent the target atmospheric regimes [1]. The stochastic component of the RNN has a simple form which allows us to analytically write Bayesian log-posterior and log-likelihood functions to train and cross-validate the model given the particular dataset.
Using the observed and climate-model-generated winter geopotential height data in the Northern Hemisphere, we show that the proposed stochastic model is able to reproduce/predict various dynamical properties and distributions of the target regimes in the kernel space, as well as to reconstruct kernel variables from a low-dimensional representation of the original spatio-temporal field.

References
1. Mukhin et al. (2022). Revealing recurrent regimes of mid-latitude atmospheric variability using novel machine learning method. Chaos: An Interdisciplinary Journal of Nonlinear Science, 32(11). 

How to cite: Gavrilov, A., Mukhin, D., Safonov, S., and Samoilov, R.: Stochastic recurrent neural network for modeling atmospheric regimes, EGU General Assembly 2025, Vienna, Austria, 27 Apr–2 May 2025, EGU25-7404, https://doi.org/10.5194/egusphere-egu25-7404, 2025.

EGU25-8105 | ECS | Posters on site | ITS1.1/CL0.9

Streamflow forecasting in the Ebro river basin using Machine Learning (ML) and a physical mass constraint 

Inmaculada González Planet and Carmelo Juez

In hydrology, the use of machine learning (ML) has gained traction due to its ability to provide alternative or complementary approaches to traditional process-based modelling. These models identify numerical patterns in time series data without needing to solve conservation equations. This flexibility enables hydrological calculations in areas where data sources are incomplete or non-existent.
Studies benchmarking ML models (SVM, RNN, CNN) against process-based models have shown that ML models deliver promising results with lower computational cost and less information about the physical processes they are modelling. Consequently, they can effectively utilize spatially discretized physical data on a large scale.
This study designs a Long Short-Term Memory (LSTM) neural network to learn sequential relationships between atmospheric, climatic and geographic features and daily streamflow data from 39 headwater gauging stations in the northern Ebro river basin. LSTM models include an internal state that can store information and learn long-term dependencies, enabling them to model sequential data effectively. However, the numerical patterns identified by LSTM models do not inherently respect universal physical laws, such as the conservation of mass.
To address the limitation, the Mass-Conserving LSTM (MC-LSTM) model has been employed and compared with the standard LSTM model. The MC-LSTM model introduces a modified cell structure that adheres to conservation laws by extending the learning bias to model the redistribution of mass.
This analysis highlights not only the high accuracy of LSTM models in predictive hydrologic modelling but also the critical importance of integrating physics-based features to enable ML models to effectively capture the hydrological dynamics of the basin.
Acknowledgments: This work is funded by the European Research Council (ERC) through the Horizon Europe 2021 Starting Grant program under REA grant agreement number 101039181-SED@HEAD.

How to cite: González Planet, I. and Juez, C.: Streamflow forecasting in the Ebro river basin using Machine Learning (ML) and a physical mass constraint, EGU General Assembly 2025, Vienna, Austria, 27 Apr–2 May 2025, EGU25-8105, https://doi.org/10.5194/egusphere-egu25-8105, 2025.

EGU25-8363 | Posters on site | ITS1.1/CL0.9

Causal Weighting for Climate Projections 

Gustau Camps-Valls, Kevin Debeire, Gherardo Varando, Jakob Runge, and Veronika Eyring

Accurate climate projections are critical for understanding climate change and to design adaptation and mitigation strategies. Weighting schemes that aggregate a range of climate model projections are widely used to provide more reliable estimates of future climate conditions. Recently, causal discovery has been successfully introduced in the weighting schemes to constrain uncertainties in climate model projections based on the performance and interdependence of climate models. However, the previous methodologies typically (and strongly) only utilize a single metric, the F1 score of performance and similarity between each climate model and observational data,  to compare the different models' causal structures. Here, we introduce alternative and more sophisticated causal weighting schemes inspired by the theory of kernel methods and Gaussian processes to compare causal graphs directly in suitable reproducing kernel Hilbert spaces. In addition, we propose alternative causal weighting schemes that rely on interventions, graph-based distances, and counterfactual evaluations. We will evaluate the causal weighting strategies in various synthetic and CMIP6 model datasets. 

How to cite: Camps-Valls, G., Debeire, K., Varando, G., Runge, J., and Eyring, V.: Causal Weighting for Climate Projections, EGU General Assembly 2025, Vienna, Austria, 27 Apr–2 May 2025, EGU25-8363, https://doi.org/10.5194/egusphere-egu25-8363, 2025.

EGU25-9358 | ECS | Orals | ITS1.1/CL0.9

A Highly Efficient Machine Learning-based Ozone Parameterization for Climate Models 

Yiling Ma, Luke Abraham, Stefan Versick, Roland Ruhnke, Peter Braesicke, and Peer Nowack

Atmospheric ozone is a crucial absorber of solar radiation and an important greenhouse gas. However, explicitly representing ozone in climate models is computationally expensive. A recent study introduced a simple linear machine learning-based ozone parameterization scheme (mloz) for daily ozone prediction based on temperature. Here we develop and implement the mloz in the UK Earth System Model (UKESM) for long-term idealized climate simulations. It produces stable ozone predictions over 50 years with a computational cost of less than 0.5% of the total runtime. The scheme accurately predicts ozone distribution, with climatology field errors of less than 10% in the stratosphere. It also realistically represents ozone variabilities, including seasonal and Quasi-Biennial Oscillation-related variabilities, despite a slight underestimation of amplitudes over the stratospheric polar regions. Additionally, we further demonstrated its generalizability by successfully transferring the mloz trained on UKESM to the ICOsahedral Nonhydrostatic model (ICON). Over 30 years of climate sensitivity tests indicate that it can effectively represent the response of ozone to the sudden quadrupling of CO2, significantly outperforming the simplified linearized ozone photochemistry scheme (Linoz) in the troposphere. This implies that the mloz can be transferred to other climate models without a full chemistry module to enable an efficient explicit ozone simulation.

How to cite: Ma, Y., Abraham, L., Versick, S., Ruhnke, R., Braesicke, P., and Nowack, P.: A Highly Efficient Machine Learning-based Ozone Parameterization for Climate Models, EGU General Assembly 2025, Vienna, Austria, 27 Apr–2 May 2025, EGU25-9358, https://doi.org/10.5194/egusphere-egu25-9358, 2025.

EGU25-9742 | ECS | Orals | ITS1.1/CL0.9

Downscaling precipitation simulations from Earth system models with generative machine learning 

Philipp Hess, Michael Aich, Baoxiang Pan, and Niklas Boers

Assessing precipitation impacts due to anthropogenic climate change relies on accurate and high-resolution numerical Earth system model (ESM) simulations. However, such simulations are computationally too expensive, and their discretized formulation can introduce systematic errors. These can, for example, lead to an underestimation of spatial intermittency and extreme events.
Generative machine learning has been shown to skillfully downscale and correct precipitation fields from numerical simulations [1].
However, these approaches require separate training for each Earth system model, making corrections of large ESM ensembles computationally costly.
Here, we follow a diffusion-based approach [2] by training an unconditional generative consistency model [3] on high-resolution ERA5 precipitation data. Once trained, a single generative model can be used to efficiently downscale arbitrary ESM simulations in an uncertainty-aware and scale-adaptive manner. Using three different climate models, GFDL-ESM4 [4], POEM [5], and SpeedyWeather [6], we evaluate the performance and generalizability of our approach.

[1] Harris, L., McRae, A.T., Chantry, M., Dueben, P.D. and Palmer, T.N., 2022. A generative deep learning approach to stochastic downscaling of precipitation forecasts. Journal of Advances in Modeling Earth Systems, 14(10), e2022MS003120.
[2] Hess, P., Aich, M., Pan, B., and Boers, N., 2024. Fast, Scale-Adaptive, and Uncertainty-Aware Downscaling of Earth System Model Fields with Generative Machine Learning. arXiv preprint arXiv:2403.02774.
[3] Song, Y., Dhariwal, P., Chen, M., and Sutskever, I. 2023.  Consistency Models. In International Conference on Machine Learning (pp. 32211-32252).
[4] Dunne, J.P., Horowitz, L.W., Adcroft, A.J., Ginoux, P., Held, I.M., John, J.G., Krasting, J.P., Malyshev, S., Naik, V., Paulot, F. and Shevliakova, E., 2020. The GFDL Earth System Model version 4.1 (GFDL‐ESM 4.1): Overall coupled model description and simulation characteristics. Journal of Advances in Modeling Earth Systems, 12(11), e2019MS002015.
[5] Drüke, M., von Bloh, W., Petri, S., Sakschewski, B., Schaphoff, S., Forkel, M., Huiskamp, W., Feulner, G. and Thonicke, K., 2021. CM2Mc-LPJmL v1.0: biophysical coupling of a process-based dynamic vegetation model with managed land to a general circulation model. Geoscientific Model Development 14, 4117–4141.
[6] Klöwer, M., Gelbrecht, M., Hotta, D., Willmert, J., Silvestri, S., Wagner, G.L., White, A., Hatfield, S., Kimpson, T., Constantinou, N.C. and Hill, C., 2024. SpeedyWeather.jl: Reinventing atmospheric general circulation models towards interactivity and extensibility. Journal of Open Source Software, 9(98), 6323.

How to cite: Hess, P., Aich, M., Pan, B., and Boers, N.: Downscaling precipitation simulations from Earth system models with generative machine learning, EGU General Assembly 2025, Vienna, Austria, 27 Apr–2 May 2025, EGU25-9742, https://doi.org/10.5194/egusphere-egu25-9742, 2025.

EGU25-9753 | Orals | ITS1.1/CL0.9

Combining spatio-temporal neural networks with mechanistic interpretability to investigate teleconnections in S2S forecasts 

Philine Lou Bommer, Marlene Kretschmer, Fiona Spurler, Kirill Bykov, Paul Boehnke, and Marina M.-C. Hoehne

Subseasonal-to-seasonal (S2S) forecasts are crucial for decision-making and early warning systems in extreme weather. However, the chaotic nature of atmospheric dynamics limits the predictive skill of climate models on S2S timescales. Teleconnections can provide windows of improved predictability, but leveraging these external drivers to enhance S2S forecast skill remains challenging. This study introduces a spatio-temporal neural network (STNN) designed to predict weekly North Atlantic European (NAE) weather regimes at lead times of one to six weeks during boreal winter. The STNN integrates a stacked vision transformer (ViT) encoder and a long short-term memory (LSTM) decoder to capture short- and medium-range variability. By incorporating spatio-temporal data on the stratospheric polar vortex, tropical outgoing longwave radiation, and 1D NAE regime time series, the network can access patterns linked to teleconnections of key drivers of European winter weather. Its modular design enables the application of mechanistic interpretability, providing novel neuron-level insights into the prediction behavior. The improved predictive skill beyond lead week three and enhanced accuracy for specific regimes suggest novel learned patterns of external drivers. Using Activation Maximization (AM), we analyze these learned representations, and by incorporating gradient-based explanations of correct predictions, we infer additional insights into prevalent teleconnections. 


How to cite: Bommer, P. L., Kretschmer, M., Spurler, F., Bykov, K., Boehnke, P., and Hoehne, M. M.-C.: Combining spatio-temporal neural networks with mechanistic interpretability to investigate teleconnections in S2S forecasts, EGU General Assembly 2025, Vienna, Austria, 27 Apr–2 May 2025, EGU25-9753, https://doi.org/10.5194/egusphere-egu25-9753, 2025.

EGU25-11083 | ECS | Posters on site | ITS1.1/CL0.9

Spatiotemporally Coherent Probabilistic Generation of Weather from Climate 

Jonathan Schmidt, Luca Schmidt, Felix Strnad, Nicole Ludwig, and Philipp Hennig

Local climate information is crucial for impact assessment and decision-making, yet coarse global climate simulations cannot capture small-scale phenomena. Current statistical downscaling methods infer these phenomena as temporally decoupled spatial patches. However, to preserve physical properties, estimating spatio-temporally coherent high-resolution weather dynamics for multiple variables across long time horizons is crucial. We present a novel generative approach that uses a score-based diffusion model trained on high-resolution reanalysis data to capture the statistical properties of local weather dynamics. After training, we condition on coarse climate model data to generate weather patterns consistent with the aggregate information. As this inference task is inherently uncertain, we leverage the probabilistic nature of diffusion models and sample multiple trajectories. We evaluate our approach with high-resolution reanalysis information before applying it to the climate model downscaling task. We then demonstrate that the model generates spatially and temporally coherent weather dynamics that align with global climate output.

How to cite: Schmidt, J., Schmidt, L., Strnad, F., Ludwig, N., and Hennig, P.: Spatiotemporally Coherent Probabilistic Generation of Weather from Climate, EGU General Assembly 2025, Vienna, Austria, 27 Apr–2 May 2025, EGU25-11083, https://doi.org/10.5194/egusphere-egu25-11083, 2025.

EGU25-11668 | ECS | Posters on site | ITS1.1/CL0.9

Whose weather is it? A fairness perspective on data-driven weather forecasting 

Leonardo Olivetti and Gabriele Messori

Recent years have seen rapid advancements in large-scale data-driven models for weather forecasting. Several of these models can now compete with, and in some respects outperform, physics-based numerical models for medium-range forecasting. They offer significant computational savings and potential forecasting accuracy improvements approximately equivalent to a decade of progress in traditional methods. This progress has prompted announcements from weather institutes across the world about plans to integrate AI-driven models into their operational workflows in the near future.

As data-driven models become integral to operational forecasting, critical questions about fairness and equity remain. Studies reveal substantial variations in forecast quality across regions, particularly for extreme weather. Unlike physical models, the disparities in data-driven models often stem from passive design decisions, such as inductive biases and weighting schemes, which may be reassessed and changed, if needed. Moreover, ensuring equitable access to these models, along with the means to effectively utilise and improve them, is essential so that both high- and low-income countries can share in their benefits.

This work explores fairness in data-driven weather forecasting, with a focus on outcome-based perspectives. We begin by defining fairness from both process and outcome viewpoints. We then analyse the performance of current data-driven models across different regions and socio-economic groups globally. Our findings reveal significant disparities that may exacerbate pre-existing socio-economic and climate-related vulnerabilities. To address these challenges, we advocate for a deliberate focus on fairness and equity in data-driven model development, emphasising the importance of active design choices to promote equitable outcomes.

How to cite: Olivetti, L. and Messori, G.: Whose weather is it? A fairness perspective on data-driven weather forecasting, EGU General Assembly 2025, Vienna, Austria, 27 Apr–2 May 2025, EGU25-11668, https://doi.org/10.5194/egusphere-egu25-11668, 2025.

EGU25-12129 | ECS | Orals | ITS1.1/CL0.9

Uncertainty Quantification of Machine Learning Parameterisations 

Laura Mansfield and Aditi Sheshadri

Machine learning (ML) parameterisations for climate models are emerging as a promising approach for capturing subgrid-scale processes, which are not explicitly resolved in climate models due to limitations on resolution. These ML parameterisations are typically trained on datasets generated by high resolution climate models or existing parameterisations (“offline”), but evaluated based on their performance when coupled into an existing climate model (“online”). Quantifying uncertainties associated with ML parameterisations is crucial for gaining insights into the reliability of hybrid ML-climate models.

I will discuss uncertainties associated with an ML parameterisation for atmospheric GWs, focusing on the parametric uncertainties which originate during the training process. I will show how these can propagate when coupled online, becoming a significant source of uncertainty in climate model circulation that we must consider carefully when building ML parameterisations.  


How to cite: Mansfield, L. and Sheshadri, A.: Uncertainty Quantification of Machine Learning Parameterisations, EGU General Assembly 2025, Vienna, Austria, 27 Apr–2 May 2025, EGU25-12129, https://doi.org/10.5194/egusphere-egu25-12129, 2025.

EGU25-12175 | ECS | Posters on site | ITS1.1/CL0.9

A deep learning approach to statistical downscaling and its potential to increase the resolution of the impact model simulations within ISIMIP 

Dánnell Quesada-Chacón, Inga Sauer, Matthias Mengel, and Katja Frieler

High-resolution climate projections are vital for understanding the local impacts of climate change in fields like agriculture, hydrology, energy production, and disaster risk management. However, Earth System Model (ESM) output often lacks the spatial detail needed to capture regional to local-scale variability, while showing large biases when compared to observational data. Statistical downscaling (SD) is commonly used to address such issues by refining the coarse spatial resolution of ESM output. While the current ISIMIP3 (Inter-Sectoral Impact Model Intercomparison Project, third round) SD algorithm is robust and computationally efficient, it struggles with increasing differences between source and target resolutions. To address these limitations, we applied deep-learning-based SD methods to create a globally consistent, high-resolution dataset for near-surface climate variables.

Using the perfect prognosis approach, we combined ERA5 as large-scale atmospheric predictors with ERA5-Land as high-resolution predictands (target resolution of ~10 km) to create accurate transfer functions (TFs) that align with ISIMIP's requirements, such as trend preservation and inter-variable consistency. These TFs are subsequently applied to ESM output to generate downscaled climate forcings. The resulting framework is both scalable and computationally efficient, making it suitable for multi-model applications. The results were compared with similar methodologies and its improvements were demonstrated in a cross-validation framework, particularly in capturing local-scale features.

Our approach offers a robust tool for generating high-resolution climate data, providing valuable insights to researchers and decision-makers working on climate impact assessments and adaptation planning. This work contributes to the next iteration of ISIMIP and to OptimESM, targeting the CMIP7-based modeling framework. The derived high-resolution projections are designed to complement CMIP7 datasets, enabling the creation of downscaled ensembles that conform with ISIMIP's objectives and support a wide range of impact modeling applications.

How to cite: Quesada-Chacón, D., Sauer, I., Mengel, M., and Frieler, K.: A deep learning approach to statistical downscaling and its potential to increase the resolution of the impact model simulations within ISIMIP, EGU General Assembly 2025, Vienna, Austria, 27 Apr–2 May 2025, EGU25-12175, https://doi.org/10.5194/egusphere-egu25-12175, 2025.

EGU25-12646 | ECS | Posters on site | ITS1.1/CL0.9

A Novel Modeling Framework based on Empirical models, PSO, XGBoost, and multiple GCMs for the projection of Long-Term Reference Evapotranspiration 

Ali Elbilali, Abdessamad Hadri, Abdeslam Taleb, El Mahdi EL Khalki, Meryem Tanarhte, and Mohamed Hakim Kharrou

Estimation of the Reference Evapotranspiration (ET0) is critical in water resources management under climate change, especially for agricultural water management in arid and semi-arid regions. Thus, estimating baseline ET0 poses significant challenges, particularly in inadequate climatological monitoring regions. In this study, a hybrid modeling approach based on the incorporation of empirical models, Particle Swarm Optimization (PSO), and XGBoost algorithm (Empirical-PSO-XGBoost) was developed and evaluated to forecast ET0 under limited climate variables. The results showed the Empirical-PSO-XGBoost outperformed the purely calibrated empirical and Temperature-PSO-XGBoost models for estimating monthly (daily) ET0 with NSE reaching 0.99 (0.86) and 0.98 (0.67) for the calibration and validation phases, respectively. Besides, up to 63 CMIP6 projections were coupled with Empirical-PSO-XGBoost for forecasting the long-term ET0 under SSP245 and SSP585 climate change scenarios. Thus, the simulation showed a significant increase in ET0 and seasonal patterns compared to the baseline ET0 where the change in range of [+5, +10] % is associated with probability values of 0.65 and 0.78 for SSP245 and SSP585, respectively. Overall, the developed framework is useful for implementing adaptation strategies to mitigate climate change effects on water resource allocation and agricultural management. It provides the ET0 associated with Exceedance probability for each month which is useful for assessing the water availability-related-risk in scheduling irrigation and sowing date of crops.

How to cite: Elbilali, A., Hadri, A., Taleb, A., EL Khalki, E. M., Tanarhte, M., and Kharrou, M. H.: A Novel Modeling Framework based on Empirical models, PSO, XGBoost, and multiple GCMs for the projection of Long-Term Reference Evapotranspiration, EGU General Assembly 2025, Vienna, Austria, 27 Apr–2 May 2025, EGU25-12646, https://doi.org/10.5194/egusphere-egu25-12646, 2025.

EGU25-13061 | ECS | Posters on site | ITS1.1/CL0.9

Surrogate impact modelling for crop yield assessment with nested RNNs 

Odysseas Vlachopoulos, Niklas Luther, Andrej Ceglar, Andrea Toreti, and Elena Xoplaki

Climate variability and change significantly influence crop production, presenting challenges that extend from understanding the basic crop growth principles to evaluating the effects of extreme weather events on crop development. Addressing this requires effective agro-management strategies guided by tailored climate services. However, a critical gap exists between scientific insights and their practical application. This study introduces and evaluates an AI-driven methodology designed to simulate crop growth and predict grain maize yields across Europe. Specifically, nested Recurrent Neural Networks (RNNs) are tested as a computationally efficient surrogate model for the process-based ECroPS model developed by the European Commission’s Joint Research Centre. Traditional mechanistic crop models, like ECroPS, require numerous meteorological inputs and significant computational resources, limiting scalability for applications such as large-scale climate simulations or ensemble modeling that explore variables like climate projections and CO₂ effects. In contrast, the surrogate AI model relies on just three weather inputs—daily minimum and maximum temperatures and daily precipitation—trained using ECMWF-ERA5 reanalysis data. This streamlined approach demonstrates the potential to bridge the gap between resource-intensive crop modeling and scalable, data-driven solutions for climate impact assessments.

How to cite: Vlachopoulos, O., Luther, N., Ceglar, A., Toreti, A., and Xoplaki, E.: Surrogate impact modelling for crop yield assessment with nested RNNs, EGU General Assembly 2025, Vienna, Austria, 27 Apr–2 May 2025, EGU25-13061, https://doi.org/10.5194/egusphere-egu25-13061, 2025.

EGU25-13234 | Posters on site | ITS1.1/CL0.9

XAI finds signs of clouds in the Net Ecosystem Exchange of boreal forest  

Topi Laanti, Ekaterina Ezhova, Anna Lintunen, Steffen Noe, Markku Kulmala, Victoria Miles, and Keijo Heljanko

XAI finds signs of clouds in the Net Ecosystem Exchange of boreal forest 

Laanti, Lintunen, Noe, Miles, Heljanko, Kulmala, Ezhova  

We applied three distinct machine learning models (random forest, LightGBM, and XGBoost) to predict net ecosystem exchange (NEE) in boreal forests using site-level information and climatic variables from two Finnish stations, SMEAR I and II as well as one Estonian station, SMEAR Estonia. Our study focuses on explainable artificial intelligence (XAI) technique called Shapley values, to interpret how radiation and meteorological and biospheric variables influence NEE.  

Using XAI, we found that diffuse radiation enhancement of NEE is linked to type of cloudiness. Our Shapley value analysis revealed that at the same diffuse radiation level, NEE can be enhanced more under overcast sky than under clear-sky or broken cloudiness conditions. Under a certain parameter range, this seems to counterbalance the negative effect of reduction in PAR on photosynthesis under overcast sky. Furthermore, visualizing the interplay between PAR, cloudiness, and NEE based on seasonality highlighted subtle differences in how these parameters interact at northern versus southern sites. Importantly, the use of three distinct machine learning models that all showed similar results demonstrate that these observed relationships are consistent.  

Although the discovered relationships between radiation, cloudiness and NEE do not necessarily reflect true causality, they can guide further testing of possible causal hypotheses. By integrating XAI into NEE modeling with machine learning, we gain deeper insights into the physical and ecological processes shaping carbon fluxes. Such interpretability is vital for understanding NEE dynamics in boreal forests, particularly in the face of evolving climate scenarios where cloud cover, temperature, and moisture regimes shift and introduce complex feedback mechanisms. Integrating XAI thus provides a valuable framework for interpreting complex, potentially nonlinear drivers behind NEE and for exploring new avenues of causal investigation in ecosystem research. 

How to cite: Laanti, T., Ezhova, E., Lintunen, A., Noe, S., Kulmala, M., Miles, V., and Heljanko, K.: XAI finds signs of clouds in the Net Ecosystem Exchange of boreal forest , EGU General Assembly 2025, Vienna, Austria, 27 Apr–2 May 2025, EGU25-13234, https://doi.org/10.5194/egusphere-egu25-13234, 2025.

EGU25-13307 | Orals | ITS1.1/CL0.9 | Highlight

Causal climate emulation 

Julien Boussard, Sebastian Hickman, Ilija Trajkovic, Julia Kaltenborn, Yaniv Gurwicz, Peer Nowack, and David Rolnick

Making projections of possible future climates with models is essential to improve our understanding of the causes and implications of anthropogenic climate change. While Earth system models are currently the most complete description of the Earth system, these models are computationally expensive. Simpler models (emulators) are therefore useful to explore the large space of possible future climate scenarios and to generate large ensembles. One class of emulators are simple climate models (SCMs), which model the Earth system with simplified physics. A second class of emulators are statistical models, which learn relationships directly from correlations in climate model data. In this preliminary work, we seek to combine the benefits of the physical grounding of SCMs with those of purely statistical emulators, using tools from causal representation learning. The resulting causal climate emulator may allow exploration of the effect of various interventions on the Earth system, including the effect of changing forcings.


The goal of causal representation learning (CRL) is to simultaneously learn low-dimensional latent representations from high-dimensional data, and a causal graph between these latent representations. In the context of climate model data, we aim to infer latent variables representing regions with shared climate variability from fine-grid climate model data, and causal teleconnections between these regions, representing climate dynamics. We build on recent previous work by Boussard et al., which illustrated how a CRL method, Causal Discovery with Single-parent Decoding (CDSD), may be used for this task. CDSD is a continuous optimization method to learn a distribution over latent variables such that every grid-point observation is driven by a single latent variable, and a causal graph between these latents is also learned. 


We illustrate that on surface fields of monthly pre-industrial climate model data, CDSD learns physically-reasonable latent variables but learning a robust causal graph between the latent variables remains a challenge. We evaluate our models on synthetic data that approximate the spatiotemporal structures that we observe in climate model data. By autoregressively rolling out the model we can then generate an ensemble of future climate trajectories with the learned generative model. We develop a Bayesian filter to maintain a constant spatial spectrum throughout our autoregressive rollout, and show that it leads to stable climate prediction. Finally, we explore approaches for including the effect of forcings such as greenhouse gasses in the model.

How to cite: Boussard, J., Hickman, S., Trajkovic, I., Kaltenborn, J., Gurwicz, Y., Nowack, P., and Rolnick, D.: Causal climate emulation, EGU General Assembly 2025, Vienna, Austria, 27 Apr–2 May 2025, EGU25-13307, https://doi.org/10.5194/egusphere-egu25-13307, 2025.

EGU25-13717 | ECS | Orals | ITS1.1/CL0.9

Leveraging Differentiable Programming and Online Learning for the design of Hybrid Numerical Models 

Said Ouala, Etienne Meunier, Ronan Fablet, and Julien Le Sommer

Earth system models (ESMs) are widely used to study climate changes resulting from both anthropogenic and natural perturbations. Over the past years, significant advances have been made through the development of new numerical schemes, refined physical parameterizations, and the use of increasingly powerful computers. Despite these advances, tuning ESMs to accurately reproduce historical data remains largely a manual process, and persistent errors and biases continue to challenge their accuracy. Reducing uncertainties in long-term climate projections and accurately estimating the spread of climate simulations continue to be critical challenges.

Recent advances in machine learning have motivated the development of learning-based methods for the calibration of ESMs. One emerging area of research is the design of hybrid modeling approaches, which combine a physical core with a machine learning model. Training these hybrid models end-to-end (or online) has the potential to unify various challenges in ESMs development, ranging from building subgrid scale parameterizations, to bias correction and parameter tuning.

Training hybrid models online requires working with an optimization problem that depends on the numerical integration of the system. Solving this optimization problem using gradient-based approaches requires the system to be differentiable, or to have access to the adjoint of the numerical model, which is not the case for most of the large-scale physical models. Beyond the need for differentiability, developing hybrid models requires interfacing a physical core that is implemented in low-abstraction languages that are running on CPUs, with AI-based models that are developed using high-abstraction, rapidly evolving languages that run on GPUs. While this interface is not a problem at inference time, doing this interface at calibration time, which is necessary when doing online learning, is not trivial as it would require an iterative communication between components that are implemented on different architectures.

In this work, we aim to investigate online learning and hybrid models to develop new computing paradigms, tools, and calibration methods for designing numerical models that are closely aligned with observations. We study the potential of online learning for deriving efficient and scalable solutions to the above-mentioned problems for applications that include both short-term forecasting and long-term simulations, which require stability considerations of the resulting hybrid systems. We explore learning configurations that include both fully differentiable and black-box physical cores. The latter configuration aims at evaluating the extent to which differentiable programming frameworks can upscale modeling capabilities in terms of accuracy, computational efficiency, and adaptability to represent diverse physical processes.

How to cite: Ouala, S., Meunier, E., Fablet, R., and Le Sommer, J.: Leveraging Differentiable Programming and Online Learning for the design of Hybrid Numerical Models, EGU General Assembly 2025, Vienna, Austria, 27 Apr–2 May 2025, EGU25-13717, https://doi.org/10.5194/egusphere-egu25-13717, 2025.

EGU25-13734 | ECS | Orals | ITS1.1/CL0.9

Reconstructing 3D vertical cloud profiles using cloud dynamics 

Emiliano Diaz, Kyriaki-Margarita Bintsi, Giuseppe Castiglioni, Michael Eisinger, Lilli Freischem, Stella Girtsou, Emmanuel Johnson, William Jones, Anna Jungbluth, and Joppe Massant

Clouds influence Earth’s climate by reflecting sunlight and trapping heat, but their role in climate change remains uncertain, causing major unpredictability in models. Global 3D cloud data can improve predictions.

Observations from NASA’s CloudSat mission have advanced our understanding of cloud structures but are limited by long revisit times and narrow coverage. Imaging instruments offer broader, faster coverage but lack vertical information.

In [1] a deep learning approach addressed this challenge by combining MSG/SEVIRI satellite imagery with CloudSat profiles to extrapolate vertical cloud structures beyond observed tracks. Using geospatially-aware Masked Autoencoders, models were pre-trained on a year of MSG data (2010) and fine-tuned with CloudSat tracks as ground truth. This self-supervised training improved reconstruction, outperforming previous methods and simpler architectures [2].

In this work, we explore to what degree including information of the temporal dynamics of clouds can further improve the quality of the 3D cloud reconstruction. Instead of using a single image  as input we use a temporal sequence of MSG/SEVIRI images, spanning a period of several hours before and after the target cloud vertical profile. We use a combination of the geospatial encodings used in [1] and the temporal encoding used in [3] to embed these spatiotemporal MSG/SEVIRI cubes in rich, general purpose latent space. We then use a finetuning model as in [1] to map the embeddings into 3D radar reflectivity maps. 

We perform a sensitivity analysis to explore how the quality of the reconstruction varies as a function of the amount of temporal information included. We also explore the relative strengths of different pre-training strategies with respect to the quality of the 3D reflectivity reconstruction and cloud type segmentations. With this, we provide insights on self-supervised learning for atmospheric applications.

References

  • Stella Girtsou et al. “3D Cloud reconstruction through geospatially-aware Masked Autoencoders” 2024. arXiv: 2501.02035 [cs.CV]. URL: https://arxiv.org/abs/2501.02035.
  • Sarah Brüning et al. “Artificial intelligence (AI)-derived 3D cloud tomography from geostationary 2D satellite data”. en. In: Atmos. Meas. Tech. 17.3 (Feb. 2024), pp. 961–978.
  • Yezhen Cong et al. SatMAE: Pre-training Transformers for Temporal and Multi-Spectral Satellite Imagery. 2023. arXiv: 2207.08051 [cs.CV]. URL: https://arxiv.org/abs/2207.08051.

How to cite: Diaz, E., Bintsi, K.-M., Castiglioni, G., Eisinger, M., Freischem, L., Girtsou, S., Johnson, E., Jones, W., Jungbluth, A., and Massant, J.: Reconstructing 3D vertical cloud profiles using cloud dynamics, EGU General Assembly 2025, Vienna, Austria, 27 Apr–2 May 2025, EGU25-13734, https://doi.org/10.5194/egusphere-egu25-13734, 2025.

EGU25-15256 | Orals | ITS1.1/CL0.9

Unravelling the role of increased model resolution on surface temperature fields using explainable AI 

Simon Michel, Kristian Strommen, and Hannah Christensen

Reducing climate model biases is crucial for decreasing uncertainties in future climate projections. Despite recent efforts, improvements between the latest generations of Earth System Models (ESMs) have been modest, primarily due to the continued reliance on subgrid-scale parametrizations. These parametrizations are necessary because the model resolutions in CMIP6 are too coarse to explicitly simulate too small-scale processes such as ocean mesoscale eddies and deep atmospheric convection, which significantly influence regional and global climate patterns. Recent advances in computational power have enabled higher-resolution models, allowing for some of these processes to be simulated explicitly, reducing the need for parametrization. Here, we combine a convolutional neural network (CNN) classifier and explainable AI (XAI) to investigate the role of increased resolution in simulating winter surface temperature fields. The CNN is used to classify ESMs with varying resolutions based on snapshots of their surface temperature fields, while the XAI approach explains which regions and features the CNN relies on to make these distinctions, providing deeper insights into ESM performance. Results indicate that models with similar ocean grids are more frequently confused by the CNN than those from similar modeling centers, emphasizing the crucial role of ocean resolution, particularly the presence of mesoscale eddies, in shaping climate simulations. Although the analysis is restricted to surface air temperature, the XAI approach offers a more nuanced understanding of model differences compared to traditional bias analyses. This methodology can be extended to other climate variables and ESM features, offering a powerful tool for enhancing model intercomparison and evaluating ESM performance.

How to cite: Michel, S., Strommen, K., and Christensen, H.: Unravelling the role of increased model resolution on surface temperature fields using explainable AI, EGU General Assembly 2025, Vienna, Austria, 27 Apr–2 May 2025, EGU25-15256, https://doi.org/10.5194/egusphere-egu25-15256, 2025.

EGU25-15363 | Orals | ITS1.1/CL0.9

Multivariate climate downscaling using deep learning models 

Pascal Horton, Maxim Samarin, Noelia Otero, Sam Allen, and Michele Volpi

Climate change is profoundly affecting ecosystems and societies. Impacts on hydrological regimes, water resources, and urban heatwaves are particularly important, emphasizing the need for a detailed understanding of these changes at local scales to inform effective adaptation strategies. Achieving this requires reliable, high-resolution projections of future climate conditions. However, current climate models operate at coarse spatial resolutions, limiting their ability to capture small-scale processes and extreme weather events. To bridge this gap, robust downscaling techniques are essential for refining the outputs of global and regional climate models.

We propose a multivariate super-resolution (SR) approach to downscale temperature and precipitation data in Switzerland to improve the representation of localized patterns, particularly in Alpine regions, while simultaneously capturing the interdependencies between temperature and precipitation, which are crucial for hydrological applications. We leverage advanced machine learning techniques, including Generative Adversarial Networks (GANs) and Diffusion models, to overcome the limitations of classical methods in capturing inter-variable dependencies. These models provide an ensemble framework, providing multiple possible realizations, to account for downscaling uncertainties, resulting in more robust and reliable outputs for impact modeling and decision-making. We test different loss functions, like a regional CRPS, to allow for variability in the generated meteorological fields.

We compare the performance of GANs and Diffusion models along with the differences between univariate and multivariate settings. Our approach includes applying a multivariate bias correction prior to downscaling. The downscaled results are compared to a setting based on univariate bias correction. Additionally, we present the pipeline, which integrates bias correction and downscaling and is intended to be open source.

How to cite: Horton, P., Samarin, M., Otero, N., Allen, S., and Volpi, M.: Multivariate climate downscaling using deep learning models, EGU General Assembly 2025, Vienna, Austria, 27 Apr–2 May 2025, EGU25-15363, https://doi.org/10.5194/egusphere-egu25-15363, 2025.

EGU25-15622 | ECS | Posters on site | ITS1.1/CL0.9

Machine Learning Projections of Climate Change Impacts on Global Vegetation Dynamics 

Anh Kieu Nguyen and Walter Chen

Understanding the potential impacts of climate change on global vegetation dynamics is crucial for effective environmental management and biodiversity conservation. This study employs a machine learning-based framework to analyze historical NDVI data and project future vegetation growth under different climate scenarios. Utilizing the GIMMS NDVI dataset (1981–2000) for model training and CMIP6 climate projections (2021–2100) for scenario analysis, the study evaluates changes in vegetation growth across four Shared Socioeconomic Pathways (SSPs). Results indicate a significant near-term increase in global mean NDVI (2021–2040) under all scenarios, followed by divergent trends. While SSP126 and SSP245 sustain modest increases, SSP370 and SSP585 show sharp declines in NDVI over the long term, driven by adverse temperature effects. Regional analyses reveal contrasting patterns: NDVI values in Africa, South America, and Oceania decline under most scenarios, while North America, Europe, and Asia exhibit potential increases, except under high-emission scenarios like SSP585. These findings underscore the importance of targeted interventions to mitigate climate impacts and highlight the role of machine learning in predicting vegetation responses to environmental changes. The study provides actionable insights for policymakers, emphasizing the need for sustainable land management practices and greenhouse gas reduction strategies to preserve global ecosystems.

How to cite: Nguyen, A. K. and Chen, W.: Machine Learning Projections of Climate Change Impacts on Global Vegetation Dynamics, EGU General Assembly 2025, Vienna, Austria, 27 Apr–2 May 2025, EGU25-15622, https://doi.org/10.5194/egusphere-egu25-15622, 2025.

EGU25-16234 | ECS | Posters on site | ITS1.1/CL0.9

Revisiting Earth’s Seasonality using Machine Learning Models 

Assaf Shmuel, Leehi Magaritz-Ronen, Shira Raveh-Rubin, and Ron Milo

Earth’s seasonality profoundly influences nearly every aspect of life on our planet. It plays a key role in driving vegetation cycles and shaping wildlife behavior. Seasonality also impacts human life significantly, affecting health, mood, social dynamics, and cultural patterns. Despite its importance, seasonality is still traditionally defined by astronomical seasons—equal-length divisions applied uniformly across the Earth. Although this division is simple and intuitive, it overlooks crucial seasonal patterns influenced by atmospheric weather. In this study, we propose a data-driven approach to redefining seasons using objective clustering. We develop an algorithm that segments various meteorological factors into meaningful seasonal clusters. Building on this algorithm, we objectively define seasons for each region globally and analyze the effects of Climate Change on these clusters. We find that seasonality is driven by different meteorological factors in different regions on Earth. Additionally, we observe that Climate Change has significantly altered the duration and onset of Earth’s seasons.

How to cite: Shmuel, A., Magaritz-Ronen, L., Raveh-Rubin, S., and Milo, R.: Revisiting Earth’s Seasonality using Machine Learning Models, EGU General Assembly 2025, Vienna, Austria, 27 Apr–2 May 2025, EGU25-16234, https://doi.org/10.5194/egusphere-egu25-16234, 2025.

EGU25-16360 | ECS | Orals | ITS1.1/CL0.9

Limitations of Machine Learning Models in Extrapolating to a Changing Climate 

Christian Reimers, Reda ElGhawi, Basil Kraft, and Alexander J. Winkler

Machine learning (ML), and deep learning (DL) in particular, hold the potential to solve long-standing challenges in understanding and modeling the Earth system. Earth system model (ESM) development is reluctant to implement DL algorithms because they are considered intransparent, meaning it is unclear how these models extrapolate to unseen conditions, e.g., under a changing climate. Still, machine learning is often used to extrapolate into the future,  which can lead to misleading results.
We demonstrate these limitations and the dangers of performing naive extrapolation by using a set of deep neural networks to emulate simulated data of gross primary production (GPP). We use a process-based model (PBM) that simulates photosynthetic CO2 uptake as a product of radiation (PAR), stress from daily meteorology (fTmin , fVPD , fSM ), vegetation state (fPAR), and CO2 (εmax(CO2 )). It is given by

GPP = εmax (CO2 ) · PAR · fPAR · fTmin · fVPD · fSM + ε.                                                           (1)

The PBM contains many of the typical challenges when using ML for Earth’s system science. It accounts for stochastic noise (ε), is capable of exhibiting multi-year memory, and the predictors are highly correlated on multiple time scales. Further, this model exhibits interesting extrapolation behavior as some of the factors  (fTmin , fVPD , fSM , fPAR) saturate in extreme meteorological conditions while others (PAR, εmax ) do not. We feed the PBM with predictors obtained from historical and future climate simulations of a comprehensive Earth system model. The training dataset contains the predictors and predictions of the PBM for various locations in a similar climate zone but different continents and for the historical time frame (1850-present) together with a spurious predictor, namely, surface wind speed. To obtain a set of independent models, each of the co-authors separately implements a custom architecture, without knowing which predictor is which. This results in four different models, namely a linear model, a multi-layer perceptron, a long-short term memory (LSTM), and an attention-based model.
We find that all models show strong prediction performance in cross-validation (Normalized Nash–Sutcliffe Efficiency (NNSE) > 0.9), decent performance when extrapolating to sites on different continents (NNSE > 0.7), but three out of four models show virtually no skill when predicting to a changed climate (NNSE < 0.6). Additionally, most models emit gradients in the same order of magnitude as the PBM when ignoring values where  some factors saturate. This indicates that the networks did not learn the saturation behavior from the data. Further, the model that extrapolates best is the LSTM, a model that has a built-in maximum output and, hence, has to saturate.
In conclusion, strong spatial generalization and cross-validation performance do not guarantee decent extrapolation for neural networks even in relatively simple, stable systems. These findings highlight the importance of selecting architectures in line with the expected extrapolation behavior when predicting Earth’s system processes under climate change conditions.

How to cite: Reimers, C., ElGhawi, R., Kraft, B., and Winkler, A. J.: Limitations of Machine Learning Models in Extrapolating to a Changing Climate, EGU General Assembly 2025, Vienna, Austria, 27 Apr–2 May 2025, EGU25-16360, https://doi.org/10.5194/egusphere-egu25-16360, 2025.

EGU25-17278 | Posters on site | ITS1.1/CL0.9

Assessment of a Pan-European high-resolution downscaling through Deep Learning 

Ramon Fuentes-Franco, Mikhail Ivanov, Torben Koenigk, Kristofer Krus, Aitor Aldama Campino, and Fuxing Wang

The performance of a deep convolutional neural network in predicting near-surface air temperature (T2m) and total precipitation (P) over Europe is assessed, comparing its results with the Copernicus European Regional Reanalysis (CERRA) and the regional dynamical model HCLIM. The ML-model accurately captures broad seasonal temperature and precipitation patterns, with minor biases in summer and more pronounced warm biases in winter. While the model effectively reproduces the probability density functions (PDFs) of daily temperature and precipitation, it underestimates extreme cold events and the high precipitation extremes in some regions. Climate indices, including cold extremes (TM2PCTL), warm extremes (TM98PCTL), consecutive dry days (CDD), and consecutive wet days (CWD), highlight that the ML model aligns closely with CERRA. However, it slightly underestimates CDD and overestimates CWD, particularly in mountainous and Mediterranean regions. Analyses of spatio-temporal variability demonstrate high correlations with CERRA for temperature, exceeding 0.99 for spatial patterns and 0.95 for temporal correlations, while correlations for precipitation are lower, with underestimated temporal variability. The ML model generally outperforms HCLIM, particularly in aligning with observed data, although challenges remain in capturing extremes and reducing biases in certain regions. These results further highlight the potential of the ML model for regional climate downscaling and impact studies, while emphasizing the need for further refinement to enhance its representation of extreme events and improve spatial accuracy.

How to cite: Fuentes-Franco, R., Ivanov, M., Koenigk, T., Krus, K., Aldama Campino, A., and Wang, F.: Assessment of a Pan-European high-resolution downscaling through Deep Learning, EGU General Assembly 2025, Vienna, Austria, 27 Apr–2 May 2025, EGU25-17278, https://doi.org/10.5194/egusphere-egu25-17278, 2025.

EGU25-17628 | ECS | Posters on site | ITS1.1/CL0.9

Exploring Terrain-Precipitation Relationships with Interpretable AI for Advancing Future Climate Projections 

Hao Xu, Yuntian Chen, Zhenzhong Zeng, Nina Li, Jian Li, and dongxiao Zhang

Despite the remarkable strides made by AI-driven models in modern precipitation forecasting, these black-box models cannot inherently deepen the comprehension of underlying mechanisms. To address this limitation, we propose an AI-driven knowledge discovery framework known as genetic algorithm-geographic weighted regression. Through this framework, we have constructed an iterative optimization of knowledge generation and utilization. On the one hand, new explicit equations are discovered to describe the intricate relationship between precipitation patterns and terrain characteristics. Experiments have shown that the discovered equations demonstrate remarkable accuracy when applied to precipitation data, outperforming conventional empirical models. Notably, our research reveals that the parameters within these equations are dynamic, adapting to evolving climate patterns. On the other hand, these previously undisclosed equations have contributed new knowledge about terrain-precipitation relationships, which can be embedded into the AI model for better interpretability and climate projection accuracy. Specifically, the unveiled equations can enable fine-scale downscaling for precipitation predictions using low-resolution future climate data. This capability offers invaluable insights into the anticipated changes in precipitation patterns across diverse terrains under future climate scenarios, which enhances our ability to address the challenges posed by contemporary climate science.

How to cite: Xu, H., Chen, Y., Zeng, Z., Li, N., Li, J., and Zhang, D.: Exploring Terrain-Precipitation Relationships with Interpretable AI for Advancing Future Climate Projections, EGU General Assembly 2025, Vienna, Austria, 27 Apr–2 May 2025, EGU25-17628, https://doi.org/10.5194/egusphere-egu25-17628, 2025.

EGU25-17783 | ECS | Orals | ITS1.1/CL0.9

Valid Prediction Intervals for Weather Forecasting with Conformal Prediction 

Thomas Mortier, Cas Decancq, Yusuf Sale, Alireza Javanmardi, Willem Waegeman, Eyke Hüllermeier, and Diego G. Miralles

In recent years, machine learning has emerged as a promising alternative to numerical weather prediction models, offering the potential for cost-effective and accurate forecasts. However, a significant limitation of current machine learning methods for weather forecasting is the lack of principled and efficient uncertainty quantification—a key element given the complexity of the Earth's climate system and the challenges in modeling its processes and feedback mechanisms. Inadequate uncertainty quantification and reporting undermines trust in and the practical use of current weather forecasting methods (Eyring et al., 2024).

Uncertainty quantification methods for weather forecasting typically use prediction intervals and can be categorized into Bayesian and frequentist approaches. Bayesian methods, while theoretically appealing, often involve restrictive assumptions and do not scale well to the complexity of spatio-temporal data. Frequentist approaches, such as ensemble-based methods, are widely used in weather forecasting and include techniques like perturbing initial states with noise (Bi et al., 2023; Scher et al., 2021), varying neural network parameters (Graubner et al., 2022), or training generative models (Price et al., 2023). However, most frequentist methods provide only asymptotically valid prediction intervals, which may not suffice in all weather forecasting applications.

Conformal prediction (CP) is a promising uncertainty quantification framework that delivers valid and efficient prediction intervals for any learning algorithm, without requiring assumptions about the underlying data distribution (Vovk et al., 2005). Despite its growing popularity in the machine learning and statistics communities, traditional CP methods are not tailored to spatio-temporal data in weather forecasting. This is due to challenges arising from spatial and temporal dependencies—such as spatial autocorrelation and temporal dynamics—that violate the exchangeability assumption underlying standard CP methods. Several recent studies attempted to address these challenges by introducing new CP algorithms specifically designed for various types of non-exchangeability (Oliveira et al., 2024). However, these adaptations face several limitations, including high computational complexity, asymptotic guarantees, and/or the need for recalibration of prediction intervals.

In this presentation, we will evaluate CP methods in the context of weather forecasting and discuss several limitations. In addition, we will highlight recent advances and discuss potential future directions that could address challenges underlying the use of CP in weather forecasting.

References:

Eyring, V., et al. Pushing the Frontiers in Climate Modelling and Analysis with Machine Learning. Nature Climate Change, 2024.

Leutbecher, M., et al. Ensemble Forecasting. JCP, 2008.

Bi, K., et al. Accurate Medium-range Global Weather Forecasting with 3D Neural Networks. Nature, 2023.

Scher, S., et al. Ensemble Methods for Neural Network-based Weather Forecasts. JAMES, 2021.

Graubner, A., et al. Calibration of Large Neural Weather Models. NeurIPS, 2022.

Price, I., et al. Probabilistic Weather Forecasting with Machine Learning. Nature, 2025.

Vovk, V., et al. Algorithmic learning in a random world. New York: Springer, 2005.

Oliveira, R.I., et al. Split Conformal Prediction and Non-exchangeable Data. JMLR, 2024.


How to cite: Mortier, T., Decancq, C., Sale, Y., Javanmardi, A., Waegeman, W., Hüllermeier, E., and Miralles, D. G.: Valid Prediction Intervals for Weather Forecasting with Conformal Prediction, EGU General Assembly 2025, Vienna, Austria, 27 Apr–2 May 2025, EGU25-17783, https://doi.org/10.5194/egusphere-egu25-17783, 2025.

EGU25-17999 | Orals | ITS1.1/CL0.9

Towards a prototype hybrid ICON-ML model with physics-aware machine learning parameterizations 

Julien Savre, Mierk Schwabe, Arthur Grundner, Katharina Hefner, Helge Heuer, Janis Klamt, Lorenzo Pastori, Manuel Schlund, Pierre Gentine, and Veronika Eyring

Earth System Models (ESMs) are fundamental to understanding and projecting climate change. While they have demonstrated continuous improvements over the last decades, systematic errors and large uncertainties in their projections remain. A large contribution to these uncertainties stems from the representation of unresolved processes such as clouds and convection that occur at scales smaller than the model grid spacing. This impacts the models’ ability to accurately project global and regional climate change, climate variability, and extremes. High-resolution models with horizontal grid spacing of a few kilometers or less alleviate many biases of coarse-resolution models, but at high computational costs. Yet short simulations from high-resolution models can be used to inform machine learning (ML)-based parameterizations that are then incorporated into hybrid (physics+ML) ESMs. This new generation of hybrid models promises to reduce systematic errors and enhance projection capabilities compared to current state-of-the-art ESMs [1, 2]. In an effort to design a comprehensive hybrid ESM, the ICOsahedral Non-hydrostatic (ICON) model is equipped with a variety of physics-aware ML parameterizations, including moist convection, cloud cover and radiation. This talk will present an overview of the modelling activities undertaken within this framework, with a special focus on the developed ML-based cloud cover parameterization. This parameterization takes the form of an interpretable non-linear equation discovered through a combination of ML techniques including symbolic regression and sequential feature selection [3]. We demonstrate that, with this new parameterization, ICON runs stably over several decades and reduces global biases in cloud cover and radiation metrics. In addition, the new equation is controlled by only 10 free parameters that we automatically calibrate to achieve more accurate climate projections. This approach of discovering a low-dimensional data-driven equation for a parameterization with subsequent tuning of the hybrid model can be used in any host ESM provided suitable training data.


References:

[1] Eyring, V., Collins, W.D., Gentine, P. et al., Pushing the frontiers in climate modeling and analysis with machine learning, Nat. Climate Change, doi:10.1038/s41558-024-02095-y, 2024.

[2] Eyring, V., Gentine, P., Camps-Valls, G., Lawrence, D.M., and Reichstein, M., AI-empowered Next-generation Multiscale Climate Modeling for Mitigation and Adaptation, Nat. Geosci., doi:10.1038/s41561-024-01527-w, 2024.

[3] Grundner, A., Beucler, T., Gentine, P. and Eyring, V., Data-driven equation discovery of a cloud cover parameterization, J. Adv. Model. Earth Sys., doi:10.1029/2023MS003763, 2024.

How to cite: Savre, J., Schwabe, M., Grundner, A., Hefner, K., Heuer, H., Klamt, J., Pastori, L., Schlund, M., Gentine, P., and Eyring, V.: Towards a prototype hybrid ICON-ML model with physics-aware machine learning parameterizations, EGU General Assembly 2025, Vienna, Austria, 27 Apr–2 May 2025, EGU25-17999, https://doi.org/10.5194/egusphere-egu25-17999, 2025.

EGU25-18735 | ECS | Orals | ITS1.1/CL0.9

Optimal Sensor Placement for Aerosol Absorption Optical Depth with Convolutional Neural Processes 

Paolo Pelucchi, Alejandro Coca-Castro, Tom R. Andersson, Jorge Vicent Servera, and Gustau Camps-Valls

Aerosols affect the Earth’s energy budget by both scattering and absorbing solar radiation. Measuring parameters that separately quantify the two components, such as the aerosol absorption optical depth (AAOD), is key to better understanding the aerosol direct climate effect. As most satellite instruments can only retrieve the total aerosol extinction signal, the most reliable source of global AAOD observations is the ground-based AERONET sensor network. AERONET comprises hundreds of stations worldwide; however, their spatial distribution is uneven and coverage remains sparse in many relevant regions. To effectively reduce our uncertainty related to absorbing aerosols and efficiently expand the network, new stations should be placed in locations that maximise measurement informativeness. In this study, we address the problem of optimal sensor placement using convolutional neural processes (ConvNPs). ConvNPs are meta-learning models that use convolutional neural networks to learn maps from heterogeneous input datasets to a context-dependent Gaussian predictive model. We train ConvNPs using reanalysis data to learn to model daily global AAOD from sparse point observations given at station locations and additional gridded auxiliary data. The model’s probabilistic predictions are then harnessed in an active learning framework to sequentially propose new observation locations that optimally reduce model uncertainty and improve the network's informativeness. Our subsequent analysis considers further practical factors that might trade off with informativeness in the selection of new station locations, such as cloudiness and remoteness. The resulting proposed placements identify locations that would optimally enhance ground-based AAOD observation and can inform and focus future network expansion efforts.

How to cite: Pelucchi, P., Coca-Castro, A., Andersson, T. R., Vicent Servera, J., and Camps-Valls, G.: Optimal Sensor Placement for Aerosol Absorption Optical Depth with Convolutional Neural Processes, EGU General Assembly 2025, Vienna, Austria, 27 Apr–2 May 2025, EGU25-18735, https://doi.org/10.5194/egusphere-egu25-18735, 2025.

EGU25-19177 | ECS | Orals | ITS1.1/CL0.9

Coupling a new convection parameterisation trained using high-resolution simulations to the Community Atmospheric Model 

Jack Atkinson, Paul O'Gorman, Judith Berner, and Marion Weinzierl

A commonly observed issue in general circulation models is biases in the frequency distribution of precipitation, including too much weak rain (the drizzle problem) and either too much or too little heavy precipitation.  High resolution models perform better on this front, but are restricted in the spatial and temporal scales they can simulate.

Previous work (Yuval, O'Gorman, Hill (2021)) demonstrated that training a neural network parameterisation on high-resolution convection-resolving simulations and deploying it within the same model running at lower horizontal resolution can maintain a good representation of precipitation. 

Our work builds on this seeking to redeploy the parameterisation within a global atmospheric model, the Community Atmosphere Model (CAM), as a deep convection scheme, with the aim of running stable simulations with improved precipitation prediction.  To do so requires interfacing the scheme to operate on a different vertical grid using a different system of variables to the original model in which it was trained.

In this talk we will present this work discussing the objectives alongside the challenges faced moving the parameterisation from one model to another.  We share the results from validation in single-column mode against field campaign observations, and of running the scheme globally in an aquaplanet configuration.  We will also discuss software architecture and engineering considerations when seeking to develop and redeploy portable machine-learnt parameterisation schemes.

How to cite: Atkinson, J., O'Gorman, P., Berner, J., and Weinzierl, M.: Coupling a new convection parameterisation trained using high-resolution simulations to the Community Atmospheric Model, EGU General Assembly 2025, Vienna, Austria, 27 Apr–2 May 2025, EGU25-19177, https://doi.org/10.5194/egusphere-egu25-19177, 2025.

EGU25-19180 | ECS | Orals | ITS1.1/CL0.9

Enforcing Conservation Laws in Neural Operators for Earth System Modeling 

Alistair White, Valentin Duruisseaux, Boris Bonev, Kamyar Azizzadenesheli, Anima Anandkumar, and Niklas Boers

Neural operators are transforming computationally intensive scientific disciplines such as weather forecasting and climate modeling, accelerating simulations by several orders of magnitude. However, they often fail to respect fundamental physical principles, such as conservation laws, during long autoregressive rollouts. We introduce an efficient correction layer that enforces global conservation constraints in neural operators. For initial conditions approximately satisfying the constraints, we prove that conservation can be guaranteed while only moderately increasing the total runtime. In a number of fluid dynamics experiments, our method produces physically realistic simulations while maintaining the computational advantages of neural operators. Our results enable the development of reliable and efficient climate model emulators by ensuring that crucial physical balance equations, such as mass and energy, are preserved during extended simulations.

How to cite: White, A., Duruisseaux, V., Bonev, B., Azizzadenesheli, K., Anandkumar, A., and Boers, N.: Enforcing Conservation Laws in Neural Operators for Earth System Modeling, EGU General Assembly 2025, Vienna, Austria, 27 Apr–2 May 2025, EGU25-19180, https://doi.org/10.5194/egusphere-egu25-19180, 2025.

EGU25-19397 | ECS | Posters on site | ITS1.1/CL0.9

Stochastic diffusion model for large-scale temperature downscaling 

Marc Benitez Benavides, Mirta Rodríguez, Tomàs Margalef, Javier Panadero, and Omjyoti Dutta

Generative Deep Learning architectures, such as Diffusion models, offer an alternative to traditional physical modeling and regression models due to their ability to produce stochastic ensembles with a single run. Even though these models are capable of downscaling coarse data, they are often trained in contained regions, which can lead to severe spatial overfitting as the model learns location-specific patterns rather than generalizable physical relationships. In practice, the usability of the models is constrained to the area where they were originally trained, and their predictive capabilities degrade significantly when applied to regions outside the training domain, even if these regions share similar characteristics.
This study presents a one-step and two-step diffusion model capable of downscaling 2-meter temperature from ERA5 to higher-resolution grids in large areas, such as the Contiguous United States or Europe, without spatially overfitting. We use CONUS404, a reanalysis dataset created using simulations of the Weather Research and Forecasting (WRF) model over the Contiguous United States, as our target data and ERA5 and constants involved in the creation of CONUS404, such as altitude and land use, as our input. The model has been trained over the whole area using 10 years of 3-hourly data, and two years have been used for testing. To study the spatial generalization capabilities of the model, we reserve an area of the study region solely for testing and compute evaluation metrics separately for this area to ensure meaningful results. We compare the results of training in large and small areas and the number of years. In addition, we discuss the usefulness of ensemble prediction and the effect that the number of ensemble members has on the performance of the downscaling. Future steps include applying this methodology for downscaling EURO-CORDEX to EMO1 and multivariate downscaling.

How to cite: Benitez Benavides, M., Rodríguez, M., Margalef, T., Panadero, J., and Dutta, O.: Stochastic diffusion model for large-scale temperature downscaling, EGU General Assembly 2025, Vienna, Austria, 27 Apr–2 May 2025, EGU25-19397, https://doi.org/10.5194/egusphere-egu25-19397, 2025.

EGU25-21270 | Orals | ITS1.1/CL0.9

Climate Prediction Based on Latent Space Dynamics 

Balasubramanya Nadiga and Kaushik Srinivasan

We consider a data-driven framework for climate prediction tasks in which the dynamics are learnt in a low-dimensional latent space. We rely on dimensionality reduction techniques --- linear principal component analysis and nonlinear autoencoders and their variants --- to then learn dynamical evolution  in the corresponding latent space using disparate methodologies --- linear inverse modeling, dictionary-based sparse regression, reservoir computing, neural differential equations, attention-based transformers, etc. In this setting, we seek to better understand the interplay between the spatial and temporal representations of variability and how they affect prediction skill.

Balu Nadiga, Los Alamos National Laboratory and Kaushik Srinivasan, University of California Los Angeles

How to cite: Nadiga, B. and Srinivasan, K.: Climate Prediction Based on Latent Space Dynamics, EGU General Assembly 2025, Vienna, Austria, 27 Apr–2 May 2025, EGU25-21270, https://doi.org/10.5194/egusphere-egu25-21270, 2025.

Seismic data forms the backbone of what we understand in the subsurface, and seismic data interpretation is still usually done by hand. Automatic seismic interpretation with deep learning is very promising, but there the problem is a lack of labelled training data. In this study, we use forward stratigraphic modelling and show how forward modelling can be advantageously used in deep learning.

Specifically, we focus on shelf-edge trajectories as the geological representations of lateral and vertical shifts in sediments’ position through time. They provide continuous tracks of changes in relative sea-level as well as sediment stacking patterns and depositional geometries. Mapping these trajectories and measuring their changing angles help in quantifying the sequence stratigraphic analysis and predicting ancient depositional environments.

Here, we evaluate the ability of deep learning models, trained on synthetic seismic data, to identify clinoforms and their rollover points for shelf-edge trajectories mapping. The synthetic training dataset generated using geological processed-based forward modelling represents different depositional slope scenarios. Controlling the different parameters that govern shelf-edges and shelf-edge trajectories (such as bathymetry, sediment supply, eustatic sea-level changes and subsidence) gave us a better chance to mimic realistic and diverse depositional setting, which helps in generalizing the deep learning model. In addition, the ground truth (labels) for the created synthetic seismic data is automatically generated by the forward model, without the need of manual labelling seismic data.

Higher accuracy score on both validation and testing datasets demonstrates the power and effectiveness of using synthetic as training dataset. This study shows that synthetic data can play a major role in bridging the gap between traditional seismic interpretation and automating the process using machine learning. It also shows that forward modelling is a powerful technique to combine with data modelling, such as machine learning.

How to cite: AlGharbi, W., Bell, R., and John, C.: Forward Stratigraphic Modelling to Generate Synthetic Seismic Training Dataset for Deep Learning: A Case Study to Predict Shelf-Edge Trajectories, EGU General Assembly 2025, Vienna, Austria, 27 Apr–2 May 2025, EGU25-288, https://doi.org/10.5194/egusphere-egu25-288, 2025.

This study aims to develop a CNN-LSTM hybrid network model integrated with a coupled self-attention mechanism, based on deep learning techniques, to simulate flood processes in the Inner Harbor area of Macau. With global climate change and accelerated urbanization, Macau, a low-lying coastal city, frequently experiences urban flooding due to typhoons and heavy rainfall. While traditional hydrological and hydrodynamic models can accurately predict flooding processes, their computational intensity and lack of real-time responsiveness make them unsuitable for emergency disaster warnings. To address these limitations, this paper proposes a convolutional long short-term memory (ConvLSTM) model enhanced with a coupled self-attention mechanism. The model leverages an encoder-decoder structure to predict the evolution of flood processes under 4–10 hours of heavy rainfall in the Inner Harbor area of Macau.

The model integrates CNN components for extracting spatial features, LSTM components for capturing temporal features, and a coupled self-attention mechanism to dynamically reweight spatial-temporal representations, improving the model's sensitivity to key flood patterns. The encoder encodes input sequences into fixed-length vectors, while the decoder translates these vectors into target sequences. The self-attention mechanism ensures the model focuses on critical spatial and temporal regions, further enhancing prediction accuracy and robustness.

The training and testing datasets were constructed from simulation data generated by hydrological-hydrodynamic models and static geographical information data, following preprocessing and normalization. Evaluation metrics, including mean squared error (MSE), Nash-Sutcliffe efficiency coefficient (NSE), and relative error, were used to assess model performance. Results demonstrate that the proposed hybrid model, augmented by the coupled self-attention mechanism, effectively simulates maximum water depth distribution and flood evolution processes, achieving high consistency with hydrodynamic simulation data while providing improved predictive performance.

How to cite: Wangqi, L.: Flood Process Simulation in Macau's Inner Harbor Area Based on CNN-LSTM, EGU General Assembly 2025, Vienna, Austria, 27 Apr–2 May 2025, EGU25-2197, https://doi.org/10.5194/egusphere-egu25-2197, 2025.

EGU25-4565 | Orals | ITS1.4/CL0.10

AI enhanced environmental modelling workflows: Towards Automated Scientific Exploration in Hydrology 

Darri Eythorsson, Kasra Keshavarz, Cyril Thébault, Mohamed Ahmed, Raymond Spiteri, Alain Pietroniro, and Martyn Clark

AI enhanced environmental modelling workflows: Towards Automated Scientific Exploration in Hydrology

Authors: Darri Eythorsson, Kasra Keshavarz, Cyril Thébault, Mohamed Ismaiel Ahmed, Raymond Spiteri, Alain Pietroniro and Martyn Clark

Modern hydrological modeling has evolved into a complex scientific endeavour requiring sophisticated workflows that span multiple scales, processes, and computational paradigms. While existing workflow solutions address specific technical challenges, the field lacks comprehensive frameworks that can support end-to-end modeling while maintaining reproducibility and scalability. This works introduces two complementary frameworks that aim to address these fundamental challenges: CONFLUENCE (Community Optimization Nexus For Large-domain Understanding of Environmental Networks and Computational Exploration) and INDRA (the Intelligent Network for Dynamic River Analysis).

CONFLUENCE implements a modular architecture that enforces workflow reproducibility through a unified configuration system while maintaining the flexibility needed to support diverse modeling applications. The framework provides comprehensive solutions for four critical workflow components: (1) flexible geospatial domain definition and discretization, (2) model-agnostic data acquisition and preprocessing, (3) extensible model setup and parameterization capabilities, and (4) comprehensive evaluation and optimization tools. This systematic approach enables efficient, reproducible, and transparent hydrological modeling across scales.

INDRA augments this foundation by implementing a network of specialized AI expert agents that support various components of the hydrological modeling workflow. Through structured dialogue between domain experts (including AI specialists in hydrology, hydrogeology, meteorology, data science, and geospatial analysis), INDRA provides context-aware guidance while maintaining complete provenance of modeling decisions and their justification. This AI-assisted approach helps address three critical challenges: (1) the growing complexity of modelling decisions, (2) the need for reproducible workflows and detailed documentation, and (3) the technical barriers limiting broader adoption of advanced modeling practices.

The integration of these frameworks aims to explore how automation and AI assistance can enhance rather than disrupt traditional modeling practices. By maintaining clear documentation of decisions and their justifications, these systems help build trust in model results while creating opportunities for recursive learning from previous modeling experiments. Our case studies, spanning scales from individual catchments to continental domains, showcase the frameworks' capabilities while highlighting their potential to transform how researchers’ interface with complex environmental modeling workflows.

This work aims to advance both operational and research oriented hydrological modeling practices, offering a foundation for reproducible, scalable, and interoperable modeling while maintaining scientific rigor and flexibility. The framework’s open-source nature and modular design create opportunities for community-driven development and extension, potentially accelerating scientific discovery in hydrological sciences.

How to cite: Eythorsson, D., Keshavarz, K., Thébault, C., Ahmed, M., Spiteri, R., Pietroniro, A., and Clark, M.: AI enhanced environmental modelling workflows: Towards Automated Scientific Exploration in Hydrology, EGU General Assembly 2025, Vienna, Austria, 27 Apr–2 May 2025, EGU25-4565, https://doi.org/10.5194/egusphere-egu25-4565, 2025.

EGU25-5159 | ECS | Orals | ITS1.4/CL0.10

RAIN: Reinforcement Algorithms for Improving Numerical Weather and Climate Models 

Pritthijit Nath, Henry Moss, Emily Shuckburgh, and Mark Webb

This study explores integrating reinforcement learning (RL) with idealised climate models to address key parameterisation challenges in climate science. Current climate models rely on complex mathematical parameterisations to represent sub-grid scale processes, which can introduce substantial uncertainties. RL offers capabilities to enhance these parameterisation schemes, including direct interaction, handling sparse or delayed feedback, continuous online learning, and long-term optimisation. We evaluate the performance of eight RL algorithms on two idealised environments: one for temperature bias correction, another for radiative-convective equilibrium (RCE) imitating real-world computational constraints. Results show different RL approaches excel in different climate scenarios with exploration algorithms performing better in bias correction, while exploitation algorithms proving more effective for RCE. These findings support the potential of RL-based parameterisation schemes to be integrated into global climate models, improving accuracy and efficiency in capturing complex climate dynamics. Overall, this work represents an important first step towards leveraging RL to enhance climate model accuracy, critical for improving climate understanding and predictions. Code accessible at https://github.com/p3jitnath/climate-rl.

How to cite: Nath, P., Moss, H., Shuckburgh, E., and Webb, M.: RAIN: Reinforcement Algorithms for Improving Numerical Weather and Climate Models, EGU General Assembly 2025, Vienna, Austria, 27 Apr–2 May 2025, EGU25-5159, https://doi.org/10.5194/egusphere-egu25-5159, 2025.

EGU25-5991 | ECS | Posters on site | ITS1.4/CL0.10

Physically-Enhanced Training of Neural Networks for Hydraulic Modelling of Rivers and Flood Events 

Gianmarco Guglielmo and Pietro Prestininzi

Machine Learning is gaining increasing attention from the scientific community in hydrological and hydraulic research. However, this field faces a consistent challenge in applying data-driven approaches due to the evident poor generalization capabilities, which are partly a result of inherent data scarcity.

We propose incorporating expert knowledge into data-driven models for river hydraulics and flood mapping by integrating physically-based information without relying on the underlying mathematical formulation (e.g., the calculation of the residuals of differential equations). This approach appears to be particularly valuable for flood simulations, where hydraulically relevant distributed parameters such as roughness, lithology, topography etc. pose significant uncertainties. The method is versatile and applicable to physical systems and scenarios in which the underlying mathematical formulation is not fully known, but expert knowledge enables the introduction of meaningful, physically-inspired constraints.

Specifically, the physical information is integrated into the model by including an additional term, weighted by the hyperparameter in the guise of a regularization term in the loss function :


Here, represents the data-driven error metric, while the physical loss term is an error metric that depends not only on the true and predicted outputs ( ), but also potentially on the inputs . Indeed, this term employs physical principles, laws, and quantities, which are not explicitly formulated in the original dataset. In this sense, we can note its similarity to data augmentation, a widely used technique in machine learning that extracts additional insights by offering alternative interpretations of the same dataset.

We clarify that this approach does not aim to replace numerical solvers or serve as an alternative numerical model, as Physics-Informed Neural Networks do: indeed, their similarity is limited to the formulation of the modified loss function.

We assessed the methodology and empirically quantified the effectiveness of the method in a simplified, well-controlled problem, evaluating the gain in generalisation capability of Neural Networks (NNs) in the reconstruction of the steady state, one-dimensional, water surface profile in a rectangular channel. We found improved predictive capabilities, even when extrapolating beyond the boundaries of the training dataset and in data-scarce scenarios. This kind of assessment is of great relevance to the application of NNs to flood mapping, where cases featuring values of the observed quantities falling out of the range of the recorded series need to be predicted.

New experiments have been also conducted on two-dimensional domains. The data-driven model was trained on a single catchment and tested on its ability to determine flooded areas in unseen catchments. Preliminary results show that an encoder-decoder model with convolutional layers exhibits improved generalization when a physical training strategy is employed. Future applications could include flood mapping for ungauged basins, leveraging similarities with other basins.

How to cite: Guglielmo, G. and Prestininzi, P.: Physically-Enhanced Training of Neural Networks for Hydraulic Modelling of Rivers and Flood Events, EGU General Assembly 2025, Vienna, Austria, 27 Apr–2 May 2025, EGU25-5991, https://doi.org/10.5194/egusphere-egu25-5991, 2025.

EGU25-9987 | ECS | Posters on site | ITS1.4/CL0.10

Modelling Maize Yield and Agronomic Efficiency Using Machine Learning Models: A Comparative Analysis 

Eric Asamoah, Gerard Heuvelink, Ikram Chairi, Prem Bindraban, and Vincent Logah

Background: Agriculture is increasingly leveraging machine learning (ML) to enhance yield predictions and optimize agronomic practices. Maize, a staple crop in Ghana, offers a valuable case study for evaluating the effectiveness of diverse ML models in yield prediction and resource management.

Objective: This study aims to evaluate the predictive performance of four ML models namely Random Forest (RF), Support Vector Machine (SVM), K-Nearest Neighbours (KNN), and Extreme Gradient Boosting (XGBoost) for maize yield and agronomic efficiency prediction. It also compares variable importance across these models to determine key explanatory variables.

Methods: The study utilized 4,496 georeferenced maize trial datasets from various agroecological zones in Ghana. Thirty-five explanatory variables included soil properties, climate, topography, crop management practices, and fertilizer application datasets. Model performance was evaluated using leave-one-out, leave-site-out, and leave-agroecological-zone-out cross-validation techniques. Metrics including Mean Error (ME), Root Mean Squared Error (RMSE), and Model Efficiency Coefficient (MEC) were used to compare model accuracy, while a permutation-based approach was employed to assess variable importance.

Results: XGBoost emerged as the most accurate model, achieving the lowest RMSE for yield (639.5 kg ha⁻¹) and agronomic efficiency (11.6 kg kg⁻¹), particularly for nitrogen (AE-N). RF demonstrated competitive performance, while KNN and SVM yielded inconsistent results under rigorous cross-validation conditions. Key explanatory variables identified across models included nitrogen fertilizer, rainfall, and crop genotype, underscoring their critical role in yield and agronomic efficiency outcomes.

Conclusion: XGBoost was the most robust and accurate model for maize yield and agronomic efficiency predictions, offering a reliable tool for data-driven agricultural planning in diverse agroecological settings. The findings underscore the transformative role of advanced ML techniques in modern agriculture, particularly in optimizing staple crop production in sub-Saharan Africa.

How to cite: Asamoah, E., Heuvelink, G., Chairi, I., Bindraban, P., and Logah, V.: Modelling Maize Yield and Agronomic Efficiency Using Machine Learning Models: A Comparative Analysis, EGU General Assembly 2025, Vienna, Austria, 27 Apr–2 May 2025, EGU25-9987, https://doi.org/10.5194/egusphere-egu25-9987, 2025.

EGU25-10915 | ECS | Posters on site | ITS1.4/CL0.10

Assessing the Geological Plausibility of Machine Learning Borehole Interpretations: A Case Study in the Roer Valley Graben 

Sebastián Garzón, Willem Dabekaussen, Eva De Boever, Freek Busschers, Siamak Mehrkanoon, and Derek Karssenberg

Expert interpretation of borehole data is a critical component of geological modelling, offering essential insights into the spatial distribution of geological units within the subsurface. For large-scale regional mapping efforts, expert interpretation of all available data is impractical due to the sheer volume of boreholes. Therefore, many 3D geological subsurface models rely only on a small portion of all available data. Machine learning (ML) models can be used to automate borehole data interpretation, increasing data density. However, these automated interpretations must adhere to strict spatial and stratigraphical relationships to be consistent with the established geological knowledge of the area. Using a dataset of 1,400 boreholes with expert interpretations from the Roer Valley Graben (Southeast Netherlands), we explore how ML models can be integrated into geological modelling workflows, highlighting the challenge of ensuring compatibility with geological principles and known spatial relationships. We evaluate the model performance using traditional metrics such as accuracy, Cohen's kappa and F1 Score and newly proposed geology-inspired metrics to quantify the ability of Random Forest and Neural Network models to interpret borehole data into lithostratigraphic units while preserving key geological relationships. Our results demonstrate that while many models achieve accuracy values of 75% to 80%, Neural Networks perform significantly better in capturing the expected sequential relationships between geological units, achieving up to 96% of geological transitions between geological units that are plausible, compared to 65% for the best-performing Random Forest model selected based on traditional metrics. This study underscores the need for domain-specific metrics in evaluating model performance and the potential for ML to increase the volume of data incorporated in subsurface models.

How to cite: Garzón, S., Dabekaussen, W., De Boever, E., Busschers, F., Mehrkanoon, S., and Karssenberg, D.: Assessing the Geological Plausibility of Machine Learning Borehole Interpretations: A Case Study in the Roer Valley Graben, EGU General Assembly 2025, Vienna, Austria, 27 Apr–2 May 2025, EGU25-10915, https://doi.org/10.5194/egusphere-egu25-10915, 2025.

EGU25-11031 | ECS | Posters on site | ITS1.4/CL0.10

Mapping Alluvial Terraces in Watersheds Using Gaussian Mixture Model on Relative Height. 

Herbert Rakotonirina, Théophile Lohier, Anne Raingeard, Frédéric Lacquement, Julien Baptiste, and Hélène Tissoux

Abstract:
Alluvial terraces in watersheds are geomorphic features formed by river incision and sediment deposit, representing former floodplain levels. They serve as valuable records of fluvial dynamics, climatic changes, and tectonic activity. Mapping methods for terraces that rely on field-acquired data, often involving physical or chemical analyses, are not feasible for large-scale applications. When aiming to map at the national scale, the development of a methodology that eliminates the need for such detailed information enhances scalability and broadens applicability.

We proposed a semi-automatic predictive mapping method for watershed terraces using 25m Digital Earth Model (DEM) provided by the IGN (French geographical service) and derived variables such as curvature, slope, and the difference from a base level (Raingeard et al., 2019). This method demonstrated meaningful results in the Pyrenean Piedmont for the Baïse and Ousse rivers, with the predicted map showing strong alignment with the geological reality.

In this study, we propose an automated approach for identifying alluvial terraces using relative height. Relative height is defined as the difference between the elevation derived from a DEM and the base level. Our methodology is based on the hypothesis that terraces are represented as flat areas in the relative height, where pixels exhibit similar statistical distributions. To capture these patterns, we employ a Gaussian Mixture Model, a probabilistic framework that approximates data as a combination of multiple Gaussian distributions. In this context, each Gaussian distribution corresponds to a specific alluvial terrace.

We conducted experiments on the study areas used by Raingeard et al. (2019), and the results are consistent with both the semi-automatic method and the geological reality. These outcomes provide promising prospects for the predictive mapping of superficial deposits

Reference:

Raingeard A., Tourlière B., Lacquement. F, Baptiste. J, Tissoux. H. Semi-automatic quaternary alluvial deposits mapping - Methodology for the predictive mapping of flat terrains within a watershed, by semi-automatic analysis of the Digital Elevation Model. INQUA 2019, Jul 2019, Dublin, Ireland. 2019.


How to cite: Rakotonirina, H., Lohier, T., Raingeard, A., Lacquement, F., Baptiste, J., and Tissoux, H.: Mapping Alluvial Terraces in Watersheds Using Gaussian Mixture Model on Relative Height., EGU General Assembly 2025, Vienna, Austria, 27 Apr–2 May 2025, EGU25-11031, https://doi.org/10.5194/egusphere-egu25-11031, 2025.

EGU25-11747 | ECS | Orals | ITS1.4/CL0.10

A new stochastic physics scheme incorporating machine-learnt subgrid variability 

Helena Reid and Cyril Morcrette

Stochastic parameterisations have seen widespread use in atmospheric models. These schemes represent uncertainty by adding terms that include a random noise component directly to the equations that describe the time evolution of the model. Stochastic parameterisation development thus involves the following questions: what are the sources of uncertainty, how do we represent them, and how precisely should we formulate stochastic terms to quantify them? Common methods to quantify the uncertainty inherent in parameterisation include applying multiplicative perturbations to physics tendencies (such that the larger the tendency due to subgrid processes, the more uncertainty we should have in the tendency) or applying perturbations to physical parameters (our physics schemes often rely on parameters whose values we do not know precisely, and have complicated nonlinear responses to perturbing this set of parameters, so perturbing each one within its own specified range during the model run allows this uncertainty to feed back into the model state).

In this work we present a different approach to stochastic parameterisation. We perturb the thermodynamic profiles that constitute the inputs to parameterisation schemes. The perturbations are scaled by the degree of subgrid inhomogeneity. A representation of the subgrid inhomogeneity is estimated by a machine learning model which has been trained on coarse-grained high resolution (dx=~1.5km) model output from the Met Office Unified Model. The scheme is implemented in LFRic, the UK Met Office’s next generation modelling system, and we present results of experiments ran in single column model mode.

How to cite: Reid, H. and Morcrette, C.: A new stochastic physics scheme incorporating machine-learnt subgrid variability, EGU General Assembly 2025, Vienna, Austria, 27 Apr–2 May 2025, EGU25-11747, https://doi.org/10.5194/egusphere-egu25-11747, 2025.

EGU25-12464 | ECS | Posters on site | ITS1.4/CL0.10

Water table rise forecasting using machine and deep learning models in arid regions, Oman 

Hussam Eldin Elzain, Osman Abdalla, Ali Al-Maktoumi, Anvar Kacimov, and Mingjie Chen

Accurately forecasting water table rise (WTR) is essential for effective water resource management, infrastructure development, flood risk mitigation, and environmental conservation. This research employed multiple machine learning (ML) models, namely Ridge Linear Regression (RLR), Radial Basis Function Support Vector Machine (RBF-SVM), Linear SVM (LSVM), Random Forest (RF), and a hybrid deep learning Transformer (TR) with Bi-Long Short-Term Memory (BiLSTM), to forecast WTR one and two weeks ahead in the Muscat Governorate, Oman. A total of 19,465 high-resolution datasets, measured at half-hour intervals between December 2017 and January 2019, were utilized. The data were divided into training and testing sets, with 90% (17,976 datasets) used for training and the remaining 10% (1,489 datasets) reserved for testing. A two-way time series analysis was employed to analyze dynamic interactions between two time-dependent behaviors over time. Additionally, the rolling forecasting method was used alongside the models to capture patterns and provide updated predictions based on the most recent data trends. The results demonstrated that RLR outperformed both the individual ML models and the hybrid deep learning TR-BiLSTM models, as indicated by the NSE and RSR statistical metrics applied to the testing data. Furthermore, the one-week step-ahead forecasting achieved greater accuracy in predicting WTR compared to the two-week step-ahead forecast. However, the average computational time of the hybrid deep learning TR-BiLSTM models was notably higher compared to the standalone models. Linear models such as RLR and LSVM demonstrated accurate forecasting results due to their ability to prevent overfitting in correlated features and effectively capture the simplicity of the relationship between the data. The approach presented in this research can be effectively useful to various arid regions worldwide that are influenced by WTR.

How to cite: Elzain, H. E., Abdalla, O., Al-Maktoumi, A., Kacimov, A., and Chen, M.: Water table rise forecasting using machine and deep learning models in arid regions, Oman, EGU General Assembly 2025, Vienna, Austria, 27 Apr–2 May 2025, EGU25-12464, https://doi.org/10.5194/egusphere-egu25-12464, 2025.

EGU25-12601 | ECS | Orals | ITS1.4/CL0.10

Differentiable Programming for Atmospheric Models: Experiences and Perspectives  

Maximilian Gelbrecht, Milan Klöwer, and Niklas Boers

Differentiable programming enables automatic differentiation (AD) tools to compute gradients through code without manually defining derivatives. AD tools can differentiate through entire software stacks, composing many functions and algorithms via the chain rule. With models that incorporate differentiable programming long-standing challenges like systematic calibration, comprehensive sensitivity analyses, and uncertainty quantification can be tackled, and machine learning (ML) methods can be integrated directly into the process-based core of earth-system models (ESMs) to incorporate additional information from observations. Through the advent of ML, several AD tools are gaining traction. A new generation of powerful tools like JAX, Zygote and Enzyme enable differentiable programming for models of varying complexity including highly complex coupled ESMs. Here we present an overview about the perspectives of differentiable programming for ESMs, using experience from two of our applications in atmospheric modelling. First off, we set up PseudoSpectralNet, a differentiable quasi-geostrophic model in Julia with Zygote. This is a hybrid model combining neural networks with a dynamical core, showcasing how the stability and accuracy of ML models is improved by integrating a process-based dynamical core into our model. Additionally, ongoing work uses Enzyme to achieve a differentiable version of the significantly more complex SpeedyWeather.jl atmospheric model. We will discuss advantages of both approaches and give an outlook into future possibilities with differentiable models. 

How to cite: Gelbrecht, M., Klöwer, M., and Boers, N.: Differentiable Programming for Atmospheric Models: Experiences and Perspectives , EGU General Assembly 2025, Vienna, Austria, 27 Apr–2 May 2025, EGU25-12601, https://doi.org/10.5194/egusphere-egu25-12601, 2025.

EGU25-13920 | ECS | Orals | ITS1.4/CL0.10

Physics-Guided Deep Learning-Based Emulation of Subgrid-Scale Turbulence Parameterization for Atmospheric Large Eddy Simulations 

Sambit Kumar Panda, Todd Jones, Muhammad Shahzad, Anna-Louise Ellis, and Bryan Lawrence

Accurate representation of turbulent processes remains a critical challenge in atmospheric modelling. Large Eddy Simulations (LES) serve as valuable tools for understanding atmospheric turbulence by explicitly resolving energy-containing eddies while parameterizing smaller-scale motions through subgrid-scale (SGS) models. In their most complex forms, these SGS parameterizations can significantly influence LES performance and computational efficiency, making their improvement useful for advancing atmospheric modelling capabilities. Neural Network based emulation of such parametrizations have proven effective in reducing the computational cost, while maintaining accuracy and stability.

Building upon recent advances in physics-informed neural networks (NN) for atmospheric modelling and emulation of physics-based processes, we present a physics-guided NN architecture for emulation of the SGS turbulence parameterizations that introduces several key innovations. Our approach uniquely combines scale-specific normalization with multi-scale feature extraction through parallel convolutional paths, distinguishing it from existing physics-guided machine learning frameworks. The deep learning-based (DL) model also incorporates physically-motivated constraints across different spatial scales while simultaneously ensuring conservation of momentum and energy.

Unlike earlier studies that focus on single aspects of physical conservation, our architecture implements a comprehensive physics-informed framework that combines Richardson number gradient handling for stability constraints, with explicit treatment of diffusion and viscosity coefficients, and scale-specific normalization for different atmospheric variables. The model was trained on limited high-resolution Radiative-Convective Equilibrium (RCE) simulations from the Met Office-Natural Environment Research Council (NERC) Cloud model (MONC), employing physics-based loss functions that enforce both conservation laws and stability constraints.

The training dataset consisted of 3-D diagnostics data from the RCE simulations, with a 64x64 km2 domain and 1 km grid spacing in the horizontal. While the original simulations had 99 vertical levels with varying vertical resolution, the DL model was trained on random slices (vertical levels) chosen from the original data volume. The inputs consisted of the resolved state variables like velocity components (u, v, w) from the previous time step, the perturbations to potential temperature, mixing ratios and Richardson number, whereas the targets for the DL model were the SGS tendencies of the model prognostic fields resulting from the Smagorisnky parameterization and the coefficients of viscosity and diffusion.

The DL model's cross-regime applicability was evaluated through multiple independent test cases: (200-second sampling frequency) and different atmospheric conditions from the Atmospheric Radiation Measurement (ARM) program. The simulations from ARM atmospheric settings were mainly targeted at simulating shallow convection, with different grid/domain configurations. Results from the off-line tests demonstrate promising performance in predicting SGS and transport coefficients (viscosity and diffusion) across these varied conditions, particularly in maintaining physical consistency during regime transitions.

Our preliminary findings indicate that this enhanced multi-scale, physics-informed architecture can effectively learn SGS parameterizations from limited training data while maintaining physical fidelity across different atmospheric conditions and spatio-temporal resolutions. This approach demonstrates the potential for the development of high-fidelity, generalizable parameterizations for weather and climate models, suggesting a route forward for reducing the greater computational costs associated with more complex SGS parameterization schemes.

How to cite: Panda, S. K., Jones, T., Shahzad, M., Ellis, A.-L., and Lawrence, B.: Physics-Guided Deep Learning-Based Emulation of Subgrid-Scale Turbulence Parameterization for Atmospheric Large Eddy Simulations, EGU General Assembly 2025, Vienna, Austria, 27 Apr–2 May 2025, EGU25-13920, https://doi.org/10.5194/egusphere-egu25-13920, 2025.

EGU25-14742 | ECS | Orals | ITS1.4/CL0.10

NORi: A Novel, Physically-Principled Approach to Parameterization of Upper Ocean Turbulence using Neural Ordinary Differential Equations 

Xin Kai Lee, Ali Ramadhan, Andre Souza, Gregory Wagner, Simone Silvestri, John Marshall, and Raffaele Ferrari

Given our current computational resources, a state-of-the-art ocean model can achieve a grid resolution in the order of 10 km for realistic global simulations, meaning that small-scale convection and wind-driven mixing near the surface of the ocean with length scales of roughly 1 m cannot be explicitly resolved. However, these microturbulent processes play a fundamental role in setting the structure of the ocean stratification, govern air-sea fluxes exchange as well as tracer transport with the interior of the ocean. Therefore, we use parameterizations, models which approximate small-scale processes using large-scale variables, to represent their effects in climate simulations.

In this work, we propose NORi: a novel, physically-principled, and data-driven approach to parameterizing ocean vertical mixing using neural ordinary differential equations (NODEs). NORi uses neural ODEs (NO) to augment a simple eddy-diffusivity closure based on the local gradient Richardson number (Ri). The Ri-based diffusivity closure captures local convective- and shear-driven mixing, while the neural ODEs augment the base model with nonlocal entrainment fluxes due to convection using neural networks. NORi is designed for realistic seawater's nonlinear equation of state using TEOS-10 and explicitly represents temperature and salinity fluxes. When compared against high fidelity large-eddy simulations (LES) of different convective strengths, background stratifications, and shear conditions, NORi demonstrates excellent prediction and generalization capabilities. By design, NORi automatically satisfies tracer invariance and conservation. It also exhibits high numerical stability and accuracy owing to its online training paradigm, where neural networks are calibrated against time-integrated field variables of interest rather than on instantaneous, time-independent turbulent fluxes. When compared against other parameterizations, NORi produces deeper mixed layers which are in better agreement with the LES solution. NORi is implemented straightforwardly into Oceananigans.jl, the fastest ocean model to date without intermediate wrappers. This can be achieved owing to the cutting-edge paradigm of the Julia programming language as well as the simple, modern and flexible interface of Oceananigans.jl. Using large-scale simulations, we demonstrate that NORi is numerically stable for at least 100 years despite being trained with only a 2-day integration, is computationally efficient, and produces realistic fields which are comparable to existing parameterization.

How to cite: Lee, X. K., Ramadhan, A., Souza, A., Wagner, G., Silvestri, S., Marshall, J., and Ferrari, R.: NORi: A Novel, Physically-Principled Approach to Parameterization of Upper Ocean Turbulence using Neural Ordinary Differential Equations, EGU General Assembly 2025, Vienna, Austria, 27 Apr–2 May 2025, EGU25-14742, https://doi.org/10.5194/egusphere-egu25-14742, 2025.

EGU25-15200 | ECS | Orals | ITS1.4/CL0.10

Distilling Machine Learning's Added Value: Pareto Fronts in Atmospheric Applications 

Tom Beucler, Arthur Grundner, Sara Shamekh, Peter Ukkonen, Matthew Chantry, and Ryan Lagerquist

The added value of machine learning for weather and climate applications is measurable through performance metrics, but explaining it remains challenging, particularly for large deep learning models. Inspired by climate model hierarchies, we propose that a full hierarchy of Pareto-optimal models, defined within an appropriately determined error-complexity plane, can guide model development and help understand the models' added value. We demonstrate the use of Pareto fronts in atmospheric physics through three sample applications, with hierarchies ranging from semi-empirical models with minimal parameters (simplest) to deep learning algorithms (most complex). First, in cloud cover parameterization, we find that neural networks identify nonlinear relationships between cloud cover and its thermodynamic environment, and assimilate previously neglected features such as vertical gradients in relative humidity that improve the representation of low cloud cover. This added value is condensed into a ten-parameter equation that rivals deep learning models. Second, we establish a machine learning model hierarchy for emulating shortwave radiative transfer, distilling the importance of bidirectional vertical connectivity for accurately representing absorption and scattering, especially for multiple cloud layers. Third, we emphasize the importance of convective organization information when modeling the relationship between tropical precipitation and its surrounding environment. We discuss the added value of temporal memory when high-resolution spatial information is unavailable, with implications for precipitation parameterization. Therefore, by comparing data-driven models directly with existing schemes using Pareto optimality, we promote process understanding by hierarchically unveiling system complexity, with the hope of improving the trustworthiness of machine learning models in atmospheric applications.

Preprint: https://arxiv.org/abs/2408.02161

How to cite: Beucler, T., Grundner, A., Shamekh, S., Ukkonen, P., Chantry, M., and Lagerquist, R.: Distilling Machine Learning's Added Value: Pareto Fronts in Atmospheric Applications, EGU General Assembly 2025, Vienna, Austria, 27 Apr–2 May 2025, EGU25-15200, https://doi.org/10.5194/egusphere-egu25-15200, 2025.

The training of machine learning models for weather and climate on multiple datasets, including local high-resolution reanalyses and level-1 observations, is one of the frontiers of the field. It promises to allow for models that are no longer constrained by the capabilities of equation-based models, as is currently still largely the case when training on global reanalyses. For example, level-1 observations contain the feedback from arbitrary scale processes and hence do not suffer from the closure problem of equation-based models. Training on observations might hence lead to machine learning-based Earth system models with reduced systematic biases, in particular for long-term climate projections. Local reanalyses are only available for a small set of regions, mainly over Europe and North America. Appropriate training might allow one to generalize the detailed process information in these to other regions or even globally. 

In this talk, we present results on the effective training with a combination of global and local reanalysis as well as level-1 observations. We consider different pre-training protocols to learn the correlations between datasets, which is critical to obtain a benefit through their combination. We use a forecasting task as baseline and study the effectiveness of different variants of masked-token modeling and more sophisticated approaches that exploit the latent space of the machine learning models. We also study different fine-tuning strategies to extract a best state estimate from multiple datasets and to generalize regional datasets globally. For this, we build on the extensive results on fine-tuning of large language models that have been developed in the last years. Our results aim to determine general principles which combination of datasets is beneficial. We also perform a detailed analysis of the physical consistency and physical process representation in the model output. Through this, we believe our work provides an important stepping stone for the next generation of machine learning-based models for weather and climate.

How to cite: Lessig, C.: Towards next generation machine learning-based Earth system models that exploit a wide range of datasets, EGU General Assembly 2025, Vienna, Austria, 27 Apr–2 May 2025, EGU25-16817, https://doi.org/10.5194/egusphere-egu25-16817, 2025.

Mesoscale atmospheric processes that are neither resolved nor parameterized in global climate models, such as slantwise convection, can have a significant impact on climate variability and change. An example of such mesoscale influence on the climate is shown by Wills et al. 2024,  who demonstrate that circulation responses to surface anomalies are increased through heat and momentum fluxes by mesoscale processes. To enable longer simulations in comprehensive global climate models that include information about subgrid mesoscale processes, a machine learning (ML) parameterization could be applied at relatively low computational cost. So far, such ML parameterizations have been primarily applied to idealized geographies (e.g., aquaplanets), and they have not targeted midlatitude mesoscale processes in particular.

In this work, we focus on midlatitude mesoscale processes over the Gulf Stream region, as simulated by variable resolution CESM2 simulations, which have 14-km resolution over the North Atlantic. Learning subgrid fluxes from this model allows a targeted parametrization of mesoscale processes leading to vertical fluxes, namely slantwise convection and frontogenesis. We use an artificial neural network to predict vertical profiles of subgrid fluxes of momentum, heat and moisture. The features (inputs) for the ML models in this work include coarse-grained atmospheric state variables at each grid point, such as the vertical profiles of horizontal winds, temperature and their horizontal shear as well as surface pressure. The vertical profile of the specific humidity and the value of convective available potential energy are included to assess the importance of moist dynamics in the determination of subgrid convectional fluxes. Our results show that moisture variables have a rather small impact, suggesting that the subgrid fluxes can be explained by dry dynamics. A greater importance is found in the horizontal differences of neighbouring momentum and temperature columns. This suggests that neighbouring column information may be essential in the prediction of subgrid-scale fluxes, e.g., through the action of shear instabilities or conditional symmetric instability. Combined with information about the vertical localization relationship of the inputs and outputs, the goal is to feed this information into an equation discovery approach, which could lead to deeper physical understanding of mesoscale momentum and energy fluxes in midlatitudes.


How to cite: Ismaili, E., Beucler, T., and Jnglin Wills, R.: Prediction and Understanding of Subgrid-Scale Vertical Fluxes by Missing Midlatitude Mesoscale Processes Using a Machine Learning Approach, EGU General Assembly 2025, Vienna, Austria, 27 Apr–2 May 2025, EGU25-17078, https://doi.org/10.5194/egusphere-egu25-17078, 2025.

EGU25-17333 | ECS | Orals | ITS1.4/CL0.10

Improving Oil Spill Numerical Simulations through Bayesian Optimization 

Marco Mariano De Carlo, Gabriele Accarino, Igor Atake, Donatello Elia, Italo Epicoco, and Giovanni Coppini

Accurate oil spill predictions are crucial for mitigating environmental and socioeconomic impacts. Numerical models, like MEDSLIK-II (De Dominicis et al., 2013), simulate oil advection, dispersion, and transformation, but their performance depends heavily on the configuration of physical parameters, often requiring labor-intensive manual tuning based on expert judgment.

To address this limitation, we integrate MEDSLIK-II with a Bayesian Optimization (BO) framework to systematically identify the optimal parameter configuration, ensuring simulations closely match observed spatiotemporal oil spill distributions. Our optimization focuses on horizontal diffusivity and drift factor parameters, using the Fraction Skill Score as the objective metric to maximize, thus reducing the overlap between simulations and observations.

The approach is validated on the 2021 Baniyas (Syria) oil spill, demonstrating improved accuracy, reduced biases and lower computational costs compared to the standalone numerical model.

By integrating BO with the MEDSLIK-II numerical model, our method enhances oil spill prediction capabilities and provides a transferable, physically consistent optimization framework applicable to a wide range of geophysical challenges.

This work is conducted within the framework of the iMagine European project, which leverages Artificial Intelligence, including AI-assisted image generation, to advance a series of use cases in marine and oceanographic science.


References

De Dominicis, M., Pinardi, N., Zodiatis, G., & Lardner, R. (2013). MEDSLIK-II, a Lagrangian marine surface oil spill model for short-term forecasting – Part 1: Theory. Geoscientific Model Development, 6, 1851–1869. https://doi.org/10.5194/gmd-6-1851-2013

How to cite: De Carlo, M. M., Accarino, G., Atake, I., Elia, D., Epicoco, I., and Coppini, G.: Improving Oil Spill Numerical Simulations through Bayesian Optimization, EGU General Assembly 2025, Vienna, Austria, 27 Apr–2 May 2025, EGU25-17333, https://doi.org/10.5194/egusphere-egu25-17333, 2025.

EGU25-17542 | Orals | ITS1.4/CL0.10

Replicating Sensible and Latent Heat Flux Diagnosis with Multilayer Perceptrons on Multi-Year Falkenberg Tower Data  

Martin V. Butz, Matthias Karlbauer, Frank Beyrich, and Volker Wulfmeyer

Vertical energy transport from the land surface into the atmosphere in the form of sensible and latent heat flux must be well represented in numerical weather prediction models to allow accurate estimates of near-surface atmospheric variables. Traditionally, these heat fluxes are parameterized relying on Monin-Obukhov Similarity Theory (MOST), which is based on differences in wind speed, air temperature, and humidity between adjacent measurement or model levels. Recently, Wulfmeyer et al. (2024) estimated heat flux with machine learning at much higher accuracy compared to MOST. Their ML model proposed the incorporation of additional predictor variables when estimating latent heat flux (such as solar radiation), which stands in contrast to the classical MOST approach. However, the analysis in Wulfmeyer et al. (2024) is based on a rather short data period in August 2017 at three nearby locations in Oklahoma, USA, which limits the generalizability of the results. Here, we replicate and expand the findings from Wulfmeyer et al. (2024) on a dataset from the boundary layer field site (GM) Falkenberg of the German Meteorological Service over a period of twelve years, covering various seasons and synoptic weather situations. Our findings support the role of incoming shortwave radiation not only for latent but also for sensible heat flux estimates, particularly for other parts of the year. The results thus underline the potential to develop more advanced flux parameterizations beyond MOST. In future research, we intend to investigate the role of other predictor variables, such as vapor pressure deficit or soil moisture, to assess the generalizability of the relations, to judge their performance under extreme conditions, and to derive simple but universally applicable parameterizations.

How to cite: Butz, M. V., Karlbauer, M., Beyrich, F., and Wulfmeyer, V.: Replicating Sensible and Latent Heat Flux Diagnosis with Multilayer Perceptrons on Multi-Year Falkenberg Tower Data , EGU General Assembly 2025, Vienna, Austria, 27 Apr–2 May 2025, EGU25-17542, https://doi.org/10.5194/egusphere-egu25-17542, 2025.

EGU25-17958 | ECS | Posters on site | ITS1.4/CL0.10

Towards a Hybrid Vegetation Model 

Maha Badri, Philipp Hess, Yunan Lin, Sebastian Bathiany, Maximilian Gelbrecht, and Niklas Boers

Vegetation plays a crucial role in the Earth's climate system via a number of key processes, affecting the exchange of carbon, water and energy between surface and atmosphere. The complex relationship between climate change and vegetation highlights the importance of accurate and reliable vegetation models that fully capture these interactions. 

Traditional vegetation models are primarily designed to operate on CPU architectures, which restricts their ability to exploit advancements in modern parallel computing architectures such as GPUs. Furthermore, limited process knowledge and the absence of direct observations and/or quantitative theories for certain processes hinder accurate representation of these processes, which introduces uncertainties in the model results, leading to discrepancies when compared to observations. The rigid structure of these traditional models also makes integration of new processes challenging and hinders the application of advanced optimization techniques for automatic parameter tuning and objective calibration using abundant observational data due to their non-differentiable nature.

This work follows a new paradigm in vegetation modeling that integrates the robustness of traditional models with the adaptive power of machine learning techniques. The goal is to combine reliable physical components with machine learning components. As opposed to classical vegetation models, the resulting hybrid model is differentiable and the parameters of both the physical and the neural network components can be optimized jointly and efficiently using observational data.

In the proposed hybrid vegetation model, machine learning can be used to improve the computational efficiency of the model by emulating computationally expensive routines. We have implemented the key processes related to photosynthesis in LPJ in Julia. This minimal model setup is used to explore the potential of machine learning to replace the computationally expensive root-finding algorithm used in computing the optimal ratio of intercellular to ambient CO2 concentration, and hence stomatal conductance.

Machine learning can also be used for better process representation. The recently developed neural or universal differential equations offer a particularly promising methodological framework for learning the dynamics of carbon allocation to different vegetation pools using observations. The dynamics of carbon allocation to different plant components can be effectively modeled using a neural ODE approach, which utilizes observations of observable variables (e.g., Above Ground Biomass (AGB), Leaf Area Index (LAI)) to learn the dynamics of unobservable variables such as vegetation carbon pools.

How to cite: Badri, M., Hess, P., Lin, Y., Bathiany, S., Gelbrecht, M., and Boers, N.: Towards a Hybrid Vegetation Model, EGU General Assembly 2025, Vienna, Austria, 27 Apr–2 May 2025, EGU25-17958, https://doi.org/10.5194/egusphere-egu25-17958, 2025.

Modelling microplastic transport through porous media, such as soils and aquifers, is an emerging research topic, where existing hydrogeological models for (reactive) solute and colloid transport have shown limited effectiveness thus far. This perspective article draws upon recent literature to provide a brief overview of key microplastic transport processes, with emphases on less well-understood processes, to propose potential research directions for efficiently modeling microplastic transport through the porous environment. Microplastics are particulate matter with distinct physicochemical properties. Biogeochemical processes and physical interactions with the surrounding environment cause microplastic properties such as material density, geometry, chemical composition, and DLVO interaction parameters to change dynamically, through complex webs of interactions and feedbacks that dynamically affect transport behavior. Furthermore, microplastic material densities, which cluster around that of water, distinguish microplastics from other colloids, with impactful consequences that are often underappreciated. For example, (near-)neutral material densities cause microplastic transport behavior to be highly sensitive to spatio-temporally varying environmental conditions. The dynamic nature of microplastic properties implies that at environmentally relevant large spatio-temporal scales, the complex transport behavior may be effectively intractable to direct physical modeling. Therefore, efficient modeling may require integrating reduced-complexity physics-constrained models, with stochastic or statistical analyses, supported by extensive environmental data. This is a sub-project (focusing on microplastics in the environment) of the Digital Waters Flagship funded by the Research Council of Finland, where we aim to create a digital ecosystem for machine learning aided hydrological modelling of various hydrosphere processes across all environmental compartments, focusing particularly on the critical zone.

How to cite: Tang, D. and Yang, X.: Modeling microplastic transport through porous media: challenges arising from dynamic transport behavior, EGU General Assembly 2025, Vienna, Austria, 27 Apr–2 May 2025, EGU25-18139, https://doi.org/10.5194/egusphere-egu25-18139, 2025.

EGU25-18810 | ECS | Posters on site | ITS1.4/CL0.10

Artificial Neural Network Approaches for Permeability Estimation 

Kyrillos Ghattas and Tamás Buday

Permeability should be dispersed conveniently to control the aquifer's type and quality. Permeability in a variety of porous media can be determined using different methods depending on the environment and the scope of the porosity media. These days, permeability of core samples and well logging data with greater aquifer heterogeneity, artificial intelligence algorithms are well-known for estimating permeability. Machine learning and artificial intelligence have gained popularity and credibility across all scientific fields. To address the dearth of resources in geosciences generally and hydrology specifically.

As soft computing techniques, Artificial Neural Networks (ANNs) have demonstrated the capacity to estimate acceptable outputs with tolerable outcomes. The ANN model uses basic processing units, which are networks of interconnected neurons. The simplest approach is the Feed-Forward Artificial Neural Network (FF-ANN). The Middle Jurassic Hugin Formation may have been deposited as a mouth bar setting during the period of general transgression, as evidenced by fluctuating permeability values brought on by changes in the sediment supply, which varying porosity values brought on by variations in the amount of clay and size of grains.

Keywords: Artificial Neural Network, Feed-Forward Artificial Neural Network, Volve oilfield, Hugin Formation, Permeability estimation.

How to cite: Ghattas, K. and Buday, T.: Artificial Neural Network Approaches for Permeability Estimation, EGU General Assembly 2025, Vienna, Austria, 27 Apr–2 May 2025, EGU25-18810, https://doi.org/10.5194/egusphere-egu25-18810, 2025.

EGU25-19319 | ECS | Posters on site | ITS1.4/CL0.10

Emulation of sub-grid physics using stochastic, vertically recurrent neural networks 

Peter Ukkonen, Laura Mansfield, and Hannah Christensen

Machine learning (ML) has the potential to reduce systematic uncertainties in Earth System Models by replacing or complementing existing physics-based parameterizations of sub-grid processes. However, after decades of research, ensuring generalization and stability of ML-based parameterizations remains a major challenge.  We aim to minimize both epistemic and aleatoric sources of uncertainty via physically inspired, vertically recurrent neural networks (RNN) which offer key benefits such as parametric sparsity and efficient modeling of non-locality in a column. To address aleatoric uncertainty, we furthermore incorporate stochasticity and convective memory into the ML architecture. We present preliminary results using the ClimSim framework, where the physically inspired ML framework replaces a superparameterization in a low-resolution climate model.

How to cite: Ukkonen, P., Mansfield, L., and Christensen, H.: Emulation of sub-grid physics using stochastic, vertically recurrent neural networks, EGU General Assembly 2025, Vienna, Austria, 27 Apr–2 May 2025, EGU25-19319, https://doi.org/10.5194/egusphere-egu25-19319, 2025.

EGU25-269 | ECS | Orals | ITS4.6/CL0.11

High resolution economic modelling for climate risk assessments: An application to coastal storm surges in Norway 

Francis Barre, Evert Bouman, Edgar Hertwich, and Daniel Moran

We introduce a novel multisectoral and point-level economic model, demonstrated through a case study assessing the Norwegian economic exposure to coastal flooding.

An important prerequisite for accurately characterizing economic impacts from climate change is a spatial inventory of economic activity and value creation. Current options for creating spatial inventories of economic activity are limited. The main product that has been used for assessing economic exposure to hazards are gridded GDP models, which rely on proxies such as nighttime lights. However, they suffer from coarse spatial resolution and lack sectoral detail. They cannot capture building-level exposure and are constrained by biases, such as saturation in urban cores and unrealistic homogeneity in densely populated areas. While asset-level datasets offer high spatial precision, they are typically restricted to specific sectors (location of infrastructure, schools, residential buildings…), making them unsuitable for comprehensive, multi-sectoral analyses that are necessary for a full national-scale evaluation. These limitations highlight the need for a more integrated approach that combines fine spatial resolution with economic comprehensiveness and sectoral differentiation.

To bridge this gap, we present a novel, high-resolution mapping of national GDP that achieves fine spatial granularity while maintaining comprehensive sectoral differentiation. Our approach disaggregates national gross value added (GVA) to the point level using a public business register. We integrate this model with meter-scale flood hazard maps to quantify direct GDP and employment exposure to flooding. Additionally, we leverage an input-output analysis framework, specifically the hypothetical extraction method (HEM), to estimate indirect economic exposure, revealing how disruptions could propagate through intersectoral linkages.

To demonstrate the utility of this approach, we evaluate economic exposure to coastal flooding in Norway under a range of scenarios, from present-day extreme events to future projections under SSP3-7.0 for the year 2100. Results reveal the scale of both direct exposure at fine spatial scales and the broader systemic risks posed by intersectoral economic linkages. Our findings underscore the critical need for high-resolution, sectorally differentiated economic data to support the development of robust mitigation and adaptation strategies.

How to cite: Barre, F., Bouman, E., Hertwich, E., and Moran, D.: High resolution economic modelling for climate risk assessments: An application to coastal storm surges in Norway, EGU General Assembly 2025, Vienna, Austria, 27 Apr–2 May 2025, EGU25-269, https://doi.org/10.5194/egusphere-egu25-269, 2025.

Understanding the spatiotemporal variations and driving forces of groundwater-dependent ecosystems (GDEs) resilience can provide scientific evidence for GDEs protection under natural and anthropogenic perturbations. However, the differences in the spatiotemporal variations of GDEs and non-GDEs resilience and their responses to climatic and anthropogenic disturbances are still unclear. Here, we applied lag-1 month temporal autocorrelation (AR(1)) based on kernel Normalized Difference Vegetation Index (kNDVI) to explore the spatiotemporal pattern of GDEs and non-GDEs resilience, and used propensity score matching (PSM) to identify the difference. XGBoost and Shapley model are applied to spatially quantify the marginal contributions from each single drivers. We found that over a third of both GDEs and non-GDEs experienced a shift from an increasing to a declining resilience trend from 1982 to 2022, with the resilience decline in GDEs being 7.5% slower than in non-GDEs. GDEs resilience are mostly responsive to precipitation and VPD, while non-GDEs resilience are mostly responsive to temperature and PET variations. Plant biodiversity significantly boosts GDEs resilience, which has a different impacting threshold compared with non-GDEs resilience. The impact of stocking density on resilience is much higher in GDEs than in non-GDEs. These findings highlight the urgent need for policy interventions to protect and manage groundwater and plant biodiversity in GDEs to maintain its resilience.

How to cite: Wu, T. and Liu, Y.: The resilience of global groundwater dependent ecosystems (GDEs) declined less than non-GDEs in the last forty years under differentiated spatial driving forces, EGU General Assembly 2025, Vienna, Austria, 27 Apr–2 May 2025, EGU25-1845, https://doi.org/10.5194/egusphere-egu25-1845, 2025.

EGU25-4495 | ECS | Posters on site | ITS4.6/CL0.11

Nature-Related Financial Risks Assessments framework for Company and Industry Archetype: Metrics Review 

Maganizo Kruger Nyasulu, Hassan Sheikh, Christophe Christiaen, Philippa Lockwood, Jean-Pierre Jean-Pierre, Emmy Wassenius, and Calvin Quek

Nature degradation directly impacts company portfolio performance by disrupting ecosystem services critical to operations (such as water availability, pollination, etc.), while on the other hand company activities (such as deforestation, pollution, and resource extraction) significantly contribute to nature's degradation. This reciprocal relationship has intensified the need for robust methodologies to assess the underling nature-related financial risks as a pathway to allow companies to engage in mitigation and adaptation activities. While various approaches are currently in use, both business-focused (e.g nature value at risk) and nature-centered (e.g earth system index), significant gaps remain in harmonised methodologies that are comprehensive, user-friendly, and replicable, especially within biodiversity and ecosystems services at company level. An examination of existing approaches and contextual applications to company or industry archetype reveals both advantages and limitations in representing the double-materiality of risk associated with businesses. Here, we explore a potential framework for companies at the sector archetype that can assist in assessing current and potential nature-related financial risks. This is done by integrating NRFR metrics multidimensionally from the perspective of nature-related dependencies, exposures, and pressures across high climate impact industry archetypes, including agriculture, energy, and the built environment. However, the inherent challenges in representing complex and adaptive systems like nature through a metric approach should be held with caution. Regardless, this approach offers optimal direction on which companies can adopt for their individual NRFR assessments.

Keywords: Risk Assessment, Nature degradation, nature-related financial risks, business

How to cite: Nyasulu, M. K., Sheikh, H., Christiaen, C., Lockwood, P., Jean-Pierre, J.-P., Wassenius, E., and Quek, C.: Nature-Related Financial Risks Assessments framework for Company and Industry Archetype: Metrics Review, EGU General Assembly 2025, Vienna, Austria, 27 Apr–2 May 2025, EGU25-4495, https://doi.org/10.5194/egusphere-egu25-4495, 2025.

Climate-related disasters often disproportionately impact the welfare of poor or marginalized households. However, the distributional impact of disasters on household welfare i.e., how these impacts vary across socioeconomic groups, remains underexplored in climate risk assessments. Further, existing frameworks often fail to capture the multidimensional nature of these impacts, such as disruptions to education, health services, food, livelihoods, work and well-being. These frameworks also fail to represent the temporal dynamics of impacts, particularly how they evolve during and after a disaster event. These limitations pose a challenge to develop quantitative models that adequately inform equitable policy responses. 

To address this gap, our research examines how multiple impact channels of disasters influence household welfare over time. Using high-frequency, longitudinal survey from Malawi (from the World Bank's Living Standard Measurement Study (LSMS)), this study analyses over 1,600 households across all districts of Malawi over 21 survey rounds (2021-2024). This timeframe includes major events like Cyclone Freddy in February 2023 and widespread floods in February 2024. The survey covers diverse indicators serving as proxies for household welfare, such as access to essential services, employment, food insecurity, price fluctuations (food, fuel, transport), and subjective welfare. Using descriptive statistics, regression models and time series analysis, we aim to highlight the diverse pathways through which disasters exacerbate socio-economic vulnerabilities, examining how these impacts vary across different regions and over time. 

Preliminary results draw attention to the complex relationship between climate-related hazards and differential household-level impacts, both spatially and across households. For example, food price responses show a sharp surge in the cost of domestically produced staples, such as maize, in flood-impacted areas due to Cyclone Freddy. Additionally, subjective welfare responses reveal that households in rural regions were disproportionately affected. Unlike their urban counterparts, rural families struggled to acquire sufficient food, fuel and other essential goods for their households, as higher prices reduced their purchasing power and further undermined their well-being. 

By capturing these spatiotemporal dynamics, our study increases our understanding of disaster impacts on household welfare. Our study paves the way for integrating these impact pathways into quantitative climate risk assessment models, ultimately aiming to make more informed and equitable decisions in disaster risk management. 

Keywords: Climate-related disasters, household welfare, high-frequency data, distributional impact, multidimensional impact pathways, temporal dynamics 

How to cite: Bansod, S., Verschuur, J., and Comes, T.: High-frequency survey data reveal complex impact pathways of climate-related disasters on household welfare in Malawi , EGU General Assembly 2025, Vienna, Austria, 27 Apr–2 May 2025, EGU25-5930, https://doi.org/10.5194/egusphere-egu25-5930, 2025.

EGU25-6470 | ECS | Orals | ITS4.6/CL0.11

Shock Tracker: A living database of shocks 

Emmy Wassénius and Giulia Rubin

There is mounting evidence that we are living in a time of turbulence, with many disruptive events becoming increasingly common and intense. In these times, understanding the dynamics of past shocks can help us better prepare and potentially prevent severe impacts in the future. The Shock Tracker is a living database of cases, encompassing everything from wildfires, to floods, disease outbreaks and conflict. The case studies are formulated as storylines, describing the event and its multiple drivers and impacts, through a standardized reporting protocol. The database currently has over 100 documented cases and, thanks to its living nature, it is growing every day. The cases are submitted by people from diverse backgrounds who become part of our growing Shock Tracker Network. All cases then undergo rigorous review before being added to the final archive. There is a particular focus in the protocol on how the shock was shaped by the interactions between people and nature. Through the case studies, the Shock Tracker highlights how anthropogenic climate change contributed to shock events, where mild but multiple drivers led to extreme impacts, and what the role of human action and agency were in both driving and mitigating these events and their impacts. The Shock Tracker is therefore a collection of cases that show that climate-induced events are already happening and are not only a future problem, that they are not only caused by extreme conditions, and that they are not only natural but often triggered by social decisions. We hope that the Shock Tracker can be a source of both direct learning from past events to better prepare us for the future and a useful resource for academic research into the patterns of drivers and impacts of shocks.

How to cite: Wassénius, E. and Rubin, G.: Shock Tracker: A living database of shocks, EGU General Assembly 2025, Vienna, Austria, 27 Apr–2 May 2025, EGU25-6470, https://doi.org/10.5194/egusphere-egu25-6470, 2025.

EGU25-6917 | ECS | Posters on site | ITS4.6/CL0.11

Local-resolution risk assessment for tropical cyclones: toward global adaptation  

Itxaso Odériz and Iñigo Losada

Between 1998 and 2017, tropical cyclones (TCs) caused 233,000 deaths, affected approximately 726 million people globally, and led to an average of 9.3 million human displacements annually between 2017 and 2020 (Kam et al., 2024). Within countries impacted by TCs, economically disadvantaged populations are disproportionately affected (Jing et al., 2024). Adaptation to TCs is impregnated with uncertainty within a global context where coastal adaptation efforts are unbalance distributed (Magnan et al., 2023).

While adaptive capacity varies widely at subnational levels (Magnan et al., 2023), adaptive information is provided at the national level or, at best, at the second administration level (e.g., states). There is a lack of local adaptation information specifically related to TCs. As part of the TRANSCLIMA project (https://transclima.ihcantabria.com/), we developed global, local risk indicators at the fourth administration level, based on changes in TC characteristics, exposed population, and TC-related adaptive capacity.

This study identifies TC regions where changes in intensity and frequency are observed. Based on these changes, regions where minor or major TCs shift and assesses whether TCs may become an unprecedented hazard, leading to emergent risks. These hazard indicators resulted from analysing TC characteristics under two climatological periods: a baseline climate (1980-2017) and a future high-emission climate scenario, Shared Socioeconomic Pathway SSP8.5 (2015-2050). We used synthetic tracks datasets of four Global Climate Models (CMCC, CNRM, EC-Earth, and HadGEM3)  (Bloemendaal, et al., 2022). Population data were obtained from the fourth version of the gridded population of the world with a 1 km resolution of the Socioeconomic Data and Application Center for the base year 2000 and for the years 2040 and 2050 under the SSP5 scenario (Center For International Earth Science Information Network-CIESIN-Columbia University, 2017), calculated for each coastal locality (Odériz et al., 2024). We assessed the adaptive capacity of each TC region using an index that combines local adaptive capacity, such as indicator local experience based on IBTrACS data (Knapp, 2018; K. R. Knapp et al., 2010). Additionally, we proposed a national-level insurance coverage indicator and a national-level adaptation readiness indicator.

Using this global, local-resolution risk assessment, we provided a detailed overview of the adaptation status of countries, considering subnational levels, that can be used to identify hotspots for financial adaptation plans.

How to cite: Odériz, I. and Losada, I.: Local-resolution risk assessment for tropical cyclones: toward global adaptation , EGU General Assembly 2025, Vienna, Austria, 27 Apr–2 May 2025, EGU25-6917, https://doi.org/10.5194/egusphere-egu25-6917, 2025.

EGU25-7026 | ECS | Orals | ITS4.6/CL0.11

Climate risk ownership in the age of asset management 

Viktor Rözer

With a recent green climbdown in global finance including the world’s largest money manager BlackRock leaving the high-profile Net Zero Asset Managers group, the debate on the financial risks from climate change is reignited. While there is an agreement on the catastrophic potential of unmitigated climate change itself, many important players in the global financial system have reevaluated to what degree climate risk equals investment risk. A key point in this debate is who owns the financial risks from climate change and who is subsequently responsible for managing them. This study looks into the question of climate change risk ownership by examining two megatrends unfolding in the global financial system over the last three decades: the financialization of climate change and the parallel evolution of the asset management industry. The analysis shows how the interconnection between these two trends has resulted in a financial system where climate risk disclosure demanded by newly introduced regulations such as TCFD and intended to enhance risk management, actually enables private entities to shield profits from climate-related losses, while leaving systemic risks unaddressed. Drawing on the literature from the financialization of nature, risk ownership, and climate risk assessment, the study highlights how technological advancements in climate risk models and government incentives for low-carbon investments create adverse selection and moral hazards for both physical and transition risks from climate change. Introducing the concept of ‘climate risk ownership’ through case studies on renewable energy investments and disaster insurance, the study highlights the gaps in the management of the financial risks of climate change between public and private entities.

How to cite: Rözer, V.: Climate risk ownership in the age of asset management, EGU General Assembly 2025, Vienna, Austria, 27 Apr–2 May 2025, EGU25-7026, https://doi.org/10.5194/egusphere-egu25-7026, 2025.

EGU25-10005 | Posters on site | ITS4.6/CL0.11

Interactions of physical climate risk and nature risk for ESG information disclosure in the financial sector 

Taro Kunimitsu, Anne Sophie Daloz, Erik Kusch, and Jana Sillmann

There have been rapid developments in mandatory Environment, Social, and Governance (ESG) information disclosure in recent years. Under the requirements that have been developed, companies, including financial institutions, are required to analyse not only the climate risk they face but also the risk from biodiversity loss and ecosystem degradation, and their interactions with climate risk. For EU nations and other European nations including Norway, companies are subject to the Corporate Sustainability Reporting Directive (CSRD) requirements that came into effect last year and require such disclosures. Many financial institutions lack the expertise to sufficiently manage these requirements and need support not only to satisfy the requirements, but also to proactively manage their assets against the risks they face.

Under such regulatory developments, we have been working with financial institutions in Norway to support their ESG information disclosure activities, focusing on physical climate risk, nature risk, and their potential connections. In this talk, we highlight our approach, focusing on the opportunities we see for both financial institutions and the scientific community. These will be presented through a case study we conducted, focusing on data flow and availability, methodologies developed on bridging climate and nature research, and on the limits we faced as academic researchers. The collaboration has led to the development of methods that could position the financial institutions as leaders in the sector regarding risk management and building resilience towards climate and nature risk. Given the disclosure requirements, transparent methods and coherent data generation on physical and transition risks will be an opportunity for enhancing awareness of climate and nature risk, and for getting a comprehensive picture of the economic impacts of climate change (including the impacts of extreme events) and the benefits of avoided impacts via mitigation and adaptation actions.

How to cite: Kunimitsu, T., Daloz, A. S., Kusch, E., and Sillmann, J.: Interactions of physical climate risk and nature risk for ESG information disclosure in the financial sector, EGU General Assembly 2025, Vienna, Austria, 27 Apr–2 May 2025, EGU25-10005, https://doi.org/10.5194/egusphere-egu25-10005, 2025.

EGU25-11087 | ECS | Posters on site | ITS4.6/CL0.11

Business-level flood insurance coverage and adaptation under climate change in the Netherlands 

Michiel Ingels, Wouter Botzen, Jeroen Aerts, Jan Brusselaers, and Max Tesselaar

Floods cause large disruptions to society by causing both direct and indirect damages. These impacts will be further exacerbated by climate change and socioeconomic development. In addition to direct impacts, businesses may face indirect losses resulting from disruptions to their operations, adding extra complexity to business risk assessments. Additionally, business closures can have far-stretching economic repercussions. Flood insurance is an instrument to reduce the impact of floods for businesses by spreading the risk over space and time. While the (future-) increase in flood damages puts pressure on businesses, insurance systems tailored to businesses remain underexplored.

This research applies and extends the ‘Dynamic Integrated Flood Insurance’ (DIFI) model to analyse flood insurance for businesses in the Netherlands, taking into account both insurance against direct damages and insurance against business interruption damages. We analyse the responses of various insurance systems to changes in flood risk. These systems include voluntary insurance, solidarity-based insurance, and public-private partnership insurance. In addition, we assess the effect of adaptation on the viability of flood insurance by allowing businesses to take building-level measures to reduce their flood risk.

To facilitate the insurance analysis, flood damages are estimated using an object-based approach that takes high resolution (25m x 25m) inundation maps as input. To simulate the insurance uptake, company-level financial data obtained from the Dutch Chamber of Commerce is used in a subjective expected utility framework. This module is calibrated on actual insurance uptake numbers and takes risk misperception into account. DIFI simulations until 2080 show how premiums, insurance uptake, and policyholder adaptation efforts develop over time for various insurance market structures. These projections provide valuable insights into the viability and effectiveness of different insurance market structures in the face of climate change and shifting socioeconomic conditions.

The novelty of this research lies not only in incorporating businesses into the insurance analysis, but also in introducing a focus on business interruption damages, offering a more comprehensive perspective on flood impacts for businesses. Initial results reveal that, in certain sectors, flood-related business interruption damages are nearly as high as, or even exceed, direct damages. These findings offer new insights into the impact of flooding on businesses and the challenges of insuring such damages.

Consequently, the findings are relevant for policymakers and insurers by identifying which insurance market structures are more resilient to the increasing flood risk, providing guidance on designing financially sustainable insurance framework. Moreover, the study highlights the need for targeted insurance incentives to encourage business-level adaptation, and it informs decisions regarding potential government involvement in the insurance system to ensure equitable access to flood insurance.

How to cite: Ingels, M., Botzen, W., Aerts, J., Brusselaers, J., and Tesselaar, M.: Business-level flood insurance coverage and adaptation under climate change in the Netherlands, EGU General Assembly 2025, Vienna, Austria, 27 Apr–2 May 2025, EGU25-11087, https://doi.org/10.5194/egusphere-egu25-11087, 2025.

EGU25-13433 | ECS | Posters on site | ITS4.6/CL0.11

Towards a Taxonomy of Systemic Risks 

Paul Einhäupl, Benjamin Hofbauer, and Pia-Johanna Schweizer

Systemic risks, emerging from dynamic interactions among natural, technological, and societal systems, pose multifaceted challenges to modern, interconnected societies. These risks emerge from the complex, interdependent relationships between various system elements and can lead to cascading effects across multiple domains. The complexity, non-linearity, and transboundary nature of these risks require a systems thinking approach for effective governance. This presentation introduces a taxonomy of systemic risks, categorizing elements, clarifying relationships, and fostering interdisciplinary dialogue to improve risk understanding and response strategies.

By systematically categorizing SR based on core elements, relationships, and characteristics, the taxonomy facilitates structured data collection and enables comparative analysis across diverse risk scenarios. It facilitates the identification of shared features and distinct differences among systemic risks, supporting more effective research and informed policymaking. Moreover, the taxonomy’s adaptive design ensures its continued relevance, allowing it to evolve as systemic risks change due to shifting societal, technological, and environmental dynamics. Thus, grounded in Forrester’s iterative system dynamics approach, the taxonomy evolves alongside systemic risk assessment, capturing new patterns and dynamics while remaining applicable across diverse contexts. This flexibility enables both granular analysis of specific risks and comparative studies across multiple domains.

An exemplary application of the taxonomy demonstrates its utility, while ongoing research critically evaluates its strengths and limitations. This work also explores the ethical implications of the taxonomy, critically assessing the normative assumptions underlying risk classification. This approach ensures that the taxonomy supports inclusive and equitable risk governance, recognizing diverse values and interests across stakeholders.

By identifying leverage points and key indicators, the taxonomy helps detect and mitigate systemic risks by efficiently pinpointing areas where interventions are most effective. It offers practical insights for developing resilience and improving decision-making by facilitating more targeted and efficient data collection. Hence, the taxonomy’s full potential will unfold as it is populated with data, enabling more effective interventions through a deeper understanding of systemic risks.

The proposed taxonomy is a significant contribution to SR research and governance, offering a structured framework and a first step towards a holistic assessment framework targeted at systemic risks. It holds the potential to improve responses to climate extremes and compound events, driving data-informed decision-making, and contributing to sustainable development, climate change resilience, and disaster risk reduction.

How to cite: Einhäupl, P., Hofbauer, B., and Schweizer, P.-J.: Towards a Taxonomy of Systemic Risks, EGU General Assembly 2025, Vienna, Austria, 27 Apr–2 May 2025, EGU25-13433, https://doi.org/10.5194/egusphere-egu25-13433, 2025.

EGU25-14413 | ECS | Posters on site | ITS4.6/CL0.11

 Nature-positive Climate Risk Transfer & Financing: A Systematic Review​ 

Alina Bill-Weilandt, David Lallemant, Vivien Chan Khim Sun, Meherwan Patel, and Perrine Hamel

Nature-based Solutions (NBS) for climate resilience offer great opportunities to address the crises of climate change, biodiversity loss, and land degradation in an integrated way. Innovative climate risk transfer and financing instruments have emerged to scale up financing for NBS. Nature-positive finance models play a key role in closing the adaptation and nature finance gaps. This systematic review structures the evidence on mechanisms emerging from academic literature and practice that combine ‘NBS for climate resilience’ and ‘risk transfer and financing mechanisms’ and their effectiveness and economic viability. The review follows the reporting guidelines of the Preferred Reporting Items for Systematic Reviews and Meta-Analyses (PRISMA) 2020 statement. We identified 104 academic publications (based on a screening of over 2000 studies listed on Web of Science and Scopus) and 132 non-academic publications that mentioned a risk transfer or financing mechanism, a Nature-based Solution, and hazard regulation benefits of the intervention. One key contribution of the review is an inventory with over 70 examples of risk transfer and financing mechanisms that incentivize investments in NBS for climate resilience. In addition, the systematic review highlights knowledge gaps and needs for further research in this field, including the quantification of co-benefits, disaggregation of benefits by socio-economic characteristics, and consideration of equity / inequity in the distribution of risks and benefits.

How to cite: Bill-Weilandt, A., Lallemant, D., Chan Khim Sun, V., Patel, M., and Hamel, P.:  Nature-positive Climate Risk Transfer & Financing: A Systematic Review​, EGU General Assembly 2025, Vienna, Austria, 27 Apr–2 May 2025, EGU25-14413, https://doi.org/10.5194/egusphere-egu25-14413, 2025.

EGU25-15169 | Orals | ITS4.6/CL0.11

Increasing fiscal stress from compound hazard risk across the globe: how can innovative finance options build resilience? 

Reinhard Mechler, Stefan Hochrainer-Stigler, Muneta Yokomatsu, and Qinhan Zhu

Strong evidence on mounting disaster and climate-related risks across the globe and first evidence on adaptation limits indicate that conventional approaches are challenged in terms of effectively preventing disasters and deliver on the Paris climate ambitions - even in an only 1.5oC warming world, which is, however, being exceeded. At the same time countries and communities across the world are already today stressed by current risk associated with hydrometeorological and geophysical hazards. Prior work on country extreme event risk has identified fiscal thresholds for multiple single hazards, where government’s ability to provide relief to the affected population and rebuild post-event has been exhausted leading to long-term declines in socio-economic development indicators. While in a changing climate, hazards are increasingly compounding (floods, windstorms, landslides etc.), it has been less clear what this may mean for risk and risk management overall.

Building on state-of-the-art disaster and climate risk modelling, we develop global insight on fiscal stress arising compound hazard risk. We probabilistically identify fiscal risk thresholds (“financing gaps”) for single and compound hazard risk from flood, cyclone, earthquake, tsunami and landslide hazards. The analysis shows that compound hazard risk leads to lower, i.e. more frequently occurring, gap return period year events, which may incur fiscal crises. For many (61) vulnerable countries this means such events may occur more often than every 10 years (equivalent to annual probability larger than 10%). As well, according to our analysis 54 low income, emerging and advanced economies would face such thresholds more often than once in 50 years (annual probability of larger than 2%). 

In this context, policy responses ought to be ramped up including consideration for risk prevention and risk finance.  In terms of risk finance, as part of the Bridgetown initiative and Loss&Damage discourses the enhanced use of IMF's Special Drawing Right (SDR) entitlements has been discussed as a means to increase resilience of the most vulnerable countries. We show that the use of SDR can soften the impact from disasters. If low income and emerging economies are allowed to access 10% of their SDR entitlements post disaster, the chance of fiscal crises can be pushed out by 19 years for low income and by 12 years for emerging economies (change in annual probability of 5 and 8 percentage points, respectively. With international debate on climate finance gaining momentum, we suggest the international community ought to further consider the innovative use of climate finance mechanism to help build climate and disaster resilience.

How to cite: Mechler, R., Hochrainer-Stigler, S., Yokomatsu, M., and Zhu, Q.: Increasing fiscal stress from compound hazard risk across the globe: how can innovative finance options build resilience?, EGU General Assembly 2025, Vienna, Austria, 27 Apr–2 May 2025, EGU25-15169, https://doi.org/10.5194/egusphere-egu25-15169, 2025.

EGU25-15331 | ECS | Posters on site | ITS4.6/CL0.11

Assessing infrastructure criticality using input-output table and network analysis 

Tan Phan and Marcello Arosio

Despite substantial progress in understanding infrastructure interdependencies and their economic implications, quantifying the criticality of infrastructure and its vulnerabilities to climate impacts remains challenging. Existing models often oversimplify the consequences of infrastructure failure, assuming total cessation of activities, which can lead to unrealistic risk assessments and inefficient resource allocation. This study addresses these gaps by focusing on the criticality of four infrastructure groups, energy, water, information and communication technologies (ICT), and transport, regarding economic activities and material transactions (input-output relationship). Leveraging data from the OECD Input-Output tables, the research identifies key infrastructure-related sectors based on the International Standard Industrial Classification (ISIC Rev.4) and analyzes their roles within the economy. The research begins by examining the intermediate inputs provided by infrastructure-related sectors (sectors of which activities are related to the critical infrastructure services, e.g., land transport, water supply) to all sectors across the 11 largest economies, determining which infrastructure sectors or groups generate the highest monetary flows. Subsequently, network analysis is used to evaluate the structural importance of these sectors by measuring their centrality within the economic network. To further explore their criticality, the study simulates disruptions to individual and combined infrastructure groups, assessing their impacts on network topology and economic connectivity. The findings highlight the pivotal role of the transportation and energy sectors, which together account for 70% of infrastructure-related expenditures in the economy. Among these, the energy sector emerges as the most central and influential, underscoring its critical function across all industries. A disruption in energy infrastructure could result in a 12% reduction in in-strength centrality across the network, emphasizing its widespread economic impact. Transportation infrastructure, while essential for manufacturing industries, demonstrates its criticality in enabling production and logistics. Similarly, ICT infrastructure is shown to be indispensable for service-oriented sectors, reflecting its growing importance in the modern economy. The water sector, while less centralized in its role, exhibits a dispersed yet significant influence across various industries, underscoring its essential but less direct contribution. Overall, the study advances our understanding of the economic significance and interdependence of critical infrastructure groups, providing a robust framework to evaluate their roles, vulnerabilities, and potential impacts on economic activities.

How to cite: Phan, T. and Arosio, M.: Assessing infrastructure criticality using input-output table and network analysis, EGU General Assembly 2025, Vienna, Austria, 27 Apr–2 May 2025, EGU25-15331, https://doi.org/10.5194/egusphere-egu25-15331, 2025.

EGU25-15930 | Posters on site | ITS4.6/CL0.11

Navigating systemic risk 

Pia-Johanna Schweizer and Sirkku Juhola

In many risk domains, such as occupational health and safety, transportation, and food safety, modern risk governance is a success story. Despite these advancements, risk governance still struggles with systemic risk in the context of extreme climate and weather events, associated disasters and emergent risks. Systemic risk affects entire systems on which society depends, such as the health care system or the energy system. Systemic risk can be defined as “the risk or probability of breakdowns in an entire system, as opposed to breakdowns in individual parts or components” (Kaufman & Scott, 2003, p. 371). Connectivity between systems is the key enabler for systemic risk to manifest through cascading effects. Systemic risks originate and evolve in the nexus of tightly-coupled dynamic systems. The convergence of systemic risks with conventional risks as well as one systemic risk with another systemic risk challenges the established modes of risk analysis and governance that still rest to a large extent on differentiation and compartmentalisation.

Governance of systemic risk is concerned with the analysis of tightly coupled systems, their various interdependencies, and the resulting dynamics. Risk analysis here investigates feedback mechanisms between components of a system at the intra-system level and at the interaction with other systems at the inter-system level which result in transboundary cascading effects. In addition, governance of systemic risk is also concerned with procedural considerations of governance. Tentative, experimentalist and adaptive governance concepts, together with inclusive risk governance approaches, provide stepping stones for governance of systemic risks.

The presentation will analyse the governance challenges around systemic risk relating to issues of complexity, uncertainty, and ambiguity. Based on an extensive literature review and drawing on the case studies of the COVID-19 pandemic and climate change, a risk governance framework for systemic risks will be proposed that aims to address these challenges.

How to cite: Schweizer, P.-J. and Juhola, S.: Navigating systemic risk, EGU General Assembly 2025, Vienna, Austria, 27 Apr–2 May 2025, EGU25-15930, https://doi.org/10.5194/egusphere-egu25-15930, 2025.

EGU25-16825 | ECS | Posters on site | ITS4.6/CL0.11

Assessing the Likelihood of High-Impact Co-Occurring Weather Extremes in Europe 

Judith Claassen, Marleen de Ruiter, Wiebke Jäger, Elco Koks, Adrian Champion, James Daniell, and Philip Ward

Co-occurring weather extremes can cause significant damage across various sectors. For instance, low spring precipitation combined with a summer heatwave may lead to crop failures, wildfires, drinking water shortages, increased mortality rates, and reduced energy production. Conversely, prolonged high precipitation on already saturated soils can trigger widespread flooding, which, when combined with extreme wind, may result in additional impacts such as fallen trees obstructing critical roads and railways.

Traditionally, these extremes have often been modeled independently in risk analyses. However, neglecting the interactions between extremes can lead to a significant underestimation of risk.

To better understand the likelihood of co-occurring weather extremes, stochastic weather data offers the ability to generate a wide range of weather scenarios beyond the historical record. Using a newly developed copula-based stochastic weather model, this research estimates the likelihood of high-impact co-occurring extreme weather events. By analysing European case studies of extreme weather conditions, such as hot and dry periods or wet and windy events, we identify the prevailing factors during these events that resulted in financial damage. The stochastic weather data allows us to assess the frequency and likelihood of these extreme conditions, providing critical insights into their potential recurrence and allows for a better management of the associated financial risk.

How to cite: Claassen, J., de Ruiter, M., Jäger, W., Koks, E., Champion, A., Daniell, J., and Ward, P.: Assessing the Likelihood of High-Impact Co-Occurring Weather Extremes in Europe, EGU General Assembly 2025, Vienna, Austria, 27 Apr–2 May 2025, EGU25-16825, https://doi.org/10.5194/egusphere-egu25-16825, 2025.

Today's decisions on climate change mitigation affect the damage that future generations will bear. Discounting future benefits and costs of climate change mitigation is one of the most critical components of assessing efficient climate mitigation pathways. We extend the DICE model with stochastic discount rates to reflect the uncertain nature of discount rates. Stochastic rates give rise to a stochastic mitigation strategy, resulting in all model quantities becoming stochastic.

We show that the optimization procedure of the DICE model induces intergenerational inequality: lacking a mechanism to regulate burden, future generations have to bear higher costs from abatement and damage relative to GDP.

Further, we show that considering uncertainty of discount rates and their feedback to abatement policies, which can be interpreted as successive re-calculation, increases intergenerational inequality (and adds additional risks).
Motivated by this, we consider additional financing risks by investigating two modifications of DICE. We find that allowing financing of abatement costs and considering non-linear financing effects for large damages improves intergenerational effort sharing. To conclude our discussion of options to improve intergenerational equity in an IAM, we propose a modified optimization to keep costs below 3 % of GDP, resulting in more equal distribution of efforts between generations.

How to cite: Fries, C. and Quante, L.: Intergenerational Equitable Climate Change Mitigation: Negative Effects of Stochastic Interest Rates; Positive Effects of Financing, EGU General Assembly 2025, Vienna, Austria, 27 Apr–2 May 2025, EGU25-16844, https://doi.org/10.5194/egusphere-egu25-16844, 2025.

EGU25-17348 | Posters on site | ITS4.6/CL0.11

Leveraging Empirical Insurance Data for Climate Risk Assessment 

Quentin Hénaff and Andréa Poletti

The insurance sector faces escalating costs from both ordinary and catastrophic weather events. According to the IPCC, insurance acts as a crucial “risk-spreading mechanism”, redistributing the financial impacts of natural hazards across policyholders and society. The insurance sector also provides empirical data and expert assessments of hazard-related damages, fostering advancements in scientific research. 
 
Generali France, a local subsidiary of Assicurazioni Generali, has operated in mainland France and overseas since 1832. Through its Climate Lab and Reinsurance Department, we are collecting and analyzing natural hazard claims not only for regulatory purposes but also as part of its internal research and development initiatives. Our claims database comprises approximately 400,000 records collected over the last decade (2014–2024), linked to an annual exposure dataset of 1.5 million policies. 
 
The catalog was constructed though meticulous steps of data collection, standardization and enhancement. A date, geolocation, economic variables such as reported damages or insured values is associated to each claim which is then categorized by lines of business, natural hazards, weather-related events and triggered coverages. Such modular structure enables an analysis at multiple levels, from individual claims to aggregated data by reinsurance event or geographical area. The financial impact of each peril can thus be studied precisely: loss ratios, destruction rates, event costs both observed and net of (re)insurance protection. 

The database was designed under the assumption of relatively stable climatic variability and was cross-referenced with external data sources which ensure accuracy and reliability. As an illustration, hurricane Irma 2017 in the Caribbean, hailstorms of 2022, French South-East floods in 2015 and extra-tropical storm Ciaran in 2023 are clearly visible. 
 
Such approach should foster collaboration between the insurance sector and geoscience to address climate risks. By leveraging Generali France’s claims data, researchers can validate regional climate models, quantify the financial impacts of natural disasters, and improve socioeconomic projections at local and national scales.  

How to cite: Hénaff, Q. and Poletti, A.: Leveraging Empirical Insurance Data for Climate Risk Assessment, EGU General Assembly 2025, Vienna, Austria, 27 Apr–2 May 2025, EGU25-17348, https://doi.org/10.5194/egusphere-egu25-17348, 2025.

EGU25-17797 | Posters on site | ITS4.6/CL0.11

Assessing the financial impacts from drought and heat induced crop yield losses 

Kai Kornhuber, Yi-Ling Hwong, and Corey Lesk

Climate variability and weather extremes can have large impacts on local crop production. Droughts and heat extremes have been identified as main drivers on crop yield variability and therefore might pose a threat to global food security under future emission scenarios. In addition, instability may arise from associated financial losses in countries in which the economy is heavily reliant on income from agricultural production.

Using latest ISIMIP3a/b data, we assess the relative importance of drought, soil moisture, mean temperature and extreme heat for regional crop variability and establish a simple statistical model for future crop yield projections under different climate futures and associated impacts on national economies.

How to cite: Kornhuber, K., Hwong, Y.-L., and Lesk, C.: Assessing the financial impacts from drought and heat induced crop yield losses, EGU General Assembly 2025, Vienna, Austria, 27 Apr–2 May 2025, EGU25-17797, https://doi.org/10.5194/egusphere-egu25-17797, 2025.

Natural disasters often result from compound events, where multiple interacting drivers converge across spatial and temporal scales, significantly amplifying their severity. The concept of compound events has gained increasing attention in recent literature, offering opportunities to enhance disaster understanding, while also presenting challenges and open issues for modern risk assessment frameworks. Traditional classification systems, which primarily focus on single hazards, often fail to capture the complex interconnections and cascading effects that define compound events. This study investigates the potential for reclassifying disasters from a compound perspective, leveraging insights derived from existing databases. By analyzing patterns of hazard interactions and co-occurrence, the research underscores the critical need for a paradigm shift in disaster classification. It highlights the limitations of conventional approaches in representing the multidimensional nature of risks and the cascading impacts that emerge from compound hazards. Reclassifying disasters from a compound perspective not only enriches our knowledge of hazard dynamics but also provides actionable pathways for improving risk assessment, informing adaptive policies, and enhancing resilience to the growing complexity of environmental challenges. In an era of rapid climatic and socio-environmental changes, such an approach is crucial for effective disaster preparedness and mitigation strategies.

How to cite: De Michele, C. and Banfi, F.: Reclassifying disasters in a compound perspective: Insights from existing databases, EGU General Assembly 2025, Vienna, Austria, 27 Apr–2 May 2025, EGU25-18319, https://doi.org/10.5194/egusphere-egu25-18319, 2025.

Southeast Asia is becoming more and more vulnerable to extreme weather events and especially flooding due to its susceptibility to tropical cyclones, storm surges and heavy rainfall, as demonstrated by the frequency and magnitude of catastrophic events like those in 2020. This vulnerability is driven by many factors, including growing population, rapid urbanization and extensive land use changes driven by agricultural expansion, especially in Cambodia, which is situated in one of the most flood-vulnerable zones in mainland Southeast Asia. In this region, flood hazards have caused severe damages on households and on infrastructures, such as roads and bridges, causing extensive impacts on the national economy. These challenges are expected to intensify in the future due to climate change, particularly through compound events such as the interactions between riverine flooding and tropical cyclones. Despite these growing risks to critical infrastructures, two crucial gaps persist in the current practice: the integration of both direct damages and indirect impact assessments, and the understanding of the economic impacts of compound events, particularly on how these events could potentially amplify economic disruptions. In order to address these gaps, this study presents a framework that is able to bridge direct and indirect impact modeling through the combination of the open-source CLIMADA platform with the agent-based model Disrupt-SC, thanks to their spatially explicit nature. CLIMADA is adopted to quantify direct infrastructure damages from flooding events, while Disrupt-SC, simulates the cascading effects through transport and supply chain networks, including rerouting, price adjustments, and product shortages. In particular, this framework is particularly suitable to analyze the economic impacts of spatially and temporally compounding hazards. To test its applicability, the framework is applied to Cambodia. Using high-resolution data on households, firms, and trade flows we mapped the cascading effects of critical infrastructure network disruptions during compound events, enabling a comprehensive evaluation of both immediate damages and the propagation of economic impacts through supply chains. In particular, the analysis reveals crucial infrastructure components whose disruption during compound events could trigger country-wide economic impacts. This methodology offers a comprehensive framework for understanding flood impacts and their propagation through interconnected systems, contributing to more effective adaptation strategies in vulnerable and developing countries and providing decision-makers with actionable insights for prioritizing infrastructure resilience investments in Cambodia's most vulnerable regions.

How to cite: Nobile, E. G. L. and Colon, C.: Assessing the cascading economic impacts of critical infrastructure failures on supply-chains: a case study of Cambodia floods, EGU General Assembly 2025, Vienna, Austria, 27 Apr–2 May 2025, EGU25-19090, https://doi.org/10.5194/egusphere-egu25-19090, 2025.

EGU25-19269 | Posters on site | ITS4.6/CL0.11

Making Sense of Multiple Stressors, Coupled Hazards, and Systemic Risks: How can we advance inter- and transdisciplinary approaches to vulnerability with a translator model? 

Alexandre Pereira Santos, Miguel Rodriguez Lopez, Yechennan Peng, and Jürgen Scheffran

Hazard impacts in the Anthropocene increasingly spill over different spatio-temporal scales, societal sectors, and risk types (e.g., from natural drivers to technological failures). Recent research efforts point towards broadening the risk systems outlines to rise to this challenge. They also indicate a need for further depth, capturing the emergent aspects and managing the (information) complexity of the risk systems at hand. These two efforts have so far been achieved separately, and holistic approaches remain costly and rare. We thus present a review of systemic risks, multiple stressors, and coupled hazards, and a four-stage framework that responds to the identified challenges. The four stages include an initial co-design stage, followed by a quantitative spatio-temporal risk assessment. A bottom-up thematic analysis follows and an agent-based model wraps up the framework, connecting scales, social sectors, and mixing evidence. We implemented the framework to analyse COVID-19 in Brazil and our mixed top-down and bottom-up evidence markedly differentiates exposure and vulnerability across social classes. Since the framework’s publication, our work has adapted the framework to the climate domain, drawing from the lessons learned to overcome disciplinary siloing, taking cross-sectoral losses into account, and tracking feedback between environmental and social factors. We believe these innovations are key for promoting evidence-based and context-sensitive policies essential for fairer and more effective adaptation.

How to cite: Pereira Santos, A., Rodriguez Lopez, M., Peng, Y., and Scheffran, J.: Making Sense of Multiple Stressors, Coupled Hazards, and Systemic Risks: How can we advance inter- and transdisciplinary approaches to vulnerability with a translator model?, EGU General Assembly 2025, Vienna, Austria, 27 Apr–2 May 2025, EGU25-19269, https://doi.org/10.5194/egusphere-egu25-19269, 2025.

EGU25-19540 | Orals | ITS4.6/CL0.11

Climate-linked bonds 

Daniel Dimitrov, Dirk Broeders, and Niek Verhoeven

Climate-linked bonds are an innovative financial tool designed to address the growing challenges of climate change. These bonds, ideally issued by governments and supranational organizations, adjust their payouts based on measurable climate variables, such as average temperatures or greenhouse gas (GHG) concentrations. By directly linking financial returns to climate outcomes, climate-linked bonds provide a strong incentive for issuers to align their actions with climate change mitigation goals. The instrument not only signals a government’s commitment to addressing climate risks but also offers investors a mechanism to hedge against the long-term economic consequences of climate change.

This paper introduces an asset pricing model for climate-linked bonds, demonstrating the growing demand for these instruments amid anticipated long-term climate risks. We evaluate the factors that facilitate risk-sharing and highlight how these bonds provide favorable  terms to counterparties willing to assume climate risks, while offering long-term hedging opportunities to those seeking protection against such risks.

For governments, climate-linked bonds offer an opportunity to integrate climate accountability into their fiscal frameworks. Because the financial cost of servicing these bonds goes down with better climate outcomes, their issuance incentivizes governments to adopt robust climate policies to reduce emissions and mitigate long-term risks. Additionally, climate-linked bonds formalize the implicit role of governments as insurers of last resort, providing a structured mechanism for managing climate-related damages while enhancing fiscal predictability.

At the same time, climate-linked bonds provide investors with long-term financial protection against climate risks. Unlike alternative dynamic hedging strategies, which can be complex and costly, climate-linked bonds offer a streamlined and efficient way to mitigate exposure to climate uncertainties. As their yields are less correlated with traditional market cycles, this also makes them a valuable addition to long-term investment strategies.

Furthermore, climate-linked bonds contribute to the resilience of the financial system by addressing the ``insurance gap,'' the large portion of climate-related damages that remain uninsured. By providing a pre-emptive financial mechanism to manage these risks, climate-linked bonds reduce reliance on ad-hoc government interventions and ensure a more systematic approach to addressing the economic costs of climate change. In addition, the market-driven pricing mechanism of these bonds embeds climate risks into financial valuations, facilitating price discovery and helping to establish a term structure for long-term climate risks. This feature thereby provides valuable insights into how the market perceives climate challenges and the potential effectiveness of mitigation strategies. 

Despite their benefits, implementing climate-linked bonds comes with challenges. Designing bonds tied to clear and actionable climate metrics, such as GHG concentrations or temperature anomalies, is critical to ensure their effectiveness and credibility. Standardizing these metrics across countries and markets is equally important to foster a robust and liquid global market for climate-linked bonds. Additionally, international coordination is necessary to address the inherently global nature of climate change and ensure that the bonds incentivize collective action rather than enabling free-riding. Market liquidity is another key consideration, as a liquid market attracts diverse investors and allows the bonds to meet varying maturity needs, from short-term hedges for insurers to long-term instruments for pension funds.

How to cite: Dimitrov, D., Broeders, D., and Verhoeven, N.: Climate-linked bonds, EGU General Assembly 2025, Vienna, Austria, 27 Apr–2 May 2025, EGU25-19540, https://doi.org/10.5194/egusphere-egu25-19540, 2025.

EGU25-19673 | Orals | ITS4.6/CL0.11 | Highlight

“Boosted” realities: exploring the plausible limits of extreme weather through ensemble forecasts 

Nicholas Leach, Shirin Ermis, Erich Fischer, Olivia Vashti Ayim, Aidan Brocklehurst, Kelvin Ng, and Gregor Leckebusch

High-impact low-likelihood extreme weather events and their impacts are of considerable interest to a variety of stakeholders across both the public and private sectors. Within the financial sector, there has been a focus on understanding how these kinds of extremes may change in the future, and quantifying the impact of such changes. However, we suggest that significant effort is still needed to fully assess the present day risk from such extremes, especially given the recent increase in apparently “unprecedented” extremes.

Within academic research, the “UNSEEN” framework has recently gained traction as one approach to understanding the limits of extreme weather. However, this framework has typically focussed on using seasonal forecast simulations as they explore a wider range of longer-scale modes of climate variability than near-term forecasts. Using seasonal forecast simulations, however, places limits on the direct applicability to local extremes and introduces challenges resulting from model drift. Here, we present a corresponding approach using state-of-the-art medium-range reforecasts to explore the extreme upper tail of the weather distribution, inspired by the ensemble boosting methodology, which has thus far been implemented within relatively coarse resolution climate models. A key feature of basing our analysis on weather forecast simulations, as opposed to high resolution climate model simulations, is that the events produced are explicitly linked to the weather that actually occurred. We can analyse dynamically what would have had to happen differently for the UNSEEN extreme to become reality — and therefore assess how plausible it is and find the key synoptic precursors.

These “boosted realities” are of wide utility - they provide physically consistent event storylines which can be used for emergency management and infrastructure design, or for the validation of the upper tail of event sets produced by the natural catastrophe models used in insurance. These plausible extremes could be ideal candidates for generating so called “Tales of Future Weather”, through the application of recently developed approaches in extreme weather attribution.

How to cite: Leach, N., Ermis, S., Fischer, E., Vashti Ayim, O., Brocklehurst, A., Ng, K., and Leckebusch, G.: “Boosted” realities: exploring the plausible limits of extreme weather through ensemble forecasts, EGU General Assembly 2025, Vienna, Austria, 27 Apr–2 May 2025, EGU25-19673, https://doi.org/10.5194/egusphere-egu25-19673, 2025.

Over the past 30+ years, Moody’s/RMS has been at the forefront of catastrophe modelling, developing and supporting models for the global (re)insurance market. Those granular, bottom-up models bring together carefully calibrated stochastic simulations of extreme events with detailed assessments of the vulnerability of a wide range of building types. For any given portfolio of assets, loss distributions that incorporate a variety of local market considerations can be generated. Those models have been validated against extensive geophysical observations and against hundreds of billions of dollars of granular damage and building-specific claims data.

In this context, Moody’s/RMS has developed a novel bottom-up approach to assess the financial impacts of climate change for the broader financial sector, which leverages the respective strengths of catastrophe models and climate change model output. The ‘Climate on Demand Pro’ platform provides physical and financial risk metrics at both location- and portfolio-levels, which includes the impacts of portfolio concentration or diversification. Those metrics are provided globally, across the 21st century, for various climate scenarios and for six acute and chronic climate perils (tropical cyclones, wildfires, inland floods, coastal floods, heat stress and water stress), as well as earthquake risk. For acute perils and in core insurance markets, model development and validation benefits from the availability of the full-fledged RMS stochastic catastrophe models. However, for chronic perils (heat stress and water stress), a different approach has been used to generate the hazard and vulnerability components of the model.

This presentation will provide an overview of the methodology underpinning the heat stress model in ‘Climate on Demand Pro’, with a specific focus on the hazard and vulnerability components. Detailed results for key regions across various climate scenarios will be discussed, with a specific focus on the impact of urban heat islands on financial losses. It will be shown that heat stress could play a sizable role in future climate risk profiles. Finally, a brief overview of other features currently in development will be provided.

How to cite: Roy, K. and Khare, S.: Bottom-Up Assessment of the Financial Impacts of Climate Change: Heat Stress Modelling in the ‘Climate on Demand Pro’ Platform, EGU General Assembly 2025, Vienna, Austria, 27 Apr–2 May 2025, EGU25-19680, https://doi.org/10.5194/egusphere-egu25-19680, 2025.

EGU25-20093 | Orals | ITS4.6/CL0.11

Climate finance needs under macroeconomic and climate uncertainty:damage functions integration in IAM 

Adriano Vinca, Jarmo Kikstra, Marina Andrijevic, Edward Byers, Setu Pelz, Matt Gidden, Volker Krey, and Keywan Riahi

The economic impacts of climate change are becoming increasingly important in thecontext of chronic physical risks, but they are often assessed in isolation from the costsof mitigation, potentially skewing perceptions of mitigation efforts. Such impacts areunevenly distributed across regions, resulting not only in immediate economic lossesbut also in reduced capacity for long-term adaptation and mitigation.This work aims to advance integrated assessments of climate impacts and mitigationcosts and explore the underlying uncertainty through climate scenarios and by linkingdifferent econometric damage functions (Burke et al., 2018, Waidelich et al. , 2024, Kotzet al. , 2024) with an integrated assessment model (IAM).Using the Rapid Impact Model Emulator to link macroeconomic impacts to temperaturelevels, the MESSAGEix-GLOBIOM IAM to assess energy-land-climate responses, and theMAGICC climate model, we assess regional and global economic risks and mitigationcosts, highlighting the feedback loops between economic damages, energy, emissions,and climate outcomes.We show how climate-related losses could constrain socio-economic development,particularly in low- and middle-income regions that are most vulnerable to climatechange impacts. We further extend the analysis by incorporating principles of equity toallocate regional mitigation costs and illustrative contributions to a Loss and Damage(L&S) Fund based on historical and projected emissions, recognising the historicalresponsibility of high-income countries. This nuanced approach provides insights intoglobal and regional financial needs for both mitigation and addressing global loss anddamage, which are critical for equitable international climate agreements.This work aims to refine the quantitative assessment of climate risk by exploringuncertainty at different levels using scenarios, multiple macroeconomic models andprobabilistic output from the MAGICC climate model, thus providing confidenceintervals for both the costs of climate change and the actions needed to mitigate it.

How to cite: Vinca, A., Kikstra, J., Andrijevic, M., Byers, E., Pelz, S., Gidden, M., Krey, V., and Riahi, K.: Climate finance needs under macroeconomic and climate uncertainty:damage functions integration in IAM, EGU General Assembly 2025, Vienna, Austria, 27 Apr–2 May 2025, EGU25-20093, https://doi.org/10.5194/egusphere-egu25-20093, 2025.

While earlier studies documented long-term decreasing trends in heat-related mortality in most European countries, including the Czech Republic, recent research suggest a reversal in this trend during the last decade (2010-2019). This observation supports future climate projections that suggest growing impacts of heat on mortality in Europe and for the development of targeted heat prevention measures. In the first stage of this study, we used a detailed mortality database to analyze spatio-temporal variations in temperature-mortality relationships in NUTS3 regions of the Czech Republic from 1994 to 2020. The individual database allows for the comparison of temperature-mortality links among selected population groups, categorized by sex, age, and the primary cause of death. Daily mean temperature at the regional level was obtained from the ERA5 reanalysis. We applied distributed lag non-linear models (DLNMs) within a multilevel mixed meta-regression framework to identify variations in the relative risk of temperature-related mortality among selected regions and population groups through exposure-response functions (ERFs). In the final stage, high-resolution climate projection data EURO-CORDEX, driven by RCP scenarios were employed to estimate future dynamics of heatwaves in the Czech Republic and their connection with heat-relate mortality. These projections relied on ERFs derived in the first stage to assess impacts for each region and population group. Results of the analysis enabled us to identify population groups potentially most affected by climate change. Geographical demographic, and socio-economic characteristics of the NUTS3 regions were included in the meta-regression model to identify socio-economic modifiers of the temperature-related mortality patterns. The study's findings highlighted the importance of developing regional public health initiatives, and adaptation to climate change policies to safeguard vulnerable people from the growing effects of extreme temperatures.

How to cite: Naz, F., Dogan, T., and Urban, A.: Spatio-temporal variations in temperature-related mortality links and Future climate projections impacts in the Czech Republic, EGU General Assembly 2025, Vienna, Austria, 27 Apr–2 May 2025, EGU25-398, https://doi.org/10.5194/egusphere-egu25-398, 2025.

EGU25-2802 | ECS | PICO | ITS2.3/CL0.12

Spatial inequalities of the effect of heat on health in Switzerland 

Garyfallos Konstantinoudis, Xinyi Chen, Connor Gasgoigne, and Marta Blangiardo

Introduction:
High ambient temperatures can cause unnecessary mortality, with the health effects of heat often being non-linear. Previous studies have shown that certain regions are more vulnerable. This study investigates the non-linear spatial vulnerabilities of heat exposure on all-cause mortality across small areas in Switzerland.

Methods:
We retrieved daily all-cause mortality and annual population data (2011–2022) for 2,145 municipalities, disaggregated by age and sex, from the Swiss Federal Office for Public Health and the Swiss Office for National Statistics. Daily temperature estimates at 1 km resolution were obtained from the Federal Office for Meteorology and Climatology and aggregated to the municipality level using population weights.

We developed a Bayesian Poisson hierarchical model to account for holidays, day of the week, long-term trends, and spatial correlation, allowing the heat effect to be both non-linear and spatially varying. We modelled spatiotemporal correlations using Gaussian priors with a structured covariance matrix. We considered a 3-day lagged temperature effect, and we focused on summer months (June–August). We further examined spatial inequalities using modifiers such as green space and deprivation.

Results:
During summer 2011–2022, we observed 160,027 deaths among individuals aged 65 years and older in Switzerland. The overall temperature-mortality association was J-shaped, with significant spatial disparities. Heat-attributable deaths were highest in northern Switzerland. Key contributors to spatial vulnerabilities included older age, lower green space coverage, and higher average temperatures.

Conclusion:
This study presents a computationally efficient modelling framework to describe the spatial variation of heat effects across small areas in Switzerland. It highlights local disparities in heat-related health risks and emphasizes the need for targeted public health interventions to address spatial inequalities.

How to cite: Konstantinoudis, G., Chen, X., Gasgoigne, C., and Blangiardo, M.: Spatial inequalities of the effect of heat on health in Switzerland, EGU General Assembly 2025, Vienna, Austria, 27 Apr–2 May 2025, EGU25-2802, https://doi.org/10.5194/egusphere-egu25-2802, 2025.

Background: Exposure to heat increases the risk of hospitalisation due to several causes, including cardiovascular and respiratory diseases and mental disorders. Older adults are especially vulnerable to heat, yet it is unclear which individuals are at a higher risk—for example, those with specific comorbidities (e.g., diabetes, Alzheimer’s), levels of dependency, or activity patterns. To address this knowledge gap, we assess the risk of emergency hospital admission (EHA) associated with heat among the older population of different characteristics during the warmer months (May to September) from 2019 to 2022 in Switzerland.

Methods: We collected individual-level EHA data linked to detailed health information gathered from homecare services (Spitex). For each admission, we calculated the population-weighted daily maximum temperature of the medical district of residence (Medstat regions) using 1km gridded temperature data. We employed an individual-level case time series design and assessed the association between EHA and heat using distributed lag non-linear models. We stratified the analysis by population subgroups according to individual characteristics, including comorbidities, levels of social interaction, and daily activity capacities.

Results: Overall, we observed a 13% increase in EHA risk during heat days (at the 99th temperature percentile, compared to the minimum hospitalisation temperature percentile [MHP]) (relative risk (RR): 1.13; 95% CI: 1.05-1.21). Older adults who did not receive assistance with daily activities and self-care had a higher risk of EHA than those receiving assistance. Furthermore, we observed that individuals with more frequent interactions with family members exhibited higher risk (1.15; 1.07-1.25) than those with low interaction levels (1.02; 0.84-1.23). A higher risk was also observed in individuals who spend less time alone (1.20; 1.10-1.32 vs. high time alone 1.02; 0.90-1.15)) and lived with a partner (1.26; 1.12-1.41 vs. living alone 1.05; 0.95-1.17). In terms of comorbidities, older individuals with cancer (1.36; 1.16-1.61), diabetes (1.15; 1.00-1.34), and dementia or Alzheimer’s disease (1.26; 1.05-1.51) had a higher risk of EHA associated with heat.

Conclusion: Our results indicate that individuals experienced varying EHA risks during heat days based on their self-care abilities, level of social engagement, and existing health conditions. These findings underscore the need for targeted public health measures considering individual risk factors.

How to cite: Lee, S. and Vicedo-Cabrera, A. M.: Who is more vulnerable among the most vulnerable? Assessing vulnerability profiles to heat in older adults in Switzerland, EGU General Assembly 2025, Vienna, Austria, 27 Apr–2 May 2025, EGU25-3118, https://doi.org/10.5194/egusphere-egu25-3118, 2025.

EGU25-5214 | ECS | PICO | ITS2.3/CL0.12

The compound role of temperature and influenza in seasonal mortality patterns in Europe  

Ekaterina Borisova, Aleš Urban, Tomáš Janoš, and Joan Ballester

Seasonal mortality patterns are influenced by a complex interaction between climatic factors, such as temperature variability, and epidemiological factors, such as the incidence of influenza-like illnesses (ILI). However, the extent to which year-to-year variations in mortality attributable to cold weather and seasonal influenza affect population vulnerability to extreme temperatures in subsequent warm seasons remains poorly understood.

This study aims to assess the interaction between cold-season temperature variability and influenza activity on excess mortality in both cold and warm seasons. Specifically, we investigate how cold-season mortality patterns, driven by non-optimal temperatures and varying levels of ILI incidence, influence population vulnerability to extreme heat in the following summer.

We utilize daily weather and mortality data sourced from the EARLY-ADAPT dataset for the European region, along with weekly ILI counts obtained from the ERVISS surveillance system, spanning multiple years. Epidemic seasons were classified into high, moderate, or low influenza activity based on ILI thresholds (>67th, 33rd–67th, and <33rd percentiles, respectively). Using a two-stage mixed-effect meta-regression analysis, we investigate associations between temperature, influenza activity, and excess mortality during the cold season, as well as their potential influence on heat-related mortality in the following warm season.

Preliminary analyses suggest that the interaction between influenza incidence and low temperatures amplify seasonal mortality risks. This research sheds light on the complex relationship between climatic variability, respiratory infections, and seasonal mortality patterns, offering valuable insights for developing more effective public health strategies to mitigate temperature-related risks. These findings underscore the importance of integrating epidemiological and climatic data to enhance public health adaptation strategies in the face of climate change.


Keywords: DLNM, seasonal mortality, influenza, heat stress, temperature variability

How to cite: Borisova, E., Urban, A., Janoš, T., and Ballester, J.: The compound role of temperature and influenza in seasonal mortality patterns in Europe , EGU General Assembly 2025, Vienna, Austria, 27 Apr–2 May 2025, EGU25-5214, https://doi.org/10.5194/egusphere-egu25-5214, 2025.

As research on the health effects of climate change-related disasters often focuses on the immediate health effects on affected populations, we know less about how the consequences of disasters influence people’s health in the medium term after disasters have occurred. By examining how disasters affect drinking water sources in low- and middle-income countries, this paper aims to explore whether changes in drinking water sources depend on community resilience to disasters. Drinking water is an important determinant of health, as it directly affects a range of health outcomes resulting from water-borne diseases, including diarrhoea or chronic diseases connected to parasites, bacteria, or chemical contamination. We use data from the Demographic and Health Surveys (DHS) on the quality of the drinking water source and combine the data with the Georeferenced Disaster (GDIS) dataset and Getis-Ord Gi* hot spots of climate change. By matching all observations on relevant indicators such as healthcare access, state reach and climate exposure, we analyse the evolution of change in drinking water sources over the first couple of years after disasters. We expect to find the biggest changes after disasters in areas where the state reach and consequently, resilience, is low. In addition, we expect these changes to be more protracted in the areas experiencing more severe climate change impacts.

How to cite: Murau, L. and Rosvold, E. L.: The consequences of climate change-related disasters on the access to drinking water in low- and middle-income countries, EGU General Assembly 2025, Vienna, Austria, 27 Apr–2 May 2025, EGU25-5590, https://doi.org/10.5194/egusphere-egu25-5590, 2025.

EGU25-7281 | PICO | ITS2.3/CL0.12

Effects of non-optimal temperature exposure on children and adolescents mortality risk in Brazil: small-area case time series approach. 

Ludmilla Viana Jacobson, Jony Pinto Junior, Mauricio Barreto, and Rochelle Schneider

Background: Since 2000, mortality from preventable causes among children under 5 years of age has been decreasing in Brazil. However, the effects of exposure to extreme temperatures are still a concern due to climate change. The aim of this study is to quantify the non-linear and delayed effects of non-optimal temperature exposure on children and adolescents from zero to nineteen years of age with mortality risk in Brazil using a case-time series analysis. Methods: A small-area analysis was performed using data on all non-accidental causes of mortality and air temperature for the 5570 municipalities within 27 Federation Units (FU`s) across Brazil between Jan 1, 2000, and Dec 31, 2019. First, we applied the case-time series design, modeling multiple municipalities-specific series within each of 27 FU and Regions (North, Northeast, Southeast, South, and Midwest) through a conditional Poisson regression. Temperature–mortality associations were modeled through distributed lag non-linear models (lag: 0-7 days). Then, a meta-regression was used to pool FU-specific estimates using area-level climatological, socioeconomic, and vulnerability predictors. Results: In Brazil, the annual mean deaths for the 0-19 age-specific group was 2,256 deaths. The total non-optimal temperature-attributable fraction of death was estimated at 2.8% (CI95%: 1.53%; 4.08%), of which 2.35% (CI95%: 1.06%; 3.66%) was attributable to heat exposure (temperatures above the optimum temperature or minimum mortality). The average point of minimum mortality was 27.2°C, corresponding to the 90th percentile of the pooled temperature distribution. The pooled curve suggests an increase in relative risk (RR) for hot temperatures with a steeper increase for extreme temperatures when compared to mild heat. Region-specific shapes for the mortality risk pooled curve vary, e.g., in the south and southeast regions U-shape and J-shape were observed, respectively. The heat effects were higher in the first 0-3 days of exposure, although the cold effects were higher after 3 days (except for the Northeast region where there was no cold effect). The multivariate Cochran Q test for heterogeneity was highly significant (p-value < 0.001), and the related I2 statistic indicates that 51% of the variability is due to true heterogeneity across FU`s. Part of this variability was explained by climate and social vulnerability composite indicators. The fractions of deaths attributable to heat exposure were significant (p<0.001) for all FU`s from the Midwest, Southeast, and South regions, varying from 0.8% to 2.6%. In the North, Rondônia (1.39%), Acre (1.44%), Amapá (2.96%), and Tocantins (1.60%) had a significant heat-attributable fraction of death. Also, in the Northeast, the FU`s with significant heat-attributable fractions were Sergipe (0.99%), Piauí (2.81%), and Maranhão (1.34%). Cold-attributable fraction of deaths were notable for all FU`s in the south region (Paraná = 2.54%; Rio Grande do Sul = 1.47%; Santa Catarina = 1.11%) and for São Paulo state (0.76%). The spatial distribution of heat-attributable deaths by municipality level suggests hot spots in the Tropical Brazil Central Climate Zone. Conclusion: This study showed significant risks and attributable deaths associated with non-optimal temperature for children and adolescents in Brazil. This approach yields results for municipality, state, and national levels.

How to cite: Viana Jacobson, L., Pinto Junior, J., Barreto, M., and Schneider, R.: Effects of non-optimal temperature exposure on children and adolescents mortality risk in Brazil: small-area case time series approach., EGU General Assembly 2025, Vienna, Austria, 27 Apr–2 May 2025, EGU25-7281, https://doi.org/10.5194/egusphere-egu25-7281, 2025.

EGU25-8254 | ECS | PICO | ITS2.3/CL0.12

Skilful forecasting of heat-realted mortality for the European summer of 2022 

Emma Holmberg, Marcos Quijal-Zamorano, Joan Ballester, and Gabriele Messori

Europe is a heatwave hotspot: numerous temperature records have been broken in recent summers, and roughly 60,000 and 50,000 heat-related deaths occurred in the summers of 2022 and 2023, respectively. With recent summers, like that of 2022, projected to become the new norm, there is a pressing need to further develop heat-health warning systems to help society adapt to a warming climate. Here, we forecast heat-related mortality by applying a statistical epidemiological framework to temperature forecasts extending up to two weeks in advance. Focusing on 2022, a recent and exceptional summer in Europe, we evaluate the skill of the daily heat-related mortality forecasts, and assess its association with temperature. For most of Europe, milder temperatures, close to the minimum mortality temperature, are associated with more skilful heat-related mortality forecasts. However, some of the hottest regions in Europe instead showed enhanced forecast skill associated with higher temperatures. This suggests that heat-related mortality forecasts could provide valuable information in European regions associated with high levels of heat-related mortality. Consequently, we advocate for local health authorities to include information from forecasts of heat-related mortality in their heat warning systems.

How to cite: Holmberg, E., Quijal-Zamorano, M., Ballester, J., and Messori, G.: Skilful forecasting of heat-realted mortality for the European summer of 2022, EGU General Assembly 2025, Vienna, Austria, 27 Apr–2 May 2025, EGU25-8254, https://doi.org/10.5194/egusphere-egu25-8254, 2025.

EGU25-8444 | PICO | ITS2.3/CL0.12

Rising Temperatures, Rising Risks: Heat-Related Mortality in Romania (2015–2024) 

Bogdan Antonescu, Raluca Turcu, Luminița Mărmureanu, and Dragoș Ene

Heatwaves constitute some of the most extreme meteorological phenomena, profoundly affecting public health. Notwithstanding global focus on heat-related mortality, research on this topic in Romania remains scarce. This study seeks to estimate the impact of heat-related mortality in Romania from the summers of 2015 to 2024, a timeframe characterised by rising temperatures and extreme weather phenomena. Utilising national mortality records that include data from all regions of Romania and a population of around 19 million, we estimate the fatalities related to heat throughout this timeframe. Initial findings indicate considerable variability in death rates among locations and demographic cohorts, with elderly women (80+ years) and men aged 0–64 years being the most impacted. Results demonstrate a significant effect in metropolitan areas and locales with inadequate adaptive strategies. These findings underscore the pressing necessity for improved heat monitoring systems, focused public health initiatives, and sustainable climate adaption strategies in Romania. This study constitutes one of the initial thorough examinations of heat-related mortality in Romania, providing essential information for policy formulation and public health strategy. Recent research have emphasised the rising frequency and severity of heatwaves in Romania. In the summer of 2023, a record-breaking heatwave persisted for 19 consecutive days in southeastern Romania, spreading into Ukraine. Furthermore, studies demonstrate that the duration, spatial range, and occurrence of heatwaves in Romania exhibit decadal fluctuations, with a significant acceleration in their rise following the 1990s. The increasing frequency of heat events highlights the necessity of examining heat-related mortality in Romania to guide appropriate public health responses and policy measures.

How to cite: Antonescu, B., Turcu, R., Mărmureanu, L., and Ene, D.: Rising Temperatures, Rising Risks: Heat-Related Mortality in Romania (2015–2024), EGU General Assembly 2025, Vienna, Austria, 27 Apr–2 May 2025, EGU25-8444, https://doi.org/10.5194/egusphere-egu25-8444, 2025.

EGU25-11896 | PICO | ITS2.3/CL0.12

Warming trends and impacts of recent heat waves on mortality in Apulia (souther 

Piero Lionello, Francesco Giangrande, Riccardo. Buccolieri, and Gianluca Pappaccogli

Global warming is expected to be large with respect the corresponding zonal mean in the Mediterranean region (50% higher than the mean global warming rate). Here we show some observed impact of the ongoing stage of this anomalously large warming on the population of Apulia, where annual temperature has been increasing since the mid of the last century with a trend of 0.18°C that has approximately doubled in the last 50years. This has resulted in a substantial increase of hot days and nights (TX90p and TN90p), whose frequency has often surpassed 25% since the end of the 20th century. The increase is maximum in summer, particularly in July with many years showing values higher than 3°C above the 1961-1990 average in the last two decades. This warming has produced a corresponding increase of heat waves with impacts on the population mortality in summer. Our analysis is based on the meteorological dataset of the regional network of weather stations (operated by Environmental Protection Regional Agency and Civil Protection Agency of the Apulia region) and the number of deaths provided by ISTAT (Italian National Institute of Statistics). Results clearly show that during summer heat waves mortalities exceed the long term average rate with approximately 10 excess deaths per million inhabitants during hot days when temperature anomalies reach 8°C.

This research has been carried out with financial support from PNRR ITINERIS IR0000032 - Missione 4, Componente 2, Investimento 3.1 “Fondo per la realizzazione di un sistema integrato di infrastrutture di ricerca e innovazione” funded by European Union – NextGenerationEU (CUP B53C22002150006) and from Financial support ICSC – Centro Nazionale di Ricerca in High Performance Computing, Big Data and Quantum Computing, funded by European Union – NextGenerationE Project code CN_00000033, CUP C83C22000560007

How to cite: Lionello, P., Giangrande, F., Buccolieri, R., and Pappaccogli, G.: Warming trends and impacts of recent heat waves on mortality in Apulia (souther, EGU General Assembly 2025, Vienna, Austria, 27 Apr–2 May 2025, EGU25-11896, https://doi.org/10.5194/egusphere-egu25-11896, 2025.

EGU25-12176 | PICO | ITS2.3/CL0.12

Developing epidemiological indicators to understand the burden of climate-sensitive infectious diseases on children  

Rachel Lowe, Georgina Eva Ceres Charnley, Dohyung Kim, and Rohini Sampoornam Swaminathan

The use of epidemiological indicators and platforms are an essential tool in infectious disease early warning systems and provide an interpretable snapshot of health risks globally to a range of end users including scientists, medical practitioners, policy makers, non-governmental organisations and the general public. Climate-sensitive infectious diseases (CSIDs) are a group of diseases which are considered to be at least in part driven by changes in climatic conditions, and include a range of water-borne, air-borne and vector-borne diseases, many of which are also zoonotic. There are a range of CSID indicators which have currently been developed and published, such as those presented in the Lancet Countdown and their regional reports, along with platforms such as EpiOutlook, to communicate indicator results and provide seasonal forecasts and projections. A demographic poorly served by most indicators and platforms for CSIDs are children, despite them facing a high burden of infectious diseases globally and being disproportionately impacted by climate change. In 2022, 13,400 children under the age of five died every day, with the greatest contributor to these deaths coming from infectious diseases. Climate change can impact children's development, including via CSIDs, leading to lifelong poor health outcomes. Here, we propose leveraging our existing knowledge of CSIDs and indicator development, to co-create indicators to specifically estimate exposure in children, in collaboration with UNICEF. We aim to take a global approach to investigate key vector-, water- and air-borne diseases which are both climate sensitive and have a high burden in children such as malaria, cholera and meningitis, respectively. The indicators will be based on threshold-based models of key climatic drivers for these diseases, and any additional risk factors, such as land use and travel. The models will use ERA5 global gridded climate datasets and Copernicus land use data, to provide an estimated proportion of the child population (<19 years old) which live in areas that are at risk of these key diseases. The results will be stratified by additional socio-economic factors which are important for many CSIDs, including the rural/urban populations and poverty according to UNICEF’s multidimensional child poverty data. We hope these indicators can be used in CSID platforms, or via standalone reports to provide additional insights into the impacts of climate change on children. 


How to cite: Lowe, R., Charnley, G. E. C., Kim, D., and Swaminathan, R. S.: Developing epidemiological indicators to understand the burden of climate-sensitive infectious diseases on children , EGU General Assembly 2025, Vienna, Austria, 27 Apr–2 May 2025, EGU25-12176, https://doi.org/10.5194/egusphere-egu25-12176, 2025.

EGU25-15737 | ECS | PICO | ITS2.3/CL0.12 | Highlight

Heat-related mortality in Europe during the summer of 2024: capacity of early warnings to anticipate the burden and prevent deaths 

Tomáš Janoš, Marcos Quijal-Zamorano, Elisa Gallo, Raúl Fernando Méndez Turrubiates, Nadia Denisse Beltrán Barrón, Fabien Peyrusse, and Joan Ballester

The year of 2024 was the warmest on record, both globally and in Europe, and the first to exceed 1.5°C in global mean temperature above the preindustrial level. Successive record-breaking temperatures in recent years emphasized the urgent need to develop and implement a new generation of impact-based early-warning systems (EWS), using epidemiological models to transform weather forecasts into health predictions (see https://forecaster.health/).

Here we combined the newly created daily continental mortality database of the EARLY-ADAPT project (https://www.early-adapt.eu/), the open-access Eurostat weekly mortality database, ensemble weather forecasts from ECMWF, and temperature observations from ERA5-Land to (i) estimate the heat-related mortality burden during the summers of 2022-2024, and (ii) analyse the forecast skill of the novel heat-health EWS.

The record-breaking temperatures of the 2024 were associated with the highest heat-related mortality burden in Greece, Bulgaria, Serbia and Romania. Our analysis showed that the impact-based EWS can predict heat-related mortality burden at least six days in advance, even during exceptionally warm summers. However, when considering extreme temperatures (> 95th percentile), the temporal prediction window is shorter, with a lead time of 1-2 days. Overall, the novel heat-health EWS demonstrated a high capacity to distinguish between warning and non-warning days at least 7 days in advance in majority of European regions (area under the ROC curve > 0.8). The system performed generally better in Southern Europe where the most of summer heat-related deaths occur.

Our study provides key information for public health agencies to activate heat-health action plans at the right time, accounting for the different vulnerability of different population subgroups and regional differences in vulnerability to heat across Europe.

How to cite: Janoš, T., Quijal-Zamorano, M., Gallo, E., Fernando Méndez Turrubiates, R., Denisse Beltrán Barrón, N., Peyrusse, F., and Ballester, J.: Heat-related mortality in Europe during the summer of 2024: capacity of early warnings to anticipate the burden and prevent deaths, EGU General Assembly 2025, Vienna, Austria, 27 Apr–2 May 2025, EGU25-15737, https://doi.org/10.5194/egusphere-egu25-15737, 2025.

EGU25-19055 | PICO | ITS2.3/CL0.12

Do heat prevention plans reduce heat-related mortality across Europe? 

Aleš Urban, Veronika Huber, Salomé Henry, Nuria Pilar Plaza, Shouro Dasgupta, Pierre Masselot, Ben Armstrong, and Antonio Gasparrini

Heat-health warning systems and action plans, referred to as heat prevention plans (HPPs), are key public health interventions aimed at reducing heat-related mortality. Despite their importance, prior assessments of their effectiveness have yielded inconsistent results.

We analysed daily mortality and mean temperature data from 102 locations in 14 European countries between 1990 and 2019. Using data from national experts, we identified the year of HPP implementation and categorised their development class. A three-stage analysis was conducted: (1) quasi-Poisson time series models were used to estimate location-specific warm-season exposure-response functions in three-year subperiods; (2) mixed-effect meta-regression models with multilevel longitudinal structures were employed to quantify changes in pooled exposure-response functions due to HPP implementation, adjusted for long-term trends in heat vulnerability; and (3) the heat-related excess mortality due to HPP was calculated by comparing factual (with HPP) and counterfactual (without HPP) scenarios. Estimates are reported by country, region, and HPP class.

HPP implementation was associated with a 25.2% [95% CI: 19.8%–31.9%] reduction in excess deaths attributable to extreme heat, corresponding to 1.8 [95% CI: 1.3–2.4] avoided deaths annually per 100,000 inhabitants. This equates to an estimated 14,551 [95% CI: 10,118–19,072] total deaths avoided across all study locations following HPP implementation. No significant differences in HPP effectiveness were observed by European region or HPP class.

Our findings provide robust evidence that HPPs substantially reduce heat-related mortality across Europe, accounting for temporal changes and geographical differences in risks. These results emphasise the importance of monitoring and evaluating HPPs to enhance adaptation to a warming climate.

How to cite: Urban, A., Huber, V., Henry, S., Pilar Plaza, N., Dasgupta, S., Masselot, P., Armstrong, B., and Gasparrini, A.: Do heat prevention plans reduce heat-related mortality across Europe?, EGU General Assembly 2025, Vienna, Austria, 27 Apr–2 May 2025, EGU25-19055, https://doi.org/10.5194/egusphere-egu25-19055, 2025.

EGU25-19569 | ECS | PICO | ITS2.3/CL0.12

The influence of transient air pollution exposure on preterm birth: A case-crossover analysis with high spatio-temporal resolution assessment in the Rotterdam-Rijnmond region, The Netherlands  

Medha J Pfaff, Benjamin Y Gravesteijn, Nienke W Boderie, Sef van den Elshout, Lizbeth Burgos Ochoa, Loes CM Bertens, Famke JM Mölenberg, Fabio Porru, Alex Burdorf, and Jasper V Been

Background
Air pollution, a leading risk factor for mortality, is linked to adverse birth outcomes, including preterm birth (PTB). This study investigated the association between the transient exposure to three pollutants (Particulate Matter with a diameter < 10 µm (PM10), Nitrogen Dioxide (NO2) and Ozone (O3)) and PTB during the week before delivery. As previous research in the study area mainly investigated chronic or long-term exposure to air pollution and is subject to confounding, the current work presents an important contribution to the literature.

Methods
This case-crossover-study included 13’058 singleton preterm deliveries (< 37 weeks) in the Rotterdam-Rijnmond region, the Netherlands, between 2003 and 2019. Daily averaged pollutant concentrations, derived through dispersion modelling by the local environmental service (DCMR) were spatiotemporally linked to the residence of birth parents. We conducted conditional logistic regression to derive odds ratios (ORs) and 95% confidence intervals (CIs) for the association between an interquartile range (IQR) increase in pollutants and PTB across individual lag days. Moreover, we performed subset analyses based on season (warm vs. cold), socioeconomic status (SES; lowest vs. highest quintile) and spontaneous PTB cases only.

Results
During the warm season (May-October), an interquartile range (IQR) increase in O3 was linked to a 3%, respectively 4%, rise in the odds of preterm birth (PTB) on the two days preceding delivery, for the general study population and the spontaneous PTB subgroup. For the low-SES subset, increased odds of PTB were observed by 9% on lag day 6 (ORlag6 1.09, 95% CI 1.02 -1.16).
In the cold season (November-April), an IQR increase in NO2 was associated with a 4-10% increase in PTB odds during the week before birth, peaking around lag days 1 and 2 (ORlag1 1.10, 95% CI 1.05-1.15; ORlag2 1.10, 95% CI 1.06-1.15). Meanwhile, the low-SES subgroup saw a 10% rise during the three days preceding delivery (ORlag1-3 1.10, 95% CI 1.00 – 1.19), whereas for the spontaneous PTB subgroup, a rise of 6% was found at lag6 (ORlag6 1.06, 95% CI 1.00, 1.12). Similarly to ozone, PM10 was associated with a slight increase in odds of 3% close to the delivery date (ORlag0-1 1.03, 95% CI 1.00, 1.06). No significant findings were derived for the subset analyses.  

Conclusion
The results suggest that short-term exposure to all three pollutants is associated with increased risk of PTB. Furthermore, the findings point to the heightened vulnerability of the low-SES and spontaneous PTB subgroups, despite their relatively small sample size. With the high spatiotemporal resolution of the utilized air quality data and the robust case-crossover design underlining the validity of the results, future studies should ideally incorporate information about time of onset of labor and indoor air quality data to tackle potential issues of non-differential exposure misclassification.  

How to cite: Pfaff, M. J., Gravesteijn, B. Y., Boderie, N. W., van den Elshout, S., Burgos Ochoa, L., Bertens, L. C., Mölenberg, F. J., Porru, F., Burdorf, A., and Been, J. V.: The influence of transient air pollution exposure on preterm birth: A case-crossover analysis with high spatio-temporal resolution assessment in the Rotterdam-Rijnmond region, The Netherlands , EGU General Assembly 2025, Vienna, Austria, 27 Apr–2 May 2025, EGU25-19569, https://doi.org/10.5194/egusphere-egu25-19569, 2025.

Despite its minimal contribution to global greenhouse gas emissions, Nepal is facing significant climate challenges due to its diverse geography (1). The impacts of climate change are becoming increasingly evident in the country, exacerbating vulnerabilities in sectors such as energy, and public health. Climate change has caused rising temperatures, glacial retreat, altered rainfall patterns, and frequent extreme weather events, which not only threaten the environment but also pose serious risks to public health (2). Climate-sensitive health outcomes in Nepal include a range of diseases such as vector-borne, respiratory, and food and waterborne illnesses, along with undernutrition and mental health concerns (3). Nepal's energy sector relies heavily on hydropower, which makes up nearly 90% of the country’s electricity generation. However, climate-induced changes in water availability due to altered rainfall patterns and glacial melt pose a significant risk to hydropower production. In addition, rural households remain heavily dependent on traditional biomass fuels for cooking, contributing to indoor air pollution and respiratory diseases (4).

Building on existing evidence, this study aims to investigate the interconnected impacts of climate variability and energy insecurity on public health in Nepal. The primary objective is to synthesize evidence from health, climate, and energy sectors to assess how these factors jointly influence health outcomes, with a particular emphasis on identifying population vulnerabilities. Additionally, the research seeks to formulate evidence-based policy recommendations to improve energy security, enhance public health, and strengthen climate resilience. These recommendations will target the challenges of climate change and energy insecurity, promoting sustainable development and health equity in vulnerable communities.

This study employs a mixed-methods approach, combining an extensive literature review with expert consultations. The literature review draws on peer-reviewed articles, policy reports, and institutional publications to analyze the current and projected effects of climate change and energy insecurity on public health. The review emphasizes risk factors, vulnerabilities, and future scenarios. Expert consultations will be conducted to contextualize findings, validate key insights, and refine policy recommendations. This combined methodology aims to generate a holistic understanding of the synergistic impacts of climate and energy factors on health and inform actionable, resilience-focused strategies.

Preliminary findings highlight a strong link between energy insecurity and health outcomes, exacerbated by climate change. The study proposes a conceptual framework linking these factors and offer policy recommendations to address energy poverty, enhance resilience, and improve health outcomes in Nepal.

References:

  • Tome J, Richmond HL, Rahman M, Karmacharya D, Schwind JS. Climate change and health vulnerability in Nepal: A systematic review of the literature since 2010. Vol. 17, Global Public Health. Routledge; 2022. p. 1406–19.
  • Dhimal M, Ahrens B, Kuch U. Climate change and spatiotemporal distributions of vector-borne diseases in Nepal - A systematic synthesis of literature. Vol. 10, PLoS ONE. Public Library of Science; 2015.
  • Dhimal M, Bhandari D, Lamichhane Dhimal M. Climate Change and Human Health: Vulnerability, Impact and Adaptation in Hindu Kush Himalayan Region. In 2023. p. 159–69.
  • National Statistics Office. National Population and Housing Census 2021: National Report. Kathmandu: Government of Nepal; 2023.

How to cite: Paudel, P. and Huang-Lachmann, J.-T.: Assessing the Interconnected Impacts of Climate Change and Energy Vulnerability on Public Health in Nepal, EGU General Assembly 2025, Vienna, Austria, 27 Apr–2 May 2025, EGU25-21120, https://doi.org/10.5194/egusphere-egu25-21120, 2025.

EGU25-927 | ECS | Orals | ITS3.1/CL0.14

Co-creation processes for conservation and ecosystem services management 

Marta Silva, Ana Matias, Beatriz Bharwany, Inês Carneiro, Ana Sousa, Óscar Ferreira, Katerina Kombiadou, Sara Moreno Pires, and A. Rita Carrasco

Coastal wetland governance involves the institutions, people, policies, laws, and norms that guide decision-making and responsibilities affecting coastal wetlands and their users. The unique wetland ecosystems motivate conservation efforts, while their natural resources can become targets of exploitation, leading to multiple conflicting interests. Co-creation processes between stakeholders, as a practice of collaborative management, can help mitigate conflicts but it requires the willingness to compromise, mutual understanding, and effective dialogue. The current work explores a co-creation process under the scope of an ongoing science-for-policy project, aimed at defining sustainable adaptation pathways for wetlands conservation and carbon sequestration management in the Ria Formosa lagoon. Co-creation methodologies are being employed at various stages, and include the exchange of information (maps, fact sheets, management plans, directives, etc.) and focus groups with involved partners, i.e., researchers, regional decision-makers, and managers. The scientific development of the project, including data collection and modelling scenarios is being guided by the choices made collaboratively between all stakeholders. Three methodologies are being used to evaluate the level of partner engagement and effectiveness of the collaboration: 1) analysis of qualitative information gathered at the beginning and end of the process; 2) monitoring the communication between stakeholders; and 3) analysis of the stakeholder’s perspectives on strategic plans and other documents, shown formally at focus groups meetings or through informal conversations. The results of this co-creation process are relevant to a) the research of methodologies best suited to co-participatory management practices for Natural Parks and b) the establishment of foundations in evidence-based land management foundations.

Acknowledgements: This study contributes to the project C-Land (CEXC/4647/2024), funded by the Fundação para a Ciência e a Tecnologia, and RestLands (ID 705677) funded by Planet Labs.

How to cite: Silva, M., Matias, A., Bharwany, B., Carneiro, I., Sousa, A., Ferreira, Ó., Kombiadou, K., Moreno Pires, S., and Carrasco, A. R.: Co-creation processes for conservation and ecosystem services management, EGU General Assembly 2025, Vienna, Austria, 27 Apr–2 May 2025, EGU25-927, https://doi.org/10.5194/egusphere-egu25-927, 2025.

EGU25-1444 | ECS | Orals | ITS3.1/CL0.14

The Role of Landscape Features in Enhancing Cultural Ecosystem Services 

Agnieszka Nowak-Olejnik, Joanna Hibner, Joanna Hałys, and Marcin Rechciński

Green spaces offer a variety of cultural ecosystem services that enhance the well-being of visitors. However, the specific landscape features that influence the provision of specific benefits are not yet fully understood. Factors such as the location of green spaces (e.g., mountain/rural, peri-urban, urban), the composition and configuration of landscape elements, and their seasonality likely play a significant role. Furthermore, challenges such as climate change, land use changes, pollution, and over-tourism may reduce the ability of these areas to provide cultural ecosystem services.

This study aimed to explore which landscape and spatial features enhance or hinder the provision of cultural ecosystem services. We conducted 35 semi-structured interviews with visitors to six green spaces located across a rural-urban gradient: two mountain areas in the Carpathians, two peri-urban spaces near Kraków, Poland, and two urban green spaces in Kraków.

Our findings reveal that visitors reported experiencing cultural ecosystem service benefits in all green spaces, though the intensity of these benefits varied by location. Landscape features had different impacts depending on the type of benefit. For some benefits, such as relaxation, greenery in general was the key element, while for others, such as strengthening social bonds, infrastructure features were more important. In addition, seasonality was crucial for certain benefits, such as educational or aesthetic values. Personal factors also played a crucial role in the perception of some benefits like social bonds, spirituality, or education.

By understanding the role of landscape features in enhancing cultural ecosystem services, we can develop land management strategies that prioritize human well-being while preserving other crucial services of green spaces, particularly regulatory ones, in the context of climate change and other global challenges.

The study was supported by the National Science Centre, Poland (OPUS-21; grant no. 2021/41/B/HS4/00648).

How to cite: Nowak-Olejnik, A., Hibner, J., Hałys, J., and Rechciński, M.: The Role of Landscape Features in Enhancing Cultural Ecosystem Services, EGU General Assembly 2025, Vienna, Austria, 27 Apr–2 May 2025, EGU25-1444, https://doi.org/10.5194/egusphere-egu25-1444, 2025.

EGU25-2061 | ECS | Orals | ITS3.1/CL0.14

Merging economics, environmental science, and local knowledge to inform lake decision-making  

Danielle Spence, Helen Baulch, and Patrick Lloyd-Smith

Freshwater lakes are increasingly threatened by cultural eutrophication, caused by human activities such as agriculture and sewage outflows that over-fertilize waterbodies with nutrients like nitrogen and phosphorus, often triggering harmful algal blooms (HABs). Addressing these issues—which are both complex and costly—requires informed decision-making. Economic valuation of lake ecosystem services can contribute to informed decision-making by estimating the benefits of lake restoration and identifying acceptable trade-offs amongst ecosystem services—especially when designed using economics, environmental science, and local knowledge. We present a case study of collaboration with a community using an economic tool known as a discrete choice experiment survey to assess community preferences and willingness to pay for restoring a Canadian lake facing worsening water quality. Results show economic benefits of restoration far outweigh the costs, as well as strong preferences for non-use ecosystem services like biodiversity, highlighting the collective value placed on lake health in this community and contributing to targeted management efforts. These results contribute to the growing literature showing substantial benefits to society from restoring lakes, and showcase the value of drawing on multiple ways of knowing to guide environmental decision-making.

How to cite: Spence, D., Baulch, H., and Lloyd-Smith, P.: Merging economics, environmental science, and local knowledge to inform lake decision-making , EGU General Assembly 2025, Vienna, Austria, 27 Apr–2 May 2025, EGU25-2061, https://doi.org/10.5194/egusphere-egu25-2061, 2025.

EGU25-3127 | Orals | ITS3.1/CL0.14

The Blame Game in Water Extractivism: Case studies from Chile 

Ricardo Ayala, Pedro Hervé-Fernández, and Majid Labbaf Khaneiki

How do key stakeholders shift blame for water crises, leaving local communities to shoulder the consequences? Using Chile as the backdrop, we debunk the layers of blame narratives in three case studies—avocado farming, forestry and rural gentrification. Through a sociohydrological lens, the study makes a case for rethinking how we manage water and hold stakeholders accountable. Water extractivism isn’t just about moving water from one place to another—it’s about who controls it, who benefits, who’s left behind and who is blamed for it all. Chile offers a prime example, where decades of neoliberal policy have prioritised corporate profits over people’s basic human rights. The paper aims to unpack the complex dynamics of water governance by looking at how social and political forces shape water injustice.

Blame as a Strategy

Powerful stakeholders often deflect responsibility. Some common tactics include discrediting critics (i.e., environmental activists are dismissed as obstacles to progress), twisting the narrative (i.e., painting a rosier picture of industrial practices) or pushing neoliberal ideals (i.e., communities are told to ‘reinvent themselves’). As a result, the root causes—flawed policies and overwhelming corporate power—are left unaddressed, while the blame is shifted onto affected communities for their hardships.

Three case studies

We explored three real-world examples from Chile. Each one provides insights into how water extractivism plays out and how blame gets passed around.

  • i) Avocado, or "Green Gold": Avocados are celebrated as a superfood, but in Chile, they’ve become a symbol of water injustice. In regions like Valparaiso, intensive avocado farming consumes staggering amounts of water, leaving little for local communities. With groundwater depletion, families struggle for drinking water while depending on avocado jobs. Meanwhile, industry leaders frame water scarcity as a "management issue," without addressing their disproportionate use.
  • ii) Forestry model: Chile’s forestry boom, fuelled by exotic species like eucalyptus and pine, was hailed as an economic success. But these fast-growing plantations have come at a cost, including ecological fallout (i.e., reduced stream flows, eroded soils and disappearing biodiversity), victims of extractivism being left out of the equation (i.e., small farmers and Indigenous forest-dependent communities) or deflection of responsibility (i.e., emphasising companies’ GDP contributions).
  • iii) Urban-Rural Migration: The rise of remote work and affordable housing in rural areas has led to a surge in rural gentrification. But this trend isn’t without consequences, as shown by the total collapse of water bodies such as Aculeo Lake, once a thriving reservoir. This results from a combination of unregulated housing, agricultural demands and poor planning. Responsibility, however, is concealed by using an ‘easy’ scapegoat (i.e., climate change), overshadowing policy failures.

Conclusion

We uncovered common strategies being used in public discourse to both avoid responsibility and project responsibility onto others – key to address for effective water governance. Such strategies gaslight the victims of extractivism, instilling the belief that they themselves are responsible for their water poverty. By exposing how blame is weaponised, the paper calls for accountability to support fairer governance.

How to cite: Ayala, R., Hervé-Fernández, P., and Labbaf Khaneiki, M.: The Blame Game in Water Extractivism: Case studies from Chile, EGU General Assembly 2025, Vienna, Austria, 27 Apr–2 May 2025, EGU25-3127, https://doi.org/10.5194/egusphere-egu25-3127, 2025.

EGU25-3497 | Posters on site | ITS3.1/CL0.14

Taking care of the Earth with an eco-centric approach based on minimal entropy production 

Jeannine de Caluwe, Guido J.M. Verstraeten, and Willem W. Verstraeten

Promoting biodiversity can be managed in two ways, i.e. by protecting species, and by improving the environment of the specific ecosystem, also called the boundary conditions for species. Species protection is an energetic approach for a sustainable transition of biotic energy in the food pyramid. The contribution of ecosystem protection to biodiversity is formulated in the energy-like niche approach of an ecological community of trophic similar species. Hubbel analysed in his monograph “The Unified Neutral Theory of Biodiversity and Biogeography” the dispersion approach based on the migration and off spring of species within a specific ecosystem inspired by Fisher (1943) and the Island Biography of MacArthur and Wilson (1967). This is the entropy-like approach because the mean result of the species distribution is formalized by a lognormal distribution which implies the statistical Shannon entropy with the standard deviation as substantial parameter.

Why should we, humans, protect biodiversity? Is it purely for aesthetic arguments since all species – just like humans – have a role in the food pyramid? Is it because any non-human biological life is entitled with intrinsic or inherent moral values as claimed by a specific eco-philosophy school called Deep Ecology? Perhaps, there are more scientifically based arguments for good sustainable maintenance of our Earth?

The entropic approach and enlarged biodiversity is supported by Penrose´s claim that biologic life is lowering the entropy production rate of Earth. Out of the thermodynamic equilibrium, the Earth’s Helmholtz Free Energy is balancing around a minimum value enabling to produce an environment (boundary condition) for biotic life. Its entropy must be at minimum value given a constant mean temperature. As a consequence, minimum entropy implies maximum order so that any ecosystem tends to maximum biodiversity given the local boundary conditions for life. Can the entropy argument be considered as a pure eco-centric inspired ecological care in contrast to the energy/food argument which is definitely based on Enlightened anthropocentrism? We will elaborate about this during the presentation. To conclude, the minimal entropy production of the Planet can be considered as the reference physical standard to aim at for taking care of ecosystems and biodiversity.

How to cite: de Caluwe, J., Verstraeten, G. J. M., and Verstraeten, W. W.: Taking care of the Earth with an eco-centric approach based on minimal entropy production, EGU General Assembly 2025, Vienna, Austria, 27 Apr–2 May 2025, EGU25-3497, https://doi.org/10.5194/egusphere-egu25-3497, 2025.

Whether or not we acknowledge the Anthropocene as a geological epoch (AWG 2024) – it is obvious that humanity has altered the Earth’s face and it is certain that our behaviour will worsen bioclimatic conditions and resources in the future. Thus, it is inherent that environmental issues are also societal and cultural issues. Industrial societies have not only caused damage to the environment but virtually colonised past and present – Nature, other cultures, even our own. Do we refrain from “colonising the future”, an assertion by the early German-Austrian futurologist Robert Jungk over 70 years ago (Jungk 1954)? Is the Australian philosopher Roman Krznaric right in claiming: “We treat the future like a distant colonial outpost devoid of people, where we can freely dump ecological degradation, technological risk and nuclear waste, and which we can plunder as we please” (Krznaric 2020)?  We are obsessed over instantaneous benefit what Krznaric labels the “tyranny of the now”, a kind of presentism that is one of the underlying characteristics of our behaviour. Well, we cannot undo what we did, but we might change – with one essential prerequisite: to overcome our fallacy to focus on (our) present.
As historians of Nature, geoscientists are sensitive to the long term. The controversial environmental issues of nuclear waste, special waste, carbon  storage (cf. Flüeler 2023) or “forever chemicals” are symptomatically longlasting. This contribution aims to explore how society and technology may find sustainable ways to cope with these issues in the long future. They not only need long-term safety demonstrations but also long-term institutional arrangements and engagement of scientists, engineers, waste producers, public administrators, NGOs and the public. This includes an adequate transfer of knowledge, concept and system understanding, experience and documentation to these audiences. Substantive and institutional approaches were investigated (Flüeler 2024) and are developed, such as criteria and means for individual “long-term” literacy and resilience, constitutions or declarations, legislations, governments, custodians like “guardians for future generations” or “councils for the future”, other collaborative approaches, knowledge bases or platforms and networks  – goal- and process-centred, from personal to social to political levels. The Copernican principle for space stating that humans are not privileged observers of the universe (Peacock 1999) must be enlarged to time, for environmental policy and governance are only sustainable if they are long-term.

____________________

AWG, Anthropocene Working Group 2024. https://quaternary.stratigraphy.org/working-groups/anthropocene.
Flüeler, T. 2023. Governance of Radioactive Waste, Special Waste and Carbon Storage. Literacy in Dealing with Long-
Term Controversial Sociotechnical Issues. Springer Nature Switzerland, Cham. https://doi.org/10.1007/978-3-031-
03902-7.

Flüeler, T. 2024. Decolonising the future – how come and how? Geosciences, waste and long-term issues. 22nd Swiss
Geoscience Meeting, Basel.

Jungk, R. 1954. Tomorrow Is Already here. Simon & Schuster, New York (orig. German: Die Zukunft hat schon begonnen.
Scherz, Bern, 1952).

Krznaric, R. 2020. The Good Ancestor. How to Think Long-term in a Short-term World. WH Allan, London.

Peacock, J.A. 1999. Cosmological Physics. Cambridge University Press, Cambridge.

How to cite: Flüeler, T.: How to abandon the ‘tyranny of the now’? Decolonising the future of the Anthropocene. Geosciences, waste and the long term, EGU General Assembly 2025, Vienna, Austria, 27 Apr–2 May 2025, EGU25-3562, https://doi.org/10.5194/egusphere-egu25-3562, 2025.

The concept of co-design is often cited in connection with the SDGs (Sustainable Development Goals). Still, collaboration across disciplines is uncommon, despite the urgency to address fundamental questions about how society can cope with and adapt to climate and environmental changes.

Social sciences encompass the study of human society and social relationships, including fields like economics, law, psychology, and politics. Thus, integrating social scientists into the research design of human-centred environmental studies is a logical consideration.

With the increased digitisation of society and research, new opportunities have emerged for more engaging collaboration among disciplines through data sharing, reuse, blending, and enrichment. There is, however, a prerequisite: the data must be trustworthy, well-curated, and interoperable.

CESSDA ERIC (https://www.cessda.eu/), the umbrella organisation of European Data Archives in the Social Sciences, has accumulated expertise in FAIR (Findable, Accessible, Interoperable, and Reusable) research data management, curation and long-term preservation over the past 50 years. CESSDA promotes the DDI (Data Documentation Initiative) standard (http://ddialliance.org/) and has recently adopted the DDI-CDI (Cross-Domain Integration), a standard for cross-disciplinarity work.

As a European Research Infrastructure Consortium (ERIC), CESSDA, along with 27 other pan-European research infrastructures, has gained visibility among European decision-makers as a strategic asset for European research. This collective presence provides a framework for collaborative development and knowledge sharing in community practices, tools, policies, and standards.

Collaboration between social science research and other disciplines is facilitated through five Science Clusters. In particular, SSHOC (the Social Science and Humanities Open Cloud - https://sshopencloud.eu/) and ENVRI (Environmental Research Infrastructures- https://envri.eu/) approaches can serve as a template for a) researchers to establish national or local modes of cooperation to pool resources or exchange knowledge; b) advancing standard agreements among research domains and beyond; c) supporting cross-disciplinarity initiatives such as OSCARS (https://oscars-project.eu/) or the WorldFAIR project (https://worldfair-project.eu/); and d) engaging with existing national or new data research infrastructures.

How to cite: Wolff-Boenisch, B.:  Social and Earth System Sciences – A Not-So Unlikely Pair in the Quest of Tackling Human-Centred Challenges , EGU General Assembly 2025, Vienna, Austria, 27 Apr–2 May 2025, EGU25-4397, https://doi.org/10.5194/egusphere-egu25-4397, 2025.

Tourism provides substantial socio-economic benefits, such as increased income, improved quality of life, and job opportunities for local residents, it also poses challenges to sustainable environmental management. Our research highlights the relationship between tourism development and its effects on river water quality at Vinh Loc District (Vietnam), a UNESCO site. Using surveys and interviews with local residents and visitors, the study assesses the current status of river water quality and identifies gaps in the existing tourism management strategies. Furthermore, the study critically examines the role of local government policies in balancing tourism growth and environmental sustainability, emphasizing the importance of effective water resource management. The findings of this study underline the need for improved policy frameworks and management practices to mitigate the adverse environmental impacts of tourism while promoting sustainable development. By addressing these challenges, the research aims to provide actionable recommendations to enhance river water quality and support sustainable tourism in Vinh Loc District (Vietnam). 

How to cite: Loan, V. T.: Impact assessment of tourism activities on water river quality: case study Vinh Loc district, Vietnam, EGU General Assembly 2025, Vienna, Austria, 27 Apr–2 May 2025, EGU25-4885, https://doi.org/10.5194/egusphere-egu25-4885, 2025.

EGU25-6369 | ECS | Posters on site | ITS3.1/CL0.14

The Impact of Urban Greenspace Changes Using a Systems Thinking Approach and Interactive Tools 

Maya Clinton, Felix Sinnott, Angel Harper, Branislav Kaleta, Stephen Campbell, Jolanta Burke, and Jimmy O' Keeffe

The VNiC-Health project, funded by Research Ireland, uses a systems thinking approach to model the impact of urban greenspace changes on ecosystem services and public health. By integrating environmental and health data, this project provides urban planners with a powerful tool to explore how different land-use changes—such as tree growth, mowing reductions, or other land-use alterations—affect key ecosystem services like carbon sequestration, air quality, and flood risk management.

Central to the tool is the use of the national land cover map, which enables precise modeling of greenspace types and land uses across urban areas. This map forms the basis for understanding how changes in land management practices can influence the surrounding environment and health outcomes. The model allows users to visualise and simulate various scenarios, such as the effects of increasing tree cover or reducing mowing, and observe their impacts on the environment and public health in real time.

The project’s technical backbone is a systems dynamics model developed in Vensim, which incorporates data from literature and real-world inputs. To make the tool user-friendly and accessible, an interactive front-end interface was created, enabling stakeholders—ranging from urban planners to community members—to input their own data and test potential solutions. The tool’s visualisation capabilities help to translate complex systems dynamics into actionable insights.

Through participatory mapping and collaboration with local stakeholders, including residents and healthcare professionals, the project ensures that the model’s design reflects real-world needs and is accessible to a wide range of users. Ultimately, this approach offers a new way for urban planners to incorporate environmental changes and health data into the decision-making process, helping to create healthier, more sustainable cities.

How to cite: Clinton, M., Sinnott, F., Harper, A., Kaleta, B., Campbell, S., Burke, J., and O' Keeffe, J.: The Impact of Urban Greenspace Changes Using a Systems Thinking Approach and Interactive Tools, EGU General Assembly 2025, Vienna, Austria, 27 Apr–2 May 2025, EGU25-6369, https://doi.org/10.5194/egusphere-egu25-6369, 2025.

Gross ecosystem product (GEP) assessment can convert physical quantities of nature’s contribution into monetary units, so that measure regulating nature's contribution to people (NCP) with a unified standard to support decision-making. The nature's contributions and people's needs are often spatial mismatch, while most of assessments lacked the integration of NCP and GEP in a spatial flow view, which is not conducive to the cross-regional policy making of "who benefits, who pays". Taking six typical cities of the Loess Plateau as a case, we valued the GEP of four material NCPs and three regulating NCPs from 2000 to 2020. We established spatial flow allocation methods for water supply, soil retention, sandstorm prevention to decompose the GEP contributions of the three regulating NCPs to the neighboring and downstream cities, so as to combine the nature's contributions located in the middle reaches and the neighboring and downstream people's needs in the form of monetary value. The results show that the GEP of the six cities in the Loess Plateau grew from 20.22 billion Yuan in 2000 to 36.98 billion Yuan in 2020, with the material NCP growing from 10.54 billion Yuan to 26.95 billion Yuan, and the regulating NCP growing from 9.67 billion Yuan to 10.03 billion Yuan. In the extraterritorial flow of regulating NCPs, GEP for water supply NCP and soil retention NCP flowed to downstream of the Yellow River, GEP for sandstorm prevention NCP flowed to neighboring cities to the east and south of the study area. The flow of NCPs exhibited spatial heterogeneity, with the city benefiting from the greatest variety of NCP types differing from the city benefiting from the highest flow value of NCPs. The assessment demonstrates the feasibility of integrating the NCP and GEP indicator systems to spatially guide cross-regional payment for ecosystem services policy.

How to cite: Wang, S. and Liu, Y.: A monetary valuation of the spatial flow of nature’s contributions to people in the middle reaches of the Yellow River, EGU General Assembly 2025, Vienna, Austria, 27 Apr–2 May 2025, EGU25-7967, https://doi.org/10.5194/egusphere-egu25-7967, 2025.

Understanding and enhancing the synergies between ecosystem services (ESs) and social governance are crucial for achieving sustainable social development. This study proposes a methodological framework to analyze the coupling coordination – representing the synergy – between the networks of water related ESs (flood regulation, water conservation, and soil retention) and their social governance. Shanxi Province, China served as the case study context. Results revealed that precipitation, landscape, and land use and land cover (LULC) were key drivers of spatiotemporal changes in water-related ESs within this semi-arid region. Spatially, flood regulation and soil retention services were generally higher in mountainous areas, while water conservation services predominated in the plains. Temporally, from 2010 to 2020, flood regulation and soil retention services showed notable increases, whereas water conservation services experienced a small decline. Trade-offs between the ESs were comprehensively driven by precipitation, landscape structure, and LULC dynamics. The Coupling coordination degree (CCD) between the networks of the water-related ESs and their social governance was found to be low, indicating significant spatial mismatches between social governance and the distribution of water-related ESs. Further results show that, the CCD exerted a measurable impact on the performance of these services. Specifically, flood regulation and soil retention services increased linearly with CCD, while water conservation services exhibited a U-shaped with CCD. This study proposed a novel social-ecological network approach to exploring the fostering synergies, this framework offers practical insights to promote win-win solutions for enhancing all water-related ESs in semi-arid regions.

How to cite: Lin, Y., Peng, J., Lin, Y., and Yu, S.: A social-ecological network approach to exploring synergies between water-related ecosystem services and social governance, EGU General Assembly 2025, Vienna, Austria, 27 Apr–2 May 2025, EGU25-7988, https://doi.org/10.5194/egusphere-egu25-7988, 2025.

Environmental concern plays a central role in researching possibilities for reducing environmentally critical behaviour and reducing the ecological footprint. It has been found that both individual and context factors are related to environmental concern. Significantly, personal and national wealth has been found to be related to environmental concern. On the individual level, environmental concern is also related to political attitudes, gender, age, education, and social trust. On the national level, environmental concern, in addition to economic wealth, is related to population density. Much attention has recently been given to extreme weather events and other natural disasters, realizing that some of them are occurring more often or have more severe consequences due to global climate change. The relationship of these disasters with public opinion about environmental issues is complex to analyze. One problem is that public attention is sometimes only of short duration. Another is that attention is dependent on media coverage. However, increasing the number and severity of environmental disasters may lead to increased general awareness about environmental problems, and thus, investigating this issue on a long-term scale is promising. With data from the International Social Survey Programme, a period from 1993 to 2020 with four waves can be investigated. It contains survey questions about environmental concern, behavioral intention, attitudes toward the economy, and demographic information about the respondents. In addition, the individual-level survey questions from ISSP 2020 can help investigate if disasters affecting the individual's neighbourhood have an influence on environmental concerns. On the national level, information from the World Bank about GDP, population density, urban population, and income inequality can be included. Also, on the national level, data from EM-DAT (www.emdat.be) is used to analyze the relationship between natural disasters (e.g., storms, floods, extreme weather events, etc) in a country and the level of environmental concern. EM-DAT gives information about the number and relevance of disasters across the world from 1900 to the present, covering disasters that have at least ten fatalities, a hundred affected people, a declaration of emergency, or a call for international assistance.

How to cite: Zenk-Möltgen, W.: Investigating how the occurrence and impacts of natural disasters are related to environmental concern, EGU General Assembly 2025, Vienna, Austria, 27 Apr–2 May 2025, EGU25-8443, https://doi.org/10.5194/egusphere-egu25-8443, 2025.

EGU25-9346 | Orals | ITS3.1/CL0.14

Valuing Natural Capital in Communities for Health  

Jimmy O'Keeffe, Felix Sinnott, Maya Clinton, Stephen Campbell, Branislav Kaleta, Angel Harper, and Jolanta Burke

Society and the natural environment are deeply interconnected. The decline in the quality and extent of our natural capital (NC) and the ecosystem services we depend on poses a significant challenge to our ability to withstand and adapt to shocks caused by climate change, population growth and environmental changes. Urbanisation has led to substantial environmental degradation, increasing flood risk, urban heat and air pollution while significantly impacting societal health and wellbeing. According to the WHO and the European Commission, there is an urgent need for innovative solutions including for multidisciplinary teams to collaboratively address the mental health and wellbeing crisis. This has also been highlighted as an essential step in addressing the environmental emergencies we face.

The VNiC-Health (Valuing Natural Capital in Communities for Health) project advances a novel, adaptable framework and systems modelling tool for evaluating urban natural capital by integrating health and wellbeing impacts with the natural environment. Developed using a stakeholder led participatory systems modelling approach, the framework uses physiological, psychological, and environmental data to quantify the links between NC quality, human health, and wellbeing. Pilot studies in Dublin's Ballymun community demonstrated that high-quality NC significantly improves emotional, psychological, and physiological health, whereas low-quality spaces negatively affect wellbeing. These findings underscore the importance of integrating high quality natural capital into urban planning and healthcare strategies.

How to cite: O'Keeffe, J., Sinnott, F., Clinton, M., Campbell, S., Kaleta, B., Harper, A., and Burke, J.: Valuing Natural Capital in Communities for Health , EGU General Assembly 2025, Vienna, Austria, 27 Apr–2 May 2025, EGU25-9346, https://doi.org/10.5194/egusphere-egu25-9346, 2025.

EGU25-9354 | ECS | Posters on site | ITS3.1/CL0.14

Integrating Natural Capital into Urban Policy: A Systems Approach to Addressing Global Climate and Biodiversity Challenges 

Felix Sinnott, Jimmy O'Keeffe, Maya Clinton, Jolanta Burke, Stephen Campbell, Branislav Kaleta, and Angel Harper

The twin crises of climate change and biodiversity loss represent intricate, multifaceted global challenges. Addressing these issues effectively necessitates interdisciplinary collaboration and cross-sectoral coordination. However, entrenched knowledge silos and fragmented policy frameworks often hinder the implementation of cohesive strategies. Considering the benefits provided by Natural Capital (NC) within decision-making provides an approach to quantify the value of ecosystem services and their contributions to human well-being, environmental health, and economic stability. Despite its potential, urban design and management frequently lack robust methodologies to assess these benefits.

This research introduces the VNiC-Health framework, a system dynamics model designed to embed Natural Capital within urban planning and policy. The model evaluates the contributions of blue-green spaces (BGS) to ecosystem services and human well-being through a novel metric informed by positive health psychology and biosensor data. Using an Irish urban case study, the model simulates alternative management scenarios to explore their long-term impacts, providing a roadmap to support strategic investment in BGS to mitigate urban challenges, reduce greenhouse gas emissions, and improve public health outcomes, directly supporting global targets such as the EU Biodiversity Strategy, the UN’s Sustainable Development Goals, and the One Health approach.

This study highlights the critical need for integrated tools and approaches that transcend policy silos to address interconnected environmental and societal issues. By framing Natural Capital as a cornerstone of urban sustainability, the VNiC-Health model showcases its potential to advance holistic solutions that align with international climate and biodiversity objectives. It underscores the necessity of embracing innovative, evidence-based tools to drive global progress toward resilience and sustainability.

How to cite: Sinnott, F., O'Keeffe, J., Clinton, M., Burke, J., Campbell, S., Kaleta, B., and Harper, A.: Integrating Natural Capital into Urban Policy: A Systems Approach to Addressing Global Climate and Biodiversity Challenges, EGU General Assembly 2025, Vienna, Austria, 27 Apr–2 May 2025, EGU25-9354, https://doi.org/10.5194/egusphere-egu25-9354, 2025.

Groundwater is a critical resource. Globally, 42% of irrigation, 36% of domestic, and 27% of industrial water needs are met by groundwater. However, over-extraction and unregulated use by anthropogenic activities and climate change have resulted in resource depletion, impacting 60% of livelihoods, 48% of food security, and 70% of environmental sustainability. According to GSDA, 2022, in semi-arid regions like Parbhani district, Maharashtra, India, groundwater scarcity is exacerbated by unplanned drilling and declining aquifer levels. The district's reliance on Deccan traps basaltic formations, a depth to the water level of more than 20 mbgl and an average rainfall of 656 mm reflect the gap and potential for effective groundwater recharge. Beyond resource management, this research addresses gender disparities tied to groundwater scarcity. In Parbhani, due to the migration of men in search of better livelihood opportunities, there is a 36 % increase in the feminization of agriculture which has placed women at the center of irrigation and agricultural activities, and groundwater depletion has heightened their drudgery. Women spend over two to four hours daily fetching water, limiting education, health, and economic empowerment opportunities. By improving groundwater availability, this study aims to alleviate women’s labor burdens, enhance their livelihoods, and promote gender equity.
This study integrated hydrogeological, geospatial, and multi-criteria decision analysis (MCDA) techniques to map groundwater recharge potential zones. Thematic layers such as geomorphology, geology, land use/land cover, drainage density, lineament density, soil, and slope were analyzed using a weighted overlay technique through social experts based on an Analytical Hierarchy Process (AHP) is further overlayed with an irrigation map of the district. The results identified high, moderate, and low recharge potential zones. The study has shown that slope (26.5%), geology (24.3%), and lineament density (15.5%) contributed the most significant weightage in determining recharge suitability. High recharge potential zones were primarily located in flatter terrains with favorable geomorphological and geological conditions, while low potential zones were associated with steeper slopes and poor lineament density. Based on the results, periodic derivation of existing water bodies and the promotion of efficient cropping patterns are recommended. The construction of water recharge structures through a public participatory approach and MGNREGA schemes including check dams, percolation tanks, and farm ponds are recommended to enhance water availability, livelihood, and gender equity for sustainable water resource management. This approach also demonstrates a replicable framework for addressing groundwater depletion challenges in similar semi-arid regions.

Keywords: Groundwater recharge zones, Public Participatory approach, livelihood, women
empowerment

How to cite: Yadav, M. and Chinnasamy, P.: Groundwater Recharge Management for Livelihood Enhancement andGender Equity in Semi-Arid Regions: A Hydrogeological and ParticipatoryApproach, EGU General Assembly 2025, Vienna, Austria, 27 Apr–2 May 2025, EGU25-9537, https://doi.org/10.5194/egusphere-egu25-9537, 2025.

EGU25-11950 | Posters on site | ITS3.1/CL0.14

A Climate and Social-Ecological Analysis of Locust Infestation Since the Mid-17th Century in the Chinese Dynasty 

Zheng-Hao Wang, Kuan-Hui Elaine Lin, Wan-Ling Tseng, Cheng-Wei Lin, Hsin-Cheng Huang, and Pao K Wang

Since ancient time, locusts have been regarded as a devastating pest, posing serious threats to human societies and agricultural production. Numerous studies have shown that the drivers of locust infestation are closely related to climate and environmental conditions, but the mechanism has been under studied. The Chinese dynasties possess a rich and extensive quantity of historical documents, ranging from official historical books to local chronicles, particularly during the Qing Dynasty (1644-1911). These documents provide detailed accounts of various natural disasters, including locust infestations and their impacts on agrarian societies, as well as the social phenomena triggered by these events. The purpose of this study is to investigate the drivers of locust infestations by integrating perspectives from both climate and social systems, and to analyze the contributing factors and interactions influencing these infestations.

We collected locust data and climate indices from the REACHES database in the Qing dynasty (Wang et al., 2018), along with relevant social data such as population, governmental efficacy, crop harvest and conflict from the SIER (Societal Impact Events Records) database (White et al., 2024). To capture both frequency and severity of locust infestations, we constructed a locust infestation index and conducted sensitivity tests to ensure the stability of this index. Then we converted all data into 1° X 1° latitude/longitude resolution for conducting regression and correlation analyses, to identify the determinant factors in each cell and to categorize the spatial features. We aim to clarify the associations between locust infestations and their climatic and societal driving factors from the long-term data in the historical perspective.

How to cite: Wang, Z.-H., Lin, K.-H. E., Tseng, W.-L., Lin, C.-W., Huang, H.-C., and Wang, P. K.: A Climate and Social-Ecological Analysis of Locust Infestation Since the Mid-17th Century in the Chinese Dynasty, EGU General Assembly 2025, Vienna, Austria, 27 Apr–2 May 2025, EGU25-11950, https://doi.org/10.5194/egusphere-egu25-11950, 2025.

EGU25-12223 | Orals | ITS3.1/CL0.14

The societal consequences of “little” floods everywhere 

David Stainforth and Raphael Calel

If there is to be sustained, large-scale action to tackle climate change, there will have to be sustained, long-term, buy-in for that action from populations and electorates. This requires the link to be clearly made between global change (e.g. the target to limit global warming to less than 2oC above pre-industrial levels) and local impacts as they may be felt by individuals. In the media this link is often made via the consequences of extreme events such as floods, wildfires, and droughts; stark images of such events in the media are a significant part of the public narrative around climate change. Nevertheless, devastating though such events may be, it is easy, and perhaps reasonable, to believe that you as an individual might not be affected; you might well not get hit by a flood or a wildfire; you might “get lucky”. With many other political and social issues facing electorates it is perhaps not surprising therefore that action on climate is rarely voters’ top priority1.

However, this framing of the threats of climate change in terms of the risks of direct impacts, misses the essence of the relationship between physical climate change and society. In a recent paper2, Calel and Stainforth argue that changing physical risk profiles are likely to strain the underlying fabric of our societies in many ways. For instance, whether or not you are directly affected by climate extremes or other climate change impacts, the consequences of such events represent a drain on our economies which will necessarily lead to higher taxes and/or the reduction of funds for other priorities such as education, health care, infrastructure etc. The consequences will thus be felt across our societies, even by those not hit by floods or wildfires.

Calel and Stainforth call for more effort to be invested in bringing together expertise across the social and physical sciences to paint better pictures of the complex consequences of changing disaster risks for the whole of society. This in turn would enable more broadly relevant representations of climate change in the media and in public and political discourse. Given the complexity of the system and the deep uncertainties inherent in climate predictions3, storyline approaches4 will be a key tool for these trans-disciplinary approaches and for subsequent communication and engagement with decision makers.

These arguments will be presented and elaborated upon in this presentation.


References:

1 See, for instance, https://yougov.co.uk/topics/society/trackers/the-most-important-issues-facing-the-country for a survey of the most important issues facing the UK.

2 Calel, R., Stainforth, D.A. Little floods everywhere: what will climate change mean for you?. Climatic Change 178, 1 (2025). https://doi.org/10.1007/s10584-024-03819-x

3 Stainforth, D., “Predicting Our Climate Future: What we know, what we don’t know and what we can’t know”, Oxford University Press, 2023.

4 Shepherd, T.G., Boyd, E., Calel, R.A. et al. Storylines: an alternative approach to representing uncertainty in physical aspects of climate change. Climatic Change 151, 555–571 (2018). https://doi.org/10.1007/s10584-018-2317-9

How to cite: Stainforth, D. and Calel, R.: The societal consequences of “little” floods everywhere, EGU General Assembly 2025, Vienna, Austria, 27 Apr–2 May 2025, EGU25-12223, https://doi.org/10.5194/egusphere-egu25-12223, 2025.

EGU25-12693 | ECS | Posters on site | ITS3.1/CL0.14

Social Networks of Institutions and Legal Processes: Case of Hydropower, Fish and Water Permits 

Thomas Banafa and Marko Keskinen

Hydropower dams obstruct fish migration and typically require regulatory measures to mitigate or compensate for the losses in fish stock. These can be in the form of monetary payments or structural measure like fish passages. In Finland, these measures are provisioned in water permits which historically have been de-facto permanent as no practical legal instruments have existed to alter or review the permits. Changes in national legislation, however, have allowed the permit-issuing authority to review and alter the measures upon application. Altering the measures presents a conflict between two vital interests: the restoration of river courses and fish populations, and power production and energy security.
We explore this conflict by using a social network model to analyse the institutional setting of three regulatory processes aiming to alter water permits and the compensatory measures provisioned therein. This is approached through two research questions: what the legal framework is, and how is it utilized by relevant stakeholders. Our case is three major hydropower plants in Finland where the permit authority has reviewed the permits following legal argumentation from proponents of opposing interests. We first analyse and code the relevant legislation using Institutional Grammar (IG) Framework, which systematically represents and examines institutional and governance rules. Second, we transform the coded syntactic IG components into a social network consisting of nodes, edges, flows, and protocols. Finally, we use natural language processing (NLP) to parse the permit application documents, revealing how stakeholders —such as permit holders (power companies), fisheries authorities, and municipalities— utilize the network through legal argumentation.
The study increases the understanding of the ways the actors operating in the same governance context —in this case hydropower and its fisheries impacts— utilise the legal framework to promote their differing interests. Methodologically the study contributes to the fields of Social Network Analysis (SNA) and Policy Analysis in several ways. First, it allows for the systematic analysis of extensive policy and legal documents with the help of NLP, thus significantly reducing manual labor. Second, its network conceptualization includes protocols and flows, which are often overlooked in SNA studies. Finally, it further bridges IG with SNA by linking more syntactic components of IG with network theory allowing analysis of both the existing institutional setting and its operationalization. The method demonstrates how computational methods can be used to analyse the dynamics of environmental conflict through social and legal perspective.

How to cite: Banafa, T. and Keskinen, M.: Social Networks of Institutions and Legal Processes: Case of Hydropower, Fish and Water Permits, EGU General Assembly 2025, Vienna, Austria, 27 Apr–2 May 2025, EGU25-12693, https://doi.org/10.5194/egusphere-egu25-12693, 2025.

EGU25-12759 | ECS | Orals | ITS3.1/CL0.14

Examining Race and Class Disparities in Urban Heat: Towards Environmental Justice in Urban Planning 

Jayati Chawla, Vandana Varma, and Susanne Benz

Climate change and urbanization contribute to uneven distributions of heat exposure that disproportionately affect disadvantaged communities resulting in environmental (in)justice. While studies in the USA highlight the elevated heat exposure faced by low-income and ethnic minority groups, similar insights are lacking for other countries. This knowledge gap impedes a comprehensive understanding of environmental (in)justice experienced by various socio-economic and ethnic groups and hampers the identification of inadequacy in urban planning policies.

This research seeks to bridge the gap between social and environmental sciences to address environmental (in)justice by establishing a link between extreme heat (at both regional and country level) and socio-economic disparities within individual municipalities or counties. So far our analysis covers Australia, New Zealand, Canada, Germany and the U.K. Using remotely sensed satellite data for Land Surface temperature mapping for summer and Census data of countries, the analysis explores various socio-economic indicators—such as education levels, age demographics, and the proportion of foreign populations.

By recognizing the unequal distribution of urban heat and its disproportionate impact on vulnerable communities, there emerges a critical mandate to prioritize equitable urban planning policies. This research underscores the urgency for policymakers and urban planners to prioritize environmental justice interventions and integrate strategies that aim to reduce race and class disparities concerning urban heat. The research also serves as a model for similar analyses globally fostering inclusive, equitable and resilient urban landscapes.

How to cite: Chawla, J., Varma, V., and Benz, S.: Examining Race and Class Disparities in Urban Heat: Towards Environmental Justice in Urban Planning, EGU General Assembly 2025, Vienna, Austria, 27 Apr–2 May 2025, EGU25-12759, https://doi.org/10.5194/egusphere-egu25-12759, 2025.

EGU25-13162 | Posters on site | ITS3.1/CL0.14

After the Peace Agreement: a review of the interplay of conflict, socio-economic factors and deforestation in Colombia 

Estefanía Muñoz, Santiago Botía, Alejandro Salazar, Jesús A. Anaya, Nicola Clerici, Lina M. Estupinan-Suarez, Isabel Lopera, Solveig Richter, Carlos A. Sierra, and Andrés Tangarife-Escobar

Colombia's forests, covering over half the country's land, are crucial ecosystems facing significant threats from multiple drivers, including infrastructure expansion, agricultural development, and illegal activities. This complex deforestation issue is deeply intertwined with Colombia's socio-political landscape, particularly influenced by its history of armed conflict and the recent peace agreement with FARC guerrillas in 2016. The complexity of the interconnected drivers makes developing effective forest protection strategies challenging, highlighting the intricate relationship between Colombia's political history, economic development, and environmental conservation. In this study, we conducted a systematic literature review examining the complex interplay between forest degradation, socio-political dynamics, and economic development in Colombia before and after the peace agreement. The review incorporated perspectives from environmental and social study disciplines, inspecting top-down and bottom-up scaling approaches to analyze the multifaceted scenarios that emerged during this period.

Our literature review on armed conflict and deforestation in Colombia reveals a growing interest from environmental and social sciences in understanding the impacts that the Colombian civil conflict and the 2016 peace agreement have had on the environment. Since the peace agreement, there has been a notable rise in research on this topic. We found that in environmental sciences, top-down analyses are more frequently employed, while in social sciences bottom-up methods are preferred. Interestingly, the number of interdisciplinary studies combining both methods is increasing. Multiple methodologies confirm that deforestation increased after the peace agreement, especially in the Andes and Amazon regions, but also in the Chocó and Llanos biogeographical regions. The power vacuum left by the guerrilla, not filled by governmental institutions, is widely acknowledged as a key source of important drivers of uncontrolled forest loss, such as land grabbing and illegal cattle ranching. External factors such as international demand for gold and illegal drugs continue to fuel deforestation and social conflict, with international aid programs to local farmers often proving ineffective. Although Colombia's situation may appear unique, the complex interplay of social, economic, political, and environmental factors offers valuable insights for understanding similar global dynamics in other conflict-prone regions.

How to cite: Muñoz, E., Botía, S., Salazar, A., Anaya, J. A., Clerici, N., Estupinan-Suarez, L. M., Lopera, I., Richter, S., Sierra, C. A., and Tangarife-Escobar, A.: After the Peace Agreement: a review of the interplay of conflict, socio-economic factors and deforestation in Colombia, EGU General Assembly 2025, Vienna, Austria, 27 Apr–2 May 2025, EGU25-13162, https://doi.org/10.5194/egusphere-egu25-13162, 2025.

Natural gas (NG) infrastructure spans across the United States and its communities. An expansive system of transmission pipelines (midstream level infrastructure) connects development and extraction sites (upstream level infrastructure) with local distribution systems (downstream level infrastructure). NG releases occur across the upstream, midstream, and downstream levels of the supply chain as a combination of operational and fugitive emissions or leaks (i.e. intentional and unintentional releases, respectively). Given its Methane (CH4) composition, NG release across the supply chain poses a significant climate concern. This has prompted increasingly robust characterizations of intentional and unintentional releases across the NG supply chain. Meanwhile, there exists a growing appreciation for the localized environmental burdens associated with the location and management of NG infrastructure, and the ways in which these burdens are inequitably distributed across communities in the US.

Many states in the U.S. are beginning to impose data collection and reporting mandates on their NG companies, leaving research groups with rich data sets that can be used for Environmental Justice analyses to further characterize equity concerns as they exist across the U.S. NG system. Here, we present the results of our Environmental Justice focused analyses of leak report data provided to us by four local distribution companies. We discuss concerning patterns found in the data set, and we contextualize our approach and findings within a larger data driven framework that aims to create relationships that sustain data collection and reporting, and that centers the role of communities and environmental advocacy groups in the process of data collection and communication of results. In doing so, we hope to demonstrate an example of how a quantitative approach may be informed by and used to address issues of Social and Environmental Justice.

How to cite: Taylor, A. and von Fischer, J.: A quantitative approach towards recognizing and addressing Environmental Justice concerns in the U.S. Natural Gas System: Applied to data from local distribution companies, EGU General Assembly 2025, Vienna, Austria, 27 Apr–2 May 2025, EGU25-13691, https://doi.org/10.5194/egusphere-egu25-13691, 2025.

The Agricultural Production Potential in China and the basic geographical endowment patterns revealed by geographical boundaries such as the Hu Huanyong Line (Population boundary line in China), the Great Wall(Boundary line of agricultural and pastoral areas in China), and the Qinling-Huaihe line(North-South boundary line in China, and their relationship with food production and population distribution are worthy of exploration. Research findings indicate that there is a significant geographical differentiation in the agricultural production potential of China, with a general trend of higher potential in the southeast and lower potential in the northwest. The Heihe-Tengchong Line and Qinling-Huaihe Line serve as a dividing line for agricultural production potential in China, with a decreasing trend on the eastern side and a significant increasing trend on the western side. Specifically, the eastern region is characterized by "warming and drying" conditions, whereas the western region is marked by "warming and wetting," resulting in distinct differences in agricultural productivity between the two regions. from 1960s to 2010s, the proportion of total grain output, cultivated land area, and grain yield per hectare in the western region of the Hu Huanyong Line exhibited a significant upward trend nationwide. Simultaneously, the share of the total population in the eastern region decreased year by year, with rural population experiencing a rise followed by a decline. In contrast, the proportion of the population, particularly the rural population, in the western region steadily increased. These regional differences can be attributed to the combined effects of climate change, agricultural production potential. This study systematically analyzes the changes in agricultural production potential in eastern and western China and their relationship with grain output and population dynamics. It provides new insights into understanding regional agricultural development disparities and offers theoretical guidance for future agricultural policies and coordinated regional development.

How to cite: Xia, H. and Yin, J.: The Potential of Agricultural Production in China and Relationship with the Spatiotemporal Changes in Grain Production and Population, EGU General Assembly 2025, Vienna, Austria, 27 Apr–2 May 2025, EGU25-15210, https://doi.org/10.5194/egusphere-egu25-15210, 2025.

Just Transition, as a critical concept balancing environmental sustainability and social equity, emphasizes achieving recognitional justice, procedural justice, and distributional justice during the low-carbon transition process. However, existing policies and research often overly focus on distributional justice, neglecting the identification of vulnerable groups and the assessment of their potential impacts. This study shifts the focus to recognitional justice, particularly on identifying potentially affected vulnerable groups and highlighting the impacts they may face, aiming to establish inclusive and equitable transition strategies.

This research integrates Life Cycle Assessment (LCA) to examine greenhouse gas emission hotspots across the entire life cycle of crops, aiming to evaluate the challenges and impacts faced by stakeholders in the supply chain under net zero transition pathways. Based on a preliminary literature review, the study identifies the field sowing stage as the major greenhouse gas emission hotspot in the life cycle of crops. To address this issue, the research incorporates a review of Climate-Smart Agriculture (CSA) practices and employs quantitative methods to evaluate the environmental and social impacts of adopting CSA on stakeholders. Using the rice supply chain as a case study, the research not only identifies the environmental benefits of low GHG agricultural practices but also explores the distribution of impacts among vulnerable groups and their adaptive strategies.

This study contributes by establishing a framework integrating Just Transition with Life Cycle Assessment, providing theoretical support and empirical insights for policy design and practical operations in agricultural sustainability transitions.

How to cite: Lee, M. and Tung, C.: Establishing and Applying a Framework for Agricultural Just Transition: A Case Study of the Rice Production, EGU General Assembly 2025, Vienna, Austria, 27 Apr–2 May 2025, EGU25-15468, https://doi.org/10.5194/egusphere-egu25-15468, 2025.

EGU25-15944 | ECS | Posters on site | ITS3.1/CL0.14

Attitudes towards urban lawns and meadows and short-term environmental effects of transforming lawns into meadows in Helsinki metropolitan area 

Beñat Olascoaga, Anna Oldén, Kristiina Karhu, Anne Duplouy, Panu Halme, Annukka Vainio, and Susan Clayton

Urbanisation and biodiversity loss in urban sprawling areas diminish human-nature interactions, which could hinder nature conservation initiatives (Soga & Gaston, 2026). To evaluate whether a more biodiverse urban greenspace promotes human-nature interactions, we developed a survey to explore attitudes towards urban lawns and meadows among residents of the Helsinki metropolitan area.


About 70% of survey respondents were willing to participate in transforming a lawn into a meadow. Consequently, six lawns were transformed into meadows via voluntary participation (Trémeau et al. 2024). Biodiversity parameters, greenhouse gas dynamics and soil physicochemical properties between control lawns and transformed meadows were compared over three consecutive years, starting the year prior to the transformation. Since transformations, vegetation richness and diversity increased over time in transformed meadows, unlike in lawns, yet evenness decreased. Transformed meadows provided resources for 35 species of bees. Neither total ecosystem respiration rates nor nitrous oxide and methane fluxes differed between the two greenspace types. Similarly, none of the soil physicochemical properties differed between meadow and lawn soils. Neither meadow soil microbial communities nor bacterial or fungal biomasses significantly differed from those found in lawn soils, suggesting that any possible change in soil aspects takes a longer time to respond to changes in aboveground plant communities and management.


In parallel, we measured respondents’ environmental identity (EID), environmental concern (EC) and experiences of nature (EoN). We developed a pool of 26 EoN items and scaled them within six dimensions: observing/interacting, consumptive/appreciative, self-directed/other-directed, separate/integrated, solitary/shared and positive/negative (Clayton et al. 2017). We analysed EoN dimensionality via structural equation modelling and determined the best model to contain all except a consumptive/appreciative dimension. There were significant correlations between EoN and respondents’ EID and EC, yet correlations suggest EoN is a distinct construct from EID and EC.


This study combines social and environmental sciences to explore nature experiences and attitudes, illustrating a case of the potential that easy citizen-based transformations have on enhancing urban biodiversity and human-nature interactions.


References

Clayton et al. 2017. Transformation of experience: toward a new relationship with nature. Consev Lett 10(5): 645–651.

Soga & Gaston. 2016. Extinction of experience: the loss of human–nature interactions. Front Ecol Environ 14(2): 94–101.

Trémeau et al. 2024. Lawns and meadows in urban green space – a comparison from perspectives of greenhouse gases, drought resilience and plant functional types. Biogeosciences 21: 949–972.

How to cite: Olascoaga, B., Oldén, A., Karhu, K., Duplouy, A., Halme, P., Vainio, A., and Clayton, S.: Attitudes towards urban lawns and meadows and short-term environmental effects of transforming lawns into meadows in Helsinki metropolitan area, EGU General Assembly 2025, Vienna, Austria, 27 Apr–2 May 2025, EGU25-15944, https://doi.org/10.5194/egusphere-egu25-15944, 2025.

EGU25-16955 | ECS | Orals | ITS3.1/CL0.14

Hamburg Climate Futures Outlook 2024. Conditions for Sustainable Climate Change Adaptation 

Anna Pagnone, Anita Engels, Jochem Marotzke, Beate Ratter, Eduardo Gonçalves Gresse, Andrés Lopéz-Rivera, and Jan Wilkens

This contribution presents the findings of the Hamburg Climate Futures Outlook 2024, an extensive interdisciplinary assessment of the plausiblity of sustainable climate change adaptation. In light of insufficient social momentum toward decarbonization and the physical realities of regional climate variability and extreme events, adaptation is increasingly crucial. However, it is important to recognize that not all adaptation measures are inherently sustainable; some may inadvertently heighten vulnerabilities, particularly in the long term.

Our assessment links the plausibility of deep decarbonization to ten social drivers identified within the realms of politics, law, economics, and culture. We evaluate the global dynamics of these drivers to determine how they support or impede a low-carbon transition aimed at achieving net-zero greenhouse gas emissions by 2050. This investigation underscores the complex interplay between social dynamics and physical processes in shaping conditions conducive to sustainable climate change adaptation.

The analysis of physical processes explores the interactions between regional variability and extreme climatic events, providing a scientific foundation for understanding the differing regional and local demands for adaptation to anticipated climate scenarios. Our findings stress the necessity of explicitly accounting for internal variability to improve predictions related to extreme events. The quality of such predictions is influenced by the inherent uncertainties and limitations of climate models. Addressing these uncertainties is vital for communities as they navigate the challenges of climate change adaptation.

To further investigate the contextual conditions that influence sustainable adaptation, we conducted nine case studies in urban, rural, and coastal settings across diverse regional contexts. These case studies—focused on Hamburg, São Paulo, Ho Chi Minh City, Lower Saxony (Germany), Kunene (Namibia), the Nepal Highlands, the German North Sea coast, Taiwan, and the Maldives—examine barriers to sustainable climate change adaptation, seeking localized responses to the question: “Under what conditions is sustainable climate change adaptation plausible?”

The assessments reveal that climate change adaptation is fundamentally a localized and socially embedded process, shaped by politico-administrative dynamics and socio-cultural dimensions such as social inequality, gender issues, and varying epistemologies. Our comprehensive analysis of the case studies offers insights into diverse adaptation strategies, categorized as coping, incremental, and transformative responses. A significant finding is the predominance of coping and incremental adaptations, underscoring the influence of governance, technical path dependencies, and potential lock-ins, which pose the risk of maladaptation in evolving physical conditions.

The implications of this analysis highlight the critical need to bridge implementation gaps through climate action strategies that incorporate legally binding, accountable objectives. Furthermore, the promotion of participatory governance and the integration of diverse ways of knowing and addressing natural contingencies and hazards into climate action are essential for fostering effective adaptation.

Engels, Anita, Marotzke, Jochem, Ratter, Beate, Gonçalves Gresse, Eduardo, López-Rivera, Andrés, Pagnone, Anna and Wilkens, Jan. Hamburg Climate Futures Outlook 2024: Conditions for Sustainable Climate Change Adaptation, Bielefeld: transcript Verlag, 2024. https://doi.org/10.1515/9783839470817

How to cite: Pagnone, A., Engels, A., Marotzke, J., Ratter, B., Gonçalves Gresse, E., Lopéz-Rivera, A., and Wilkens, J.: Hamburg Climate Futures Outlook 2024. Conditions for Sustainable Climate Change Adaptation, EGU General Assembly 2025, Vienna, Austria, 27 Apr–2 May 2025, EGU25-16955, https://doi.org/10.5194/egusphere-egu25-16955, 2025.

Climate services seek to provide information that enables climate-informed decision making by non-climate scientists. Often, especially where climate services are co-produced, boundary agents (typically social scientists) act between these groups to facilitate the seamless flow of knowledge in both directions and create climate services that are scientifically accurate and apt for building climate resilience. Or at least that is the idealised aspiration. 

In practice, developing climate services that are both useful and used involves contending with a wide range of factors beyond the project boundaries, ranging from the current limitations of climate science to societal power (im)balances and to the fitness of purpose of any service to a decision context. Different actors involved in developing and using climate services view them in different ways and hold different preferences on what constitutes a successful climate service. Thus, creating criteria to evaluate a climate service has an inherent subjectivity and designing a holistic evaluation framework requires drawing out these perspectives and preferences from decision-makers, climate scientists and boundary agents, and then bringing them together. 

Impetus4Change (I4C, https://impetus4change.eu/) is a Horizon Europe project joining 18 institutions from 8 countries that aims to improve the quality and usability of near-term climate information in cities and regions. Throughout the entirety of the project we are simultaneously co-producing climate services in four Demonstrator cities: Barcelona, Bergen, Paris, and Prague. This involves three stages: co-exploring the problems, solutions and realities that decision makers face; co-designing mock-ups of climate services and then co-developing these through Adaptalabs (highly interactive, transdisciplinary hackathons). The entire process is co-evaluated to capture lessons learned and combine these with detailed analysis of climate adaptation knowledge networks to explore the services’ replicability.

This presentation will cover the steps taken to generate tailored frameworks for evaluating urban climate services, including the generation of ideas from 60 participants of the first Adaptalab, the synthesis of pillars of the framework, and the tailoring of these pillars to each of the four Demonstrator cities. Using the Barcelona case study as an example, we show that actor perspectives on what is important vary not just in terms of what to assess, but also when. We conclude with examples of how we might evaluate different aspects of the co-production process, its outputs and its outcomes and our experiences operationalising the framework.

How to cite: Pickard, S., Bojovic, D., Baulenas, E., and Saklani, S.: Co-evaluating urban climate services: perspectives from climate scientists, decision makers and boundary agents on what makes “good” services, EGU General Assembly 2025, Vienna, Austria, 27 Apr–2 May 2025, EGU25-18189, https://doi.org/10.5194/egusphere-egu25-18189, 2025.

EGU25-18308 | Orals | ITS3.1/CL0.14

Digital twin politics: Unlocking the full potential of digital twins for sustainable ocean futures  

Alice Vadrot, Carolin Hirt, Felix Nütz, Emil Wieringa Hildebrand, and Wenwen Lyu

Environmental challenges demand not only technological innovation but also critical interdisciplinary approaches that bridge the gap between science, society, and policy. The concept of Digital Twins of the Ocean (DTOs) exemplifies this intersection and offers a promising approach to monitoring progress in achieving environmental targets including in the areas of marine biodiversity, deep-seabed mining, fishing, shipping and plastic pollution.  

Despite a rapidly expanding range of potential DTO applications, research into their social and political dimensions remains underdeveloped. This gap is particularly concerning, as we argue that DTOs are inherently contested, ambiguous and political: Firstly, DTOs can risk exacerbating global inequalities, given the unequal capacities to develop, access, and utilize ocean data, information, and DTO models and technologies. Secondly, they introduce a range of legal and political challenges, including uncertainties around data access, ownership, security, and sharing. Thirdly, to ensure ethical use of DTOs, they require a robust framework of norms, rules, and values. All these aspects, we argue, remain neglected amid the current “twin rush.” 

To address these aspects and the overall lack of empirical social science research on the development and use of digital twins, the ERC project TwinPolitics (grant agreement No 101124903 – TwinPolitics – ERC-2024-STG) at the University of Vienna re-conceptualizes DTOs as a socio-technical relation shaped by specific institutional, political, and economic conditions within a hybrid environment of research, data, and observation. TwinPolitics seeks to unpack the emergence of so-called “digital twin politics” in international environmental governance by tackling key questions: How and why are DTOs developed by governments and utilized in marine scientific research? How are they designed to inform decision-making? To what extent are they, or could they be, integrated into multilateral governance? 

By exploring how social science perspectives can deepen our understanding of DTOs, this presentation is particularly fitting for this session as it highlights the essential interplay between environmental and social sciences in addressing global sustainability challenges. 

How to cite: Vadrot, A., Hirt, C., Nütz, F., Wieringa Hildebrand, E., and Lyu, W.: Digital twin politics: Unlocking the full potential of digital twins for sustainable ocean futures , EGU General Assembly 2025, Vienna, Austria, 27 Apr–2 May 2025, EGU25-18308, https://doi.org/10.5194/egusphere-egu25-18308, 2025.

EGU25-19257 | Orals | ITS3.1/CL0.14

Helicopter Research in the Geosciences 

Marco Van De Wiel

Helicopter research, also called parachute research or neo-colonial research, occurs when research in a country –typically a low or medium income country– is conducted by researchers from outside that country, with no or little involvement of local researchers. The target country thus serves as a location worthy of research, but only to the extent that data, samples or measurements can be obtained there by the foreign researchers. All other aspects of the research process –problem formulation, research design, data analysis, publishing of results– occur abroad.

Helicopter research is problematic because researchers in the target country do not benefit from the research conducted within their country. Instead, the benefits of the research (prestige, career progression, future funding opportunities) all accrue to the foreign researchers – typically from more privileged, better funded, better resourced countries. Helicopter research thus perpetuates historical power imbalances, stifles investment in local academic capacity building, and thereby maintains dependencies on external expertise, facilities and resources.

Here, I present an analysis of published literature to evaluate spatial patterns and temporal trends in the occurrence of helicopter research within the geosciences over the last 50 years, focussing on geology, geomorphology, hydrology and quaternary sciences. Over 19000 papers addressing geoscientific research in developing countries are identified, and their author affiliations extracted to evaluate contributions with and without local authors. The data is then analysed to: (i) identify countries/regions that are less prone or more prone to helicopter research; (ii) assess temporal trends in the prevalence in helicopter research in the geosciences; and (iii) identify changes in the geopolitical characteristics of helicopter research in the geosciences. Although focussing on geosciences in a broad sense, the general findings are thought to transcend disciplines and be equally applicable to other disciplines.

How to cite: Van De Wiel, M.: Helicopter Research in the Geosciences, EGU General Assembly 2025, Vienna, Austria, 27 Apr–2 May 2025, EGU25-19257, https://doi.org/10.5194/egusphere-egu25-19257, 2025.

EGU25-19330 | ECS | Orals | ITS3.1/CL0.14

Agent-based modelling of social processes in land use change: Which influence have socio-psychological factors on shifts in land use intensity? 

Ronja Hotz, Calum Brown, Yongchao Zeng, Thomas Schmitt, and Mark Rounsevell

Understanding land use change dynamics is crucial for sustainable transformation, as land-use intensity affects ecosystem services and socio-ecological resilience. While much modelling effort has focused on economic and biophysical drivers, the role of psychological and social factors in shaping land use trajectories remains underexplored. However, empirical evidence suggests that socio-psychological factors significantly influence land managers' decision-making alongside economic considerations. To address this gap, we present a novel, generic model for social processes that we incorporate into a large-scale agent-based modelling framework for land use change. Our approach combines agent-based modelling with social network analysis, using the Theory of Planned Behaviour to simulate land managers' decisions on land use intensification or extensification. We examine how attitudes, social influences, network characteristics, and demand-driven competition impact land use outcomes and ecosystem service provision. Using a global sensitivity analysis, we identify key drivers shaping land manager distribution across intensities. Our findings reveal that the demand for ecosystem services is the most influential factor for the abundance of high- and low-intensity land managers. However, once psychological and structural barriers - contributing to an overall inertia to adopting new behaviour - are removed, attitudes toward sustainable practices become the primary driver for low-intensity land use. Social influence significantly increases the prevalence of medium-intensity land use, particularly at the spatial border between high- and low-intensity managers. As adoption surpasses a critical mass, medium-intensity practices rapidly expand, while high-intensity practices decline. Social influence also drives spatial clustering of similar land-use intensities, reflecting homophily within land use communities where neighbouring managers adopt comparable strategies. These local clustering effects reinforce dominant practices, creating path-dependent transitions that are difficult to reverse. In contrast, distant social ties have minimal impact, emphasizing the importance of local network effects. We conclude that incorporating social processes into land use models leads to distinct behaviours, revealing threshold and lock-in dynamics. Our approach offers a generic method for enhancing land use models with social dynamics, providing a more holistic understanding of future trajectories and potential sustainability transitions in the land system.

How to cite: Hotz, R., Brown, C., Zeng, Y., Schmitt, T., and Rounsevell, M.: Agent-based modelling of social processes in land use change: Which influence have socio-psychological factors on shifts in land use intensity?, EGU General Assembly 2025, Vienna, Austria, 27 Apr–2 May 2025, EGU25-19330, https://doi.org/10.5194/egusphere-egu25-19330, 2025.

An advanced environmental information system is essential for the sustainable conservation and management of national land, leading to the increased utilization of the Environmental Conservation Value Assessment Map (ECVAM). However, following the scale enhancement to 1:5,000 in 2021, the Weakness evaluation item has included unsuitable data, resulting in an overestimation of grade 5 areas. This study aims to refine the Weakness evaluation item by revising the data used, focusing on the Chungcheongnam-do(CN) region. A revised model was developed by extracting only areas where Urban areas and Planned Management areas of Zoning District and Urbanized Areas of Land Cover(level 3) overlap, excluding previously included data such as farm roads, drainage ditches, and forest paths within Land Cover(level 3). As a result, the proportion of grade 5 areas decreased by 17.78 percentage points, while non-graded areas increased by 14.74 percentage points, indicating a more accurate reflection of the current conditions. Cross-comparison with other environmental and ecological indicators confirmed the relevance of the improved assessment. The revised model was found to maintain consistency within the ECVAM. This study enhances the accuracy and completeness of the Weakness evaluation item, supporting the utility of ECVAM and contributing to sustainable environmental land management.


This paper was supported by Technology Development Project for Creation and Management of Ecosystem based Carbon Sinks (RS-2023-00218243) through KEITI, Ministry of Environment.

How to cite: Ha, E., Jang, R.-I., Lee, S.-W., Yoon, J.-H., and Jeong, S.-W.: Improvement of Weakness Evaluation Item of Environmental Conservation Value Assessment Map (ECVAM) for the Integrated Management of Land and Environmental Planning, EGU General Assembly 2025, Vienna, Austria, 27 Apr–2 May 2025, EGU25-19377, https://doi.org/10.5194/egusphere-egu25-19377, 2025.

EGU25-19411 | ECS | Orals | ITS3.1/CL0.14

Environmental History, Policy, and Carbon Flows and Stocks in Berlin, Germany 

Christopher Ryan and Galina Churkina

Research related to the physical sciences often lacks thoughtful specificity related to the research context. In particular, Berlin, Germany’s diverse political history has had significant impact on its built environment and urban form. Environmental concerns have a long history in Berlin, with early discourse focused on public health and green space availability related to the dense tenement blocks resulting from the Hobrecht Plan (1862), which dictated the form of the city’s early expansion. The rise of German nature and homeland protection movements in the late 19th and early 20th century included many anti-urban sentiments, and while Nazi plans to redevelop Berlin with green corridors radiating out from the center never materialized, a third of the city would be destroyed and the city split into two. This destruction left numerous voids across the city, yielding a unique and characteristic ruderal or wasteland ecology. Particularly after the fall of the wall, many former railyards and airports were converted to parks and greenspaces. With legal requirements at the international (UN Climate Agreement), national (The 2023 Climate Protection Program of the Federal Government), and city (Berlin Climate Protection and Energy Transition Act) level related to reducing CO2 and greenhouse gas (GHG) emissions, the specific pathways that Berlin will take are dictated by this complicated urban history. As patterns of urban biogeochemical cycling are a legacy of both manifested form and ideological histories within any given context, Berlin offers a unique history in which to understand urban carbon cycling. Potential sites for carbon sinks such as soils, vegetation, and buildings, and existing sites of emissions including industry, buildings, and transportation, all exist within this historic context of urban transformation and redevelopment, with future visions for the city being extensions of a longer socioenvironmental and political narrative. This research offers a methodological framework for integrating historical analysis, policy, and biogeochemical data for improving understandings related to urban carbon cycling. In applying this framework to Berlin, insight is gained in how the city can improve urban planning and policy implementation, particularly for the goal of reducing CO2 and GHG emissions.

How to cite: Ryan, C. and Churkina, G.: Environmental History, Policy, and Carbon Flows and Stocks in Berlin, Germany, EGU General Assembly 2025, Vienna, Austria, 27 Apr–2 May 2025, EGU25-19411, https://doi.org/10.5194/egusphere-egu25-19411, 2025.

EGU25-20291 | ECS | Orals | ITS3.1/CL0.14

Empowering Woman in Coastal Community To Fight Climate Crisis  

Aplena Elen Bless, Agustina Sylvani Morimuzemdi, Desi Edowai, Marlon Huwae, Antoni Unggirwalu, Afia Tahoba, and Krisma Lekito

Globally, there are many examples of women’s knowledge and expertise being overlooked by scientists, decision makers, and even community organisations. Women’s work is often regarded as domestic and thus less significant than men’s work, even when women’s work involves managing mangroves, sustaining diverse communities of life, and educating the next generation. This is also the case in Papua, where outsiders are often seen as the real experts in conservation and development. When women’s expertise is minimised over a long period of time, women may not see themselves as experts, and thus not assert their knowledge and authority when they might. So, we see our project as both helping to reveal and document knowledge that has historically been ignored, and affirming for Indigenous women and communities that women’s work with mangroves is a critical form of expertise that should inform current and future responses to the climate crisis.”

How to cite: Bless, A. E., Morimuzemdi, A. S., Edowai, D., Huwae, M., Unggirwalu, A., Tahoba, A., and Lekito, K.: Empowering Woman in Coastal Community To Fight Climate Crisis , EGU General Assembly 2025, Vienna, Austria, 27 Apr–2 May 2025, EGU25-20291, https://doi.org/10.5194/egusphere-egu25-20291, 2025.

Objective: Given the urgency of tools for managing risks associated with climate change, this study aimed to build integrated indicators of vulnerability, exposed population, and climate threat (IVPA) for Brazilian municipalities in 2022, assess their spatial distribution, and assess their association with hospital admissions for primary care-sensitive conditions (CSAP). Method: In the vulnerability dimension, the indicator incorporated simple indicators in sub-dimensions of the driving force, pressure, state, exposure, and effect. The relationship between these simple indicators was assessed according to a Spearman correlation matrix and the principal components technique. The composite threat indicator was the average yearly heat index, calculated from 2006 to 2021. Two other simple threat indicators were evaluated: the yearly maximum temperature and relative humidity (ERA5-Land). The demographic density indicator represented the exposed population dimension. The composite indicators were calculated using geometric means and categorized into quintiles: very low, low, moderate, high, and very high. The future impacts of IVPA were investigated considering the CORDEX-CMIP5 mean projections of maximum temperatures in 2021 to 2040 and 2041 to 2060 in a pessimistic scenario (RCP8.5), compared to the historical period defined as 1986 to 2005. Generalized linear models were used to estimate the associated risks of IVPA on hospital admissions. Results: The North region had the highest percentage of municipalities classified as very high IVPA (72%). The South (59%) and Southeast (24%) regions had the highest percentage of municipalities classified as very low. Almost 70% of the municipalities in the North had a very high heat index. For all CSAP, the critical IVPA situation increased the risk of hospitalization. For example, the risk of hospitalization for angina was approximately 8 times higher in locations classified as high or very high IVPA; for asthma and hypertension, these risks were approximately 3 times higher, respectively. For future periods, most municipalities in Brazil increased the value of their IVPA indicator compared to the historical period, indicating that the population's risk situation could be worse. Conclusion: The IVPA highlighted Brazilian municipalities vulnerable to climate threats, weighted by population density, and their significant association with hospital admissions. The worse the municipality's situation regarding IVPA, the greater the risk of hospitalization due to CSAP.

How to cite: Jacobson, L., Pinto Junior, J., Oliveira, B., Ignotti, E., Schneider, R., and Hacon, S.: Vulnerability and Climate Threat Indicators and associations with morbidity due to primary care-sensitive conditions: An integrated health and environment proposal for Brazilian municipalities., EGU General Assembly 2025, Vienna, Austria, 27 Apr–2 May 2025, EGU25-20569, https://doi.org/10.5194/egusphere-egu25-20569, 2025.

EGU25-397 | Orals | ITS2.2/CL0.16

Impacts of Global Warming on the Livelihoods of Himalayan Communities 

Saraswati Prakash Sati and Sandeep Kumar

The Himalayan region, renowned for its breathtaking landscapes, diverse ecosystems, vibrant communities, and rich cultural heritage, is facing significant challenges due to the ongoing impacts of global warming. The region is experiencing accelerated temperature increases and altered weather patterns that have profound implications for both the environment and the communities that depend on it, in both direct and indirect ways. This study examines how global warming and changing weather patterns affect the livelihoods of Himalayan communities, which are closely linked to natural resources and traditional practices. Key impacts include loss of agricultural productivity, including horticulture and agroforestry, reduced water availability due to glacial retreat, increased frequency and intensity of forest fires, and increased risk of natural disasters such as landslides and floods. Rising temperatures are leading to a retreat of glaciers and thus to a decline in the availability of fresh water, an important resource for agriculture and daily life. Changes in precipitation patterns, including altered monsoon cycles and more frequent extreme weather events, further exacerbate water scarcity and disrupt the traditional farming practices that have sustained these communities for generations. In addition, the loss of crop yields and the increase in natural disasters such as landslides, flash floods, etc., caused by volatile weather and unstable glacier melt, are endangering lives and infrastructure. These disasters disproportionately affect vulnerable populations, especially those living in remote areas where access to emergency services and resources is limited. In response to these challenges, Himalayan communities are adopting adaptation strategies such as changing cropping patterns, diversifying livelihoods and increasing migration to urban centres in search of alternative income opportunities. However, these coping mechanisms are often inadequate due to a lack of financial support, limited access to climate-resilient technologies and a lack of policy responsiveness to local needs. This study highlights the need to understand the interactions between climate change, environmental degradation, and socio-economic systems in the Himalayas.

How to cite: Sati, S. P. and Kumar, S.: Impacts of Global Warming on the Livelihoods of Himalayan Communities, EGU General Assembly 2025, Vienna, Austria, 27 Apr–2 May 2025, EGU25-397, https://doi.org/10.5194/egusphere-egu25-397, 2025.

EGU25-1107 | ECS | Posters on site | ITS2.2/CL0.16

Habitat suitability modelling of endangered medicinal plant, Aconitum heterophyllum Wall. Ex Royle in the Western Himalaya 

Simran Tomar, Merja Helena Tölle, Shinny Thakur, Khilendra Singh Kanwal, Indra Dutt Bhatt, and Sunil Puri

Climate change is considered one of the major threats to species extinction. The impact of climate change on the distribution of Aconitum heterophyllum, an endangered species in the northwestern Himalayan state of Himachal Pradesh, remain largely unexplored. In this study, species occurrence data, bioclimatic variables and population distribution data were used to map the current and future distribution (2050 and 2070) of A. heterophyllum. The Species Distribution Modelling (SDM) based on Maximum Entropy (MaxEnt) algorithm driven by climate data from the Global Circulation Model, HadGEM3-GC31-LL, which is statistically downscaled to 1 km spatial resolution was used for species distribution mapping. Here, we consider three future scenarios: Shared Socioeconomic Pathways (SSPs) - SSP126, SSP245, and SSP585. The Bioclimatic variables (Bio 15), which is precipitation seasonality and elevation, were found to positively influence the distribution of A. heterophyllum in the studied locations. Precipitation seasonality ensures adequate water availability at cold and dry habitats. Also, higher elevations corresponded to high suitable habitats in the Himalaya. The SDM predicted a total suitable area of 1863.7 km2 A. heterophyllum in Himachal Pradesh. Under SSP126, which represents moderate development with minimal environmental degradation, the suitable habitat is projected to decrease by 51.28%by 2070. Under SSP245, which represents moderate development with more pronounced environmental degradation, the suitable habitat is predicted to decrease by 53.64%in the mean by 2070. Under SSP585, representing fossil-fuelled development and successful mitigation of environmental issues, the suitable habitat is predicted to decrease by 54.61% by 2070. Overall, the species is expected to loose 30.68–58.51% of its current habitat between 2050 to 2070, posing a significant extinction risk in the future. Based on the classified layers, the highly suitable areas were found to be overlaying within the Dhauladhar ranges, alpine regions of Pin Valley National Park, Killar ranges of Chamba, Great Himalayan National Park, Parvati glacier, Gramphu, Indrasan Peak and Inderkilla National Park. These regions were identified as areas for key conservation efforts and are crucial for implementing adaptive management strategies to enhance the protection and sustainable use of A. heterophyllum in Himachal Pradesh in the face of global climate change.

Keywords: Species Distribution Modelling, Northwestern Himalaya, Shared Socioeconomic Pathways, Climate change, Endangered

How to cite: Tomar, S., Tölle, M. H., Thakur, S., Kanwal, K. S., Bhatt, I. D., and Puri, S.: Habitat suitability modelling of endangered medicinal plant, Aconitum heterophyllum Wall. Ex Royle in the Western Himalaya, EGU General Assembly 2025, Vienna, Austria, 27 Apr–2 May 2025, EGU25-1107, https://doi.org/10.5194/egusphere-egu25-1107, 2025.

EGU25-3410 | ECS | Orals | ITS2.2/CL0.16

A Climate-Driven Human Genetic Bottleneck in Africa 900 Thousand-Years Ago 

Shih-Wei Fang, Aneesh Sundaresan, Chiara Barbieri, Pasquale Raia, Jiaoyang Ruan, Ali Vahdati, Elke Zeller, Christoph Zollikofer, and Axel Timmermann

Mid-Pleistocene transition (MPT), a climate state underwent low temperature and dry condition, has been suggested as a candidate for a massive genomic bottleneck in African hominins ~0.9 million years ago (Ma). However, no sufficient evidence supports such attribution to climate deterioration for the human genetic bottleneck. Here, we use an agent-based model forced by realistic time-evolving climate conditions to investigate the population and genetic changes of African hominins. With our climate-driven model simulations, population collapses are found before and during the MPT due to reductions of atmospheric CO2 concentrations. The corresponding climate changes and vegetation loss enhance the difficulty of habitation for African hominins in northern and southern Africa. The regional extinctions create population refugia in eastern and southern Africa serving as possible genetic pools for the emergence of Homo sapiens. Furthermore, culture evolution may reinforce the expansion and dispersal of African hominins during the climate recoveries after MPT and to enhance the chance of admixture of African genetic information.

How to cite: Fang, S.-W., Sundaresan, A., Barbieri, C., Raia, P., Ruan, J., Vahdati, A., Zeller, E., Zollikofer, C., and Timmermann, A.: A Climate-Driven Human Genetic Bottleneck in Africa 900 Thousand-Years Ago, EGU General Assembly 2025, Vienna, Austria, 27 Apr–2 May 2025, EGU25-3410, https://doi.org/10.5194/egusphere-egu25-3410, 2025.

EGU25-4065 | ECS | Posters on site | ITS2.2/CL0.16

High-performance computing for mechanistic prediction of biome distribution 

Capucine Lechartre, Victor Boussange, Jed Kaplan, Philipp Brun, and Niklaus Zimmermann

Predictive biome distribution models allow us to investigate how ecosystem dynamics may respond to climate change. A key challenge lies in capturing vegetation’s dynamic response, as plants react individually to climate shifts, forming and dissolving biomes over time. Therefore, models that predict the response of biomes to climate change must adopt a physiology-based approach rather than basing themselves on the apparent climatic distributions of biomes as they exist today. BIOME4, a widely used equilibrium vegetation model developed in 1999, incorporates key components that enhance its ecological realism such as a mechanistic approach driven by climate variables, explicit modeling of plant functional types (PFTs), sensitivity to CO₂ effects and soil-climate interactions, and bioclimatic limits. However, the model has been limited by its computational constraints, running at a coarse resolution of 55 km and relying on legacy Fortran code which leads to compiling challenges and lack of modern GIS compatibility. 

To address these issues, we implement BIOME4 in Julia, a high-performance and open-source computational language towards which a growing fraction of computational geoscientists are turning. In Julia, just-in-time compilation permits fast development while matching the speed of Fortran, and the use of a modern language allows interfacing with state-of-the-art GIS libraries. Moreover, Julia’s multiple dispatch allows for modularizing the model for future needs and Julia displays high expressivity, which means that it can represent a wide variety of ideas, making models developed in the language highly comprehensive. Thanks to the language improvements, our updated version allows for (1) full parallelization, reducing computation times on HPC systems, (2) improved scalability to handle global datasets at fine resolutions, and (3) enhanced maintainability and modularity for future adaptations. 

Using the CHELSA global climate dataset, we demonstrate how our novel BIOME4 version enables new applications. We present predictions of biome distribution at fine resolutions, resolving biome belts along ambiguous elevational gradients in coarse-scale applications. By isolating the individual effects of environmental variables such as temperature, precipitation, and CO₂, we show how BIOME4 facilitates attribution studies on the sensitivity of vegetation to drivers of change and the mechanisms underlying biome shifts. We show that the model can be used to explore climate change impacts through CO₂ fertilization effects or to investigate how changes in net primary productivity (NPP) of PFTs translate into shifts in biome distributions. With access to a wide range of climate scenarios, we provide examples of how one can now use BIOME4 to predict how future climate and CO₂ levels might induce shifts in plant functional type and biome distributions.

This work underscores the value of BIOME4 and the importance of modernizing legacy models to harness advances in computational capabilities, ensuring their relevance in predicting vegetation dynamic responses to climate change.

How to cite: Lechartre, C., Boussange, V., Kaplan, J., Brun, P., and Zimmermann, N.: High-performance computing for mechanistic prediction of biome distribution, EGU General Assembly 2025, Vienna, Austria, 27 Apr–2 May 2025, EGU25-4065, https://doi.org/10.5194/egusphere-egu25-4065, 2025.

EGU25-5079 * | Orals | ITS2.2/CL0.16 | Highlight

Vegetation responses to climate change: lessons from the past 1 Ma of Earth history 

Sandy P. Harrison and I. Colin Prentice

Records of vegetation and environmental change during the Late Quaternary period are numerous and globally distributed, and provide information on actual climate changes and ecosystem responses that have no parallel in recent times. Plants have shown remarkably little macroevolution, and apparently few extinctions, over the past 105–106 years – despite the Earth experiencing alternating warm and cold periods, the latter punctuated by multiple episodes of rapid (decadal to centennial) climate change accompanied by almost equally rapid biome shifts. The persistence of tree taxa in both temperate and tropical regions through multiple climatic cycles indicates considerable resilience to large changes in climate. Phylogenetic niche conservatism has favoured geographic or topographic range shifts, rather than adaptive evolution, as the principal mode by which plants have responded to climate changes on the glacial-interglacial scale. Nevertheless, a pervasive feature of the palaeorecord is the frequent appearance of “novel” communities and disappearance of others: biomes may shift, but community composition is transient. Past vegetation changes also record the effects of atmospheric CO2 concentration on photosynthetic physiology: high CO2 favoured forests and low CO2 favoured C4-dominated grasslands, due to the positive effect of CO2 on the water use efficiency of C3 plant leaves.

This “palaeoperspective” has several, under-appreciated implications for nature conservation in the face of continuing climate change. (1) Novel ecosystems are normal; the preservation of existing assemblages is unlikely to succeed.  (2) Rapid migration of plant species (including trees) is possible, likely facilitated by long-distance dispersal, and may be much faster than currently assumed. (3) Rising CO2 has likely been a primary cause of “woody thickening” in savannas, and will continue to promote the colonization of open vegetation by trees.

How to cite: Harrison, S. P. and Prentice, I. C.: Vegetation responses to climate change: lessons from the past 1 Ma of Earth history, EGU General Assembly 2025, Vienna, Austria, 27 Apr–2 May 2025, EGU25-5079, https://doi.org/10.5194/egusphere-egu25-5079, 2025.

EGU25-7855 | Orals | ITS2.2/CL0.16

Global 1-km habitat distribution for endangered species and its spatial changes under future warming scenarios 

Bin Li, Changxiu Cheng, Tianyuan Zhang, Nan Mu, Zhe Li, Shanli Yang, and Xudong Wu

Implementing biodiversity and climate actions for endangered terrestrial vertebrates is hampered by a lack of high-precision habitat maps. Therefore, we developed a dataset by linking the suitable land-use types and elevation ranges of each endangered terrestrial vertebrate species and mapping these factors onto our recently developed global land use and land cover maps, we generated the distribution of global 1-km habitat suitability ranges  distributions from 2020 to 2100 under varied climate warming scenarios for endangered terrestrial vertebrates (1,754 amphibians, 617 birds, 1,280 mammals, and 1,456 reptiles) and obtained the spatial evolution maps as compared to 2020 baseline. Validation of the 2020 data with actual observation data suggested that the HSR maps for 92% of amphibians, 94% of birds, 95% of mammals, and 91% of reptiles outperformed random distributions within IUCN's expert range maps and that the distribution of observation points closely aligned with species diversity maps. This dataset offers HSR maps for endangered terrestrial vertebrates and their spatial evolution under future warming scenarios, providing a solid basis for biodiversity conservation.

How to cite: Li, B., Cheng, C., Zhang, T., Mu, N., Li, Z., Yang, S., and Wu, X.: Global 1-km habitat distribution for endangered species and its spatial changes under future warming scenarios, EGU General Assembly 2025, Vienna, Austria, 27 Apr–2 May 2025, EGU25-7855, https://doi.org/10.5194/egusphere-egu25-7855, 2025.

EGU25-7948 | ECS | Posters on site | ITS2.2/CL0.16

Climate impacts on Late Quaternary megafauna: A global dynamical modelling approach 

Thushara Venugopal, Axel Timmermann, Pasquale Raia, Jiaoyang Ruan, Elke Zeller, Silvia Castiglione, and Giorgia Girardi

The Late Quaternary period was characterized by the widespread extinction of over 50% of global megafaunal species, followed by a rapid decline in biodiversity. The relative roles of adverse climatic conditions and the emergence of modern humans in these extinctions remain unresolved due to the sparsity of palaeoecological evidence. Here we present a new spatially explicit dynamical model (ICCP Global Mammal Model, IGMM) that simulates climate-induced changes in habitat suitability and biomass distribution of more than 2000 terrestrial mammal species, incorporating dispersion, competition, and predation as functions of time and across the globe. Forced with transient climate simulations for the Late Quaternary period, the model reproduces well the observed global distribution of mammal population biomass and species richness. The glacial-interglacial transitions, with the Last Glacial Maximum (LGM) in particular, were marked by dramatic changes in habitat suitability of mammals, followed by global modulations in population biomass, species composition and biodiversity. The present model may help elucidate the climate-ecological interactions that contributed to the loss of megafauna in the Late Quaternary period, providing insights into the potential drivers of future biodiversity crisis.

How to cite: Venugopal, T., Timmermann, A., Raia, P., Ruan, J., Zeller, E., Castiglione, S., and Girardi, G.: Climate impacts on Late Quaternary megafauna: A global dynamical modelling approach, EGU General Assembly 2025, Vienna, Austria, 27 Apr–2 May 2025, EGU25-7948, https://doi.org/10.5194/egusphere-egu25-7948, 2025.

EGU25-11028 | Posters on site | ITS2.2/CL0.16

Climate Study Insights for the Tourism Sector: Analysis of Selected Pilot Regions in Croatia 

Kreso Pandzic, Tanja Lkso, and Izidora Marković Vukadin

Understanding the impacts of climate change on key economic sectors is essential for developing effective adaptation strategies. The tourism sector in Croatia, a country with diverse climatic regions, is particularly sensitive to changes in climate variables such as air temperature and precipitation. This study aims to analyze essential climate variables for the period 1961–2023 across different climatic regions of Croatia, including Varaždin (representing Northern Continental Croatia), LičkoLešće (Mountain region), and Mali Lošinj and Rijeka (Northern-Eastern Adriatic coastal areas).

In addition to linear trend and 5-year moving average analysis of climate variables for the period 1961-2023 a comparison between these variables was made for two 30-year standard climate periods:  1961-1990 and 1991-2020, respectively. A comparison of climate characteristics for cited two standard periods are compared with those for the period 2071-2100 using projection data of global climate models. Interpretation of the results is focused on their application to adaptation planning to mitigate impacts of global climate warming on touristic sector in Croatia.

The results emphasize the significance of shifting climate characteristics across these regions and their potential implications for tourism adaptation planning. By focusing on these changes, this study aims to support the development of robust strategies to mitigate the impacts of global warming on Croatia's tourism sector. Access to reliable climate data and projections is critical for ensuring the resilience and sustainability of this vital economic sector in the face of ongoing climate change.

Acknowledgment: This research was conducted in the scope of the research project COMMITMENT, financed by Institute for Tourism through Next Generation Fund (CroRis ID- 9574).

How to cite: Pandzic, K., Lkso, T., and Marković Vukadin, I.: Climate Study Insights for the Tourism Sector: Analysis of Selected Pilot Regions in Croatia, EGU General Assembly 2025, Vienna, Austria, 27 Apr–2 May 2025, EGU25-11028, https://doi.org/10.5194/egusphere-egu25-11028, 2025.

EGU25-12281 | ECS | Posters on site | ITS2.2/CL0.16

Measuring Climate Impact on Extinction Risk in Amphibians 

Claus Sarnighausen, Maximilian Kotz, and Sanam Vardag

The increasing relevance of climate change as a threat of species extinction is a pressing concern, as highlighted by the recent IUCN Red List assessment for amphibians. Based on the concept of the climate niche, i.e. conditions required for a stable population, recent studies have estimated the dramatic implications of different climate change scenarios on species. However, there is an ongoing discussion in the community which measures are best suited to quantify climate change impacts on extinction risk, given the available data.
In this study, we provide a consistent framework to evaluate three published measures on historical changes in extinction risk. The compared measures include a classical bioclimate envelope approach, an ensemble of species distribution models, and the average climate change within species' ranges. We train an advanced statistical model (random forest) to predict changes in extinction risk between 1980 and 2021 in 6,288 amphibian species. This analysis is controlled for factors such as geographical range area, human pressures, and other external threats.
We find that two measures based on the climate niche do not predict historical changes in risk, when other factors are controlled for. Also, we find that predictions of risk, based on average climate change, can be misleading when applied to future scenarios. These findings highlight the limitations and inherent uncertainties of predicting climate impact for a high number of species, given the standard datasets and tested methods.


How to cite: Sarnighausen, C., Kotz, M., and Vardag, S.: Measuring Climate Impact on Extinction Risk in Amphibians, EGU General Assembly 2025, Vienna, Austria, 27 Apr–2 May 2025, EGU25-12281, https://doi.org/10.5194/egusphere-egu25-12281, 2025.

EGU25-12467 | ECS | Orals | ITS2.2/CL0.16

Using paleoclimatic range reconstructions to analyse historical space shifts of Striped and Brown Hyenas 

Francisca Virtuoso, Lizzy Brouwer, Frank van Langevelde, Stephanie Dloniak, Anouschka Hof, Andrew Jacobson, Jente Ottenburghs, Florian Weise, Lars Werdelin, Michael Westbury, and Femke Broekhuis

Niche theory suggests that two species with similar ecological roles can coexist only if they exhibit sufficient differentiation in resource use; otherwise, competitive exclusion may occur. The striped and brown hyena share similar niches, particularly in terms of diet and habitat preferences. Today, the brown hyena’s range is restricted to Southern Africa, while the striped hyena occupies a larger area from Kenya to India. Yet, fossil evidence suggests that these species could have occupied wider, potentially overlapping ranges historically. Brown hyena fossils have been found in Kenya and Ethiopia, while striped hyena fossils appear as far south as South Africa. To investigate the potential historical range shifts of both species during the last 120,000 years, we developed maximum entropy species distribution models (package megaSDM). We used occurrence data collated by the IUCN SSC Hyena Specialist group and HadCM3/ HadAM3H simulated climatic, bioclimatic and vegetation variables as  predictors. Our results indicate that during the Last Glacial Maximum (~21,000BP), a potential corridor with high habitat suitability existed between their current ranges, suggesting that the striped hyena could have extended its range into southern Africa, supporting previous fossil findings. We found that habitat suitability for both species has declined over time, likely driven by changes in precipitation, temperature, and biome type. Both species show a preference for regions with relatively low annual precipitation (with 700 mm as a maximum threshold), moderate temperatures (12–18°C), and arid landscapes. These results imply that fluctuating Pleistocene climates, particularly cycles of wetter and drier conditions in East Africa, likely caused shifts in suitable habitats, contributing to the contraction of both species' ranges. Understanding these historical dynamics provides insights into the ecological and climatic factors that have shaped the current distributions of striped and brown hyenas, with implications for conservation and management in the context of future climate change.

How to cite: Virtuoso, F., Brouwer, L., van Langevelde, F., Dloniak, S., Hof, A., Jacobson, A., Ottenburghs, J., Weise, F., Werdelin, L., Westbury, M., and Broekhuis, F.: Using paleoclimatic range reconstructions to analyse historical space shifts of Striped and Brown Hyenas, EGU General Assembly 2025, Vienna, Austria, 27 Apr–2 May 2025, EGU25-12467, https://doi.org/10.5194/egusphere-egu25-12467, 2025.

EGU25-12891 | ECS | Posters on site | ITS2.2/CL0.16

Human Thermal Indices and the Risk of Abrupt Population Disruption 

Saket Dubey and Shrikant Lahase

This study investigates the timing of abrupt disruptions to human populations resulting from extreme heat stress on a global scale. Utilizing data from 38 Global Climate Models (GCMs) under multiple Shared Socioeconomic Pathways (SSPs: 2.6, 4.5, and 8.5) within the CMIP6 framework, we project a suite of human thermal indices, including apparent temperature (indoor & outdoor), discomfort index, effective temperature, heat index, humidex, modified discomfort index, net effective temperature, simplified wet globe temperature, wet bulb globe temperature, and wind chill temperature, for both historical (1850-2024) and future (2024-2100) periods. Abrupt disruption is defined as a continuous period exceeding historical thresholds for at least five consecutive years.

Our analysis, conducted within Köppen-Geiger climate regions, reveals a concerning trend: the onset of abrupt disruption is projected to occur significantly earlier than previously anticipated across all SSPs. Even under the most optimistic mitigation scenario (SSP2.6), millions of people are projected to experience abrupt disruptions before 2050. By 2100, over 5% of the global population could be affected by these abrupt changes, with substantial regional variations.

Furthermore, our analysis incorporates population projections from SSPs to estimate the number of individuals impacted by these disruptions in each decade. Results indicate a substantial increase in the number of people exposed to extreme heat stress, with significant implications for human health, livelihoods, and societal stability.

These findings underscore the urgency of implementing robust adaptation strategies to mitigate the severe impacts of extreme heat on human populations. Such strategies should include investments in early warning systems, improved urban planning, and the development of heat-resilient infrastructure.

How to cite: Dubey, S. and Lahase, S.: Human Thermal Indices and the Risk of Abrupt Population Disruption, EGU General Assembly 2025, Vienna, Austria, 27 Apr–2 May 2025, EGU25-12891, https://doi.org/10.5194/egusphere-egu25-12891, 2025.

EGU25-15791 | ECS | Orals | ITS2.2/CL0.16

The respective role of climate mitigation, sustainable land use and area-based conservation to curb future biodiversity loss 

Chantal Hari, Matthias Biber, Jonas Geldmann, Thomas Hickler, Myke Koopmans, Pablo Negret, Christopher Reyer, Alke Voskamp, Markus Fischer, and Édouard Davin

Increasing conservation efforts are required to avert biodiversity decline caused by climate and land use changes. In a recent study (Hari et al. 2024; preprint), we combined climate change scenarios (RCP2.6 and RCP6.0) and land use change projections to assess their impact on future species distribution for a large number of mammals, birds and amphibians. Future projections of land use change were derived from the Land Use Harmonization dataset v2 (LUH2), which does not make any explicit assumptions about the area under protection in these scenarios.

Here, we extend the scope of our future biodiversity projections by adding an additional layer of different protected area (PA) scenarios. In the first conservation scenario, we fix the PAs based on the World Database on Protected Areas (WDPA), thereby assuming that PAs will remain the same in the future as it is today. In a second category of scenarios, we create land use scenarios compatible with the Global Biodiversity Framework’s “30 by 30” target based on the spatially optimized dataset by Jung et al. (2021) combined with LUH2.

We show that combining climate mitigation measures with sustainable land use is more beneficial for biodiversity than any PA scenario alone. However, PA expansion significantly reduces species loss, particularly in biodiversity hotspots. While any level of area-based conservation yields notable biodiversity benefits, the 30% PA target proves especially effective under high-emission scenarios, preventing up to 11.2% more land use-driven species loss in regions such as West, Central, East and South Africa compared to scenarios without PAs.

How to cite: Hari, C., Biber, M., Geldmann, J., Hickler, T., Koopmans, M., Negret, P., Reyer, C., Voskamp, A., Fischer, M., and Davin, É.: The respective role of climate mitigation, sustainable land use and area-based conservation to curb future biodiversity loss, EGU General Assembly 2025, Vienna, Austria, 27 Apr–2 May 2025, EGU25-15791, https://doi.org/10.5194/egusphere-egu25-15791, 2025.

EGU25-16386 | ECS | Orals | ITS2.2/CL0.16

Major distribution shifts are projected for key rangeland grasses under a high-emission scenario in East Africa at the end of the 21st century 

Santos J. González-Rojí, Martina Messmer, Sandra Eckert, Amor Torre-Marin Rando, Mark Snethlage, Kaspar Hurni, Urs Beyerle, Andreas Hemp, Staline Kibet, and Thomas F. Stocker

Grassland landscapes are important ecosystems in East Africa, providing habitat and grazing grounds for wildlife and livestock and supporting pastoralism, an essential part of the agricultural sector. Since future grassland availability directly affects the future mobility needs of pastoralists and wildlife, we aim to model changes in the distribution of key grassland species under climate change. We combine a global and regional climate model with a machine learning-based species distribution model to understand the impact of regional climate change on different key grass species. The application of a dynamical downscaling step allows us to capture the fine-scale effects of the region’s complex climate, its variability and future changes.

Under present-day climate conditions, the arid lowlands of eastern and northern Kenya seem favourable to all studied grassland species. However, future climate change under the high-emission scenario RCP8.5 is expected to alter the distribution and composition of grassland ecosystems. While C. ciliaris and D. milanjiana, show a slight overall increase in habitat suitability, species such as C. dactylon, C. plectostachyus and C. mezianus are projected to experience notable range contractions. The Turkana region, in particular, is expected to be severely impacted, with a near-complete absence of the studied species under the high-emission scenario. These negative effects are likely driven by increased precipitation and seasonal temperature, which create unfavourable conditions for many grass species. Elevated regions present less favourable conditions for some of the considered species under present-day climate conditions. However, the projected higher temperatures will possibly help some of the grasses to conquer these regions. With this study we tried to anticipate the currently still uncertain changes in grass species, key for wildlife and livestock of pastoralists, under climate change. Our results are valuable for assessing the economic potential of the region and the sustainable long-term planning, for example when designing livestock and wildlife corridors or highway crossings.

How to cite: González-Rojí, S. J., Messmer, M., Eckert, S., Torre-Marin Rando, A., Snethlage, M., Hurni, K., Beyerle, U., Hemp, A., Kibet, S., and Stocker, T. F.: Major distribution shifts are projected for key rangeland grasses under a high-emission scenario in East Africa at the end of the 21st century, EGU General Assembly 2025, Vienna, Austria, 27 Apr–2 May 2025, EGU25-16386, https://doi.org/10.5194/egusphere-egu25-16386, 2025.

EGU25-16593 | Orals | ITS2.2/CL0.16

Regional Contrasts in LGM to Holocene Warming Trends in the Terrestrial Arctic: Insights from Sedimentary Ancient DNA 

Ulrike Herzschuh, Thomas Boehmer, Kathleen Stoof-Leichsenring, Simeon Lisovski, Anne Dallmeyer, and Darrell Kaufman

A synthesis of proxy studies from the terrestrial Arctic reveals conflicting patterns regarding the extent and timing of the Holocene summer temperature maximum. This is unexpected, as summer insolation—acting at the hemispheric scale—is generally assumed to be the primary driver. Regional differences have largely been attributed to proxy-related uncertainties.

In this study, we introduce a new quantitative proxy for terrestrial climate change by leveraging sedimentary ancient DNA (plant metabarcoding) from lake sediments. Our dataset spans 22 sites across Siberia, Alaska, and western Canada, covering the last 26,000 years. The reconstruction error is notably low (<1°C) compared to other proxies.

Our findings indicate that the temperature maximum across all records occurred around 10,000 years ago, with temperatures averaging 1.5°C above the late Holocene mean and approximately 4°C warmer than the Last Glacial Maximum (LGM) average. While the large-scale trend generally aligns with summer insolation patterns, we observed strong regional variations, particularly in areas affected by shelf flooding. These regions were relatively warm during the glacial period compared to the Holocene, as the sites were situated more distant from the coasts.

Importantly, our sedimentary ancient DNA-based reconstructions are validated by transient simulations using an Earth System Model (ESM) with adjusting land-sea mask which show similar pattern.

How to cite: Herzschuh, U., Boehmer, T., Stoof-Leichsenring, K., Lisovski, S., Dallmeyer, A., and Kaufman, D.: Regional Contrasts in LGM to Holocene Warming Trends in the Terrestrial Arctic: Insights from Sedimentary Ancient DNA, EGU General Assembly 2025, Vienna, Austria, 27 Apr–2 May 2025, EGU25-16593, https://doi.org/10.5194/egusphere-egu25-16593, 2025.

Anthropogenic climate change is altering the distribution of mycotoxigenic fungi, including Aspergillus flavus and Fusarium spp., which produce harmful mycotoxins like aflatoxins and fumonisins that can contaminate food and feed supplies. These shifts impact agriculture, food security, and food safety, as fungal life cycles depend on temperature, humidity, and rainfall. Using high-resolution ERA5-Land data (1950–2021), we have calculated a daily Aflatoxin Risk Index (ARI) to identify high-risk regions and temporal trends. Results show a significant increase in the days with ARI >0.50 in southern Europe, particularly in Spain, Greece, and Italy, with expansion into central and northern Europe in recent decades. Future work will employ EURO-CORDEX and CMIP6 projections to assess fungal biodiversity changes under Shared Socioeconomic Pathways (SSPs), addressing critical agricultural and health challenges posed by climate change.

How to cite: Raj, R., Rieder, H., Balkova, D., Battilani, P., and Leggieri, M. C.: Changes in the spatio-temporal distribution of climatic conditions suitable for mycotoxigenic fungal pathogens in Europe: Implications of Climate Change on Food Security, EGU General Assembly 2025, Vienna, Austria, 27 Apr–2 May 2025, EGU25-16796, https://doi.org/10.5194/egusphere-egu25-16796, 2025.

EGU25-17276 | ECS | Orals | ITS2.2/CL0.16

 Climate Models and Hominin Niches: Insights from the Last Glacial Cycle 

Deepak Kumar Chinnaswamy, Antje Schwalb, and Sebastian Wagner

Climate models are fundamental in shaping the narratives of the future impacts of humans on climate, yet their capacity to illuminate past climate impacts on humans remains largely unexplored. This study explores possibilities, challenges and limitations of using comprehensive Earth System  Models to reconstruct the climatic niches of hominins during the Last Interglacial (LIG) and the Last Glacial Maximum (LGM).

Hominin niches are primarily shaped by temperature and precipitation patterns, incorporating archaeological and environmental constraints. While paleoclimate reconstructions are commonly used, they are sometimes complemented by climate models. Intermediate Complexity Models are widely applied for their efficiency but lack the resolution and detailed processes offered by Earth System Models (ESMs) or Regional Climate Models (RCMs). Despite their advantages, ESMs and RCMs are computationally expensive for long-term simulations. Moreover, most studies rely on a single climate model, which can introduce significant biases. Here we utilize six Coupled Model Intercomparison Project sixth phase (CMIP6) models to highlight these biases and examine differences in the climatic niche patterns over Europe during the Last Interglacial (LIG), and the Last Glacial Maximum (LGM) compared to pre-industrial conditions.

LGM and LIG are the periods with contrasting background climates that humans have experienced. The models show good agreement in terms of mean climate but they tend to diverge during periods of higher variability (like LGM winters). The LIG climate had a larger temperature range with precipitation levels comparable to pre-industrial times over Europe. At the same time during the LGM, the temperature range was high, still, mean temperatures were subzero for half of the year with a similar amount of precipitation. While catabatic winds kept Europe colder during the LGM in the vicinity of the large Scandinavian Inland Ice Sheet, orbitally induced continental heating resulted in warmer LIG summers. However, Iberia and parts of Western Europe maintained moderate climate conditions during both periods. Although the CMIP6 suite of ESM models agrees with each other broadly, getting into specific aspects and regional characteristics can be ambiguous.

Our findings emphasize the need for multi-model approaches to elucidate biases and provide more robust insights into hominin climatic niches. Future research will explore regional variations across Europe, allowing a better understanding of past human-climate interactions.

How to cite: Chinnaswamy, D. K., Schwalb, A., and Wagner, S.:  Climate Models and Hominin Niches: Insights from the Last Glacial Cycle, EGU General Assembly 2025, Vienna, Austria, 27 Apr–2 May 2025, EGU25-17276, https://doi.org/10.5194/egusphere-egu25-17276, 2025.

EGU25-18982 | ECS | Posters on site | ITS2.2/CL0.16

Protected areas desperately need climate connectivity 

Hui Dang

Over the past two decades, numerous efforts have been made to conserve biodiversity. However, official assessments from the Convention on Biological Diversity indicate that none of the proposed biodiversity conservation targets have been fully achieved. These efforts have often prioritized expanding protected areas, while overlooking the critical importance of climate connectivity, which is essential for species adaptation to climate change. Despite the Kunming-Montreal Global Biodiversity Framework stressing the importance of enhancing ecosystem connectivity to mitigate climate impacts, it remains frequently overlooked in early protected area planning. This oversight is a widespread issue across many countries.To reverse this alarming situation, we call for the establishment of a network of terrestrial protected areas with broad climate connectivity to enhance the resilience of species to climate change. The terrestrial network should include wildlife corridors, rich refuges for rare and endangered species, a variety of ecosystems and areas from low to high elevations. A more effective network of climate-resilient terrestrial protected areas will contribute greatly to the achievement of biodiversity conservation targets from local to global scales in the future.

How to cite: Dang, H.: Protected areas desperately need climate connectivity, EGU General Assembly 2025, Vienna, Austria, 27 Apr–2 May 2025, EGU25-18982, https://doi.org/10.5194/egusphere-egu25-18982, 2025.

CL1.1 – Past Climate - Deep Time

As the terminal zone for marine sulfate reduction, the sulfate-methane transition zone (SMTZ) facilitates anaerobic oxidation of methane coupled with sulfate reduction (AOM-SR), integrating the biogeochemical cycles of carbon and sulfur. This process indirectly influences the redox balance of surface geological environments. To investigate the biogeochemical characteristics within paleo-SMTZs, we examined two representative nodules from the Early Silurian, South China. The diagenetic barite and 34S-enriched euhedral pyrite within these nodules indicate a close association with SMTZ. The sedimentary microtextural evidence of the authigenic growth sequence of framboidal pyrite and pronounced heterogeneity δ34Spyr suggests a multi-stage genesis of nodules. In Type-1 nodules, δ34Spyr at the edges are as low as 8.6‰. significantly less than the 18.8‰ observed at the centers. At the grain scale, the δ34S within individual pyrite grain ranges from -1.9‰ to 29.1‰. We propose that the formation of Type-1 nodules occurred in three stages: (1) nodule embryos with 34S-depleted pyrite edges formed in the sulfate reduction zone based on a diffusion-precipitation model; (2) within the SMTZ, barite dissolution and reprecipitation promote nodule growth, forming 34S-enriched euhedral pyrite and causing strong heterogeneity in the sulfur isotope distribution within some pyrite grains.; and (3) below the SMTZ, sulfate depletion leads to extensive replacement of barite by other minerals. The pronounced concentric structure in Type-2 nodules indicates multiple formation episodes; the initial stage aligns with that of Type-1 nodules, while needle-shaped minerals at the edges formed in response to vertical spatial shifts within SMTZ. Additionally, calcite, typically associated with SMTZs, is notably rare within these nodules. Instead, quartz replaces calcite as the nodule matrix and commonly undergoes pseudomorphic replacement of barite. We suggest that the substantial enrichment of quartz over calcite within nodules results from microbial activity altering pore water pH and alkalinity, serving as a petrographic fingerprint of organoclastic sulfate reduction within paleo-SMTZs.

How to cite: Tang, Q., Liang, C., Ji, S., Cao, Y., and Liu, K.: Lithofacies and in-situ sulfur isotope characteristics of nodules across the Ordovician-Silurian boundary marine shale in South China: Indicative significance for sedimentary environment, EGU General Assembly 2025, Vienna, Austria, 27 Apr–2 May 2025, EGU25-107, https://doi.org/10.5194/egusphere-egu25-107, 2025.

EGU25-116 | ECS | Posters on site | CL1.1.1

Lower CO2 consumption from chemical weathering during warmer climates in North New Guinea 

Yifan Du and Peter D. Clift

New Guinea represents an important potential influence over the consumption of atmospheric CO2 and global climate because of its large size, rapid erosion and strongly mafic composition. A new sediment record documenting erosion in northern New Guinea since 350 ka shows that stronger rain during interglacial times erodes more accreted continental crust than mafic arc crust. Although sediment is altered more during interglacials, this change in provenance results in a greater impact on the amount of CO2 consumed per unit weight. Thus silicate weathering is less efficient at removing CO2 when global climate is warmer, leaving more greenhouse gas in the atmosphere. New Guinea’s climatically modulated erosion thus acts as an amplifier of global climate variations on orbital timescales.

How to cite: Du, Y. and Clift, P. D.: Lower CO2 consumption from chemical weathering during warmer climates in North New Guinea, EGU General Assembly 2025, Vienna, Austria, 27 Apr–2 May 2025, EGU25-116, https://doi.org/10.5194/egusphere-egu25-116, 2025.

EGU25-1205 | ECS | Posters on site | CL1.1.1

Orbitally-paced climate change and organic carbon burial during the late Ordovician-early Silurian 

Jixuan Wang, Guanghui Yuan, Zhonggui Hu, Jiuzhen Hu, and Quansheng Cai

Climate change and organic carbon burial events in the Late Ordovician-Early Silurian are well-documented, yet the mechanisms driving these events remain debated. Through high-resolution gamma-ray logging (GR) and trace element records, we establish a 12.6 Myr astronomical timescale for the Late Ordovician-Early Silurian Wufeng-Longmaxi Formation in the Sichuan Basin. Million-year-scale sea level fluctuations are reconstructed by modeling sedimentary noise in the 405 kyr-tuned GR series. Energy decomposition analysis of astronomical orbital parameters suggests that changes in land-sea water exchange, driven by enhanced tropical water vapor and heat within a ~2.1 Myr eccentricity-modulated gyre, likely served as the primary driver of seawater deposition. Maxima in total organic carbon coincides with peaks in the long-term 1.1 Myr obliquity modulation cycle, with the long-term 2.1 Myr eccentricity cycle occurring at a maximum or minimum. This long-term trajectory may have driven carbon cycle perturbations and differential organic matter enrichment by influencing various climate-related factors. During the Late Ordovician-Early Silurian, a new resonance state emerged, characterized by ~2.1 Myr eccentricity and ~1.1–1.0 Myr inclination, likely associated with long-term Earth-Mars resonance and potentially constraining the chaotic evolution of the solar system over geological timescales.

How to cite: Wang, J., Yuan, G., Hu, Z., Hu, J., and Cai, Q.: Orbitally-paced climate change and organic carbon burial during the late Ordovician-early Silurian, EGU General Assembly 2025, Vienna, Austria, 27 Apr–2 May 2025, EGU25-1205, https://doi.org/10.5194/egusphere-egu25-1205, 2025.

EGU25-1207 | ECS | Posters on site | CL1.1.1

Evidence for the enhancement of east–west climatic contrast in northern China under past global warming: paleovegetation records and numerical simulations 

Xiaofang Huang, Shiling Yang, Wenying Jiang, Minghu Ding, Yongda Wang, Minmin Sun, and Shihao Zhang

The response of vegetation to past global warming, as revealed by geological records, can provide insights into future changes. We used pollen records to reconstruct spatial changes in the boundary between steppe and forest/forest-steppe for the Last Glacial Maximum (LGM), mid-Holocene, Last Interglacial (LIG), and mid-Pliocene, representing major changes in global temperature. The results showed that in the region east of 110° E, the trend of the boundary between steppe and forest/forest-steppe rotated anticlockwise by around 30°, 5° and 10°, during the warm periods of the mid-Holocene, LIG, and mid-Pliocene, relative to the LGM, mid-Holocene, and LIG, respectively. However, in the region west of 110° E, the boundary remained stationary during the mid-Holocene compared with the LGM, while it shifted northward during the LIG relative to the mid-Holocene, and it shifted southward during the mid-Pliocene relative to the LIG. Overall, our results indicate an enhanced east-west climatic contrast in northern China under past global warming. Climate simulation results showed that the warming-induced northward shift and westward extension of the western Pacific subtropical high promoted the northwestward displacement of the East-Asian monsoon rainfall belt. This suggests that in the future, under a warmer climate, the eastern region of northern China will become wetter, and that the extent of sandy desert will decrease. 

How to cite: Huang, X., Yang, S., Jiang, W., Ding, M., Wang, Y., Sun, M., and Zhang, S.: Evidence for the enhancement of east–west climatic contrast in northern China under past global warming: paleovegetation records and numerical simulations, EGU General Assembly 2025, Vienna, Austria, 27 Apr–2 May 2025, EGU25-1207, https://doi.org/10.5194/egusphere-egu25-1207, 2025.

EGU25-1269 | ECS | Orals | CL1.1.1

 The late Eocene rise of eastern Tibet and its impact on climate and biodiversity  

Zhongyu Xiong, Lin Ding, Alexander Farnsworth, Chenyuan Zhao, and Xiaolong Tian

The rise of the Tibet Plateau played a significant role in Asian climate evolution, especially the eastern Tibet which forms the transitional area where the South Asian Monsoon and East Asian Monsoon systems interact, and the formation of modern high-relief topography of eastern Tibet potentially makes its the cradle of Hengduan Mountain biodiversity hotspot.

We reconstruct the uplifting history of the eastern Tibet in three Cenozoic basins, including Gonjo, Relu and Markam basins based on multiple proxies. These basins are NW-SE directed basins with an elevation of ~4000 m at present. Today, the climate in these basins is semi-humid monsoonal with a mean annual air temperature of 0-5 ℃ and annual precipitation of 400-600 mm/yr. Aeolian deposits are pervasively developed at the bottom of the eastern Tibet Cenozoic basins before early Eocene (>50 Ma), especially in the Gonjo and Relu basins. Fluvial and lacustrine strata were deposited in the middle part of Gonjo Basin and the lower part of Relu Basin (50-45 Ma). Large number of lacustrine sediments (45-34 Ma) exists in the middle of the Relu Basin and the top of the Markam Basin. Oxygen and clumped isotopes from the Gonjo Basin suggested an earlier uplift from 0.7 km to 3.8 km during the middle Eocene (50-40 Ma; Xiong et al., 2020). The CLAMP and clumped isotope results for the Relu Basin indicated a rise in elevation from 0.6 km to 3.7 km between 45 to 34 Ma (He et al., 2022). The Markam Basin remained at a moderate elevation of 2.6 km between 42 to 39 Ma, then rose rapidly to 3.8 km by 36 Ma as indicated by CLAMP and oxygen isotope paleoaltimetry (Zhao et al., 2023). Combined with published paleoelevation results, the elevational history of eastern Tibet revealed as: During the early Eocene, it remained as lowland, and then underwent moderate to quick rise in the middle Eocene, approached to near present elevations by the latest Eocene of ~35 Ma.

The rise of the eastern Tibet during warm-house period significantly changed the climate as well as the biodiversity within and around Tibet. Before the rise of eastern Tibet, the climate was dry with typical intermountain desert system. Accompany with the rise of eastern Tibet, a Mediterranean climate developed in eastern Tibet characterized by bi-modal precipitation with two peaks during the spring (MAM) and autumn (SON) seasons, and a lower precipitation in the summer (JJA) seasons (He et al., 2022; Chen et al., 2023). Another line of evidence that supports the Mediterranean-like climate comes from the plant fossils. A typical semi-arid or arid flora that includes Palm, Eucalyptus, Palibinia and Quercus shows some similarity to Mediterranean vegetation. This flora co-evolved with the rise of eastern Tibet in the Relu and Markam basins, and even dispersed to the southeastern China. The high-relief topography, coupled with this distinctive Mediterranean climate system, significantly contributes to the development of the highly diversified species.

How to cite: Xiong, Z., Ding, L., Farnsworth, A., Zhao, C., and Tian, X.:  The late Eocene rise of eastern Tibet and its impact on climate and biodiversity , EGU General Assembly 2025, Vienna, Austria, 27 Apr–2 May 2025, EGU25-1269, https://doi.org/10.5194/egusphere-egu25-1269, 2025.

EGU25-1919 | ECS | Posters on site | CL1.1.1

CRETACEOUS OCEAN RED BEDS (CORBe) AND OXYGENATION: UNVEILING THE UPPER APTIAN AND UPPER ALBIAN PALEOCLIMATE AND PALEOCEANOGRAPHY 

Stephanie Leone, Manoel Damaceno, Martino Giorgioni, and Luigi Jovane

Cretaceous Oceanic Red Beds (CORBs) represent important archives of paleoceanographic and paleoclimatic conditions during Earth’s greenhouse intervals. In this study, we focus on Upper Aptian and Upper Albian CORBs from the Trento Plateau (Southern Alps, NE Italy), integrating geochemical (ICP-OES, ICP-MS), rare earth element (REE), and thermomagnetic analyses to elucidate local and global factors controlling their deposition. Aptian CORBs exhibit higher and more variable oxygenation, favoring hematite formation and enrichment in light rare earth elements (LREEs), whereas Albian CORBs reflect slightly lower O2 levels and greater climatic stability. The absence of redox-sensitive elements such as Mo and Cr confirms that anoxia was not a limiting factor in either interval. Thermomagnetic data reveal incomplete magnetite oxidation in both Aptian and Albian samples, indicative of reduced oxygen availability during deposition. These depositional differences are linked to local tectonic subsidence of the Trento Plateau, which influenced sedimentation rates, as well as global climatic shifts following major Oceanic Anoxic Events (OAEs). Our multi-proxy approach highlights that, despite contrasting oxygenation histories, both intervals maintained sufficiently oxic bottom waters—whether through higher dissolved O2 or lower sedimentation rates—to enable the formation of CORBs. Our findings advance the understanding of mid-Cretaceous paleoceanography, demonstrating that CORBs can form under varying yet consistently oxic conditions, shaped by the interplay of tectonics, sediment supply, and climate feedbacks.


How to cite: Leone, S., Damaceno, M., Giorgioni, M., and Jovane, L.: CRETACEOUS OCEAN RED BEDS (CORBe) AND OXYGENATION: UNVEILING THE UPPER APTIAN AND UPPER ALBIAN PALEOCLIMATE AND PALEOCEANOGRAPHY, EGU General Assembly 2025, Vienna, Austria, 27 Apr–2 May 2025, EGU25-1919, https://doi.org/10.5194/egusphere-egu25-1919, 2025.

EGU25-2832 | ECS | Posters on site | CL1.1.1

Paleogeography and boundary condition sensitivities in mid-Miocene climate simulations with CESM1.2 

Martin Renoult and Agatha de Boer

The Langhian (15.98–13.82 Ma) was a stage of the mid-Miocene characterized by atmospheric CO2 levels higher than those of the present day and significantly warmer surface temperatures. Growing interest in the mid-Miocene arises from its potential as an analog for future climate scenarios. In this study, we conducted Langhian simulations using the climate model CESM1.2 and a new and unpublished geography, comparing them to simulations submitted for the Miocene Modeling Intercomparison Project Phase 1 (MioMIP), which utilizes the geography of Burls et al. (2021). The global mean surface temperature anomaly is similar for both geographies, averaging +5.5°C relative to pre-industrial levels, but exhibits strong local differences due to variations in ice sheets, topography, and bathymetry. A notable feature of our simulations is significant cooling in the northern Atlantic Ocean, driven by a collapse of the Atlantic meridional overturning circulation. Conversely, a strong Pacific meridional overturning circulation emerges, a phenomenon less commonly observed in other Miocene simulations. We further explore the sensitivity of the Langhian climate by varying CO2 concentrations, removing the Antarctic ice sheet, adjusting cloud parametrization, and incorporating dynamic vegetation. This study reveals a wide range of climate responses, emphasizing the critical influence of geography and other uncertain boundary conditions in achieving realistic Miocene climate simulations and improving data-model comparisons.

How to cite: Renoult, M. and de Boer, A.: Paleogeography and boundary condition sensitivities in mid-Miocene climate simulations with CESM1.2, EGU General Assembly 2025, Vienna, Austria, 27 Apr–2 May 2025, EGU25-2832, https://doi.org/10.5194/egusphere-egu25-2832, 2025.

EGU25-3420 | ECS | Posters on site | CL1.1.1

Elucidating the mechanisms of 400-kyr tropical hydroclimate variability during the Plio-Pleistocene 

Jyoti Jadhav, Axel Timmermann, Nitesh Sinha, and Kyung-Sook Yun

The control of the eccentricity on annual mean insolation is minimal. Yet, substantial variability in eccentricity timescales, especially the 400-kyr cycle, has been observed in tropical hydroclimate records. As suggested, this variability may have been significantly driven by long-term carbon cycle changes during the Plio-Pleistocene.

We present results from well-dated high-resolution paleoclimate proxies during the Plio-Pleistocene and an unprecedented transient climate simulation conducted with NCAR’s realistic Community Earth System Model version 1.2; the latter covers the climate history of the past 3Myr. The analyses of existing carbon isotope records (i.e., planktic and benthic δ13C) from deep marine sediment cores and other paleoclimatic (terrigenous dust flux) archives from the tropical ocean during the Pliocene and early Pleistocene (>1.5 Myr) reveal clear 400-kyr climate signals, suggesting eccentricity-paced changes in the long-term carbon cycle. Our model simulates 400-kyr variability in tropical hydroclimate. However, the climatic control on the robust feature of the carbon cycle (i.e., the 400-kyr oscillation) and its role and dynamics during the Plio-Pleistocene needs to be better understood. Our study investigates the interaction processes between various paleoenvironmental records and further focuses on different hypotheses following the antiphase relation of marine δ13C with the eccentricity cycle. First, we provide a combined perspective on the role of atmospheric circulation and, thus, dust in the dynamic of the carbon cycle and productivity. Also, come up with causes and links with the pacing of the carbon cycle and the ocean’s role. Second, assess the ecosystem response (vegetation) to changes in precipitation in connection with changes in atmospheric CO2.

How to cite: Jadhav, J., Timmermann, A., Sinha, N., and Yun, K.-S.: Elucidating the mechanisms of 400-kyr tropical hydroclimate variability during the Plio-Pleistocene, EGU General Assembly 2025, Vienna, Austria, 27 Apr–2 May 2025, EGU25-3420, https://doi.org/10.5194/egusphere-egu25-3420, 2025.

EGU25-4630 | ECS | Orals | CL1.1.1

Hydroclimatic change at the immediate start of the Carnian Pluvial Episode (Late Triassic) 

Yizhou Huang, Jacopo Dal Corso, Piero Gianolla, Daniel Lunt, Alexander Farnsworth, Guido Roghi, Yuhang Wang, David Naafs, Xinyue Dang, Michael Benton, and Richard Pancost

The Carnian Pluvial Episode was marked by episodic climate perturbations and multiple negative carbon isotope excursions (NCIEs) in (in)organic carbon. Its onset (NCIE-1) corresponds to an extended period of climate disruption, including global warming and an intensified hydrological cycle, as evidenced by increased siliciclastic inputs into marine basins and hygrophytic palynological assemblages. To investigate climatic/biotic changes of NCIE-1, we analyzed plant, algal, and bacterial lipid biomarkers and δ2H of leaf-wax n-alkanes from the Dolomites (Italy) in northwestern Tethys. Coeval δ2H reductions in n-alkanes by up to ca. 40‰ align with NCIE-1, indicating increased rainfall and altered hydroclimate in this initial carbon cycle perturbation. Concurrently, elevated biomarker concentrations reveal enhanced terrestrial inputs and marine primary production, with shifts in land plant communities via n-alkane distributions and alterations in marine algal communities by sterane assemblages. The biomarker dataset emphasizes the immediate impact of the NCIE-1 on both the terrestrial and marine ecosystems. Such a hydroclimate-biotic change in Dolomites suggests a complicated interaction amongst carbon and hydrological cycle via atmospheric-ocean dynamics during Carnian urgent to be investigated.

How to cite: Huang, Y., Dal Corso, J., Gianolla, P., Lunt, D., Farnsworth, A., Roghi, G., Wang, Y., Naafs, D., Dang, X., Benton, M., and Pancost, R.: Hydroclimatic change at the immediate start of the Carnian Pluvial Episode (Late Triassic), EGU General Assembly 2025, Vienna, Austria, 27 Apr–2 May 2025, EGU25-4630, https://doi.org/10.5194/egusphere-egu25-4630, 2025.

EGU25-4792 | Orals | CL1.1.1

Persistently active El Niño–Southern Oscillation since the Mesozoic 

Yongyun Hu, Xiang Li, Shineng Hu, and Wenju Cai

 The El Niño–Southern Oscillation (ENSO), originating in the central and eastern equatorial Pacific, is a defining mode of interannual climate variability with profound impact on global climate and ecosystems. However, an understanding of how the ENSO might have evolved over geological timescales is still lacking, despite a well-accepted recognition that such an understanding has direct implications for constraining human-induced future ENSO changes. Here, using climate simulations, we show that ENSO has been a leading mode of tropical sea surface temperature (SST) variability in the past 250 My but with substantial variations in amplitude across geological periods. We show this result by performing and analyzing a series of coupled time-slice climate simulations forced by paleogeography, atmospheric CO2 concentrations, and solar radiation for the past 250 My, in 10-My intervals. The variations in ENSO amplitude across geological periods are little related to mean equatorial zonal SST gradient or global mean surface temperature of the respective periods but are primarily determined by interperiod difference in the background thermocline depth, according to a linear stability analysis. In addition, variations in atmospheric noise serve as an independent contributing factor to ENSO variations across intergeological periods. The two factors together explain about 76% of the interperiod variations in ENSO amplitude over the past 250 My. Our findings support the importance of changing ocean vertical thermal structure and atmospheric noise in influencing projected future ENSO change and its uncertainty.

How to cite: Hu, Y., Li, X., Hu, S., and Cai, W.: Persistently active El Niño–Southern Oscillation since the Mesozoic, EGU General Assembly 2025, Vienna, Austria, 27 Apr–2 May 2025, EGU25-4792, https://doi.org/10.5194/egusphere-egu25-4792, 2025.

EGU25-5667 | Orals | CL1.1.1

High-resolution records of the mid-Pleistocene Transition in pelagic sediments of the western Pacific 

Haifeng Wang, Liang Yi, Yong Yang, and Gaowen He

The Mid-Pleistocene Transition (MPT), which occurred approximately 1.25 to 0.85 million years ago, marks a critical geological period characterized by a shift in Earth's glacial cycles from a roughly 41 kyr periodicity to a 100 kyr periodicity. However, the stratigraphic framework is constrained by low sedimentation rates, the absence of high-resolution isotope stratigraphy, and low-resolution or absent biostratigraphic control. In this study, we examined four piston cores collected from the western-central Pacific to more accurately determine the geochronology of the surficial sediments in the deep sea. Through integrated magnetostratigraphy, a proposed chronology since the Pliocene was established, and astronomical tuning was also conducted in one of the four cores. In conjunction with XRF scanning, the geochemical properties were studied to reveal regional changes since the MPT. Our findings indicate the following paleoceanographic evolution: concurrent with global cooling and aridification in Asia, there has been an increase in wind and dust flux in the western Pacific, an enhancement in biological productivity, and a reduction in the degree of seabed redox post the MPT. Additionally, we also found that throughout the MPT (approximately 1.2 to 0.7 Ma), the deep-sea paleoceanographic environment of the Western Pacific has maintained relative stability.

How to cite: Wang, H., Yi, L., Yang, Y., and He, G.: High-resolution records of the mid-Pleistocene Transition in pelagic sediments of the western Pacific, EGU General Assembly 2025, Vienna, Austria, 27 Apr–2 May 2025, EGU25-5667, https://doi.org/10.5194/egusphere-egu25-5667, 2025.

EGU25-5818 | ECS | Orals | CL1.1.1

Late Paleozoic climate transition from a long-term climate modelling perspective  

Chloé Marcilly, Trond H. Torsvik, and Morgan T. Jones

The Late Paleozoic Ice Age (LPIA) represents Earth's longest icehouse period in the Phanerozoic and the only recorded greenhouse–icehouse–greenhouse cycle on a vegetated Earth. Sedimentary archives provide evidence of glaciation events, but the mechanisms driving the LPIA's onset (~330 Ma) and end (~260 Ma) remain debated. Here we investigate the climatic transitions associated with the LPIA using both non-dimensional (COPSE) and spatially resolved climate models, emphasizing the interplay between paleogeography, silicate weathering, and solid Earth degassing. By integrating new paleogeographic reconstructions constrained by fossil and lithological climatic paleo-indicators, we identify high-weatherability zones and assess their evolving influence on carbon fluxes. Additionally, the Variscan orogeny's role is examined to evaluate how physical erosion enhances chemical weathering and CO₂ drawdown.

Simulations highlight that maintaining icehouse conditions required not only a decrease in solid Earth degassing but also an enhancement in silicate weathering driven by the combined effects of increased topography and runoff. These processes amplified the consumption of CO2, supporting the initiation of a widespread glaciation. In contrast, the transition back to greenhouse conditions appears driven by a progressive decrease in exposed land for high intensity weathering. Climate sensitivity played a significant role in modulating these transitions, and model adjustments to this parameter improved alignment with CO₂ proxy data.

Our findings provide new insights into the interactions between tectonics, paleogeography, and biogeochemical processes in shaping Earth's climatic history. By leveraging geological evidence to refine long-term carbon cycle models, this work underscores the critical importance of accurately representing the paleogeography to understand ancient climate transitions and inform projections of future climate change.

How to cite: Marcilly, C., Torsvik, T. H., and Jones, M. T.: Late Paleozoic climate transition from a long-term climate modelling perspective , EGU General Assembly 2025, Vienna, Austria, 27 Apr–2 May 2025, EGU25-5818, https://doi.org/10.5194/egusphere-egu25-5818, 2025.

EGU25-5831 | Orals | CL1.1.1 | Highlight

Carbon-cycle modelling and Phanerozoic climate change 

Trond Torsvik, Dana Royer, Chloe Marcilly, and Stephanie Werner

Greenhouse gases trap heat in the Earth’s atmosphere and warm our planet and on geological time-scales CO2 is the most influential greenhouse gas in modulating atmospheric temperature. During most of the Phanerozoic (past 540 million years), our planet was warmer than today, and a greenhouse-dominated climate (80%) was only interrupted by three periods of cold glacial conditions during the end-Ordovician (Hirnantian) glaciation, the Permo-Carboniferous (~330-260 Ma) and the second half of the Cenozoic (34-0 Ma). Icehouses are characterized by lower CO2 concentrations and temperatures, and a modern CO2 threshold for continental-scale glacial inception is estimated to 500 ppm. But with a fainter sun, the glacial inception threshold during the Hirnantian (445 Ma) glaciation was probably closer to 1000 ppm.

CO2 concentrations cannot be measured in deep time, and we therefore must rely on proxies, or models. For the past 450 million years, CO2 proxies during greenhouse climates average ~1100 ppm whilst the Phanerozoic icehouse intervals average ~480 ppm. But a proxy-based picture of CO2 concentrations before 450 Ma is lacking and thus CO2 levels for most of Earth’s history must be estimated from carbon-cycle models. Models are also important for capturing the processes (sources and sinks) that can explain shifting greenhouse and icehouse climates and can loosely be classified as inverse or forward models, pending on whether isotopic proxy data are parametrized or predicted from the model, respectively. Both model types, however, incorporate several biological and geological/tectonic forcing parameters that should be similar in all models.

Carbon-cycle models predict very different atmospheric CO2 levels for large of the Phanerozoic, differing by more than 4000 ppm and model-proxy differences can exceed 5000 ppm. Many of the relatively large, modelled differences in atmospheric CO2 are arguable caused by differences in time-dependent parametrization of plate tectonic degassing and silicate weathering, and benchmarking of carbon-cycle models are urgently required. In this contribution we focus on carbon-cycle modelling with GEOCARB_NET — a user-friendly version of the GEOCARB model. In GEOCARB_NET input parameters can easily be changed, tested, and compared with other models (e.g., COPSE, SCION and GEOCLIM). The system also contains databases for CO2 proxies and temperatures that be visualized together with CO2 predictions. We highlight how key input parameters can seriously affect reconstructed CO2 levels but also how models and proxies can better be reconciled.

How to cite: Torsvik, T., Royer, D., Marcilly, C., and Werner, S.: Carbon-cycle modelling and Phanerozoic climate change, EGU General Assembly 2025, Vienna, Austria, 27 Apr–2 May 2025, EGU25-5831, https://doi.org/10.5194/egusphere-egu25-5831, 2025.

The Approximate Partial Radiative Perturbation (APRP) method is a powerful tool for investigating the effects of changes in cloud characteristics, driven by increased CO2 levels, on planetary albedo. The northern polar region is particularly sensitive to climate change. However, the summer temperature rise over the Arctic Ocean is relatively mild, and the mechanisms that suppress temperature increases are not fully understood.

We apply the APRP method to an ensemble of models participating in the Eocene Deep-Time Model Intercomparison Project (DeepMIP) and compare the effects of summer cloud feedback changes in the polar region to CO2 level increases from 1× pre-industrial (PI) level to 3/4× PI for both Eocene and modern conditions across the ensemble.

Our results reveal a wide range of results, both in magnitude and in sign (warming/cooling) of radiative changes, between models and even within the same models across different timeslices. Changes in cloud scattering are the primary contributors to the inter-model spread of cumulative APRP cloud effects. This spread is further amplified by differences in the sign of APRP cloud absorption effects.

In contrast, the models provide relatively consistent results for APRP cloud fraction effects, with most simulating modest positive feedback from cloud fraction changes due to CO2 increases. Nevertheless, the cumulative APRP cloud effects are minor compared to the net ocean-atmosphere energy flux changes over an ice-free Arctic Ocean. These fluxes might play a dominant role in inhibiting summer temperature increases in the polar region under elevated CO2 levels.

How to cite: Niezgodzki, I., Knorr, G., Lunt, D., and Lohmann, G.: Comparison of APRP cloud feedbacks to CO2 level rise on the summer Arctic climate across the Eocene Deep-Time Model Intercomparison Project ensemble, EGU General Assembly 2025, Vienna, Austria, 27 Apr–2 May 2025, EGU25-6251, https://doi.org/10.5194/egusphere-egu25-6251, 2025.

EGU25-6438 | ECS | Posters on site | CL1.1.1

The Eocene-Oligocene Transition in Central Anatolia: lake retreats and increased aridity 

Paul Botté, Alexis Licht, Leny Montheil, Anne-Lise Jourdan, François Demory, Mustafa Kaya, Faruk Ocakoğlu, Mehmet Serkan Akkiraz, Deniz İbilioğlu, Pauline Coster, Grégoire Métais, Benjamin Raynaud, and K. Christopher Beard

The Eocene-Oligocene Transition (EOT; ~34 Ma) is one of the most significant climate shifts of the Cenozoic era, representing the transition from the last warmhouse state to a coolhouse state. The EOT had a significant impact on terrestrial ecosystems and was synchronous with the "Grande Coupure", a major episode of faunal turnover in western Europe associated with the influx of multiple clades of Asian tetrapods. The impact of the EOT displays considerable regional variability in sedimentary records, and its role in the opening of dispersal corridors for the Grande Coupure remains unclear.

In this study, we use sedimentology, magnetostratigraphy, biostratigraphy, and U-Pb geochronology to date a section comprising the EOT in the Çiçekdağı Basin, in central Anatolia, a region that sits on Balkanatolia, a biogeographic province proposed as a secondary dispersal pathway for the Grande Coupure that remains largely understudied. We then analyze stable and clumped isotopes from pedogenic carbonates to investigate the local paleoenvironmental evolution through the EOT.

Our record captures a fluvio-lacustrine system spanning the Priabonian and the lower Rupelian, including the Oi-1 glaciation (~33.65Ma). Our sedimentological analyses reveal significant paleoenvironmental changes, including a major sedimentary unconformity in the latest Priabonian interpreted as a lake retreat related to a regional increase in aridity. This event also marks the onset of a long-term aridity trend in our stable isotope data. Furthermore, the stable and clumped isotopes analysis provide preliminary surface temperature estimates (Δ₄₇)discuss the implications of these paleoclimatic findings for understanding the environmental drivers behind faunal dispersals of the Grande Coupure.


Keywords: Paleogene, EOT, Pedogenic carbonates, Anatolia, Clumped isotopes, Stable isotopes, Dispersals.

How to cite: Botté, P., Licht, A., Montheil, L., Jourdan, A.-L., Demory, F., Kaya, M., Ocakoğlu, F., Akkiraz, M. S., İbilioğlu, D., Coster, P., Métais, G., Raynaud, B., and Beard, K. C.: The Eocene-Oligocene Transition in Central Anatolia: lake retreats and increased aridity, EGU General Assembly 2025, Vienna, Austria, 27 Apr–2 May 2025, EGU25-6438, https://doi.org/10.5194/egusphere-egu25-6438, 2025.

The surface productivity variations are still unclear through the Ordovician-Silurian crisis, which is belong to one of the “Big Five” extinction. Here, we present barium (Ba) concentration and isotope data from organic matter-enriched anoxic siliceous sediments of various facies (X sites from proximal to distal regions) during the OST from South China. Our data show that both raw Ba and ratios of Ba to aluminum (Ba/Al) are higher than that in numerous ancient black shales and modern high productivity area, document elevated Ba accumulations during this interval. Besides, a larger gradient (~ 1 ‰) of Ba isotope (138Ba) gradient between the shallow-water to deep-water sites, additional support higher marine productivity was the reason of the higher Ba burial in these sediments. These data provide evidence that elevated organic carbon fluxes from the surface ocean (other than redox conditions) was likely the main control on accumulation of these organic matter-enriched sediments, and thus provide the sources of “shale gas” during this interval.

How to cite: Shen, J.: The oceanic primary productivity variations during the Ordovician and Silurian transtion, EGU General Assembly 2025, Vienna, Austria, 27 Apr–2 May 2025, EGU25-7465, https://doi.org/10.5194/egusphere-egu25-7465, 2025.

The South China Craton experienced large changes in climate, eustasy and environmental conditions during the Late Ordovician Hirnantian Ice Age, but their impact on the watermass architecture of the Yangtze Sea has not yet been thoroughly evaluated. Here, we reconstruct the salinity-redox structure of the Yangtze Sea based on five Upper Ordovician-Lower Silurian shale successions representing a lateral transect from a deep-water area of the Inner Yangtze Sea (IYS; Shuanghe section) across the shallow Hunan-Hubei Arch (Pengye, Jiaoye and Qiliao sections) to the relatively deep-water Outer Yangtze Sea (OYS; Wangjiawan Section). Carbon isotope (13Corg) profiles show that the Guanyinqiao Bed (recording the peak Hirnantian glaciation) thins and is less completely preserved at sites on the flanks of the Hunan-Hubei Arch than in deeper water areas to the SW and NE, reflecting bathymetric influences. Watermass salinities were mainly marine at Shuanghe and brackish at the other four study sites, with little variation among Interval I (pre-glaciation), Interval II (Hirnantian glaciation) and Interval III (post-glaciation). Redox proxies document mainly euxinia at Shuanghe and Wangjiawan and suboxia at the other sites during Interval I, with shifts towards more reducing (mostly euxinic) conditions at most sites during Intervals II and III, which shows that all the study sections were deep enough to remain below the redoxcline during the glacio-eustatic lowstand. Two features of the Shuanghe section mark it as being unusual: it alone exhibits fully marine salinities implying greater proximity to the open ocean than the other four sites, and it exhibits an especially large shift towards more reducing conditions during Interval III (i.e. the post-Hirnantian transgression), implying greater water depths. These features are difficult to reconcile with the standard palaeogeographical model for the Ordovician-Silurian South China Craton, which is characterized by a geographically enclosed and restricted IYS and a more open OYS, arguing instead for the SW end of the IYS to have been connected to the global ocean and the OYS to have been a restricted oceanic cul-de-sac. A review of sedimentological and facies data for the IYS region suggests that our re-interpretation of the Ordovician-Silurian palaeogeography of the South China Craton is viable, although further vetting of this hypothesis is needed.

How to cite: Wang, X., Liu, Z., and Shen, J.: Watermass architecture of the Ordovician-Silurian Yangtze Sea (South China) and its palaeogeographical implications, EGU General Assembly 2025, Vienna, Austria, 27 Apr–2 May 2025, EGU25-7655, https://doi.org/10.5194/egusphere-egu25-7655, 2025.

EGU25-7762 | Orals | CL1.1.1

Carbon-Climate Coupling Dynamics Revealed by Decadal-Resolution Middle Miocene Records 

Yige Zhang, Daianne Starr, Qin Leng, Duo Chan, Jeffrey Sachnik, Jiaqi Liang, Hong Yang, Yangyang Xu, Bumsoo Kim, Ruoxia Shen, Ran Feng, and Ann Pearson

Contemporary global warming is known to lag behind the rapid increase in atmospheric CO2 levels. This delay, largely due to heat uptake and storage in the vast ocean interior, remains one of the key uncertainties in projecting climate change in future decades. Here, we present decadal-resolution paleoclimate reconstructions of atmospheric CO2 and temperature to evaluate the carbon-climate coupling dynamics over an approximately 700-year time window of the middle Miocene, 16 million years ago. The middle Miocene is characterized by perturbations in the global carbon cycle caused by volcanic degassing, and global warming of about 6ºC relative to today. By analyzing fossil leaves and lipid biomarkers from the annually-varved Clarkia Lake deposit in Idaho, USA, we establish concurrent and continuous CO2 and temperature records that capture short-term fluctuations superimposed on long-term warming and CO2 increasing trends. Statistical analysis shows that CO2 consistently lead temperature variation on a multi-decadal scale. Climate model emulators further confirm the role of ocean heat storage in shaping this delayed transient response. High temporal resolution reconstructions can provide constraints on Earth’s climate changes from a distant greenhouse world yet on societally relevant time scales, offering critical insights to improve our understanding of carbon-climate coupling dynamics. Such paleoclimate constraints are crucial for reducing uncertainties in projecting the near-term climate change under increasing CO2 levels.

How to cite: Zhang, Y., Starr, D., Leng, Q., Chan, D., Sachnik, J., Liang, J., Yang, H., Xu, Y., Kim, B., Shen, R., Feng, R., and Pearson, A.: Carbon-Climate Coupling Dynamics Revealed by Decadal-Resolution Middle Miocene Records, EGU General Assembly 2025, Vienna, Austria, 27 Apr–2 May 2025, EGU25-7762, https://doi.org/10.5194/egusphere-egu25-7762, 2025.

EGU25-7951 | Posters on site | CL1.1.1

Carbonate Compensation Depth and Carbonate Carbon Flux in the Indian Ocean over the Cenozoic  

Faranak Dalvand, Adriana Dutkiewicz, Nicky M. Wright, and R. Dietmar Müller

The Indian Ocean, a crucial component of the global thermohaline circulation with a carbonate saturation state intermediate between the Atlantic and Pacific oceans, plays a vital role in climate variability. It serves as a major sink for atmospheric carbon dioxide (CO₂), sequestering approximately 20% of the world's anthropogenic carbon. However, a major gap exists in understanding the deep carbon cycle of the Indian Ocean because the evolution of deep-sea carbonate carbon reservoirs, as a key contributor to the long-term global carbon cycle, remains unknown across this ocean over the Cenozoic. Here, we present new regional carbonate compensation depth (CCD) reconstructions incorporating dynamic topography and eustasy impacts to quantify the storage and fluxes of carbonate carbon to the Indian seafloor since the early Cenozoic. The CCD is defined as the water depth at which carbonate supply from the surface is balanced with its dissolution, leading to the absence of carbonate components below the CCD. Due to the complexity of carbonate distribution across the Indian Ocean, we model the Cenozoic CCD across six regions: western North Indian, western and eastern equatorial Indian, western and eastern South Indian, and the Indian sector of the Southern Ocean. Utilizing updated age models and backtracking with lithology-specific decompaction from 118 deep-sea drill sites (DSDP, ODP, and IODP expeditions), we compute the CCD through a linear reduced major-axis regression of the carbonate accumulation rate (CAR) versus paleo-water depth. The regression analysis is carried out in 0.5 My time intervals. Our results illustrate distinct CCD patterns across the Indian Ocean, fluctuating regionally by ~1.5–2.5 km over the Cenozoic. The western equatorial Indian shows a long-term deepening trend from ~2.7 km at 44 Ma to ~4.9 at present, while the eastern equatorial maintains a deep CCD fluctuating between ~4.2 km and ~4.8 km since 19 Ma. The relatively shallow CCD of the Indian sector of the Southern Ocean, between ~2–4 km since 43 Ma, experiences pronounced variability across the Indian Ocean, indicating significant oceanographic changes and the complexity of diverse factors influencing the carbonate system in this high-latitude region. The highly variable CCDs across the Indian Ocean result in substantial regional heterogeneity in carbonate carbon flux corresponding to distinct oceanography characteristics such as deep-water carbonate chemistry and gradients of carbonate rain rate. The regional CCD models for the Indian Ocean are utilized to estimate the evolution of deep-sea carbonate carbon reservoir across the entire Indian during the Cenozoic in the context of the long-term global carbon cycle.

How to cite: Dalvand, F., Dutkiewicz, A., Wright, N. M., and Müller, R. D.: Carbonate Compensation Depth and Carbonate Carbon Flux in the Indian Ocean over the Cenozoic , EGU General Assembly 2025, Vienna, Austria, 27 Apr–2 May 2025, EGU25-7951, https://doi.org/10.5194/egusphere-egu25-7951, 2025.

Two prominent forcing factors occurring during the Cenozoic are the Indian Asian collision and the atmospheric drawdown of carbon dioxide concentration from 4 to 1 PAL. Both of them have been intensively studied, but only a few studies were devoted to disantengling them and to explore their impact on the meridional ocean circulation. Indeed, there are some interactions between these two factors and other important features occurred during this period, especially concerning the geometry of straits (Tan et al., GRL 2022). In this study, we simulate, with a coupled GCM model (CESM version 1.0.5), the response to both of these factors with idealized boundary conditions. Using four long-lasting simulations with two different values of pCO2 (4 and 1 PAL) mixed with the presence or absence of TP, we demonstrate that the ocean heat transport in North Pacific and Atlantic ocean is differently impacted by the uplift of the TP. Such a response has been pointed out by Su et al., Climate of the Past 2018 and depicts a large increase of AMOC and decrease of PMOC from Eocene to present-day, but in this study, they only used a pCO2 of 1 PAL.

This last feature was a severe limitation to compare these simulations to data. Moreover, the sea-ice response played an important role, which would be undoubtedly reduced at a CO2 concentration of 4 PAL. In this new study, we disentangle the effect of the pCO2 decrease from 4 to 1 PAL and the uplift of the Tibetan Plateau. We pin-point the important result that, even with 4 PAL CO2, the Tibetan Plateau uplift led to major changes of the meridional ocean circulation, including pronounced differences in North Pacific and North Atlantic.

Moreover, our simulation with present-day TP and 1 PAL corresponding to the pre-industrial and the other extreme simulation, no TP and 4 PAL corresponding to the early Eocene, can be, therefore, compared to data, especially over the northern hemisphere, for which the Pacific and Atlantic ocean model response is largely different. Thanks to the availability of data over North Atlantic, it is possible to show that the simulated cooling is in agreement with these reconstructions using different marine proxies. In contrast, over North Pacific, not enough sea surface temperature reconstructions (SST) are yet available over 30°N to assess the SST cooling inferred by the simulation. (Hollis, GMD 2019 ;   Lunt et al., Climate of the Past 2021).

In summary, this study claims for more data in North Pacific during the early Eocene. More importantly, it pin-points the important role of the Tibetan Plateau uplift on building a modern circulation in North Atlantic.

How to cite: Ramstein, G., Su, B., Phan, C., and Tremblin, M.: Disentangling the role of two prominent climate forcing factors in the large decrease of temperatures since the Eocene : a pCO2 drawdown and the Tibetan Plateau uplift, EGU General Assembly 2025, Vienna, Austria, 27 Apr–2 May 2025, EGU25-8270, https://doi.org/10.5194/egusphere-egu25-8270, 2025.

The late Miocene was an important stage for the formation of modern-like ecological and environmental patterns. Proxy data from the middle to late Miocene reveal that large-scale cooling and drying occurred, however, the reasons for this climate transition remain unclear. Through a compilation of proxy data and climate simulations, our results indicate that atmospheric CO2 decline markedly decreased the temperature and reduced the precipitation in most of the land area, while the paleogeographic changes enhanced cooling at northern high latitudes and increased precipitation in East Asia, East Africa and South America. In comparison, vegetation changes accelerated cooling at northern high latitudes and modulated precipitation at low- and mid-latitude continents. This deepens the understanding of the mechanism of the late Miocene climate transition.

How to cite: Zhang, R.: The role of vegetation feedback during the late Miocene climate transition, EGU General Assembly 2025, Vienna, Austria, 27 Apr–2 May 2025, EGU25-8336, https://doi.org/10.5194/egusphere-egu25-8336, 2025.

EGU25-8497 | ECS | Posters on site | CL1.1.1

Input and output fluxes of surface CO2 throughout the lower Cenozoic 

Luca Castrogiovanni, Pietro Sternai, Claudia Pasquero, Nicola Piana Agostinetti, Bram Vaes, and Jack Longman

Long-term Cenozoic climate trends result from changes in the geological carbon cycle and associated surface input and output CO2 fluxes largely due to magmatic emissions and weathering of silicate minerals (Berner & Lasaga, 1989). Proxy records allow to detect absolute values of CO2 in different reservoirs to define major Cenozoic climatic events (e.g., PETM, EECO or MECO). However, interpreting the proxy-based time history of surface CO2 budget in terms of input and output CO2 fluxes is critical to assess the responsible processes behind the surface-deep carbon exchange and associated long term climate trends. Here, we use a newly developed technique (Castrogiovanni et al., 2024) based on a reversible-jump Markov chain Monte Carlo algorithm (rj-McMC) to invert the CO2 time series from the Proxy Integration Project (CENCO2PIP) (Hönisch et al., 2023) and obtain estimates of the surface input and output CO2 fluxes throughout the lower Cenozoic. We base the inversion on a general formulation of the geological carbon cycle and use the temperature time history from Hansen et al., 2023 as a further constraint to the inversion scheme. Results indicate a marked peak in the emission rate of CO2 at ˜56 Ma (PETM), enhanced CO2 emissions between 54-50 Ma (EECO) and at ˜40 Ma (MECO), whereas the output CO2 term associated to weathering responds to such variations of the input CO2 term. We conclude that magmatic CO2 emissions related to the closure of the Neo-Tethyan ocean and opening of the Nort-East Atlantic Ocean played a key role in driving lower Cenozoic climate trends.


References

Berner, R. A., & Lasaga, A. C. (1989). Modeling the Geochemical Carbon Cycle. 260(3), 74–81. https://doi.org/10.2307/24987179

Castrogiovanni, L., Sternai, P., Piana Agostinetti, N., & Pasquero, C. (2024). A reversible-jump Markov chain Monte Carlo algorithm to estimate paleo surface CO2 fluxes linking temperature to atmospheric CO2 concentration time series. Computers & Geosciences, 105838. https://doi.org/10.1016/J.CAGEO.2024.105838

Hansen, J. E., Sato, M., Simons, L., Nazarenko, L. S., Sangha, I., Kharecha, P., Zachos, J. C., von Schuckmann, K., Loeb, N. G., Osman, M. B., Jin, Q., Tselioudis, G., Jeong, E., Lacis, A., Ruedy, R., Russell, G., Cao, J., & Li, J. (2023). Global warming in the pipeline. Oxford Open Climate Change, 3 (1). https://doi.org/10.1093/OXFCLM/KGAD008

Hönisch, B., Royer, D. L., Breecker, D. O., Polissar, P. J., Bowen, G. J., Henehan, M. J., Cui, Y., Steinthorsdottir, M., McElwain, J. C., Kohn, M. J., Pearson, A., Phelps, S. R., Uno, K. T., Ridgwell, A., Anagnostou, E., Austermann, J., Badger, M. P. S., Barclay, R. S., Bijl, P. K., … Zhang, L. (2023). Toward a Cenozoic history of atmospheric CO2. Science, 382 (6675). https://doi.org/10.1126/SCIENCE.ADI5177/SUPPL_FILE/SCIENCE.ADI5177_SM.PDF


How to cite: Castrogiovanni, L., Sternai, P., Pasquero, C., Piana Agostinetti, N., Vaes, B., and Longman, J.: Input and output fluxes of surface CO2 throughout the lower Cenozoic, EGU General Assembly 2025, Vienna, Austria, 27 Apr–2 May 2025, EGU25-8497, https://doi.org/10.5194/egusphere-egu25-8497, 2025.

EGU25-10515 | Orals | CL1.1.1

Spatial patterns and mechanisms of the temperature response in East Asia to mid-Piacenzian warming 

Haibin Wu, Lixin Chen, Yong Sun, Wenchao Zhang, Yanyan Yu, and Chunxia Zhang

The mid-Piacenzian (3.264–3.025 Ma) is regarded as being the most recent warm period with atmospheric CO2 levels comparable to those of the present-day, thus reconstruction of corresponding climate change provides a good reference for our understanding the current and future global warming. In this study, we undertook climate reconstructions for East Asia using the modern analogue technique, based on fossil pollen records. The results show significant spatial variations in paleoclimate, with a warmer zone in the northwest and a colder zone in the eastern monsoonal regional. To better understand the data–model discrepancies, particularly with respect to the overall warming trend indicated by the simulations, we decomposed the physical processes in the simulation based on the surface energy budget equation. Our findings suggest that the cooling effects of cloud radiative forcing, non-surface albedo feedbacks induced by clear-sky shortwave radiation, and latent heat flux contributed to the cooling trend in the eastern zone. In contrast, the warming observed in the northwestern zone was driven primarily by increased clear-sky downward longwave radiation. These results highlight the complex responses of different regions to climatic change and the key role of cloud and radiation processes in controlling regional climate.

How to cite: Wu, H., Chen, L., Sun, Y., Zhang, W., Yu, Y., and Zhang, C.: Spatial patterns and mechanisms of the temperature response in East Asia to mid-Piacenzian warming, EGU General Assembly 2025, Vienna, Austria, 27 Apr–2 May 2025, EGU25-10515, https://doi.org/10.5194/egusphere-egu25-10515, 2025.

EGU25-11732 | ECS | Orals | CL1.1.1

The effect of land distribution on Neo-Archean atmospheric circulation and surface climate 

Anya Taylor, Stephen Thomson, Sophie-Berenice Wilmes, Nathan Mayne, and Mattias Green

The continental distribution and surface conditions of a planet strongly impact its climate. Continents on Earth are believed to have emerged above sea level in the Archean Eon, although the exact timing and emerged surface area are widely debated. We use the Isca climate model, a framework for the modelling of idealised planetary atmospheres, to explore the climatic impact of various land-ocean configurations on a 2.7 Ga Archean Earth. We find that the addition of land consistently produces a global cooling and introduces hemispheric asymmetry to the large-scale atmospheric circulation and equator-to-pole temperature gradient. The magnitude of the climate response increases with overall land fraction, while the degree of hemispheric asymmetry is more sensitive to the difference in land fraction between hemispheres. These effects are driven by changes in the surface energy balance, which are caused by the distribution of land and associated changes in albedo and the availability of water for evaporation. These results are comparable to similar work on tidally-locked exoplanets, and further highlight the importance of including land in climate simulations for Archean Earth and Earth-like exoplanets, particularly if the goal is an assessment of a planet’s habitability.

How to cite: Taylor, A., Thomson, S., Wilmes, S.-B., Mayne, N., and Green, M.: The effect of land distribution on Neo-Archean atmospheric circulation and surface climate, EGU General Assembly 2025, Vienna, Austria, 27 Apr–2 May 2025, EGU25-11732, https://doi.org/10.5194/egusphere-egu25-11732, 2025.

EGU25-13232 | ECS | Orals | CL1.1.1

Lipid biomarker chemostratigraphy in Arctic Canada: Evaluating microbiology ecology and carbon cycling during Hirnantian cooling 

Nathan Marshall, Chris Holmden, Michael Melchin, and Gordon Love

The Late Ordovician Mass Extinction (LOME) event is one of the most well-known climatic and environmental transition events in the Phanerozoic Eon. The Hirnantian glaciation and associated cooling during the latest Ordovician is widely considered to be the key driver for the major mass extinction event as well as changes in the climate and oceanographic systems1. Evidence from sedimentological, faunal, and geochemical data from around the globe has demonstrated that the transition from pre-glacial, to glacial, and post-glacial times was associated changes in carbon cycling, a large drop in eustatic sea level, and a series of extinction pulses2. The extinction patterns of marine fauna and perturbations to the carbon cycle have been well documented. However, the effects on the microbial communities that underpin marine food webs and mediate essential biogeochemical cycles are poorly constrained. New pristine outcrop samples have provided an opportunity for a detailed microbial lipid biomarker and stable isotope investigation on a succession that spans the Late Ordovician (Katian Stage) to Early Silurian (Rhudanian stage) time interval3. Here, we investigate how the significant environmental changes associated with the LOME and HICE affected the microbial communities.

Lipid biomarker and stable isotope (δ13Corganic, δ13Ccarbonate, δ15Ntotal) stratigraphic records were acquired from a 10-m interval of outcrop section from Cornwallis Island, Nunavut, Canada. Rock extracts were analyzed for a suite of branched and polycyclic hydrocarbon biomarkers utilizing the sensitivity and selectivity of Metastable Reaction Monitoring-Gas Chromatography-Mass Spectrometry (MRM-GC-MS). Baseline conditions, prior to the HICE, exhibit typical Ordovician marine biomarker characteristics which have been observed from various lithologies and different Ordovician marine depositional settings. These characteristics include low hopane/sterane (H/St) ratios, high relative abundance of C29 steranes from green algae, and high abundances of 3-methylhopanes (many times the Phanerozoic average), likely sourced from methanotrophic bacteria4. The rising and falling limbs of the HICE locally at our site are associated with a significant increase in total organic carbon (TOC) content (<9.5 wt.%) and are concomitant with an increase in the absolute abundances of regular steranes from marine algae. The observed jump in algal productivity and increased TOC content coincides with facies and biofacies indicators of a brief rise and then fall of global sea level documented in number of other sections, globally. By contrast, the biomarkers in the peak interval of the HICE locally, is associated with bacterial dominated productivity in an oligotrophic marine setting as indicated by high H/St ratios and low TOC content (≥0.3 wt.%). Low TOC content is a hallmark of the sea level low stand interval in many other sections, globally. These findings support and advance findings from earlier studies that Hirnantian climate and oceanographic changes caused major structural changes to marine food webs, particularly in low latitude regions where most of the graptolite extinctions have been documented.

1Finnegan, S. et al. Science (2011)

2Finnegan, S. et al. PNAS (2012)

3Melchin, M. J. & Holmden, C. Palaeogeography, Palaeoclimatology, Palaeoecology (2006)

4Rohrssen, M. et al. Geology (2013)

How to cite: Marshall, N., Holmden, C., Melchin, M., and Love, G.: Lipid biomarker chemostratigraphy in Arctic Canada: Evaluating microbiology ecology and carbon cycling during Hirnantian cooling, EGU General Assembly 2025, Vienna, Austria, 27 Apr–2 May 2025, EGU25-13232, https://doi.org/10.5194/egusphere-egu25-13232, 2025.

EGU25-13510 | ECS | Orals | CL1.1.1

Vegetation response to varying CO2 conditions during the Mid-Pliocene Warm Period. 

Elke Zeller, Sophia Macarewich, Jed O. Kaplan, Anta-Clarisse Sarr, Feng Zhu, Jiang Zhu, Bette Otto-Bliesner, Maya E. Tessler, Dan Amrhein, Jane W. Baldwin, Dervla Meegan-Kumar, Christopher J. Poulsen, and Jessica E. Tierney

The Mid-Pliocene Warm Period (mPWP) provides a valuable analog for near-future climate warming with an estimated global mean temperature  2.5–4°C higher than today and atmospheric CO₂ concentrations ranging from 360 to 420 ppm. Vegetation changes during the mPWP were significant, playing a crucial role in the climate through feedback mechanisms. Studying the climate-vegetation interactions provides insights into their strength, temporal dynamics, and their role in extreme events. We plan to investigate these interactions by examining vegetation changes under various climate scenarios, including distinct vegetation configurations. As a first step in this research, we will develop a set of vegetation scenarios from exploratory model runs which will then be used as boundary conditions in future runs—in combination with other varying conditions such as varying GHG levels, paleogeography, orbital configurations, and aerosol emissions— to incorporate vegetation dynamics in the mPWP experiments.

Here, we present preliminary results regarding the changes in spatial coverage of different vegetation during mPWP scenario runs and our proposed vegetation scenarios. The vegetation scenarios are developed from mPWP simulations with varying atmospheric CO₂ concentrations of 350 ppm, 400 ppm, and 490 ppm. These simulations were performed with the Community Earth System Model version 1.2, a fully coupled climate model, and Biome4, an offline equilibrium vegetation model. We will show the responses of paleo vegetation to climates under different CO₂ levels and quantify the stability of vegetation around the globe within the different scenarios. Based on these results, we will propose a set of vegetation scenarios for use in future studies.

How to cite: Zeller, E., Macarewich, S., Kaplan, J. O., Sarr, A.-C., Zhu, F., Zhu, J., Otto-Bliesner, B., Tessler, M. E., Amrhein, D., Baldwin, J. W., Meegan-Kumar, D., Poulsen, C. J., and Tierney, J. E.: Vegetation response to varying CO2 conditions during the Mid-Pliocene Warm Period., EGU General Assembly 2025, Vienna, Austria, 27 Apr–2 May 2025, EGU25-13510, https://doi.org/10.5194/egusphere-egu25-13510, 2025.

EGU25-14215 | ECS | Posters on site | CL1.1.1

Enhanced acidification of intermediate water in the South China Sea during the Pliocene-Pleistocene transition 

Man Zhao, Jiantao Cao, and Guodong Jia

Ocean interior acidification is predicted to exacerbate in the future due to persistent emissions of anthropogenic carbon dioxide (CO₂), which may excert disastrous impact on marine ecosystems. However, whether this trend is ubiquitous in the global oceans is not well understood. In this study, we reconstruct the pH changes of intermediate water in the northern South China Sea (SCS) since the Pliocene using bacterial branched glycerol dialkyl glycerol tetraethers. The results indicate a significant decline in pH during the Pliocene-Pleistocene transition, when atmospheric CO₂ was decreasing and thus not conductive to pH drop. We examined the controlling factors and found that weakened vertical mixing between intermediate and deep waters during this period played a crucial role in the decrease of intermediate water pH, rather than the influence by changes in atmospheric CO₂. Our findings highlight the effect of stratification of the ocean interior on the balance of the carbonate system in the SCS, which has been overlooked in modern observations and projections.

How to cite: Zhao, M., Cao, J., and Jia, G.: Enhanced acidification of intermediate water in the South China Sea during the Pliocene-Pleistocene transition, EGU General Assembly 2025, Vienna, Austria, 27 Apr–2 May 2025, EGU25-14215, https://doi.org/10.5194/egusphere-egu25-14215, 2025.

EGU25-14249 | ECS | Orals | CL1.1.1

The origin of the modern-like East Asian Monsoon: insights from new data synthesis and climate modelling 

Zhilin He, Zhongshi Zhang, Zhengtang Guo, Ning Tan, Zijian Zhang, Chunxia Zhang, Haibin Wu, and Chenglong Deng

It is debated as to whether the modern-like East Asian monsoon formed during the late Oligocene–early Miocene or the Eocene. To resolve this dispute requires a comprehensive and updated synthesis of the available geological records and a reliable modelling study. Here, we investigate Cenozoic climate patterns over East Asia by compiling geological records and conducting climate modelling for key geological periods based on our improved paleogeographies. Geological records suggest that a zonal (semi-)arid climate pattern was dominant over tectonic timescales during most of the Paleogene in large areas of East Asia, with marked fluctuations between dry and wet conditions over orbital timescales, and a modern-like monsoon-dominated climate pattern has formed since the late Oligocene–early Miocene (ca. 28–22 Ma). Our simulations show that a zonal dry belt extended across East Asia during the late Eocene, and a monsoon-dominated pattern had already formed over East Asia by the early Miocene. In addition, our simulations further indicate a strong sensitivity of East Asian rainfall to orbital forcing, which can explain the seemingly unstable character (i.e., wet–dry fluctuations) of the dry belt across East Asia during the Eocene. Furthermore, our results suggest that paleogeographic changes, particularly uplift of the Tibetan Plateau to moderate–high elevations and its paleolatitude approaching present-day location during the late Oligocene–early Miocene, rather than atmospheric CO2 levels, played a crucial role in the establishment of the modern-like East Asian monsoon.

How to cite: He, Z., Zhang, Z., Guo, Z., Tan, N., Zhang, Z., Zhang, C., Wu, H., and Deng, C.: The origin of the modern-like East Asian Monsoon: insights from new data synthesis and climate modelling, EGU General Assembly 2025, Vienna, Austria, 27 Apr–2 May 2025, EGU25-14249, https://doi.org/10.5194/egusphere-egu25-14249, 2025.

EGU25-14653 | ECS | Orals | CL1.1.1

Continental Rigidity in the Tropics Shapes Earth’s Climate state 

Feng Cheng, Andrew Zuza, Zhangjun Li, Yiduo Liu, Marc Jolivet, Zhaojie Guo, and Wenjiao Xiao

Global pCO₂ levels have fluctuated significantly throughout the Phanerozoic, closely aligning with Earth’s warm, ice-free periods and cold, glacial climates. However, the extent to which these variations in pCO₂ are linked to weathering processes remains a topic of active debate. In this study, we quantify the effective elastic thickness of all major modern terrains and reconstruct their paleogeographic positions over the past 250 million years. We then estimate the weighted average continental effective elastic thickness within the tropics (e.g., within 10°, 15°, and 20° of the equator) and compare these values to global pCO₂ levels over time. Our analysis reveals a strong positive correlation between global pCO₂ levels and the weighted average continental effective elastic thickness in the tropics. We propose that variations in the mechanical strength of continents at low latitudes are linked to transitions between cold and warm climatic states. Specifically, when non-rigid continents drift into tropical regions, weakened and deformed rocks become more susceptible to exhumation and erosion in the warm, wet tropics, thereby enhancing Earth’s capacity for carbon sequestration through chemical weathering. Conversely, when rigid continents dominate the tropics, exhumation and erosion are inhibited, leading to relatively high atmospheric pCO₂ levels. If validated, we apply this correlation between continental rigidity and global pCO₂ to project future pCO₂ levels based on the assembly of the next supercontinent. Our findings suggest that, excluding human influence, global pCO₂ levels could increase fivefold over the next 250 million years. This underscores the critical role of continental strength, beyond just lithology or rock composition, in the tropics in driving physical and chemical weathering processes that shape Earth's climate state.

How to cite: Cheng, F., Zuza, A., Li, Z., Liu, Y., Jolivet, M., Guo, Z., and Xiao, W.: Continental Rigidity in the Tropics Shapes Earth’s Climate state, EGU General Assembly 2025, Vienna, Austria, 27 Apr–2 May 2025, EGU25-14653, https://doi.org/10.5194/egusphere-egu25-14653, 2025.

EGU25-15065 | ECS | Orals | CL1.1.1

Loss of vegetation-mediated carbon sequestration during the Paleocene-Eocene Thermal Maximum 

Julian Rogger, Vera Korasidis, Gabriel Bowen, Christine Shields, Taras Gerya, and Loïc Pellissier

The Paleocene-Eocene Thermal Maximum (PETM) around 56 million years ago was a 5-6°C global warming event, representing one of the most important geologic analogues to present-day climate change. Considering that the carbon release rate that triggered the PETM was likely around a magnitude lower than current anthropogenic carbon emissions, it is of major importance to identify the climatic, geologic and biological factors that drove the severity and 200 kyr long duration of the PETM hyperthermal. Based on carbon isotope records of the period, it was suggested that a loss and a 70-100 kyr lagged regrowth of biospheric organic carbon stocks may have contributed to the long duration of the carbon cycle perturbation. In this work, we aim to identify the biological mechanisms that could explain such a sustained loss of vegetation-mediated carbon sequestration on land, and whether these dynamics can be expected under current anthropogenic carbon release. We developed a new, eco-evolutionary vegetation model, grounded in principles of eco-evolutionary optimality, to simulate changes in vegetation structures and traits, organic carbon sequestration and vegetation-mediated silicate weathering enhancement throughout the PETM climatic excursion. By comparing modelled vegetation dynamics with vegetation reconstructions derived from palynofloral records, we show that the PETM warming may have exceeded the capacity of vegetation systems to respond to the environmental changes through evolutionary adaptation of functional traits and climatic tolerances, resulting in reduced fitness and functioning. The magnitude of the warming and the creation of previously non-existent climatic environments during the period further resulted in a limited capacity of plants to avoid the warming-induced stress through dispersal and migration. Our results show that a global warming of similar magnitude as during the PETM could result in a long-lasting loss of vegetation-mediated carbon sequestration and a reduction in the efficiency of the Earth system to regulate perturbations.

How to cite: Rogger, J., Korasidis, V., Bowen, G., Shields, C., Gerya, T., and Pellissier, L.: Loss of vegetation-mediated carbon sequestration during the Paleocene-Eocene Thermal Maximum, EGU General Assembly 2025, Vienna, Austria, 27 Apr–2 May 2025, EGU25-15065, https://doi.org/10.5194/egusphere-egu25-15065, 2025.

EGU25-15107 | Orals | CL1.1.1

Late Ordovician and early Silurian warming sustained by enhanced clay formation  

Yanfang Li, Hui Tian, He Sun, Peng Cheng, Tengfei Li, and Haitao Gao

The Ordovician–Silurian transition (O-S) was a period of dramatic climatic, environmental, and biological changes marked by severe mass extinction, glaciation, intense volcanism, marine anoxia, and widespread deposition of organic-rich shale. Silicate weathering has been proposed as a potential driver for the extreme climate change and invoked as a driver for marine anoxia during this time. However, the changes in chemical weathering across O-S transition are poorly constrained. Here, we present high-resolution Li isotope (δ7Li) records of marine shales from South China, spanning the Upper Ordovician to Lower Silurian to track changes in continental weathering across the O-S transition. We find significant positive δ7Li excursions in the Late Ordovician (Katian stage) and early Silurian (Rhuddanian stage), reflecting a shift to incongruent weathering, associated with secondary clay formation. Clay formation can retain cations on the continents, resulting in inefficient atmospheric CO2 consumption through silicate weathering. We therefore propose that enhanced clay formation may have sustained the long-term greenhouse conditions during Early Silurian, although volcanic degassing may have acted as a trigger. The greenhouse conditions would have reduced the thermohaline circulation and oxygen solubility, facilitating the development of prolonged anoxia throughout the Early Silurian and delayed the biotic recovery of marine ecosystems during this period. Marina anoxia could enhance the burial of huge amounts of organic matter in the sedimentary record as globally distributed organic-rich black shales, which ultimately caused the drawdown of atmospheric CO2 and allowed the climate recovery.

How to cite: Li, Y., Tian, H., Sun, H., Cheng, P., Li, T., and Gao, H.: Late Ordovician and early Silurian warming sustained by enhanced clay formation , EGU General Assembly 2025, Vienna, Austria, 27 Apr–2 May 2025, EGU25-15107, https://doi.org/10.5194/egusphere-egu25-15107, 2025.

During the Ordovician-Silurian boundary interval, the Hirnantian Glaciation and the first major biodiversity crisis of the Phanerozoic, the Late Ordovician Mass Extinction (LOME), occurred. As one of the Phanerozoic “Big Five” extinction events, LOME is widely regarded as being closely linked to environmental changes such as anoxia induced by the Hirnantian Glaciation. However, due to the lack of high temporal resolution data in most previous studies, evolutionary patterns of different clades remain unclear. Trilobites, one of the most diverse clades during the Paleozoic, suffered catastrophic losses during this event, never recovering to the same level of dominance in the marine ecosystem and ultimately disappearing during the end-Permian Mass Extinction. Although previous studies (stage- or biozone-level, generally ~1-3 Myr) based on individual or limited number of stratigraphic sections suggested marine anoxia as the driver of benthic extinctions or the main cause of biodiversity decline, the vast morphological and occurrence data of trilobites have not been fully utilized to depict the morphological evolution of marine life due to technical constraints, hindering our understanding of the evolutionary history of life during this critical interval.

Here we compiled global trilobite fossil records and morphological descriptions spanning LOME from literature. Using the newly developed quantitative stratigraphic method, HORSE, we analyzed tens of thousands of fossil records to generate a global high-resolution trilobite diversity curve (~25 kyr as imputed temporal resolution) which has never been achieved before. The manual, labor-intensive annotation hindered the development of image-based large-scale annotated fossil datasets, thereby limiting large-scale morphological data analysis. However, high-dimensional embeddings extracted from morphological descriptions with large language models (LLMs) quantified global trilobite morphological similarities and allowed the generation of a high-resolution morphological disparity curve. Comparison between these two curves revealed that, while severe biodiversity losses are a defining feature of mass extinction events, its impacts on morphological disparity are more complicated. Although greater morphological disparity typically indicates higher ecological or functional diversity, the coupled diversity and disparity dynamics during the glaciation could be explained by either the intensity of extinctions or strong internal constraints. This study aims to reveal in significant detail the connections between marine biodiversity changes and morphological evolution during the Hirnantian Glaciation and LOME, as well as the relationships between these biotic changes and abiotic factors, thereby enhancing our understanding of the patterns and underlying mechanisms of the Late Ordovician Mass Extinction.

How to cite: Shen, H., Chu, T., and Fan, J.: AI-Powered Analysis of Global Trilobite Diversity and Morphology During the Late Ordovician Mass Extinction, EGU General Assembly 2025, Vienna, Austria, 27 Apr–2 May 2025, EGU25-15140, https://doi.org/10.5194/egusphere-egu25-15140, 2025.

EGU25-16029 | ECS | Orals | CL1.1.1

Impact of marine gateways on oceanic circulation and carbon cycle in the Late Eocene 

Emma Fabre, Jean-Baptiste Ladant, Pierre Sepulchre, and Yannick Donnadieu

The Late Eocene is a period of global cooling and high-latitude tectonic changes culminating in the Eocene Oligocene Transition (34 Ma ago), one of the major climatic shifts of the Cenozoic. Across the Late Eocene, the Earth went from a largely ice-free greenhouse during the early Eocene climatic optimum to an icehouse with the ice sheet inception over Antarctica. This long-term cooling happened simultaneously with a decrease in the atmospheric content in carbon dioxide whose causes are still unclear. During the same period, marine gateways surrounding Antarctica (Drake Passage and Tasman Gateway) opened and deepened and Atlantic-Artic gateways changed configurations, thereby allowing the onset of oceanic currents such as the circumpolar current isolating Antarctica.

Here, we investigate how coupled changes in the configuration of these gateways impact the oceanic circulation and carbon cycle, in particular the distribution of δ13C. Applying for the first time the carbon isotopes-enabled version of PISCES (Buchanan et al. 2021) to the Late Eocene,  we present and analyze a set of experiments with different gateways configurations with a specific focus on the reorganization of ocean circulation and its consequence on carbon isotopes distribution and gradients. We then compare our model results to available proxy data and discuss hypotheses regarding Late Eocene δ13C changes.

How to cite: Fabre, E., Ladant, J.-B., Sepulchre, P., and Donnadieu, Y.: Impact of marine gateways on oceanic circulation and carbon cycle in the Late Eocene, EGU General Assembly 2025, Vienna, Austria, 27 Apr–2 May 2025, EGU25-16029, https://doi.org/10.5194/egusphere-egu25-16029, 2025.

EGU25-16077 | ECS | Orals | CL1.1.1

The impact of paleogeographic boundary conditions on early Cenozoic climate simulations 

Bram Vaes, Pietro Sternai, Alexis Licht, Pierre Maffre, Thomas Chalk, Erwan Pineau, and Yannick Donnadieu

Studying warm climates of the geological past is essential to improving our understanding of the Earth’s climate and carbon cycle under elevated atmospheric CO2 levels. A major challenge in simulating past climates lies in the accurate reconstruction of the paleogeography ­– the spatial distribution of land, mountains, oceans, and their bathymetry. However, the impact of paleogeography and its uncertainty on modelled paleoclimates and model-data misfits is poorly quantified. Here, we quantify the impact of paleogeographic boundary conditions on the simulation of early Cenozoic climates (66 to 34 million years ago) using the IPSL-CM5A2 Earth System Model. We performed a series of paleoclimate simulations for key time slices, such as the early and middle Eocene climatic optima (EECO and MECO), using the most recent paleogeographic reconstructions and with varying atmospheric CO2 concentrations. We tested alternative paleogeographic scenarios, with particular focus on the different reconstructions of the Neo-Tethyan region and the India-Asia collision. In addition, we evaluate the impact of using different global reference frames, including the latest paleomagnetic reference frame of Vaes et al. (2023, Earth-Science Reviews). We show that the choice of reference frame and paleogeographic reconstruction can significantly impact global ocean circulation as well as regional temperature and precipitation patterns. To assess how paleogeography affects model-data comparisons, we compared model predictions against available paleoclimate proxy records. We find that changes in paleogeographic boundary conditions lead to notable differences in the reconstructed position of proxy sites. This may affect interpretations of past climates based on proxy records, such as reconstructions of latitudinal temperature gradients or climate sensitivity calculations. Our findings highlight the importance of paleogeography for paleoclimate modelling, and we discuss how future improvement of paleogeographic reconstructions may contribute to advancing our understanding of past climates and the carbon cycle.

How to cite: Vaes, B., Sternai, P., Licht, A., Maffre, P., Chalk, T., Pineau, E., and Donnadieu, Y.: The impact of paleogeographic boundary conditions on early Cenozoic climate simulations, EGU General Assembly 2025, Vienna, Austria, 27 Apr–2 May 2025, EGU25-16077, https://doi.org/10.5194/egusphere-egu25-16077, 2025.

EGU25-16102 | ECS | Posters on site | CL1.1.1

80-Million-Year Atmospheric CO2 Record from the Late Palaeozoic Ice Age 

Hana Jurikova, Claudio Garbelli, Ross Whiteford, Theodore Reeves, Gemma Laker, Volker Liebetrau, Marcus Gutjahr, Anton Eisenhauer, Kotryna Savickaite, Melanie Leng, Dawid Adam Iurino, Marco Viaretti, Adam Tomašových, Yuchen Zhang, Wen-qian Wang, Guang Rong Shi, Shu-zhong Shen, James Rae, and Lucia Angiolini

Atmospheric CO2 is thought to play a fundamental role in Earth’s climate regulation. Yet, for much of Earth’s deep geological past, atmospheric CO2 has been poorly constrained, hindering our understanding of transitions between cool and warm climates. Beginning ~370 million years ago in the Late Devonian and ending ~260 million years ago in the Permian, the Late Palaeozoic Ice Age was the last major glaciation preceding the current Late Cenozoic Ice Age and possibly the most intense glaciation witnessed by complex lifeforms. From the onset of the main phase of the Late Palaeozoic Ice Age in the mid-Mississippian ~330 million years ago, the Earth is thought to have sustained glacial conditions, with continental ice accumulating in high to mid-latitudes. However, open questions remain about the role of CO2 and nature of Earth’s climate during the onset and demise of glacial conditions.

This presentation will showcase an 80-million-year-long boron isotope record within a proxy framework for robust quantification of CO2, paired with new strontium, carbon and oxygen isotope records. Our records reveal that the main phase of the Late Palaeozoic Ice Age glaciation was maintained by prolonged low CO2, unprecedented in Earth’s history. About 294 million years ago, atmospheric CO2 rose abruptly (4-fold), releasing the Earth from its penultimate ice age and transforming the Early Permian into a warmer world. Our findings demonstrate the central role of CO2 in driving Earth’ geological climatic and environmental transitions [1].

[1] Jurikova H., Garbelli C., Whiteford R., Reeves T., Laker G.M., Liebetrau V., Gutjahr M., Eisenhauer A., Savickaite K., Leng M.J., Iurino D.A., Viaretti M., Tomašových A., Zhang Y., Wang W., Shi G.R., Shen S., Rae J.W.B., Angiolini L. (2025) Rapid rise in atmospheric CO2 marked the end of the Late Palaeozoic Ice Age. Nature Geosci., https://doi.org/10.1038/s41561-024-01610-2.

How to cite: Jurikova, H., Garbelli, C., Whiteford, R., Reeves, T., Laker, G., Liebetrau, V., Gutjahr, M., Eisenhauer, A., Savickaite, K., Leng, M., Iurino, D. A., Viaretti, M., Tomašových, A., Zhang, Y., Wang, W., Shi, G. R., Shen, S., Rae, J., and Angiolini, L.: 80-Million-Year Atmospheric CO2 Record from the Late Palaeozoic Ice Age, EGU General Assembly 2025, Vienna, Austria, 27 Apr–2 May 2025, EGU25-16102, https://doi.org/10.5194/egusphere-egu25-16102, 2025.

EGU25-16228 | ECS | Orals | CL1.1.1

Global vegetation of the warm Early Eocene: insights from a model - data comparison 

Julia Brugger, Nick Thompson, Ulrich Salzmann, Torsten Utescher, Matthew Forrest, Daniel J. Lunt, Kira Rehfeld, and Thomas Hickler

The Early Eocene, with CO2 levels exceeding 800 ppm, is a well-suited period for studying the effects of elevated atmospheric CO2 concentrations on climate, vegetation and their interplay. Here, we present insights from a model – data comparison using simulations with a dynamic global vegetation model (LPJ-GUESS) and a comprehensive global paleobotanical data set. The vegetation model is driven by climate input from four climate models of the Deep-Time Model Intercomparison Project Phase 1 (DeepMIP 1) under varying CO2 concentrations. Using climate input from two models with CO2 concentrations between three to six times pre-industrial CO2, we successfully replicate the extension of tropical, sub-tropical and temperate forests into higher latitudes, consistent with the paleobotanical record. Notably, tropical forest extent as suggested by paleobotanical data is also captured at CO2 concentrations exceeding four times pre-industrial CO2, contrasting with previous modeling results. However, input from the other two climate models produce excessively dry conditions in subtropical regions, misaligning with the paleobotanical evidence. Our vegetation distribution results will inform the next phase of the DeepMIP (DeepMIP 2). In addition, our comparison provides insights into the performance of climate and vegetation models under high CO2 concentrations, with implications for simulating future climate change and its impacts.

How to cite: Brugger, J., Thompson, N., Salzmann, U., Utescher, T., Forrest, M., Lunt, D. J., Rehfeld, K., and Hickler, T.: Global vegetation of the warm Early Eocene: insights from a model - data comparison, EGU General Assembly 2025, Vienna, Austria, 27 Apr–2 May 2025, EGU25-16228, https://doi.org/10.5194/egusphere-egu25-16228, 2025.

EGU25-16652 | ECS | Posters on site | CL1.1.1

Quantifying net carbon cycle feedbacks across the Paleocene-Eocene Thermal Maximum 

Pam Vervoort, Daniel Doherty, Sarah E. Greene, Stephen M. Jones, Tom Dunkley Jones, Daniel Gaskell, and Andy Ridgwell

The Paleocene-Eocene Thermal Maximum (PETM, 56 Ma) is perhaps the most extensively studied paleoclimate event of massive carbon release because the intense global warming and widespread ocean acidification bear resemblance to the predicted worst-case near-future Earth conditions. While emission rate and carbon source were different from today’s perturbation, valuable lessons can be learned from studying the PETM. For instance, whether climate or carbon cycle feedbacks amplify or mitigate the environmental disruption, and what feedback processes contributed to the global climate response. In this study, we quantify the magnitude and sign of ‘net’ carbon cycle feedbacks by integrating: (1) estimates of volcanic carbon emissions from the North Atlantic Igneous Province (active ~56 Ma and considered a major source of carbon release), and (2) the net global environmental response recorded in paleoclimate records such as δ18O (temperature), δ11B (ocean pH), and δ13C (carbon cycle). The difference between the environmental response to volcanic emissions alone and the recorded global response is attributed to feedback processes. Our Earth system model results suggest that carbon release from positive carbon cycle feedbacks (e.g. non-volcanic) likely approached or exceeded volcanic emission rates at the onset of the PETM, raising pCO2 by 1330 ppm and the global temperature by 4.4°C. The ‘net’ feedback emissions are negative during the PETM recovery. Carbon isotopes indicate that a sustained low emission flux of isotopically light carbon is required to slow down the δ13C recovery driven by organic carbon burial, potentially pointing to additional thermogenic or biogenic methane release during the recovery phase.

How to cite: Vervoort, P., Doherty, D., Greene, S. E., Jones, S. M., Dunkley Jones, T., Gaskell, D., and Ridgwell, A.: Quantifying net carbon cycle feedbacks across the Paleocene-Eocene Thermal Maximum, EGU General Assembly 2025, Vienna, Austria, 27 Apr–2 May 2025, EGU25-16652, https://doi.org/10.5194/egusphere-egu25-16652, 2025.

The Late Paleocene – Early Eocene period is characterised by several short-term warming episodes superimposed on already high temperatures and CO2 levels. These hyperthermal events are associated with negative carbon isotope excursions, which are thought to represent significant changes in the carbon cycle through input of isotopically light carbon into the exogenic carbon pool. Next to carbon release from melting permafrost, one large-scale carbon reservoir that might have been the source of this disturbance is marine methane hydrates. To study the potential role of this carbon reservoir in more detail, we expand the carbon cycle box model LOSCAR to include a methane hydrate reservoir. By adapting the carbon cycling parameterisations in the original LOSCAR ocean boxes to allow for organic carbon burial, and by determining a temperature-dependent gas hydrate stability zone in the sediment, we model the time-varying volume of marine methane gas hydrates. In order to investigate the dynamic response between methane hydrates and temperature fluctuations in the Eocene, we run simulations using the Early Eocene as a background state and orbital solutions plus noise as forcing, shedding new light on the role of methane hydrates in late Paleocene – early Eocene climate fluctuations.

How to cite: Elbertsen, M. and Cramwinckel, M.: Assessing the role of methane hydrates in the Late Paleocene – Early Eocene hyperthermals using a carbon cycle box model, EGU General Assembly 2025, Vienna, Austria, 27 Apr–2 May 2025, EGU25-17767, https://doi.org/10.5194/egusphere-egu25-17767, 2025.

EGU25-20307 | ECS | Orals | CL1.1.1

Enhanced continental weathering and carbon-cycle perturbations linked to volcanism during the P1 Glaciation of the Late Paleozoic Ice Age 

Luojing Wang, Dawei Lv, Junlin Li, Zhihui Zhang, John Isbell, Munira Raji, Wenxu Du, Zekuan Li, and Dongxu Jiang

The late Paleozoic ice age (LPIA) was the longest-lived glaciation of the Phanerozoic, and the demise of LPIA is the Earth’s only recorded transition from an icehouse to a greenhouse state. The P1 glaciation (Asselian-Sakmarian) was the most extensive phase of the LPIA, characterized by rapid climate change and several significant events, including widespread aridification in the low latitudes of Pangaea, episodic glacial expansion in Gondwana, and considerable fluctuations in CO2 concentrations. This study investigates the early Asselian warming event and its connection to volcanic activity during the Early Permian, using data from two stratigraphic sections in the North China Craton (NCC). We analyzed organic carbon isotopes (δ13Corg), total organic carbon (TOC), total sulfur (TS), aluminum, mercury content, and chemical weathering indices to track climate and carbon isotope changes during P1 Glaciation of the LPIA. Our results suggest that the early Asselian climate warming may have been driven by volcanic activity through the release of greenhouse gases. This study also contributes to understanding the correlation between volcanism and carbon perturbations during the LPIA.

How to cite: Wang, L., Lv, D., Li, J., Zhang, Z., Isbell, J., Raji, M., Du, W., Li, Z., and Jiang, D.: Enhanced continental weathering and carbon-cycle perturbations linked to volcanism during the P1 Glaciation of the Late Paleozoic Ice Age, EGU General Assembly 2025, Vienna, Austria, 27 Apr–2 May 2025, EGU25-20307, https://doi.org/10.5194/egusphere-egu25-20307, 2025.

The bauxite is a critical paleoclimatic proxy, and it is also the main material for refining aluminum. Therefore, it is of great scientific, economic and strategic significance to study the mineralization of bauxites. The formation of bauxites is largely affected by intense chemical weathering, closely related to temperature, precipitation and vegetation cover. In paleoclimatic studies, bauxites are used to qualitatively indicate warm, humid and vegetated environmental conditions, but how bauxites in the deep time were quantitatively related to temperature and precipitation has not been established, which limits the paleoenvironmental indication of bauxites and the metallogenic prediction. Here, we combine geological records with climate simulations to establish the quantitative relationships of bauxites with temperature and precipitation since the Mesozoic era. The Earth system model CESM1.2.2 and the vegetation model BIOME4 were combined to simulate the climate and vegetation distribution. Then the environmental information of the paleo-locations of bauxites is extracted, and the quantitative relationships between bauxites, and temperature, precipitation and vegetation are established. We show that bauxites formed with an annual mean temperature of 24.8 °C and precipitation of 1097 mm y-1 after 250 Ma. The climatic variations of bauxites are due to land distribution, climate states, and vegetation coverage. Our research results provide a new understanding of the mineralization of bauxites, and also offer a reference for the exploration of bauxites.

How to cite: Bao, X.: Quantitative constraints on the environmental conditions of bauxite formation since Mesozoic , EGU General Assembly 2025, Vienna, Austria, 27 Apr–2 May 2025, EGU25-20484, https://doi.org/10.5194/egusphere-egu25-20484, 2025.

EGU25-20768 | ECS | Orals | CL1.1.1

Late Carboniferous ice sheets in a coupled Earth-system model 

Julius Eberhard, Georg Feulner, Matteo Willeit, Hannah Sophia Davies, Benoît Bovy, Jean Braun, and Stefan Petri

The Late Paleozoic Ice Age (LPIA) was the latest phase of widespread glaciation on Earth before the current Late Cenozoic Ice Age. At its peak around 300 million years ago, ice sheets in southern Pangea reached their maximal extents. This knowledge comes from a plethora of geological evidence but has so far not been explored by fully three-dimensional coupled models of land ice and climate. Here we present results from the first peak-LPIA simulations with interactive ice sheets using CLIMBER-X, a fast coupled Earth-system model featuring a statistical–dynamical atmosphere and a frictional–geostrophic ocean. For a range of likely greenhouse-gas concentrations, we investigate how orbital geometry, topography, and the initialization of ice sheets affect the growth and distribution of land ice during the late Carboniferous. We find an especially distinct dependency on orbital geometry, with ice covering almost whole Gondwana in one case and being limited to the South American part in another, while keeping the greenhouse gases constant. We then plan to use the precipitation and ice-sheet cover output from the climate model to calibrate landscape evolution modeling with Fastscape and thereby obtain estimates of the global sediment flux during the LPIA. 

How to cite: Eberhard, J., Feulner, G., Willeit, M., Davies, H. S., Bovy, B., Braun, J., and Petri, S.: Late Carboniferous ice sheets in a coupled Earth-system model, EGU General Assembly 2025, Vienna, Austria, 27 Apr–2 May 2025, EGU25-20768, https://doi.org/10.5194/egusphere-egu25-20768, 2025.

The Ordovician-Silurian transition was a time of marked upheaval in global climate, ocean oxygenation and marine biodiversity. Geochemical and sedimentary evidence for anoxia in the late Hirnantian and Rhuddanian has led to the coining of a Hirnantian oceanic anoxic event, linked to globally widespread organic carbon burial and potentially a second pulse of the Late Ordovician Mass Extinction. Evidence from stable uranium isotopes indicates that a late Hirnantian shift towards more expanded anoxic marine conditions was global in nature, supporting widespread sedimentological data. However, how stable was the inferred early-middle Hirnantian background state of near-modern ocean oxygenation? If the late Katian was in fact characterised by a warm climate and expanded anoxic marine conditions (as hinted at by geochemical data), should we actually be reframing our discussion of late Ordovician ocean oxygenation and discussing a late Ordovician oceanic oxygenation event (or OOE) similar to those discussed in the late Neoproterozoic?


We integrate an updated synthesis of geochemical data across the Ordovician-Silurian with a new stage-by-stage series of 3D biogeochemical models to provide an updated perspective on the end-Ordovician Earth system. Our intermediate complexity Earth system modelling framework builds on global circulation and long-term carbon cycle modelling by coupling cGENIE to existing SCION and HADCM3L simulations. This enables us to present new reconstructions of 3D ocean biogeochemistry over key intervals of the Phanerozoic, including dissolved oxygen in shelf environments, volume of oxygen minimum zones and seafloor redox. Here, we find that circulation in icehouse climates has a dramatic impact on reconstructed ocean oxygenation. We further integrate this series with a sensitivity analysis interrogating the importance of Earth system boundary conditions to these predictions of non-linear climatic drivers of ocean oxygenation. Finally, we place this experimental analysis in the context of our knowledge of the Ordovician-Silurian Earth system and highlight future directions to reconcile data and model perspectives.

How to cite: Stockey, R.: Reconsidering the Hirnantian oceanic anoxic event – exploring the evidence for and implications of a late Ordovician oceanic oxygenation event, EGU General Assembly 2025, Vienna, Austria, 27 Apr–2 May 2025, EGU25-21433, https://doi.org/10.5194/egusphere-egu25-21433, 2025.

EGU25-21799 | Orals | CL1.1.1

Palaeogeographic reconstructions shape understanding of deep-time climate change 

Xiaoli Ma, Lewis A. Jones, Kilian Eichenseer, and Junxuan Fan

Oxygen isotope compositions (δ18O) have been widely used to reconstruct deep-time climate dynamics, which have been shown to vary through time and space. Reconstruction of the spatial pattern of these records relies on robust estimates of palaeolocations derived from Global Plate Models (GPMs). However, several different GPMs exist which vary in their palaeogeographic reconstruction, potentially impacting estimates of deep-time latitudinal temperature gradients and latitudinal-band temperatures. Since global mean temperatures are calculated as the sum of area-weighted latitudinal-band temperatures, variations in GPMs may also influence global mean temperature estimates. Here, we tested whether GPM choice impacts reconstructions of Early Palaeozoic climate by analysing an extensive Ordovician δ18O dataset compiled from bulk rocks, brachiopods, and conodonts. Using four open-access GPMs to reconstruct the paleogeographic distribution of sampled localities from our Ordovician δ18O dataset, we quantified discrepancies in palaeolatitudinal-band temperatures and global mean temperatures. Our results indicate that variations in GPM palaeogeographic reconstructions alone can lead to large differences (3–3.5°C) in palaeolatitudinal-band temperature and global-mean temperature estimates. Our findings suggest that GPM choice can substantially impact reconstructions of deep-time climate dynamics and careful consideration of the differences in palaeogeographic reconstructions between GPMs is required.

How to cite: Ma, X., Jones, L. A., Eichenseer, K., and Fan, J.: Palaeogeographic reconstructions shape understanding of deep-time climate change, EGU General Assembly 2025, Vienna, Austria, 27 Apr–2 May 2025, EGU25-21799, https://doi.org/10.5194/egusphere-egu25-21799, 2025.

EGU25-21897 | ECS | Orals | CL1.1.1

Assessing the Impact of Vegetation Data on HadCM3L Phanerozoic Climate Simulations 

Tianyi Chu, Daniel J. Lunt, and Junxuan Fan

Climate-model simulations are important tools for testing hypotheses about the drivers of shifts in climate and ecosystem distributions throughout the Phanerozoic. Initial simulations of Phanerozoic climates have been carried out using the HadCM3L climate model, with 109 time slices across the 540 million years. Each time slice represents a distinct stage, with CO2 concentrations prescribed to align the modeled global mean surface temperatures (GMST) with estimates of past GMST.

However, these simulations utilized modern plant functional types (PFT) and globally homogeneous surface properties across all Phanerozoic timescales. In reality, vegetation has evolved through time. So, use of modern PFT may introduce significant errors in climatically relevant variables (e.g., albedo). Consequently, the estimated values of modeled temperatures through time may be inaccurate.

The aim of this project is to implement more realistic representations of vegetation in the simulations, by utilizing PFTs that are appropriate for each time slice. For example, the early Ordovician would be characterized by low-lying, sparse vegetation dominated by bryophyte-like plants, which likely exhibited simple anatomy and physiology, were restricted to moist lowland habitats, and lacked deep anchoring structures.

As a first step towards this aim, we have set up a series of simulations that are simple continuations of the existing simulations, run for 110 years, but including more vegetation-specific outputs. Our analysis included visualizations of the Phanerozoic vegetation fraction, which pointed out clear inaccuracies, such as the unrealistic representation of vegetation during the early Phanerozoic. These findings emphasize the limitations of the original model’s assumptions about vegetation. Furthermore, we demonstrated that vegetation significantly influences surface temperature and found strong relationships between climate variables (such as precipitation and surface air temperature) and vegetation distribution. Our results underscore the need to make realistic adjustments to vegetation parameters in HadCM3L simulations.

How to cite: Chu, T., Lunt, D. J., and Fan, J.: Assessing the Impact of Vegetation Data on HadCM3L Phanerozoic Climate Simulations, EGU General Assembly 2025, Vienna, Austria, 27 Apr–2 May 2025, EGU25-21897, https://doi.org/10.5194/egusphere-egu25-21897, 2025.

EGU25-2066 | Posters on site | CL1.1.3

Astronomical driven low-latitude hydrological cycle not paced by summer insolation 

Hu Yang, Xiaoxu Shi, Xulong Wang, Qingsong Liu, Yi Zhong, Xiaodong Liu, Youbin Sun, Yanjun Cai, Fei Liu, Gerrit Lohmann, Martin Werner, Zhimin Jian, Tainã M. L. Pinho, Hai Cheng, Lijuan Lu, Jiping Liu, Qinghua Yang, Yongyun Hu, Jingyu Zhang, and Dake Chen

For a century, the hemispheric summer insolation is proposed as a key pacemaker of astronomical climate change. In high latitudes, these climate changes are characterized by cyclical expansion and retreat of ice sheets. While the low-latitude climate changes are featured by strong variations in the hydrological cycle, with dominant precessional variations. Existing studies argued that precession determines the inter-hemispheric summer insolation difference, thus regulating the North-South seesaw of the ITCZ. However, an increasing number of geologic records, especially those absolutely dated ones, reveal that terrestrial precipitation shows asynchronous precessional evolutions that are very often out of phase with the summer insolation. The underlying mechanism, despite being highly debated, however, remains unclear. In this study, we proposed that the astronomically driven low-latitude hydrological cycle is paced by shifting perihelion, rather than the Northern (or Southern) Hemisphere summer insolation. Precession of the Earth’s rotation axis alters the occurrence season and latitude of perihelion. When perihelion occurs, increasing insolation raises the moist static energy over land faster than over ocean due to differing thermal inertia. This thermodynamically moves the tropical convergence precipitation from the ocean to the land, contributing to enhancing the terrestrial precipitation over the latitudinal rain belt. As perihelion shifts towards different latitudes and seasons at different precessional phases, this leads to asynchronous terrestrial precipitation maxima at different latitudes. We present both model simulations and geological records to support our hypothesis. Our results suggest that the insolation in individual seasons is equally important in shaping the orbital scale climate changes at low latitudes. This offers new insight into the Milankovitch theory.

How to cite: Yang, H., Shi, X., Wang, X., Liu, Q., Zhong, Y., Liu, X., Sun, Y., Cai, Y., Liu, F., Lohmann, G., Werner, M., Jian, Z., Pinho, T. M. L., Cheng, H., Lu, L., Liu, J., Yang, Q., Hu, Y., Zhang, J., and Chen, D.: Astronomical driven low-latitude hydrological cycle not paced by summer insolation, EGU General Assembly 2025, Vienna, Austria, 27 Apr–2 May 2025, EGU25-2066, https://doi.org/10.5194/egusphere-egu25-2066, 2025.

EGU25-3028 | Orals | CL1.1.3

Significant ocean heat content reduction caused by subsurface cooling after 0.8 Ma in the central and southern margins of the Western Pacific Warm Pool 

Li Lo, Yi-Hseuh Tsai, Shital Paulu Godad, Shih-Yu Lee, Thibault de Garidel-Thoron, Chia-Shiuan Chu, Chuan-Chou Shen, Ludvig Löwemark, Horng-Sheng Mii, and Yuan-Pin Chang

      Growing evidence indicates a rapid expansion of the Western Pacific Warm Pool (WPWP), characterized by annual sea surface temperatures exceeding 28°C. This expansion is seen both in area and upper ocean heat content (OHC) over the past few decades, potentially increasing typhoon activity, coral bleaching. Ecological disruptions are expected if OHC continues to rise. To better understand future changes, paleo-records offer valuable insights for assessing potential scenarios. Most previous studies in the region have focused on surface reconstructions or shorter timescales, with limited data extending beyond 0.5–0.3 million years (Ma).

     In this study, we present reconstructions of surface and subsurface temperatures based on planktonic foraminiferal Mg/Ca ratios (Globigerinoides ruber and Neogloboquadrina dutertrei) from the central and southwestern margins of the WPWP for the last 1.75 Ma. Our data were obtained from core MD97-2140 (2°02’ N, 141°46’ E) and ODP Hole 1115B (9°11’ S, 151°34’ E), respectively. Our findings reveal distinct glacial/interglacial (G/IG) cycles in OHC at both sites, underscoring the significant influence of global climate boundary conditions on the WPWP. Across the middle Pleistocene transition (MPT), as the dominant climate periodicity shifted from 41-kyr to 100-kyr cycles, changes in the periodicities and amplitudes of G/IG OHC variations were also observed. Notably, OHC in both central and southwestern WPWP regions has been declining since approximately 0.8 Ma, driven primarily by a gradual subsurface cooling of 2–3°C. During “warmer-than-present” periods, such as Marine Isotope Stages 5e, 11, and 31, OHC exceeded Holocene averages.

       Our findings indicate that ocean circulation and greenhouse gas forcing play a more significant role in driving OHC changes than direct orbital-induced insolation forcing. However, the long-term stability of surface SSTs in both central and southern marginal warm pool regions does not clearly support a sustained decline in greenhouse gas radiative forcing, suggesting the existence of more complex feedback mechanisms that require further exploration. This research helps refine energy budget estimates and improve the calibration of numerical models. Additionally, it emphasizes the importance of subsurface water circulation in connecting the WPWP to climate systems in mid- and high-latitude regions.

How to cite: Lo, L., Tsai, Y.-H., Godad, S. P., Lee, S.-Y., de Garidel-Thoron, T., Chu, C.-S., Shen, C.-C., Löwemark, L., Mii, H.-S., and Chang, Y.-P.: Significant ocean heat content reduction caused by subsurface cooling after 0.8 Ma in the central and southern margins of the Western Pacific Warm Pool, EGU General Assembly 2025, Vienna, Austria, 27 Apr–2 May 2025, EGU25-3028, https://doi.org/10.5194/egusphere-egu25-3028, 2025.

EGU25-3193 | Orals | CL1.1.3

Killing the Faint Young Sun Paradox: An exploration of Eoarchean climate 

Michael Way, Eric Wolf, and Sophie-Berenice Wilmes

Geological proxies indicate that early Archean Earth was not in a permanent snowball state. Otherwise, we have limited data on its atmospheric composition, how volatile cycling operated, its evolving land-sea mask, topography and ocean bathymetry, etc. At the same time Archean climate studies provide a relatively large and underexplored parameter space for full complexity General Circulation Models (GCMs). Here we model the climate of the Archean at 3.8Ga when the amount of exposed land is likely very small (e.g. Cawood et al. 2022). The ROCKE-3D (R3D; Way et al. 2017) GCM is used. It is a full-complexity fully coupled atmosphere, land and ocean model. In contrast to previous studies we utilize a full complexity atmosphere, a coupled fully dynamic ocean, and dynamic sea ice. R3D is a child of the Goddard Institute for Space Studies GCM Model_E that is used for climate change studies (Schmidt et al. 2013). We model day lengths of 12 and 18 hours in an aquaplanet setup. We use an N2 dominated atmosphere with differing amounts of CO2 and CH4 (being careful to avoid ratios that lead to climate cooling hydrocarbon hazes). Surface pressures of 1, 0.5 and 0.25 bar are modeled, given various Archean pressure proxy constraints (e.g. Som et al. 2016). We use a solar spectrum from 3.8Ga with a reduction of ~25% from modern day insolation. Perhaps unsurprisingly we discover that the tipping point from a temperate state (similar to modern day Earth) versus a snowball state is very sensitive to greenhouse gas amounts and total atmospheric pressure. We see differences in latitudinal ice extent dependent upon day length (12 vs 18 hours) for otherwise similar parameters, and that the dynamics of the climate is similar to recent work by Feulner et al. (2022). This work, alongside others such as Charnay et al. (2017)  and Feulner et al. (2023) provide a clear path to explaining why the Faint Young Sun paradox may finally be put to rest.

References:

Cawood et al. (2022) RG, 60, e2022RG000789; Charnay et al. (2017) EPSL 474, 97; Feulner et al. (2023) ESD 14, 533-547; Schmidt et al. (2013) JAMES, 6, 141-184; Som et al. (2016) NatGeo 9, 448; Way et al. (2017) ApJS. 231, 12.

How to cite: Way, M., Wolf, E., and Wilmes, S.-B.: Killing the Faint Young Sun Paradox: An exploration of Eoarchean climate, EGU General Assembly 2025, Vienna, Austria, 27 Apr–2 May 2025, EGU25-3193, https://doi.org/10.5194/egusphere-egu25-3193, 2025.

EGU25-3465 | ECS | Orals | CL1.1.3

The Solar System's Passage through the Radcliffe Wave during the Middle Miocene 

Efrem Maconi, João Alves, Cameren Swiggum, Sebastian Ratzenböck, Josefa Großschedl, Peter Köhler, Núria Miret-Roig, Stefan Meingast, Ralf Konietzka, Catherine Zucker, Alyssa Goodman, Marco Lombardi, Gregor Knorr, Gerrit Lohmann, John Forbes, Andreas Burkert, and Merav Opher

As the Earth and the other planets orbit around the Sun, the Solar System itself revolves around the center of the Milky Way, our Galaxy. The Milky Was is far from being a static and homogeneous environment. On large scales, the stars, the gas, and the dust are organized into a rotating spiral structure that extend from the center into the galactic disk. On smaller scales, the environment between the stars, also known as the interstellar medium (ISM), is continuously shaped by different  events and mechanism, like supernovae explosions, stellar winds, Galactic shear, magnetic fields, etc. 

The Solar System, located at about 27’000 light-years from the center of the Milky Way, completes a full orbit around the Galactic center in about 225 million years (Myr). The constantly evolving environment, combined with the Sun’s peculiar velocity relative to the average velocity of the surrounding gas and stars, causes the Solar System to “sail” various Galactic environments with different gas densities. 

Encounters with dense gas regions, such as gas clouds or supernova shock fronts, can compress the heliosphere, exposing parts of the Solar System to the ISM. These encounters also increase the influx of interstellar dust into the Solar System and Earth's atmosphere. A greater influx of dust would result into the decrease of the amount of sunlight reaching Earth and, by bringing radioactive elements from the supernovae, might also cause radionuclides anomalies in geological records.

Recently, by the means of new astronomical data provided by the Gaia mission, the 3D structure of the environment surrounding the Sun has been unveiled. This has led to the identification of previously unknown Galactic structures, such as the Radcliffe Wave. This raises the question of whether the Sun has encountered any of these structures.

In our work, we study the passage of the Solar System through the Radcliffe Wave gas structure over the past 30 Myr. We find that the Solar System’s trajectory intersected the Radcliffe Wave in the Orion star forming region. We have constrained the timing of this event to between 18.2 and 11.5 Myr ago, with the closest approach occurring between 14.8 and 12.4 Myr ago. 

Notably, this period is synchronous with the Middle Miocene Climate Transition on Earth, providing an interdisciplinary link with paleoclimatology. We also estimate the potential impact of the crossing of the Radcliffe Wave on climate on Earth and suggest possible future developments for this work. As the crossing could also lead to anomalies in radionuclide abundances, we highlight its importance for the field of geology and nuclear astrophysics.

How to cite: Maconi, E., Alves, J., Swiggum, C., Ratzenböck, S., Großschedl, J., Köhler, P., Miret-Roig, N., Meingast, S., Konietzka, R., Zucker, C., Goodman, A., Lombardi, M., Knorr, G., Lohmann, G., Forbes, J., Burkert, A., and Opher, M.: The Solar System's Passage through the Radcliffe Wave during the Middle Miocene, EGU General Assembly 2025, Vienna, Austria, 27 Apr–2 May 2025, EGU25-3465, https://doi.org/10.5194/egusphere-egu25-3465, 2025.

EGU25-3765 | ECS | Posters on site | CL1.1.3

Recognition and response of ENSO signals in the middle Eocene Bohai Bay Basin lake (E China)  

Yu Han, Yingchang Cao, and Chao Liang

The behavior of the global climate system on scales from years to centuries is related to several mechanisms, including solar forcing and the El Niño-Southern Oscillation (ENSO). Pre-Quaternary archives are rare, however, due to limited stratigraphic resolution and the accuracy of datings. A middle Eocene lacustrine shale in the Bohai Bay Basin (E China) shows annual laminae that allow establishing its astronomical and varve chronology. Principal component analysis of the sediments in the cored material, their magnetic susceptibility and grayscale scans as well as analysis of the varve thickness in thin sections jointly reveal variations between a warm/dry and a cold/wet climate on the scale of centuries (~200–240 years, ~350 years), probably corresponding with cycles in solar activity. In situ δ13C and δ18O values of the light carbonate laminae show, in combination with varve-thickness data, that algal blooming and carbonate production show ~2.1–8.7 year cycles that could be ascribed to ENSO activity. The data also suggest that solar forcing controlled the ENSO intensity in the area of the Bohai Bay Basin during the middle Eocene.

How to cite: Han, Y., Cao, Y., and Liang, C.: Recognition and response of ENSO signals in the middle Eocene Bohai Bay Basin lake (E China) , EGU General Assembly 2025, Vienna, Austria, 27 Apr–2 May 2025, EGU25-3765, https://doi.org/10.5194/egusphere-egu25-3765, 2025.

Several studies have revealed that the Eocene fine-grained sedimentary rocks in Bohai Bay Basin is driven by astronomical forces. However it is still not clarified how orbital cycles specifically control the deposition of fine-grained sedimentary rocks and the coupling relationship of paleoclimate- paleolake- sedimentation. In this study, a combination of core and thin section observation, X-ray diffraction, ICP-MS analysis, total organic carbon (TOC) content analysis and cyclostratigraphy analysis were conducted on the lacustrine shale of the Eocene Shahejie Formation (Es4u to Es3l) in the Dongying Depression of Bohai Bay Basin, in order to recognize the Milankovitch cycles and explore the controlling effect of eccentricity, obliquity and precession on the deposition of the lacustrine shale as well as the paleoclimate evolution. The related achievements are as follows: 1. Through pre-processing, sliding window spectrum analysis and multi-taper method (MTM) of the natural gamma ray data of the well NY1, good orbital signals were recognized. And through correlation coefficient method (COCO), the study interval is divided into two sections according to the change of accumulating rates. Filtered eccentricity, obliquity and precession signal curves were obtained for both sections. 2. For the lower Section, obliquity is the main controlling factor for shale deposition and precession is the secondary controlling factor. When obliquity reaches its maximum, the content of dolomite and clay in Shahejie Formation increases, while the content of calcite decreases and TOC also increases. At this point the laminar combinations are mainly dolomite/calcite lamina and organic-rich clay lamina. When obliquity reaches its minimum, the content of calcite increases, the content of dolomite and clay decreases and TOC decreases. At this point the laminar combinations are mainly calcite lamina and clay silt mixed lamina. 3. For the upper Section, eccentricity is the main controlling factor for shale deposition and precession is the secondary controlling factor. When eccentricity reaches its maximum, the content of clay and quartz in Shahejie Formation increases, while the content of carbonate minerals decreases and TOC also increases. At this point the laminar combinations are mainly calcite lamina and organic-rich clay silt lamina. When eccentricity reaches its minimum, the content of clay and quartz decreases, the content of carbonate minerals increases and TOC decreases. At this point the laminar interface is usually blurry. 4. According to a series of geochemistry data analysis, the chemical weathering index (CIA) for the lower section is relatively low, the Mg/Ca ratio and Ni/Co ratio are relatively high, which indicates that the paleo-environment was arid and reductive. For the upper section, CIA is relatively high and the Mg/Ca ratio and Ni/Co ratio are relatively low, indicating a humid and less reductive paleo-environment. The coupling relationship of paleoclimate- paleolake- sedimentation experienced a transition from the lower section to the upper section of the study interval, which is consistent with the shift from obliquity driven to eccentricity driven. The intensification of East Asia monsoons might be responsible for this transition.

How to cite: Liang, C., Han, Y., and Cao, Y.: Recognition and Responses of Milankovitch Cycles in Eocene Shahejie Formation, Dongying Depression, EGU General Assembly 2025, Vienna, Austria, 27 Apr–2 May 2025, EGU25-3783, https://doi.org/10.5194/egusphere-egu25-3783, 2025.

EGU25-3901 | Posters on site | CL1.1.3

The response of AUSM to precession forcing and its relation to EASM and EAWM  

Mi Yan, Zhengyu Liu, Bin Wang, Xinwei Kong, Liang Ning, Qin Wen, and Jian Liu

The East Asian monsoon (EAM) and the Australian monsoon (AUM) are two subsystems of the Asian-Australian monsoon system. The EAM and AUM can be linked dynamically through the cross-equatorial outflow, in addition to their own distinct responses to external forcing. Despite previous studies on their relationships for different timescales, their relationship at the orbital timescale has remained poorly explored. In a set of simulations, we demonstrate that the Australian Summer Monsoon (AUSM) precipitation varies out-of-phase to the East Asian Summer Monsoon (EASM) at precession timescale due to the local insolation. At the same time scale, the relation between the AUSM and the East Asian winter monsoon (EAWM) is weak. The weak relation is due to the precession induced inter-hemispheric insolation gradient, which weakens the cross-equatorial flow and thus the dynamical links between the AUSM and the EAWM

How to cite: Yan, M., Liu, Z., Wang, B., Kong, X., Ning, L., Wen, Q., and Liu, J.: The response of AUSM to precession forcing and its relation to EASM and EAWM , EGU General Assembly 2025, Vienna, Austria, 27 Apr–2 May 2025, EGU25-3901, https://doi.org/10.5194/egusphere-egu25-3901, 2025.

EGU25-4028 | ECS | Posters on site | CL1.1.3

Linear and Nonlinear Responses of Annual Mean Sea Surface Temperature to Orbital Forcing 

Xinwei Kong, Zhengyu Liu, Mi Yan, Qin Wen, Samantha Bova, Yair Rosenthal, Liang Ning, Jian Liu, and Fuxian Xie

The response of mean annual sea surface temperature (MASST) to orbital insolation forcing has remained not well understood. Here, we study the MASST response to orbital forcing in a climate model simulation of the last 200,000 years. Our results show that SST responds nearly linearly to insolation across most of the tropics and high latitudes, with the MASST dominated by obliquity variability. In the mid-latitude and the eastern equatorial Pacific, however, SST response is nonlinear such that the MASST is dominated precession variability. The nonlinear MASST response can be biased towards winter or summer SST, caused by the rectification of the seasonal insolation forcing by cloud albedo or mixed layer depth.

How to cite: Kong, X., Liu, Z., Yan, M., Wen, Q., Bova, S., Rosenthal, Y., Ning, L., Liu, J., and Xie, F.: Linear and Nonlinear Responses of Annual Mean Sea Surface Temperature to Orbital Forcing, EGU General Assembly 2025, Vienna, Austria, 27 Apr–2 May 2025, EGU25-4028, https://doi.org/10.5194/egusphere-egu25-4028, 2025.

EGU25-4679 | ECS | Posters on site | CL1.1.3

Dry hydroclimates in the early Eocene hothouse world 

Victor Piedrahita, Andrew Roberts, Eelco Rohling, David Heslop, Xiang Zhao, Simone Galeotti, Fabio Florindo, Katharine Grant, and Jinhua Li

Extreme global warming events, such as that one expected for the shared socio-economic pathway (SSP) 8.5 in upcoming centuries, induce significant hydrological cycle changes characterized mainly by wet-wetter (wet-becomes-wetter) hydroclimates. However, hydroclimate changes of dry areas associated with increased temperatures are poorly understood and the occurrence of dry-drier (dry-becomes-drier) or dry-wetter (dry-becomes-wetter) conditions remains elusive. Early Eocene hothouse climates offer alternatives to assess the response of dry regions to global warming, which allows to better understand hydroclimate variability drivers in geological timescales and likely improve predictions about hydrological cycle variability under an extreme SSP 8.5-like global warming state. Here, we study the proto-Mediterranean Contessa Road (Italy) section, which contains records of a series of early Eocene carbon cycle perturbations. We used geochemical and rock magnetic data to reconstruct proto-Mediterranean hydroclimate variability, and found that orbital forcing and global warming controlled the hydrological cycle. Precession-driven insolation changes led to generation of dry/wet cycles, which occurred over superimposed aridification trends caused by short-lived (~200 kyr) carbon cycle perturbations and long-term (~6 Ma) global warming. Short-lived events caused hydroclimate perturbations that took ~24-27 kyr to recover from peak to pre-event conditions. These observations suggest that anthropogenic global warming can cause widespread aridification with impacts that exceed societally relevant timescales.

How to cite: Piedrahita, V., Roberts, A., Rohling, E., Heslop, D., Zhao, X., Galeotti, S., Florindo, F., Grant, K., and Li, J.: Dry hydroclimates in the early Eocene hothouse world, EGU General Assembly 2025, Vienna, Austria, 27 Apr–2 May 2025, EGU25-4679, https://doi.org/10.5194/egusphere-egu25-4679, 2025.

EGU25-8041 | ECS | Posters on site | CL1.1.3

Distinct response of Asian summer monsoon circulation and precipitation toorbital forcing during six Heinrich events 

MingQiang Liang, Qiuzhen Yin, Yong Sun, Chao Zhang, Andre Berger, Anqi Lyu, Wei Liu, and Zhipeng Wu

Climatic fingerprint of Heinrich (H) events was characterized by widespread megadroughts over the Asian summer monsoon (ASM) region accompanied by systemic weakening of the ASM. However, recent studies of hydroclimate proxies suggest huge spatial discrepancies in precipitation over the ASM region during some H events, characterized by increased precipitation in the Yangtze River Valley contrasting with the prevalent megadroughts across the whole ASM region. The mechanism responsible for the spatial discrepancies in precipitation and the relationship between local precipitation and the ASM intensity remain elusive. In this study, we investigate the response of the ASM circulation and precipitation to orbital forcing during six H events based on simulations with a coupled atmosphere-ocean general circulation model. The results show that changes in insolation alone can induce spatial discrepancies in precipitation over the ASM region during the H events. During the H1, 3, 4, 5, 6 events, the amplification of the land-sea pressure contrast in response to a positive interhemispheric insolation gradient (30◦N-30◦S) during boreal summer intensifies moisture transport from the adjacent oceans to the ASM region. The ensuing moisture divergence, combined with anomalous downdrafts, results in decreased precipitation in the South Asian Summer Monsoon (SASM) region, but converse scenario for the East Asian Summer Monsoon (EASM) region. During the H2 event, the increased precipitation across the Yangtze River Valley sharply contrasts the widespread drought over the ASM region, attributing to an anticyclone anomaly over the subtropical Western North Pacific and a cyclone anomaly over Japan and Korea. Moisture budget analysis shows that the dynamic effect, especially the vertical term, rather than the thermodynamic effect, is the dominant control of precipitation changes over the ASM region. Our results also suggest that despite the synchronous variation in the strength of the EASM and SASM in response to orbital forcing, the EASM should not be regarded as an eastward and northward extension of the SASM. Furthermore, our model simulates a weak correlation between the monsoon intensity and precipitation in the SASM region in response to orbital forcing, calling for caution in employing precipitation to reconstruct SASM intensity on orbital time scale.

How to cite: Liang, M., Yin, Q., Sun, Y., Zhang, C., Berger, A., Lyu, A., Liu, W., and Wu, Z.: Distinct response of Asian summer monsoon circulation and precipitation toorbital forcing during six Heinrich events, EGU General Assembly 2025, Vienna, Austria, 27 Apr–2 May 2025, EGU25-8041, https://doi.org/10.5194/egusphere-egu25-8041, 2025.

EGU25-8832 | ECS | Orals | CL1.1.3

Astronomical forcing and anoxia during the Devonian: Insights from Earth system modeling 

Justin Gérard, Michel Crucifix, Loïc Sablon, Anne-Christine Da Silva, Jarno Huygh, and Alexandre Pohl

The Devonian period, spanning from 419 to 359 million years ago, was marked by a warmer-than-present climate and recurring ocean anoxic events (OAEs), with evidence increasingly suggesting a link between these events and astronomical forcing. Our study aims to investigate how astronomical forcing can initiate ocean anoxic events, revealing the spatial manifestation of these perturbations and assessing whether they remain regionally confined or escalate into global-scale phenomena. To this end, we employed the Earth System Model of Intermediate Complexity (EMIC) cGENIE, forced with spatially distributed continental reactive phosphorus fluxes. The coupling is performed offline with the dynsoil module of GEOCLIM, itself coupled to a statistical emulator of the Devonian climate, trained on a general circulation model (namely HadSM3). This coupling ensures the effects of more complex processes related to astronomical forcing that EMICs can hardly resolve. cGENIE is run transiently over a 1 Myr astronomical solution, crossing a 2.4 Myr eccentricity node, allowing us to capture the dynamic interplay between astronomical cycles and ocean oxygenation, mainly through the alteration of weathering. By exploring multiple variations of this astronomical solution, we aim to disentangle the respective contributions of individual astronomical parameters to the perturbation of the system. Furthermore, two experimental setups characterized by different atmospheric pCO2 levels, one high (2000 ppm) and another low (500 ppm), are considered, enabling us to investigate the impact of astronomical forcing under both "warm" and "cold" Devonian climate scenarios.

How to cite: Gérard, J., Crucifix, M., Sablon, L., Da Silva, A.-C., Huygh, J., and Pohl, A.: Astronomical forcing and anoxia during the Devonian: Insights from Earth system modeling, EGU General Assembly 2025, Vienna, Austria, 27 Apr–2 May 2025, EGU25-8832, https://doi.org/10.5194/egusphere-egu25-8832, 2025.

EGU25-8979 | Posters on site | CL1.1.3

Magnetic susceptibility of Permian-Triassic terrestrial mudstone of southern Britain: features and application for paleoenvironment reconstruction 

Mariia Netsyk, Thomas Stevens, Johan Arnqvist, Dominika Niezabitowska, Bjarne Almqvist, Mark W Hounslow, and Ramues Gallois

The late Permian to Triassic (~ 260-201 Ma) is one of the hottest periods in the last 500 Ma, witnessing dramatic changes in the environment on the Pangea supercontinent, extensive low mid latitude dusty desert formation and the development of a strong monsoonal regime (Ruffell & Hounslow 2006). However, one aspect of Permo-Triassic climate that is relatively unexplored is the extent to which orbital forcing drove terrestrial environmental change in the monsoon and desert areas. The terrestrial mudstone deposits of the Aylesbeare and Mercia Mudstone groups formed under a dusty desert environment crop out along the southwest coast of England (Hounslow and Gallois, 2023) and potentially provide a means to address this gap.

Here we apply dual frequency magnetic susceptibility and analysis of its frequency dependence on mudstones of the Aylesbeare and Mercia Mudstone groups in order to constrain the environmental controls on these parameters and reconstruct Permo-Triassic environmental changes. We sample for these parameters at closely spaced regular intervals and use the new magnetostratigraphic timescale of Hounslow and Gallois (2023) to ascertain variations in these parameters with both age and depth. Both bulk magnetic susceptibility at low frequency (976 Hz) and frequency dependence show considerable variation, which correspond to stratigraphic alternations between green-grey silty mudstones and red mudstones, potentially reflecting wider scale changes in water table level and humidity. Evidence from temperature‐dependent magnetic susceptibility experiments suggested prevailing of magnetite in all types of sequences with hematite evidence in a red mudstone. We propose a model where changes in a dissolution of iron oxides due to climatically driven water table level changes explains these variations in the mudstones. Spectral and wavelet analysis reveals clear orbital periodicities in the proxy data, implying orbital control on water table in these desert environments, potentially via distal monsoon precipitation. Notably, there are substantial changes in the importance of key orbital parameters in the data through time, implying strong sensitivity of this hyper-arid climate to external boundary conditions.  


References

Ruffell, A. & Hounslow, M., 2006: In P. F. Rawson, & P. Brenchley (Eds.), The Geology of England & Wales. Geological Society of London; 295-325.

Hounslow, M.  & Gallois, R., 2023: Magnetostratigraphy of the Mercia Mudstone Group (Devon, UK): implications for regional relationships and chronostratigraphy in the Middle to Late Triassic of Western Europe. Journal of the Geological Society 180, jgs2022-173.

How to cite: Netsyk, M., Stevens, T., Arnqvist, J., Niezabitowska, D., Almqvist, B., Hounslow, M. W., and Gallois, R.: Magnetic susceptibility of Permian-Triassic terrestrial mudstone of southern Britain: features and application for paleoenvironment reconstruction, EGU General Assembly 2025, Vienna, Austria, 27 Apr–2 May 2025, EGU25-8979, https://doi.org/10.5194/egusphere-egu25-8979, 2025.

EGU25-11061 * | ECS | Orals | CL1.1.3 | Highlight

The Climate of Earth's Next Supercontinent: Stable Ocean Circulation States 

Sophie-Berenice Wilmes, Michael Way, Anya Taylor, and Mattias Green

Earth's continents assemble into supercontinents and subsequently disperse in cycles of 400 – 600 million years. The next supercontinent is predicted to form in about 250 million years. Previous studies of future supercontinent climate have focused on surface climate and atmospheric circulation only, so this study explores how small changes in astronomical forcing―future increased solar radiation and longer day lengths―could impact ocean circulation and climate. We simulated two scenarios using present-day or future astronomical forcing for one of the possible future continental arrangements, Aurica, using the fully-coupled climate model ROCKE-3D. Future orbital forcing leads to a 4.4°C rise in global surface temperatures and a shift towards an ice-free state. Ocean circulation transitions from a gyre-dominated state to an overturning circulation with deep water formation at subpolar latitudes, similar to present-day Earth's ocean circulation. This change in ocean circulation state is driven by interactions between the atmospheric circulation, altering rainfall and evaporation patterns, and changes in the transport of salt in the oceans. Our work adds to a growing body of evidence that, for the same continental configurations, multiple stable ocean circulation states may exist. We also emphasise that fully-coupled climate models (i.e., atmosphere and oceans) are needed to understand deep-time climate states.

How to cite: Wilmes, S.-B., Way, M., Taylor, A., and Green, M.: The Climate of Earth's Next Supercontinent: Stable Ocean Circulation States, EGU General Assembly 2025, Vienna, Austria, 27 Apr–2 May 2025, EGU25-11061, https://doi.org/10.5194/egusphere-egu25-11061, 2025.

EGU25-11086 | ECS | Posters on site | CL1.1.3

Can bi-coherence spectral analysis be used as test for the astronomical origin of sedimentary cycles? 

Yifei Zhang, Christian Zeeden, Qiang Fang, and Huaichun Wu

Many geological datasets exhibit distinct lithological cycles at high-frequencies (e.g., ~30 kyr, ~15 kyr, ~13 kyr) that often lack a definitive explanation for their origin. While such cycles are frequently hypothesized to be tied to astronomical forcing, the identification of periodicities alone is insufficient to confirm their astronomical origin. This challenge underscores the need for robust analytical frameworks capable of probing the underlying forcing mechanisms of these cycles. Recently, amplitude variations are the standard tool to assess the possible orbital origin of quasi-cyclic sediment sequences. Bi-coherence spectral analysis, a technique commonly used to identify nonlinear interactions and energy transfer between frequencies in complex systems, offers a promising complementary approach for addressing this issue. By assessing the coherence between two primary frequencies and their interaction-generated secondary frequency in the astronomical solutions, bi-coherence spectra provide insights into the complex relationships between orbital cycles. Here, we utilize bi-coherence analysis as a tool to evaluate whether specific periodicities observed in geological records stem from nonlinear interactions consistent with astronomical forcing. We test this approach using several datasets from the Quaternary to the Paleozoic and assess Milanković and sub-Milanković frequencies. This study proposes a novel test for the astronomical origin of cycles in geological records. 

How to cite: Zhang, Y., Zeeden, C., Fang, Q., and Wu, H.: Can bi-coherence spectral analysis be used as test for the astronomical origin of sedimentary cycles?, EGU General Assembly 2025, Vienna, Austria, 27 Apr–2 May 2025, EGU25-11086, https://doi.org/10.5194/egusphere-egu25-11086, 2025.

EGU25-12088 | Orals | CL1.1.3

Eccentricity pacing and rapid termination of the early Antarctic ice ages 

Tim E. van Peer, Diederik Liebrand, Victoria E. Taylor, Swaantje Brzelinski, Iris Wolf, André Bornemann, Oliver Friedrich, Steven M. Bohaty, Chuang Xuan, Peter C. Lippert, and Paul A. Wilson

The intricate rhythms of changes in Earth’s axial tilt (obliquity) and orbit (eccentricity) are strongly imprinted on records of past climate. Some of our best-dated records of astronomically paced changes in climate and continental glaciation come from deep-sea benthic foraminiferal oxygen isotope records (δ18Ob). However, even these data present major questions about the mechanisms linking Earth’s climate to its astronomical configuration, particularly the importance of eccentricity- and obliquity-paced changes in climate. We studied striking site-to-site disagreement over the frequency of change in δ18Ob, which violates the first principles of oxygen isotope systematics, and inferred Antarctic ice volume for the late Oligocene and early Miocene (Oligo-Miocene) interval.

We present a new, finely resolved δ18Ob record for ~26.4 to 21.8 million years ago from International Ocean Drilling Program (IODP) Site U1406 in the northwest Atlantic Ocean. Our new record shows clear variability at both obliquity and eccentricity frequencies, but not in equal measures. A comparison of our record to other δ18Ob records for the time interval shows a remarkably consistent global imprint of eccentricity on δ18Ob whereas the obliquity signal is inconsistent between sites, indicating that eccentricity was the primary pacemaker of land ice volume. Our results also show that the larger eccentricity-paced early Antarctic ice ages were vulnerable to rapid termination. These findings imply that the self-stabilizing hysteresis effects of large land-based early Antarctic ice sheets were strong enough to maintain ice growth despite consecutive insolation-induced polar warming episodes. However, rapid ice age terminations indicate resistance to melting was weaker than simulated by numerical models and regularly overpowered, sometimes abruptly.

How to cite: van Peer, T. E., Liebrand, D., Taylor, V. E., Brzelinski, S., Wolf, I., Bornemann, A., Friedrich, O., Bohaty, S. M., Xuan, C., Lippert, P. C., and Wilson, P. A.: Eccentricity pacing and rapid termination of the early Antarctic ice ages, EGU General Assembly 2025, Vienna, Austria, 27 Apr–2 May 2025, EGU25-12088, https://doi.org/10.5194/egusphere-egu25-12088, 2025.

EGU25-16876 | Orals | CL1.1.3

Insolation induced abrupt changes and multi-centennial variability of AMOC  

Qiuzhen Yin, Zhipeng Wu, André Berger, Hugues Goosse, Ming-Qiang Liang, and Wei Liu

To investigate the climate effect of astronomical forcing on several timescales, we have performed transient simulations covering the last 800,000 years with LOVECLIM1.3, an Earth system model of intermediate complexity. Our results show that, in addition to changes on orbital timescale, slow-varying insolation could trigger abrupt changes and multi-centennial variability in the Atlantic meridional overturning circulation (AMOC). 

The insolation-induced abrupt changes and multi-centennial variability of AMOC are particularly pronounced at the end of interglacials. When summer insolation in the Northern Hemisphere (NH) high latitudes decreases to a threshold, it triggers a strong, abrupt weakening of the AMOC and consequently an abrupt cooling in the NH. The mechanism involves sea ice-ocean feedbacks in the Northern Nordic Sea and the Labrador Sea. During glacial times, the insolation-induced high frequency oscillations of AMOC could be strongly modulated by both reduced CO2 concentration and enhanced NH ice sheets through their additional effects on the sea ice-ocean system. 

The timing of the simulated abrupt events at the end of interglacials is highly consistent with that observed in marine and terrestrial records, especially in high-resolution, absolutely-dated speleothem records from Asia and Europe. This validates the model results and provides a plausible explanation for the abrupt cooling events observed at the end of interglacials in many proxy records. Our preliminary results from ice sheet simulations show that the insolation-induced cooling plays an essential role on the regrowth of NH ice sheets at the glacial inception. The next insolation threshold will occur in 50,000 years, implying an exceptionally long interglacial ahead naturally speaking. 

How to cite: Yin, Q., Wu, Z., Berger, A., Goosse, H., Liang, M.-Q., and Liu, W.: Insolation induced abrupt changes and multi-centennial variability of AMOC , EGU General Assembly 2025, Vienna, Austria, 27 Apr–2 May 2025, EGU25-16876, https://doi.org/10.5194/egusphere-egu25-16876, 2025.

EGU25-16931 | ECS | Orals | CL1.1.3

Exploring the Connections between Vegetation, Orbital Forcing, and Anoxia in the Devonian with a Hierarchical Model Framework 

Loïc Sablon, Pierre Maffre, Justin Gérard, Jarno Huygh, Anne-Christine Da Silva, and Michel Crucifix

    The Devonian period (419–359 million years ago) was characterized by significant climatic changes, including Oceanic Anoxic Events (OAEs) and mass extinctions. A potential link between these events and long-term astronomical cycles influencing Earth’s climate has been suggested, yet the mechanisms connecting these processes remain unclear.  
    To investigate this link, an emulator-based framework has been developed to simulate atmospheric conditions during the Devonian. The emulator, trained on an ensemble of snapshot simulations using HadSM3 (a General Circulation Model), captures the spatial effects of climatic precession, eccentricity, obliquity, and pCO2 on runoff and temperature. This approach provides a computationally efficient alternative to traditional GCMs and has been integrated into the recent GEOCLIM7 model, which combines a geographically distributed model of vertical weathering profile with a biogeochemical ocean box model. Vegetation distribution is estimated using FLORA, a fast model accounting for temperature, runoff, and insolation to determine potential biomass. Steady-state oceanic circulation fields are provided by cGENIE, a model of intermediate complexity. Dynamic feedbacks are incorporated as pCO2 levels are passed between the box model and the emulator, enabling the simulation of associated climate fields.  
    These results offer insights into the potential role of vegetation and astronomical cycles, such as eccentricity and precession in triggering oceanic anoxia, and allow for a critical evaluation of existing hypotheses on the mechanisms underlying these events.  

How to cite: Sablon, L., Maffre, P., Gérard, J., Huygh, J., Da Silva, A.-C., and Crucifix, M.: Exploring the Connections between Vegetation, Orbital Forcing, and Anoxia in the Devonian with a Hierarchical Model Framework, EGU General Assembly 2025, Vienna, Austria, 27 Apr–2 May 2025, EGU25-16931, https://doi.org/10.5194/egusphere-egu25-16931, 2025.

EGU25-16994 | ECS | Orals | CL1.1.3

Astronomical (paleo)climate forcing amplified by oxygen minimum zone dynamics 

Pam Vervoort, Sarah E. Greene, Andy Ridgwell, Dominik Hülse, and Sandy Kirtland Turner

The 100 and 400 kyr eccentricity cycles are present in many Mesozoic and Cenozoic records but appear especially prominent during the warmer intervals. Their occurrence in deep marine records of these intervals demonstrates that astronomical forcing not only impacts the regional environment but also alters climate conditions and carbon cycle dynamics on a global scale. Yet, the pathways by which regional insolation changes amplify to global scale climate perturbations remain poorly understood, particularly in greenhouse climates where climate-sensitive ice sheets are absent. Here, we present the first-ever Earth system model simulations that closely replicate the 100 kyr climate-carbon cycles in an ice-free world, using only insolation forcing as a driver. Subtle changes in nutrient fluxes and marine organic carbon burial have the potential to drastically alter the ocean buffering capacity – a key mechanism that amplifies astronomical climate variability via the preferential partitioning of carbon to atmospheric CO2. The presence of extensive oxygen minimum zones, where the interplay between sedimentary nutrient (phosphate) regeneration and terrestrial nutrient runoff regulates organic carbon burial, lies at the foundation of the mechanism presented here.

How to cite: Vervoort, P., Greene, S. E., Ridgwell, A., Hülse, D., and Kirtland Turner, S.: Astronomical (paleo)climate forcing amplified by oxygen minimum zone dynamics, EGU General Assembly 2025, Vienna, Austria, 27 Apr–2 May 2025, EGU25-16994, https://doi.org/10.5194/egusphere-egu25-16994, 2025.

EGU25-18358 | Posters on site | CL1.1.3

100-kyr glacial-interglacial cycles seen as a timescale matching problem 

Michel Crucifix, Takahito Mitsui, Peter Ditlevsen, and Niklas Boers

The dominant periodicity of the late Pleistocene glacial-interglacial cycles is roughly 100 kyr, rather than other major orbital periods such as 19, 23, 41, and 400 kyr. Various models explain this fact through distinct dynamical mechanisms, which include synchronization of self-sustained oscillations and resonance in mono- or multi-stable systems. However, the variety of proposed models and dynamical mechanisms could obscure the essential factor for realizing the 100-kyr periodicity.

In this study, we propose the hypothesis that the ice-sheet climate system responds to orbital forcing at the 100-kyr periodicity because the intrinsic timescale of the system is closer to 100 kyr than to other major orbital periods. We support this hypothesis with analyses and sensitivity studies of several simple ice age models with contrasting mechanisms.

How to cite: Crucifix, M., Mitsui, T., Ditlevsen, P., and Boers, N.: 100-kyr glacial-interglacial cycles seen as a timescale matching problem, EGU General Assembly 2025, Vienna, Austria, 27 Apr–2 May 2025, EGU25-18358, https://doi.org/10.5194/egusphere-egu25-18358, 2025.

EGU25-19356 | ECS | Posters on site | CL1.1.3

Deciphering Orbital Frocing and Paleoclimate dynamics in the Early Carboniferous: Cyclostratigraphy of the Salet Road section, Belgium 

Dhoha Boukhalfa, Hamdi Omar, Michiel Arts, Jarno Huygh, Michel Crucifix, Julien Denayer, and Anne-Christine Da Silva

The Early Carboniferous successions in the Namur-Dinant Basin (NDB) in Belgium spans the transition from the Devonian Greenhouse to the Late Paleozoic Ice Age (LPIA). Sections in the basin have been extensively studied, resulting in the establishment of a stratigraphic framework. The role of orbital forcing on sedimentary cycles during the Tournaisian-Visean interval remains unclear. Although cyclic patterns have been visually identified [1], detailed cyclostratigraphic analysis has yet to be conducted.

Our primary objective is to enhance the astrochronological framework of this period, contributing to a precise geologic timescale calibration and a deeper understanding of Early Carboniferous paleoclimate variability. Additionally, this research seeks to improve our estimates of the Earth Precession and Obliquity rates. This will allow to estimate the Earth-Moon distance during a period when a critical change in the Earth-Moon system occurred [2], but still lacking cyclostratigraphic data.

To achieve this, we selected The Salet Road section in the NDB, a 30-meter-thick stratotype for the Moliniacian regional substage, characterized by alternating thick and thinly bedded black limestone facies. We sampled and measured at an unprecedented high resolution of 1 cm. Initial results are promising, showing the imprint of ~2.5 eccentricity cycles (405-kyr). The findings are expected to clarify the influence of orbital forcing on sedimentary processes and expand the global relevance of NDB stratigraphy during this period.


[1] Poty. "The Dinantian (Mississippian) succession of southern Belgium and surrounding areas: stratigraphy improvement and inferred climate reconstruction." Geologica Belgica 19.1-2 (2016).

[2] Farhat et al. "The resonant tidal evolution of the Earth-Moon distance." Astronomy & Astrophysics 665 (2022): L1.

How to cite: Boukhalfa, D., Omar, H., Arts, M., Huygh, J., Crucifix, M., Denayer, J., and Da Silva, A.-C.: Deciphering Orbital Frocing and Paleoclimate dynamics in the Early Carboniferous: Cyclostratigraphy of the Salet Road section, Belgium, EGU General Assembly 2025, Vienna, Austria, 27 Apr–2 May 2025, EGU25-19356, https://doi.org/10.5194/egusphere-egu25-19356, 2025.

EGU25-2138 | ECS | Orals | TS2.8

Interannual to multidecadal climate oscillations in the Cryogenian 

Chloe Griffin, Thomas Gernon, Elias Rugen, Anthony Spencer, Geoffrey Warrington, and Thea Hincks

The two Cryogenian ‘snowball Earth’ glaciations, the Sturtian (~717-658 Ma) and Marinoan (~654-635 Ma), represent extreme climate states when ice reached equatorial latitudes and persisted for millions of years. Varve-like laminites deposited before and after the Sturtian glaciation reflect high-frequency climate cycles linked to solar, ocean and atmospheric dynamics. However, to date, no evidence of such cycles has been documented during the snowball Earth interval. Here, we analyze a ~5.5 m thick bed of laminites within the Port Askaig Formation, Scotland—a Sturtian glaciogenic succession—to reconstruct short-term climate variability on snowball Earth. Petrographic analysis indicates the laminites represent annual varves, reflecting freeze-thaw cycles and seasonal sediment contributions to a glacio-lacustrine environment. Spectral analysis of laminar set thickness reveals statistically significant periodicities of similar length to the present-day Quasi-Biennial Oscillation, Schwabe cycle, and Gleissberg cycle. This finding supports linkages between solar forcing, dynamic ocean circulation and regional climatic variability, which modulated glaciogenic sedimentation during the Sturtian. The preservation of multiannual to multidecadal cycles within the laminites provides important new insight into the persistence of solar-ocean-atmospheric interactions during the Cryogenian.

How to cite: Griffin, C., Gernon, T., Rugen, E., Spencer, A., Warrington, G., and Hincks, T.: Interannual to multidecadal climate oscillations in the Cryogenian, EGU General Assembly 2025, Vienna, Austria, 27 Apr–2 May 2025, EGU25-2138, https://doi.org/10.5194/egusphere-egu25-2138, 2025.

EGU25-3309 | ECS | Posters on site | TS2.8

Ediacaran-Cambrian Boundary in the Anti-Atlas belt (Morocco): A review of biostratigraphy, chemostratigraphy and geochronology 

Jamal El kabouri, Ezzoura Errami, Fred T Bowyer, Bruno Beker-Kerber, Said Belkacim, and Antoine Triantafyllou

The Ediacaran-Cambrian transition represents a pivotal geological time, denoting the decline of the Ediacaran biota and the emergence of most modern animal phyla in an interval marked by perturbations to the carbon cycle (as evidence by carbonate carbon isotopes, δ13Ccarb), biotic turnover, dynamic paleoredox regimes, and magnetic field instability. Thick and laterally extensive exposure of marine sedimentary rock along the Anti-Atlas (AA) belt of Morocco constitute an especially important succession for global Ediacaran-Cambrian (E-C) chronostratigraphy. Here, numerous attempts have sought to pinpoint the exact stratigraphic level of the E-C boundary. The AA belt comprises ca. 3 km of continuous carbonate rocks, providing one of the most complete successions for the establishment of a global δ13Ccarb chemostratigraphic reference curve.

A growing number of publications in recent years have enhanced the stratigraphic, paleontological and geochronological record of the AA belt. However, despite extensive efforts, the precise position of the E-C boundary in the Anti-Atlas remains ambiguous. The δ13Ccarb data from this region have been used to inform rates of change in global palaeomarine redox conditions, biotic innovation and turnover, but significant inconsistencies remain in global correlation.

Here, we conduct a comprehensive examination of the available chemostratigraphic, paleontological, and geochronological data associated with the late Ediacaran-Cambrian Ouarzazate Group and Adoudou Formation within the AA belt. The objective is to refine our understanding of the regional expression of the E-C boundary and offer clarity on the inconsistencies observed among biostratigraphic, chemostratigraphic and geochronological datasets. This review highlights that the stratigraphic level currently assumed to represent the E-C boundary in the AA belt relies primarily on δ13Ccarb data and, in particular, a prominent negative δ13Ccarb excursion. However, the precise level of the E-C boundary in this region lacks corroborating evidence from other independent markers such as geochronological data or, crucially, the presence of the boundary-defining ichnospecies Treptichnus pedum.

Through the integration of newly available data and interrogation of global chemostratigraphic, biostratigraphic, and geochronological information, our findings suggest that the E-C boundary within the Western Anti-Atlas may be positioned as low as within the upper unit of the Tabia Member. However, this interpretation relies heavily on the presumed Fortunian age of the ichnotaxa Monomorphichnus, because no co-occurring specimens of T. pedum are yet known. Moreover, a revised litho- and chemostratigraphic correlation that employs a compilation of published geochronological markers indicates that the Tabia and Tifnout members in the Central and Eastern Anti-Atlas do not correlate with the same named members in the Western Anti-Atlas. Both the Tabia and Tifnout members of the Central-Eastern Anti-Atlas may instead correlate with the middle part of Tifnout Member in the Western Anti-Atlas. This implies a late Ediacaran to early Cambrian ca. 10 m.y stratigraphic gap in the Central-Eastern Anti-Atlas and hence the E-C boundary in the Central-Eastern Anti-Atlas is likely situated within the unconformity between the Ouarzazate and Taroudant Groups.

Keywords: Anti-Atlas, Ediacaran-Cambrian boundary, Lower Cambrian ichnozone, Ouarzazate Group Adoudou Formation

How to cite: El kabouri, J., Errami, E., Bowyer, F. T., Beker-Kerber, B., Belkacim, S., and Triantafyllou, A.: Ediacaran-Cambrian Boundary in the Anti-Atlas belt (Morocco): A review of biostratigraphy, chemostratigraphy and geochronology, EGU General Assembly 2025, Vienna, Austria, 27 Apr–2 May 2025, EGU25-3309, https://doi.org/10.5194/egusphere-egu25-3309, 2025.

EGU25-4074 | Posters on site | TS2.8

Geochronological and Petrochemical Study of Non-Glaciogenic Neoproterozoic Banded Iron Formations (Anti-Atlas, Morocco): Insights into Their Formation in a Suboxic Arc-Related Basin 

Emma Calassou, Antoine Triantafyllou, Alex Bisch, Baptiste Debret, Delphine Bosch, Olivier Bruguier, Jamal El Kabouri, Linru Fang, Audrey Margirier, Clementine Fellah, Julien Berger, Veronique Gardien, and Gweltaz Maheo

The resurgence of Banded Iron Formations (BIFs) during the Neoproterozoic, following a billion-year hiatus, reflects significant geodynamic and climatic transition. Newly discovered Neoproterozoic BIFs in the central Anti-Atlas region of Morocco provide key insights into these processes. The studied BIFs units are exposed within the Bou Azzer-El Graara inlier (Central Anti-Atlas), an oceanic paleo-suture zone between the Paleoproterozoic West African Craton and remnants of a Neoproterozoic magmatic arc. This inlier comprises 750 to 680 Ma magmatic arcs and ophiolitic remnants, both intruded by ~650 Ma dioritic plutons and overlain by Ediacaran metasedimentary sequences. The studied BIFs are hosted in meta-volcano-sedimentary units, intercalated between magmatic arc and ophiolitic complexes, and locally intruded by igneous bodies. Neither the BIFs nor their host volcano-sedimentary schists are associated with glacio-derived sediments.

Petrological, geochemical, and geochronological analyses were conducted to reconstruct the paleo-depositional environment and identify the mechanisms of BIF formation. In situ U-Pb dating on hematite yielded a crystallization age of 641 ± 41 Ma. Hematite dating could be interpreted as an early diagenetic age probably close to BIF deposition.

The whole-rock major and trace element composition of the Bou Azzer BIFs exhibits a high correlation among terrigenous proxies (e.g., Al, Zr, Hf) and silica content, with trends strongly aligning with the felsic host rocks. This suggests that the BIFs’ whole-rock geochemical signature, specifically the siliceous layers, is predominantly controlled by detrital inputs. Multi-element geochemistry, (e.g. mean La/YbSN ratio of 0.36, low TiO₂ content of 0.24 wt%, Y/Ho ratio of 26, Nb-Ta depletion) combined with Nd-Sr isotopic data from the host rocks (εNdᵗ +4.0 to +4.5), indicates a juvenile arc source, consistent with presence of igneous minerals, such as feldspar, epidote, and amphibole, in both the host rocks and BIF samples.

Hematite in BIFs show two habitus: large euhedral grains surrounded by platy hematite. Petrographic evidence suggests that euhedral hematite precipitated at a more precocious stage, while platy hematite is distinctly aligned with the foliation of the host sediments. In situ LA-ICP-MS analyses of hematite from the two habitus reveal distinct geochemical signatures from each other and from the whole-rock compositions. Overall, hematite exhibits significantly lower ΣREE and superchondritic Y/Ho ratios up to 42, with a median value of ~28. Large euhedral hematite displays a pronounced negative Ce anomaly, indicative of precipitation from oxygenated seawater and distant from hydrothermal sources, as shown by low positive Eu anomaly (~1.06). The chemical composition of platy hematite shows no Eu or Ce anomalies, suggesting anoxic conditions during diagenetic crystallization. 

The Bou Azzer BIFs are Cryogenian and were deposited in an arc-bounded basin, with no evidence of glaciogenic influence. This paleo-depositional context emphasizes the role of limited arc-related basins during the Neoproterozoic, which facilitated the development of unique suboxic conditions.

How to cite: Calassou, E., Triantafyllou, A., Bisch, A., Debret, B., Bosch, D., Bruguier, O., El Kabouri, J., Fang, L., Margirier, A., Fellah, C., Berger, J., Gardien, V., and Maheo, G.: Geochronological and Petrochemical Study of Non-Glaciogenic Neoproterozoic Banded Iron Formations (Anti-Atlas, Morocco): Insights into Their Formation in a Suboxic Arc-Related Basin, EGU General Assembly 2025, Vienna, Austria, 27 Apr–2 May 2025, EGU25-4074, https://doi.org/10.5194/egusphere-egu25-4074, 2025.

EGU25-7188 | Orals | TS2.8 | Highlight

Testing enhanced surface weathering hypotheses for Snowball Earth 

Thomas Gernon and Thea Hincks

The Cryogenian Period, which began around 720 million years ago, was marked by prolonged low-latitude glaciations known as ‘Snowball Earth’. The prevailing hypothesis is that these global cooling events were driven by enhanced weathering of continental fragments in the tropics during the breakup of the Rodinia supercontinent. To test this idea, we applied a Bayesian network analysis (cf. Gernon et al., 2021) to examine the statistical relationship between seawater chemistry (⁸⁷Sr/⁸⁶Sr) and the fraction of continental land in the tropics, as inferred from recently available plate tectonic reconstructions. Our results reveal a weak overall correlation between these variables, even when accounting for multi-million-year time lags and the effects of auto-correlation in the time series. This finding suggests that the Earth's weathering response to global tectonic reorganisation is more complex than previously assumed. We conclude that while enhanced chemical weathering may have driven Snowball Earth, it likely arose from processes other than the first-order distribution of continents in the tropics, although a secondary influence cannot be excluded. Finally, we explore alternative plate tectonic mechanisms that yield unexpectedly long time lags between continental breakup and changes in ocean chemistry and climate, which may help reconcile disparate observations from the geologic record.

Reference

Gernon, T.M., Hincks, T.K., Merdith, A., Rohling, E.J., Palmer, M.R., Foster, G.L., Bataille, C.P. and Muller, D. Global chemical weathering dominated by continental arcs since the mid-Palaeozoic. Nature Geoscience 14, 690–696, doi: 10.1038/s41561-021-00806-0 (2021).

How to cite: Gernon, T. and Hincks, T.: Testing enhanced surface weathering hypotheses for Snowball Earth, EGU General Assembly 2025, Vienna, Austria, 27 Apr–2 May 2025, EGU25-7188, https://doi.org/10.5194/egusphere-egu25-7188, 2025.

EGU25-8991 | Posters on site | TS2.8

Climate Modelling of the late Neoproterozoic Era. 

Stephen Hunter, Benjamin Mills, Andrew Merdith, and Alan Haywood

The late Neoproterozoic Era saw deep glaciation and possible rises in atmospheric and marine oxygen levels. It has been suggested that these environmental changes could be the consequence of supercontinent breakup and amplified continental weathering rates, which could have drawn down CO2 and liberated nutrients. But this idea has not been tested using recent paleogeographic reconstructions and paleoclimate modelling. Here we present a suite of HadCM3L climate model simulations covering the late Neoproterozoic Era, specifically the descent into the Sturtian glaciation (800 – 715 Ma), based upon a new full-plate model and palaeogeographic framework. We outline the modelling strategy which includes representation of continental-scale icesheets and investigate the sensitivity of the climate to changing palaeogeography. To assess the implications for the carbon cycle, the resulting suite of climatologies are incorporated into the SCION climate-chemical model to produce a self-consistent reconstruction of biogeochemistry (including chemical weathering and atmospheric O2 and CO2) and climate. 

How to cite: Hunter, S., Mills, B., Merdith, A., and Haywood, A.: Climate Modelling of the late Neoproterozoic Era., EGU General Assembly 2025, Vienna, Austria, 27 Apr–2 May 2025, EGU25-8991, https://doi.org/10.5194/egusphere-egu25-8991, 2025.

EGU25-9990 | Posters on site | TS2.8

The Early Ediacaran orogenic history of the northern Arabian-Nubian Shield in a nutshell (Eilat area, Israel)  

Dov Avigad, Chen Vardi, Adar Glazer, Leo Millonig, Axel Gerdes, Richard Albert, and Yona Geller Lutzky

The Arabian-Nubian Shield (ANS) is a juvenile crust formed over more than 300 my of Neoproterozoic crustal evolution. In the northern ANS two major igneous cycles were most significant in manufacturing the continent: the older comprises Tonian intra-oceanic island arcs whereas the second saw widespread, Early Ediacaran late to post-tectonic granitoids and volcanics. A swarm of schistose dikes of basic to intermediate composition occurs in the Neoproterozoic basement of the Eilat area, in the northern ANS. These dikes were metamorphosed in epidote-amphibolite facies, are vertically-oriented, striking WNW-ENE, with marked vertical schistosity parallel to their walls. They are abundant in a 740 Ma Eilat granite gneiss and crosscut the regional foliation which dips moderately to the south. They are commonly thought to mark a break in the prolonged Pan-African orogenic history but their age is not well defined.

We located a unique field occurrence of a schistose dike crosscut by a granite pegmatite vein which in turn was deformed and folded parallel to the vertical schistosity. The marked foliation in the hinge zone of the folded granite vein formed by crystalline plasticity at elevated temperatures during metamorphism. This key outcrop provides the opportunity to tie high-resolution field observations to accurate, multi-system U-Pb geochronology and to evaluate the relations between dike intrusion, metamorphism, and the invasion of late to post-orogenic granitoids.

Zircon U-Pb geochronology from the schistose dike yielded 645±4 Ma, considered to mark the age of crystallization of the igneous protolith. Zircon from the deformed granite vein yielded an age of 617±17Ma, indicating the vein pertains to the abundant late- to post-orogenic granitoids that invaded the juvenile crust in the aftermath of Pan-African orogeny. Titanite from the schistose dike yielded a lower intercept U-Pb age of 626±4 Ma. With a closure temperature for Pb of ~550-650C, titanite records the age of its crystallization during metamorphism. Apatite yielded a lower intercept U-Pb age of 611±12Ma. With an effective closure temperature for Pb of 450-550°C, apatite serves as an important medium-temperature thermochronometer. Similarly, an apatite U-Pb age of 593±12Ma was determined for the adjacent, garnet-grade Eilat schist. We interpret apatite U-Pb age as representing the timing of cooling of the entire crustal edifice in the Eilat area.

Our study demonstrates that the Pan-African tectonometamorphic history in the Eilat area was punctuated by the intrusion of basic dikes at ~645 Ma. They penetrated an already accreted and metamorphosed island-arc sequence and were subsequently deformed and metamorphosed with their country rocks in the Early Ediacaran. The Early Ediacaran deformation and metamorphism partly overlapped the intrusion of late-orogenic granitoids (see also Elisha et al, 2017) and was immediately followed by rapid exhumation. Our previous work (Katz et al 2004) showed that the protoliths of schistose dikes from the nearby Roded area were high-Mg andesites, resembling boninites which are currently restricted to active subduction zones. We propose, as a working hypothesis, that the schistose dikes signify southward subduction of the proto-Tethys below the Gondwana margin in the late stages of Pan-African orogeny.

How to cite: Avigad, D., Vardi, C., Glazer, A., Millonig, L., Gerdes, A., Albert, R., and Geller Lutzky, Y.: The Early Ediacaran orogenic history of the northern Arabian-Nubian Shield in a nutshell (Eilat area, Israel) , EGU General Assembly 2025, Vienna, Austria, 27 Apr–2 May 2025, EGU25-9990, https://doi.org/10.5194/egusphere-egu25-9990, 2025.

The late Neoproterozoic–early Cambrian signify a time bracket when the Indian craton got separated from the supercontinent Rodinia and was in a process of becoming an integral part of supercontinent Gondwana.  The late Neoproterozoic–early Cambrian Bilara Group (BG) of the Marwar Supergroup provides a scope for study of depositional processes and spatio-temporal evolution of a distally-steepened carbonate ramp that developed on westward dipping greater Indian shelf; arguably formed in Indo-Arabian geological province during the time period. Deposited within an intracratonic rift/sag set up fringing the northern margin of the Aravalli craton, the BG succession, is subdivided under three Formations viz. Dhanapa, Gotan and Pondlu, in order of superposition.

Six different facies are identified within BL succession with their depositional environment spanning from supra-peritidal to intertidal to shallow and deep subtidal. The cabbage-headed stromatolites and crinkly laminites with tepee structure represent the shallowest supratidal-peritial setting whereas the LLH-type stromatolite in alternation with algal laminite and plane-laminated carbonates represent products of intertidal to shallow subtidal set-up. The limestone-shale heterolithics having signature of storm action is interpreted as deposit of subtidal shelf above storm wave base. The occurrence of calaclastite, intraclastic conglomerate with carbonate mass flows origin are indicative of steep slope at the distal part of the ramp. A distally-steepened ramp geometry is visualized for the Bilara carbonate platform. Additionally, metres-thick soft sediment deformation (SSD) structure layers including disharmonic folds, low-angle thrusts, distorted laminae, fluidisation pipes, slump and load structures, homogeneities, diapirs, etc. at different stratigraphic levels through the BG succession, traceable over hundreds of metres in outcrop, bear indication of basin-scale instability in course of Bilara carbonate platform development.  

From delineation of facies succession and documentation of facies stacking pattern, two cycles of deposition inferred from the Bilara lithopackage; DC1 and DC2. While the DC-1 is transgressive and represented by superimposition of facies types of increasing bathymetry, the second cycle DC-II is progradational, shallowing upward and represented by progressively shallow water facies types.

Stable isotope (C ) study on Bilara carbonate with systematic sampling from different facies associations reveal four major intervals of negative isotope excursion (EN1, EN2, EN3 and EN4) of medium to long duration and three positive excursions (EP1, EP2, EP3) of short duration. The EN1- records highest negative value; where δ13Ccarb value as low as -10.4 ‰ but for significantly of short duration. The other three negative excursions (i.e. EN2, EN3 and EN4) δ13C values are quite similar and ranges in between –8 to -6.5‰; in terms of stratigraphic interval (i.e time duration) the EN3 records the longest.

In most of the cases , high negative δ13C values are in close association and succeeded upward by SSD horizons. The presence of SSD structures, presence of Bitumen in pore spaces and large scale negative carbon isotope suggest, destabilization of methane clatharate as possible cause of carbon isotope excursion.

How to cite: Sharma, R. and Chakraborty, P. P.: Depositional architecture of a Neopreoterozoic distally-steepened carbonate ramp from the Bilara Group, Marwar Supergroup, Rajasthan, India and a few clues on Supercontinent and  ocean- atmosphere interaction , EGU General Assembly 2025, Vienna, Austria, 27 Apr–2 May 2025, EGU25-12442, https://doi.org/10.5194/egusphere-egu25-12442, 2025.

EGU25-12980 | Posters on site | TS2.8

Tracking the transition from subduction to continental collision using Ce and Eu anomaly in detrital zircons 

Antoine Triantafyllou, Emma Calassou, Alex Bisch, Jamal El Kabouri, Delphine Bosch, Julien Berger, Olivier Bruguier, Jérome Ganne, Gweltaz Mahéo, Frederic Christophoul, and Mihai N. Ducea

Zircon geochemistry provides critical information on the melt from which they form. Specifically, Eu and Ce anomalies in zircons can be used to infer the evolution of average crustal thickness over time. However, they are typically influenced by multiple factors, such as the depth of magmagenetic processes, the nature of the parental magma, magma hydration, oxidation state, and the crystallization of minerals like plagioclase, apatite, and garnet. As a result, translating these data into paleo-depth is challenging and can introduce significant biases into interpretations of crustal evolution.

We tested these proxies on detrital zircons from the well-known Pan-African Anti-Atlas orogen. Current geodynamic models suggest an initial igneous phase (>800 Ma) dominated by rifting mafic magmatism, and the formation of oceanic basins and passive margins along the northern boundary of the West African Craton. Between 760 and 650 Ma, magmatic arcs developed, characterized by juvenile mantle-derived magmas. This period is followed by the closure of oceanic domains around 630 Ma and the subsequent development of syn-orogenic flysch basins. Abundant post-collisional to Cadomian felsic magmatism ignited around 610 Ma and lasted until 550 Ma.

A dataset of 827 Neoproterozoic zircons was statistically analyzed using bootstrap approach to produce chemical timeseries for both Eu and Ce anomalies. The results are the following: (i) pre-760 Ma (12% of zircons data): shows a slightly increasing trend in Eu (negative) and Ce (positive) anomalies. (ii) 760 - 710 Ma: zircon's age-frequency diagram suggests a first magmatic inflation around 750 Ma, Eu anomaly trends decrease while Ce anomaly remains constant. (iii) 710 - 630 Ma: Ce anomaly is still constant, but Eu anomaly shows a gradual decrease. (iv) 630 - 600 Ma: both proxies drop sharply and synchronously, coinciding with a negative shift from a compilation of whole-rock Nd signatures. This marks the implication of the West African Craton crust in the source of post-collision magmas. (v) 600 - 550 Ma: both proxies rise significantly and remain closely correlated.

Our analysis reveals that the paroxysm of the magmatic flare-up occurs at the transition from oceanic subduction to continental collision (at ~630 Ma) in the Anti-Atlas orogenic belt. If used as a proxy for crustal thickness, the Eu/Eu* ratio in zircons would be expected to increase around 630 Ma, as most geological markers indicate crustal thickening related to continental collision. However, it instead shows a sharp decline strongly correlated with Ce anomaly and coinciding with a major shift in magma sources—from mantle-dominated to crust-dominated. Conversely, intervals associated with variations in crustal thickness (from 760 to 700 Ma for example) exhibit a clear decorrelation between the Eu and Ce anomalies time series. This shows that magmatic changes associated with geodynamic transitions (e.g., from rifting to subduction to collision) have a significant impact on zircon trace element composition which inhibits other variations related to petrogenetic processes or crustal architecture.

How to cite: Triantafyllou, A., Calassou, E., Bisch, A., El Kabouri, J., Bosch, D., Berger, J., Bruguier, O., Ganne, J., Mahéo, G., Christophoul, F., and Ducea, M. N.: Tracking the transition from subduction to continental collision using Ce and Eu anomaly in detrital zircons, EGU General Assembly 2025, Vienna, Austria, 27 Apr–2 May 2025, EGU25-12980, https://doi.org/10.5194/egusphere-egu25-12980, 2025.

EGU25-14406 | ECS | Orals | TS2.8

Long duration of the ~56 Myr Sturtian Snowball Earth event suggests missing link in geologic carbon cycle. 

Trent Thomas, Francis Macdonald, and David Catling

There were at least two major glaciation events (i.e., “Snowball Earth” events) in the Neoproterozoic Era when ice sheets dominated Earth’s surface. Radioisotopic dating indicates the first, Sturtian glaciation lasted ~56 Myr, and the second, Marinoan glaciation lasted ~4 Myr.

Why do the two glaciation events – which are only separated by a ~22 Myr interglacial gap – have a ~14x difference in duration? To first order, the glacial termination, and thus duration, is determined by (1) changes in the albedo of Earth’s surface and/or (2) changes in greenhouse warming from the atmosphere, likely driven by enhanced CO2 and the geologic carbon cycle.

Here, we simulated the evolution of atmospheric CO2 via the geologic carbon cycle during the Sturtian and Marinoan glaciation events to determine what conditions could explain the difference in their duration. While the 4 Myr Marinoan glaciation was reproduced in >30% of model runs with a variety of model parameter values, we find that only 0.05% of model runs reproduced the 56 Myr Sturtian glaciation. The Sturtian model runs require very low levels of CO2 outgassing from volcanos and extremely efficient seafloor weathering (which consumes CO2) to keep atmospheric CO2 levels low enough to sustain glacial conditions for 56 Myr. To reproduce the Marinoan glaciation, the opposite is required: a 1.6x increase in CO2 outgassing and a 10x decrease in seafloor weathering.

What could cause such drastic changes in CO2 outgassing and seafloor weathering in successive glaciations separated by only 22 Myr? Possible explanations relate to the Franklin Large Igneous Province (LIP), the depth of mid-ocean ridges, and high-temperature anhydrite production in the seafloor; however, none of these explanations are directly indicated by geologic evidence.

Therefore, the differing durations of the two glaciation events – and particularly the long duration of the 56 Myr Sturtian – indicate that an important aspect of the Neoproterozoic carbon cycle is not being captured. We suggest several possibilities and look forward to open discussions that may illuminate the solution.

How to cite: Thomas, T., Macdonald, F., and Catling, D.: Long duration of the ~56 Myr Sturtian Snowball Earth event suggests missing link in geologic carbon cycle., EGU General Assembly 2025, Vienna, Austria, 27 Apr–2 May 2025, EGU25-14406, https://doi.org/10.5194/egusphere-egu25-14406, 2025.

EGU25-14862 | Orals | TS2.8

Fluid-induced changes in suites of high-grade rocks along the Mahanadi Shear Zone in northern Eastern Ghats Belt, India 

Nilanjan Mondal, Sankar Bose, Proloy Ganguly, and Gautam Ghosh

The present study focuses on the complex fluid-induced processes involved in the evolution of two suites of high-grade rocks from the northern part of the Eastern Ghats Belt, India. We make a comparative study on the role of fluids in the modification of lower crustal rocks; the felsic gneiss/granite mylonite in the Mahanadi Shear Zone (MSZ) and investigate the origin of several micrometres to meters thick syenite veins hosted in and at the contacts of mafic granulite and charnockite away from the MSZ. The syenite (K-feldspar-hyalophane-clinopyroxene-titanite-fluorapatite-allanite-epidote-calcite/REEcarbonates-actinolite-quartz with or without ilmenite-thorite-zircon) is coarse-grained and bears mineralogical features distinct from either side of the contact. We document features like orthopyroxene changing to clinopyroxene, anorthitic rims on plagioclase, and myrmekite patches at the syenite and mafic granulite interface. K-feldspar and hyalophane occur in coarse-recrystallized pockets with the latter often occurring along grain boundaries of the former. Fluorapatite grains occur as euhedral megacrysts and are marginally replaced by patchy as well as large crystals of allanite (typically zoned and consisting of thorite inclusions), epidote, and actinolite grains. The entire assemblage is infiltrated by calcite veins and patches. We interpret this as a metasomatic transformation of the original charnockite rock (orthopyroxene- K-feldspar- quartz ± ilmenite and titanite) that was driven by late-stage magmatic fluid, charged with CO2-F-H2O species. This late fluid could have mobilised Ca from the mafic granulite and formed the syenite veins. An alternative mechanism by syenite magmatism looks like a distant possibility as found in the north-western margin of the belt. The felsic gneiss from the MSZ also hosts evidence of a channelised fluid flow associated with shearing. Textures of K-feldspar micro-veins and patches in and around quartz and plagioclase matrix are likely to be caused by fluid action. Monazites in this rock preserve extensive fluid alteration signatures, indicated by compositional zoning, sub-domains and resetting of ages, suspected to have been caused by the process of coupled dissolution-reprecipitation. The unaltered monazite shows distinct age signatures in the range ca. 1000-900 Ma which presumably implies the timing of a major tectonothermal event that joined the Angul domain in the north and the Phulbani domain in the south. The fluid-mediated monazite domains, on the other hand, show a spectrum of ages in the range ca. 890-810 Ma. Our combined mineralogical-textural and geochronological study thus identifies a channelised fluid event during pervasive shearing associated with the amalgamation of two crustal domains of the Eastern Ghats Belt.

How to cite: Mondal, N., Bose, S., Ganguly, P., and Ghosh, G.: Fluid-induced changes in suites of high-grade rocks along the Mahanadi Shear Zone in northern Eastern Ghats Belt, India, EGU General Assembly 2025, Vienna, Austria, 27 Apr–2 May 2025, EGU25-14862, https://doi.org/10.5194/egusphere-egu25-14862, 2025.

The Neoproterozoic tectonics at the northeast–southwest trending western margin of the Aravalli-Delhi Mobile Belt (ADMB) along the South Delhi Fold belt (SDFB) is highly debated due to the spread of geochronological data from different parts of the belt. The dataset of the magmatic and metamorphic ages of the granitic rocks ranges from Stenian to Tonian Period. However, there is a lack of clarity on whether the orogenesis of the belt (SDFB) along Phulad-Ranakpur Lineament (PRL) is associated with the Grenvillian orogeny or it is a much younger Pan-African orogeny. Therefore, the tectono-stratigraphy of the region to elucidate the overall formation of the Greater Indian Landmass (GIL) is difficult to understand. To solve this problem, a comprehensive study through systematic geological mapping, structural analysis, metamorphic and geochronological study has been conducted in and around Kumbhalgarh-Sayra-Ranakpur area, Rajasthan, India. The study demarcates three phases of deformation (D1, D2 and D3) and their subsequent prograde/retrograde metamorphic events in the calcareous rocks. The first generation isoclinal, reclined (F1) folds are the result of D1 event which are synchronous with prograde amphibolite facies metamorphism (~5 kbar, 650 oC). This is followed by (D2) formation of outcrop to map-scale upright (F2) folds. D3 is marked by ‘partitioned transpression’ along subvertical shear zones (Steep zones) within the folded sequences of SDFB. Oblique slip dextral-reverse movement (D3a) along the Kumbhalgarh Steep Zone (KSZ) formed an outcrop-scale positive flower like structure. At the western limit of the SDFB, along the PRL, the Ranakpur Shear Zone (RSZ) shows rotated and steepened hinges of the F2 folds (D3b). U-Pb zircon dating is done for the zircon grains derived from the intrusive granites associated with different phases of deformation. The oldest granitic intrusion (strongly deformed pink granite from RSZ: pre-D2) occurred at ca. 990 Ma which indicates a Grenville-age orogeny for the SDFB rocks. The leucocratic granites from the KSZ (post-D2, but pre-D3) suggests ca. 850 Ma age. However, the third deformation (D3 = D3a and D3b), a progressive interlinked transpression, is identified as a ca. 822-819 Ma event from the granite ages. Undeformed leucocratic granite from RSZ shows the youngest age of ca. 819 Ma as a late-tectonic event and that marks the final suturing event between the ADMB and MC along the Phulad-Ranakpur paleo-suture zone to form the GIL. The geochemical signatures of the different varieties of granites from different parts of the SDFB also supports a collisional setting for the granite magmatism. The spacial distribution of early (ca. 1000-900 Ma) and late (ca. 800-700 Ma) Tonian magmatic and metamorphic ages over the SDFB demarcate that there is a younging trend from Beawar and Sendra area in the north to Mt. Abu and Ambaji area in the south. Hence, it can be concluded that the collision of the two blocks (ADMB and MC) started in the northern part and eventually the growth of the GIL took place through different stages of oblique collision in a pulsating manner through the Early Neoproterozoic.

How to cite: Hatui, K., Chattopadhyay, A., and Das, K.: Evidence of oblique collision between the Aravalli Delhi Mobile Belt and Marwar Craton along the Phulad – Ranakpur paleo-suture zone: Implication for the partition transpression style deformation during the Grenville-age orogeny, EGU General Assembly 2025, Vienna, Austria, 27 Apr–2 May 2025, EGU25-15268, https://doi.org/10.5194/egusphere-egu25-15268, 2025.

Understanding the significance of the Indian Shield in the reconstruction of tectonic plate amalgamation in geological history requires an analysis of the evolution of the Chotanagpur Granite Gneiss Complex (CGGC), which is regarded as a component of the Rodinia supercontinent. The major lithology of the CGGC is felsic orthogneiss, which contains enclaves of mafic granulites, metapellites, and calc-silicates. The present study focuses on the mafic enclaves hosted within the felsic orthogneiss located in the Bero-Saltora area of the eastern part of CGGC. The rocks comprise of orthopyroxene (Opx), clinopyroxene (Cpx1) and plagioclase (Pl1) representing the high-grade granulite facies assemblage and variable amount of amphibole. The amphibole is found to replace the earlier minerals suggested by their occurrence as relict within this phase. The rock shows occurrence of a second generation clinopyroxene (Cpx2) and plagioclase (Pl2) developed as symplectite at a high angle to the amphibole's grain boundary. This feature suggests that the rock witnessed a metamorphic dehydration reaction post to the hydration event that formed amphibole in the anhydrous rock. Rarely occurring and locally developed, the symplectite texture indicates that the majority of the rock did not record the conditions under which this assemblage formed. The reaction sequences after stabilization of granulite facies assemblage (Opx+Cpx1+Pl1) can be drawn as Opx + Cpx1 + Pl1 → Amp, followed by Amp → Cpx2 +Pl2. Previous research from this region has modeled the granulite facies event and the ensuing hydration; however, despite the fact that similar symplectite assemblages have been documented, to our knowledge no study has studied the detailed petrological significance of the texture from the studied area. In this study, we will focus on the petrological significance and their connection to the geological evolutionary history of CGGC using detailed petrography and thermodynamic modeling.

How to cite: Banerjee, S., Adak, V., and Dutta, U.: Imprint of metamorphic dehydration reactions subsequent to amphibolitization of mafic granulite from Eastern part of Chotanagpur Granite Gneiss Complex (CGGC), India., EGU General Assembly 2025, Vienna, Austria, 27 Apr–2 May 2025, EGU25-16901, https://doi.org/10.5194/egusphere-egu25-16901, 2025.

EGU25-18792 | Orals | TS2.8

Geochemistry and high-precision zircon U-Pb geochronology of the Nama Group reveal foundational uncertainties in terminal Ediacaran chronostratigraphy 

Fred Bowyer, Fabio Messori, Rachel Wood, Ulf Linnemann, Esther Rojo-Perez, Mandy Zieger-Hofmann, Johannes Zieger, Junias Ndeunyema, Martin Shipanga, Bontle Mataboge, Dan Condon, Catherine Rose, Collen-Issia Uahengo, Sean Gaynor, Inigo Muller, Gerd Geyer, Torsten Vennemann, and Maria Ovtcharova

     The late Ediacaran Nama Group of southern Namibia and northwestern South Africa hosts a mixed carbonate-siliciclastic Proterozoic succession and is key for resolving the timing of early metazoan evolution, leading to a suite of geochronology studies of these rocks. Important outcrops of the upper Nama Group are found in the Swartpunt area, where the depositional sequence is preserved as a series of thrust plates that formed during compression associated with the Gariep orogeny. Here, numerous silicified volcanic tuff interbeds are present, but different interpretations regarding the fidelity of associated tuff bed ages result in very different regional stratigraphic correlations. We use geological mapping, integrated with lithostratigraphy, carbonate carbon isotope (δ13Ccarb) chemostratigraphy and high-precision radioisotope geochronology from outcrop and recently acquired drill core from the ICDP project GRIND-ECT (Geological Research through Integrated Neoproterozoic Drilling – Ediacaran-Cambrian Transition) in an attempt to address this issue. A compilation of new and published zircon U-Pb ages from the Swartpunt area shows systematic age repetition within the upper Nama Group, that either reflects pervasive zircon reworking or points to the presence of a cryptic décollement. We investigate the evidence for and against both scenarios, and consider their implications for stratigraphic and δ13Ccarb correlations between the Swartpunt area and coeval autochthonous exposures along the Orange River border with South Africa.

     The first scenario implies that some published ash bed ages may be >1 Myr older than their depositional age, increasing the uncertainty of the chronostratigraphic correlation between these two areas by up to 0.22% of the age compared with an analytical uncertainty as low as ±0.02% from the youngest coherent zircon populations. If this scenario is preferred, then a cautious approach would be to consider all ash bed zircon U-Pb ages to reflect maximum depositional ages, thereby highlighting an insidious complication for calibrating rates of paleoenvironmental change and biotic innovation at the dawn of the Cambrian explosion. Given that these issues are revealed in an area that benefits from numerous silicified ash beds and extensive exposure, the inability to confidently discount either scenario highlights a level of compounding uncertainty in stratigraphic correlation that should be carefully considered when constructing global chronostratigraphic frameworks in any interval of the geologic record.

How to cite: Bowyer, F., Messori, F., Wood, R., Linnemann, U., Rojo-Perez, E., Zieger-Hofmann, M., Zieger, J., Ndeunyema, J., Shipanga, M., Mataboge, B., Condon, D., Rose, C., Uahengo, C.-I., Gaynor, S., Muller, I., Geyer, G., Vennemann, T., and Ovtcharova, M.: Geochemistry and high-precision zircon U-Pb geochronology of the Nama Group reveal foundational uncertainties in terminal Ediacaran chronostratigraphy, EGU General Assembly 2025, Vienna, Austria, 27 Apr–2 May 2025, EGU25-18792, https://doi.org/10.5194/egusphere-egu25-18792, 2025.

EGU25-19357 | ECS | Posters on site | TS2.8

Early to Mid‐Neoproterozoic Tectonics of Northwestern India and it’s implications for Rodinia reconstruction 

Ayan Kumar Sarkar, Alip Roy, Sadhana M. Chatterjee, and Anirban Manna

The Phulad Shear Zone, a NE–SW trending ductile transpressional shear zone with a southeasterly dip, developed between ca. 820–810 Ma and marks the tectonic boundary between the Marwar Crustal Block and the South Delhi Fold Belt to the east. The evolution of the Marwar Crustal Block, particularly before its accretion to Greater India, is poorly understood but involves three phases of ductile deformation: D1, D2, and D3. The D1 deformation is restricted to enclave gneisses, while the Megacrystic granite was emplaced syn-tectonically during D2 deformation, forming NNW–SSE magmatic foliation oblique to the PSZ. D3 deformation coincides with the PSZ and includes the emplacement of the porphyritic Phulad granite (~820 Ma) along and across the shear zone. Field evidence indicates that the Phulad granite crystallized during the regional deformation associated with Phulad Shear Zone. Magmatic foliation in this Phulad granite is characterized by parallel alignment of feldspar phenocrysts and microgranitoid enclaves, transitioning to solid-state foliation due to ongoing deformation. Structural analyses reveal that releasing bends of N–S orientation within the Phulad Shear Zone provided the space for the granite’s emplacement under a transpressional regime. Geochronological data further constrain the tectonic history. U-Pb zircon ages in the Marwar Crustal Block document magmatic events at ~890 Ma and ~860 Ma, with monazite ages peaking at ~820 Ma, marking significant tectono-thermal activity. EPMA U-Pb-Th monazite and U-Pb LA-ICP-MS zircon ages from the Phulad granite confirm its magmatic age at ~819 Ma, supporting its role as a stitching pluton during the accretion of the Marwar Crustal Block with the Indian landmass Integrating structural, geochronological, and field data suggests that the accretion of the Marwar Crustal Block postdated ~860 Ma and culminated during ~820–810 Ma along the Phulad Shear Zone. This event marked the assembly of the Greater India landmass, with the Phulad Shear Zone acting as a significant suture zone. These findings highlight the distinct geological evolution of the Marwar Crustal Block and its role in the tectonic assembly of northwest India within the broader framework of Rodinia’s fragmentation and reassembly.

How to cite: Sarkar, A. K., Roy, A., Chatterjee, S. M., and Manna, A.: Early to Mid‐Neoproterozoic Tectonics of Northwestern India and it’s implications for Rodinia reconstruction, EGU General Assembly 2025, Vienna, Austria, 27 Apr–2 May 2025, EGU25-19357, https://doi.org/10.5194/egusphere-egu25-19357, 2025.

EGU25-19819 | Posters on site | TS2.8

Neoproterozoic Tectonics of Northwest India: Insights from Field Evidence, Geochemistry, and Geochronology 

Sadhana Chatterjee, Alip Roy, Ayan Kumar Sarkar, and Anirban Manna

The South Delhi Fold Belt (SDFB) is a Proterozoic fold belt trending NE-SW in northwest India. Its western boundary is defined by the crustal-scale Phulad Shear Zone (PSZ). To the west of the SDFB lies the Marwar Craton, and the timing of its amalgamation with the rest of India has been a subject of long debate. Scattered occurrences of ~1 Ga granites near the PSZ within the SDFB are temporally associated with the assembly of the Rodinia supercontinent. Our detailed field investigations reveal distinct pre-shearing deformation patterns in the SDFB and the Marwar Craton rocks. Geochemical and geochronological analyses of rocks from the SDFB and Marwar Craton indicate an extensional regime around ~1 Ga, with the collision and suturing of the Marwar Craton and SDFB occurring as late as 820 Ma. Our findings suggest that northwest India lacks geological evidence supporting the assembly of Rodinia, a critical insight for reconstructing Rodinia's paleogeography and clarifying India's role within the supercontinent.

How to cite: Chatterjee, S., Roy, A., Sarkar, A. K., and Manna, A.: Neoproterozoic Tectonics of Northwest India: Insights from Field Evidence, Geochemistry, and Geochronology, EGU General Assembly 2025, Vienna, Austria, 27 Apr–2 May 2025, EGU25-19819, https://doi.org/10.5194/egusphere-egu25-19819, 2025.

Two coal mines namely Kurja and Jhiriya were selected for investigation using multiproxy approach which included organic petrology, geochemistry and stable carbon and nitrogen isotope to reveal coal characteristics, paleo-depositional conditions and precursors material responsible for the paleomire. The results from the analysis reveal that the degraded humic material for the coal deposits was supplied from the surrounding terrestrial vegetation typical as vitrinite dominates the maceral groups followed by inertinite and liptinites. The degraded organic detritus in the samples suggest regular inundation of the mire aiding in degradation of the organic matter. The mineral matter observed through coal microscopy are dominantly argillaceous which is supported by mineral phases supported by x-ray diffraction and x-ray fluorescence studies. It is more likely that the Hasdeo basin coals were possibly deposited in the lacustrine environment with intermittent influx of siliceous detrital matter through fluvial channels. The geological setting and tectonics probably aided syn-rift sedimentation during the Permian. The mires shifted from rheotropic to mesotrophic regime due to the fluctuations in the water table during the evolution of the mire. The various indices such as the CIA, ICV, PIA and CIW are suggestive of moderate to intense weathering condition prevailing in the basin, the sediments were chiefly sourced dominantly from felsic with lesser input from mafic sources. The samples are rich in volatile matter (25.34 - 42.44 wt% on daf basis) in Kurja and (30.2 - 40.12 wt% on daf basis) in Jhiriya revealing low in rank which is also corroborated by the maturity parameter, vitrinite reflectance (random) having mean 0.40% in Kurja and 0.43% in Jhiriya. High oxygen to carbon and low hydrogen to carbon ratio suggest oxidation of the organic detritus in the mire. The elemental ratio in conjunction with stable carbon and nitrogen isotope are indicative of sedimentary organic matter sourced from C3 terrestrial plants. The carbon isotopic excursion in the basin based on delta δ13C aligns well with the global data in the isotopic shift in the coal and carbonaceous material revealing the paleo atmospheric carbon during the Permian periods. The study establishes the coeval nature of evolution of the isolated Gondwana sequences in the Indian sub-continent and in the various parts of the world.

How to cite: Naik, A. S. and Kumar, G.: Evolution of Permian coals of Hasdeo Basin, India: Insights from Organic Petrology, Geochemistry, and Stable Isotope analysis., EGU General Assembly 2025, Vienna, Austria, 27 Apr–2 May 2025, EGU25-20370, https://doi.org/10.5194/egusphere-egu25-20370, 2025.

The end-Permian event (EPE; c. 252 Ma) resulted in the loss of keystone plant species from humid tropical and high-latitude ecosystems and the extinction of several major insect groups. The subsequent Early to Middle Triassic evinced diminished terrestrial productivity, punctuated by a series of second-order biotic crises that hindered recovery. End-Permian ecosystem collapse resulted in the extirpation of productive wetland ecosystems, the primary carbon sinks on land, represented by the cessation of significant coal formation until the Middle Triassic. The gymnosperm seed fern Dicroidium (Order: Umkomasiales) emerged as the dominant floral component of most known terrestrial ecosystems of the Early Triassic across southern Gondwana and, by the Middle Triassic, was the principal coal-forming plant. Understanding when and how this ecologically important taxon rose to dominance will provide a gauge of ecosystem recovery and carbon sink stabilisation in Gondwana following the worst mass extinction event in Earth’s history.

While there have been many large-scale investigations into Middle Triassic plants and biodiversity, the Early Triassic interval of ecological recovery immediately following the EPE is poorly studied. In addition to examination of the fossil plants themselves, trace fossils of plant–arthropod interactions (PAIs) provide an independent window into assessing terrestrial ecosystem states through geological time. In this context, PAI records can be used for evaluating changes in herbivorous arthropod feeding guilds in the wake of global biotic crises. Here, we investigated three well-preserved early records of Dicroidium from the well-age constrained Lower Triassic strata of the Sydney Basin, Australia (the Skillion, Turimetta Head and Mona Vale). In this study, we: 1, systematically described the Dicroidium species from these localities; 2, interpreted their palaeoenvironmental contexts; 3, compared their diversity and morphological trends over time; and 4, recorded evidence of PAIs.

The floras exhibited a generally low species richness of Dicroidium overall, but an increase in richness and leaf size with increasing time from the EPE. Similarly, Dicroidium leaf fragments from each locality revealed evidence of PAIs (including margin feeding, hole feeding, galling, and oviposition), with the highest proportion of PAIs from the youngest locality. Increasing numbers of PAIs on the dominant plant genus in Gondwanan ecosystems indicate that foundational trophic interactions between plants and arthropods were slowly re-establishing in the early Mesozoic. Given the broadly similar depositional conditions, these changes cannot readily be attributed to differences in local environments. Collectively, our findings evidence the recovery of terrestrial ecosystems and carbon sinks over several millions of years following the worst warming-driven mass extinction in Earth’s history.

How to cite: Turner, H.-A., McLoughlin, S., Sweeney, A., and Mays, C.: Ecosystem recovery after the end-Permian event, Sydney Basin, Australia: Diversity and ecological interactions of the Early Triassic Dicroidium floras, EGU General Assembly 2025, Vienna, Austria, 27 Apr–2 May 2025, EGU25-1062, https://doi.org/10.5194/egusphere-egu25-1062, 2025.

EGU25-1220 | Orals | BG5.3

Tracking the co-evolution of microbial sulfur metabolisms and geodynamics at the Eoarchean - Paleoarchean (3800-3200 Ma) transition 

Stephen J. Mojzsis, Barbara Kremer, Johanna Marin-Carbonne, Paul Tackley, Christoph Heubeck, and Alida Timar-Gabor

Chemolithoautotrophy, free energy from chemical disequilibria in crustal environments, apparently sustained the last universal common ancestors (LUCAs) of all life. If the LUCAs relied on the reductive Acetyl-CoA metabolic pathway via abundant H2 (e- donor) and bicarbonate (e- acceptor), they were confined to hydrogenous (H2-producing) metalliferous (ultra-)magnesian alkaline hydrothermal (>50°C) systems. The later advent of photoautotrophy provided a new plentiful e- donor (Corg) that allowed early life to exploit Sulfur (S) compounds as an energy source. Here, we report new multiple S-isotope (32S, 33S, 34S; Δ33S) data from authigenic sedimentary sulfides in Eoarchean-Paleoarchean sedimentary rocks from Isua (West Greenland) and South Africa (Barberton) to trace this early metabolic evolution. Our aim is to: (i) pinpoint in time and space when life began to influence the marine S cycle; (ii) follow changes in primary (Corg) production; (iii) model commutations to Eoarchean-Paleoarchean geodynamic regimes; and (iv) experimentally test how Corg is altered. Geodynamic scenarios particular to the Eoarchean-Paleoarchean Earth supported early biodynamic environments in both plate tectonics vs. non-plate tectonic contexts. For example, crust production modulates nutrient supply to the oceans which in turn influences the timing and tempo of metabolic innovation. Bio-geo-dynamic changes in the early Archean set the stage for the eventual emergence of the Eukaryotes.

How to cite: Mojzsis, S. J., Kremer, B., Marin-Carbonne, J., Tackley, P., Heubeck, C., and Timar-Gabor, A.: Tracking the co-evolution of microbial sulfur metabolisms and geodynamics at the Eoarchean - Paleoarchean (3800-3200 Ma) transition, EGU General Assembly 2025, Vienna, Austria, 27 Apr–2 May 2025, EGU25-1220, https://doi.org/10.5194/egusphere-egu25-1220, 2025.

Volcanic activity plays a pivotal role in Earth’s material cycling and serves as a crucial mechanism in regulating atmospheric CO2 concentrations. During the Late Ordovician–Early Silurian, global volcanic activity was frequent, exerting substantial influences on paleoclimate, paleoceanographic changes, mass extinctions, and the formation of important hydrocarbon source rocks in the Early Paleozoic era. In this study, Hg content, Zr content, Hf content, and Zr/Cr were used to identify volcanic activity; Cu content, Mo content, TOC content, and carbon isotopes were used to determine primary productivity; U/Th, V/Cr, V/(V+Ni), and Ni/Co were used to analyze the redox conditions of the sedimentary environment; chemical index of alteration, Sr content, and Sr/Cu were used to discriminate paleoclimate; and Sr/Ba to discriminate paleosalinity. In the Katian in the Yangtze region, the water body was highly reducing, and at the beginning of the Rhuddanian, the maximum values of all redox indicators appeared, with the maximum values of U/Th reaching 7.99, V/Cr reaching 25.68, V/(V+Ni) reaching 0.89, and Ni/Co reaching 25.15, which meant that the water body was in the strongest period of reductivity at this time. In the middle and late Rhuddanian, U/Th, V/Cr, V/(V+Ni), and Ni/Co all showed a decreasing trend, indicating that the reductivity of the water body gradually weakened. The trend in marine water's reducibility paralleled that of primary productivity, as indicated by Cu, Mo, and TOC content and the δ13C value increasing from the Katian to the beginning of the Rhuddanian, and then starting to decrease, and reached their maximum values at the beginning of the Rhuddanian. Additionally, the frequency and thickness of the bentonite layers were gradually decreasing and thinning from the Wufeng Formation to the Longmaxi Formation, and indicators of volcanic activity intensity, such as Zr content and Hf content, and Zr/Cr ratio exhibited an overall declining trend from the bottom to the top, aligning with the pattern of volcanic activity and the evolution of the sedimentary environment in the Late Ordovician–Early Silurian. The weathering process of volcanic rocks and volcanic ash brought huge amounts of P to the ocean during the Late Ordovician-Early Silurian, accompanied by inputs of N, Fe, Zn, and other vital elements necessary for biological growth and development, triggering the flourishing of marine organisms in the Yangtze Sea, with a rapid increase in biomass and consumption of more oceanic and atmospheric CO2. The original organic carbon sequestered in the Wufeng-Longmaxi Formation in the Yangtze region is about 4582.493 Gt, and the global total original organic carbon sequestered during this period is at least 16131.135 Gt. Volcanic activity enhanced the biological pumping effect, which resulted in the largest organic carbon sequestration in the Early Paleozoic.

How to cite: Xie, H. and Liang, C.: Late Ordovician-Early Silurian global volcanism triggers biological pumping in the Yangtze region driving ocean and climate change, EGU General Assembly 2025, Vienna, Austria, 27 Apr–2 May 2025, EGU25-1320, https://doi.org/10.5194/egusphere-egu25-1320, 2025.

EGU25-1684 | ECS | Orals | BG5.3

Biodiversification and the Latitudinal Diversity Gradient over deep time: insights from mechanistic models 

Manon Lorcery, Laurent Husson, Tristan Salles, Sébastien Lavergne, Oskar Hagen, and Alexander Skeels

The rise in species richness from the poles to the tropics, known as the latitudinal diversity gradient (LDG), is one of the most widespread patterns in the distribution of modern ecosystems. Although first documented more than 200 years ago, its origins, evolutionary dynamics, and underlying mechanisms remain unresolved. While geological and climatic changes are recognized as key drivers of biodiversity patterns, the precise causal factors shaping the LDG and their relative contributions to species richness gradients are still debated. Here, we explore how spatiotemporal variations in the physical environment influence the LDG by simulating the global diversification of terrestrial mammals over the past 125 million years using a spatially explicit eco-evolutionary model (gen3sis). This approach allows us to investigate both the mechanisms driving the LDG and broader biodiversification processes in dynamic landscapes, integrating changes in geological, climatic, and surface processes. Our findings indicate that the modern LDG is largely shaped by paleoclimatic and paleogeographic factors, with limited influence from surface processes. This gradient has persisted since the Cretaceous, steepening and stabilizing in width from the early Tertiary. Over deep time, LDG drivers demonstrate a strong influence of tectonic activity on speciation rates. The modeled scenarios also support an "out of the tropics" model in which species primarily originate in the tropics and disperse toward the poles without losing their tropical presence. As a result, the tropics are defined not only as a cradle, fostering the origination of new species, but also as a museum, preserving biodiversity over deep time.

How to cite: Lorcery, M., Husson, L., Salles, T., Lavergne, S., Hagen, O., and Skeels, A.: Biodiversification and the Latitudinal Diversity Gradient over deep time: insights from mechanistic models, EGU General Assembly 2025, Vienna, Austria, 27 Apr–2 May 2025, EGU25-1684, https://doi.org/10.5194/egusphere-egu25-1684, 2025.

EGU25-1806 | ECS | Posters on site | BG5.3

Building the eukaryotic planet: a view from marginal marine settings 

Giovanni Mussini

Marginal marine settings – the deltaic, estuarine, and mudflat habitats at the interface of land and sea – offer exceptional taphonomic windows on the rise of eukaryotic ecologies. Organic microfossils from tidally influenced horizons point to pre-Cryogenian origins for major eukaryotic groups, including red algae (Butterfield 2000), putative fungi (Butterfield 2003, 2005), and amoebae (Porter et al. 2003; Dehler et al. 2012). Meanwhile, an absence of comparable records even in those supratidal settings offering exceptional preservation conditions (e.g., in early diagenetic silica) suggests that Precambrian eukaryotes were essentially confined to subaqueous environments. Yet, these windows onto early eukaryotic history are vanishingly rare and temporally restricted. Efforts to place them within a broader record, spanning the Precambrian-Cambrian transition and its Phanerozoic aftermath, have been frustrated by a lack of similar organically preserved biotas from Cambrian marginal marine settings. New ichnofossils and Small Carbonaceous Fossils (SCFs; Butterfield & Harvey, 2012) from mudcracked horizons of the Middle Cambrian Pika Formation (Western Canada) offer a comprehensive view on an early Palaeozoic fauna from a periodically emergent mudflat. The wiwaxiids, priapulids, stem- and crown-annelids, and burrow traces of the Pika biota show that both classic Burgess Shale-type metazoans and ecosystem engineers from modern classes ventured into Cambrian tidally influenced settings, where they coexisted with members of derived living orders. This attests to an early influence of animal ‘pioneer taxa’ on dysoxic, intermittently desiccating marginal habitats. These findings push the limits of metazoan ecological tolerance to dehydration, UV exposure and salinity and redox fluctuations (e.g. Sagasti et al., 2001; Blewett et al., 2022), complementing the Precambrian record to suggest shallow-marine settings as cradles of eukaryotic innovation across the Neoproterozoic-Cambrian boundary.


References

Blewett, T. A., Binning, S. A., Weinrauch, A. M., Ivy, C. M., Rossi, G. S., Borowiec, B. G., ... & Norin, T. (2022). Physiological and behavioural strategies of aquatic animals living in fluctuating environments. Journal of Experimental Biology225(9), jeb242503.

Butterfield, N. J. (2000). Bangiomorpha pubescens n. gen., n. sp.: implications for the evolution of sex, multicellularity, and the Mesoproterozoic/Neoproterozoic radiation of eukaryotes. Paleobiology26(3), 386-404.

Butterfield, N. J. (2005). Probable proterozoic fungi. Paleobiology31(1), 165-182.

Butterfield, N. J. (2005). Reconstructing a complex early Neoproterozoic eukaryote, Wynniatt Formation, arctic Canada. Lethaia38(2), 155-169.

Butterfield, N. J., & Harvey, T. H. P. (2012). Small carbonaceous fossils (SCFs): a new measure of early Paleozoic paleobiology. Geology40(1), 71-74.

Dehler, CM, SM Porter, and JM Timmons (2012) "The Neoproterozoic Earth system revealed from the Chuar Group of Grand Canyon", in JM Timmons and KE Karlstrom, eds., pp. 49–72, Grand Canyon Geology: Two Billion Years of Earth's History. Special Paper no. 489, Geological Society of America, Boulder, Colorado.

Porter, S. M., Meisterfeld, R., & Knoll, A. H. (2003). Vase-shaped microfossils from the Neoproterozoic Chuar Group, Grand Canyon: a classification guided by modern testate amoebae. Journal of Paleontology77(3), 409-429.

Sagasti, A., Schaffner, L. C., & Duffy, J. E. (2001). Effects of periodic hypoxia on mortality, feeding and predation in an estuarine epifaunal community. Journal of Experimental Marine Biology and Ecology258(2), 257-283.

How to cite: Mussini, G.: Building the eukaryotic planet: a view from marginal marine settings, EGU General Assembly 2025, Vienna, Austria, 27 Apr–2 May 2025, EGU25-1806, https://doi.org/10.5194/egusphere-egu25-1806, 2025.

EGU25-2266 | ECS | Posters on site | BG5.3

Development of a biogeodynamical tool for exploratory paleoclimate modelling  

Laure Moinat, Florian Franziskakis, Christian Vérard, Daniel Goldberg, and Maura Brunetti

Exploring the dynamical structure of complex systems like Earth’s climate generally requires run- ning simulations over long time scales and for a wide range of initial conditions [1] following a ‘bio- geodynamical approach’. This means that the simulations need to include interactions among the climatic components (in particular, dynamical atmosphere and ocean as in general circulation models, as well as representations of vegetation, sea and continental ice) under different plate tectonic config- urations for deep time modelling. This is hardly achieved using CMIP-like models, because of their high computational costs.

Here, we describe a recently developed biogeodynamical modelling tool that allows for running simulations over multi-millennial time scales within a reasonable amount of CPU-time. Starting from the MITgcm coupled atmosphere-ocean-sea ice setup, we have developed a global ice-sheet model based on the shallow-ice approximation, where in a first step the surface mass balance is computed as in [2]. In a second step, we will adapt the MITgcm land/snow model to properly compute the surface energy balance. The runoff map is obtained by the hydrological model pysheds [3] and takes into account the ice-sheet isostatic correction. These three components are further coupled with the well- known vegetation model BIOME4 [4] and the paleogeographical reconstruction model PANALESIS [5].

Such a coupled setup permits to investigate nonlinear interactions among the climatic components at the global scale. These interactions evolve and balance differently along Earth’s history under the effect of various types of forcing, leading to a wide range of climatic steady states for different paleogeographical reconstruction times, and potentially revealing the presence of tipping mechanisms. Here, we show a present-day validation of this coupled setup against observations and CMIP6-model results, and how we are planning to apply it to selected time frames in deep time.


References

[1] Brunetti and Ragon, Physical Review E 107, 054214 (2023)

[2] Tsai & Ruan, Journal of Glaciology 64,246 (2018)

[3] Bartos, Matt., pysheds: simple and fast watershed delineation in python. (2020)

[4] Kaplan et al., Journal of Geophysical Research 108, 8171 (2003)

[5] Vérard., Geological Magazine 156, 2 (2019)

How to cite: Moinat, L., Franziskakis, F., Vérard, C., Goldberg, D., and Brunetti, M.: Development of a biogeodynamical tool for exploratory paleoclimate modelling , EGU General Assembly 2025, Vienna, Austria, 27 Apr–2 May 2025, EGU25-2266, https://doi.org/10.5194/egusphere-egu25-2266, 2025.

EGU25-3297 | ECS | Orals | BG5.3

Intense CO2 consumption by pulsed volcano weathering near interglacial peaks in the Azores Archipelago (North Atlantic Region) 

Francisco Hevia-Cruz, Anthony Hildenbrand, Nathan Sheldon, François Chabaux, Fernando O. Marques, and Julie Carlut

The weathering of basaltic rocks, especially on volcanic islands, plays a crucial role in global carbon cycling. In these environments, intense precipitation and frequent exposure of fresh rocks accelerate weathering processes, thus favoring the uptake of atmospheric CO2. While most estimates of weathering rates derive from river chemistry, soils and paleosols –the solid residue of protracted interaction between surface waters and the volcanic substrate– remain underexplored. Developed in contact with the atmosphere and incorporated into the geological record once sealed by volcanic deposits, paleosols record valuable environmental information, including the paleoclimatic conditions under which they were formed. In this study, we investigated the geochemistry of paleosols developed in the Azores Archipelago over the past 1 Myr. Precise geochronology of volcanic units bracketing paleosols revealed pulses of fast soil formation during interglacial peaks, and indicates high soil formation rates (3–180 mm kyr-1), similar to modern soil formation rates in tropical volcanic islands. This suggests periods over which the Azores High-pressure system could have been weakened or centered farther to the south of its current position, allowing humid air masses to reach the Azores region. Geochronological evidence suggests high initial formation rates, rapidly decreasing to near zero after ~35 kyr. This might be attributed to a combination of cation depletion and precipitation of stable minerals. Paleosols have generally developed faster on pyroclastic deposits than on lava flows. However, those formed on lava flows required less vertical development to sustain high cation exports due to their higher density. Based on the geochemistry of paleosols and their parental materials, we estimated cation exports (0–2600 t km-2 yr-1) and associated CO2 uptake (0–35 × 106 Mol km-2 yr-1). These estimates generally exceed previous estimates based on the geochemistry of modern rivers in the Eastern Azores, by a factor of up to tenfold. Our results highlight the criticality of precise geochronological control to estimate past weathering and soil formation rates, and that atmospheric CO2 may have experienced short episodes of intense sequestration during interglacial stages, possibly contributing to subsequent cooling events over the past 1 Myr. A preliminary study of U-series geochronology on paleosols of the Azores provided promising results, consistent with our previous Ar geochronology. This is expected to provide a better understanding of the evolution of past weathering rates and consequent CO2 consumption in the Azores and other volcanic settings.

How to cite: Hevia-Cruz, F., Hildenbrand, A., Sheldon, N., Chabaux, F., Marques, F. O., and Carlut, J.: Intense CO2 consumption by pulsed volcano weathering near interglacial peaks in the Azores Archipelago (North Atlantic Region), EGU General Assembly 2025, Vienna, Austria, 27 Apr–2 May 2025, EGU25-3297, https://doi.org/10.5194/egusphere-egu25-3297, 2025.

Clay mineralogy records provide important climate archives of weathering and hydrology through time, but these paleoclimate signals may be obscured by authigenic or diagenetic overprinting. International Ocean Discovery Program Expedition 396 drilled an expanded Paleocene-Eocene Thermal Maximum (PETM) succession from the Modgunn Vent in the Northeast Atlantic Norwegian Continental Margin. The PETM succession here is marked by frequent occurrence of discrete ash beds (centimetre scale) and by thicker ash-rich deposits. Three major lithological units were identified from the Late Paleocene to the Early Eocene in holes U1568A and U1567B: Late Paleocene bioturbated mudstone (Unit VI), laminated mudstone from the PETM onset and earliest PETM body (Unit V), and ash-rich mudstone in the later PETM body (Unit IV). Smectite is the dominant clay mineral throughout the record, with minor components of illite, kaolinite, and quartz. However, the potential transformation of volcanic ash into authigenic smectite after deposition complicates using clay mineralogy as a proxy for paleoclimate and weathering at this site.

We apply X-ray diffraction (XRD) analyses to quantify the bulk mineralogical composition as well as the clay-sized fraction and electron microscopy (SEM/EDX) to characterise the compositional and morphological changes of the clay-sized fraction. These results enable us to investigate the contribution of volcanism to the clay signal in order to discriminate between continental weathering processes given by clay mineralogy and early diagenesis processes by the input of volcaniclastic material. Morphological analysis of smectites indicate the occurrence of both detrital and authigenic types, but the chemical compositions are clustered by lithological unit rather than type. Detrital smectites in all units are montmorillonite-beidellites, and in Units V and VI authigenic smectites resemble the composition of detrital smectites in the same unit – suggesting a precursory relationship. In Unit IV Mg-rich authigenic smectite (cheto type) makes up >95% of the clay-sized fraction and is associated with enhanced in situ alteration of volcanic ash. This record indicates volcanic ash was relatively well preserved in the latest Paleocene and earliest PETM (Units VI and V) and authigenic smectites were mostly derived from detrital smectite and therefore paleoclimate signals are preserved. In the later PETM, a relative increase in volcanic material to background sedimentation – through increased bioturbation and/or volcanic production – significantly influenced the clay fraction due to the formation of ash-derived authigenic smectite. This process overwhelms the percentage of detrital clay in the XRD record and therefore masked any paleoclimate signals in Unit IV.

How to cite: Turton, N., Xu, W., and Pellenard, P.: Assessing volcanic influence on clay minerals as weathering proxies during the Paleocene-Eocene Thermal Maximum from Modgunn Hydrothermal Vent (IODP Expedition 396), EGU General Assembly 2025, Vienna, Austria, 27 Apr–2 May 2025, EGU25-3510, https://doi.org/10.5194/egusphere-egu25-3510, 2025.

EGU25-3646 | ECS | Orals | BG5.3 | Highlight

How deep-time climate change has influenced the diversity of plants 

Jiaze Li and Iain Colin Prentice

Biodiversity loss and climate change are interlinked crises with global ecological and societal impacts. Common explanations for how climate shapes biodiversity focus either on spatial scale (whereby more extensive and/or isolated climates promote species richness) or on temporal scale (whereby older, or more stable, climates foster biodiversity). However, these hypotheses overlook the intrinsic link between the spatial and temporal dimensions of climate.

We investigated how spatio-temporal climate changes over deep time may have influenced global patterns of plant diversity through the lens of climate analogues. By compiling global occurrence records for 350,864 vascular plant species, we produced the most comprehensive and precise global map of plant diversity to date. We identified analogues of recent (1851–1989) climate conditions across several geohistorical time periods: the Early Eocene (ca. 50 Ma), the Mid-Pliocene (3.3–3.0 Ma), the Last Glacial Maximum (LGM, 22–18 ka) and the Mid-Holocene (ca. 6 ka). We quantified spatial climate change within temporal periods, temporal change across spatial gradients, and the integrated spatio-temporal dynamics of climate. We evaluated the relative contributions of these metrics in explaining global plant diversity variation and examined the correlations between the spatial and temporal dimensions of climate change.

Our findings extend previous hypotheses by showing that species richness is higher in climatic conditions that were historically more extensive and/or isolated and have remained so through time. We also reveal a previously unrecognized mechanism by which climatic conditions that have undergone geographic expansion and slower movement over deep time tend to harbour higher plant diversity. Moreover, the combination of temperature stability and precipitation variability has facilitated species accumulation in low-latitude regions.

Spatial and temporal dimensions of climate change are thus interconnected, with long-term trends and short-term variability influencing the geography and movement of climate analogues, which in turn shape species richness. By incorporating the spatio-temporal climate changes into models, we can almost completely (> 90%) explain the global patterns of plant diversity today.

How to cite: Li, J. and Prentice, I. C.: How deep-time climate change has influenced the diversity of plants, EGU General Assembly 2025, Vienna, Austria, 27 Apr–2 May 2025, EGU25-3646, https://doi.org/10.5194/egusphere-egu25-3646, 2025.

Quick take: We investigate the conditions behind exoplanetary habitability. We compare how different models (complex physics-based vs. parameterized evolution) estimate the climate of Earth-like planets. We identify which planetary properties are critical to assess habitable conditions, and how that impacts the reliability of parameterized modeling.

Estimating whether an exoplanet is habitable is a complex question that goes far beyond calculating its host star Habitable Zone. In addition to incoming radiation from the star, atmosphere composition, planetary rotation, topography, and ocean/continent layout can all affect surface conditions spatial distribution. Simple parameterized models of those exoplanets allow for testing a large parameter space quickly, while physics-based models are more complex and much more time consuming, only allowing for the modelling of more restricted cases. We wish to test how the limitations of both approaches affect our capacity to assess planetary habitability, given the limited characterization available for exoplanets at present and for the foreseeable future.

We use Earth as a reference case, as the only planet where data is available regarding surface conditions evolution. We present new modeling results from the 3D climate General Circulation Model (GCM) ROCKE3D applied to Earth-like planets, based on atmospheric compositions derived from internal thermal histories and outgassing evolution scenarios consistent with Earth observation. We also compare atmospheric compositions and interior/atmosphere evolution scenarios obtained in a parameterized interior approach to the results of the 2D/3D Earth mantle dynamics model StagYY.

The main properties that we have investigated are variations of length of day, continental vs. oceanic coverage, topography and diverse atmospheric compositions consistent with recorded constraints on the Earth.

We compare average surface temperatures, albedos, precipitations, ice and clouds coverage obtained in both simulations. We then evaluate precipitations, sea surface level, and ice coverage obtained in GCM simulations and compare them to the usual criteria for habitability (such as average temperatures above 273-258 K). Finally, we assess the reasons for discrepancies between the models.

The trend of the variations of average temperature through time (and CO2 abundances) is consistent in parameterized vs. GCM models, making parameterized approaches generally efficient for a broad estimate of average surface conditions. However, perturbations around the reference model result in stronger temperature variations in the GCM due to albedo feedback. The albedo variations can be significant in 3D simulations and are not considered in the parameterized approach. Additionally, spatial variations of local surface conditions are found to be large and dependent on properties that cannot be resolved by parameterized models nor observed for exoplanets. Supercontinent setups result in markedly dryer land than the present-day Earth continental layout. Even models with average temperatures below 273-258 K have significant ice-free ground in all continental setups.

How to cite: Gillmann, C.: The habitability of Earth-like (exo)planets: modelling and limitations., EGU General Assembly 2025, Vienna, Austria, 27 Apr–2 May 2025, EGU25-4476, https://doi.org/10.5194/egusphere-egu25-4476, 2025.

EGU25-5049 | ECS | Orals | BG5.3

Hydrological cycles perturbation of continental weathering during the Triassic-Jurassic transition and Toarcian Oceanic Anoxic Event 

Qian He, Sofie Lindström, Stephen Hesselbo, Christian Bjerrum, Mingsong Li, Jianxin Yu, and Jun Shen

The Early Jurassic represents a critical interval in Earth’s history, characterized by significant ecosystem perturbations both on land and in oceans. Huge releases of greenhouse gas (e.g., CO2, CH4) by large scale of volcanic eruptions are generally assumed to cause significant increases in temperature during the Triassic-Jurassic transition (TJT) and Toarcian Oceanic Anoxic Event (T-OAE). However, terrestrial environmental responses to the climate perturbations on land, e.g., type and intensity of continental weathering, during these two hyperthermal events are still unclear. Here, we present a continuous lacustrine succession from the Chuxiong Basin in Yunnan Province, China, through the analysis of an approximately 1800 meter core. By integration of sedimentological, paleontological, geochemical, and astronomical data, we have established a chronology spanning about 21 million years from the Rhaetian (Late Triassic) to the Aalenian (late Early Jurassic), calibrated by the long eccentricity cycles. Distinct negative carbon isotope excursions and peaks in sedimentary Hg abundance, confirm significant volcanism during both the TJT and T-OAE. However, the Chemical Index of Alteration (CIA) and clay mineral data show opposing responses for the two events, indicating increasing and decreasing (or constant) chemical weathering intensity during TJT and T-OAE, respectively. Therefore, we proposed that these event-specific chemical weathering variations imply responses of volcanism-induced hydrological changes at different latitudes during these events.

How to cite: He, Q., Lindström, S., Hesselbo, S., Bjerrum, C., Li, M., Yu, J., and Shen, J.: Hydrological cycles perturbation of continental weathering during the Triassic-Jurassic transition and Toarcian Oceanic Anoxic Event, EGU General Assembly 2025, Vienna, Austria, 27 Apr–2 May 2025, EGU25-5049, https://doi.org/10.5194/egusphere-egu25-5049, 2025.

EGU25-6489 | Posters on site | BG5.3

Unexpected intense weathering during glacial periods in the Central North Atlantic as recorded by paleosols from Flores Island (Azores) 

Anthony Hildenbrand, Francisco Hevia-Cruz, Laura Loiodice, and Nathan Sheldon

Global climate variations (e.g., during glacial-interglacial transitions) induce local climatic effects such as temperature and precipitation changes, significantly impacting the chemical and physical degradation of volcanic islands. Conversely, the weathering of volcanic rock, especially on volcanic islands, consumes CO2, thus impacting its concentration in the atmosphere and consequently the global climate. The Azores Archipelago (Central North Atlantic) is particularly sensitive to climate changes due to its position influenced by regional climatic drivers such as the North Atlantic Oscillation atmospheric system and the oceanic North Atlantic Gyre. Paleosols are key targets to reconstruct paleo-environmental conditions, as they constitute a valuable archive of both paleoclimatic conditions and weathering processes. Recent work on paleosols spanning the past 1 Myr in the Central and Eastern Azores showed pulses of fast soil formation during wet and warm interglacial stages locally promoting intense atmospheric CO2 consumption through weathering. Flores Island, in the Western Azores, is the perfect target to further study rates of weathering and paleosol formation, and document paleoclimate at the regional scale (~600 km separation between Western and Eastern Azores). In this work, K-Ar geochronology of volcanic units under and overlying paleosols was used to precisely constrain their mean ages and formation times. This was complemented with paleoclimatic proxies based on paleosol whole-rock geochemistry, which allowed us to reconstruct Mean Annual Precipitation (MAP) and Mean Annual Air Temperature (MAAT) at the time the paleosols were formed. Our results show two groups of paleosols formed mainly during glacial periods (~ 550 ka, 630-670 ka), in contrast with the Central and Eastern Azores, where paleosols were formed near interglacial peaks. Our MAAT and MAP reconstructions show that mild and wet conditions prevailed in Flores, reaching 21.5°C and 1340 mm yr-1, respectively. These conditions are hotter and drier than current mean annual conditions (17°C and 1716 mm yr-1). However, they show wetter/warmer conditions than those reached around interglacial peaks in the Central and Eastern Azores, consistent with modern climatic differences (wetter/hotter conditions to the west). As paleosol ages between Flores and other Azores islands do not overlap, our data could indicate (1) persistent wet/warm local paleo-conditions in Flores due to its position farther to the north-west compared to the Central and Eastern Azores, closer to the westerlies’ main trend; or (2) a regional warm and wet climate around 550 ka and 650 ka that remains to be investigated in the other parts of the Archipelago and the Atlantic region at a broader scale (e.g., the Canary volcanic archipelago). In any case, our data evidence periods of fast soil formation during glacial stages (10 to 367 mm kyr-1), supposed to be too dry and cold to allow the efficient weathering of the volcanic substrate, according to recent reconstructions in the Central and Eastern Azores. Such intense and fast weathering likely resulted in significant atmospheric CO2 consumption, at least at local scale. Further investigations of paleosols could improve our temporal and spatial resolutions, and consequently our understanding of the feedback between volcanic islands weathering and global climate.

How to cite: Hildenbrand, A., Hevia-Cruz, F., Loiodice, L., and Sheldon, N.: Unexpected intense weathering during glacial periods in the Central North Atlantic as recorded by paleosols from Flores Island (Azores), EGU General Assembly 2025, Vienna, Austria, 27 Apr–2 May 2025, EGU25-6489, https://doi.org/10.5194/egusphere-egu25-6489, 2025.

It is becoming increasingly well understood that the Earth’s interior and surface evolution is intrinsically interrelated with the evolution of its atmosphere, oceans, landscape and life. This understanding lays down principal foundations of Biogeodynamics – an emerging scientific field that explores the interface of geodynamics, geomorphology, climate, ocean and atmosphere sciences, biology and ecology in order to understand how the evolution of the planetary interiors, surface, atmosphere, ocean, climate, and life is coupled. Despite its strong scientific, educational and societal potential, Biogeodynamics has not been yet fully established as a new discipline. An intrinsically cross-disciplinary character of Biogeodynamics creates organizational, educational and scientific challenges due to the necessity of truly collaborative research and education to efficiently combine scientific knowledge, research tools and training approaches from the very different research fields (such as Earth Sciences, Biology, Ecology, Climate Sciences and Planetology), which evolved independently from each other. To address these challenges, recently approved COST Action EUROBIG (https://www.cost.eu/actions/CA23150/) established the first pan-European Biogeodynamics network, which currently includes >100 scientists from 26 countries. The envisaged EUROBIG networking activities will accelerate the development of Biogeodynamics as a discipline in Europe and worldwide by supporting and linking the relevant communities, facilitating interactions to address the important scientific, methodological, educational, networking and funding challenges of this new field. Here, I will present in short the EUROBIG COST Action, which is open for new participants interested in building, advancing and leading the global Biogeodynamics research community. I will also review some recent advances in computational Biogeodynamics to show why and how the unique Earth's global evolution style - plate tectonics – is coupled to biosphere dynamics thereby accelerating life evolution and controlling biodiversity dynamics. Implications from Biogeodynamics for finding habitable Earth-like exoplanets and for the future dynamics and longevity of human civilization will also be discussed.

How to cite: Gerya, T.: Pan-European Biogeodynamics network EUROBIG: outstanding challenges and opportunities, EGU General Assembly 2025, Vienna, Austria, 27 Apr–2 May 2025, EGU25-7005, https://doi.org/10.5194/egusphere-egu25-7005, 2025.

EGU25-8561 | Orals | BG5.3

Climate change-driven Late Miocene to Pliocene rise and fall of C4 vegetation in Anatolia (Türkiye) 

Maud J.M. Meijers, Tamás Mikes, Bora Rojay, H. Evren Çubukçu, Erkan Aydar, Tina Lüdecke, and Andreas Mulch

Since the emergence of life on Earth 2.8 billion years ago, plants have been capitalizing on the C3 photosynthetic pathway. In the world’s grasslands that emerged since the Paleogene, C4 vegetation expanded considerably between 8 and 3 Ma following climatic changes, which heralded profound terrestrial ecosystem changes. However, sparse reconstructions of C4 vegetation in the northeastern Mediterranean region prevent a reconstruction of C3-C4 vegetation dynamics.

We present the first extensive δ13C soil carbonate record for Anatolia (Türkiye) for the last 10 Ma, which we combine with existing records from the Aegean (Greece). Our results show the emergence of C4 vegetation in Anatolian floodplains by 9.9 Ma, which is similar to regions in NW and E Africa. A transition to C4 dominance before ca. 7.1 Ma in Anatolia and potentially the Aegean occurs simultaneous with southern Asia during global Late Miocene Cooling in response to decreasing atmospheric pCO2.However, the patterns of the Anatolian and likely Aegean paleoecosystems are unique due to a rapid and permanent return to C3 dominance at ca. 4.4 Ma. A return to C3 dominance is not observed elsewhere in the world and occurs simultaneously with the disappearance of the open environment-adapted large mammal Pikermian chronofauna. We suggest that a regional warm-to-cold season change in rainfall seasonality toward a Mediterranean-style climate triggered the return of C3 biomass in Anatolia and the vanishing of herbivorous mammal populations of the Old World savannah paleobiome.

How to cite: Meijers, M. J. M., Mikes, T., Rojay, B., Çubukçu, H. E., Aydar, E., Lüdecke, T., and Mulch, A.: Climate change-driven Late Miocene to Pliocene rise and fall of C4 vegetation in Anatolia (Türkiye), EGU General Assembly 2025, Vienna, Austria, 27 Apr–2 May 2025, EGU25-8561, https://doi.org/10.5194/egusphere-egu25-8561, 2025.

The Permian-Triassic transition was marked by severe climatic and environmental disturbances, culminating in the largest mass extinction event since the Phanerozoic era. Volcanic activity, particularly the eruptions associated with the Siberian Traps Large Igneous Province (STLIP), is widely regarded as the primary driver of this ecological crisis. However, it is still unclear about the ecosystem effects by the weathering of the basalt, although the volatile effects by volcanic releasing had been well explored. This study focuses on the Suol section in the Siberian Basin to explore the causal relationship between basalt weathering and climatic-environmental evolution during this critical period, by metal geochemistry, sedimentology, and mineralogical analyses.
Results show that the concentrations of nickel, copper, vanadium, scandium, cobalt, and other metals in sediments near the Permian-Triassic boundary align with the elemental composition of Siberian basalts, confirming that the primary source material originated from basaltic eruptions. Following the volcanic events, the weathering of exposed Siberian basalts continued to influence the metal cycling in the Suol section into the Early Triassic, which yielding higher temperature. Notably, mercury and carbon isotope records recovered swiftly to pre-eruption background levels during the Early Triassic, indicating that volatile components such as mercury and carbon had a short-term impact on the climate and environment. In contrast, the weathering of non-volatile components persisted, resulting in prolonged effects on the regional climate and ecosystem.
These findings highlight a temporal disparity in the release and impact of volatile versus non-volatile components during Siberian volcanic activity. Volatile emissions significantly influenced short-term climatic and environmental conditions, whereas basalt weathering under extremely higher temperature conditions exerted a long-term influence on geochemical cycles and ecosystem dynamics.

How to cite: Zhang, Z. and Shen, J.: Sedimentary records of basalt weathering in the Suol section of Siberia basin during the Permian-Triassic Transition, EGU General Assembly 2025, Vienna, Austria, 27 Apr–2 May 2025, EGU25-9047, https://doi.org/10.5194/egusphere-egu25-9047, 2025.

EGU25-9324 | ECS | Posters on site | BG5.3

Evaluating the Impact of Paleogeographic Reconstructions on Phanerozoic Climate Simulations and Carbon Cycle Dynamics 

Niklas Werner, Christian Vérard, Maura Brunetti, Taras Gerya, and Paul Tackley

Over the course of the Phanerozoic, Earth’s climate has alternated between greenhouse and icehouse regimes, driven in large part by shifts in continental configurations that influence weathering processes and, consequently, the global climate. Geodynamic factors play a critical role in these shifts, and intermediate-complexity Earth System Models provide an effective means of exploring the associated parameter spaces. These models rely on topographic boundary conditions derived from paleogeographic reconstructions, where elevation and slope significantly affect silicate weathering intensities. However, different methodologies for reconstructing paleogeographies can yield markedly different results. Among these, the digital elevation maps by Scotese and Wright (2018) are widely used, despite notable discrepancies compared to alternative reconstructions.

To evaluate the impact of paleogeographic reconstructions on climate model simulations, we compared the outcomes of PlaSim-GENIE simulations for 45 time slices across the Phanerozoic, using both Paleomap and PANALESIS (Vérard, 2019) digital elevation models (DEMs). These simulations, covering pCO2 levels from 0.25 to 16 times pre-industrial atmospheric concentrations (280 ppm), were used to generate lookup tables for the spatially resolved global carbon cycle model SCION (Mills et al., 2022). This approach allowed us to investigate a broad parameter space of potential drivers for climatic shifts throughout the Phanerozoic.

Preliminary results indicate that incorporating degassing forcing from the PANALESIS paleogeography enables even simple inorganic carbon cycle box models to more closely replicate atmospheric CO2 variations inferred from proxy records. Furthermore, climate simulations using PANALESIS paleogeography within SCION more successfully capture the Hirnantian Glaciation, whereas simulations constrained by PaleoMap reconstructions produce pCO2 levels that are too high to align with the observed glaciation during this period. The identified differences may be related to a more robust treatment of plate boundaries evolution in PANALESIS, which is based on plate tectonic rules.

References

Mills, B. J., Donnadieu, Y., & Goddéris, Y. (2021). Spatial continuous integration of Phanerozoic global biogeochemistry and climate. Gondwana Research, 100, 73-86.

Scotese, C. R., & Wright, N. (2018). PALEOMAP paleodigital elevation models (PaleoDEMS) for the Phanerozoic. Paleomap Proj.

Vérard C. (2019.b). PANALESIS: Towards global synthetic palæogeographies using integration and coupling of manifold models. Geological Magazine, 156 (2), 320-330; doi:10.1017/S0016756817001042.

How to cite: Werner, N., Vérard, C., Brunetti, M., Gerya, T., and Tackley, P.: Evaluating the Impact of Paleogeographic Reconstructions on Phanerozoic Climate Simulations and Carbon Cycle Dynamics, EGU General Assembly 2025, Vienna, Austria, 27 Apr–2 May 2025, EGU25-9324, https://doi.org/10.5194/egusphere-egu25-9324, 2025.

EGU25-9334 | ECS | Posters on site | BG5.3

Low chemical weathering intensity in the Vøring Basin during the Paleocene-Eocene Thermal Maximum 

Anjana Gireesh Sandhya, Katharina Pahnke, Jack Longman, Joost Frieling, and Morgan T. Jones

The Paleocene Eocene thermal Maximum (PETM) was a rapid global warming event, which occurred ~ 56 million years ago and lasted for ~200 ka. It is characterized by a massive rapid input of 13C-depleted carbon into the atmosphere and ocean, causing a 2-7‰ negative carbon isotope excursion (CIE). As a result of high atmospheric CO2 levels, high temperatures, and an enhanced hydrological cycle during the PETM, increases in physical and chemical weathering intensity have previously been reconstructed across the globe. Chemical weathering of silicate rocks predominates in humid climates and significantly influences the major and trace element composition of resulting sediments. Numerous studies  suggest that the intensified chemical weathering of silicate rocks occurred during the PETM, driven by the warm conditions and enhanced hydrological cycle.

Here we present the first results of elemental geochemical analysis of sediment samples collected from the mid-Norwegian margin during IODP Expedition 396. Our initial results focus on variations in chemical weathering across the PETM as inferred from geochemical proxies.

In the samples examined here, chemical index of alteration (CIA), a proxy for chemical weathering intensity, values show a sharp drop from pre-PETM to mid-PETM. In contrast to other locations, these observations suggest a shift in the intensity of weathering from intermediate to weak and indicates chemical weathering was not intensified during the PETM in our study region. As this is opposite to previous studies, we consider whether changes in sediment provenance may explain these data. However, the provenance discrimination plots (La-Th-Sc ternary diagram Th/Co vs. La/Sc bivariate plot) shows mixed source with no clustering regardless of the time period. This indicates that the sediment source of the Vøring basin did not change at the PETM onset and we suggest that our CIA data truly represent a decrease in the intensity of chemical weathering during the PETM in the Vøring Basin.


How to cite: Sandhya, A. G., Pahnke, K., Longman, J., Frieling, J., and Jones, M. T.: Low chemical weathering intensity in the Vøring Basin during the Paleocene-Eocene Thermal Maximum, EGU General Assembly 2025, Vienna, Austria, 27 Apr–2 May 2025, EGU25-9334, https://doi.org/10.5194/egusphere-egu25-9334, 2025.

EGU25-9519 | Orals | BG5.3

Geodynamics of synconvergent extension on Venus and earth 

Oğuz Hakan Göğüş, Oğuzcan Karagöz, Ömer Bodur, Açelya Ballı Çetiner, and Özge Dinç Göğüş

Revealing the characteristics and origins of surface deformation in planetary bodies is fundamental to understanding the biogeodynamic cycle. Investigating how mountains and basins (topography) as well as magmatism (carbon cycling) develop with or without subduction—and therefore, plate tectonics—provides critical insights into the habitability and climate stability of a planet. This study aims to identify tectonic deformation on Venus, specifically describing extensional and shortening features. High-resolution, scaled laboratory experiments combined with structural observations suggest that lithospheric drips (sinking plumes) influence strain distribution and the geometric characteristics of various coronae. Notably, the linear shortening structures observed at the centers of coronae appear to form above downwelling regions, while material pulling results in crustal stretching at the topographic rims. These findings support the hypothesis that multiple geodynamic processes may collectively control coronae formation, with lithospheric drips often overlooked due to the prevalence of plume models. Ultimately, the coexistence of crustal extension/rifting and plate shortening (fold and thrust belt) by lithospheric instabilities offers a possible explanation for clarifying deformation patterns on Venus and earth.

How to cite: Göğüş, O. H., Karagöz, O., Bodur, Ö., Ballı Çetiner, A., and Dinç Göğüş, Ö.: Geodynamics of synconvergent extension on Venus and earth, EGU General Assembly 2025, Vienna, Austria, 27 Apr–2 May 2025, EGU25-9519, https://doi.org/10.5194/egusphere-egu25-9519, 2025.

The spatial-temporal climate and environmental effects triggered by the weathering of basaltic magmas after a large igneous province (LIP) eruption are not well known. Here, we present geochemical data from numerous sedimentary sites with a near-global distribution to explore the effects of juvenile basalt weathering of the low-latitude Emeishan large igneous province (E-LIP, ~260 Ma). These data show the weathering of basalt dominantly contributed to siliciclastic materials in proximal basins (> 6 × 10⁶ km2) at a timescale of up to ten million years. Our data thus provide evidence that, besides the gases released during the eruption, release of (metal) elements via weathering of basalt at low latitudes plays a significant role in surface geochemical cycling. The release of these elements likely facilitated the flourishing of tropical wetland flora in southwestern China during the Late Permian, resulting in the widespread formation of coal seams. Moreover, increased erosion rates, sharply reduced Chemical Index of Alteration (CIA), and exponentially increased bulk accumulation rates suggest a shift in the weathering regime of basaltic landscapes under the extreme climate conditions of the Early Triassic. This shift, characterized by intensified physical weathering, enhanced erosion in source areas but limited sediment transport, potentially resulting in the rapid disappearance of basalt weathering records in southwestern China.

How to cite: Ouyang, Q., Shen, J., and Longman, J.: Long-term provenance supply records of the Emeishan large igneous province: implications for the extreme climate of the Early Triassic, EGU General Assembly 2025, Vienna, Austria, 27 Apr–2 May 2025, EGU25-9529, https://doi.org/10.5194/egusphere-egu25-9529, 2025.

EGU25-10211 | Orals | BG5.3

Tectonic Control of Global Plant Biodiversity 

Sean D. Willett, Ao Luo, Yanyan Wang, Zhiheng Wang, and Loïc Pellissier

The distribution of plant species richness on earth suggests that tectonic mountain-building and its interaction with climate exert a defining control on species distributions and diversification rates. The two main pathways identified to increase species richness are, first, the broadening of environmental heterogeneity through the creation of new habitats formed by tectonic topography and, second, the disruption of existing landscapes by tectono-geomorphic processes, leading to time-dependent habitat fragmentation and increased allopatric speciation. Here, we resolve the contribution of these two pathways to explain global plant species richness. We build a model for environmental heterogeneity at the 100 km scale based on local richness at the 100 meter scale, which we take to be a function of local climate, and community turnover between 100 m cells based on environmental distance, which we take to be a global function. Each of these functions is calibrated to local field data. These two models can be combined to provide a prediction of species richness due to environmental heterogeneity at the 100 kilometer scale using global topography and climate data. Differencing this prediction from observed richness provides an estimate of the excess richness, which we argue is dominated by tectonic and geomorphic enhancement of allopatric speciation rates. We find that this excess component of richness is nearly always positive and is locally a factor of up to ten above that expected by environmental gradients alone. We conduct a categorical analysis, comparing the excess richness to active tectonic and geomorphic domains and find a close correspondence between the patterns of excess richness and recent tectonic and geomorphic activity. We conclude that high richness areas (biodiversity hotspots) overwhelmingly fall in areas of tectono-geomorphic activity, even after accounting for environmental heterogeneity, supporting the hypothesis that transient, tectono-geomorphic disruption is an important control on speciation rates and the distribution of biodiversity.

How to cite: Willett, S. D., Luo, A., Wang, Y., Wang, Z., and Pellissier, L.: Tectonic Control of Global Plant Biodiversity, EGU General Assembly 2025, Vienna, Austria, 27 Apr–2 May 2025, EGU25-10211, https://doi.org/10.5194/egusphere-egu25-10211, 2025.

EGU25-10843 | Orals | BG5.3

‘rgplates’: R Interface to Plate Tectonic Models in GPlates 

Ádám T. Kocsis, John Cannon, Xiaodong Qin, Dietmar Müller, Nussaibah B. Raja, Simon Williams, Sabin Zahirovic, and Elizabeth M. Dowding

Researching large-scale responses of organisms and ecosystems to deep-time perturbations requires a paleogeographic reconstruction of ancient Earth. Deep-time paleogeographic reconstruction rests on the foundations of tectonic modelling. The GPlates suite offers a continuously-developed, open-source solution for the development and interrogation of global tectonic models. These allow the implementation of key components of deep-time ecological research, such as the analysis of geographic ranges, the study of bioregionalization, the spatiotemporal analysis of diversity dynamics, and ecological niche modelling, to mention a few. However, the difficulty of using tectonic models and making fossil occurrence record data interact with them in the R environment, the standard scripting environment for paleoecological research, has been limiting the integration of paleogeographic and paleontological research.

Here we present the R extension package 'rgplates', which provides access to the calculations implemented in the GPlates Web Service and the GPlates desktop application via its command-line interface. Besides the reconstructions of point paleocoordinates, the package allows the access and manipulation of more complex vector features with the popular 'sf' extension. We present the basic feature set of the package and provide examples demonstrating their relevance to paleoecological calculations using occurrence records from the Paleobiology Database, as well as derived reconstruction products, such as digital elevation models and paleoclimatic models. In short, 'rgplates' enables the exploration of various tectonic models and the assessment of how their disagreements propagate to paleoecological inference.

How to cite: Kocsis, Á. T., Cannon, J., Qin, X., Müller, D., Raja, N. B., Williams, S., Zahirovic, S., and Dowding, E. M.: ‘rgplates’: R Interface to Plate Tectonic Models in GPlates, EGU General Assembly 2025, Vienna, Austria, 27 Apr–2 May 2025, EGU25-10843, https://doi.org/10.5194/egusphere-egu25-10843, 2025.

EGU25-11019 | ECS | Orals | BG5.3

Implementing plant evolution into a dynamic vegetation model and its impact on the Phanerozoic biosphere 

Khushboo Gurung, Alexander J. Hetherington, and Benjamin J.W. Mills

Land plants are a major contributor towards global terrestrial biomass which influences atmospheric CO2 and O2 however the amplitude of their contribution has fluctuated throughout the Phanerozoic; partly due to the evolution of plant features and strategies. An extended rise of atmospheric O2 over the Carboniferous and Permian coincides with the rise of large vascular plants which is thought to have increased organic carbon burial rates1. Here, we present one of the first dynamic climate-biogeochemical-vegetation model that allows the assessment of how plant evolution may have played a key role in the rise of the Late Paleozoic oxygen level. We implement a simple rooting evolution parameter and a high net primary productivity strategy of lycophyte paleotropical trees2 to the existing SCION-FLORA model3. The evolution of roots amplifies continental weathering processes and increases overall biomass while the lycophyte tree strategy allows for accelerated biomass accumulation. The two strategies contribute towards the increase of organic carbon burial which leads to a rise in oxygen with lycophyte tree forests playing a much greater role. Without the evolution of lycophyte tree forests, Paleozoic O2 levels cannot be reached suggesting that a quicker accumulation of biomass compared to present day forests was essential.

1. Berner RA. 1999 DOI: 10.1073/pnas.96.20.10955.

2. Cleal CJ, Thomas BA. 2005 Geobiology. DOI: 0.1111/j.1472-4669.2005.00043.x

3. Gurung K, Field KJ et al. 2024 Nat Comms. DOI: 10.1038/s41467-024-46105-1

How to cite: Gurung, K., Hetherington, A. J., and Mills, B. J. W.: Implementing plant evolution into a dynamic vegetation model and its impact on the Phanerozoic biosphere, EGU General Assembly 2025, Vienna, Austria, 27 Apr–2 May 2025, EGU25-11019, https://doi.org/10.5194/egusphere-egu25-11019, 2025.

EGU25-12000 | ECS | Posters on site | BG5.3

Range and radiation of Cambrian Trilobites 

Elizabeth Dowding, Harriet Drage, Adriane Lam, James Holmes, Stephen Pates, Katherine Jordan, Luis Collantes, Jorge Esteve, Lukáš Laibl, Kelsey Lucas, Mark Nikolic, Alexis Rojas, Fernanda Serra, and María Gabriela Suárez

Revealing the patterns and drivers of diversity in the Cambrian requires an understanding of distribution. On a dynamic Earth with uncertain palaeogeography, the understanding of range and diversity requires novel methodology and approaches. Trilobites, an extremely diverse group of arthropods, underwent important shifts in diversity and morphology throughout the Cambrian. However, the mechanisms driving their global dispersal and diversification during the early Palaeozoic remain inadequately understood. Persistent issues in studying the facilitators of distribution include morphological and life history constraints, e.g. the impact of benthic or pelagic larval stages. This uncertainty is compounded by the limitations of current palaeogeographical reconstructions. To address these issues, the Trilobite Biogeography and Ecology working group (TRiBE) applied  a novel approach to geography and reconstructed trilobite biogeographical patterns associated with their initial global radiation from throughout the Cambrian. Using phylobiogeographic methods, with the Paterson et al (2019) phylogeny, we took three approaches to area establishment and compared the resulting patterns. The results, strengthened through robust comparison of area establishment, provide insights into Cambrian trilobite ancestral geographical ranges, the frequency and type of allopatric speciation events, and the connectivity between different regions during this critical phase of euarthropod evolution. Comparison between palaeogeography, climate, and marine connectivity are examined as facilitators of a global trilobite distribution and the specialisation of the group throughout the Cambrian. This study aims to both make comment on the evolutionary success of early euarthropods, but also to highlight the influence of geographical assumptions on interpretation. 

How to cite: Dowding, E., Drage, H., Lam, A., Holmes, J., Pates, S., Jordan, K., Collantes, L., Esteve, J., Laibl, L., Lucas, K., Nikolic, M., Rojas, A., Serra, F., and Gabriela Suárez, M.: Range and radiation of Cambrian Trilobites, EGU General Assembly 2025, Vienna, Austria, 27 Apr–2 May 2025, EGU25-12000, https://doi.org/10.5194/egusphere-egu25-12000, 2025.

EGU25-12998 | Orals | BG5.3

Volcanic glass shards as a substrate for early life 

Barbara Kremer, Ewa Słaby, Richard Wirth, Owocki Krzysztof, Bąbel Maciej, Witkowski Marcin, Królikowska Agata, Schreiber Anja, Kempe Stephan, and Kaźmierczak Jozef

Explosive volcanoes eject large amounts of ashes in the form of fine-grained glass fragments (shards) during eruption. Depending on their size, degree of vesicularity and composition, pyroclastic glass shards have chemically reactive catalytic surfaces with high surface-to-volume ratios. They are able to adsorb organics, metals, and phosphates, as well as create microenvironments attractive for microbial growth. Pyroclastic material – deposited in both aquatic and terrestrial environments – was abundant on early Earth and some of the first habitats for life may have been glass-rich. Our new sedimentological, geomicrobiological and geochemical-petrological comparative studies (LAICPMS, EMPA, TEM, Raman) aim at evaluating the significance of volcanic glass shards as a substrate and source of nutrients for microbes and as a medium for preservation of biosignatures in the geological record.

Here we show that modern (Holocene) and Paleoarchean volcanic glass shards deposited in aqueous settings (hyaloclasts) preserve evidence of alteration by microbial activity. For example, sub-recent (ca. 0.37 ka; Kaźmierczak & Kempe 2006) shards of island arc basalt composition (containing phenocrysts of the early crystallization process i.e., forsterite olivine, spinel, plagioclase-bytownite, pyroxene) are documented from the alkaline caldera lake Vai Lahi on Niuafo’ou Island, Tonga (Kempe & Kaźmierczak 2012). Analyses by 3D Raman spectroscopy (depth profiling) reveal aragonite and calcite in the entire shard volume with associated carbonaceous matter, as well as spectra of anorthite and olivine.

Most Niuafoʻou shards are coated with a laminated envelope of alternating aragonitic and silicate layers resembling oncoids cortex. Open vesicles and external faces of the shards host an organic matter and mineral assemblage texturally identical to that of the laminated envelope. Two types of alterations are identified in the Niuafo’ou shards: i) pit-like etchings; and, ii) alveolar-spongy textures. Transmission electron microscopy reveals etch-like alterations (weathering or microbial activity?) on shard surfaces to a depth of ca. 2 µm. Elemental compositions of the altered layer point to a mixture of glass and the carbonate-silicate envelope.

Niuafo’ou shards were deposited in water of increased alkalinity that favored silica dissolution and carbonate precipitation. In turn, this leads to the growth of aragonite coatings as well as sizeable stromatolites in the lake. Such habitat is ideal for alkalophilic cyanobacteria that form biofilms and participate in the precipitation of mineral envelopes. Coated by carbonate-silicate, such glass shards can effectively preserve biosignatures even as far back as the Paleoarchean (<3.5 Ga) geologic record.

Kazmierczak, J. & Kempe, S. (2006)  Naturwissenschaften 93, 119- 126.

Kempe, S. & Kazmierczak, J. (2012) Life on Earth and Other Planetary Bodies, Springer, 197-234.


How to cite: Kremer, B., Słaby, E., Wirth, R., Krzysztof, O., Maciej, B., Marcin, W., Agata, K., Anja, S., Stephan, K., and Jozef, K.: Volcanic glass shards as a substrate for early life, EGU General Assembly 2025, Vienna, Austria, 27 Apr–2 May 2025, EGU25-12998, https://doi.org/10.5194/egusphere-egu25-12998, 2025.

EGU25-13043 | ECS | Posters on site | BG5.3

Contrasting vegetation and climate regulation at the Permian-Triassic and Triassic-Jurassic hyperthermals 

Zhen Xu, Khushboo Gurung, Alexander Farnsworth, Paul Wignall, Jason Hilton, Andrew Merdith, Stephen Hunter, Alexander Krause, Yuxuan Wang, Jianxin Yu, and Benjamin Mills

The Permian-Triassic (PTME, ~251.9 Ma) and Triassic-Jurassic (TJME, ~201.3 Ma) mass extinctions, both triggered by large igneous province (LIP) activity, represent two of the most significant extinction events in Earth’s history. Despite this similarity, there were contrasting impacts on land plants. Here, we compile global macrofossil records of Triassic-Jurassic flora and integrate them with lithological climate proxies, the HadCM3L climate model, and vegetation model FLORA to reconstruct vegetation dynamics across the TJME. Our findings suggest that, unlike the significant low latitude plant extinction during the PTME, the TJME coincides with floral compositional turnover and enhanced productivity, particularly in mid- to high- latitudes. High-resolution chemical weathering index, mercury, and plant biomarker records further suggest that global vegetation productivity and biotic weathering was enhanced after the TJME, stabilizing Earth’s temperature and facilitating rapid post-extinction cooling once LIP emissions ceased. This contrasts with the PTME when widespread deforestation trapped the Earth in a prolonged super-greenhouse climate. This study underscores the critical role of vegetation in modulating long-term climate and highlights plant thermal response and adaption as a key control on Earth's sensitivity to warming.

How to cite: Xu, Z., Gurung, K., Farnsworth, A., Wignall, P., Hilton, J., Merdith, A., Hunter, S., Krause, A., Wang, Y., Yu, J., and Mills, B.: Contrasting vegetation and climate regulation at the Permian-Triassic and Triassic-Jurassic hyperthermals, EGU General Assembly 2025, Vienna, Austria, 27 Apr–2 May 2025, EGU25-13043, https://doi.org/10.5194/egusphere-egu25-13043, 2025.

EGU25-14396 | ECS | Posters on site | BG5.3

Supraglacial biological niches as a solution to the Sturtian oxygenation problem 

Charlotte Minsky, Robin Wordsworth, and David Johnston

Understanding how climate and biology changed during and after Snowball Earth events - global glaciations which coincided with major shifts in the ocean-atmosphere state - is critical for understanding the evolution of life on Earth. New observations of the Neoproterozoic Sturtian glaciation pose challenges to the Snowball paradigm. Precision geochronology shows that the Sturtian lasted ~56 Myr, and the lack of sulfur-MIF signals observed indicates that the atmosphere remained oxygenated throughout. A source of O2 is required to maintain an oxygenated atmosphere for ~56 Myr, but in the canonical Snowball scenario, primary production shuts down completely. Here, we model the carbon and oxygen cycles during the Snowball to investigate this challenge. We propose that photosynthesis in melt holes on the equatorial glacier surface was sufficiently productive to provide the missing O2 source, and that accumulation of aeolian dust sustained these melt holes and supplied them with nutrients. We argue that primary production was limited by phosphorus availability and photosynthetically active surface area, and show that only a dust-supported supraglacial ecosystem could satisfy both conditions.

How to cite: Minsky, C., Wordsworth, R., and Johnston, D.: Supraglacial biological niches as a solution to the Sturtian oxygenation problem, EGU General Assembly 2025, Vienna, Austria, 27 Apr–2 May 2025, EGU25-14396, https://doi.org/10.5194/egusphere-egu25-14396, 2025.

EGU25-14655 | Posters on site | BG5.3

Volcanic impact on terrestrial sulphur cycling during the Carboniferous‒Permian in an alkaline lake in the Junggar Basin, NW China 

Xinping Liang, Andrey Yu Bychkov, Qingbin Xie, Bo Wang, and Rukai Zhu

The sulphur (S) cycle is important for determining paleoenvironmental evolution and organic matter enrichment. Compared with research on marine facies, studies on the terrestrial sulphur cycle and its relationship with key geological events, such as volcanic activity or hydrothermal fluids, are more limited. The Fengcheng Formation in the Mahu Sag of the Junggar Basin in northwestern China, which deposited approximately 360m during the Carboniferous to early Permian in an alkaline lake, is an ideal research object for studying the relationship between the terrestrial sulphur cycle and geological events. Therefore, in this work, we identified volcanic activity during the deposition of the Fengcheng Formation and established a link between volcanic activity and the lacustrine alkaline carbon‒sulphur cycle during the Carboniferous‒Permian through petrologic, geochemical, and geophysical data from the MY1 Well in the Mahu Sag. The results revealed that (1) multiple volcanic episodes occurred during the deposition of the Fengcheng Formation, as evidenced by high mercury (Hg) concentrations, high Hg/S ratios, increased sulphate concentrations and large negative pyrite sulphur isotope (δ34Spy) values (ranging to -20.52‰); (2) long-term ferruginous bottom water conditions may have been conducive to the preservation of organic matter; however, sulphate from volcanic activity promoted bacterial sulphate reduction, resulting in intermittent alternating euxinic conditions, as evidenced by iron speciation, molybdenum concentrations, and framboid and euhedral pyrite morphologies, which may have resulted in some consumption of organic matter; and (3) after volcanic activity, the sulphate in the lake water was depleted, and the bottom water system gradually closed and was continuously enriched with δ34Spy. Therefore, volcanic activity appears to have been the key factor controlling the sulphur cycle and organic matter enrichment through increased sulphate fluctuations in the oldest alkaline lake during the deposition of the Fengcheng Formation. This study sheds new light on the sulphur cycle of ancient alkaline lakes and can serve as a reference for organic matter enrichment under different mechanisms in shale.

How to cite: Liang, X., Bychkov, A. Y., Xie, Q., Wang, B., and Zhu, R.: Volcanic impact on terrestrial sulphur cycling during the Carboniferous‒Permian in an alkaline lake in the Junggar Basin, NW China, EGU General Assembly 2025, Vienna, Austria, 27 Apr–2 May 2025, EGU25-14655, https://doi.org/10.5194/egusphere-egu25-14655, 2025.

EGU25-14800 | ECS | Posters on site | BG5.3

Early Cambrian volcanic and palaeoenvironmental evolution of eastern Australia  

Suwijai Jatupohnkhongchai, Stacey Curtis, Jack Castle-Jones, Justin Payne, John R. Paterson, Glenn A. Brock, Luke Milan, and Marissa J. Betts

Early Cambrian tectonics of eastern Australia was characterised by the transition from a passive margin to a convergent regime with associated development of a volcanic arc system. This interval coincided with the Cambrian Explosion—the geologically sudden appearance of all major animal body plans. In South Australia, lower Cambrian successions in the Stansbury and Arrowie basins are stratigraphic archives that preserve evidence for diverse fossil faunas that flourished along the eastern margin of Gondwana, and the dynamic palaeoenvironments they inhabited. Sandwiched within these marine and marginal marine successions are distal volcanics—key for mapping the tectonically-driven palaeoenvironmental and palaeogeographic evolution of this region.

Proximal and distal volcanics from South Australia (SA) and western New South Wales (NSW) have been CA-TIMS dated to establish precise marker horizons. These dates link distal volcanics with their likely proximal equivalents in South Australia and the Gnalta Shelf in western NSW. In SA, a tuff from the lower part of the Parara Limestone in the SYC 101 drill core in the western Stansbury Basin has been dated to 517.5±0.2 Ma (Castle-Jones et al., in review) which is within error of a CA-TIMS date of 517.41±0.15 Ma from the Marne River Volcanics in the eastern part of the basin (Curtis, in prep.). Tuffs from the Mernmerna Formation in the Arrowie Basin have been dated to 515.38 ± 0.13 Ma (Big Green Tuff), 514.56 ± 0.13 Ma (Third Plain Creek Member), and 514.46 ± 0.13 Ma (Paralana 1B DW1 drill core) (Betts et al., 2018). These ages correspond closely to the 514.96 ±0.14 Ma tuff from Cymbric Vale Formation, western NSW (Betts et al., 2024). The Billy Creek Formation tuff in the Arrowie Basin, dated to 511.87 ±0.14 Ma (Betts et al., 2018), is slightly younger than the Ma Mooracoochie Volcanics in the Warburton Basin to the north (Curtis, in prep.).

Changes in volcanic regime over time accompanied profound changes in basinal palaeogeography, sedimentation and faunal composition in eastern Australia during the early Cambrian. This study shows how geochronology, accompanied by rigorous petrographic, biostratigraphic and geochemical data are important for resolving how tectonic evolution impacted nascent ecosystems along the early Cambrian margin of eastern Australia.

References

Betts, M.J., et al. 2024. First multi-proxy chronostratigraphy of the lower Cambrian Byrd Group, Transantarctic Mountains and correlation within East Gondwana. Gondwana Research 136, 126-141.

Betts, M.J., et al. 2018. Early Cambrian chronostratigraphy and geochronology of South Australia. Earth-Science Reviews 185, 498-543.

Castle-Jones, J., et al. in review. Integrated biostratigraphy, chemostratigraphy and geochronology of the lower Cambrian succession in the western Stansbury Basin, South Australia. Australian Journal of Earth Sciences.

Curtis, S., in prep. The Delamerian Orogen: Insights into a rapidly evolving convergent continental margin from the timing and petrogenesis of igneous rocks. PhD thesis. University of South Australia

How to cite: Jatupohnkhongchai, S., Curtis, S., Castle-Jones, J., Payne, J., R. Paterson, J., A. Brock, G., Milan, L., and J. Betts, M.: Early Cambrian volcanic and palaeoenvironmental evolution of eastern Australia , EGU General Assembly 2025, Vienna, Austria, 27 Apr–2 May 2025, EGU25-14800, https://doi.org/10.5194/egusphere-egu25-14800, 2025.

EGU25-15785 | ECS | Orals | BG5.3

Detecting signatures of life on terrestrial and Martian rocks: contribution of microbial mats in the biogeomorphological responses of desiccated sediments 

Liza Alexandra Fernandez, Dov Corenblit, Florent Arrignon, Stéphanie Boulêtreau, Neil S. Davies, Jessica Ferriol, Frédéric Julien, Joséphine Leflaive, Thierry Otto, Erwan Roussel, Jean-Pierre Toumazet, and Johannes Steiger

Detecting signatures of life in sedimentary rocks lies in the difficulty of distinguishing them from abiotic signals and interpreting their formational conditions, particularly when working on planetary systems that are different from Earth, such as Mars (Corenblit et al., 2023). Research in this field is booming, thanks to the development and deployment of detection tools either in orbit or on the surface. Mars is of great interest due to its early history comparable to Earth during the Noachian period > 3.7 Ga (Lapôtre, 2022). In addition, traces of favourable environmental conditions for the potential development of life have been found for this period, for example in Gale Crater (Rapin et al., 2023). Among the candidates for searching potential signatures of life, Microbially Induced Sedimentary Structures (MISS, Nora Noffke in 1996) have become a target. MISS are characteristic structures resulting from surface sediment disturbances induced by microbial mats (Schieber et al., 2007; Noffke, 2010). Their formational environments may correlate with early Mars conditions, and their terrestrial study is enriched by their representation in both fossil and modern records (Noffke 2015, 2021). The analogy between two planetary systems relates to the principle of abductive inference, which posits that similar (bio)geomorphological processes will result in similar (bio)geomorphological structures (Corenblit et al., 2019). Therefore, it is crucial to develop a clear conceptual framework for processing observations of modern and fossilized textures, forms, and patterns and for discussing the gradient of distinction between abiotic and biotic modalities (Davies et al., 2016).

Here, we focused on one type of MISS known as “mat cracks”, the biotic equivalent of abiotic structures “mud cracks” (Noffke, 2010). These are well-represented in the field in both fossil and modern records, and they are robustly repeatable under controlled laboratory conditions. They may correspond to ancient Martian environmental systems as attested by polygonal ridges in Gale Crater, which are characteristic of sustained wet/dry cycles (Rapin et al., 2023). The methodology is based on the visual distinction of biotic and abiotic classes of texture, form, and pattern using different visualisation methods such as photogrammetry and expert visual observations, statistical tools and classification with convolutional neural networks (CNNs). For an initial exploration of the mud crack variability, we set up an ex-situ experiment to produce mud cracks with three types of biofilms and three biomass levels according to variables observed in the field, and using 3D picture dataset of the resulting mud cracks. We have demonstrated significant differences between abiotic and biotic classes and between strain and biomass classes. CNN models outperformed the human-blinded classification by refining the diversity of criteria used and observations such as the textures of the sandy matrix. These significant distinctions and the finesse of the classification provided by artificial intelligence allow us to discuss the interest of the information gain in distinguishing potential textures, forms and patterns that are characteristic of MISS in the field where noise, alteration and erosion can be a problem in identifying the origin of signatures, particularly on Mars.

How to cite: Fernandez, L. A., Corenblit, D., Arrignon, F., Boulêtreau, S., Davies, N. S., Ferriol, J., Julien, F., Leflaive, J., Otto, T., Roussel, E., Toumazet, J.-P., and Steiger, J.: Detecting signatures of life on terrestrial and Martian rocks: contribution of microbial mats in the biogeomorphological responses of desiccated sediments, EGU General Assembly 2025, Vienna, Austria, 27 Apr–2 May 2025, EGU25-15785, https://doi.org/10.5194/egusphere-egu25-15785, 2025.

EGU25-18229 | Orals | BG5.3

Deep time climatic oscillations regulated by shallow-water carbonates 

Laurent Husson and Tristan Salles

The long-term climate depend on continental weathering, hydrothermal fluxes, and carbonate sequestration in the oceans, but a coherent explanation is missing. Here, we investigate the role of neritic carbonate accumulation, by plugging a macro-ecological model for shallow-water carbonates onto a combined set of state-of-the-art tectonic, climatic and physiographic reconstructions. Our model introduces and quantifies neritic habitability as a primordial climatic control. Our model confirms the role of deep ocean carbonate habitability -when carbon sources exceed the accumulation capacity of warm water carbonates, expanding carbon storage to the abyss- as a cooling factor, and reveals an unidentified alternative warm regime, controlled by the exceeding capacity of warm-water carbonates to capture Ca2+ and alkalinity fluxes. This regime depletes the oceans of its alkalinity, shoals the carbonate compensation depth, and releases carbon from the deep ocean to the atmosphere. These contrasted regimes, that we refer to as habitability-limited and calcium-limited, largely explain longterm climatic excursions, as revealed by the geological archive.

How to cite: Husson, L. and Salles, T.: Deep time climatic oscillations regulated by shallow-water carbonates, EGU General Assembly 2025, Vienna, Austria, 27 Apr–2 May 2025, EGU25-18229, https://doi.org/10.5194/egusphere-egu25-18229, 2025.

EGU25-18533 | ECS | Orals | BG5.3

Influence of orbital cycles on chemical weathering and marine redox conditions under greenhouse climates 

Chiara Krewer, Stephen Hunter, Simon W. Poulton, Robert J. Newton, and Benjamin J. W. Mills

Cretaceous Oceanic Anoxic Event 2 (OAE2) coincided with the emplacement of several large igneous provinces. The rapid exhalation of volcanic CO2 intensified the global climate and accelerated the hydrological cycle. Cyclic variations in marine redox conditions linked to weathering are documented in OAE2 successions, indicating an orbital control on global weathering rates, and thus, marine nutrient availability. However, the impact of the cyclicity varies in intensity, particularly at the end of OAE2, which is characterized by dampened weathering variability. In this conceptual approach, we assess the influence of orbital forcing on global chemical weathering rates under different atmospheric CO2 concentrations and orbital configurations using HadCM3L. We find that with increasing pCO2, chemical weathering rates significantly increase and the influence of changes in obliquity is amplified. This suggests a strong coupling between orbital cyclicity and global weathering fluxes under hot climates, with significant influence on the carbon cycle driven by weathering-derived nutrients.

How to cite: Krewer, C., Hunter, S., Poulton, S. W., Newton, R. J., and Mills, B. J. W.: Influence of orbital cycles on chemical weathering and marine redox conditions under greenhouse climates, EGU General Assembly 2025, Vienna, Austria, 27 Apr–2 May 2025, EGU25-18533, https://doi.org/10.5194/egusphere-egu25-18533, 2025.

EGU25-19148 | Posters on site | BG5.3

Investigating warm climatic conditions through bulk and clay mineralogy in the AlanoSection (Neo-Tethys) during the Middle Eocene Climatic Optimum (MECO, ~40 Ma) 

Giuseppe Cruciani, Silvia Sigismondi, Luca Giusberti, and Valeria Luciani

The middle Eocene was marked by long-term global cooling trend, interrupted by a notable
warming event lasting ~500 kyr, the Middle Eocene Climatic Optimum (MECO, ~40 Ma),
characterized by a 4–6°C increase in surface and temperatures, accompanied by a transient rise in
atmospheric pCO2. The MECO event is attracting increasing scientific interest, as it records
temperatures and pCO2 levels that Earth could reach by the end of this century if anthropogenic
greenhouse gas emissions are not reduced. Continental weathering plays a critical role during warm
phases, as it contributes to carbon removal from the atmosphere through silicate hydrolysis.
Analyzing clay and bulk mineralogy in the stratigraphic archives offers valuable insight into past
environmental conditions. The preservation of clay minerals allows for the reconstruction of the
conditions under which they formed, providing clues about continental weathering and geochemical
conditions in the water columns or pore waters (neoformed or transformed) of the sedimentary
environment during climate events. However, bulk and clay mineralogy data that characterize
paleoenvironmental conditions during the MECO, are still insufficiently explored. This study
presents an integrated approach to assess changes in weathering regimes through bulk and clay
mineralogy from the Alano di Piave section, a Neo-Tethys bathyal succession located in NE Italy.
This section, the GSSP of the Bartonian/Priabonian boundary, offers a continuous and well-
preserved record of the MECO interval, well constrained by stable isotope record, making it an
ideal location to study paleoclimatic conditions of this crucial warming event, especially in relation
to continental weathering. Changes in mineralogical assemblages observed in this study reflect the
regional climatic expression of the MECO global warming event. In addition, climatic variations as
derived by our analyses can provide significant information on the marked biotic changes recorded
from this section.

How to cite: Cruciani, G., Sigismondi, S., Giusberti, L., and Luciani, V.: Investigating warm climatic conditions through bulk and clay mineralogy in the AlanoSection (Neo-Tethys) during the Middle Eocene Climatic Optimum (MECO, ~40 Ma), EGU General Assembly 2025, Vienna, Austria, 27 Apr–2 May 2025, EGU25-19148, https://doi.org/10.5194/egusphere-egu25-19148, 2025.

EGU25-19755 | Posters on site | BG5.3

Global impacts of evaporite deposition during the Messinian Salinity Crisis in transient Earth system model simulations  

Benjamin Mills, Markus Adloff, Fanny Monteiro, and Rachel Flecker

The Messinian Salinity Crisis (MSC, 5.9-5.3 Ma) is recognised as a period of dramatic regional environmental change but it is rarely considered in the interpretation of global environmental change in the late Miocene. Following Shields & Mills (2021), who showed that evaporite deposition has the potential to perturb the global carbon cycle, we investigate the temporal and spatial patterns of global environmental change resulting from the precession-paced extraction of the gypsum preserved until today in the Mediterranean basin in the 3D Earth system model cGENIE. The prescribed evaporite deposition causes a transient atmospheric CO2 draw-down of ~80 ppm and swings in the carbonate saturation state which causes sedimentary dissolution near the carbonate compensation depth, especially in the Pacific and Indian ocean. We compare the simulated model response to proxy records of late Miocene environmental change to test whether the fingerprint of the MCS evaporite deposition can be identified or whether additional buffer mechanisms need to be invoked to explain a more stable carbonate system.


References

Shields, G.A. and Mills, B.J., 2021. Evaporite weathering and deposition as a long-term climate forcing mechanism. Geology, 49(3), pp.299-303.

How to cite: Mills, B., Adloff, M., Monteiro, F., and Flecker, R.: Global impacts of evaporite deposition during the Messinian Salinity Crisis in transient Earth system model simulations , EGU General Assembly 2025, Vienna, Austria, 27 Apr–2 May 2025, EGU25-19755, https://doi.org/10.5194/egusphere-egu25-19755, 2025.

Stepwise Pb-Pb leaching (PbSL) is a silicate digestion technique based on sequential acid treatment of a mineral, resulting in the selective recovery of radiogenic and common Pb from the crystal lattice. This technique has proven effective for directly dating rock-forming silicates associated with metamorphic reactions that define a PT path. Two Paleoarchean granitoids from the Bastar craton were selected for this study; one is a ~3.5 Ga orthopyroxene-bearing basement tonalite sample near Nagaras, CH13 [1] and the other is the ~3.6 Ga ‘true granite’ sample near Dalli-Rajhara [2], resampled as C30. Orthopyroxene (Opx) and microcline (Mc) grain separates were leached in multiple steps using HBr, HNO3, and HF acids [3]. Lead was separated and purified using 100 µL and 10µL AG1-X8 anion exchange resin using HNO3 – HBr chemistry, and the purified Pb fraction was dissolved in 0.2% HNO3 solution. Lead isotope ratios were measured on a Thermo-Fisher Scientific Neptune Plus MC-ICPMS at the Indian Institute of Technology (IIT) Kharagpur, India, using a novel approach of combining Thallium-doping with sample-standard bracketing. Two multi-grain Opx fractions from sample CH13 yielded a combined Pb-Pb isochron age of 3594±95 Ma (2σ error, MSWD = 8.3, n = 11), which is slightly older than the zircon U-Pb crystallization age of 3453±21 Ma [1]. Therefore, sample CH13 is a Paleoarchean charno-enderbite formed at lower crustal depths. In contrast, Mc separated from sample C30 yielded a Pb-Pb isochron age of 3189±3 Ma (2σ error, MSWD = 1.3, n = 5), which confirms that despite an older zircon U-Pb crystallization age, this sample is not a ~3.6 Ga ‘true granite’ but is a product of a later ~3 Ga partial melting event, related to the Mesoarchean Sukma orogeny [1].

[1] Nandi, A., Mukherjee, S., Sorcar, N., and Vadlamani, R., 2023, Relict Mesoarchean (2.99–2.94 Ga) metamorphism overprinted by late Neoarchean tectonothermal event(s) from the Sukma Group supracrustal rocks, Bastar craton, India: Evidence from new Lu-Hf and Sm-Nd garnet isochron and Th-U-total Pb monazite ages: Precambrian Research, v. 390, p. 107056.

[2] Rajesh, H. M., Mukhopadhyay, J., Beukes, N. J., Gutzmer, J., Belyanin, G. A., and Armstrong, R. A., 2009, Evidence for an early Archaean granite from Bastar craton, India: Journal of Geological Society, London, v. 166, p. 193 – 196.

[3] Frei, R., and Kamber, B. S., 1995. Single mineral Pb-Pb dating. Earth and Planetary Science Letters, 129(1-4), 261 – 268.

How to cite: Nandi, A. and Vadlamani, R.: Constraining timing of early Archean magmatism using stepwise Pb-Pb leaching (PbSL) dating from the Bastar Craton, central India, EGU General Assembly 2025, Vienna, Austria, 27 Apr–2 May 2025, EGU25-875, https://doi.org/10.5194/egusphere-egu25-875, 2025.

Mount Isa Inlier, located in northwest Queensland, consists of multiple Proterozoic volcano-sedimentary sequences intruded, deformed and metamorphosed during a complex tectonic history between ~1880 Ma and ~1490 Ma. The stratigraphy of the Mount Isa Inlier is generally interpretated to reflect the superposition of three major superbasin events, marked by discontinuities, and deformed and metamorphosed during the Isan Orogeny (1620-1500 Ma). The superbasin model proposes continuation of stratigraphy along the length of the inlier and the existence of corelative units across the inlier. According to this model, the stratigraphy in the Dajarra region (southern part of Western Fold Belt) consists of a series of units that are either continuous with or can be corelated along strike with units that occur further north. The oldest units are the Bottletree Formation and the Lower Haslingden Group, characterized by bimodal volcanics and siliciclastic rocks which were deposited during the 1800-1780 Ma Leichardt Superbasin. These units were unconformably overlain by the Warrina Park Quartzite and the Moondarra Siltstone accumulated during the 1690-1670 Ma Calvert Superbasin. However, there is no geochronological data available from the sedimentary units in the Dajarra region and these correlations remain speculative. In this study, we report new LA-ICP-MS ages from magmatic and detrital zircons that can help constrain the magmatic and sedimentary history of the rocks occurring in this region and evaluate the existing stratigraphic correlations. Two new magmatic events, between 1810-1780 Ma and between 1710-1690 Ma, are identified in the southern part of the Western Fold Belt. The detrital zircon data indicates that (1) siliciclastic rocks mapped as the Mount Guide Quartzite have the youngest detrital populations between 1885 Ma and 1850 Ma; (2) siliciclastic sediments from the Eastern Creek Volcanics and the Jayah Creek Metabasalt have the youngest detrital zircon populations between 1870 and 1850 Ma; (3) siliciclastic rocks mapped as the Timothy Creek Sandstone and as the Mount Isa Group have the youngest detrital populations between 1820 and 1780 Ma. The maximum depositional ages obtained in this study are significantly older compared to the same stratigraphic units mapped to the north indicating either a different source or that these units are indeed much older and represent a different stratigraphy not previously recognized in the Mount Isa Inlier.

How to cite: Noptalung, S., Sanislav, I., and McCoy-West, H.: New constraints on the timing of magmatism and sedimentation in the Dajarra region, southern area of Western Fold Belt, Mt Isa Inlier, Australia: implication for stratigraphic successions during Paleoproterozoic , EGU General Assembly 2025, Vienna, Austria, 27 Apr–2 May 2025, EGU25-2666, https://doi.org/10.5194/egusphere-egu25-2666, 2025.

The Manamedu Ophiolite Complex (MOC) within the Palghat-Cauvery Suture Zone (PCSZ) in southern India comprises metamorphosed equivalents of mafic–ultramafic group of rocks including pyroxenite and dunite with locally cumulate textures; gabbroic rock types including gabbro, gabbronorite, and anorthosite; sheeted mafic dykes of amphibolite to meta-andesite and plagiogranite; a thin layer of ferruginous cherts. The tectonic discrimination of these rocks based on various geochemical plots shows that they were related to island arc tholeiite (IAT) group with tholeiitic to calcalkaline signatures. Most of the samples (hornblendite, anorthosite, and amphibolite) have similar chondrite-normalized rare earth element patterns characterized by light REE enrichment, slightly Eu anomaly, and flat heavy REE profiles, except plagiogranite has a significant Eu anomaly. In the primitive mantle-normalized spidergram, all samples show depletion in HFSE (P, Zr, Sm, Ti, and Y) and enrichment of LILE (Rb, Ba, Th, Sr) with negative Nb anomalies. The petrological and geochemical characteristics of the lithological association of MOC represent the remnants of an oceanic crust, which may be formed in a suprasubduction zone geodynamic environment.

How to cite: Chen, N. H.-C.: Geochemical and petrological study of the Manamedu Ophiolite Complex, Cauvery suture zone, southern India, EGU General Assembly 2025, Vienna, Austria, 27 Apr–2 May 2025, EGU25-4628, https://doi.org/10.5194/egusphere-egu25-4628, 2025.

Clarifying the sedimentary characteristics of the Precambrian microbialite is crucial for understanding the evolution of early life on Earth. In the study, the sedimentary, mineralogical and geochemistry characteristics of microbial dolomite at the Ediacaran in the Upper Yangtze Block are analyzed. The results show that the late Ediacaran in the Upper Yangtze is a rimmed carbonate platform. The microbialite inside the semi-restricted platform is small and sparse, with low residual organic matter, while microbialite at the platform margin is large and dense, with high residual organic matter. The in- situ major elements, rare earth elements, C/O isotopes, and mineral assemble of microbialite indicate significant hydrothermal activity at the platform margin. Under the influence of hydrothermal activity, microbialite at the platform margin are enriched in Fe, Mn, PEF, BaEF, NiEF, CuEF, CoEF, ZnEF, with higher levels of NaEF, KEF, MgEF and UEF, MoEF, VEF, indicating a sedimentary environment with sufficient nutrients, higher salinity, higher seawater temperature and lower oxygen. It can be concluded that environments significantly influenced by hydrothermal activity during the late Neoproterozoic were more suitable for microbial habitation, which may also suggest the origin of early life on Earth.

How to cite: Wang, H.: Sedimentary characteristics of Ediacaran microbialite in the Yangtze Platform, South China: implications for the evolution of early life, EGU General Assembly 2025, Vienna, Austria, 27 Apr–2 May 2025, EGU25-4766, https://doi.org/10.5194/egusphere-egu25-4766, 2025.

EGU25-6167 | PICO | GD3.2

Slow Thickening of Cratons Has Increased Kimberlite Frequency Over Time 

Jyotirmoy Paul and Clinton Phillips Conrad

Kimberlites are exclusively found on cratons, some of which have remained stable for more than 3 billion years. Kimberlite melts are generated at temperatures of at least 1300°C and pressures of 5–7 GPa, corresponding to depths of 160–250 km. Cratons, being thicker than normal lithosphere, are thus natural hosts for kimberlite melts. Analyzing the frequency of kimberlite eruptions over time, we found that their frequency gradually increased after 1.5 Gyr. Notably, before 2 Gyr, only 4-5 records of kimberlite eruptions have been documented. As kimberlites are found on stable cratons, preservation bias due to tectonic or erosional destruction may not fully explain the scarcity of older kimberlites. This paucity motivated us to explore a potential correlation between craton thickness and kimberlite frequency. Analysing previous studies we hypothesize that, initially, cratons were less than 150 km thick — below the kimberlite stability depth –  and they have thickened over time, eventually reaching depths conducive to kimberlite stability. Mechanisms for craton growth remain poorly understood, although gravitational thickening and self-compressive thickening have been proposed. To investigate these mechanisms within the context of supercontinental cycles, we developed 2D box models using the finite element code ASPECT. Starting with a 150 km thick craton, we allowed mantle flow to evolve over 3 Gyr. Due to their high viscosity and thickness, cratons can divert mantle flow, creating a self-compressive environment during supercontinental assembly. During supercontinental breakup, mantle flow generates an extensional environment that thins the craton. We simulated four supercontinental cycles corresponding to Superia, Columbia, Rodinia, and Pangea. Our results show that cratons became progressively thicker during each cycle. After 1.5 Gyr, craton thickness increased to approximately 160 km, entering the kimberlite stability field. By the time of the Rodinia assembly, craton thickness had reached levels suitable for diamondiferous kimberlite formation, potentially explaining the sudden increase in kimberlite eruptions around 1.1 Ga. We tested various parameters, including viscosity, density, initial thickness, and craton width, against different background mantle flow velocities. Our preliminary results suggest that the gradual thickening of cratons after 1.5 Gyr increased the likelihood of kimberlite eruptions on Earth.

How to cite: Paul, J. and Conrad, C. P.: Slow Thickening of Cratons Has Increased Kimberlite Frequency Over Time, EGU General Assembly 2025, Vienna, Austria, 27 Apr–2 May 2025, EGU25-6167, https://doi.org/10.5194/egusphere-egu25-6167, 2025.

Plate tectonics is central to the long-term release of heat from Earth’s deep interior, which ultimately maintains habitability, but its time of onset is highly debated. Early Archean granitic domes surrounded by greenstones provide evidence for gravitational reorganization of the crust and dominance of vertical tectonics distinct from plate tectonics. However, because plate tectonics is a kinematic framework, a measure of motion such as that provided by paleomagnetism is needed for direct tests. The East Pilbara craton (Western Australia) preserves classic Paleoarchean to Mesoarchean granite-greenstone geology, but paleomagnetic data from these rocks have been interpreted as tracing modern plate tectonic velocities. Herein, we report new paleomagnetic data from granite, basalt and dacite ranging in age from 3.49 to 3.2 Ga from the East Pilbara craton and find that these carry a 2.7 Ga reset magnetization, a pattern seen in data throughout the craton. The recognition of this resetting resolves the conflict with the geological record, and together with other paleomagnetic results from the Kaapvaal (South Africa) and the Yilgarn (Western Australia) cratons define a 600 myr-long transition between stagnant lid tectonics and modern plate tectonic motions, the latter beginning ca. 3.0 to 2.7 billion years ago.

How to cite: Cottrell, R., Bono, R., and Tarduno, J.: Modern plate tectonic motions commenced after formation of voluminous Paleoarchean to Mesoarchean TTG crust , EGU General Assembly 2025, Vienna, Austria, 27 Apr–2 May 2025, EGU25-7331, https://doi.org/10.5194/egusphere-egu25-7331, 2025.

EGU25-10015 | ECS | PICO | GD3.2

Clay-hematite Association in Late Paleoproterozoic Oolitic Ironstones of the North China Craton  

Yisheng Li, Xiancai Lu, Xiangjie Cui, Huan Liu, Jiarun Liu, and Yuanfeng Cai

Original phases of the Proterozoic Iron Formations (IFs) have been considered as essential archives of paleo-seawater geochemistry. It is widely acknowledged that hydrated ferric oxides/hydroxides were the primary precursor phase. However, the significance of high silica concentrations in Precambrian seawater has been receiving increasing attention for understanding the original iron mineralogy. Recent studies have provided compelling evidence that Fe(II)-silicates were the predominant precursor phases of IFs.

In this study, we identified the Fe-illite cortices within ooids from the Paleoproterozoic Chuanlinggou Iron Formation, located on the northern margin of the North China Craton. The Fe-illite, characterized by an Fe(II)/Fetotal ratio of approximately 20%, exhibits tangentially arranged crystals probably formed by wave action in reducing environments. There is considerable hematite within the Fe-illite cortices, which can be categorized into striped and granular types. Striped hematite is tangentially arranged alongside the Fe-illite, and its rare earth element (REE) patterns exhibit heavy rare earth element (HREE) enrichment, similar to Fe-oxide cortices. In contrast, Fe-illite associated with granular hematite exhibits light rare earth element (LREE) enrichments. We propose the Fe-illite cortices reflect the original Fe-smectite precipitation from paleo-seawater under alkaline conditions, and striped hematite represents the original mineral phase during the formation of the Fe-smectite cortices. Furthermore, the Fe-illite cortices exhibit orders-of-magnitude enrichment in biological elements compared to Fe-oxide cortices. It is noticeable that similar clay-hematite association has been reported in the Paleoproterozoic Yunmengshan oolitic ironstone from the southern margin of the North China Craton (Qiu et al., 2020). These findings indicate specific solution chemistry and potential biological influences at the craton margins during the Proterozoic era.


References

Qiu, Y., Zhao, T. and Li, Y. (2020) The Yunmengshan iron formation at the end of the Paleoproterozoic era. Applied Clay Science 199, 105888.

How to cite: Li, Y., Lu, X., Cui, X., Liu, H., Liu, J., and Cai, Y.: Clay-hematite Association in Late Paleoproterozoic Oolitic Ironstones of the North China Craton , EGU General Assembly 2025, Vienna, Austria, 27 Apr–2 May 2025, EGU25-10015, https://doi.org/10.5194/egusphere-egu25-10015, 2025.

EGU25-10905 | ECS | PICO | GD3.2

Late Archaean basalts from the Yilgarn craton record evidence of thin lithosphere prior to cratonisation 

Marthe Klöcking, Karol Czarnota, Ian H. Campbell, Hugh Smithies, David C. Champion, and D. Rhodri Davies

The dynamics of Earth’s early mantle and the timing of the onset of plate tectonics remain a topic of debate. Proposed hypotheses for the Archaean eon range from a stagnant-lid Earth all the way to modern-style plate tectonics. Here, we estimate temperatures and depths of melt generation in the late Archaean mantle using a new geochemical data compilation of mafic igneous rocks from the Yilgarn craton, Australia. We combine these results with stratigraphic and geodynamic constraints to resolve the tectonic regime and upper mantle dynamics at the time.

Primitive volcanic rocks can preserve signatures of the melting processes in the mantle: depth and temperature of melting are recorded in magma major and trace element chemistry. We have collated a data compilation of mafic volcanic samples from the Archaean Yilgarn craton in Western Australia. In order to identify those samples most representative of melting conditions in the convecting mantle, the data were screened to minimise the effects of crystal fractionation and assimilation of crustal or cumulate material (9 wt% < MgO < 15 wt%; no Eu anomalies, no positive Pb anomalies; Nb/U > 30). We further correct these screened compositions for olivine fractionation. This screened dataset predominantly comprises tholeiitic basalts in the Kalgoorlie terrane that erupted prior to the main komatiite sequence and the felsic magmas that make up the bulk of the Yilgarn cratonic crust. The mafic compositions investigated here therefore represent melting conditions immediately before the onset of cratonisation.

The screened data display depleted, MORB-like rare earth element patterns with no evidence of a garnet signature. Forward and inverse geochemical modelling of these compositions, assuming a primitive mantle source, predicts melting at depths as shallow as ~40 km and mantle potential temperatures elevated by ~200 °C compared to present-day ambient mantle. These results are consistent with melting of a rising plume head combined with moderate extension of the pre-existing lithospheric lid.

How to cite: Klöcking, M., Czarnota, K., Campbell, I. H., Smithies, H., Champion, D. C., and Davies, D. R.: Late Archaean basalts from the Yilgarn craton record evidence of thin lithosphere prior to cratonisation, EGU General Assembly 2025, Vienna, Austria, 27 Apr–2 May 2025, EGU25-10905, https://doi.org/10.5194/egusphere-egu25-10905, 2025.

The ocean pH is a fundamental property regulating various aspects of Earth system evolution. However, the early ocean pH remains controversial, with estimates ranging from strongly acidic to alkaline. Here we develop a model integrating global carbon cycling with ocean geochemistry, and incorporating continental growth and mantle thermal evolution. By coupling global carbon cycle with ocean charge balance, and by using solid Earth processes of mantle degassing and crustal evolution to specify the history of volatile distribution and ocean chemistry, we show that a rapid increase in ocean pH is likely during the Hadean to the early Archean, with pH evolving from 5 to neutral by approximately 4.0 Ga. This rapid pH evolution is attributed primarily to elevated rates of both seafloor and continental weathering during the Hadean. This acceleration in weathering rates originates in the unique aspects of Hadean geodynamics, including rapid crust formation, different crustal lithology, and fast plate motion. Earth likely transformed from a hostile state to a habitable one by the end of the Hadean, approximately 4.0 Ga, with important implications for planetary habitability and the origin of life.

How to cite: Guo, M. and Korenaga, J.: Rapidly evolving ocean pH in the early Earth: Insights from global carbon cycle coupled with ocean chemistry, EGU General Assembly 2025, Vienna, Austria, 27 Apr–2 May 2025, EGU25-11088, https://doi.org/10.5194/egusphere-egu25-11088, 2025.

EGU25-11656 | ECS | PICO | GD3.2

Lithosphere-Mantle Interactions and Weakening Processes in Early Earth: Implications on the onset of Plate Tectonics 

Poulami Roy, Jeroen van Hunen, Michael Pons, and Arijit Chakraborty

The initiation of plate tectonics marks a pivotal moment in Earth's geological history, shaping its surface dynamics and influencing its habitability. Despite its significance, the mechanisms that triggered the onset of plate tectonics during the early Earth remain a subject of active debate, with several mechanisms that may have existed prior to Plate tectonics (PT), and might have gradually evolved into or abruptly triggered PT., e.g. crustal resurfacing, crustal overturn, sagduction, plume induced subduction, formation of reworked crust, damage induced plate boundary formation and plutonic squishy lid regime. In this study, we investigate how localized lithospheric weakening, potentially driven by mantle plumes and/or melt, could have contributed to the emergence of plate tectonics. Using 2D numerical simulations developed with the ASPECT geodynamic code, we explore the conditions under which these mechanisms may operate. To investigate these processes, a parameter sensitivity study that explores the effects of mantle and crustal rheological properties and ambient mantle temperature have been carried out. We will present the preliminary results of this work which provides new insights into the complex interplay of lithosphere and mantle processes that could have driven the emergence of plate tectonics, offering a framework for reconciling diverse hypotheses.


How to cite: Roy, P., van Hunen, J., Pons, M., and Chakraborty, A.: Lithosphere-Mantle Interactions and Weakening Processes in Early Earth: Implications on the onset of Plate Tectonics, EGU General Assembly 2025, Vienna, Austria, 27 Apr–2 May 2025, EGU25-11656, https://doi.org/10.5194/egusphere-egu25-11656, 2025.

EGU25-16055 | ECS | PICO | GD3.2

3.7 Ga Isua Supracrustal Belt sediments record formation of fore-arc basin with conditions conducive to proliferation of life 

Austin Jarl Boyd, Minik Rosing, Magnus Harding, Donald Canfield, and Tue Hassenkam

The Isua Supracrustal Belt hosts >3.7 Ga old detrital meta-sediments that consist of turbiditic and pelagic pelites. These meta-sediments contain some of the oldest evidence for life in the form of abundant graphite with low δ13C. The continuous occurrence of this graphite throughout these meta-sediments is consistent with their formation in a basin with a continued pelagic biomass productivity, fueled by a consistent source of nutrients. Understanding the environment in which these early life-forms thrived is fundamental to our understanding of which conditions are conducive to life on Earth. In order to trace the tectonic and compositional development of the basin and proximal terranes, we have characterized a ca. 80 m rock core that samples the basaltic basement, iron-rich meta-sediments, detrital meta-sediments and contacts between these lithologies. The basement consists of basalts with major and trace elemental compositions that are similar to boninites and are conformably overlain by iron rich mixed chemical and detrital sediments. Iron concentrations fall gradually upwards in the core, with sporadic reoccurring iron-rich layers occurring in the upper core. The gradual change in iron concentrations shows that the core contains a broadly conformable and coherent stratigraphy that records the formation of the volcanic basement, followed by iron deposition enhanced by post-volcanic hydrothermal circulation. Detrital sediments were being deposited as soon as the basin floor was formed, indicating that proximal erodible terranes were already present. A combination of proxies, consisting of La/Yb, Ti/Zr and petrographic observations show that this detrital component was derived from ca. 60 % tonalities and 40 % non-boninitic basalts. These conditions are best explained by the formation of a volcanic fore-arc basin in front of a pre-existing differentiated terrane formed by melting of hydrated basalts. This sequence of events is consistent with cumulative zircon ages in surrounding gneisses that suggest episodic collisions of primitive arcs, followed by re-initiation of subduction. The active volcanism, tectonism and formation of (semi)restricted basins in this environment likely allowed the accumulation of nutrients required for the proliferation of life.

How to cite: Boyd, A. J., Rosing, M., Harding, M., Canfield, D., and Hassenkam, T.: 3.7 Ga Isua Supracrustal Belt sediments record formation of fore-arc basin with conditions conducive to proliferation of life, EGU General Assembly 2025, Vienna, Austria, 27 Apr–2 May 2025, EGU25-16055, https://doi.org/10.5194/egusphere-egu25-16055, 2025.

EGU25-18911 | PICO | GD3.2

Namibe Group detrital zircon U-Pb and Lu-Hf isotopes: a testimony of late-Orosirian (1.9–1.8 Ga) crustal growth in the Angolan Shield (Congo Craton) 

Ezequiel Ferreira, Jérémie Lehmann, José Feliciano Rodrigues, Paulo Bravo Silva, Trishya Owen-Smith, José Luis Garcia Lobón, João Correia, Henriette Ueckermann, Mmasetena Anna Molekwa, José Manuel, and Américo da Mata Lourenço Victorino

The Namibe Group represents the largest package of immature supracrustal rocks of the Angola Shield (Congo Craton), occupying an area of nearly 10,000 km2 in the Namibe Zone (NZ). It is a folded, steeply dipping, meta-volcanosedimentary sequence essentially comprising immature micaschists and greywackes, felsic metavolcaniclastites, along with intercalated marbles and amphibolites. The metavolcanosedimentary sequence is intruded by ca. 1810–1790 Ma ultramafic to felsic plutonic rocks with magmatic arc geochemical signatures. Despite its importance, key aspects such as its maximum depositional age (MDA), sedimentary provenance, and the detrital zircon (DZ) record of crustal evolution remain unresolved. This study presents LA-ICP-MS U-Pb and Lu-Hf DZ analyses from nine NG samples.

The results reveal a dominant cluster of MDAs between 1840 ± 6 Ma and 1820 ± 5 Ma, with two samples yielding older MDAs of 1867 ± 15 Ma and 1880 ± 13 Ma. These findings establish a late-Orosirian age for the NG, refuting earlier proposals of an Archean age. The DZ age distributions are dominated by a prominent youngest peak, with most ages clustering near the MDA. These patterns resemble those of active magmatic arc basin deposits, indicating a convergent plate margin setting for NG deposition.

The provenance for all DZs can be explained by sources internal to the SW Angolan Shield, apart from a minor (8%) Rhyacian age fraction (~2.08 and ~2.14 Ga), for which no rocks of this age have been identified in the Angolan Shield. Approximately 63% of the DZs are late-Orosirian (1.82–1.90 Ga), with a predominant component at ~1.83 Ga and a minor one at ~1.87 Ga. These zircons were likely sourced from the extensive magnesian, calc-alkaline granitoids of the Epupa Metamorphic Complex (EMC: ~1.86–1.76 Ga), the Kamanjab Inlier (~1.88–1.80 Ga), the NZ (~1.83–1.79 Ga), and/or ~1.84–1.80 Ga plutons intruding the Central Eburnean Zone (CEZ: 2.04–1.95 Ga). Older DZ populations comprise 23% early-Orosirian (Eburnean) ages (peaks at ~1.92, ~1.97, and ~2.01 Ga) and 6% Archean ages (2.50–3.52 Ga). These Eburnean and Archean DZs were likely sourced from the CEZ and/or Cassinga Zone in southern Angola, and/or the Sesfontein-Grootfontein-Tsumkwe-Quangwadum inliers in northern Namibia.

Archean DZs exhibit mostly subchondritic Hf compositions, indicating significant crustal reworking. This trend persisted during Rhyacian to early Orosirian times, with 88% of DZs displaying markedly negative εHf(i) values. In contrast, most late Orosirian DZs (86%) plot above the crustal evolution trend of older ones, reflecting a marked shift toward slightly subchondritic to suprachondritic εHf(i) values and younger TDM2 model ages. This trend indicates a substantial increase in the contribution of juvenile material to magma generation in late-Orosirian times.

This isotopic shift is also observed in late-Orosirian granitoids of the NZ and EMC, likely reflecting a fundamental geodynamic transition from a period dominated by crustal reworking to juvenile accretion within this part of the Angolan Shield.  Our data show that significant continental growth took place in the southwestern margin of the Angolan Shield (Congo Craton) in late-Orosirian times, during the assembly of Columbia.

How to cite: Ferreira, E., Lehmann, J., Feliciano Rodrigues, J., Bravo Silva, P., Owen-Smith, T., Garcia Lobón, J. L., Correia, J., Ueckermann, H., Molekwa, M. A., Manuel, J., and da Mata Lourenço Victorino, A.: Namibe Group detrital zircon U-Pb and Lu-Hf isotopes: a testimony of late-Orosirian (1.9–1.8 Ga) crustal growth in the Angolan Shield (Congo Craton), EGU General Assembly 2025, Vienna, Austria, 27 Apr–2 May 2025, EGU25-18911, https://doi.org/10.5194/egusphere-egu25-18911, 2025.

CL1.2 – Past Climate - Last ~2.6 Ma

EGU25-1712 | ECS | Posters on site | CL1.2.1

Trees resilience to drought in forest ecosystems from Eastern Carpathians, Romania 

Andrei Popa, Mihai Balabasciuc, and Ionel Popa

Carpathian forest ecosystems play a major role in providing ecosystem services and ecological stability in Europe. Increasing drought frequency and intensity is a reality in plains and hills regions, becoming a threat also for mountain forest ecosystems. Forests are among the most vulnerable terrestrial ecosystems to these extremes. The impacts of climate change vary from the reduction of productivity and loss of overall ecosystem biodiversity to even the mortality of trees. Our study assessed the growth and drought resilience of three main forest species from the Carpathians: Picea abies, Abies alba, and Fagus sylvatica.
Based on an extensive tree ring data network consisting of over 6000 trees from 158 plots for P. abies, 64 plots for A. alba, and 65 plots for F. sylvatica, distributed along an elevation gradient, we (i) evaluate the basal area increment variability and (ii) quantify the resilience to the most extreme drought years from last 100 years. To assess the tree's capacity to react to water deficit, we used the resilience indices: resistance, recovery, and recovery period.
Our results show an evident growth decline of P. abies from elevation below 1400 m, with a similar trend in the case of A. alba from elevation below 800 m. A. alba and F. sylvatica show an increasing trend of basal area increment in plots from medium and high elevations. F. sylvatica and A. alba have a higher resistance and resilience to water deficit at low elevations than P. abies. Generally, the recovery period from drought events increases with elevation from all species. 

How to cite: Popa, A., Balabasciuc, M., and Popa, I.: Trees resilience to drought in forest ecosystems from Eastern Carpathians, Romania, EGU General Assembly 2025, Vienna, Austria, 27 Apr–2 May 2025, EGU25-1712, https://doi.org/10.5194/egusphere-egu25-1712, 2025.

How do climatic conditions, particularly rainfall, influence the radial growth and vascular traits of Vachellia macracantha in tropical dry forests? This study aimed to measure the tree-ring width (TRW) and vascular variables (AVLA, TVLA, VDLA) of V. macracantha in the Tumbesian dry forest of southern Ecuador, construct chronologies for these variables, and analyze their relationship with precipitation. Using standard dendrochronological methods, we measured TRW and vascular traits, subsequently developing chronologies for both TRW and the vessel variables. These chronologies were correlated with precipitation data to assess climate-growth relationships. Results showed a positive correlation between precipitation and both TRW and AVLA, indicating that higher rainfall promotes radial growth and larger vessel lumen areas. In contrast, precipitation was negatively correlated with TVLA and VDLA, suggesting a decrease in vessel density and total lumen area under wetter conditions. These findings underscore the adaptability of V. macracantha to fluctuating water availability, demonstrating how it balances hydraulic efficiency and safety. By integrating dendrochronology and wood anatomy, this study provides critical insights into the growth dynamics of tropical dry forests and offers a robust foundation for conservation strategies in the face of changing climate conditions.

How to cite: Peña, K.: Effect of climate on ring-width and vessel variables of Vachellia macracantha from dry forest in Southern Ecuador, EGU General Assembly 2025, Vienna, Austria, 27 Apr–2 May 2025, EGU25-1964, https://doi.org/10.5194/egusphere-egu25-1964, 2025.

EGU25-3163 | ECS | Posters on site | CL1.2.1

The effects of individual tree competition on growth-based resilience to a fast-changing climate 

Rebecca Partemi, Tom Levanič, and Jernej Jevšenak

Climate change poses a significant threat to forest ecosystems worldwide, intensifying the frequency and severity of extreme droughts that challenge tree survival, growth and carbon sequestration. In addition to climate variability, one of the most significant factors affecting tree growth is competition, which ultimately shapes resource availability, stand structure, and microclimatic conditions. However, our understanding of how individual traits and stand-level characteristics influence the resilience of different tree species to climate stressors remains limited. While competition is recognized as a key driver of tree growth dynamics, its impact on the climate sensitivity and coping strategies of trees to drought conditions is poorly understood.

In this study, we investigate the interplay between individual tree competition and tree size characteristics such as diameter at breast height (DBH) and social status in modulating growth and responses to climate variability. Specifically, we examine how various growth-based resilience indicators (resilience, resistance, recovery and recovery period) and climate-growth relationships are affected by stand-level competition obtained by measuring DBH of each competitor tree within a 10-meter radius of our focal trees. By integrating competition data with dendrochronological analyses, we assessed how current competition status affects the resilience of Norway spruce (Picea abies), Scots pine (Pinus sylvestris), and Silver fir (Abies alba) to warmer and drier climate, both in past and present contexts, between two sites with differing productivity levels.

We hypothesize that smaller trees and those under strong competition are less exposed, as shading from larger trees may buffer them against extreme environmental conditions such as high temperatures and water stress. This shading effect likely creates a more stable microclimate, mitigating drought conditions. However, these benefits may come at the cost of slower growth rates and reduced access to resources under competitive pressure.

This study provides valuable insights into the relationship between stand dynamics and tree resilience to climate stressors. Understanding how competition and tree status concurrently shape climate sensitivity and potentially moderate drought consequences, can help achieve a more nuanced perspective on forest management. These insights can inform strategies to promote forest resilience by fostering greater species diversity and vertical structural complexity, creating forests that are better suited to withstand increased frequency of climatic extremes. Promoting diverse and vertically layered forests not only supports sustainable and adaptive forestry practices but also enhances ecosystem stability and the capacity to mitigate environmental challenges. 

How to cite: Partemi, R., Levanič, T., and Jevšenak, J.: The effects of individual tree competition on growth-based resilience to a fast-changing climate, EGU General Assembly 2025, Vienna, Austria, 27 Apr–2 May 2025, EGU25-3163, https://doi.org/10.5194/egusphere-egu25-3163, 2025.

Green alder (Alnus alnobetula (Ehrh.) K. Koch) is a tall, multi-stemmed deciduous shrub widespread in the Central European Alps across the treeline ecotone. The focus of this study was (i) to determine key dates of intra-annual radial stem growth (RG), and (ii) to assess environmental factor most closely related to daily RG along an elevational transect. For this purpose, RG was continuously recorded by dendrometers mounted on shoots (n=16–20 dendrometer records per year) at three study plots on Mt. Patscherkofel (1940–2150 m asl) during the growing seasons 2022–2024, and in potted saplings (n=3) at 600 m asl (Botanical garden in Innsbruck, Tyrol, Austria). The Gompertz function was applied to determine phenological dates of intra-annual RG dynamics, i.e., onset, end, duration and time of maximum RG. Daily radial stem increments were extracted from dendrometer traces, and Spearman correlations (ρ) with environmental variables were determined. Results revealed that within the treeline ecotone RG started and ceased around end of June (doy 177±7) and end of August (233±9), respectively. The mean growth duration was found to be 56 ± 9 days. Within the treeline ecotone mild temperatures in May and cold spells during the growing period led to an earlier start and end of RG, respectively. The time of maximum RG was observed in early July (doy 192±8), with about 60 % of the annual increment developing during this month. Although RG in the valley already started in mid-May (doy 134±2) and lasted until mid-October (doy 286±8; duration: 153±7 days), time of maximum RG in 2024 was reached at a similar point in time as within the treeline ecotone (doy 194±13). The environmental factor most closely related to intra-annual RG was soil temperature along the entire elevational transect (ρ=0.371–0.419; P<0.01). Air and cambial temperature were less closely related to RG at all study plots. Precipitation constrained RG at the forest line (ρ=0.549, P<0.001) and at the south-facing treeline site (ρ=0.426, P<0.001). Soil water content and vapour pressure deficit of the air had no significant influence on RG. Results of this study revealed a high degree of plasticity in RG of A. alnobetula, with the RG period spanning two and five months within the treeline ecotone and in the valley, respectively. The greater significance of soil temperature compared to air and cambial temperature for RG is most likely attributable to a non-linear relationship between RG and temperature.

This research was funded by the Austrian Science Fund (FWF), P34706-B.

How to cite: Oberhuber, W., Wieser, G., and Gruber, A.: Effects of environmental variables on intra-annual dynamics of radial growth of green alder (Alnus alnobetula) along an elevational transect, EGU General Assembly 2025, Vienna, Austria, 27 Apr–2 May 2025, EGU25-4019, https://doi.org/10.5194/egusphere-egu25-4019, 2025.

EGU25-5180 | Posters on site | CL1.2.1

Tracking the isotopic fingerprint of defoliation in tree rings 

Valentina Vitali, Cecilia Franka Hofmann, Nikolaus Obojes, Elisabet Martínez-Sancho, Meisha Holloway-Phillips, Joanna Sydney Reim, Marçal Argelich Ninot, Bernhard Muigg, Willy Tegel, Jesus Julio Camarero Marinez, Matthias Saurer, and Yann Vitasse

Understanding changes in the physiological responses of trees to disturbances, and establishing proxies to reconstruct past events, is of high importance in a changing world. Recent studies have demonstrated the potential of δ2H in tree-ring cellulose as a proxy for physiological changes in carbon utilization, reflecting shifts between the use of current assimilates and stored C sources. These findings might explain the considerable annual variations in the strength of the δ18O and δ2H (O-H) relationship despite the shared hydrological pathway, underlining the complex interaction of hydrological and physiological processes. One of the situations where there is a clear disruption of carbon assimilation and tree functioning is defoliation events. Thus, tree-ring isotopes can be utilized to test the physiological signal recorded in tree rings by quantifying changes in δ13C, δ2H and δ18O values, and the decoupling of the O-H relationship. Here, we investigated the isotopic fingerprint of abiotic and biotic defoliation events in tree-ring cellulose, including (i) late-spring frost on European beech near its upper elevational limit in the Swiss Jura(ii) pine processionary moth outbreaks in northern Italy, and (iii) cockchafer moth outbreaks on archaeological oak material from Central European lowlands. Across all defoliation types, a common fingerprint was identified with significantly enriched δ2H, depleted δ18O, resulting in the decoupled (negative) O-H relationship, and non-affected δ13C values.  As defoliation causes reduced fresh carbon assimilation, the remobilization of stored non-structural carbohydrates (NSC) is likely the fundamental process for plant growth, metabolism, and canopy re-flushing. NSC differ in their isotopic ratio compared to fresh photosynthates, by exhibiting 2H-enrichment and 18O-depletion, explaining the negative O-H relationship in tree-ring cellulose. Since defoliation has been shown to induce allocation shifts by prioritizing NSC storage over radial growth, foliage loss also leads to substantial secondary growth reductions which was observed across all defoliation types. The generally non-significant changes in δ13C between outbreak and non-outbreak years indicate minor impacts on leaf stomatal conductance. In conclusion, this common isotopic fingerprint provides valuable insight into past defoliation events and their reconstruction, which is particularly relevant in the context of rapid environmental change.

How to cite: Vitali, V., Hofmann, C. F., Obojes, N., Martínez-Sancho, E., Holloway-Phillips, M., Reim, J. S., Argelich Ninot, M., Muigg, B., Tegel, W., Camarero Marinez, J. J., Saurer, M., and Vitasse, Y.: Tracking the isotopic fingerprint of defoliation in tree rings, EGU General Assembly 2025, Vienna, Austria, 27 Apr–2 May 2025, EGU25-5180, https://doi.org/10.5194/egusphere-egu25-5180, 2025.

EGU25-6466 | ECS | Posters on site | CL1.2.1

The First Tree-Ring Blue Intensity Measurements from the Korean Peninsula: Exploring Summer Temperature Signals 

Min-Seok Kim, Mauricio Fuentes, Hans Linderholm, Frida Lidman, Youngdae Koh, Chanhyuk Choi, Sung-Ho Woo, and Jee-Hoon Jeong

Tree-ring blue intensity (BI), a proxy measuring blue light reflection from tree-ring cores, has emerged as a promising tool for climate reconstruction, yet its application in East Asia remains limited. Here we evaluate the dendroclimatological potential of tree-ring blue intensity using Korean pine (Pinus koraiensis Siebold & Zucc.) samples from Mt. Seorak in the Korean Peninsula. We developed chronologies using tree-ring width (TRW) and three BI parameters (earlywood BI, maximum latewood BI, and delta BI), with delta BI (DBI) exhibiting robust correlations with summer (July-August) mean surface air temperature (SAT). Despite weak series intercorrelation in the BI chronologies, the DBI measurements preserved consistent temperature signals from the early 20th century to present, in contrast to the inconsitent climate response in the TRW data. The DBI chronology further demonstrated potential for reconstructing large-scale atmospheric patterns, including the circumglobal teleconnection pattern and subtropical jet stream. Our findings establish BI methodology as a valuable tool for enhancing climate reconstructions in subtropical East Asia, particularly in regions where traditional TRW measurements prove inadequate for capturing summer temperature signals.

How to cite: Kim, M.-S., Fuentes, M., Linderholm, H., Lidman, F., Koh, Y., Choi, C., Woo, S.-H., and Jeong, J.-H.: The First Tree-Ring Blue Intensity Measurements from the Korean Peninsula: Exploring Summer Temperature Signals, EGU General Assembly 2025, Vienna, Austria, 27 Apr–2 May 2025, EGU25-6466, https://doi.org/10.5194/egusphere-egu25-6466, 2025.

EGU25-7291 | ECS | Orals | CL1.2.1

Tree growth responses to climate variability: The case of Clethra arborea in the Azores and Madeira islands. 

André Neves, Diogo Pavão, Ricardo Camarinho, Lurdes Silva, and Luís Silva

Forests on oceanic islands present unique opportunities for dendroclimatic research, owing to the pronounced climatic gradients over short geographic distances. In the Azores archipelago, with a temperate oceanic climate, with low thermal amplitude, and mild and relatively wet Summers, Clethra arborea Aiton (Clethraceae) is one of the most recent examples in the Azores of the generally unexpected consequences that the introduction of an exotic species, introduced in São Miguel Island (Azores) probably in 1950s. Madeira island climate is slightly warmer and more humid than the Azores, with distinct variations between the north and south of the island due to its topography. Here, Clethra arborea Aiton is an endemic plant. Forest management is essential for maintaining and improving the provision of ecosystem services, while dendrochronological techniques can be instrumental in supporting this effort. There are not many dendrochronological studies that have targeted this species elsewhere and, both archipelagos, are widely unexplored in terms of dendroclimatology, so, this study in the Azores and Madeira is aimed to understand its climate-growth relationships better and allow the identification of possible limiting factors on growth through tree-ring inter-annual pattern variations. For this purpose, we sampled 606 trees from two populations (São Miguel and Madeira islands). Following standard dendrochronological methods, we obtained four site chronologies from São Miguel Island and four site chronologies from Madeira Island. We used a stepwise modelling approach, with Random Forest and Generalized Linear Models. Our results suggest that Clethra arborea benefits from the conditions of year-round precipitation in the Azores while in Madeira, only on site Encumeada (EN) it benefits from these conditions. For this species, and in the future, higher Winter and Spring temperatures could lead to increased water stress and reduced growth rates. This should be reflected when forecasting the future distribution and productivity of Clethra arborea under diverse climate change scenarios. Our findings provide essential insights for developing management strategies for this species.

How to cite: Neves, A., Pavão, D., Camarinho, R., Silva, L., and Silva, L.: Tree growth responses to climate variability: The case of Clethra arborea in the Azores and Madeira islands., EGU General Assembly 2025, Vienna, Austria, 27 Apr–2 May 2025, EGU25-7291, https://doi.org/10.5194/egusphere-egu25-7291, 2025.

    Dynamic fluctuations in sea surface temperature within the North Atlantic Ocean (NA-SST) exert a pivotal influence on global climate change. Yet, the specific impacts of these variations on the temperature shifts within the Qinling-Bashan Mountains (QBM) of China, remain to be fully elucidated. Furthermore, a debate surrounding the manifestation of the Little Ice Age (LIA) within the QBM is ongoing, primarily due to the scarcity of reliable, long-term, and high-resolution temperature records. To bridge these knowledge gaps, in this paper, we present a ~250-year temperature reconstruction (Tmax11-7) developed based on a tree-ring-width chronology from the QBM. The new reconstruction not only aligns with a local winter temperature reconstruction based on historical document evidence, but also reveals robust regional and hemispheric temperature signals. Intriguingly, the study shows that the warming trend observed in the QBM since the Industrial Era is less pronounced than that witnessed across China and the Northern Hemisphere. The Tmax11-7 reconstruction provides a glimpse into the final stages of the LIA, highlighting a relatively colder 19th century followed by a warmer 20th century. Notably, the warming trend post-1970s remains within the bounds of the 250-year temperature framework. The research further uncovers that NA-SST has predominantly governed the QBM's temperature fluctuations over the past centuries, as evidenced by the tight positive correlation between Atlantic multidecadal Oscillation (AMO)/Atlantic multidecadal variability (AMV) and Tmax11-7. However, this dominant influence of NA-SST was temporarily subdued between 1900 and 1930 CE due to the interference of Pacific Decadal Oscillation (PDO). This finding serves as a reminder that future temperature projections for the QBM must account not only for the primary role of NA-SST but also the modulating effects of the PDO. The study is essential for shaping effective environmental management and adaptation strategies in the region.

How to cite: Cai, Q. and Liu, Y.: The influence of North Atlantic sea surface temperature fluctuations on the climate of the Qinling-Bashan Mountains over the past 250 years, EGU General Assembly 2025, Vienna, Austria, 27 Apr–2 May 2025, EGU25-8087, https://doi.org/10.5194/egusphere-egu25-8087, 2025.

EGU25-8655 | ECS | Posters on site | CL1.2.1

Using GARCH Models to Detect Forthcoming Transitions in Tree Growth 

Samuel Egan and Christian Zang

In numerous ecological systems, forthcoming critical transitions can be identified using a variety of methods for deriving early warning indicators. Several methods focus on characteristics of time-series related to system behaviour or properties, including changes in time-series variability. One such method is conditional heteroskedasticity (CH). CH defines a time series as having a non-constant variability, that is also dependent on the variability at previous time-steps, where increases in variability indicate that the system under study is nearing a critical transition. Here, we apply this concept to time series of radial growth, measured as tree-ring widths: a general autoregressive conditional heteroskedasticity (GARCH) model is used to produce a CH time-series from detrended tree-ring data. By analysing the variability trends within this time series, conclusions can be made relating to the system’s proximity to transition. Whilst this form of analysis is not a novel concept in the field of ecology, such a thorough examination of the models’ ability to detect change in the variability of tree-ring data is yet to be carried out. We propose the application of a dual-model approach, using both GARCH and VS-Lite models, with an aim of determining the efficacy of such a strategy to detect not only changes in tree-growth stability, but more specifically changes induced by climate stressors. This approach has the potential to forecast impending critical transitions in tree-growth behaviour, possible fluctuations in the rate of mortality, and quantify the influence of climate on growth stability at both the tree and site-level.   

How to cite: Egan, S. and Zang, C.: Using GARCH Models to Detect Forthcoming Transitions in Tree Growth, EGU General Assembly 2025, Vienna, Austria, 27 Apr–2 May 2025, EGU25-8655, https://doi.org/10.5194/egusphere-egu25-8655, 2025.

    Climate change has played a pivotal role in shaping Chinese history, especially during the Ming Dynasty. Previous studies have focused primarily on the Chongzhen megadrought, which is widely considered as the primary climatic perturbation behind the demise of the Ming Dynasty. However, relatively little is known about other severe drought events and their potential impact on the dynasty collapse. Additionally, the characteristics of an exceptional climatic anomaly termed the “Late Ming Weak Monsoon Period” are unclear. In this study, we reconstructed the historical variations of Palmer Drought Severity Index for July–September based on tree-ring stable oxygen isotopes (δ18O) from 1556 CE to 2015 CE in southwest Loess Plateau. Our study reveals a significant weakening of the Asian summer monsoon between 1561 CE and 1661 CE, consistent with the Late Ming Weak Monsoon Period, and unravels its structural characteristics in details. Our reconstruction also captures a distinct humidification trend over northwest China since the early 2000s and suggests that this current humidification trend will persist in this region for the next few years. Notably, in addition to the well-known Chongzhen megadrought, our study records the severe Wanli megdrought (1585–1590 CE) during the late Ming Dynasty, an event that rarely featured in earlier studies, exhibiting comparable duration and severity to the Chongzhen megadrought. Further analysis indicates that Wanli megadrought may have served as an early trigger for the collapse of the Ming Dynasty. Furthermore, our analysis implicates the El Niño–Southern Oscillation as a contributing factor in both the Wanli and Chongzhen megadroughts, and thus to the ultimate collapse of the Ming Dynasty by affecting the Asian summer monsoon intensity.

How to cite: Ren, M. and Liu, Y.: The collapse of the Ming Dynasty actually began with the Wanli megadrought: insights from a hydroclimate reconstruction based on tree-ring δ18O over the past 460 years, EGU General Assembly 2025, Vienna, Austria, 27 Apr–2 May 2025, EGU25-8716, https://doi.org/10.5194/egusphere-egu25-8716, 2025.

Global climate change influences the growth and distribution of forest species, including Qinghai spruce (Picea crassifolia), a dominant species on the northeastern Qinghai-Tibet Plateau and a key afforestation species in Northwest China. Using tree-ring data and a random forest algorithm, this study developed a radial growth model to simulate the annual growth of P. crassifolia from 1950 to 2100 under different climate scenarios. The analysis revealed that soil moisture in June and precipitation in September of the previous year were critical factors influencing growth, with optimal thresholds of 0.36±0.09 m³·m⁻³ and 92.56±20.21 mm, respectively. Future projections indicated that the SSP1-1.9 scenario is beneficial for growth, while SSP2-4.5 and SSP5-8.5 scenarios lead to significant habitat degradation and reduced suitable areas. These results emphasize the need for adaptive afforestation and management strategies to address climate variability, providing valuable insights for sustainable forest restoration and conservation in the region.

How to cite: Zhao, Z. and Guo, Y.: Using Tree-Ring Data to Model the Growth Dynamics of Qinghai Spruce Under Future Climate Scenarios, EGU General Assembly 2025, Vienna, Austria, 27 Apr–2 May 2025, EGU25-9542, https://doi.org/10.5194/egusphere-egu25-9542, 2025.

EGU25-11095 | ECS | Orals | CL1.2.1

Temperature-Humidity-Wind index variability on the Qinghai-Tibet Plateau over the past half millennium 

Boya Zhang, Feng Shi, Juan Feng, Jinbao Li, and Bao Yang

The Qinghai-Tibet Plateau has experienced rapid warming over the past six decades, resulting in more frequent extreme weather events with significant impacts on human health. This warming trend, along with improved infrastructure and transportation, has spurred a rise in summer tourism, boosting local economies yet exposing visitors and residents to high risks of public health. However, the relationship between the historical variability of THW index on the Qinghai-Tibet Plateau and human health under the combined influence of external forcing factors and internal climate variability remains unclear. In this study, we reconstructed the summer (June–August) Temperature–Humidity–Wind (THW) index, an indicator of apparent temperature and associated health impacts, across the western, southern, southeastern and northeastern Qinghai–Tibet Plateau over the past 500 years. Our results reveal that the post-1971 CE upward trend in the THW index for the southern, southeastern, and northeastern plateau regions is the most rapid of the past five centuries. Despite the accelerated warming, current THW values remain below the thresholds for heat-related health risks. Notably, the two coldest intervals during 1630–1660 and 1670–1700 CE exhibited marked drops in THW index, possibly lowering oxygen levels and exacerbating chronic mountain sickness, thereby reducing life expectancy. Solar activity shows a significant positive correlation with the THW index on multi-decadal timescales and affects the THW index by altering the radiation flux at the top of the Earth's atmosphere and amplifying it through the water vapor transport feedback mechanism of the ocean. However, the relationship between the Atlantic Multidecadal Oscillation (AMO) and the THW index shifted from negative to positive after the Industrial Revolution. This shift likely stems from the AMO-driven changes in the North Atlantic sea surface temperatures, which alters the Silk Road teleconnection wave train and leads to spatially inconsistent THW patterns. These findings highlight the critical influence of long-term climate variability on human health, underscoring the importance of Predicting future THW index trends by modeling to guide effective public health strategies during global warming.

How to cite: Zhang, B., Shi, F., Feng, J., Li, J., and Yang, B.: Temperature-Humidity-Wind index variability on the Qinghai-Tibet Plateau over the past half millennium, EGU General Assembly 2025, Vienna, Austria, 27 Apr–2 May 2025, EGU25-11095, https://doi.org/10.5194/egusphere-egu25-11095, 2025.

EGU25-12400 | Posters on site | CL1.2.1

Effects of nitrogen deposition and climate extremes on European forests: combining stable isotopes in tree rings and ecosystem fluxes 

Giorgio Matteucci, Marco Montedoro, Matteo Rossi, Francesco Mazzenga, and Rossella Guerrieri

The ability of forests to continue providing important ecosystem services and mitigating climate change depends on their ability to adapt to global change pressures, such as more frequent climate extremes (specifically drought and heatwaves) and changes in atmospheric pollutants, such as reactive nitrogen compounds. On the one hand, nitrogen deposition could stimulate tree growth in a CO2 richer word, but on the other hand increasing atmospheric nitrogen input, above the critical load, could result in forest dieback, through soil acidification and nutrient imbalances but also by making trees more vulnerable to climate extremes. How do these global change components interact and affect forest carbon, water and nitrogen cycling? What are tree ecolophysiological mechanisms involved? Are those mechanisms synchronized (in terms of magnitude and temporal trends) at tree and ecosystem scales? Does nitrogen deposition affect tree and forest responses to climate extremes? 
In order to answer these fundamental questions, we considered 12 forests along a climate and nitrogen deposition gradient (from 3 to 42 kg ha-1 yr-1) in Europe, including four of the most widespread tree species in European forests: Fagus sylvatica, Quercus spp., Picea abies, Pinus sylvestris. Forests sites were selected within established networks, namely ICOS and eLTER (for the ecosystem scale measurements of carbon and water fluxes with eddy covariance technique and other ecological parameters) and ICP Forests (for atmospheric nitrogen deposition). We will present preliminary results on the combinination of existing data on ecosystem fluxes with dendroecological data (growth and stable carbon, oxygen and nitrogen isotope ratios) to explore multidecadal changes in forest water-use efficiency and elucidate tree physiological mechanisms underpinning those responses. Moreover, in specific years characterized by climate extremes, an intra-annual isotope approach will be considered to evaluate possible divergences among tree species in the physiological signal and between tree and ecosystem responses, but also to elucidate the contribution of nitrogen deposition in affecting responses to climate extremes. 
Collaborators at the ICOS and ICP Forests sites selected for the study are greatly acknowledged

How to cite: Matteucci, G., Montedoro, M., Rossi, M., Mazzenga, F., and Guerrieri, R.: Effects of nitrogen deposition and climate extremes on European forests: combining stable isotopes in tree rings and ecosystem fluxes, EGU General Assembly 2025, Vienna, Austria, 27 Apr–2 May 2025, EGU25-12400, https://doi.org/10.5194/egusphere-egu25-12400, 2025.

EGU25-12457 | Orals | CL1.2.1

Warming Tipping Point for tree growth in boreal permafrost landscapes 

Raquel Alfaro Sánchez, Jennifer L. Baltzer, and Sharon L. Smith

Boreal ecosystems are warming at three to four times the global average due to Arctic amplification. At these higher latitudes, where plant growth is constrained by low temperatures, climate warming is expected to shift the tree line northward and enhance vegetation productivity.

Permafrost thaw is also a major driver of climate-induced landscape changes in the north, significantly impacting tree growth and productivity. Approximately 80% of the boreal biome lies within the permafrost region. With continued global warming, permafrost temperatures will rise, leading to increased thaw rates and a reduction in permafrost extent.

Some studies suggest that permafrost thaw may benefit the functioning of overlying forests, primarily due to warmer soils, deeper permafrost tables, and access to newly released resources previously trapped in the frozen ground. However, the combined effects of climate change on growth trajectories in boreal trees remain uncertain. Indeed, satellite and ground-based vegetation studies, including tree-ring analyses, reveal substantial inconsistencies across the boreal and Arctic biomes, with some regions showing accelerated growth and greening, while others exhibit reduced growth and browning.

Here, we assembled a network of tree-ring data from sites with a historical record of permafrost thaw, spanning a climatic gradient in the boreal-subarctic Canadian region, to analyze tree growth patterns and identify their primary drivers—temperature, moisture, or permafrost changes.

Our findings revealed that the positive response of tree growth to warmer temperatures shifted in recent decades, with no significant positive temperature response at any studied site after 2007. Sensitivity to moisture also varied, showing exclusively negative impacts of higher vapor pressure deficit and precipitation on tree growth. Overall, tree growth exhibited a steady increase across the climatic gradient, peaking between 1993 and 2007, followed by a decline after 2007.

Nearly all permafrost monitoring sites examined showed consistent increases in permafrost thaw since 2007, with more pronounced ground destabilization occurring at lower latitudes within the climatic gradient. We found that permafrost thaw generally had a negative impact on tree growth. These reductions in growth were linked to ground destabilization caused by seasonal and long-term changes in ice-rich permafrost, which led to trees tilting off-vertical. Tree leaning triggered the formation of reaction wood, which alters radial growth as the trees counteract the physical instability of the permafrost.

Our results indicate that continued climate warming will drive widespread reductions in radial growth in boreal forests, leading to decreased carbon sequestration capacity.

How to cite: Alfaro Sánchez, R., Baltzer, J. L., and Smith, S. L.: Warming Tipping Point for tree growth in boreal permafrost landscapes, EGU General Assembly 2025, Vienna, Austria, 27 Apr–2 May 2025, EGU25-12457, https://doi.org/10.5194/egusphere-egu25-12457, 2025.

EGU25-13082 | ECS | Posters on site | CL1.2.1

Peatland trees contain strong and temporally stable hydroclimate information in tree-ring δ13C and δ18O records 

Karolina Janecka, Kerstin Treydte, Silvia Piccinelli, Loïc Francon, Marçal Argelich Ninot, Johannes Edvardsson, Christophe Corona, Veiko Lehsten, and Markus Stoffel

Peatland trees are valuable archives of paleoclimatic information; however, gaps persist in understanding the relationships between tree growth, peatland hydrology, and hydroclimate variables. While previous research in peatlands has mainly focused on tree-ring widths (TRW), yielding inconclusive results, the potential of stable carbon (δ13C) and oxygen (δ18O) isotopes in tree rings remains unexplored. In this study, we develop TRW, δ13C, and δ18O chronologies of Scots pine trees located in a Swedish peatland and a reference site on bedrock with a mineral soil layer. We assess their responses to hydroclimate conditions and evaluate their potential for reconstructing hydroclimate variations. Our findings show significant differences in mean TRW and δ13C values between the peatland and reference sites. Moreover, while all three proxies exhibit uniform year-to-year variations across sites, we observe discrepancies in long-term trends, particularly in δ13C. Although the climate sensitivity of TRW is weak and non-homogenous, the δ13C and δ18O peatland and reference chronologies contain robust and consistent signals, with a maximum sensitivity to water table, precipitation, and vapor pressure deficit (VPD) variations during summer. Both δ13C and δ18O chronologies show stable relationships with three key hydroclimate variables over time. In conclusion, while TRWs from living peatland pines at our sites have limited potential to record high-frequency hydroclimate information, δ13C and δ18O chronologies can serve as excellent proxies for the reconstruction of past hydroclimate changes.

How to cite: Janecka, K., Treydte, K., Piccinelli, S., Francon, L., Argelich Ninot, M., Edvardsson, J., Corona, C., Lehsten, V., and Stoffel, M.: Peatland trees contain strong and temporally stable hydroclimate information in tree-ring δ13C and δ18O records, EGU General Assembly 2025, Vienna, Austria, 27 Apr–2 May 2025, EGU25-13082, https://doi.org/10.5194/egusphere-egu25-13082, 2025.

EGU25-13144 | Orals | CL1.2.1

Long-term dynamics of forest and aquatic net primary productivity inferred from tree-ring and limnological records in a sub-alpine lake 

Emanuele Ziaco, Flavia Tromboni, Facundo Scordo, Carina Seitz, and Sudeep Chandra

Terrestrial and aquatic ecosystems are connected through the exchange of nutrients, energy, and organisms. Investigating the spatio-temporal synchronicity (i.e., coupling and decoupling) of Net Primary Productivity (NPP) across these ecosystems is essential for understanding their responses to current and future environmental changes. While tree rings provide a robust proxy for reconstructing terrestrial NPP (TNPP) and its historical fluctuations under varying climatic and environmental conditions, a comparable approach for freshwater ecosystems is hindered by the lack of long-term records of aquatic NPP (ANPP). In this study, we compared annually resolved time series of TNPP, derived from ring-width chronologies of white fir (Abies concolor) and lodgepole pine (Pinus contorta) in the Castle Lake basin (USA), with ANPP records from 1961 to 2020 collected by the long-term ecological research program at the lake. Our analysis focused on identifying patterns of synchronicity between TNPP and ANPP and their climatic drivers across high- and low-frequency domains. Our results revealed a one-year lagged negative effect of TNPP on ANPP, potentially linked to nutrient uptake by vegetation, and a delayed influence of ANPP on TNPP, with a lag of 5–10 years. In the low-frequency domain, we identified a pronounced episode of decoupling (1961–1988), followed by a phase of coupling (1989–2012). These dynamics appear to be driven by contrasting climatic sensitivities: TNPP was negatively influenced by June–July temperatures and drought stress throughout the growing season, whereas ANPP was positively associated with April temperatures and constrained by winter precipitation.  This study highlights the value of long-term monitoring in disentangling the complex interactions between terrestrial and aquatic ecosystems. Our research suggests that the response of aquatic and terrestrial ecosystems to climate change might be characterized by complex patterns of synchronicity, highlighting the importance of cross-disciplinary research. Measurements that connect fundamental processes across the terrestrial to aquatic ecosystems are needed to understand the connections between lake, watershed, and climate, particularly given the certain future of warming in the region.

How to cite: Ziaco, E., Tromboni, F., Scordo, F., Seitz, C., and Chandra, S.: Long-term dynamics of forest and aquatic net primary productivity inferred from tree-ring and limnological records in a sub-alpine lake, EGU General Assembly 2025, Vienna, Austria, 27 Apr–2 May 2025, EGU25-13144, https://doi.org/10.5194/egusphere-egu25-13144, 2025.

EGU25-15294 | Orals | CL1.2.1

Jet stream controls on European climate and agriculture since 1300 CE 

Guobao Xu, Ellie Broadman, Isabel Dorado-Liñán, and Valerie Trouet

The jet stream is an important dynamic driver of climate variability in the Northern Hemisphere mid-latitudes. Modern variability in the position of summer jet stream latitude in the North Atlantic-European sector (EU JSL) promotes dipole patterns in air pressure, temperature, precipitation, and drought between northwestern and southeastern Europe. EU JSL variability and its impacts on regional climatic extremes and societal events are poorly understood, particularly prior to anthropogenic warming. Based on three temperature sensitive European tree-ring records, we develop a reconstruction of interannual summer EU JSL variability over 1300-2004 CE (R2 = 38.5%) and compare it to independent historical documented climatic and societal records, such as grape harvest, grain prices, plagues, and human mortality. Here, we show contrasting summer climate extremes associated with EU JSL variability back to 1300 CE, as well as biophysical, economic, and human demographic impacts, including wildfires and epidemics. In light of projections for altered jet stream behavior and intensified climate extremes, our findings underscore the importance of considering EU JSL variability when evaluating amplified future climate risk.

How to cite: Xu, G., Broadman, E., Dorado-Liñán, I., and Trouet, V.: Jet stream controls on European climate and agriculture since 1300 CE, EGU General Assembly 2025, Vienna, Austria, 27 Apr–2 May 2025, EGU25-15294, https://doi.org/10.5194/egusphere-egu25-15294, 2025.

EGU25-15521 | ECS | Posters on site | CL1.2.1

Examining Forest Structure and Growth Dynamics Using Dendrochronology 

Ching-Chu Tsai, Yu-Fang Wang, and Su-Ting Cheng

Extreme climate events pose a potential threat to the forest structure stability, triggering tree growth release (GR) and possible shifts in tree social status. This study used a dendrochronological approach to investigate changes in tree competition in a 100-year-old Japanese cedar (Cryptomeria japonica) plantation at the JinGangZuan site, managed by the Experimental Forest of National Taiwan University. Tree-ring data was used to reconstruct historical GR events and explored the relationship between GR and the maximum wind speed. In addition, we evaluated tree social status shifts by comparing each sample tree’s diameter at breast height (DBH) with the stand’s quadratic mean DBH from forest inventory data.

Our findings identified a major GR event around 1970 and revealed a significant positive correlation (r = 0.73, P = 0.01) between GR and maximum wind speed. Most high wind events occurred during typhoon periods. Despite these disturbances, the overall social structure remained largely unchanged among the 113 sampled trees, suggesting that GR does not necessarily drive significant status shifts. Specifically, 79.6% of trees retained their original social status (“big trees remain big and small trees remain small”), while 20.4% exhibited some degree of status change. Most codominant-to-dominant status changes occurred in early growth stages, while status change in later stages appear to be randomly distributed. We suspected disturbances tend to remove weaker trees, complicating direct comparisons among individuals.

Notably, typhoon strength has increased over the past four decades and is expected to intensify further under global warming. Although this study suggests minimal impacts of disturbances on forest structure at the JinGangZuan site, proactive adaptation measures are advisable. Tree-ring analysis offers valuable insights into stand development following extreme events, providing critical guidance for refining forest management strategies in an era of changing environmental conditions.

How to cite: Tsai, C.-C., Wang, Y.-F., and Cheng, S.-T.: Examining Forest Structure and Growth Dynamics Using Dendrochronology, EGU General Assembly 2025, Vienna, Austria, 27 Apr–2 May 2025, EGU25-15521, https://doi.org/10.5194/egusphere-egu25-15521, 2025.

EGU25-15925 | Orals | CL1.2.1

Species Differences in δ13C and δ18O in Arctic Shrubs: Evidence from a Snow Fence Experiment 

Candice Power, Katja Rinne-Garmston, Bo Elberling, Elina Sahlstedt, Urs Treier, Jeffrey M. Welker, and Signe Normand

Carbon (δ13C) and oxygen (δ18O) isotopes provide key insights into plant physiological processes, including water-use efficiency, water source utilization, and carbon assimilation. In Arctic ecosystems, changes in snow conditions may influence shrub growth, physiology, and isotopic composition by altering soil moisture, temperature, and soil nutrient conditions with carry-over effects from winter to the main growing season. We analyzed δ13C and δ18O values in two dominant Arctic shrub species, Salix glauca (gray willow) and Betula nana (dwarf birch), growing at a snow fence experiment implemented summer 2012 on Disko Island, Greenland. Using novel laser ablation methods with beam sizes of 100μm and 40μm for δ18O and δ13C, respectively, we analyzed growth rings from 20 individuals per species, covering the period 2007-2017. In total, we obtained 255 δ18O measurements (122 for S. glauca and 133 for B. nana) and 352 δ13C measurements (175 for S. glauca and 177 for B. nana). We obtained annual resolution measurements of δ18O for 162 rings and of δ13C for 320 rings, despite narrow rings averaging ~93μm (~85μm for S. glauca and ~100μm for B. nana). Our preliminary results indicate that increased snow depth due to the snow fence did not significantly alter the carbon or oxygen values in either species. While δ18O values were similar between the species, suggesting similar water sources regardless of snow depth, S. glauca had significantly enriched δ13C values than B. nana, indicating greater water-use efficiency, which may give it a competitive advantage during drier periods. These findings suggest that species-specific physiological traits, rather than snow depth changes, may be the primary drivers of isotopic differences in Arctic shrubs, with implications for shrub expansion and Arctic carbon and water cycles.   

How to cite: Power, C., Rinne-Garmston, K., Elberling, B., Sahlstedt, E., Treier, U., Welker, J. M., and Normand, S.: Species Differences in δ13C and δ18O in Arctic Shrubs: Evidence from a Snow Fence Experiment, EGU General Assembly 2025, Vienna, Austria, 27 Apr–2 May 2025, EGU25-15925, https://doi.org/10.5194/egusphere-egu25-15925, 2025.

For many non-commercial but abundant tree species, detailed knowledge about their seasonal timing of wood formation is lacking. Radius dendrometers are a way of detailly assessing stem diameter variations, that contain both information on tree water status as well as irreversible growth. Recently, low-cost sensors allow to expand the number of replicates and species to assess in detail the seasonal growth of trees. Here we present preliminary results on a dendrometer network (400+ dendrometers) in Belgium (12 species) and in Central-Africa (59 species), and we discuss future avenues for research. Especially the link with dendro-anatomy will be made, and will be specifically challenging for tropical species. Knowing the seasonal window of tree growth allows us to interpret dendroclimatic analysis in temperate regions, and allows us to explore seasonal tropical tree growth, which holds many uncertainties and where rings are not always periodical and visible.

How to cite: De Mil, T.: Deploying a radius dendrometer network to reveal the seasonal growth of trees, EGU General Assembly 2025, Vienna, Austria, 27 Apr–2 May 2025, EGU25-19941, https://doi.org/10.5194/egusphere-egu25-19941, 2025.

EGU25-20027 | Posters on site | CL1.2.1

Multi-proxy tree ring analysis to improve the dating around the Older Dryas  

Simona Staub, Lukas Wacker, Edouard Bard, Patrick Fonti, Frédéric Guibal, Christian Marschal, Cécile Miramont, Daniel Nievergelt, Frederick Reinig, Andreas Rigling, Frauke Rostek, Matthias Saurer, Anne Verstege, and Kerstin Treydte

The longest absolute tree-ring chronology is extended by the Swiss Late Glacial chronology back to about 14 000 BP (years before 1950) with an uncertainty of only 8 years (2-sig, Reinig 2020). Recently published chronologies from Southern France (Bard et al. 2023) extend the Swiss chronologies throughout the Older Dryas further back to 14 350 BP. However, an accurate placement of the mid-resolution (1yr ever 3yr) French radiocarbon chronologies is so far not available and purely base on low-resolution Swiss radiocarbon measurements.

By performing stable isotope (δ18O and δ13C) measurements on French and Swiss trees and additional annual-resolution radiocarbon measurements, we will present a new accurate dating of the French chronologies. We suggest a link between Switzerland and France based on stable isotope signatures, that agrees with the new high-resolution radiocarbon measurement. The evidence of the new placement based on the new multi-proxy approach will be given.


Bard, E. et al. A radiocarbon spike at 14 300 cal yr BP in subfossil trees provides the impulse response function of the global carbon cycle during the Late Glacial. Philosophical Transactions of the Royal Society A: Mathematical, Physical and Engineering Sciences 381 (2023). https://doi.org/10.1098/rsta.2022.0206

Reinig, F. et al. Illuminating Intcal during the Younger Dryas. Radiocarbon 62, 883-889 (2020). https://doi.org/10.1017/Rdc.2020.15

How to cite: Staub, S., Wacker, L., Bard, E., Fonti, P., Guibal, F., Marschal, C., Miramont, C., Nievergelt, D., Reinig, F., Rigling, A., Rostek, F., Saurer, M., Verstege, A., and Treydte, K.: Multi-proxy tree ring analysis to improve the dating around the Older Dryas , EGU General Assembly 2025, Vienna, Austria, 27 Apr–2 May 2025, EGU25-20027, https://doi.org/10.5194/egusphere-egu25-20027, 2025.

EGU25-1403 | ECS | Posters on site | CL1.2.2

A 2000 year record of hydroclimate variability inferred from oxygen isotopes in lake sediments on Kangaroo Island, South Australia  

Mahfuzur Rahman, Lucinda Duxbury, Haidee Cadd, Robert Klaebe, Geraldine Jacobsen, John Tibby, and Jonathan Tyler

High resolution records of past hydroclimate are crucial for understanding the recurrence of extreme climatic events (prolonged droughts and deluges) and for robust decision making around environmental and economic sustainability. The current study presents a ~sub-decadal-scale hydroclimate reconstruction based on oxygen isotope analysis of lake sediment ostracod shells, extracted from the sediments of Lashmars Lagoon, Kangaroo Island, South Australia. Spanning the last ~2000 years, the oxygen isotope record records a series of multi-decadal wet and dry periods, manifest in the relative precipitation-evaporation balance of the lake. Of note, the record implies periods of prolonged declines in water balance, tentatively interpreted as droughts, during the periods 525-575 CE, 770-790 CE, 825-850 CE, and 980-1020 CE. By contrast, the periods from ~150-450 CE and 600-750 CE were relatively wet. Unfortunately, ostracods were absent within the sediments deposited between 1250-1590 CE, possibly due to a reduction in lake water or sediment pH following a notable increase in charcoal deposition. The period from ~1590-1800 CE appears to have been notably dry, prior to an increase in effective moisture during the last 200 years. The Lashmars Lagoon record exhibits similar trends to a record from Blue Lake, Mt. Gambier, approx. 500 km to the southeast. However, these records contrast with other hydroclimate records from further east, implying a complex relationship with regional climate drivers. Comparison with instrumental period rainfall data, and reconstructed indices for major ocean–atmosphere interactions suggests that periods of increased moisture balance on Kangaroo Island were influenced by a combination of Southern Ocean and Indian Ocean derived climate influences.

How to cite: Rahman, M., Duxbury, L., Cadd, H., Klaebe, R., Jacobsen, G., Tibby, J., and Tyler, J.: A 2000 year record of hydroclimate variability inferred from oxygen isotopes in lake sediments on Kangaroo Island, South Australia , EGU General Assembly 2025, Vienna, Austria, 27 Apr–2 May 2025, EGU25-1403, https://doi.org/10.5194/egusphere-egu25-1403, 2025.

EGU25-2052 | Orals | CL1.2.2

Reconstructions of climate during last two millennium based on data assimilation using multiple types of proxy records 

Liang Ning, Zhengyu Liu, Jian Liu, Fen Wu, Wenqing Hu, Fangmiao Xing, Kefan Chen, Yanmin Qin, Mi Yan, Chuanxi Xu, Weiyi Sun, and Qin Wen

We use the Hybrid Gain Analog Offline EnKF (HGAOEnKF) with multiple types of proxy records, to reconstruct the temperature, precipitation, and large-scale climate variability during the last two millennia. First, a new reanalysis product (NNU-2ka Reanalysis) is generated through the HGAOEnKF with the expanded proxy database. A comparison with observed SST variability shows that our assimilated tropical SST variability performs reasonably well for the seasonal cycle and monthly ENSO characteristics, notably the phase-locking and onset timing, and more realistic spatial fields relative to the model simulations. Sensitivity experiments show that the proxy records from the ocean contribute more to the temperature reconstruction skill with both assimilation methods. We then further reconstruct the Pacific decadal variability (PDV) and Atlantic meridional overturning circulation (AMOC) using the marine oxygen isotope records.

How to cite: Ning, L., Liu, Z., Liu, J., Wu, F., Hu, W., Xing, F., Chen, K., Qin, Y., Yan, M., Xu, C., Sun, W., and Wen, Q.: Reconstructions of climate during last two millennium based on data assimilation using multiple types of proxy records, EGU General Assembly 2025, Vienna, Austria, 27 Apr–2 May 2025, EGU25-2052, https://doi.org/10.5194/egusphere-egu25-2052, 2025.

EGU25-2591 | ECS | Orals | CL1.2.2 | Highlight

A shift in South Pacific hydroclimate over the last 1500 years driven by tropical Pacific variability 

Daniel Skinner, Mark Peaple, Gordon Inglis, Manoj Joshi, Peter Langdon, Adrian Matthews, Timothy Osborn, Jean-Yves Meyer, and David Sear

The South Pacific Convergence Zone (SPCZ) is a critical region of intense precipitation, particularly during the austral summer (November—March), situated in the tropical Pacific Ocean. This region is known to be highly sensitive to variations in sea surface temperatures (SSTs) across the Pacific. Previous research has demonstrated that decadal-scale shifts in the SPCZ are influenced by SST variability, but our understanding of longer-term changes—spanning multi-decadal to millennial timescales—remains limited. These constraints arise from the scarcity of high-resolution hydroclimate proxy records and systemic biases in even state-of-the-art coupled climate models.

To address this knowledge gap, we combine newly developed hydroclimate proxies (from Nuku Hiva and Tahiti, French Polynesia) with previously established proxies and novel climate model simulations to explore SPCZ dynamics over the last 1500 years. Our findings provide new insights into centennial- and millennial-scale precipitation variability and its potential drivers.

Our proxy data indicate a spatial shift in SPCZ precipitation patterns from 1000 yrs BP to 200 yrs BP. During this interval, the eastern SPCZ experienced a significant increase in precipitation, whilst the western SPCZ underwent notable drying. This north-eastward shift in precipitation was likely driven by changes in Pacific SST gradients, as shown by our climate model simulations and proxy SST reconstructions. Our modelling results show that a previously hypothesised weakening of the tropical Pacific zonal SST gradient is consistent with our new proxy reconstructions and offer a plausible mechanism for the observed hydroclimatic shifts.

An intriguing corollary of our study is the coincidence of this millennial-scale hydroclimatic changes with key events in human history. The eastward shift in SPCZ precipitation overlaps temporally with the Polynesian colonization of the eastern SPCZ region, including islands such as the Marquesas, and eventually Hawaii. This suggests a potential linkage between climate-driven changes in the SPCZ and patterns of human migration and settlement. Enhanced precipitation in the eastern SPCZ would have likely improved freshwater availability, agricultural potential, and overall habitability of these islands, potentially facilitating successful colonization. Conversely, drier conditions in the western SPCZ may have influenced resource pressures, encouraging exploration and eastward movement.

Ultimately, these findings emphasize the need for continued development of high-resolution proxies and improvements in coupled climate models to deepen our understanding of long-term Pacific region climate dynamics and their societal impacts.

How to cite: Skinner, D., Peaple, M., Inglis, G., Joshi, M., Langdon, P., Matthews, A., Osborn, T., Meyer, J.-Y., and Sear, D.: A shift in South Pacific hydroclimate over the last 1500 years driven by tropical Pacific variability, EGU General Assembly 2025, Vienna, Austria, 27 Apr–2 May 2025, EGU25-2591, https://doi.org/10.5194/egusphere-egu25-2591, 2025.

The Late Bronze Age (LBA) collapse (1350–1050 BCE) marked a period of profound societal upheaval across the ancient Mediterranean, including the decline of Mycenaean civilization in the Peloponnese. While traditionally attributed to invasions by the "Sea Peoples," emerging paleo-climate evidence suggests that severe and prolonged droughts played a significant role in this collapse. A key methodology for exploring unknown past climate conditions is the use of Holocene transient simulations. This study evaluates the extent to which three Holocene transient climate simulations (MPI-ESM, TraCE-21ka, and EC-Earth3 8K) capture the prolonged arid conditions observed in regional proxies during the LBA collapse. The EcEarth and MPI models agree with lake and marine sediment, stalagmite and tree ring proxy data from across the wider region, revealing a prolonged drying trend for the Balkan area from 4800 until 1000 BCE. Focusing in on the Peloponnese region, EcEarth and MPI models agree well with the Mavri Trypa Cave δ18O record, indicating an unstable climate with extended drought periods from 1600 until 1100 BCE and recording abrupt dry pulses following 1250 BCE. The TraCE simulation, however, exhibits relatively stable behaviour, showing no marked shifts toward either wet or dry extremes during the entire period. We establish that due to differences in resolution and model parametrization, MPI and EC-Earth provide a more realistic simulation of the dynamic and variable climate conditions during the Holocene period in the Aegean region, particularly with respect to capturing prolonged droughts and abrupt climatic shifts, while TraCE seems to oversimplify these variations. From the EcEarth model, we establish that droughts in the Peloponnese and Balkan region, in the period prior to and during the LBA collapse, were a result of cooling Mediterranean sea surface temperatures, that reduced moisture into the regions hydrological cycle, supporting proxy evidence. This cooling was ultimately driven by a weakening AMOC.  By drawing parallels between the LBA collapse and contemporary climate challenges, the study underscores the importance of understanding how current and future climate variability could lead to similar societal disruptions, urging policymakers to incorporate historical insights into modern climate mitigation strategies.

How to cite: Power, K. and Zhang, Q.: Climate variability and the Late Bronze Age collapse in the Peloponnese: Insights from Holocene transient simulations, EGU General Assembly 2025, Vienna, Austria, 27 Apr–2 May 2025, EGU25-3593, https://doi.org/10.5194/egusphere-egu25-3593, 2025.

EGU25-4888 | Posters on site | CL1.2.2

Paleoclimate Data Assimilation of Monsoon Precipitation in China Over the Past 500 Years 

Feng Shi, Zhiqiang Lyu, and Zhengtang Guo

Monsoon precipitation in China influences the livelihoods of approximately two-thirds of its population, making an understanding of its regional patterns and long-term variability essential for improving future precipitation forecasts. However, the relatively short span of instrumental records and the limited skill of climate models in simulating precipitation hinder our ability to uncover the driving mechanisms behind historical monsoon precipitation changes. To address these gaps, this study integrates multiproxy precipitation reconstructions with climate model simulations to assimilate China precipitation fields over the past 500 years. Our analysis highlights robust assimilation results in North and Southwest China, suggesting a potential teleconnection influenced by the South Asian summer monsoon. Similarly, assimilation in East China successfully captures Meiyu rainfall variations closely associated with the East Asian summer monsoon. Furthermore, our analyses indicate that precipitation in North, Southwest, and East China exhibits strong responses to interannual-scale El Niño-Southern Oscillation (ENSO) variability and decadal-scale Pacific Decadal Oscillation (PDO) fluctuations. These findings not only deepen our understanding of the mechanisms underlying China’s monsoon precipitation evolution but also provide a valuable scientific basis for refining future projections of monsoon climate in China.

How to cite: Shi, F., Lyu, Z., and Guo, Z.: Paleoclimate Data Assimilation of Monsoon Precipitation in China Over the Past 500 Years, EGU General Assembly 2025, Vienna, Austria, 27 Apr–2 May 2025, EGU25-4888, https://doi.org/10.5194/egusphere-egu25-4888, 2025.

EGU25-6761 | Posters on site | CL1.2.2

Early-twentieth-century cold bias in ocean surface temperature observations 

Sebastian Sippel, Elizabeth Kent, Nicolai Meinshausen, Duo Chan, Christopher Kadow, Raphael Neukom, Erich Fischer, Vincent Humphrey, Robert Rohde, Iris de Vries, and Reto Knutti

The observed temperature record, which combines sea surface temperatures with near-surface air temperatures over land, is crucial for understanding climate variability and change. However, early records of global mean surface temperature are uncertain owing to changes in measurement technology and practice, partial documentation, and incomplete spatial coverage. Here we show that existing estimates of ocean temperatures in the early twentieth century (1900–1930) are too cold, based on independent statistical reconstructions of the global mean surface temperature from either ocean or land data. The ocean-based reconstruction is on average about 0.26 °C colder than the land-based one, despite very high agreement in all other periods. The ocean cold anomaly is unforced, and internal variability in climate models cannot explain the observed land–ocean discrepancy. Several lines of evidence based on attribution, timescale analysis, coastal grid cells and palaeoclimate data support the argument of a substantial cold bias in the observed global sea- surface-temperature record in the early twentieth century. Although estimates of global warming since the mid-nineteenth century are not affected, correcting the ocean cold bias would result in a more modest early-twentieth-century warming trend, a lower estimate of decadal-scale variability inferred from the instrumental record, and better agreement between simulated and observed warming than existing datasets suggest.
We will present the associated published paper1 with a focus on the implications for the interpretation of the global mean surface temperature record in observations and models, including new developments and comparison with ancillary data.

1The associated paper is published as Sippel, S., Kent, E.C., Meinshausen, N., Chan, D., Kadow, C., Neukom, R., Fischer, E.M., Humphrey, V., Rohde, R., de Vries, I. and Knutti, R., 2024. Early-twentieth-century cold bias in ocean surface temperature observations. Nature, 635(8039), pp.618-624. https://doi.org/10.1038/s41586-024-08230-1.


How to cite: Sippel, S., Kent, E., Meinshausen, N., Chan, D., Kadow, C., Neukom, R., Fischer, E., Humphrey, V., Rohde, R., de Vries, I., and Knutti, R.: Early-twentieth-century cold bias in ocean surface temperature observations, EGU General Assembly 2025, Vienna, Austria, 27 Apr–2 May 2025, EGU25-6761, https://doi.org/10.5194/egusphere-egu25-6761, 2025.

EGU25-6842 | Posters on site | CL1.2.2

The grand Maunder Minimum and changing patterns of South and East Asian summer monsoons 

Kuan-Hui Elaine Lin, Wan-Ling Tseng, Jen-Ing Lee, Cheng-Wei Lin, Huang-Hsiung Hsu, and Pao K Wang

The East Asian summer monsoon (EASM) is a distinctive component of the Asian climate system, strongly influenced by orographic forcing. Unlike Indian summer monsoon which occurs within South Asian summer monsoon (SASM) trough and presents a relative uniformity of rainfall distribution allowing for an All Indian Rainfall index to measure its variability, the definition of the EASM intensity is more complex. One of the main reasons is the vast spatial extent of the EASM encompassing tropics, subtropics and midlatitudes, making it difficult to attribute its variability. Despite the challenges, studying the evolution of the South and East Asian monsoon systems over centennial to millennial timescales is essential for developing a comprehensive understanding of both high- and low-frequency variations in monsoon behavior and their relationship with general atmospheric circulations. Many previous studies used geochemical proxy records from oceanic sediments or continental archives to reconstruct paleomonsoon indices. However, most reconstructions relied on rainfall information extracted from individual sites, facing limited spatial coverage and constrained ability to generalize findings across broader monsoon systems.

In this study, we present a novel approach to reconstruct paleo SASM and EASM indices. First, we applied the present method for estimating SASM and EASM indices (Wang et al. 2008) to calculate wind fields (zonal and meridional winds at 850hPA) from 1950 to 2020 using ERA5 data and rainfall data from NOAA Precipitation Reconstruction over Land. This approach was used to construct modern indices and investigate the relationships between rainfall and circulation anomalies. Next, the rainfall pattern was projected onto the gridded 1o x 1o resolution REACHES (Reconstructing East Asian Climate Historical Encoded Series) (Wang et al., 20018) precipitation index data in 1368-1911CE so that a reconstructed SASM and EASM index can be derived incorporating both temporal and spatial variability. The reconstructed indices were then compared with other indices for justification. Importantly, the reconstructed monsoon indices reveal multidecadal and centennial variabilities during the Little Ice Age. A significant phase transition from SASM dominance shifting to EASM occurred during the Maunder Minimum, coinciding with significant behavior changes of typhoons and other extreme events in East Asia.

How to cite: Lin, K.-H. E., Tseng, W.-L., Lee, J.-I., Lin, C.-W., Hsu, H.-H., and Wang, P. K.: The grand Maunder Minimum and changing patterns of South and East Asian summer monsoons, EGU General Assembly 2025, Vienna, Austria, 27 Apr–2 May 2025, EGU25-6842, https://doi.org/10.5194/egusphere-egu25-6842, 2025.

EGU25-7260 | ECS | Posters on site | CL1.2.2

A long-term drought reconstruction based on oxygen isotope tree ring data for central and eastern parts of Europe (Romania) 

Viorica Nagavciuc, Gerhard Helle, Maria Rădoane, Cătălin-Constantin Roibu, Mihai-Gabriel Cotos, and Monica Ionita

This study investigates the relationship between oxygen isotope ratios (δ¹⁸O) in oak tree ring cellulose and past drought variability in Letea Forest, Romania. A δ¹⁸O site chronology spanning 1803-2020 was compiled from seven individual time series. δ¹⁸O values exhibited a significant negative correlation with moisture-related variables (cloud cover, relative humidity, and precipitation) and a positive correlation with temperature and sunshine duration. This confirms that δ¹⁸O from tree rings can be a good proxy for moisture availability. The strongest correlation was found between δ¹⁸O and the August Standardized Precipitation Evapotranspiration Index for an accumulation period of 9-months (SPEI9) for central and eastern Europe. This highlights SPEI9 as a superior indicator of drought compared to individual parameters like temperature or precipitation. Using a linear regression model, we reconstructed August SPEI9 variability for the past 200 years. The reconstruction captured interannual and decadal variations, with distinct wet and dry periods. Analysis of large-scale atmospheric circulation patterns revealed a link between high δ¹⁸O values (indicating dry conditions) and a high-pressure system over the North Atlantic. Conversely, low δ¹⁸O values (indicating wet conditions) corresponded to negative pressure anomalies over Europe. Moreover, extreme values of δ¹⁸O are also associated with the prevalence of a hemispheric teleconnection pattern, namely wave number 4. This δ¹⁸O chronology and the corresponding August SPEI9 reconstruction offer valuable tools for understanding past climate variability and its relationship with large-scale atmospheric and oceanic circulation patterns.

How to cite: Nagavciuc, V., Helle, G., Rădoane, M., Roibu, C.-C., Cotos, M.-G., and Ionita, M.: A long-term drought reconstruction based on oxygen isotope tree ring data for central and eastern parts of Europe (Romania), Biogeosciences, 22, 55–69, https://doi.org/10.5194/bg-22-55-2025, 2025

Nagavciuc, V., Helle, G., Rădoane, M., Roibu, C.-C., Cotos, M.-G., and Ionita, M.: A long-term drought reconstruction (August SPEI9) based on oxygen isotope tree ring data for central and eastern parts of Europe (Romania), Zenodo [data set], https://doi.org/10.5281/zenodo.14536886, 2024.

How to cite: Nagavciuc, V., Helle, G., Rădoane, M., Roibu, C.-C., Cotos, M.-G., and Ionita, M.: A long-term drought reconstruction based on oxygen isotope tree ring data for central and eastern parts of Europe (Romania), EGU General Assembly 2025, Vienna, Austria, 27 Apr–2 May 2025, EGU25-7260, https://doi.org/10.5194/egusphere-egu25-7260, 2025.

EGU25-7483 | Posters on site | CL1.2.2

Grain Size Analysis Reveals Late Holocene Climate Variability from the Halk El Menjel Lagoon (Central Mediterranean) 

Najoua Gharsalli, Hamdi Omar, Rana Baydoun, and Chokri Yaich

Examining Late Holocene climate variability is crucial for understanding past environmental changes and predicting future patterns, especially in the Mediterranean, a region sensitive to climate shifts. Positioned between temperate and arid zones, the Mediterranean is vulnerable to even minor climatic fluctuations, impacting ecosystems and water systems. The Halk El Menjel lagoon in the South-Central Mediterranean is a vital paleoenvironmental archive, recording over 4000 years of climate variability through hydrological and sedimentary cycles.

Granulometric analysis is an essential tool for interpreting sediments as environmental indicators. This study focuses on grain size distribution, revealing polymodal distributions linked to specific depositional environments and transport processes, whether by water or wind. Detailed granulometric analysis of 750 sediment samples from a 150-cm core at Halk El Menjel Lagoon was conducted using Principal Component Analysis (PCA), dendrogram clustering (DC), and temporal distribution analysis. These methods help reconstruct sediment transport dynamics and investigate long-term climatic variability in this semi-arid coastal environment.

Twelve distinct grain size sub-populations (ranging from 1.2–2 µm to 1000–1350 µm) were identified, each linked to different depositional environments. PCA revealed three main sedimentary groups: aeolian (dominated by 600–1000 µm), fluvial (dominated by 250–580 µm), and hydraulic runoff (dominated by 1.2–2 µm). These groups reflect different transport processes and depositional environments, with varying levels of homogeneity. DC further refined the categorization, highlighting significant differences between aeolian and fluvial processes.

Temporal analysis, based on an age-depth model using LANDO and Bayesian Bchron scripts, revealed key climatic shifts over the 4000-year period. The analysis, visualized through various charts, showed significant changes in sediment composition linked to historical climate variability. From 3500 to 3000 BP, all twelve sub-populations coexisted, reflecting highly variable climatic conditions. During the Iron Age (IA) to Roman Classical Period (RCP), the 600–1000 µm sub-population increased, peaking during the 2.8 ka transition in the IA. This shift suggests arid conditions and growing aeolian influence.

The Roman Humid Period (RHP) exhibited alternating arid and humid phases. During arid periods, the 600–1000 µm fraction dominated, while the 250–580 µm fraction, often associated with the 2–5.2 µm fraction, prevailed in humid periods. By the RCP, the 600–1000 µm sub-population reached near-total dominance, indicating a shift toward predominant aeolian sedimentation.

In contrast, the Dark Age (DA) and Medieval Climate Anomaly (MCA) periods saw a significant increase in the 250–580 µm sub-population, exceeding 75%, indicating wetter conditions favoring fluvial sedimentation. A new component, represented by the 1.2–2 µm fraction, emerged, accounting for approximately 25% of the sediment, signaling evolving depositional environments.

The Little Ice Age (LIA) and Modern Period (MP) were dominated by the 1.2–2 µm sub-population, comprising over seven-eighths of the sediment in the MP. This reflects lagoon infilling and deposition of suspended material transported by hydrological processes.

These findings align with Mediterranean climatic events, highlighting shifts in precipitation and aeolian activity. The Halk El Menjel lagoon provides valuable insights into long-term environmental dynamics, illustrating the interplay between climate variability and sedimentary processes.

How to cite: Gharsalli, N., Omar, H., Baydoun, R., and Yaich, C.: Grain Size Analysis Reveals Late Holocene Climate Variability from the Halk El Menjel Lagoon (Central Mediterranean), EGU General Assembly 2025, Vienna, Austria, 27 Apr–2 May 2025, EGU25-7483, https://doi.org/10.5194/egusphere-egu25-7483, 2025.

EGU25-7521 | Orals | CL1.2.2

An Online Paleoclimate Data Assimilation with a Deep Learning-based Network 

Lili Lei, Haohao Sun, Zhengyu Liu, Liang Ning, and Zhe-Min Tan

An online paleoclimate data assimilation (PDA) that utilizes climate forecasts from a deep learning-based network (NET) along with assimilation of proxies to reconstruct surface air temperature, is investigated here. Trained on ensemble simulations from the Community Earth System Model-Last Millennium Ensemble, the NET that has nonlinear features gains better predictive skills compared to the linear inverse model (LIM). Thus, an alternative for online PDA is to couple the NET with the integrated hybrid ensemble Kalman filter (IHEnKF). Moreover, an analog blending strategy is proposed to increase ensemble spread and mitigate filter divergence, which blends the analog ensembles selected from climatological samples based on proxies and cycling ensembles advanced by NET. To account for the underestimated uncertainties of real proxy data, an observation error inflation method is applied, which inflates the proxy error variance based on the comparison between the estimated proxy error variance and its climatological innovation. Consistent results are obtained from the pseudoproxy experiments and the real proxy experiments. The more informative ensemble priors from the online PDA using NET enhance the reconstructions than the online PDA using LIM, and both outperform the offline PDA with randomly sampled climatological ensemble priors. The advantages of online PDA with NET over the online PDA with LIM and offline PDA become more pronounced, as the proxy data become sparser. Thus, during the early period of the Common Era with limited proxy data, the online PDA with NET can play an essential role to reconstruct the temperature.

How to cite: Lei, L., Sun, H., Liu, Z., Ning, L., and Tan, Z.-M.: An Online Paleoclimate Data Assimilation with a Deep Learning-based Network, EGU General Assembly 2025, Vienna, Austria, 27 Apr–2 May 2025, EGU25-7521, https://doi.org/10.5194/egusphere-egu25-7521, 2025.

EGU25-9136 | Posters on site | CL1.2.2

Daily variability of the Atlantic-European Jet stream over the last 300 years 

Stefan Bronnimann and Yuri Brugnara

Extreme weather events in Western and Central Europe such as cold-air outbreaks, heavy precipitation, or heat waves are strongly affected by the Atlantic-European jet stream. Hence, projected changes in the jet stream in a future climate might alter the variability of extremes. It is therefore relevant to study the past variability of the jet. A recent analysis of the Atlantic-European jet based on reconstructions since 1421 showed links with extremes but no evidence for changes in the base state. However, the monthly-to-seasonal scale precluded analysing changes in the distribution, which are relevant for extremes. In this contribution we address the daily variability of the jet stream since 1725 based on observations and compare it with climate model simulations. We use existing historical pressure series from Padova, Uppsala, London and a newly digitised and homogenised series for Berlin. The four locations are well positioned to capture the strength, tilt, and latitude of the Atlantic-European jet. The daily indices explain large fractions of temperature variability and are associated with precipitation extremes, blocks or cyclones. Extreme excursions of the jet on a 1-, 5- or 15-daily scale were associated with extreme weather. However, changes in the mean or in extremes of the jet indices are small.

How to cite: Bronnimann, S. and Brugnara, Y.: Daily variability of the Atlantic-European Jet stream over the last 300 years, EGU General Assembly 2025, Vienna, Austria, 27 Apr–2 May 2025, EGU25-9136, https://doi.org/10.5194/egusphere-egu25-9136, 2025.

EGU25-10021 | ECS | Posters on site | CL1.2.2

Greenland ice cores as proxy for European extremes 

Alessandro Gagliardi, Norel Rimbu, Gerrit Lohmann, and Monica Ionita

High-resolution ice core data from the Greenland Ice Sheet offer valuable insights into past climate variations on seasonal to multidecadal scales. One key parameter for reconstructing these variations is the concentration of stable oxygen isotopes in ice cores. We present evidence that a stacked record of stable oxygen isotope concentrations from Northern Greenland ice cores is a good proxy for the recurrence of a particular synoptic patterns in the atmospheric circulation, such as atmospheric blocking. Our evidence indicates that low oxygen isotope concentrations corroborate the reoccurrence formation of high-pressure systems over Europe. In particular, during the observational period (1920 – 2011), an increase in the frequency of atmospheric blocking events from Iberian Peninsula to Scandinavia is observed, leading to significant shifts in European hydroclimatic conditions: increased precipitation along the Norwegian coast, drier conditions and decreased temperatures in southern Europe. These findings are supported by a paleo-reanalysis product, which indicates similar patterns over a longer temporal perspective (1602 – 2003).

How to cite: Gagliardi, A., Rimbu, N., Lohmann, G., and Ionita, M.: Greenland ice cores as proxy for European extremes, EGU General Assembly 2025, Vienna, Austria, 27 Apr–2 May 2025, EGU25-10021, https://doi.org/10.5194/egusphere-egu25-10021, 2025.

EGU25-11129 | ECS | Posters on site | CL1.2.2

Reconstructing historical daily weather fields using a deep-learning variational auto-encoder 

Conall E. Ruth, Yannis Schmutz, and Stefan Brönnimann

To study historical weather extremes and their impacts, as well as the evolution of weather variability over time, gridded reconstructions of daily weather are of great importance. However, prior to the establishment of national meteorological services, starting in Europe in the second half of the 19th century, observations from which to derive such reconstructions are greatly limited. As a result, traditional spatial-interpolation approaches such as inverse-distance weighting are unreliable in this context. Numerical weather prediction models that assimilate available observations are also unfavourable, because of their high computational demand. A promising alternative is the application of deep-learning models, which have already been shown to produce reliable reconstructions with relatively little cost. Given the wide range of possible deep-learning architectures, further studies into their application for historical weather reconstruction continue to be valuable.


In this study we present a deep-learning model based on a variational auto-encoder (VAE) architecture for reconstructing fields of mean daily air temperature and mean-sea-level pressure across Europe. While the use of VAEs for weather reconstruction has previously been proposed, to our knowledge no such studies have been published in the literature. Our model is trained using ERA5 data for the domain 36N-67N, 22W-41E, aggregated to a daily, 1° resolution. During training, the model’s encoder takes the complete fields of temperature and pressure for a given day and reduces them to a simplified representation within the model’s latent space. The model’s decoder then takes this as input and attempts to recreate the original fields. Once trained, the encoder is then discarded and the latent space is instead sampled iteratively such that the decoded set of output fields best matches any available observations from a given day of interest. This output then represents the reconstruction of that day.


To evaluate performance, we apply our model to reconstruct the year 1807 using 25 historical temperature records and 18 historical pressure records. The reconstruction is then compared to a separate set of hold-out records from the same year. We also apply our model to a test period of 1950-1954 using ERA5 pseudo-observations with the same availability as above. This is then compared to the corresponding complete fields of ERA5. Additionally, we examine the performance of the model relative to the daily re-analysis dataset 20CRv3 and to an existing deep-learning model WeRec3D inspired by video inpainting.


For 1807, our model performs relatively well in reconstructing the hold-out records, achieving correlations and root-mean-squared errors similar to or better than those of WeRec3D and 20CRv3 for each variable. On the other hand, when considering the entire study domain for the period 1950-1954, our model performs notably worse than WeRec3D with a greater reconstruction error, under-represented variance and overly smooth reconstructed fields. This is especially pronounced towards the edges of the domain where observations are particularly sparse. Thus, our model is ultimately not superior to an existing alternative. Nevertheless, this study successfully demonstrates the application of a VAE for the task of historical weather reconstruction and provides a foundation for further investigation.

How to cite: Ruth, C. E., Schmutz, Y., and Brönnimann, S.: Reconstructing historical daily weather fields using a deep-learning variational auto-encoder, EGU General Assembly 2025, Vienna, Austria, 27 Apr–2 May 2025, EGU25-11129, https://doi.org/10.5194/egusphere-egu25-11129, 2025.

EGU25-11351 | Posters on site | CL1.2.2

Late Holocene climate dynamics in NW Iberian Peninsula: Exploring the Atlantic-Mediterranean interactions and paleoenvironmental impacts 

Roberto Bao, Uxía Fernández-Pérez, Rafael Carballeira, Alberto Sáez, Ricardo Prego, Luisa Santos, Pedro Raposeiro, Rouven Altrogge, and Armand Hernández

The northwestern Iberian Peninsula is a climatically complex region influenced by both Atlantic and Mediterranean systems, making it a key area for studying past climate dynamics. Mountain lake ecosystems in this region are particularly sensitive to climate variability, serving as valuable archives of sedimentary records that document paleoenvironmental responses to major climatic phases. This study aims to reconstruct Late Holocene climate variability in northwestern Iberian Peninsula, with focus on clarifying the uncertainties regarding its timing and extent of climatic changes in this region. Accordingly, mountain lakes are highly sensitive to climatic fluctuations, serving as critical archives for reconstructing past climate dynamics with high temporal resolution

Lake Ocelo, an oligotrophic mountain lake at 1517 m a.s.l. in the Pena Trevinca Massif (Galicia), lies at the interface of Eurosiberian and Mediterranean bioclimatic regions. In April 2021, a sediment core (OCE21-3GA, 131 cm) was retrieved using a UWITEC® gravity corer. Radiocarbon dating, alongside concentration profiles of 210Pb and 137Cs, established an age-depth model indicating a sequence spanning approximately 2900 years. To identify and precisely date major environmental transitions over the last millennia (ca. 3 ka), a multidisciplinary approach was used, including sedimentological (facies analysis), geochemical (XRF, TOC, TN, biogenic silica, δ13CORG, δ15NORG analyses), and biological proxies (diatoms and pollen). Statistical analyses, including Principal Component Analysis (PCA), were applied to reconstruct environmental conditions.

The age of the main changes in sediment composition roughly correlate with documented Late Holocene climate centennial periods, providing evidence of regional responses to larger-scale climatic events. However, our findings also reveal a complex dynamic interplay between Atlantic and Mediterranean climatic influences. The shift from drier to wetter conditions during the Older Subatlantic (ca. 800-200 BCE) likely reflect the end of the 2.8 ka event, characterized by dry conditions in the northern hemisphere. The aridity of the Roman Warm Period (ca. 200 BCE-300 CE) suggests the onset and a northward shift of the Mediterranean bioregion. Wetter conditions during the Dark Ages (ca. 300-750 CE) indicate a subsequent Atlantic dominance, whereas the arid Medieval Climate Anomaly (ca. 750-1100 CE) reflects intensified Mediterranean influence, with temporal offsets compared to other Iberian records. The Little Ice Age (LIA; ca. 1300-1900 CE) exhibits significant hydroclimatic variability, subdivided into alternating wet and dry sub-phases: LIA-I (ca. 1300-1500 CE), LIA-II (ca. 1500-1700 CE), and LIA-III (ca. 1700-1900 CE). Diatom data suggest extended and prolonged lake ice cover conditions during the LIA in the lake, leading to stronger denitrification and prolonged stratification periods, with a marked anoxia in the lake bottom. The transition of the Medieval Climate Anomaly to Little Ice Age (ca. 1100-1300 CE) marks a shift to wetter conditions. Finally, the Industrial Era (ca. 1850 CE–present) is defined by warming trends, increased lake productivity, reduced detrital inputs, and human-induced impacts such as elevated atmospheric nitrogen deposition.

This work is supported by Grants PID2019-107424RB-I00 and PID2022-139775OB funded by MCIN/AEI/10.13039/501100011033, with the latter also co-funded by “ERDF A way of making Europe”. Xunta de Galicia also supports this work through project ED431F 2022/18 and ED431B 2024/03

How to cite: Bao, R., Fernández-Pérez, U., Carballeira, R., Sáez, A., Prego, R., Santos, L., Raposeiro, P., Altrogge, R., and Hernández, A.: Late Holocene climate dynamics in NW Iberian Peninsula: Exploring the Atlantic-Mediterranean interactions and paleoenvironmental impacts, EGU General Assembly 2025, Vienna, Austria, 27 Apr–2 May 2025, EGU25-11351, https://doi.org/10.5194/egusphere-egu25-11351, 2025.

The number of seasonal or annual climate reconstructions targeting the last 1000-2000 years has increased significantly over the last decade, particularly climate field reconstructions (CFRs) that provide spatially explicit estimates of multiple climate state variables such as surface temperature, precipitation, or sea level pressure.  This proliferation of CFRs has been driven by multiple factors, including increasing numbers of available proxies and methodological advances.  These developments have created a moment of opportunity, long in the making, in which seasonal and annual CFRs that target the last several millennia can better inform climate dynamics, model assessments, historical conditions, and characterizations of climate risks.  But how accurate are these CFRs, how well do they agree with each other, and how dependent are they on different methodological and data choices?  The importance of these questions will be demonstrated by comparing estimates of climate responses to large tropical eruptions derived from a state-of-the-science CFR ensemble.  The results of these comparisons subsequently will be used to propose a framework for developing a climate reconstruction intercomparison project to evaluate methodological choices, data dependencies, and reconstruction agreement.  This framework will include an exploration of systematic reconstruction and data protocols, as well as skill and comparison diagnostics.

How to cite: Smerdon, J.: Reconstructions, Reconstructions Everywhere: A humble call for a Climate Reconstruction Intercomparison Project , EGU General Assembly 2025, Vienna, Austria, 27 Apr–2 May 2025, EGU25-13379, https://doi.org/10.5194/egusphere-egu25-13379, 2025.

EGU25-13679 | Posters on site | CL1.2.2

Climatic effects on grain harvest variations at parish-level in Sweden c. 1665–1810 

Fredrik Charpentier Ljungqvist and Martin Skoglund

Several studies have statistically assessed the relationship between climate variability and grain harvest variations in pre-modern Sweden. They have, however, either studied the relationship on a coarse geographical (county to national) scale (Ljungqvist et al., 2023) or for only an individual province (Skoglund 2022, 2023, 2024). Fine-scale (parish-level) studies are entirely lacking. The Swedish 17th and 18th century tithe data – i.e., a tax paid on a percentage of the harvest – for different grain types are available at  parish-level and offer excellent estimates of harvest variations from year to year. Adequate palaeoclimate data, with seasonal resolution, is also available for the region and period. This has enabled us to conduct a detailed spatio-temporal investigation of the effects of climate variability on grain harvest variations at a parish-level. We have focused on the two main grain types cultivated in pre-modern Sweden, spring-sown barley and autumn-sown rye, and used 10-year high-pass filtered data to investigate short-term effects and linearly detrended data to also capture more long-term climate–harvest relationships while minimising the effects of spurious trends.

Our results show a consistent relationship in northern, and to a lesser extent also central, Sweden between summer temperature and harvest size. Warmer summers resulted in higher yields while colder summers resulted in lower yields. This effect extended further south in Sweden for the more drought-tolerant rye than for the more drought-sensitive barley. However, for both grain types southern-most coastal Sweden showed an opposite temperature–harvest relationship than the rest of the country: here, cooler summers instead promoted larger harvests than warmer ones.

We found that wetter summer conditions (higher soil moisture) mainly had a positive effect on the harvests in east-central and southern Sweden. The hydroclimatic effect on the harvests was found to be largest when considering only inter-annual variability (i.e., using high-pass filtered data), whereas the temperature-effect is more prominent when also considering relationships over longer time-scales (i.e., using linearly detrended data). Finally, we investigate the influence of soil texture and manure availability for the detected geographical climate–harvest relationship. We conclude that the climate–harvest relationships in southern-most and northern Sweden c. 1665–1810 were rather similar to those of modern times. Due to sensitivity to drought, harvests in the former region were, and still are, favoured by cooler summers, while warmer summers in the north increased, and still increase, the harvests. However, the positive effect of warmer summers in south-central Sweden was found to be much stronger c. 1665–1810 than in modern times, when larger harvests in the region rather follow cooler summers.

References

Ljungqvist, F. C., et al.: Climatic signatures in early modern European grain harvest yields, Climate of the Past, 19, 2463–2491, 2023.

Skoglund, M. K.: Climate variability and grain production in Scania, 1702–1911, Climate of the Past, 18, 405–433, 2022.

Skoglund, M. K.: Farming at the margin: climatic impacts on harvest yields and agricultural practices in central Scandinavia, c. 1560–1920, Agricultural History Review, 71, 203–233, 2023.

Skoglund, M. K.: The impact of drought on northern European pre-industrial agriculture, The Holocene, 34, 120–135, 2024.

How to cite: Charpentier Ljungqvist, F. and Skoglund, M.: Climatic effects on grain harvest variations at parish-level in Sweden c. 1665–1810, EGU General Assembly 2025, Vienna, Austria, 27 Apr–2 May 2025, EGU25-13679, https://doi.org/10.5194/egusphere-egu25-13679, 2025.

Understanding the effects of past climate change on human societies and their adaptations is vital for both historical studies and modern resilience strategies. Our previous study examined the impacts of seasonal solar radiation variations, reconstructed from diary weather records across 18 locations in Japan, on rice prices and migration during the Tenpō famine (1833–1839). We found that severe weather, as reflected in these solar radiation estimates, led to high rice prices in Osaka. Consequently, higher temporal resolution data, compared to annual or limited-season data, can be more effective for studying the impacts of climate change on society.

This study further explores how climate change affects food and economics and how stresses such as famine and grain price fluctuations impact migration, using historical weather descriptions, rice prices, and migration data. The migration data were calculated based on individual-level panel data from local population registers of four communities (current Fukushima prefecture) from 1708 to 1870. The rice price series in the local market of Aizu in the same prefecture was used to measure the annual fluctuations in local agricultural output. The monthly solar radiation was reconstructed from historical weather descriptions for three locations in the target area of Moriyama, one to the north (Yamagata), and two to the south (Nikko). A comparison of the migration data with the reconstructed monthly solar radiation indicated that after the summer solar radiation decreased significantly, the number of migrations, abscondences, and deaths increased, particularly during the Tenmei (1782-1788) and Tenpo famines.

How to cite: Ichino, M., Kurosu, S., and Masuda, K.: Climate Change and Severe Famines: Exploring the Relationship between Solar Radiation and the Dynamics of Historical Migration, EGU General Assembly 2025, Vienna, Austria, 27 Apr–2 May 2025, EGU25-14714, https://doi.org/10.5194/egusphere-egu25-14714, 2025.

EGU25-15324 | ECS | Posters on site | CL1.2.2

Shallow Ice Borehole Thermometry: Bayesian inversion techniques for reconstructing the Antarctic temperature evolution of the last centuries 

Kshema Shaju, Thomas Laepple, Nora Hirsch, and Peter Zaspel

Reconstructing paleo-climate information using subsurface temperature data from ice borehole thermometry has proven to be a promising approach in climate reconstruction. Using Bayesian inversion, we aim to reconstruct the temperature evolution of Antarctica over the last centuries. A forward heat transfer model is implemented that simulates borehole temperature profiles for time-dependent surface temperatures. We invert this forward model using Bayesian inference by modeling known uncertainties as priors and obtain the reconstructed surface temperatures with associated uncertainty information. Through synthetic examples, we highlight the extent to which signals can be retrieved from a 200-meter borehole along with its uncertainty information. We further apply this to measured data for surface temperature reconstruction from EPICA Dronning Maud Land and analyze the results.

How to cite: Shaju, K., Laepple, T., Hirsch, N., and Zaspel, P.: Shallow Ice Borehole Thermometry: Bayesian inversion techniques for reconstructing the Antarctic temperature evolution of the last centuries, EGU General Assembly 2025, Vienna, Austria, 27 Apr–2 May 2025, EGU25-15324, https://doi.org/10.5194/egusphere-egu25-15324, 2025.

EGU25-15801 | ECS | Orals | CL1.2.2

Multi-proxy speleothem record from continental Croatia as an archive of Late Holocene palaeoclimate variability 

Iva Palatinuš, Petra Bajo, Vlatko Brčić, Maja Briški, Hai Cheng, Russell Neil Drysdale, John Hellstrom, Philip Hopley, Christoph Spötl, Maša Surić, Pauline Treble, Hubert Vonhof, and Jia Xue

The Late Holocene is characterized by several short-term climate anomalies recorded widely in various natural climate archives. However, the lack of consensus on their temporal and spatial occurrence (Neukom et al., 2019) highlights the need for high-resolution archive data as they may provide information on the magnitude and timing of these events, helping to address the gaps in our understanding of the climate over the past two millennia. Given the scarcity of high-resolution palaeoclimate records in South Central Europe, we aim to reconstruct the climate conditions over the past  ~1500 years by using multi-proxy records of a speleothem from the Nova Grgosova Cave in Croatia.

A floating lamina-based chronology was acquired and supported by 15 U-Th dates to construct an age-depth model of the NG-2 stalagmite. The model reveals several distinct growth phases. The slowest growth rate ( ̴ 0.01 mm/yr) was observed during the period corresponding to the Little Ice Age from ca. 1625 to 1830 CE and partially overlapping the Medieval Climate Anomaly, from ca. 710 to 1060 CE. In comparison, the stalagmite grew ten times faster from ca. 1060 to 1625 CE and ca. 535 to 710 CE, while the fastest growth rate was observed during the last ca. 185 years ( ̴ 0.2 mm/yr).

Cave monitoring observations revealed that speleothem growth is enhanced during the cooler part of the year due to increased infiltration and dripwater degassing in a CO2-depleted cave atmosphere (Bajo et al., 2024). Accordingly, the speleothem geochemical properties most likely reflect the cooler part of the year. The stable isotope data coupled with trace element records suggest that the condensed growth phases reflect drier and/or cooler environmental conditions. Alongside, petrographical analysis revealed alterations of crystal fabrics, which are presumably a result of seasonal changes in hydrological conditions and/or geochemical properties of the dripwater. Thin sections exhibit large columnar crystals, however, to construct a stratigraphic log, the columnar fabric was further subdivided into columnar compact, columnar open, columnar elongated, micrite and microsparite fabrics. The latter two suggest microbial activity and diagenetic origin (Frisia, 2015), which is yet to be discussed.

These findings, combined with other palaeoclimate records from South Central Europe and beyond, provide a better understanding of the spatial extent and duration of the regional climate conditions over the past two millennia.


References:

Bajo, P., Briški, M., Benutić, A., Piplica, A., Brčić, V., Marciuš, B., Palatinuš, I., Stroj, A. (2024): Seasonality in cave dripwater and air properties – implications for speleothem palaeoclimatology, Nova Grgosova Cave (Croatia). Geologia Croatica, 77(3), 243–251.

Frisia, S. (2015): Microstratigraphic logging of calcite fabrics in speleothems as tool for palaeoclimate studies. International Journal of Speleology, 44(1), 1–16.

Neukom, R., Steiger, N., Gómez-Navarro, J.J., Wang, J., Werner, J.P. (2019): No evidence for globally coherent warm and cold periods over the preindustrial Common Era. Nature, 571, 550–554.

How to cite: Palatinuš, I., Bajo, P., Brčić, V., Briški, M., Cheng, H., Drysdale, R. N., Hellstrom, J., Hopley, P., Spötl, C., Surić, M., Treble, P., Vonhof, H., and Xue, J.: Multi-proxy speleothem record from continental Croatia as an archive of Late Holocene palaeoclimate variability, EGU General Assembly 2025, Vienna, Austria, 27 Apr–2 May 2025, EGU25-15801, https://doi.org/10.5194/egusphere-egu25-15801, 2025.

EGU25-15882 | ECS | Posters on site | CL1.2.2

Investigation of historical low-temperature events in the warm season in China based on documentary data 

Siyu Chen and Stefan Brönnimann

Low-temperature events, as an important and disastrous weather process, can cause severe damage to agriculture, transportation, and economic systems. However, low-temperature events occurring during the warm season have received less attention from climatologists compared to the harsh winters, with the exception of the well-known cold summer of the post-Tambora period during 1815-1817, which resulted in terrible famines in southwest China. Documentary data have been widely used to study past climate. Aside from abnormal phenomena like snow, frost, and ice, past low-temperature events occurring in late summer and early autumn, which are key periods of rice growth, also attracted people's attention and have been documented. Through the excavation of the original literature, the presented study reconstructed a chronology of low-temperature events in the warm season over the past hundreds of years and analyzed their temporal-spatial characteristics. We also detected low-temperature events in the past decades in southwest China and discussed the corresponding circulation pattern and potential forcing using the instrumental, reanalysis (ERA5), and paleo-simulation (ModE-Sim) datasets. Volcanic eruptions are one of the most important forcings, and Superposed Epoch Analysis (SEA) results show lower temperatures in the years following eruptions in the North Hemisphere and tropical regions. The large-scale circulation anomaly composition presents as the East-Atlantic (EA) pattern. The impact of Pacific sea surface temperature (SST) is also present in both reanalysis and simulations, which could force an EA pattern by inducing a Rossby wave train. In further work, we will make a comparison between low-temperature events in China and Europe, which are both potentially influenced by the EA pattern and volcanic eruptions.

How to cite: Chen, S. and Brönnimann, S.: Investigation of historical low-temperature events in the warm season in China based on documentary data, EGU General Assembly 2025, Vienna, Austria, 27 Apr–2 May 2025, EGU25-15882, https://doi.org/10.5194/egusphere-egu25-15882, 2025.

EGU25-16236 | ECS | Orals | CL1.2.2

CoolinG oveR thE VicToria LAnd (GRETA): resolving the Ross Sea response to continental climate change during the last two millennia 

Fiorenza Torricella, Francesca Battaglia, Simon Belt, Lucilla Capotondi, Florence Colleoni, Ester Colizza, Leonardo Langone, Patrizia Giordano, Gesine Mollenhauer, Jens Hefter Hefter, Enrico Pochini, Mathia Sabino, and Tommaso Tesi

Recent evidence from ice cores revealed that between ca. 1.3-1.9 ky CE the Victoria Land (western Ross Sea, Antarctica) experienced an abrupt cooling. How this cooling affected the ocean and marine cryosphere is largely unknown. GRETA proposes to fill this knowledge gap using sedimentary archives to investigate the ocean´s response to this cooling event. Here, we present new high-resolution sedimentary sequences collected in the western Ross Sea (JOIDES basin) and compare our findings with existing Victoria Land Coast data (Edisto Inlet, Robertson Bay, Wood Bay). We use a multidisciplinary approach that includes micropaleontological analyses (diatom assemblages) and organic geochemical proxies (IPSO25, HBI III, organic carbon, carbon stable isotopes, RI-OH’). The overarching goal of this study is to reconstruct sea ice dynamics and water mass properties (sea surface temperature, water mass circulation, upwelling) during the last 2 ky BP in the Western Ross Sea. Finally, we will merge the information obtained from the marine domain with observations from ice cores and model data to provide new insights into the sub-millennial variability of atmosphere-ocean interactions.

How to cite: Torricella, F., Battaglia, F., Belt, S., Capotondi, L., Colleoni, F., Colizza, E., Langone, L., Giordano, P., Mollenhauer, G., Hefter, J. H., Pochini, E., Sabino, M., and Tesi, T.: CoolinG oveR thE VicToria LAnd (GRETA): resolving the Ross Sea response to continental climate change during the last two millennia, EGU General Assembly 2025, Vienna, Austria, 27 Apr–2 May 2025, EGU25-16236, https://doi.org/10.5194/egusphere-egu25-16236, 2025.

EGU25-17258 | ECS | Orals | CL1.2.2

Reconstructed summer temperature variability in the Caucasus since 1613 CE and its relevance for continental-scale climate dynamics 

Lea Schneider, Rupesh Dhyani, Dario Martin-Benito, and Ekaterina Dolgova

While temperature history has been extensively studied in other parts of the Alpide belt, such as the Pyrenees, the Alps or the Himalaya, the Caucasus region remains underrepresented in paleoclimate research. This gap is evident in large-scale proxy compilations such as the NTREND (tree-rings) or the PAGES2k (multi-proxy) datasets as well as in climate reconstructions based on these compilations. Here, we present a reconstruction of summer temperature variability extending back to 1613 CE, derived from a network of six tree-ring Blue Intensity chronologies collected from upper treelines in the Greater and Lesser Caucasus. The reconstruction explains over 50% of the observed summer temperature variability, captures the signature of global warming, and reveals volcanic forcing signals. However, the network exhibits disagreement regarding the intensity of the Little Ice Age. Our record correlates with temperature reconstructions from Greece and Turkey, but shows an inverse relationship at higher frequencies with Western European temperature records. When combined with reconstructions from northwestern Russia, our data aligns with the East Atlantic/Western Russia (EA/WR) pattern, an atmospheric mode characterized by a temperature dipole over Europe. In its positive phase, this pattern generates cold anomalies over western Russia, the Caucasus and Turkey, accompanied by above-average temperatures in France and parts of Spain. We investigate the temperature dipole associated with the EA/WR pattern during the pre-industrial period across various frequency domains. Our findings offer valuable insights into historical climate dynamics across Europe and serve as a benchmark for evaluating the representation of the EA/WR pattern in climate model simulations.

How to cite: Schneider, L., Dhyani, R., Martin-Benito, D., and Dolgova, E.: Reconstructed summer temperature variability in the Caucasus since 1613 CE and its relevance for continental-scale climate dynamics, EGU General Assembly 2025, Vienna, Austria, 27 Apr–2 May 2025, EGU25-17258, https://doi.org/10.5194/egusphere-egu25-17258, 2025.

EGU25-18184 | ECS | Posters on site | CL1.2.2

Extreme rainfall events recorded in stalagmites from Oman during the last two millennia 

Ismini Lypiridou, Sara Plattner, Helen Foxhall Forbes, Mohammed Al Kindi, Hai Cheng, and Dominik Fleitmann

Understanding human-climate interactions over the past two millennia is critical for areas like Oman, where water has been a valuable resource and has shaped societal resilience and adaptation strategies. Oman’s unique geographical location, at the pathway of monsoonal activity and tropical cyclones, makes it an ideal area to investigate the links between climatic variability and extreme rainfall events. During the last few decades, Oman was affected by several tropical cyclones, such as cyclone Mekunu in May 2018. Furthermore, Oman is also frequently affected by flash floods, which cause severe damages to people and property. Detailed information about tropical cyclone and flash flood activity in the recent and more distant past is urgently needed to place present-day cyclone activity and flash flood frequencies into a meaningful historical context, and to detect any significant changes in their occurrence rates. Because of the brevity of historical and instrumental records in Oman, such information must be obtained from natural archives such as stalagmites, which can be used as a paleoflood archive (e.g., Denniston and Lütscher, 2017). During flooding of caves, stalagmites can be coated with sediment and biogenic particles which are then preserved as distinct detrital layers when the stalagmite growth continues.

Here we present first results of two Uranium-series dated actively-growing stalagmites from northern and southern Oman, one from Qunf Cave and Hoti Cave (Fleitmann et al., 2022) to explore the frequency of extreme rainfall events and their climatic drivers. Both cave systems are frequently affected by flooding (Al Kindi et al., 2023) and the two stalagmites show frequent detrital layers along their growth axis. Using digital image analysis of thin sections and high-resolution trace element profiles, we are able to develop a precisely dated record of cave flooding related to tropical cyclones and regional heavy rainfall events over the last two millennia.   


References

Al Kindi et al., 2023. A guide to the caves of Oman – The remarkable subterranean world of the Sultanate of Oman. Nomad Publishing, 274 pages.

Denniston, R.F., Luetscher, M., 2017. Speleothems as high-resolution paleoflood archives. Quaternary Science Reviews 170, 1-13.

Fleitmann et al., 2022. Droughts and societal change: The environmental context for the emergence of Islam in late Antique Arabia. Science 376, 1317-+.

How to cite: Lypiridou, I., Plattner, S., Foxhall Forbes, H., Al Kindi, M., Cheng, H., and Fleitmann, D.: Extreme rainfall events recorded in stalagmites from Oman during the last two millennia, EGU General Assembly 2025, Vienna, Austria, 27 Apr–2 May 2025, EGU25-18184, https://doi.org/10.5194/egusphere-egu25-18184, 2025.

EGU25-19354 | ECS | Orals | CL1.2.2

Regional Climate of the last 2500 years in the Eastern Mediterranean and Middle East  

Eva Hartmann, Elena Xoplaki, and Sebastian Wagner

The climate of the eastern Mediterranean and the Middle East is well documented through natural archives, such as speleothems, tree rings, sediments and pollen, as well as historical human records. The period from 500 BCE to 1850 CE is particularly intriguing from both historical and climatic perspectives. This era encompasses the prosperity and decline of the Byzantine and Roman Empires, the Middle Ages, the Little Ice Age, and the onset of industrialization, as well as significant events like plague pandemics and pronounced climate variability. Dynamical downscaling can bridge the gap between palaeo-records, which often contain uncertainties from different sources but may also have very high spatial resolution, and the coarsely resolved Earth System Models (ESMs). A transient paleo-simulation using the regional climate model COSMO-CLM (CCLM, COSMO 5.0 clm16) with adjusted forcings is conducted for the period 500 BCE - 1850 CE to explore potential interactions and feedbacks between climate variability and socio-political and/or economic conditions. The model as well as the driving MPI-ESM-LR incorporates forcing reconstructions based on the framework of the international climate model comparison project CMIP6, including volcanic (stratospheric aerosol optical depth), orbital (eccentricity, obliquity, precession), solar (irradiance), land-use and greenhouse-gas changes. The simulated temperature and precipitation outputs are compared with those of other CMIP6 models and validated against proxy records and reconstructions, enhancing our understanding of climate-society dynamics in this historically pivotal region.

How to cite: Hartmann, E., Xoplaki, E., and Wagner, S.: Regional Climate of the last 2500 years in the Eastern Mediterranean and Middle East , EGU General Assembly 2025, Vienna, Austria, 27 Apr–2 May 2025, EGU25-19354, https://doi.org/10.5194/egusphere-egu25-19354, 2025.

EGU25-19592 | ECS | Posters on site | CL1.2.2

Late Holocene climate and environmental history based on biomarker analyses from Lake Tislit, Morocco 

Svenja Scholz, Olga Schmitz, Laura Bergmann, Maximilian Prochnow, Lisa Danius, Christoph Zielhofer, and Roland Zech

The High Atlas in Morocco is sensitive to climate change and influenced by both the subtropical and mid-latitude atmospheric circulation systems, making it a key region for paleoclimate and -environmental research. Here, we present first results of lipid biomarker analyses on a ~2 m sediment core from Lake Tislit, covering approximately the last 1500 years at 30-year temporal resolution. Specifically, we aim to apply compound-specific hydrogen isotope analyses (δ2H) on n-alkanes to investigate past changes in the hydrological cycle. Further, polycyclic aromatic hydrocarbons (PAHs) are used as a proxy for paleofires. This combined approach allows us to explore the interactions between hydrological variability and (anthropogenic) fire activity during the Late Holocene.

Our preliminary results indicate that n-alkanes (n-C23 - n-C33) are well preserved with an odd-over-even predominance of >7. n-C29 and n-C31 are the most abundant homologues (~1 μg g-), likely reflecting input from terrestrial plants. Short-chain n-alkanes (n-C23 and n-C25), likely derived from aquatic organisms, are also abundant (~0.25 μg g-), providing a reliable basis for compound-specific δ2H analyses. Therefore, we will run these measurements in the coming weeks to investigate paleohydrological changes.

PAHs are consistently present throughout the sediment core. High molecular weight PAHs (m/z 252 to 278) increase strongly towards the top of the core, reaching almost 1 μg g-. This is probably indicative of high temperature combustion and the onset of industrialisation. Perylene is considered separately, as it has recently been proposed to rather serve as possible proxy for soil erosion. Perylene is often the most abundant PAH in our core and has a pronounced maximum at ~50 cm core depth, possibly indicating significant anthropogenic land use.

How to cite: Scholz, S., Schmitz, O., Bergmann, L., Prochnow, M., Danius, L., Zielhofer, C., and Zech, R.: Late Holocene climate and environmental history based on biomarker analyses from Lake Tislit, Morocco, EGU General Assembly 2025, Vienna, Austria, 27 Apr–2 May 2025, EGU25-19592, https://doi.org/10.5194/egusphere-egu25-19592, 2025.

EGU25-896 | ECS | Posters on site | CL1.2.3

A Multiproxy Approach to study Vegetation and Temperature Changes since the Last Glacial in Central Vietnam. 

Chloe Snowling, Annabel Wolf, Sebastian F M Breitenbach, James Bendle, Alfredo Martínez-García, Johanna Schäfer, David McGee, Adam B Jost, Deb Limbert, and Vasile Ersek

Speleothems are invaluable archives of past climate variability and offer important insights into monsoon dynamics across Southeast Asia. Different isotope systems have been employed to characterise autumn monsoon in this region, but multiple influencing factors render the interpretation of isotope proxy records ambiguous. To gain novel insights into regional vegetation and temperature changes, novel proxies are required. Here, we combine traditional speleothem stable isotopes (δ¹⁸O and δ¹³C) with speleothem thermometry (TEX86) and lignin oxidation products (LOP) analyses, to provide a more comprehensive understanding of past environmental changes in Central Vietnam. Specifically, we aim to:

1. Reconstruct cave air temperature variations using TEX86.

2. Assess vegetation and environmental changes through LOP analysis.

3. Evaluate the response of these proxies to known climate forcing mechanisms, including Northern Hemisphere summer insolation, sea surface temperature anomalies, and shifts in the Intertropical Convergence Zone.

A stalagmite record from Central Vietnam, spanning the last glacial and onset of the Holocene (35 – 10 ka BP), provides a unique opportunity to reconstruct glacial to Holocene temperature changes and the response of regional hydroclimate and vegetation. Preliminary TEX86 results suggest a temperature shift of at least 2°C from fully glacial to Holocene conditions. LOP results suggest that the vegetation in Central Vietnam changed from hardwood deciduous vegetation types (0.37 S/V, 0.33 C/V) to an increase in softwood vegetation types (0.1 S/V, 0.11 C/V), respectively.  Our findings have implications beyond Southeast Asia's paleoclimate. Validating these novel biomarker systems (TEX86 and LOP) against more traditional stable isotope ratios (δ¹⁸O and δ¹³C), we aim to elucidate changes in moisture budget and sources, and seasonality.

How to cite: Snowling, C., Wolf, A., Breitenbach, S. F. M., Bendle, J., Martínez-García, A., Schäfer, J., McGee, D., Jost, A. B., Limbert, D., and Ersek, V.: A Multiproxy Approach to study Vegetation and Temperature Changes since the Last Glacial in Central Vietnam., EGU General Assembly 2025, Vienna, Austria, 27 Apr–2 May 2025, EGU25-896, https://doi.org/10.5194/egusphere-egu25-896, 2025.

The caves of the eastern part of the Yorkshire Dales karst in northern England have received little scientific attention as compared to the classic karst of the Three Peaks area to the west. This is especially true of the valley of Nidderdale, which has no through road, and as much of the area was purchased in the nineteenth century in order to provide water for the growing city of Bradford has been relatively little visited. The Manchester Hole/Goyden Pot/Nidd Heads cave system has developed beneath a cover of clastic strata with only very limited outcrop of limestone occurring in the valley bottom. U-series dates from Goyden Pot show cave development occurred prior to Marine Isotope Stage 3. The presence of detrital thorium, in the speleothem samples, probably due to the nature of the catchment, limits precision however; this study confirms there is a long history of cave development in the area.

The curious nature of the speleothem in the system has been commented upon since the earliest days of cave exploration. They appear to be undergoing re-dissolution because of the chemically aggressive nature of the water in the valley although one early explorer made an alternative suggestion of it being due to animal wastes leaking in from the farm above. The chemically aggressive nature of the water may also account, at least in part, for the very large passage size in the system – being some of the largest stream passage development in the region. Such a situation of very chemically aggressive waters entering the limestone aquifer at discrete points where the limestone was first exposed due to valley incision may account for the very large size of some of the relict passage fragments found at very high altitudes within the Great Scar Limestone of the Yorkshire karst. 

How to cite: Murphy, P.: U-series and Urine – understanding cave development in Nidderdale, North Yorkshire, UK, EGU General Assembly 2025, Vienna, Austria, 27 Apr–2 May 2025, EGU25-1116, https://doi.org/10.5194/egusphere-egu25-1116, 2025.

EGU25-5196 | ECS | Orals | CL1.2.3

Late Holocene climate variability and cultural transitions in the southeastern Iberian Peninsula recorded by speleothems 

Elvira Ruíz-Caballero, Fernando Gázquez, Andrea Columbu, Ángel Fernández-Cortés, Eneko Iriarte, Hu Hsun-Ming, Shen Chuan-Chou, Giovanni Zanchetta, and José María Calaforra

Speleothems serve as valuable archives for paleoclimate reconstructions; however, high-resolution stalagmite records from the southern Iberian Peninsula remain limited. We investigate two stalagmites from Larga Cave (Sierra de los Filabres range, Almería, 1980 m a.s.l.) using geochronology (U-Th dating), stable isotope analysis (δ¹⁸O and δ¹³C), trace element composition, micromorphology, and petrography. Additionally, environmental monitoring of the cave and modern calcite farming on glass substrates have been ongoing since November 2022, to obtain a better understanding of the cave's ventilation dynamics and how the climatic signal is recorded in the speleothems.

The ages of stalagmites CL-1 and CL-3 span from approximately 5,000 to 1,000 years BP, encompassing the late phase of the Los Millares culture and the rise and fall of the El Argar civilization in southeastern Iberia. Stalagmite CL-1 contains fragments of macroscopic endolithic charcoal, which have also been identified at various locations within the cave. Radiocarbon dating of this charcoal indicates an age of 3,900 calibrated years BP, suggesting that the cave was occupied either permanently or temporarily during the Early to Middle Bronze Age.

The decline of the El Argar civilization appears to coincide with a relatively drier period, as indicated by shifts in δ¹⁸O and δ¹³C values. This stage is further characterized by successive speleothem layers exhibiting retraction patterns, typically associated with reduced drip rates. Further geochemical analyses of these and other speleothems from Larga Cave will provide deeper insights into the extent to which ancient civilizations in southeastern Iberia were influenced by climatic conditions.

How to cite: Ruíz-Caballero, E., Gázquez, F., Columbu, A., Fernández-Cortés, Á., Iriarte, E., Hsun-Ming, H., Chuan-Chou, S., Zanchetta, G., and Calaforra, J. M.: Late Holocene climate variability and cultural transitions in the southeastern Iberian Peninsula recorded by speleothems, EGU General Assembly 2025, Vienna, Austria, 27 Apr–2 May 2025, EGU25-5196, https://doi.org/10.5194/egusphere-egu25-5196, 2025.

EGU25-7077 | ECS | Posters on site | CL1.2.3

Cavern pearls of the Lluis Auroux's Collection: geochemical and mineralogical characterization on caves from the Geoparc Orígens (Catalan Pyrenees) 

Mercè Cisneros, Jordi Ibáñez-Insa, Josep Roqué, Abigail Jiménez, Soledad Álvarez, Lluís Auroux, and Santiago Giralt

The unequivocal global warming of the climate system and the clear influence of human activities underscore the urgency of addressing the current challenge of Earth's warming. Not only many ecosystems but the whole Earth System is being affected, and in some cases, knowledge about the impact of climate change remains limited. A good example of this are the cave pearls, which are highly interesting due to their particular geochemical fingerprint and also from the perspective of natural heritage.

The mountain regions of the Catalan Pyrenees are experiencing more pronounced temperature increases than the rest of the territory, which intensifies the impacts of climate change in this area. Regarding precipitation, and as is the case throughout the rest of Catalonia, all projections seem to indicate a significant reduction in the annual number of days with light precipitation (20 fewer days) and an increase in the maximum duration of dry spells (20 more days). In this context, one might wonder how this 'new hydroclimatic variability' is altering the environmental conditions of karst cavities. Frequent observations by speleologists reveal a widespread trend toward drier conditions inside caves. More intense droughts could lead to a reduction in the water level of the gours where the pearls grow, a reduction that could significantly hinder their growth.

Cave pearls, technically known as pisolites or oolites depending on their size, represent a type of speleothem growth that is much less known than stalagmites and stalactites. They form rare, difficult-to-find deposits that are still poorly studied and are located on the floors of certain underground cavities. Unlike other stone formations, they are not attached to the rock due to the vibration of the water in the basin where they are found, a vibration caused by the dripping that sustains it. These are complex processes, highly sensitive to environmental variations. As such, they present a potential vulnerability, yet still unknown, to situations arising from the current climate emergency, drought, and human access. The scientific understanding of this heritage (particularly as a record of climate change) and its dissemination must contribute to preserving them from the current irreversible damage and mass spoliation.

This study aims to carry out a geochemical and mineralogical characterization of cave pearls from 15 cavities located within the Orígens Geopark, in the Catalan Pyrennes (NE Spain). The cavities are made of different lithologies (limestones, conglomerates, and sandstones) and include various geomorphological units. The methodology incorporates elemental and mineralogical analyses at both macro and micro scales using XRF, SEM-EDS, XRD, and Raman Spectroscopy, alongside crystallography, X-ray tomography, and advanced 3D imaging techniques. Innovative approaches to imaging and microanalysis will also be utilized.

Our data and analysis show the high richness and geochemical variability of cave pearls in the Orígens Geopark, with high potential to extract useful information about the impact of climate change on karstic systems.

How to cite: Cisneros, M., Ibáñez-Insa, J., Roqué, J., Jiménez, A., Álvarez, S., Auroux, L., and Giralt, S.: Cavern pearls of the Lluis Auroux's Collection: geochemical and mineralogical characterization on caves from the Geoparc Orígens (Catalan Pyrenees), EGU General Assembly 2025, Vienna, Austria, 27 Apr–2 May 2025, EGU25-7077, https://doi.org/10.5194/egusphere-egu25-7077, 2025.

We present a high–resolution record of unstable hydro-climate conditions in the last interglacial MIS5e (~131-116 ka) in the southern Levant by analyzing the simultaneous behavior of Sr, C, and O isotopes in a stalagmite from the Har Nof cave in Jerusalem, Israel [1]. These data are compared and integrated with data from other surrounding speleothems and the contemporaneous charcoal, fungal spores, and pollen data retrieved from the ICDP Dead Sea deep drill core.

The following environmental patterns are observed during MIS5e:

  • During early MIS5e (~131-125 ka) on the rising flank of the northern hemisphere (33 N and 65 N) insolation curves, Jerusalem and the Judea Hills were experiencing a moderate Mediterranean-like climate. Desert dust accumulated in the vicinity of the cave. Salt deposition was occurring in the Dead Sea basin.
  • Approaching the peak northern hemisphere insolation, and during the interval of peak insolation and Sapropel event S5 (127.5-122 ka), temperatures rose and rains arrived to the region from both Mediterranean and tropical sources. The end of this period was characterized by widespread fires, loss of C3 vegetation, fungal proliferation, and complete soil removal from hill-slopes. Savannah-like C4 grasses penetrated to soil-accumulation sites in the valleys. The main rainfall season appears to have shifted from winter to summer.
  • At 122-120.5 ka, high 87Sr/86Sr ratios indicate contributions of sea salts. Extremely high δ13C values indicate no vegetation above the cave, suggesting an arid environment.
  • At 5-118 ka, on the declining flank of the insolation curve, the area was under unstable conditions with occasional storms, and high-intensity rainfall accompanied by sea salt. Soil was formed and savannah-like C4 vegetation developed.
  • At ~118-116 ka, the sedimentation rate of Har Nof AF12 stalagmite is extremely low. The region was characterized by arid conditions and major salt deposition was occurring in the Dead Sea. Still, occasional floods reached the Dead Sea with some moisture coming mainly from southern sources.

This detailed record of environmental changes shows that the northward expansion of climatic belts over the southern Levant during MIS5e caused dramatic environmental changes, crossing a tipping point threshold, and was associated with a major ecologic disruption. Such abrupt changes are characterized by nonlinear, threshold-type responses at rates that are large relative to background variability and forcing.

The evidence from the caves and Dead Sea sediments presented here for the MIS5e period suggests that global warming can be associated with periods of increased instability in the south Levant, an area lying at the desert fringe. The tipping point threshold manifested in MIS 5e of the Levant include complete loss of vegetation and soil, devastating fires and a shift of precipitation from winter to summer. These extreme events send a warning message that elevated greenhouse gases may increase desertification and instability of Levant climate.

[1] Frumkin, A., Stein, M. and Goldstein, S.L., Palaeogeography, Palaeoclimatology, Palaeoecology 586, 110761, 2022. 

How to cite: Frumkin, A. and Stein, M.: The last interglacial (MIS5e) in Jerusalem, Israel from speleothem Sr, C and O isotopes , EGU General Assembly 2025, Vienna, Austria, 27 Apr–2 May 2025, EGU25-7795, https://doi.org/10.5194/egusphere-egu25-7795, 2025.

EGU25-8705 | Posters on site | CL1.2.3

Hydroclimate Variations in Southeastern China During the Last Glacial Period: Insights from Multi-Proxy Stalagmite Records 

Miaomiao Wang, Haiwei Zhang, Xiaomei Zhang, and Hai Cheng

During the Last Glacial Period, millennial-scale abrupt climate events were closely linked to the weakening of the Atlantic Meridional Overturning Circulation (AMOC). This weakening is also significantly associated with the increasing frequency of modern extreme climate events in the context of global warming. However, geological records detailing regional climate responses in southeastern China during these events, particularly the Heinrich cold events, remain limited. In this study, we analyze climate characteristics during the Heinrich Stadials (HS1-HS4) using multiple proxies from the stalagmite YXG01, which was collected from Yindi Cave in Huangshi City, Hubei Province (located in the lower reaches of the Yangtze River). The proxies include δ¹³C, δ¹⁸O, Mg/Ca, Sr/Ca, and Ba/Ca, and the dating spans from 47.47 to 11.92 ka BP. Our results show that during HS1-HS4, δ¹⁸O values in the stalagmite exhibit significant positive excursions, indicating a weakening of the East Asian summer monsoon (EASM). In contrast, δ¹³C, Mg/Ca, Sr/Ca, and Ba/Ca ratios show negative excursions. Furthermore, stalagmite growth rates significantly increased during these stadials, reflecting more favorable hydroclimatic conditions. On the orbital timescale, our δ¹⁸O variations also show inverse relationships with δ¹³C, Mg/Ca, Sr/Ca, and Ba/Ca ratios, suggesting that the stalagmite δ¹⁸O variations are anticorrelated with changes in rainfall in southeastern China. These findings support the hypothesis of a "tripole precipitation pattern" in monsoonal China, where stronger EASM periods correspond to more precipitation in North and South China and less in Central-East China, while weaker EASM periods show the opposite pattern. Nevertheless, during the Last Glacial Period, both on the orbital timescale and during Heinrich Stadials (HSs), the robustness of the tripole precipitation pattern in monsoonal China still needs to be further validated through the use of well-dated and reliable precipitation proxies.

How to cite: Wang, M., Zhang, H., Zhang, X., and Cheng, H.: Hydroclimate Variations in Southeastern China During the Last Glacial Period: Insights from Multi-Proxy Stalagmite Records, EGU General Assembly 2025, Vienna, Austria, 27 Apr–2 May 2025, EGU25-8705, https://doi.org/10.5194/egusphere-egu25-8705, 2025.

EGU25-8706 | Posters on site | CL1.2.3

The 2.8 ka abrupt climate event in East Asian Monsoon region: High-resolution stalagmite records from southern China 

Xiaomei Zhang, Haiwei Zhang, Miaomiao Wang, and Hai Cheng

Using 15 230Th dating of a stalagmite (SN33) from Shennong Cave, Jiangxi Province, southeastern China, along with 140 δ18O results, we reconstructed the evolution of the East Asian Summer Monsoon (EASM) during the Late Holocene between 3.2 and 2.5 ka B.P., with an average resolution of 4 yrs. During this interval, a pronounced positive δ18O excursion was observed between 2.97 and 2.68 ka B.P., marking the occurrence of the 2.8 ka weak monsoon event in southeastern China. This event began at 2965 ± 13 a B.P. and ended at 2677 ± 47 a B.P., characterized by an asymmetric "double-plunging" structure. Through centennial-scale variations in δ13C, trace elements, δ234U, and growth rate of stalagmite SN33, we infer that southeastern China was in a wetter state during 2.8 ka event. Comparison with other geological records further supports that, while southeastern China indeed experienced humid conditions during this period, other regions were in a state of drought. The 2.8 ka B.P. climatic anomaly had profound impacts on agriculture, population migration, and cultural transitions in the East Asian monsoon region. In China, populations migrated to the warmer and more humid region in southeastern of lower reaches of the Yangtze River Valley (YRV), facilitating the development of agriculture and culture in this region. Meanwhile, the collapse of the Zhou Dynasty in China and the decline of the Songguk-ri culture in Korea were also responses to the cooler and drier climate conditions during the 2.8 ka event.This precipitation pattern may have been influenced by a strengthened westerly jet stream and the Western Pacific Subtropical High (WPSH) during 2.8 ka B.P..  The internal dynamics and transitional characteristics between the 2.8 ka and 8.2 ka events suggest that both weak monsoon events in the Holocene may have been driven by a common mechanism, likely associated with a weakening of the Atlantic Meridional Overturning Circulation (AMOC). Additionally, the significant decline in solar activity during the latter phase of the 2.8 ka event indicates that centennial-scale variations in East Asian monsoon circulation were likely co-driven by solar activity and high-latitude climatic changes in the Northern Hemisphere.

How to cite: Zhang, X., Zhang, H., Wang, M., and Cheng, H.: The 2.8 ka abrupt climate event in East Asian Monsoon region: High-resolution stalagmite records from southern China, EGU General Assembly 2025, Vienna, Austria, 27 Apr–2 May 2025, EGU25-8706, https://doi.org/10.5194/egusphere-egu25-8706, 2025.

EGU25-8924 | ECS | Orals | CL1.2.3

Palaeoclimate reconstruction using high-resolution proxy data from Holocene stalagmites from the Kingdom of Tonga 

Hesam Zareh Parvar Ghoochani Nejad, Andrea Borsato, Danielle Verdon-Kidd, Silvia Frisia, Dan Sinclair, Pauline C. Treble, Hai Cheng, and Russell Drysdale

Insufficient palaeoclimate data from the South Pacific lead to conflicting theories regarding the region's responses to Holocene climate fluctuations. To address this gap in knowledge we present preliminary results from five stalagmites collected from two different caves in the Kingdom of Tonga.

Despite their vicinity, Ana Hulu (on Tongatapu Island) and Ana Maui (on ‘Eua Island) caves differ significantly in their microclimatic settings. Ana Hulu is a warm (24.2 °C) and shallow coastal cave, whereas Ana Maui is a deep and relatively cooler cave opening deep in the forest at 188 m above sea level. These differences are likely underpinned in the formation of the well-laminated and coloured stalagmites retrieved from Ana Hulu and the colourless, faint-laminated stalagmites from Ana Maui.

The set of U-series dated stalagmites provides an almost continuous record spanning the entire Holocene up to the end of the Younger Dryas (ca. 12,500 years ago). The stalagmites show different growth rates varying from 50 to 300 µm/year. The high-resolution chronology can offer the potential for annually resolved records of infiltration (rainfall) variability, which are likely to be related to shifts of the South Pacific Convergence Zone (SPCZ), the most important tropical South Pacific cloud belt..

However, an interpretation of SPCZ shifts based solely on speleothem δ13C and δ18O values is challenging. The potential influence of enhanced evaporation and degassing effects, which may arise from warm temperatures and low cave air pCO2, must be accounted for. A multi-proxy approach on coeval stalagmites has been shown to provide critical information about the role of local hydrology. Thus, we combined the stable isotope ratios values time-series with petrographic observations, high-resolution LA-ICP-MS trace elements data, and synchrotron-radiation XRF elemental mapping. This multi-proxy approach, along with an assessment of crystallization pathways leading to fabrics, is expected to enable robust reconstructions of coeval changes in infiltration regimes and hydroclimate dynamics across the South Pacific.

How to cite: Zareh Parvar Ghoochani Nejad, H., Borsato, A., Verdon-Kidd, D., Frisia, S., Sinclair, D., C. Treble, P., Cheng, H., and Drysdale, R.: Palaeoclimate reconstruction using high-resolution proxy data from Holocene stalagmites from the Kingdom of Tonga, EGU General Assembly 2025, Vienna, Austria, 27 Apr–2 May 2025, EGU25-8924, https://doi.org/10.5194/egusphere-egu25-8924, 2025.

EGU25-9236 | Orals | CL1.2.3

Absolute paleotemperatures during the Laschamps geomagnetic excursion 

Eric Font, Stéphane Affolter, Elisa Sanchez-Moreno, Yusuke Yokoyama, Claude Hillaire-Marcel, and Dominik Fleitmann

The link between geomagnetic excursions and climate is an exciting but still unresolved topic. The idea reposes on the increased solar and cosmic ray radiation in response to the weakened magnetic field during the transitional fields accompanying a geomagnetic reversal or excursion. However, a direct climate response to the variations of the Earth magnetic field is not yet demonstrated in the geological record. A major limitation resides in the fact that paleomagnetic data are usually extracted from igneous or sedimentary rocks, which usually provide no or poor-quality paleoclimate information. Recent advances in speleothem magnetism fill this gap and open a new door to investigate the link between climate and the variation of the Earth magnetic field in the same geological archive. Here we document absolute paleotemperatures based on water isotopes in fluid inclusions from a Portuguese stalagmite that recorded the Laschamps geomagnetic excursion (~42 kyrs). The stalagmite was dated by radiocarbon method. Paleomagnetic data show the complete record of the Laschamps geomagnetic excursion, with paleomagnetic poles moving from the north pole down to the south pole and returning to the original position in ~3000 kyrs. Paleointensity data show a weakened magnetic field associated with the migration of the paleomagnetic pole. Absolute paleotemperatures were calculated using the fluid inclusion hydrogen isotope (d2H) and the calcite-water isotope fractionation paleothermometer on 19 samples encompassing the Laschamps event. The data show increased absolute temperatures just before and during the Laschamps. However, a strong correlation is noted between the absolute temperature calculated here and the oxygen isotope composition of the NGRIP ice core. Although the relation between paleotemperatures and the Laschamps event is not yet fully demonstrated in this case, the combination of paleomagnetic techniques coupled to isotope composition in speleothems offers new and promising perspectives to investigate the relationship between climate and the Earth magnetic field.


This project is funded by Portuguese Fundação para a Ciência e Tecnologia, FCT, I.P./MCTES through national funds (PIDDAC): UID/50019/2025, UIDB/50019/2020 (https://doi.org/10.54499/UIDB/50019/2020), LA/P/0068/2020 (https://doi.org/10.54499/LA/P/0068/2020), and PTDC/CTA-GEO/0125/2021.

How to cite: Font, E., Affolter, S., Sanchez-Moreno, E., Yokoyama, Y., Hillaire-Marcel, C., and Fleitmann, D.: Absolute paleotemperatures during the Laschamps geomagnetic excursion, EGU General Assembly 2025, Vienna, Austria, 27 Apr–2 May 2025, EGU25-9236, https://doi.org/10.5194/egusphere-egu25-9236, 2025.

EGU25-10612 | ECS | Orals | CL1.2.3

Calibration of stalagmite trace elements with instrumental rainfall record from the Australian tropics 

Andrei Munteanu, Marco Roman, Mara Bortolini, Elena Argiriadis, and Rhawn F. Denniston

Stalagmites serve as valuable archives that significantly enhance our understanding of past climate and environmental changes. The trace element records preserved within stalagmites have been used to reconstruct past rainfall patterns at regional scale [1]. However, interpreting these geochemical proxies is challenging, as the functioning of the cave system, within its specific climatological and geological context, must be taken into account. Comparing instrumental climate measurements with these proxies from stalagmites that grew during the 20th century provides an opportunity to investigate how stalagmite geochemistry responds to variations in rainfall.

In this study, we present results from a stalagmite collected from cave KNI-51, located in the Kimberley region of northeast Western Australia. Previous uranium–thorium disequilibrium dating of the stalagmite has yielded a high-precision age model (2 sd errors of ±1–2 years over much of the last century) and revealed rapid growth (1–2 mm/yr) [2], allowing for nearly annual resolution of geochemical records. We examined trace element variations related to historical annual rainfall fluctuations, retrieved from five stations near the cave area between 1915 and 2007. Comprehensive statistical analyses, accounting for stationarity and autocorrelation in the time series data, revealed significant correlations when comparing certain trace elements to both total annual rainfall and the rainfall recorded during the monsoon season (December to March). Notably, some trace elements exhibited a stronger response to rainfall occurring during the monsoon period. Furthermore, we applied rolling window correlation to assess the evolution and stability of these correlations over time, identifying intervals where the relationship between the time series appeared weaker or stronger.

The multi-annual calibration provided critical insights into how the stalagmite recorded rainfall variability through trace elements fluctuations and represents a key step in defining the response times of the cave and stalagmite "recording systems" to changes in climate and water balance in the Kimberley region. The disclosed correspondence between the instrumental rainfall record and the trace element signals encoded in the stalagmite demonstrates that rainfall time series can be successfully reconstructed from stalagmites. This marks an important milestone in the development of a calibrated trace element–rainfall transfer function, which can be applied to past stalagmite geochemical records.

[1]         S. F. Warken et al., “Reconstruction of late Holocene autumn/winter precipitation variability in SW Romania from a high-resolution speleothem trace element record,” Earth Planet. Sci. Lett., vol. 499, pp. 122–133, 2018, doi: https://doi.org/10.1016/j.epsl.2018.07.027.

[2]         R. F. Denniston et al., “Expansion and contraction of the indo-pacific tropical rain belt over the last three millennia,” Sci. Rep., vol. 6, pp. 1–9, 2016, doi: 10.1038/srep34485.

How to cite: Munteanu, A., Roman, M., Bortolini, M., Argiriadis, E., and Denniston, R. F.: Calibration of stalagmite trace elements with instrumental rainfall record from the Australian tropics, EGU General Assembly 2025, Vienna, Austria, 27 Apr–2 May 2025, EGU25-10612, https://doi.org/10.5194/egusphere-egu25-10612, 2025.

EGU25-11210 | ECS | Posters on site | CL1.2.3

A seasonally resolved late Holocene paleoclimate record from Sofular Cave, Northern Türkiye. 

Alice Paine, Frederick Held, Hai Cheng, and Dominik Fleitmann

Understanding how climate change manifests across the Mediterranean basin is critical for predicting the impacts of future climate change. The Black Sea region (BSR) is one of the most vulnerable areas of the Mediterranean climate change hotspot, owing to its high sensitivity to both local and global-scale climate feedbacks1. However, few paleoclimate records exist with sufficient resolution, and length, to fully assess significance of these feedbacks on timescales exceeding the window of instrumental observation2. Here, we present a ~230-year-long, seasonally-resolved stable isotope record record of effective moisture and temperature variability from stalagmite So-11, which grew in Sofular Cave (Northern Türkiye) between 1779 and 2008 CE. The sample contains 229 continuous, well-developed laminae couplets with a mean wavelength of ~0.95 mm a-1, suggesting that each dark-to-light couplet corresponds to one calendar year. This assumption is supported by two U-Th ages, which show good agreement with the layer-counted chronology generated using the date of collection (2008 CE) as an upper anchor point. Minima in δ13C closely track the dense, dark, compact calcite layers, and are typically followed by a distinct δ13C peak in conjunction with formation of white, porous calcite layers. We interpret these oscillations as seasonal changes in effective moisture, with the lowest δ13C values corresponding to high drip rates, lower CO2 degassing, and weaker fractionation during winter months – reflecting the high responsivity of the Sofular Cave system to transient changes in local precipitation3,4. Marked changes in the geochemistry of So-11 also coincide with the Little Ice Age (1850 to 1870 CE), and the progressive increase in global atmospheric CO2 in response to increased fossil fuel combustion during the 20th and 21st centuries5. Our results underscore how high-resolution, speleothem-based paleoclimate reconstructions can provide important context not only for constraint of global circulation model (GCM) simulations, but also closer examination of human-climate-environment interactions during the Late Holocene. 

~~

1Giorgi, F. (2006) Geophysical Research Letters 33(8):  L08707
2Burstyn, Y. et al. (2019) Quaternary 2:16
3Göktürk et al. (2011) Quaternary Science Reviews 30: 2433-2445
4Rudzka, D. et al. (2011) Geochimica et. Cosmochimica Acta 75 : 4321–4339
5Bauska, T. K. et al. (2015) Nature Geoscience 8: 383–387

How to cite: Paine, A., Held, F., Cheng, H., and Fleitmann, D.: A seasonally resolved late Holocene paleoclimate record from Sofular Cave, Northern Türkiye., EGU General Assembly 2025, Vienna, Austria, 27 Apr–2 May 2025, EGU25-11210, https://doi.org/10.5194/egusphere-egu25-11210, 2025.

EGU25-11557 | Orals | CL1.2.3

Investigation of the Global Meteoric Water Line in the past using speleothem fluid inclusions 

Stéphane Affolter and Dominik Fleitmann

The paleoclimate role of speleothem fluid inclusions – and namely its direct link to past precipitation – has been recognized since decades (Affolter et al., 2025). Water isotopes contained in speleothem fluid inclusions offer a unique opportunity to reconstruct and study the past water cycle. The analyses of water extracted from the speleothem calcite matrix allow a precise determination of its hydrogen (δ2H) and oxygen (δ18O) isotopes. The relationship between δ2H and δ18O isotope ratios in meteoric waters is called the Global Meteoric Water Line (GMWL). Here, we explore this relationship in the past based on speleothem fluid inclusion water.

Based on a compilation of existing data covering essentially mid- to low-latitude area, as well as new data, we developed a Global Meteoric Water Line for the past (paleo-GMWL). Results show a remarkable similarity between the paleo-GMWL inferred from the speleothem fluid inclusion water in the past, and the present-day GMWL. This demonstrates the long-term GMWL stability, at least during temperate periods when speleothems at mid- and high-latitudes grew, i.e. when mean annual air temperatures and cave air temperatures were above the freezing point.

Similarly, we analyzed the spatial distribution of δ2H by comparing speleothem fluid inclusion and recent rainfall δ2H isotope values. Results show the suitability of fluid inclusion water isotopes for the reconstruction of a global network of isotopes in precipitation in the past. However, challenges such as temporal and spatial gaps in the speleothem record remain in many regions of the world.  Nevertheless, our study highlights the high potential of speleothem fluid inclusions to investigate the spatial and temporal variability of water isotopes in the past. The fact that speleothem fluid inclusion water isotopes fall on the GMWL delineates the quality of this proxy and its ability to reconstruct the past water cycle.


Affolter, S., Kipfer, T., Hofmeister, E., Leuenberger, M. and Fleitmann, D., 2025. Paleoclimatic significance of water isotopes in speleothem fluid inclusions. Earth-Science Reviews, 261: 105026.


How to cite: Affolter, S. and Fleitmann, D.: Investigation of the Global Meteoric Water Line in the past using speleothem fluid inclusions, EGU General Assembly 2025, Vienna, Austria, 27 Apr–2 May 2025, EGU25-11557, https://doi.org/10.5194/egusphere-egu25-11557, 2025.

EGU25-14105 | ECS | Posters on site | CL1.2.3

Interhemispheric monsoon response to bipolar forcing during Heinrich Stadial 4 

Rui Zhang, Haiwei Zhang, Xiyu Dong, Christoph Spötl, Carlos Pérez-Mejíasa, Francisco W. Cruz, and Hai Cheng

Heinrich Stadial 4 (HS4) the most prominent iceberg collapse event of the Last Glacial is marked by significant changes in both high- and low-latitude records, making it a key example for studying millennial-scale events. Based on an improved chronological, we present high-resolution, annually laminated speleothem record from southeastern China, spanning the HS4, which allows us to quantify the temporal relationship of Heinrich Event 4 (HE4) with unprecedented age precision across the Asian Monsoon region, South American Monsoon region, and polar regions. Our data suggests that during the onset of HS4, the East Asian Summer Monsoon (EASM) and northern high-latitude climate experienced two rapid stages of change, tightly coupled by the rapid southward migration of the Intertropical Convergence Zone over the Pacific. In contrast, controlled by low temperatures in Antarctica, the strengthened cross-equatorial flow led to a gradual weakening of the Indian Summer Monsoon (ISM). Our records precisely date the onset of HE4 at 39.70 ± 0.06 ka BP, significantly narrowing the uncertainty in Greenland ice cores (GISP2 and GRIP) for this period. Following HE4 onset, northern high-latitude cooling and EASM weakening occurred, followed by a marked strengthening of the South American Summer Monsoon and a rapid increase in atmospheric methane about 100 years later. Atmospheric CO2 rises and Antarctic warming after HE4 caused a weakening of the cross-equatorial flow, eventually triggering a significant decline in ISM.

How to cite: Zhang, R., Zhang, H., Dong, X., Spötl, C., Pérez-Mejíasa, C., W. Cruz, F., and Cheng, H.: Interhemispheric monsoon response to bipolar forcing during Heinrich Stadial 4, EGU General Assembly 2025, Vienna, Austria, 27 Apr–2 May 2025, EGU25-14105, https://doi.org/10.5194/egusphere-egu25-14105, 2025.

EGU25-14953 | Posters on site | CL1.2.3

Quantifying evaporation during fluid inclusion isotope analysis in speleothem samples 

Jasper A. Wassenburg, Hubert B. Vonhof, Sayak Basu, Daniel M. Cleary, Yun Seok Yang, Yuna Oh, Hai Cheng, and Christoph Spoetl

Speleothem fluid inclusion isotope analysis provides the oxygen and hydrogen isotope compositions of the parent water from which the carbonate was precipitated. In contrast to the carbonate isotopes, it is not affected by kinetic isotope effects or cave air temperature. However, in-cave evaporation has been identified as a potential control on drip water isotopes if drip rates are slow and or relative humidity in the cave is low.

Rainfall isotope compositions generally plot close to the global meteoric water line (GMWL) in a plot of d2Hversus d18O that can be described by the following regression equation: d2H = 8*d18O + 10. A lower deuterium excess (d-excess) value indicates post-condensation evaporation, and different fractions of evaporation typically result in so-called evaporation lines with shallower slopes. Recently it was shown that in-crusher evaporation results in water loss during analysis, which may significantly affect the speleothem fluid inclusion isotope composition. For fluid inclusion isotope compositions that have low d-excess values, it is thus key to find out where evaporation took place.

In this study, we examine the effect of analytical evaporation by quantifying the water loss during analysis. We target two layers with different calcite fabrics from a flowstone of Touhami Cave (GTOF2), Morocco, as well as a speleothem from Scladina Cave, Belgium. The Moroccan fluid inclusion isotope data agree well with the drip water isotope composition from a cave nearby. The white opaque layer from GTOF2 has high water contents of 3.4 µl/g, whereas the second transparent layer has only 0.12 µl/g. The speleothem from Scladina Cave yielded 2.0 µl/g. We observed that all replicates lose water up to 39% by evaporation, but only the Scladina speleothem shows a clear relationship between fractional water loss and d-excess. The replicates of the low water content layer in GTOF2 plot on an evaporation line, but the slope is steeper compared to the evaporation line from the Scladina speleothem. We suggest that the Touhami Cave flowstone may have been affected by in-cave evaporation.

How to cite: Wassenburg, J. A., Vonhof, H. B., Basu, S., Cleary, D. M., Yang, Y. S., Oh, Y., Cheng, H., and Spoetl, C.: Quantifying evaporation during fluid inclusion isotope analysis in speleothem samples, EGU General Assembly 2025, Vienna, Austria, 27 Apr–2 May 2025, EGU25-14953, https://doi.org/10.5194/egusphere-egu25-14953, 2025.

EGU25-15460 | Posters on site | CL1.2.3

Radiocarbon evidence for aged speleothem organic matter: what does this mean for the interpretation of speleothem biomarker records? 

Franziska Lechleitner, Rowan Sarah, Gang Xue, Tim Huber, Marc Luetscher, Giulia Guidobaldi, Negar Haghipour, Laura Endres, Heather Stoll, Aurea C. Chiaia-Hernández, and Sergio Cirelli

The application of organic carbon-based proxies, particularly biomarkers, to speleothem archives has greatly increased due to methodological and analytical advances. These reconstructions rely on the critical assumption that the analyzed proxy shares the same age as the surrounding archive matrix, as direct measurement of the biomarker age remains challenging due to very low concentrations.

We have developed a dataset of globally distributed bulk organic carbon radiocarbon ages from speleothems. Comparison with coupled carbonate radiocarbon ages, and where applicable, U-Th ages, shows that the speleothem organic carbon fraction is predominantly older than the depositional age (by 600 - 15,000 years). This discrepancy seems largely unaffected by climate conditions and ecosystem type, suggesting that aging of organic matter through storage and reworking is a widely occurring feature of karst systems.

Radiocarbon measurements of drip water organic carbon in a temperate karst system in Switzerland confirm that dissolved organic carbon ages in the karst system (and is not, for example, related to processes during incorporation into the speleothem carbonate matrix), with a strong influence of hydrology. Fluorescence and high resolution mass spectrometry allow us to investigate the processing and transformation of organic matter in the subsurface.

Our results remain so far constrained to the bulk organic carbon phase, and therefore we can only infer on how different biomarkers are affected by pre-aging in the karst system. Nevertheless, we highlight the complexity of carbon transport and transformation in the karst subsurface, underscoring the need for careful screening of samples and biomarkers used for paleoenvironmental reconstructions from speleothem organic matter.

How to cite: Lechleitner, F., Sarah, R., Xue, G., Huber, T., Luetscher, M., Guidobaldi, G., Haghipour, N., Endres, L., Stoll, H., Chiaia-Hernández, A. C., and Cirelli, S.: Radiocarbon evidence for aged speleothem organic matter: what does this mean for the interpretation of speleothem biomarker records?, EGU General Assembly 2025, Vienna, Austria, 27 Apr–2 May 2025, EGU25-15460, https://doi.org/10.5194/egusphere-egu25-15460, 2025.

EGU25-16094 | ECS | Orals | CL1.2.3 | Highlight

A six-million-year speleothem derived clumped isotope temperature record of continental Eurasia 

Stuart Umbo, Sevasti Modestou, Thomas Opel, Franziska Lechleitner, Anton Vaks, Tzahi Golan, Andrew Mason, Jade Margerum, Ola Kwiecien, Alexandr Osintsev, and Sebastian Breitenbach

Our understanding of global temperature in the recent geological past is predominantly derived from oceanic proxies and modelling reconstructions1–3. Terrestrial proxy data, particularly in continental environments, is sparse and based largely on palaeobotanical and palaeozoological data which can be difficult to accurately date4.

We present approximately 30 temperature reconstructions over a six-million-year interval from Botovskaya Cave (N 55.3°, E 105.3°) in Siberia, ca. 300 km west of Lake Baikal. We provide chronological constraint with U-series techniques5 and multi-annual absolute temperature estimates from clumped isotope analyses of speleothems (carbonate cave deposits, e.g. stalagmites and flowstones). Clumped isotope analysis directly infers quantitative paleotemperature estimates, overcoming difficulties associated with conventional stable isotope (δ18O) techniques which require knowledge of the isotopic composition of carbonate precipitation waters – which is often unknown. By targeting subaqueous material, we overcome dis-equilibrium effects which have hindered widespread application of clumped isotopes to speleothems6,7.

Our record is the longest palaeotemperature timeseries from continental Eurasia and suggests a ca. 4 – 5°C temperature drop between the Messinian (7.24 – 5.33 Ma) and the present day, coincident with declining atmospheric carbon dioxide8, and in agreement with existing estimates of global temperature over the same interval9,10.

References

1. Clark, P. U. et al, Global and Regional Temperature Change over the Past 4.5 Million Years. Science (2024).

2. Herbert, T. D. et al. Late Miocene global cooling and the rise of modern ecosystems. Nat Geosci (2016).

3. Judd, E. J. et al. A 485-million-year history of Earth’s surface temperature. Science, (2024).

4. Bradshaw, C. D. et al. The relative roles of CO2 and palaeogeography in determining late Miocene climate: Results from a terrestrial model-data comparison. Climate of the Past (2012).

5. Mason, A. J. et al, Simplified isotope dilution approach for the U-Pb dating of speleogenic and other low-232Th carbonates by multi-collector ICP-MS. Geochronology (2022).

6. Daëron, M. et al. 13C18O clumping in speleothems: Observations from natural caves and precipitation experiments. Geochim Cosmochim Acta (2011).

7. Affek, H. P. et al, Glacial/interglacial temperature variations in Soreq cave speleothems as recorded by ‘clumped isotope’ thermometry. Geochim Cosmochim Acta (2008).

8. Rae, J. W. B., et al. Atmospheric CO2 over the past 66 million years from marine archives. Annual Review of Earth and Planetary Sciences. (2021).

9. Westerhold, T. et al. An astronomically dated record of Earth’s climate and its predictability over the last 66 million years. Science (2020).

10. Pound, M. J. et al, Global vegetation dynamics and latitudinal temperature gradients during the Mid to Late Miocene (15.97-5.33Ma). Earth-Science Reviews (2012).

How to cite: Umbo, S., Modestou, S., Opel, T., Lechleitner, F., Vaks, A., Golan, T., Mason, A., Margerum, J., Kwiecien, O., Osintsev, A., and Breitenbach, S.: A six-million-year speleothem derived clumped isotope temperature record of continental Eurasia, EGU General Assembly 2025, Vienna, Austria, 27 Apr–2 May 2025, EGU25-16094, https://doi.org/10.5194/egusphere-egu25-16094, 2025.

EGU25-16788 | Posters on site | CL1.2.3

Unveiling the biogeochemical role of bat guano in shaping cave morphology in the Madingou region, Republic of the Congo 

Pascale Lahogue, Nicy Bazebizonza, Sophie Verheyden, Mathieu Boudin, Florent Boudzoumou, and Imen Arfaoui

The research investigated cave deposits and stalagmites in two caves within the karst area of the Madingou region, Republic of the Congo, with a focus on biocorrosion features and guano deposits prevalent in these sites. A systematic inventory of biocorrosion features in the studied caves was complemented by geochemical analyses of sediments and corroded speleothems, providing valuable insights into the underlying processes. To monitor environmental conditions, a seasonally based approach was employed, involving temperature recording, punctual CO₂ measurements, and in-situ parameter monitoring during each sampling period. These efforts contribute to a detailed understanding of speleogenesis processes, particularly the influence of bat guano-induced corrosion.

Field studies revealed remarkable observations of cave morphology, highlighting intriguing biocorrosion features such as cupolas, guano-holes in the ground, and bell holes in the roof. These features closely resemble similar formations documented in other regions, including France and Slovakia. The observed elements have sparked reflections on their significance in the late morphological evolution of caves. Understanding the role of bat guano in shapingmorphology could shed light on the broader processes influencing cave evolution in various contexts.

Two samples were collected from the dark-colored superficial sediments, along with two core samples from monitored stalagmites and one sample from a corroded speleothem, all from two bordering caves in the Madingou region. These samples underwent elementary chemical analysis, revealing that the sediments contained 11% CaO and 24% P₂O₅, while the corroded speleothem exhibited 55% CaO and 47% P₂O₅. The high phosphate (P₂O₅) and calcium oxide (CaO) concentrations, confirm the direct impact of biocorrosion driven by bat guano on the evolution of cave features.

The process of biocorrosion is further supported by environmental parameters, including an elevated CO₂ concentration that vary between 480 and 500 ppm, higher than the atmospheric average (~400 ppm), and cave temperatures ranging between 19°C and 25°C. These conditions, which are ideal for microbial activity, accelerate the decomposition of bat guano and promote the formation of phosphoric acid and carbonic acid. These acids enhance carbonate dissolution and the precipitation of phosphate minerals, leading to significant chemical and structural alterations in the cave system over time. The impact of bat guano on cave evolution is also temporally contextualized by C-14 dating, which places the deposition of the superficial sediment layer at 1956 ± 28 BP. This dating aligns with a period of guano accumulation and biocorrosion activity, highlighting the longstanding influence of bat colonies on the cave's geochemical environment.

In summary, the high phosphate content within sediment and speleothems, carbonate corrosion, coupled with the radiocarbon-dated guano deposits, suggest that biocorrosion induced by bat guano decomposition has been a primary driver of recent cave morphology evolution in the Madingou region for at least two millennia. This biogeochemical activity reflects a dynamic interplay of biological and chemical processes under specific environmental conditions, resulting in both chemical modification and structural caves features reshaping.

How to cite: Lahogue, P., Bazebizonza, N., Verheyden, S., Boudin, M., Boudzoumou, F., and Arfaoui, I.: Unveiling the biogeochemical role of bat guano in shaping cave morphology in the Madingou region, Republic of the Congo, EGU General Assembly 2025, Vienna, Austria, 27 Apr–2 May 2025, EGU25-16788, https://doi.org/10.5194/egusphere-egu25-16788, 2025.

EGU25-17008 | Posters on site | CL1.2.3

Comparing climate variability with historical datasets from Cyprus: significance, strengths and limitations  

Carole Nehme and the ANR HIGH-PASM project

Comparing long-term climate variability with documentary data for the last millennium is challenging in regions where well-resolved natural records are lacking. In Cyprus, historical data of famine outbreaks, plagues and locust waves were retrieved from a variety of historical documents. These events are considered as societal indicators as they reflect the vulnerability of the Cypriot society towards environmental and climatic change from the late Lusignan’s to the Early British colonial period. The aim of this study within the HIGH-PASM project is to explore the relationship between local climate variability and locust waves, plagues and famine outbreaks.

An 8 cm-high actively growing stalagmite was collected from Hot cave in the Kyrenia range (Cyprus). U-Th dating and lamina counting were combined to produce an age model of the last ~700 years. We applied high-resolution stable isotopic (ẟ18O, ẟ13C) and trace element (Mg, Sr) analyses to establish climate proxy records and compare them to historical records and observational data. First, statistical analyses (normalization, volatility) were conducted on the isotope time-series to evaluate the intensity of humid/dry peaks and to identify periods with strong/weak fluctuations. Second, 875 recorded events were compiled from various historical sources (primary, secondary, compilations) and homogenized. Third, both natural (continuous) time-series and historical (discrete) data were compared using several statistical methods. 

The comparison between the occurrence of these three types of historical events shows that 36% of locust waves and famines occurred within the same year and a similar synchronicity was found between famines and plague outbreaks. Plagues and locust waves, however, did not occur significantly synchronously. Statistical analyses between the ẟ13C volatility index and the number of locust waves, plagues, and famines show whether certain combinations of dry/wet and volatile/non-volatile conditions promote any of the three different disasters. Early results show that all three types of events occurred during wet and non-volatile (low signal oscillation) periods. This is consistent with the ecological niches of Dociostaurus maroccanus (locust specie) and Yersinina pestis (zoonotic bacterium that causes plague) which require a slightly wet climate to proliferate. However, this applies less to famines, as many famines also occurred during dry periods (e.g., in the 19th century).

How to cite: Nehme, C. and the ANR HIGH-PASM project: Comparing climate variability with historical datasets from Cyprus: significance, strengths and limitations , EGU General Assembly 2025, Vienna, Austria, 27 Apr–2 May 2025, EGU25-17008, https://doi.org/10.5194/egusphere-egu25-17008, 2025.

EGU25-17146 | Posters on site | CL1.2.3

Constraining the climate of the Western Caucasus from the Late Pleistocene to Holocene through isotopic analysis of speleothems 

Manuel Rührer, Thomas Schneck, Olga Chervyatsova, Roman Dbar, Evgeniy Zakharov, Yuri Dublyansky, Christoph Spötl, and Jonathan Baker

Global climate evolution since the Last Glacial Maximum is well understood but large areas of continental Eurasia are still underrepresented, masking regional disparities. While some regions have high-resolution paleoclimate records, there are significant spatial and seasonal differences in reconstructed trends, particularly with regard to Early Holocene temperature. The Western Caucasus region of the Eastern Black Sea margin, comprising modern Russia and Georgia, is of high historical and archeological significance with abundant Paleolithic sites. It served as a corridor for migration and settlement of early modern humans and Neanderthal alike, influencing the development of agriculture and major cultural achievements. Although the abundance of limestone caves within the rich karst terrain provides ample opportunity for paleoclimatic reconstruction from speleothem analysis, this approach has scarcely been utilized. Here we present novel speleothem records from three caves—Vorontsovskaya, Novoafonskaya, and Abrskil—that collectively span the last 34,000 years with minor hiatuses.

By analyzing high-resolution stable isotope data (δ¹⁸O, δ¹³C) from speleothems in these caves, we aim to evaluate the regional response to major climate events from the Late Pleistocene to the Holocene. Our approach involves high-precision Uranium-Thorium dating and micromilling for isotopic analysis corresponding to multidecadal resolution. Preliminary results indicate semi-continuous data, which will allow us to identify key perturbations and trends, such as the Younger Dryas, Heinrich, and Dansgaard-Oeschger events. These will be correlated with other regional and global data sources to provide a clearer picture of past regional climate dynamics and their connection to global climate trends. Understanding the climatic conditions and moisture sources—such as influences from the Black Sea via westerly wind systems, Mediterranean, and continental sources—may help clarify the susceptibility of regional agriculture to drought while contributing to a better understanding of global climate evolution. Additionally, identifying the link between regional climate processes and larger-scale climatic shifts can provide valuable insights for predicting future climate scenarios in the region.

How to cite: Rührer, M., Schneck, T., Chervyatsova, O., Dbar, R., Zakharov, E., Dublyansky, Y., Spötl, C., and Baker, J.: Constraining the climate of the Western Caucasus from the Late Pleistocene to Holocene through isotopic analysis of speleothems, EGU General Assembly 2025, Vienna, Austria, 27 Apr–2 May 2025, EGU25-17146, https://doi.org/10.5194/egusphere-egu25-17146, 2025.

EGU25-17668 | Posters on site | CL1.2.3

Floods and water availability reconstructions from speleothems through Laser-induced break down spectrometry (LIBS) with implications for archaeological work and citizen engagement in the UNESCO global geopark Famenne-Ardenne.  

Sophie Verheyden, Christian Burlet, Serge Delaby, Hai Cheng, Xue Jia, Possum Pincé, Koen Deforce, Christophe Snoeck, Philippe Crombé, Hans Vandendriessche, Hannah Leonard, Giacomo Capuzzo, Matthieu Boudin, and Marine Wojcieszak

Our work on a speleothem in the Hotton cave reveals a 5000-year record of past floods in the Hotton cave through deposition of detrital layers in a flowstone covered by mud during the exceptional 2021 flood. The palaeorecord reveals other such exceptional floods around 1550 CE (Common Era), 30 CE and 350 BCE (Before Common Era). Further down, a period between 3.3 BCE and 2.6 BCE shows ‘dirty calcite’ with several smaller detrital layers indicating a period with much more regular floods. In the frame of the Leap Project (learning from the past - The impact of abrupt climate changes on society and environment in Belgium - www.leap-belgium.be), we investigate possible relations between the environmental  changes and past human activities. In order to construct high resolution trace element curves as a proxy for past water availability, a procedure for LIBS analysis of speleothems is set up at the Institute of Natural Sciences in Brussels, Belgium. A 2D spectral image of a few millimeters broad is taken along the growth axis of the speleothem. A curve is constructed by averaging the data along horizontal lines of the 2D analysis. It is a rapid and minimal destructive method to obtain trace elemental curves of Mg, Sr, Ba, and other elements such as Pb, Cu, Zn,.. Up to now the method is rather qualitative, but a semi-quantitative analysis is in progress.

The interest of these climate and environmental related data, is that they are very visual, concrete traces of past climate changes. Speleothems and their records of floods are a strong educational tool for citizens that feel not concerned about climate change. The dissemination of our results through events organized by the UNESCO Global Geopark Famenne-Ardenne aims at engaging inhabitants with climate science and awareness.

How to cite: Verheyden, S., Burlet, C., Delaby, S., Cheng, H., Jia, X., Pincé, P., Deforce, K., Snoeck, C., Crombé, P., Vandendriessche, H., Leonard, H., Capuzzo, G., Boudin, M., and Wojcieszak, M.: Floods and water availability reconstructions from speleothems through Laser-induced break down spectrometry (LIBS) with implications for archaeological work and citizen engagement in the UNESCO global geopark Famenne-Ardenne. , EGU General Assembly 2025, Vienna, Austria, 27 Apr–2 May 2025, EGU25-17668, https://doi.org/10.5194/egusphere-egu25-17668, 2025.

EGU25-18074 | Posters on site | CL1.2.3

Cryogenic carbonate synthesis by controlled solution freezing 

Péter Németh, Attila Demény, Anett Lázár, Gabriella Koltai, Yuri Dublyansky, and Christoph Spötl

Cave carbonates offer insights into past environmental and climate change. A unique type of these deposits, cryogenic cave carbonates (CCCs), form by a mechanism known as cryogenic crystallization. CCCs may form through: (1) rapid freezing of thin water films on ice surfaces, creating small crystals (typically, <1 mm), and (2) slow freezing of water in pools, creating larger crystals (up to several cm in size). These two types of CCC show distinct stable isotope compositions. From a paleoclimatological point of view, CCCs of the second type are an indicator of past permafrost conditions1. However, the details of their formation are still not fully understood, as no actively forming CCCs of this type have been observed in nature.

To study how the freezing proceeds and how it influences the geochemical signature and morphology of the cryogenic crystallization products, we employed several methods for forming cryogenic carbonates under controlled conditions in the laboratory. (1) Cryogenic carbonates were produced via bottom-up solution freezing, by lowering a plastic bottle filled with a Ca-bicarbonate solution into a -15 °C medium. The freezing times for the bottom and top layers varied between three and ten hours. (2) Cryogenic carbonates were also precipitated from a saturated Ca-bicarbonate solution via slow (several days) and uniform freezing at -2 °C in a freezer. To control the direction of freezing and enhance the top-down freezing process, the flask containing the bicarbonate solution was placed in an insulated box. After the experiments, the first- and last-formed carbonates were separated by sampling of the formed ice. Marked differences in the crystal size and the oxygen and carbon isotope compositions of the first- and last-formed carbonates were observed. The δ13C and δ18O values of synthetic cryogenic carbonates align with the field of the fast-forming natural CCCs. However, when compared with parent solutions, they are closer to the values of the field of CCCs² forming in freezing pools. The results highlight the importance of knowing the C isotopic composition of the solution’s dissolved inorganic carbon in isotope-based classification of CCCs, and are relevant for understanding the environment in which CCCs form.

We acknowledge the financial support of the NKFIH ANN141894 grant.

References:

1 Žák, K., Onac, B.P., Kadebskaya, O., Filippi, M., Dublyansky, Y., Luetscher, M. (2018): Cryogenic mineral formation in caves, in: Perşoiu, A., Lauritzen, S.-E. (Eds.), Ice Caves, 123-162, Elsevier, Amsterdam.

2 Spötl, C., Koltai G. & Dublyansky Y. (2023) Mode of formation of cryogenic cave carbonates: Experimental evidence from an Alpine ice cave. Chemical Geology, 638, 121712. DOI: 10.1016/j.chemgeo.2023.121712.

How to cite: Németh, P., Demény, A., Lázár, A., Koltai, G., Dublyansky, Y., and Spötl, C.: Cryogenic carbonate synthesis by controlled solution freezing, EGU General Assembly 2025, Vienna, Austria, 27 Apr–2 May 2025, EGU25-18074, https://doi.org/10.5194/egusphere-egu25-18074, 2025.

EGU25-18153 | ECS | Posters on site | CL1.2.3

Sterol Biomarkers for Paleoenvironmental and Anthropogenic Tracing in Speleothems 

Johanna Schäfer and Thorsten Hoffmann

Speleothems, renowned for their potential as continuous paleoenvironmental archives spanning thousands of years, are particularly valuable due to reliable age determination via the 230Th/U230Th/U-method. The closed-system nature of cave environments and the chemical stability of speleothems allow for the preservation and analysis of organic substances alongside traditional proxies such as stable isotopes and trace elements. Among organic compounds, sterols emerge as promising biomarkers owing to their chemical stability in oxygen-limited environments, and distinct origins from plants, animals, and microbial processes.

Cholesterol and sitosterol, representing sterols derived from animals and plants, respectively, are precursors to stanols, which are microbially reduced sterols, often traceable to faecal inputs. Notably, coprostanol serves as a key marker for human activity due to its predominance in human faeces. Despite the widespread application of sterol-based biomarkers in soil and sediment studies, their use in speleothem research remains nascent, largely due to the challenges posed by the complex mineral matrix and low concentrations of organic analytes.

To overcome these obstacles, a method combining stir bar sorptive extraction (SBSE) with a polydimethylsiloxane (PDMS) phase was developed, following acid dissolution of speleothem samples. Subsequent analysis was performed using high-performance liquid chromatography coupled with atmospheric pressure chemical ionization high-resolution orbitrap mass spectrometry (HPLC-APCI-HRMS), which provides exceptional resolution and sensitivity. This novel methodology not only enhances the extraction and analysis of sterols from speleothems but also establishes a pathway for expanding their use in paleoenvironmental and anthropogenic reconstructions.

How to cite: Schäfer, J. and Hoffmann, T.: Sterol Biomarkers for Paleoenvironmental and Anthropogenic Tracing in Speleothems, EGU General Assembly 2025, Vienna, Austria, 27 Apr–2 May 2025, EGU25-18153, https://doi.org/10.5194/egusphere-egu25-18153, 2025.

Calcium isotopes (δ44Ca) in speleothems are thought to solely record changes in prior carbonate precipitation (PCP) along the seepage water flowpath. This unique sensitivity makes  d44Ca a useful tool for both reconstructing past hydroclimate and exploring the influence of PCP on other proxies where it can be one of several influences. Here we present δ44Ca records for two partially coeval stalagmites from Lake Shasta Caverns (LSC) in northern California that grew between 37,000 and 14,000 years BP. Both δ44Ca records display similar mean values and temporal variations, and significant positive correlations with δ13C (r = 0.74, 0.73) and δ18O (r =0.49, 0.77), suggesting PCP also influences these traditional stable isotope proxies. However, neither stalagmite displays significant correlations between d44Ca and trace element proxies (Mg/Ca, Sr/Ca, Ba/Ca) indicating these do not solely reflect PCP at this site.

LSC sits on the boundary between two hydroclimate regimes in the northwestern and southwestern United States (US). Stalagmite δ44Ca and δ13C suggest wetter conditions during warm Dansgaard-Oeschger interstadials, similar to paleoclimate archives from the Pacific northwest. However, LSC proxies also indicate wet conditions during colder Heinrich Stadials, similar to archives from the US southwest. Values for the fraction of Ca remaining in solution after PCP (f) calculated using a Rayleigh fractionation model for δ44Ca calibrated with modern monitoring data indicate that 0 to ~60% of dissolved Ca is lost to PCP. We compare stalagmite f values with modern PCP rates and measured rainfall to generate quantitative estimates of past rainfall. However, unreasonable f values during the wettest intervals indicate that the calcite-water calcium isotopic fractionation factor may have varied in the past, particularly during intervals of faster stalagmite growth. Using calculated f values, we estimate the δ13C of dissolved inorganic carbon prior to PCP which agrees with modern dripwater values. Notably, these δ13C estimates are higher during wetter warm interstadials and cold Heinrich Stadials, when PCP is lowest. This suggests that during wet intervals, seepage water has little time to equilibrate with soil CO2 leading to lower carbonate saturation and less PCP, likely a result of sparse soils and steep terrane above LSC. 

How to cite: Oster, J., Scarpitti, E., de Wet, C., and Griffith, E.: Calcium isotope ratios (δ44Ca) in coeval California stalagmites record hydroclimate shifts and reveal soil-to-cave carbon transformations during the last glacial period, EGU General Assembly 2025, Vienna, Austria, 27 Apr–2 May 2025, EGU25-20160, https://doi.org/10.5194/egusphere-egu25-20160, 2025.

EGU25-20167 | Posters on site | CL1.2.3

Novel proxy constraints on subglacial speleothem growth in the Northern Alps bounding the MIS-11 Interglacial 

Jonathan Baker, Gina Moseley, Alexandre Honiat, Peter Wynn, R. Lawrence Edwards, and Christoph Spötl

Late Pleistocene climate of the European Alps was characterized by orbitally forced, high-magnitude oscillations in temperature and glacial ice extent. Beyond the Last Glacial Maximum, however, the geographic extent of continental glaciation is notably difficult to constrain, due to the erosion and reworking of associated surficial deposits. Subglacial speleothem growth occurs when warm-based ice sheets cover karst terrain, providing a thermal buffer to ground temperature and a source of liquid water infiltration. In place of carbonic-acid dissolution from the soil zone, the oxidation of sulfide minerals provides a source of acidity to facilitate carbonate dissolution and vadose-zone precipitation. The proxy identification of subglacial processes can therefore serve to constrain ice-sheet evolution from absolutely dated speleothems, but these techniques have yet to be systematically developed. Herein we present a novel composite record of climatic change across MIS-12, -11, and -10 from three stalagmites in Klaus Cramer Cave, a high-elevation site located in the northern Alps of western Austria. Stable-isotope values of oxygen (carbon) are low (high) during glacial episodes that bound the MIS-11 interglacial. When warm-based ice is likely to be present above the cave, δ13C exceeds +4‰, signaling that sulfuric-acid dissolution became dominant in the epikarst. To investigate this process further, we measured δ34S and δ18O in speleothem sulfate, which confirm that pyrite was the primary sulfur source and elucidate redox conditions in both subglacial and soil-dominated systems. Glacial periods also exhibit abrupt and dramatic contrasts to MIS-11 with regard to major- and trace-element concentrations, including a ~20-fold increase in sulfur concomitant with elevated Mg and Sr. This pattern is consistent with a marked increase in prior calcite precipitation associated with sulfuric-acid dissolution that would have elevated initial Ca2+ in the system. Finally, we assess trace elements in the context of provenance analysis as a potential indicator of enhanced glacial weathering at the ice-rock interface. Collectively, this suite of geochemical proxies can identify precisely when warm-based ice advanced or retreated across the specific location and elevation of Klaus Cramer Cave in the total absence of evidence from conventional glacial geomorphology.

How to cite: Baker, J., Moseley, G., Honiat, A., Wynn, P., Edwards, R. L., and Spötl, C.: Novel proxy constraints on subglacial speleothem growth in the Northern Alps bounding the MIS-11 Interglacial, EGU General Assembly 2025, Vienna, Austria, 27 Apr–2 May 2025, EGU25-20167, https://doi.org/10.5194/egusphere-egu25-20167, 2025.

EGU25-20198 | ECS | Orals | CL1.2.3

Climate instability in the European Alps across MIS 10 and 11 

Alexandre Honiat, Jonathan Baker, Martin Trüssel, R. Lawrence Edwards, and Christoph Spötl

The MIS 10 glacial period was characterized by vast ice sheets and cold climates, but reconstructing its history is challenging due to erosion and burial under modern glaciers. In contrast, the preceding MIS 11 interglacial lacks clear markers for some substages, despite its well-defined peak. As MIS 11 is often considered a partial analogue to the Holocene, understanding its transition into MIS 10 could provide valuable insights into future climate scenarios.

Research on MIS 10 and MIS 11a/b is limited by their temporal remoteness and the scarcity of well-preserved records. While studies tend to focus on more recent ice ages, terrestrial data such as lake sediments and loess sequences are rare. Although ice cores offer detailed records, they primarily cover younger periods. Subglacial speleothems, however, have emerged as a valuable alternative, providing high-resolution, U/Th dated archives even for older glacial climates.

This study examines subglacial speleothems from the Schratten karst in Switzerland’s Melchsee-Frutt region. Stable-isotope data reveal distinct patterns: stable signals during warm interglacial periods and unstable signals during colder phases, linked to moisture sources from the North Atlantic. These findings provide the first high-resolution reconstruction of MIS 10 and MIS 11a/b climate events for this region.

The study highlights the underexplored potential of subglacial speleothems as critical tools for studying glacial-interglacial transitions and improving our understanding of ancient climates, with implications for future scenarios.

How to cite: Honiat, A., Baker, J., Trüssel, M., Edwards, R. L., and Spötl, C.: Climate instability in the European Alps across MIS 10 and 11, EGU General Assembly 2025, Vienna, Austria, 27 Apr–2 May 2025, EGU25-20198, https://doi.org/10.5194/egusphere-egu25-20198, 2025.

This study synthesizes Holocene palaeoclimatic variability in the Kachchh region, Western India, and its profound influence on human inhabitation, driven primarily by the dynamics of the Indian Summer Monsoon (ISM). A review of multi-proxy records from three key zones—the Rann, Kachchh Mainland, and coastal regions—provides insights into the climatic evolution of the region during the Holocene. The palaeoclimatic shifts, often intertwined with sea-level changes, profoundly influenced human settlement patterns, adaptive strategies, and the socio-cultural fabric of ancient societies. Our analysis highlights the significant role of climatic variability in the decline of Harappan cultural centres, such as, Dholavira, Kanmer and Khirsara. The widespread aridification observed during the Late Holocene, likely triggered by weakening monsoon activity, led to the desiccation of rivers, retreat of seawater, and eventual site abandonment. These environmental stresses undermined the sustenance of advanced civilizations, emphasizing the critical link between climate dynamics and human resilience. Despite these findings, a comprehensive understanding of coastal adaptations and the impacts of sea-level fluctuations on ancient settlements remains elusive. This calls for systematic investigations of coastal archives to unravel the nuanced interactions between palaeoclimate, sea-level changes, and human responses. Continental records, on the other hand, provide robust proxies for deciphering monsoonal variability and its implications for the broader ecological and cultural landscape of Gujarat. In summary, the Kachchh region exemplifies a dynamic palaeoecological domain, where Holocene climatic and environmental changes played a pivotal role in shaping human history. This synthesis underscores the need for integrated, multi-proxy approaches to further elucidate the complex interplay between climate, environment, and ancient societies in this climatically sensitive dryland region.


How to cite: Das, A.: A synthesis of the Early to Late Holocene palaeoclimate variability from the dryland region of Kachchh, Western India and its impact on human inhabitation, EGU General Assembly 2025, Vienna, Austria, 27 Apr–2 May 2025, EGU25-390, https://doi.org/10.5194/egusphere-egu25-390, 2025.

The Holocene temperature history and its forcing mechanisms remain elusive due to the conflict between proxy reconstructions and model simulations. Recently, this model-data inconsistency has been partly attributed to the seasonal bias in the proxy indicators. This study attempts to assess changes in the seasonal variability of sea surface temperature in the low-latitude western Pacific since the Last Glacial Maximum (LGM), based on the standard deviation of oxygen isotope (δ18O) measured from individual planktonic foraminifera at four sites. The reconstructed temperature seasonality shows interhemispheric trends since the LGM, increasing in the Northern Hemisphere and decreasing in the Southern Hemisphere from the LGM to the early Holocene, then reversing towards the late Holocene. And we find that the meridional gradient in the amplitudes of temperature seasonality was similar to today, which is consistent with the orbital insolation forcing. Combining with the model outputs from transient simulations (Trace-21ka), we suggest that temperature seasonality of the west Pacific warm pool appears to be controlled solely by precession, and shows no evident response to changes in global ice volume and atmospheric CO2 levels. According to our reconstruction, if proxies from tropical-subtropical oceans tended to record warm season temperature changes as proposed by previous studies, they would cause the ‘Thermal Maximum’ phenomenon during the early-mid Holocene.

How to cite: Yuan, Z. and Huang, E.: Precession Control of Temperature Seasonality Changes in the West Pacific Warm Pool since the Last Glacial Maximum, EGU General Assembly 2025, Vienna, Austria, 27 Apr–2 May 2025, EGU25-521, https://doi.org/10.5194/egusphere-egu25-521, 2025.

EGU25-1547 | Orals | CL1.2.5

The Holocene thermal maximum in the North American Arctic 

Konrad Gajewski and Camille Tamo

Global databases of Holocene paleoclimates have been assembled, but these contain few data from the north American Arctic, especially from the High- and Mid-Arctic zones. A series of lake sediment cores from across the North American Arctic as well as data on treeline variations have been analyzed for several different proxy-climate data. The results show longitudinal differences in the timing of the maximum temperatures, with transitions synchronous across the North American Arctic, although not necessarily in the same direction. For example, at 8.2ka, the western and central Arctic cooled, but eastern Arctic and northern Greenland warmed. This space-time pattern of the Holocene Thermal Maximum (HTM) can be attributed to changes in the atmospheric circulation in response to the melting ice sheet, changes in the local energy balance in response to orbital insolation changes and other forcing.

The impacts of these changes on Arctic ecosystems are subtle but noticeable. Multiple proxies from the same core or from nearby lakes sometimes show coherent changes but at other times differences. For terrestrial ecosystems, biodiversity seems less affected by warmer conditions than biological production, which increased during local HTM. Periods of warm conditions and high terrestrial plant production were associated with a decrease in diatom production (as measured by accumulation rates) in some sites, and in some cases, with an absence of diatoms in the sediments (diatom-free zones), for reasons not yet clear. Secondary production of chironomid communities living in the lake sediments was sometimes coherent with diatom production, but not at other times.

How to cite: Gajewski, K. and Tamo, C.: The Holocene thermal maximum in the North American Arctic, EGU General Assembly 2025, Vienna, Austria, 27 Apr–2 May 2025, EGU25-1547, https://doi.org/10.5194/egusphere-egu25-1547, 2025.

EGU25-1812 | Orals | CL1.2.5

The Holocene Seasonal Temperature Conundrum 

Zhengyu Liu, Jun Cheng, Yukun Zheng, Wengchao Zhang, Hongyan Liu, Haibin Wu, Jiang Zhu, and Shucheng Xie

Last decade has seen greatly intensified interest in understanding the temperature evolution in the Holocene (~last 10,000 years), which provides the background climate for our ongoing anthropogenic global warming.  Much of the effort so far has focused on the mean annual temperature (MAT). The so called Holocene temperature conundrum still remains unresolved: has the global MAT exhibited a cooling trend as indicated in most proxy reconstructions, or a warming trend in response to increased concentration of greenhouse gases and retreating ice sheet as in most climate models. Here, we further point out a conundrum on the Holocene seasonal temperatures in the Northern Hemisphere extra-tropics: in comparison with a simple analogue model that predicts the seasonal cycle of temperature from insolation based on present observations, most available seasonal temperature reconstructions severely underestimate the decrease of seasonal cycle amplitude in the Holocene. Meanwhile, a newly developed set of summer and annual temperature reconstructions based on soil bacteria’s membrane lipids (branched glycerol dialkyl glycerol tetraethers (brGDGT)) exhibits an evolution pattern similar to the analogue model. Our study highlights the current uncertainty in seasonal temperature reconstructions, with implications to the MAT.


How to cite: Liu, Z., Cheng, J., Zheng, Y., Zhang, W., Liu, H., Wu, H., Zhu, J., and Xie, S.: The Holocene Seasonal Temperature Conundrum, EGU General Assembly 2025, Vienna, Austria, 27 Apr–2 May 2025, EGU25-1812, https://doi.org/10.5194/egusphere-egu25-1812, 2025.

EGU25-2040 | ECS | Posters on site | CL1.2.5

Precipitation reconstruction in the Asian monsoon region during the 4.2 ka BP event with paleoclimate data assimilation 

Fangmiao Xing, Liang Ning, Zhengyu Liu, Jian Liu, Mi Yan, Weiyi Sun, and Qin Wen

The 4.2 ka BP event is a pronounced climate event in the Holocene. Since this climate episode was associated with the collapse of several ancient civilizations in many sites worldwide such as Neolithic cultures in China, Ancient Egypt, and Indus Valley civilizations, it has been widely studied in recent years. However, the spatial distribution of precipitation is still controversial in some regions like eastern China. In this study, we use the offline ensemble Kalman filter (OEnKF) data assimilation (DA) method, combining the high-resolution δ18O from speleothems and iTraCE model data which simulates the water isotope, to reconstruct precipitation δ18O and precipitation in the Asian monsoon region during the 4.2 ka BP event. In our DA reconstruction, the precipitation during the 4.2 ka BP event shows a dry pattern from North China to Southwest China and India, and a wet pattern in the middle and lower Yangtze River.

How to cite: Xing, F., Ning, L., Liu, Z., Liu, J., Yan, M., Sun, W., and Wen, Q.: Precipitation reconstruction in the Asian monsoon region during the 4.2 ka BP event with paleoclimate data assimilation, EGU General Assembly 2025, Vienna, Austria, 27 Apr–2 May 2025, EGU25-2040, https://doi.org/10.5194/egusphere-egu25-2040, 2025.

The Korea Strait, located along the pathway of Pacific typhoons, contains well-preserved storm surge deposits that provide critical insights into past typhoon activity and climate variability. This study investigates Late Holocene typhoon dynamics through the analysis of sediment facies and radiocarbon (14C) AMS-dated piston core sediments from the Korea Strait Shelf Mud (KSSM) deposit off southeastern Korea. Significant changes in storm surge deposit characteristics are observed approximately 400 cal yr BP, with younger deposits containing thicker layers of sand or shell fragments. Deposits from deeper water cores are notably thicker than those from shallower coastal cores, indicating variations in sedimentation processes linked to typhoon events. These changes suggest variations in typhoon strength or riverine sediment input, possibly linked to typhoon-driven heavy rainfall. These findings contribute to our understanding of typhoon variability and climate dynamics in the Korea Strait region over the past 600 years during the late Holocene.

How to cite: Chun, J.-H. and Um, I. K.: Variability in Late Holocene typhoon activity in the Korea Strait: Insights from marine core records, EGU General Assembly 2025, Vienna, Austria, 27 Apr–2 May 2025, EGU25-2990, https://doi.org/10.5194/egusphere-egu25-2990, 2025.

EGU25-5133 | Orals | CL1.2.5

Enhanced frequency of multi-year El Niño-Southern Oscillation across the Holocene 

Zhengyao Lu, Anna Schultze, Matthieu Carré, Christopher M Brierley, Peter O Hopcroft, Debo Zhao, Minjie Zheng, Pascale Bracconot, Qiuzhen Yin, Johann Jungclaus, Xiaoxu Shi, Haijun Yang, and Qiong Zhang

The El Niño-Southern Oscillation (ENSO) events that persist and develop for a second year or beyond (multi-year) are relatively rare. Compared to single-year events they create higher cumulative impacts and are linked to extended periods of extreme weather events worldwide. Past ENSO variations help us to better understand and anticipate how multi-year ENSO may change in the future. Here we combine proxy data reconstructions with a multi-model ensemble of climate simulations to investigate the evolution of multi-year ENSO during the Holocene (about 11,700 years ago to the present day), when the global annual mean climate was relatively stable and mainly driven by seasonal distribution of insolation. We find that the ratio of multi-year El Niño and La Niña to single-year events increased by a factor of 5, associated with a longer ENSO period (from 3.5 to 4.1 years) over the past ~7,000 years in monthly-resolved fossil coral oxygen isotope reconstructions from the equatorial central Pacific. This change is verified qualitatively by comparison with a subset of transient Holocene model simulations with a more realistic representation of ENSO periodicity. More frequent multi-year ENSO and prolonged ENSO period are caused by a shallower thermocline and stronger upper ocean stratification in the tropical Eastern Pacific towards the present day. The sensitivity of ENSO duration to orbital forcing provides a warning signal highlighting the urgency of minimising anthropogenic influence which could accelerate the long-term trend towards more persistent ENSO damages.

How to cite: Lu, Z., Schultze, A., Carré, M., Brierley, C. M., Hopcroft, P. O., Zhao, D., Zheng, M., Bracconot, P., Yin, Q., Jungclaus, J., Shi, X., Yang, H., and Zhang, Q.: Enhanced frequency of multi-year El Niño-Southern Oscillation across the Holocene, EGU General Assembly 2025, Vienna, Austria, 27 Apr–2 May 2025, EGU25-5133, https://doi.org/10.5194/egusphere-egu25-5133, 2025.

EGU25-5444 | ECS | Orals | CL1.2.5

Unraveling proxy noise and climate signal in paleotemperature records: a replicate study in the northwest Pacific 

Ru-Yun Tung, Sze Ling Ho, Yoshimi Kubota, Masanobu Yamamoto, Jens Hefter, and Chuan-Chou Shen

Geochemical proxies are used to reconstruct changes in sea surface temperature (SST) prior to the instrumental era. However, proxy records can be influenced by non-climatic factors, including instrumental errors and sediment heterogeneity, which introduce uncertainty and further complicate the interpretation. To decipher the climate signal and noise from proxy reconstructions, here we assess the replicability of two commonly used SST proxies, foraminiferal Mg/Ca and UK’37, by analyzing records from four nearby sediment cores in the northern Okinawa Trough collected from a radius of 10 km. The results show that all records of the same proxy type display consistent glacial-interglacial trends but differ in the degree of high-frequency variability across sites in Mg/Ca records. This variability cannot be reproduced among sites, thus may reflect uncertainties in instrumental analysis or sedimentary heterogeneity rather than actual SST changes. In addition, this variability contributes to differing inter-proxy deviations across sites, demonstrating that proxy uncertainty may influence comparisons between proxies. Despite this, averaging proxy records reveals a systematic offset between Mg/Ca and UK’37. One possibility is that the discrepancy arises from different seasonal productions, as supported by modern proxy observations and the closer alignment of UK’37 with model-derived annual mean temperatures compared to Mg/Ca. However, Mg/Ca is influenced by non-thermal factors which, if taken into account, can also resolve the aforementioned discrepancy between proxies. Overall, our findings indicate that the first-order glacial-interglacial patterns in paleotemperature records are reproducible among sites, but Mg/Ca records exhibit additional high-frequency variability that may reflect proxy noise. These results may be site-specific due to the core sites being located in the depocenter of a small basin, highlighting the need for replicate studies in diverse depositional settings. Data-model comparisons can refine interpretations of proxy records. We encourage models to account for sedimentation processes, enabling more precise quantification of the impact of sedimentary heterogeneity. This approach will improve the robustness of data-model comparisons and provide a more comprehensive framework for reconstructing past climate variability.

How to cite: Tung, R.-Y., Ho, S. L., Kubota, Y., Yamamoto, M., Hefter, J., and Shen, C.-C.: Unraveling proxy noise and climate signal in paleotemperature records: a replicate study in the northwest Pacific, EGU General Assembly 2025, Vienna, Austria, 27 Apr–2 May 2025, EGU25-5444, https://doi.org/10.5194/egusphere-egu25-5444, 2025.

EGU25-6713 | ECS | Orals | CL1.2.5

Spectral divergence in hydroclimate and temperature between models and reconstructions  

Thomas Pliemon, Nathan Steiger, Thomas Laepple, Kira Rehfeld, and Raphaël Hébert

The relatively short observational record limits our ability to understand the long-term variability of key climate factors like temperature and hydroclimate. Climate models and paleoclimate proxies appear to have long-term temperature variabilities that diverge from each other at local and long time scales. But it is unclear whether these divergences also apply to hydroclimate and whether long-term hydroclimate variability is fundamentally different than temperature variability.

Here we evaluate the long-term variability over the Common Era of temperature and hydroclimate using a climate model (the Community Earth System Model-Last Millennium Ensemble, CESM-LME) and a paleoclimate reconstruction based on this model (the Paleo Hydrodynamics Data Assimilation product, PHYDA); this framework allows us to see how a model’s long-term climate variability is affected by informing it with proxy data. We specifically focus our analyses on the continuum of temperature (tas) and the Palmer Drought Severity Index (PDSI) in four regions of low reconstruction uncertainty: the Western USA, the Eastern USA, Central Europe, and Scandinavia.

Using the power-scaling exponents β from the relationship S(τ) τβ, where S denotes the power spectral density (PSD) and τ the period, we find universally higher values of β in PHYDA (except for tas globally); in these four regions PHYDA’s β values are 0.30 to 0.63 higher than CESM-LME. Thus, long range dependence behavior is more pronounced in PHYDA than in the CESM-LME model. We find that PHYDA has different spatial distributions of β than CESM-LME. We also find that hydroclimate is spectrally flatter than temperature in CESM-LME, whereas temperature and hydroclimate β-values are comparable in PHYDA. These results show that CESM-LME’s hydroclimate and temperature is less dominated by long timescales compared to PHYDA’s. The robustness of the low-frequency variability signal in PHYDA was verified by performing pseudoproxy experiments. Furthermore, preliminary results of other temperature DA reconstructions over the Holocene and since the Last Glacial Maximum also reveal spectral divergencies with model data. In particular, for the PSD of the global mean temperatures, higher beta values were obtained for the reconstructions compared to the model data, indicating a deficit in simulated low-frequency.

How to cite: Pliemon, T., Steiger, N., Laepple, T., Rehfeld, K., and Hébert, R.: Spectral divergence in hydroclimate and temperature between models and reconstructions , EGU General Assembly 2025, Vienna, Austria, 27 Apr–2 May 2025, EGU25-6713, https://doi.org/10.5194/egusphere-egu25-6713, 2025.

This study explores the relationship between dinoflagellate cyst (dinocyst) assemblages and the mixed layer depth (MLD) using canonical correspondence analyses. Our results demonstrate that wintertime deepening of MLD, in response to deep convection events, can influence dinocyst assemblages and especially the relative abundance of Nematosphaeropsis labyrinthus, which can thus be used as a proxy of MLD and the associated deep convection intensity. We analyzed a total of 24 Holocene records of N. labyrinthus percentage in the subpolar North Atlantic, along with quantitative reconstructions of MLD from 16 of them using the entire assemblage. The results reveal a westward migration of potential deep convection region around 6 ka BP, from the Nordic Seas and eastern subpolar gyre (SPG) during the Early Holocene, to the western to central SPG during the Middle and Late Holocene. The intensification of deep convection in the Labrador Sea towards a modern-like situation started during the Late Holocene, one or two thousand years later than the major transition around 6 ka BP in other parts of the subpolar North Atlantic. These results strengthen the hypothesis of reduced deep-water formation in the eastern North Atlantic from the Early to Late Holocene. Next, we will attempt to simulate the MLD in the North Atlantic at 6 ka BP using a regional configuration of the NEMO (Nucleus for European Modelling of the Ocean) ocean model, which includes the Arctic and the Northern Hemisphere Atlantic (ANHA) at 1/4 degree. The comparison of numerical simulations with various proxy reconstructions will allow us to explore potential drivers of this westward migration pattern around 6 ka BP.

How to cite: Wu, X. and de Vernal, A.: Migration of deep convection center in subpolar North Atlantic around 6 ka suggested by a dinocyst proxy of mixed layer depth, EGU General Assembly 2025, Vienna, Austria, 27 Apr–2 May 2025, EGU25-7302, https://doi.org/10.5194/egusphere-egu25-7302, 2025.

EGU25-8922 | ECS | Posters on site | CL1.2.5

Holocene Evolution of the Indian Summer Monsoon: Insights from Proxy-Model Comparisons on the Thar Desert Margin 

Aakanksha Kumari, Yama Dixit, and William Defliese

The margins of the Thar Desert, which supported dense populations approximately 5000 years ago, are now among the most vulnerable regions to projected future climate change. Paleoclimate records from this region reveal diverse climate histories, reflecting varying sensitivities to monsoonal changes. These variations underscore the importance of comprehensive paleoclimate reconstructions to understand better the complexities of the Indian Summer Monsoon (ISM) at regional scales.

This study investigates the Holocene evolution of the Indian Summer Monsoon (ISM) and its implications for the environmental history of the Thar Desert margin through a comparative analysis of proxy-based reconstructions and simulation results from the Paleoclimate Modelling Intercomparison Project (PMIP). Sediment cores were collected from two lakes at the desert margins, including Karanpura (northern margin) and Raiwasa (eastern margin). For proxy reconstruction using the lake sediments, stable oxygen and carbon isotope analyses of ostracod shells were analysed along with geochemical and sedimentological techniques, including X-ray fluorescence (XRF), Loss on Ignition (LOI), bulk sediment analysis (C/N, TOC), and grain-size analysis to apply a multi-proxy framework to ensure robust findings. Chronologies were established using radiocarbon dating and Optically Stimulated Luminescence (OSL) dating.

Reconstructed monsoon variability was compared with PMIP model outputs, with a focus on key climatic events like the Holocene Climate Optimum, and abrupt climatic events such as the 8.2 ka event, 4.2 ka event, the Little Ice Age (LIA), and the Medieval Climate Anomaly (MCA). Model performance was validated against historical simulation runs (1850–2014 CE) using the Global Precipitation Climatology Centre (GPCC) dataset. Results indicate increased precipitation along the Thar Desert margin during the mid-Holocene, inferred from proxy evidence of high lake levels, intense weathering, and elevated organic matter. However, dry conditions marked by high salinity, coarse grains, and reduced organic input were observed during abrupt events, such as the 8.2 ka and 4.2 ka events. The lake on the eastern margin, Raiwasa Lake, records demonstrates a gradual shift from arid to wetter conditions over time. Comparisons with PMIP model outputs reveal discrepancies between model simulations and proxy data, likely attributable to model biases and limitations in proxy methodologies. Drivers of the ISM variability will be explored to understand the regional differences and differences between model and proxy results.

How to cite: Kumari, A., Dixit, Y., and Defliese, W.: Holocene Evolution of the Indian Summer Monsoon: Insights from Proxy-Model Comparisons on the Thar Desert Margin, EGU General Assembly 2025, Vienna, Austria, 27 Apr–2 May 2025, EGU25-8922, https://doi.org/10.5194/egusphere-egu25-8922, 2025.

EGU25-10476 | ECS | Posters on site | CL1.2.5

Beyond the Historical Record: How Paleoclimate Evidence Sheds Light on a Warming World? 

Fariba Naghizadeh Avilagh and Akbar Rahmati Ziveh

Recent temperature changes have substantially altered global hydroclimate dynamics, yet the degree to which these shifts result from natural variability or anthropogenic influence remains unclear. Observational records, which extend only a century at best, are insufficient to fully capture the scope and magnitude of long-term hydroclimatic changes. Paleoclimate dataset offer an indispensable lens through which to examine hydroclimate variability over the past two millennia. Here, we integrate data from the Paleo Hydrodynamics Data Assimilation (PHYDA) simulation with the Climatic Research Unit Time Series (CRU TS) to investigate spatiotemporal patterns of wet and dry conditions from year 1 to 2000. First, paleo records are used to identify the frequency of wet and dry periods over centennial to millennial timescales. These findings are then compared with CRU TS data to validate the observed trends and assess changes in temperature and precipitation over the same intervals. Our results indicate a global shift toward drier conditions over the past two millennia, particularly in Southern Europe and Central Asia. In contrast, Eastern and Northern Africa exhibit a higher frequency of wetter conditions. Furthermore, the commonly posited notion that “the wet get wetter and the dry get drier” holds true only in a small fraction of examined regions. These findings underscore the value of long-term hydroclimate reconstructions for understanding the drivers and impacts of past and present climate dynamics. Our work contributes to refining future projections of water availability, informing resource management strategies, and advancing hydrological and climate science research.

How to cite: Naghizadeh Avilagh, F. and Rahmati Ziveh, A.: Beyond the Historical Record: How Paleoclimate Evidence Sheds Light on a Warming World?, EGU General Assembly 2025, Vienna, Austria, 27 Apr–2 May 2025, EGU25-10476, https://doi.org/10.5194/egusphere-egu25-10476, 2025.

EGU25-13339 | Posters on site | CL1.2.5

Subfossil yew (Taxus baccata) wood from eastern England reveals mid-Holocene climate and environmental changes 

Tatiana Bebchuk, Otmar Urban, Tito Arosio, Paul Krusic, Ronny Friedrich, Mirek Trnka, Jan Esper, and Ulf Büntgen

Placing current climate trends and extremes in the long-term context of pre-industrial variability requires annually resolved absolutely dated proxy archives.

Here, we benefit from hundreds of exceptionally well-preserved subfossil yew (Taxus baccata) trees that were excavated over decades from near sea-level peat-rich sediments in the Fenland region of eastern England. We combined dendrochronological and radiocarbon dating to develop a millennium-long tree-ring width (TRW) chronology for the mid-Holocene. We further measured stable oxygen and carbon isotopes (δ18O and δ13C) in a subset of samples, which allowed absolute dating of the yew chronology between 5225 and 4148 calendar years BP. An eco-physiological model was then developed to reconstruct hydroclimate changes on interannual to centennial timescales.

Our findings suggest that relatively dry soil and atmospheric conditions favoured yew growth, while higher groundwater tables and wetter soils reduced TRW. These relationships are contrary to those we observed in living yew trees today, likely due to hydrological rather than climatic changes in space and time. Our new hydroclimate reconstruction reveals unusually wet conditions around 4,200 years ago, when extensive yew woodlands suddenly disappeared from eastern England. We propose that the extinction of Fenland taxus was likely driven by a sea-level rise in the North Sea, a prolonged negative phase of the North Atlantic Oscillation, and significant riverine flooding. These hydroclimate and biogeographic transformations provide new insights into the causes and consequences of the hotly debated 4.2 ka event in the North Atlantic/European sector.

How to cite: Bebchuk, T., Urban, O., Arosio, T., Krusic, P., Friedrich, R., Trnka, M., Esper, J., and Büntgen, U.: Subfossil yew (Taxus baccata) wood from eastern England reveals mid-Holocene climate and environmental changes, EGU General Assembly 2025, Vienna, Austria, 27 Apr–2 May 2025, EGU25-13339, https://doi.org/10.5194/egusphere-egu25-13339, 2025.

EGU25-13533 | ECS | Orals | CL1.2.5

The expanding LiPD (Linked Paleo Data) ecosystem: improving your paleoclimate research workflow 

David Edge, Lena Thöle, and McKay Nick

Querying, cleaning, and annotating paleoclimate data can be a cumbersome task, as is reproducing a published reconstruction method. Most of this work can now either be automated or avoided by utilizing the LiPD ecosystem.


With Pages2k, Temp12k, and other compilations, the linked paleodata (LiPD) format has solved the problems of data cleaning and annotation. These compilations and others are stored in the LiPDverse, with all metadata, paleo data, and chronology data. Packages in R and Python support querying the database (lipdR, pylipd). And a set of paleoclimate analysis packages allow for changepoint detection, age-modeling, and various other analyses (actR, geochronR, pyleoclim).


A new web platform called PReSto (the paleoclimate reconstruction storehouse) provides GUIs for easier querying of the LiPDverse. Additionally, several published climate reconstructions are available for visualization and comparison. And the creation of custom reconstructions from several of these published methods is now enabled in a streamlined web interface, code free. 


With a new partnership (FREE SODA, Dutch Research Council) the LiPDverse database continues to grow. We are currently adding a collection of records from the Southern Ocean. Several new web features are also being developed, such as map overlays and projections, as well as interactive data comparison tools.

How to cite: Edge, D., Thöle, L., and Nick, M.: The expanding LiPD (Linked Paleo Data) ecosystem: improving your paleoclimate research workflow, EGU General Assembly 2025, Vienna, Austria, 27 Apr–2 May 2025, EGU25-13533, https://doi.org/10.5194/egusphere-egu25-13533, 2025.

EGU25-16563 | ECS | Posters on site | CL1.2.5

 SCUBIDO: transforming multivariate proxy data to quantitative climate reconstructions  

Laura Boyall, Andrew Parnell, Paul Lincoln, Antti Ojala, Armand Hernández, and Celia Martin Puertas

Palaeoclimate archives record climate variability on a range of timescales from seasonal changes in the climate system to multi millennial variability. Decision makers working on climate mitigation and adaptation typically work on timescales of one year to a few decades ahead only. This means that in order for palaeoclimate reconstructions to be most relevant for policy decisions, the temporal resolution of reconstructions also need to be at an annual to decadal scale. However, traditional approaches to quantitatively reconstruct climate are often expensive and require a lot of archive material and therefore typically have a multidecadal to centennial resolution.

In this presentation we present a new approach to reconstruct climate on high temporal resolutions (annual to decadal) using micro–X-ray Fluorescence (μXRF) data from lake sediments. We have built a statistical model based on Bayesian inference which transforms the semi-quantitative mXRF data into an annually resolved quantitative climate timeseries with quantified uncertainties. Within this study we have synthesised the mathematical details of this approach into a user-friendly R package (SCUBIDO: Simulating Climate Using Bayesian Inference with Proxy Data Observations) which simplifies the modelling process.

We present the output of SCUBIDO from two annually laminated (varved) lake records, Diss Mere in the UK and Nautajärvi in Finland and reconstruct temperature through the Holocene. The results from these reconstructions show long-term climate amelioration and demonstrates clear decadal and multidecadal climate variability, of which is unable to be observed in previously published reconstructions of a lower temporal resolution. Finally in this presentation we will focus on the last two thousand years, a period of time frequently discussed in climate conversations and show the evolution of climate through time.

How to cite: Boyall, L., Parnell, A., Lincoln, P., Ojala, A., Hernández, A., and Martin Puertas, C.:  SCUBIDO: transforming multivariate proxy data to quantitative climate reconstructions , EGU General Assembly 2025, Vienna, Austria, 27 Apr–2 May 2025, EGU25-16563, https://doi.org/10.5194/egusphere-egu25-16563, 2025.

EGU25-16780 | ECS | Orals | CL1.2.5

Differences between simulated and observed surface temperature variability in the tropics versus extratropics 

Elisa Ziegler, Beatrice Ellerhoff, Nils Weitzel, Marie-Luise Kapsch, Uwe Mikolajewicz, and Kira Rehfeld

Projections of future climate and especially extreme events depend on the reliable simulation of climate variability. On timescales inaccessible to direct observations, the evaluation of simulated variability requires comparison to proxy-based reconstructions. However, simulated and proxy-based estimates of surface temperature variability disagree locally on decadal and longer timescales.

Here, we expand comparisons of surface temperature variability in simulations and observations with data covering up to the last 2 Million years. For the comparison, we compile a multi-proxy database, as well as use direct observations and an ensemble of transient and equilibrium simulations of varying complexity, including an ESM with a dynamically-coupled ice-sheet-solid earth model. Based on these, we create global and regional spectra of observed and simulated surface temperature covering daily to multi-millennial timescales. We evaluate the variability with respect to differences between land and sea, proxy type, model complexity, employed forcings and model properties such as resolution.

Our results confirm that global agreement between reconstructions and models extends to the past 2 Million years. The global composite spectrum follows a power law scaling with a break at multi-millennial timescales. The results further demonstrate that a range of models can simulate the continuum of global mean surface temperature. Regionally, we find substantial differences between simulations and observations in the tropics and subtropics, where reconstructed temperature variability surpasses simulated variability. On the model-side, the complexity of the atmosphere and representation of cloud processes seem particularly relevant for the magnitude of simulated tropical variability, however, the relationship between tropical dynamics and local temperature variability requires further investigation. In the mid and high latitudes, differences between simulations and observations are smaller, especially for complex models that include volcanic forcing. The choice between dynamic and prescribed ice sheets affects temperature variability in particular in the southern polar region, where dynamically coupled ice sheets tend to lead to better agreement with proxy-based reconstructions. We further find that forcings affect simulated variability not only on their characteristic timescales, but on both longer and shorter timescales. This highlights the importance of including long-term feedbacks and volcanic forcing to simulate the spectrum of temperature variability across timescales, a necessity for reliable projections, attribution studies and assessments of the risks of extreme events.

How to cite: Ziegler, E., Ellerhoff, B., Weitzel, N., Kapsch, M.-L., Mikolajewicz, U., and Rehfeld, K.: Differences between simulated and observed surface temperature variability in the tropics versus extratropics, EGU General Assembly 2025, Vienna, Austria, 27 Apr–2 May 2025, EGU25-16780, https://doi.org/10.5194/egusphere-egu25-16780, 2025.

EGU25-17475 | ECS | Orals | CL1.2.5

Paleoclimate reconstructions based on European pollen data since the Last Glacial Maximum: probabilistic inversion, megabiomization, and multi-method approach 

Gabriel Fénisse, Manuel Chevalier, Odile Peyron, David Vincent Bekaert, and Pierre-Henri Blard

            Pollen data are among the most abundant and spatially-temporally resolved proxies for quantitatively reconstructing European climate evolution since the Last Glacial Maximum (LGM, ~19-26 kyr, [1]). This period of near-climatic stability, characterized by a climate drastically different from the present, serves as a key reference point for evaluating the reliability/performance of climate models used to project anthropogenic climate change, especially in Paleoclimate Modelling Intercomparison Project (PMIP) ([2]) Pollen assemblages are particularly useful for studying climatic spatial gradients, the proximity effects of ice sheets, seasonality, and environmental changes (e.g., [3]). However, the number of available fossil sites, the quality of the records (i.e., diversity and taxonomic resolution), and the age constraints remain limited. In Europe, various pollen-based transfer functions have been used to provide climate reconstructions (e.g., Modern Analogue Technique (MAT) and Weighted Averaging Partial Least Squares (WAPLs); [4]), each depending differently on sampled modern analog climates. The lack of agreement between inverse methods necessitates the development of new transfer approaches to enable more robust and reliable reconstructions.

            Here, we present a new compilation of pollen sequences and revised age models for Europe ([5]) as well as a synthesis of reconstructions based on the most comprehensive European calibration dataset available to date (~8700 spectra): EMPD2 (Eurasian Modern Pollen Database, [6]). Temperatures and precipitation reconstructed using MAT and WAPLs are compared with outputs from the probabilistic CREST method ([7]), which is applied for the first time in Europe. In the studied areas, we demonstrate the value of the Plant Functional Type (PFT) biomization method ([8]) and so-called megabiomization approach ([9]) for quantifying coherent and large-scale environmental and climatic changes. By comparing outputs from these different approaches, we show that CREST (i) is particularly sensitive to detailed pollen (i.e., species), (ii) performs better with more taxonomically detailed pollen data, and (iii) is less dependent on the availability of modern analogues than MAT and WAPLs. Furthermore, reconstructions from CREST exhibit less abrupt variability than those from the other two methods.

To assess the significance, sensitivity, and robustness of the cooling and drying trends inferred from pollen data, we present some inter-proxy comparisons and compare these with simulation outputs from the intermediate-complexity climate model iLOVECLIM.


[1] - Tarasov, P. E., et al., (2013). https://doi.org/10.1016/j.quaint.2012.04.007

[2] - Harrison, S. P., et al., (2014).  https://doi.org/10.1007/s00382- 013-1922-3

[3] - Brewer.S, et al., (2008). https://doi.org/10.1016/j.quascirev.2008.08.029

[4] - Overpeck, J., Webb, T. et Prentice, I. (1985). https://doi.org/10.1016/0033-5894(85)90074-2

[5] - Blaauw.M, (2010). https://doi.org/10.1016/j.quageo.2010.01.002

[6] - Davis, B. A. S., et al., (2020). https://doi.org/10.5194/essd-12-2423-2020

[7] - Chevalier.M, (2022). https://doi:10.5194/cp-18-821-2022

[8] - Prentice, C., et al., (1996). https://doi.org/10.1007/BF00211617

[9] - Li, C., et al., (2024). https://doi.org/10.5194/egusphere-2024-1862

How to cite: Fénisse, G., Chevalier, M., Peyron, O., Bekaert, D. V., and Blard, P.-H.: Paleoclimate reconstructions based on European pollen data since the Last Glacial Maximum: probabilistic inversion, megabiomization, and multi-method approach, EGU General Assembly 2025, Vienna, Austria, 27 Apr–2 May 2025, EGU25-17475, https://doi.org/10.5194/egusphere-egu25-17475, 2025.

EGU25-17974 | Posters on site | CL1.2.5

Storminess along the Black Sea coast records a shift in atmospheric circulation patterns 5000 years ago 

Aurel Perşoiu, Ioana Perşoiu, Angelica Feurdean, and Simon Hutchinson

Climatic conditions in SE Europe result from a complex interplay between Atlantic, continental and Mediterranean influences. Competing and/or mutually reinforcing large-scale modes of climate variability led to complex climatic conditions, whose dynamics in the past remain poorly understood. The regional climate is strongly seasonal, with hot and dry summers associated with the northward expansion of mid-latitude anticyclonic cells and cold and wet winters, resulting from the complex interplay of southward outbursts of Siberian cold air and the northward intrusion of moisture carried by Mediterranean cyclones. While climate reconstructions offer information on past air temperature and precipitation variability in the region, changes in the strength, direction and spatio-temporal variability of winds and storms, linked to large-scale atmospheric circulation pattern variability are virtually unknown. To address this gap in our knowledge of these parameters of past climatic conditions, we present here the first reconstruction of mid-to-late Holocene storminess along the western shore of the Black Sea, based on geochemical and sedimentological proxies from a radiocarbon-dated core located in a coastal marsh (Mangalia Herghelie, SE Romania). Our data shows two climatically distinct periods, with an interval of strong NE winds and marine storminess before ca. 5000 cal BP, followed by a period, between 5000 and 2000 cal BP of intense SW winds. Our data, combined with seasonally-distinct climate reconstructions, suggest a major reorganization of large-scale atmospheric circulation patterns around 5000 cal BP, with more frequent northward expansion of Mediterranean cyclones and a reduction in the southward advection of cold air, likely the result of the weakening of the Siberian High.

How to cite: Perşoiu, A., Perşoiu, I., Feurdean, A., and Hutchinson, S.: Storminess along the Black Sea coast records a shift in atmospheric circulation patterns 5000 years ago, EGU General Assembly 2025, Vienna, Austria, 27 Apr–2 May 2025, EGU25-17974, https://doi.org/10.5194/egusphere-egu25-17974, 2025.

EGU25-18506 | Posters on site | CL1.2.5

On the suitability of data assimilation products to quantifying variability and teleconnections across scales 

Raphael Hébert, Thomas Pliemon, Nathan Steiger, and Thomas Laepple

Data assimilation techniques, such as the Kalman Filter, have enabled the development of complete climate field reconstructions over the last millennium, commonly referred to as paleoclimate reanalysis. These techniques effectively integrate paleoclimate data, facilitating the understanding and attribution of past climate events. The resulting spatio-temporal fields are invaluable for studying teleconnections and exploring dynamical links between variables and locations in the past. However, when the observation network is sparse, or proxies exhibit high levels of non-climatic noise, the Kalman Filter tends to revert to the prior. These limitations often result in paleoclimate data assimilation products underestimating variability in earlier periods and overestimating spatial coherence compared to modern observations, reducing their reliability. We thus investigate the timescale-dependent variance and the spatio-temporal covariance of different paleoclimate data assimilation products: ModE-RA, LMR, and PHYDA, and relate differences primarily to the methodology and prior assumptions. The results from the data assimilation products were further assessed against instrumental data and CMIP6 pre-industrial control and fully forced simulations.

How to cite: Hébert, R., Pliemon, T., Steiger, N., and Laepple, T.: On the suitability of data assimilation products to quantifying variability and teleconnections across scales, EGU General Assembly 2025, Vienna, Austria, 27 Apr–2 May 2025, EGU25-18506, https://doi.org/10.5194/egusphere-egu25-18506, 2025.

The Holocene history of Australia’s hydroclimate is surprisingly poorly understood. This is, in part, because of the relatively weak forcing of Holocene climate versus that of the late Pleistocene. However, it is commonly suggested that eastern Australian climates dried in the late-Holocene and that this was in response to increased activity in the El Niño-Southern Oscillation (ENSO), in particular, the intensification of the El Niño phase of the ENSO cycle. While this has been inferred from numerous locations, data from K'gari (a World Heritage-listed subtropical east coast sand island once known Fraser Island) was amongst the first used to develop this hypothesis and features heavily in discussion of the causes and effects of ENSO intensification. K’gari’s lake systems have significant cultural, environmental and economic value and are a key aspect of the island’s World Heritage status. This study examines published and new radiocarbon dates from three >4.5 m deep K'gari lakes. There was a hiatus in sedimentation in the lakes representing a marked drying event during the middle Holocene (7,640 to 5,600 a BP), followed by wetter late Holocene climate, which contrasts with previous arguments about K’gari’s history. It will also be argued that this phenomenon is observed in other lakes on the eastern Australian margin in a manner previously unrecognised. Hence, there is a need to re-evaluate the notion of ENSO intensification driving late-Holocene drying on the eastern Australian coastal margin. It also indicates that even the deepest K’gari lakes are vulnerable to drying and the risks associated with drying should be considered in their management.

How to cite: Tibby, J. and Haidee Cadd, H.: Mid-Holocene drying of K'gari lakes (subtropical eastern Australia) necessitates re-evaluation of links to the El Niño-Southern Oscillation and future drying risk, EGU General Assembly 2025, Vienna, Austria, 27 Apr–2 May 2025, EGU25-21086, https://doi.org/10.5194/egusphere-egu25-21086, 2025.

EGU25-94 | Posters on site | CL1.2.7

A new Australian gas lab for the Million Year Ice Core project 

Daniel Baggenstos, James Menking, and Joel Pedro

The aim of the Australian Million Year Ice Core Project (MYIC) is to drill and recover an ice core that extends to well over a million years ago. Due to the highly thinned nature of the ice close to the bedrock of the MYIC, good vertical sampling resolution, and thus small sample capabilities, is key to resolve the variability in the climate records. This requirement demands major development of new ice core measurement capability, including a state-of-the-art ice continuous flow analysis facility and development and build of a new ice core gas laboratory.

The main capabilities for the gas laboratory include a small-volume (~50g) sublimation extraction system, a QCL absorption spectrometer, and a MAT 253+ mass spectrometer, to produce 1) concentration measurements of the primary greenhouse gases CO2, CH4, N2O to constrain changes in radiative forcing, 2) isotope ratio measurements of CO2 on discrete ice samples to screen measured concentrations for contamination artefacts and constrain carbon cycle source and sink changes, 3) measurements of δ18O-O2 and δ15N-N2 for understanding of site conditions, gas trapping, firnification processes and to aid dating. We present our plans and progress in establishing the new Hobart ice core gas facility to achieve these measurements.

How to cite: Baggenstos, D., Menking, J., and Pedro, J.: A new Australian gas lab for the Million Year Ice Core project, EGU General Assembly 2025, Vienna, Austria, 27 Apr–2 May 2025, EGU25-94, https://doi.org/10.5194/egusphere-egu25-94, 2025.

EGU25-147 | ECS | Orals | CL1.2.7

« Horizontal coring » in blue ice areas of Antarctica: an accessible approach for assessing paleoclimate variations 

Etienne Legrain, Veronica Tollenaar, Steven Goderis, and Harry Zekollari and the BlueIceLapseRate Team

Reconstructing past Antarctic climate typically relies on vertical drilling of deep ice cores. However, the ~1% of the Antarctic ice sheet exposes blue ice, which offers a unique resource for paleoclimate research. The typically old blue ice exposed at the surface presents a continuous horizontal age gradient. By sampling ice along a transect in blue ice, we can thus reconstruct past climate variations.

In this study, we treat surface blue ice transects as horizontal ice cores and analyze 444 ice samples from the Sør Rondane Mountains. Isotope (δ18O) measurements from these samples enable the estimation of surface paleotemperatures for both the current interglacial period and the Last Glacial Maximum. By combining these paleotemperatures with the spatially variable source elevations of the blue ice, we provide the first insights into the (absence of) lapse rate changes (variations in the elevation-temperature relationship) in Antarctica over the last deglacial warming.

The absence of lapse rate changes in the samples from Antarctica contrasts with lower latitudes, which have experienced elevation-dependent warming over the same period. Our results reaffirm the potential of blue ice as an archive for reconstructing past climatic variations in Antarctica, and the easily accessible samples offer complementary insights to those obtained from vertical ice core drilling.

How to cite: Legrain, E., Tollenaar, V., Goderis, S., and Zekollari, H. and the BlueIceLapseRate Team: « Horizontal coring » in blue ice areas of Antarctica: an accessible approach for assessing paleoclimate variations, EGU General Assembly 2025, Vienna, Austria, 27 Apr–2 May 2025, EGU25-147, https://doi.org/10.5194/egusphere-egu25-147, 2025.

EGU25-2317 | ECS | Orals | CL1.2.7

81Kr dating of 1 kg polar ice 

Jie Wang, Florian Ritterbusch, Xin Feng, Sarah Shackleton, Michael Bender, Edward Brook, John Higgins, Zehua Jia, Wei Jiang, Zhengtian Lu, Jeffrey Severinghaus, Liangting Sun, Guomin Yang, and Lei Zhao

81Kr (t1/2=229 ka) is a valuable isotope for radiometric dating of water and ice with a dating range from thirty thousand to over one million years. It is produced by cosmic rays in the stratosphere, and uniformly distributed in the atmosphere with an isotopic abundance of 81Kr/Kr ~ 1 ×10-12. Based on laser cooling and trapping, the detection method Atom Trap Trace Analysis (ATTA) has enabled 81Kr analysis at the extremely low isotopic abundance levels in the environment. However, it has been a challenge to apply 81Kr dating on ice cores where sample size is limited. Here, we present the realization of an all-optical ATTA system, reducing cross-sample contamination during 81Kr analysis by two orders of magnitude. As a consequence, the sample size requirement reduces to 1 kg of ice and the upper dating limit is extended to 1.5 million years. Using the all-optical ATTA system, we demonstrate 81Kr dating of 1-kg ice core samples from Taylor Glacier, Antarctica, whose gas ages are precisely known from their stratigraphic alignment. Moreover, we have performed 81Kr analysis on basal ice samples of the GISP2 core, providing constraints on when Greenland Summit was most recently ice-free. The achieved sample size reduction facilitates 81Kr dating of ice-core sections to address open questions in paleoclimatology such as the evolution of glaciers on the Tibetan Plateau or the stability of the West-Antarctic ice sheet.

How to cite: Wang, J., Ritterbusch, F., Feng, X., Shackleton, S., Bender, M., Brook, E., Higgins, J., Jia, Z., Jiang, W., Lu, Z., Severinghaus, J., Sun, L., Yang, G., and Zhao, L.: 81Kr dating of 1 kg polar ice, EGU General Assembly 2025, Vienna, Austria, 27 Apr–2 May 2025, EGU25-2317, https://doi.org/10.5194/egusphere-egu25-2317, 2025.

EGU25-3459 | ECS | Orals | CL1.2.7

Investigating Antarctic Blue Ice Climate Archives Using Laser Ablation Impurity Imaging 

Fairuz Ishraque, Mebrahtu Weldeghebriel, Elizabeth Niespolo, and John Higgins

Ice cores are indispensable archives for preserving terrestrial climate history, yet continuous Antarctic cores are limited to 1–1.5 million years due to basal melting, ice flow dynamics, and layer thinning, with the oldest continuous ice core (the EPICA Dome C core) extending to 800,000 years before present.  Recent discoveries of ice as old as 6 million years from shallow cores drilled in the Allan Hills Blue Ice Area (BIA) in Antarctica indicate that it is possible to extend the polar ice core record well beyond what is possible from continuous ice cores. However, developing robust paleoclimate archives from Antarctic BIA ice cores is challenging due to the uncertainties in the orientation and thickness of layering in such old, deformed, and often chronologically disturbed ice. Cryo-cell laser ablation inductively coupled plasma mass spectrometry (LA-ICP-MS) offers a micro-destructive method to analyze spatial impurities in ice cores at a sub-millimeter scale, and preserves most of the ice material for paired, high-precision chemical analyses. This study investigates the application of LA-ICP-MS for high-resolution chemical layer analysis and orientation of Antarctic BIA cores. By imaging distribution of trace elements like Na, Mg, Ca, Al, and Sr at micrometer (µm) scales, LA-ICP-MS enables the chemical characterization of individual ice layers. To evaluate the technique’s effectiveness, we analyzed NIST 612 glass standard, Taylor Glacier ice, and an Allan Hills ice core (ALHIC 1903). Our findings reveal that LA-ICP-MS captures fine-scale spatial variations (65 µm) in elemental concentrations, highlighting the potential for annual layer identification within BIA ice cores. In the ALHIC 1903 sample, we identified a probable annual layer through a distinct peak in Na concentration across the length of a sample, demonstrating the ability of LA-ICP-MS to reveal layering within ice microstructure. The study emphasizes the importance of optimizing laser parameters and washout times to preserve microstructural details, ultimately enhancing the reconstruction of paleoclimate records from BIA ice cores. 

How to cite: Ishraque, F., Weldeghebriel, M., Niespolo, E., and Higgins, J.: Investigating Antarctic Blue Ice Climate Archives Using Laser Ablation Impurity Imaging, EGU General Assembly 2025, Vienna, Austria, 27 Apr–2 May 2025, EGU25-3459, https://doi.org/10.5194/egusphere-egu25-3459, 2025.

EGU25-4393 | ECS | Posters on site | CL1.2.7

Investigating the possibility to retrieve climate information from three stacked δ18O series in Adélie Land: a comparison between data and virtual firn cores 

Titouan Tcheng, Elise Fourré, Christophe Leroy-Dos Santos, Frédéric Parrenin, Emmanuel Le Meur, Frédéric Prié, Olivier Jossoud, Roxanne Jacob, Bénédicte Minster, Olivier Magand, Cécile Agosta, Niels Dutrievoz, Vincent Favier, Mathieu Casado, Martin Werner, Alexandre Cauquoin, Laurent Arnaud, Bruno Jourdain, Ghislain Picard, and Amaelle Landais

Water stable isotopes signals recorded in snow, firn and ice cores were successfully used to investigate past temperatures on glacial/interglacial scales. However, many uncertainties hampered the interpretation of water isotope records at sub-annual to decadal resolution as a proxy of past temperature variations only. Condensation, sublimation and/or redistribution of snow triggered by strong katabatic winds as well as diffusion within firn lessen the representativeness of a single isotopic profile to reconstruct past temperature in this region. In order to mitigate the non-representativeness of a single isotopic profile, a solution consists of averaging several records to increase signal to noise ratios.

              In this study, we present an analysis of 3 stacked δ18O temporal series from the coast-to-plateau transition in Adélie land. Each of these stacks was built from three shallow firn cores (~20 m-long) drilled at 3 locations (so called D47, Stop5 and Stop0) with high accumulation rates (~200 mm w.eq ·yr-1) during the ASUMA campaign in December 2016 - January 2017. The sites feature different elevations (from 1516 m to 2416 m above sea level) and katabatic winds influence. We present a comparison of each of these stacks with virtual firn cores produced from the outputs of two atmospheric general circulation models including isotopes, ECHAM6wiso and LMDZ6iso for the period 1979 - 2016. In particular, we show how much of the climatic information we can retrieve from our δ18O stacked series.

How to cite: Tcheng, T., Fourré, E., Leroy-Dos Santos, C., Parrenin, F., Le Meur, E., Prié, F., Jossoud, O., Jacob, R., Minster, B., Magand, O., Agosta, C., Dutrievoz, N., Favier, V., Casado, M., Werner, M., Cauquoin, A., Arnaud, L., Jourdain, B., Picard, G., and Landais, A.: Investigating the possibility to retrieve climate information from three stacked δ18O series in Adélie Land: a comparison between data and virtual firn cores, EGU General Assembly 2025, Vienna, Austria, 27 Apr–2 May 2025, EGU25-4393, https://doi.org/10.5194/egusphere-egu25-4393, 2025.

EGU25-4894 | Orals | CL1.2.7

Biomass burning over the past 350 years: insights from high-resolution analysis of black carbon particles in a northwestern Greenland ice core 

Kumiko Goto-Azuma, Yoshimi Ogawa-Tsukagawa, Kaori Fukuda, Koji Fujita, Motohiro Hirabayashi, Remi Dallmayr, Jun Ogata, Nobuhiro Moteki, Tatsuhiro Mori, Sho Ohata, Yutaka Kondo, Makoto Koike, Sumito Matoba, Moe Kadota, Akane Tsushima, Naoko Nagatsuka, and Teruo Aoki

Black carbon (BC) particles, emitted by incomplete combustion of biomass and fossil fuels, play a crucial role in Earth's radiation budget and climate. Conversely, climate changes can influence BC emissions from biomass burning (BB). Global warming has been linked to the recent increase in large wildfires worldwide, causing significant ecological and societal damage. Increased occurrence of large wildfires in the future could affect Earth’s radiation budget, and change the frequency at which certain regions are exposed to serious hazards. Understanding the long-term changes in BC concentrations and size distributions is essential to assess BC's role in climate dynamics and its response to climate change. At the EGU 2024 General Assembly, we presented an ice core BC record from the EastGRIP site in northeastern Greenland, focusing on temporal variability in BC derived from anthropogenic emissions. In this study, we present a high-resolution BC record from the SIGMA-D ice core in northwestern Greenland, spanning the past 350 years. Using an improved BC measurement technique coupled with a continuous flow analysis (CFA) system, we obtained accurate, high-temporal-resolution data on BC particle size and mass/number concentrations.

Our results reveal that both BC number and mass concentrations began to increase in the 1870s, peaked during the 1910s–1920s due to the inflow of anthropogenic BC, and subsequently decreased to pre-industrial levels or lower. However, BC particle size did not return to pre-industrial values, remaining elevated during the 1960s–2000s. Anthropogenic BC emissions also shifted the annual peak in BC concentrations from summer to winter–early spring, while the peak returned to summer after BC concentrations declined to pre-industrial levels. This suggests that BB has become the dominant source of BC at the SIGMA-D site in recent years. Interestingly, anthropogenic BC emissions made only a minor contribution to summer BC concentrations throughout the past 350 years. By separating winter and summer BC data, we reconstructed temporal variations in BC originating from boreal forest fires, even during periods of significant anthropogenic input. Our findings indicate no increase in boreal forest fire-derived BC until the early 2000s. These results enhance our understanding of the interplay between natural BC emissions, anthropogenic influences, and climate variability since the preindustrial time.

How to cite: Goto-Azuma, K., Ogawa-Tsukagawa, Y., Fukuda, K., Fujita, K., Hirabayashi, M., Dallmayr, R., Ogata, J., Moteki, N., Mori, T., Ohata, S., Kondo, Y., Koike, M., Matoba, S., Kadota, M., Tsushima, A., Nagatsuka, N., and Aoki, T.: Biomass burning over the past 350 years: insights from high-resolution analysis of black carbon particles in a northwestern Greenland ice core, EGU General Assembly 2025, Vienna, Austria, 27 Apr–2 May 2025, EGU25-4894, https://doi.org/10.5194/egusphere-egu25-4894, 2025.

EGU25-5176 | ECS | Posters on site | CL1.2.7

Limitations on the Use of Atmospheric δO₂/N₂ for Ice Core Dating: Insights from the EPICA Dome C Ice Core  

Louisa Brückner, Amaëlle Landais, Anna Klüssendorf, Grégory Teste, Frédéric Prié, and Élodie Brugère

The measurement of atmospheric δO₂/N₂ trapped in ice is an incredible tool for ice core dating, as it is directly linked to local summer insolation. Numerous studies conducted between 2005 and 2022 have focused on determining the δO₂/N₂ composition of the EPICA Dome C (EDC) ice core. However, discrepancies between the datasets from these studies have emerged, raising questions about the potential causes of variability. Notably, inconsistencies between datasets measured years apart (e.g. 2012 vs. 2022) are investigated using newly acquired high-resolution δO₂/N₂ data in the age range from 450 to 550 ka BP. In this presentation, we present this new data together with a compilation of all available δO₂/N₂ values on the EDC ice core.

One significant factor influencing the δO₂/N₂ composition is gas loss during the storage of the ice samples, which appears to correlate with the storage temperature. Our results reveal that the storage temperature plays a critical role in preserving the δO₂/N₂ signature. Samples transported at -20°C, even for only a few months, exhibit a substantially more depleted δO₂/N₂ signature (approximately -5‰) compared to those consistently stored at -50°C. Additional factors influencing δO₂/N₂ values include the local accumulation rate and other regional conditions, for which the δD of the ice is a proxy. By comparing local summer insolation, δD of the ice, and δO₂/N₂ of the trapped air, one can distinguish the effects of orbital forcing from higher-frequency, non-orbital influences. Accurately interpreting the EDC δO₂/N₂ record is essential for the best use of this tool for the construction of the chronology of the new Beyond EPICA ice core.

How to cite: Brückner, L., Landais, A., Klüssendorf, A., Teste, G., Prié, F., and Brugère, É.: Limitations on the Use of Atmospheric δO₂/N₂ for Ice Core Dating: Insights from the EPICA Dome C Ice Core , EGU General Assembly 2025, Vienna, Austria, 27 Apr–2 May 2025, EGU25-5176, https://doi.org/10.5194/egusphere-egu25-5176, 2025.

EGU25-5530 | Posters on site | CL1.2.7

Mineral dust weathering in the RICE ice core 

Luca Lanci, Barbara Delmonte, Michele Mattioli, Laura Valentini, Giovanni Baccolo, and Nancy Bertler

The RICE ice core was drilled on the NE edge of the Ross Ice Shelf, at the summit of Roosevelt Island (79.364°S, 161.706°W, 550 m a.s.l.), an ice rise 764 m thick, locally-grounded 214 m below sea level (Bertler et al., 2018). The climate record documented in the ice core covers the last 83 ka, providing rich insights on the coastal Antarctic climate. Insoluble impurities in the RICE ice core mainly consist of mineral dust particles. Direct SEM and X-Ray diffraction analyses on single-grains from discrete dust samples extracted from RICE sections show evidence of extensive englacial diagenesis, in particular below ca. 650 m depth. Within the upper part of the core, dust particles are mostly volcanic or aeolian. In the deepest part of the core, conversely, aeolian dust particles show authigenic, eudral crystals grown on their surface. Also, individual crystals not showing signs of atmospheric transport both possibly resulting from in situ mineralization have been observed. Mineral neoformation likely results from the interaction between dust and fluids concentrating in ice crystal boundaries and triple junctions. Newly-formed minerals include Fe-bearing compounds such as Jarosite, Goethite, Magnetite and Hematite. These results are in line with the ice-weathering model proposed for ice deeper than about 1500 meters at Talos Dome (Baccolo et al., 2021a, 2021b), although in the case of RICE the depth of englacial mineralization is much shallower. Our results corroborate the finding that weathering and englacial diagenesis is a common process at depth inside thick ice sheet, potentially affecting the climatic interpretation of dust records in deep ice cores. Considering the different depth at which such processes have been found in RICE and Talos Dome ice cores, it remains to be understood which are the limiting factors controlling the initiation of such englacial reactions.

Bertler, Nancy AN, et al. "The Ross Sea Dipole–temperature, snow accumulation and sea ice variability in the Ross Sea region, Antarctica, over the past 2700 years." Climate of the Past 14.2 (2018): 193-214.

Baccolo, G., Delmonte, B., Niles, P.B., ... Snead, C., Frezzotti, M. Jarosite formation in deep Antarctic ice provides a window into acidic, water-limited weathering on Mars, Nature Communications, 2021, 12(1), 436

Baccolo, G., Delmonte, B., Di Stefano, E., ... Marcelli, A., Maggi, V. Deep ice as a geochemical reactor: Insights from iron speciation and mineralogy of dust in the Talos Dome ice core (East Antarctica), Cryosphere, 2021, 15(10), pp. 4807–4822

How to cite: Lanci, L., Delmonte, B., Mattioli, M., Valentini, L., Baccolo, G., and Bertler, N.: Mineral dust weathering in the RICE ice core, EGU General Assembly 2025, Vienna, Austria, 27 Apr–2 May 2025, EGU25-5530, https://doi.org/10.5194/egusphere-egu25-5530, 2025.

EGU25-5912 | ECS | Orals | CL1.2.7

Improving the past methane budget using dual-isotope methane records over the last glacial cycle 

Michaela Mühl, Hubertus Fischer, Jochen Schmitt, and Barbara Seth

Ice core derived records of the past atmospheric methane concentration ([CH4]) allow us to reconstruct its past variability and its link to changes in the climate system. During the last glacial cycle [CH4] showed pronounced increases from glacial to interglacial conditions, but [CH4] also closely followed large and rapid millennial-scale warming events in the Northern Hemisphere associated with Dansgaard-Oeschger (DO) events, indicating a strong sensitivity of NH low-latitude CH4 sources to the position of the Inter-Tropical Convergence Zone.

Past [CH4] are well recorded by the measurements of Antarctic and Greenland ice cores, however, large parts of existing Greenland records over the last glacial period suffered from excess methane production during analysis (Mühl et al., 2023). The individual contributions of various sources and sinks to the global methane budget are still a matter of debate and a quantitative assessment is still missing for many time periods in the past. Synchronized ice core records from both polar regions allow to derive the Inter-Polar Difference (IPD) in [CH4] reflecting latitudinal emission variability and are used to distinguish low and high latitude CH4 sources. Another powerful tool to separate emissions from different sources are measurements of the stable hydrogen and carbon isotopic signature of CH42H-CH4, δ13C-CH4) as CH4 released by the various sources are associated with characteristic isotopic signatures and different sinks are connected to systematic isotope fractionations, providing additional constraints on past CH4 source variability and top-down quantifications of the CH4 budget.

In this study we present the first complete δ2H-CH4 record over the last glacial cycle complementing our existing δ13C-CH4 record (Möller et al., 2013). The record shows only relatively small variations in δ2H-CH4 over the last glacial cycle, while δ13C-CH4 showed pronounced millennial variability, which are correlated to concurrent CO2 changes but not to stadial/interstadial climate variability. With additional measurements of Greenland ice core samples (GRIP) in the time interval 73-105 kyr, we can derive for the first time an IPD in both the methane concentration and the methane dual-isotopic signature during glacial times. We concentrate our CH4 budget reconstruction on selected time intervals during Heinrich Stadials 7b and 9, and DO events 21-23, where excess CH4 production does not affect our results.

How to cite: Mühl, M., Fischer, H., Schmitt, J., and Seth, B.: Improving the past methane budget using dual-isotope methane records over the last glacial cycle, EGU General Assembly 2025, Vienna, Austria, 27 Apr–2 May 2025, EGU25-5912, https://doi.org/10.5194/egusphere-egu25-5912, 2025.

EGU25-6313 | ECS | Posters on site | CL1.2.7

Deciphering the cause of greenhouse gas (CO2, CH4) alteration in shallow ice at Larsen blue-ice area, East Antarctica 

Giyoon Lee, Jinho Ahn, Ikumi Oyabu, Julia M. Peterson, Changhee Han, Motohiro Hirabayashi, Edward J. Brook, Kenji Kawamura, Kumiko Goto-Azuma, and Sangbum Hong

Ice cores drilled from polar ice sheets in Antarctica and Greenland contain ancient atmospheric air trapped in air bubbles. The reconstruction of past atmospheric greenhouse gas (GHG) concentrations, such as carbon dioxide (CO2) and methane (CH4), has enhanced our understanding of the glacial-interglacial climate cycles and their relationship to surface temperature. However, processes that alter the GHG concentrations of the trapped air poses a challenge for accurate GHG reconstruction and paleoclimate interpretation. Previous studies report excess GHG concentration related to various factors, such as ice impurities, organic carbon oxidation, methods of extracting trapped air, refrozen ice layers, and biological activity. Despite these findings, the causes and mechanisms of GHG alteration within glacial ice remain incompletely understood, for example, the alterations observed in shallow ice in blue-ice areas (BIAs). GHGs in shallow ice cores from BIAs in Antarctica show excess CO2 and CH4 concentration values and even extremely lower CH4 concentration than other non-contaminated ice core records at the same gas ages. Here, we aim to decipher the cause of excess GHG (CO2, CH4) concentration and depleted CH4 concentration observed in the shallow ice from Larsen BIA, East Antarctica. CO2 concentration in the Larsen blue ice shows a gradual decrease from the surface until a depth of ~4.6 m where the concentration variation stabilizes. In contrast, CH4 concentration records show an increasing trend from the surface to a depth of ~0.35–1.15 m. Then gradually decreases until it reaches stabilized values at ~4.6 m depth. Measurements of δ15N-N2, ion concentrations (Ca2+ and Na+), and Pb isotopes indicate that excess GHG concentrations are not associated to the modern air/aerosol intrusion. The pronounced excess GHG concentrations in the surface ice are not related to dust content. The observed δ18Oatm depletion in the surface ice suggests that photochemical reactions have occurred within the ice. Therefore, we infer that GHG alterations observed in the surface ice from Larsen BIA are attributed to UV photochemistry. Based on δ13C of CO2, we suggest that photolysis of both organic and inorganic carbon by ultraviolet light from sun is a primary source for the excess CO2 concentration.

How to cite: Lee, G., Ahn, J., Oyabu, I., M. Peterson, J., Han, C., Hirabayashi, M., J. Brook, E., Kawamura, K., Goto-Azuma, K., and Hong, S.: Deciphering the cause of greenhouse gas (CO2, CH4) alteration in shallow ice at Larsen blue-ice area, East Antarctica, EGU General Assembly 2025, Vienna, Austria, 27 Apr–2 May 2025, EGU25-6313, https://doi.org/10.5194/egusphere-egu25-6313, 2025.

EGU25-6428 | Orals | CL1.2.7 | Highlight

Ice half a million years old at the base of the Skytrain Ice Rise ice core 

Eric Wolff, Xin Feng, Wei Jiang, Zheng-Tian Lu, Florian Ritterbusch, Jie Wang, Guo-Min Yang, Amaelle Landais, Elise Fourré, Thomas Combacal, Niklas Kappelt, Raimund Muscheler, and Robert Mulvaney

Skytrain Ice Rise is a separate ice flow centre at the inland edge of the Ronne Ice Shelf, on the periphery of the West Antarctic Ice Sheet. An ice core drilled through to the base of the ice at 651 m was dated as far as 126 ka before present, which is found at 627 m depth. This ice has been used so far to investigate the climate and the ice sheet stability of the Holocene and the last interglacial. Here we investigate the ice between 627 and 651 m depth. Three methods for dating old ice have been applied to samples within this depth range. Analysis using the ATTA method of 81Kr, with a half-life of 229 kyr, has been carried out on three samples between 635 and 648 m, as well as on one younger sample of known age. 40Ar in the atmosphere is increasing with time, and therefore the deficit compared to modern of the derived quantity 40Aratm can be used to date ice. Two samples of deep ice have been analysed for this measure. Finally the ratio of 36Cl/10Be should be independent of production rate changes, and has an apparent half-life of 384 kyr. Five samples were analysed between 633 and 650 m. We first compare the findings from the three methods to establish their consistency. The combination of data from the three methods suggests that, despite flow disturbances that are apparent around the last interglacial (LIG) ice, the ages are monotonically increasing with depth. Ice just above the bottom is around half a million years old, suggesting that the ice at Skytrain Ice Rise has been present since before Marine Isotope Stage 11. The climate record will be shown, but has to be interpreted very carefully because we can assume that flow disturbances, similar to those in the LIG, have affected ice at the interfaces between cold and warm periods, leading to missing sections of the record.

How to cite: Wolff, E., Feng, X., Jiang, W., Lu, Z.-T., Ritterbusch, F., Wang, J., Yang, G.-M., Landais, A., Fourré, E., Combacal, T., Kappelt, N., Muscheler, R., and Mulvaney, R.: Ice half a million years old at the base of the Skytrain Ice Rise ice core, EGU General Assembly 2025, Vienna, Austria, 27 Apr–2 May 2025, EGU25-6428, https://doi.org/10.5194/egusphere-egu25-6428, 2025.

EGU25-7037 | Posters on site | CL1.2.7

Could the calcium conundrum in Skytrain shed light on West Antarctic Ice Sheet dynamics?  

Rachael Rhodes, Helena Pryer, Ryan Simpson, Helene Hoffmann, Mackenzie Grieman, Emily Stevenson, Hal Bradbury, Alexandra Turchyn, Jack Humby, James Marschalek, Emily Archibald, Thomas Bauska, and Eric Wolff

Recent work demonstrates that the Skytrain ice core, retrieved from the Weddell Sea Embayment in West Antarctica, can inform us about the (in-)stability of the Ronne-Filcher Ice Shelf and the West Antarctic Ice Sheet in past warm periods. Here we switch our focus to the Last Glacial period at Skytrain and describe our “Calcium Conundrum”, which may be linked to ice sheet dynamics.


The Skytrain calcium record diverges from those of other Antarctic ice cores across several distinct time intervals. The increased Ca at Skytrain is not accompanied by a corresponding increase in other terrigenous elements such as Al. We hypothesize that the elevated Ca intervals result from additional input of relatively local dust, unique to Skytrain. To test this, we present new geochemical measurements on the soluble phase and fully digested dust particles from a ‘regular Ca’ interval (20–31 ka) and an ‘excess Ca’ interval (42–49 ka).


Trace element data confirm elevated Ca levels during the excess Ca interval, associated also with a significant Ba increase relative to Al. However, terrigenous elements associated with silicate minerals exhibit no significant difference between the two intervals when normalised to Al. Radiogenic Sr and Nd isotopes of the regular Ca interval fall within range of South American source areas, typical for Antarctica during the Last Glacial Period. In contrast, 87Sr/86Sr and eNd values for the excess Ca interval are significantly different from those of the regular Ca interval. Using a collation of Sr and Nd isotope data of potential source regions, complemented by new measurements on rocks from the nearby Ellsworth Mountains, we assess the possibility that the recurring excess Ca signal during the Last Glacial fingerprints a dynamic ice sheet in the Weddell Sea Embayment that intermittently exposed nearby nunataks to physical erosion and dust transport.


Additionally, we report the first (to our knowledge) Ca isotope measurements on ice cores in an effort to further fingerprint the source of the excess Ca.

How to cite: Rhodes, R., Pryer, H., Simpson, R., Hoffmann, H., Grieman, M., Stevenson, E., Bradbury, H., Turchyn, A., Humby, J., Marschalek, J., Archibald, E., Bauska, T., and Wolff, E.: Could the calcium conundrum in Skytrain shed light on West Antarctic Ice Sheet dynamics? , EGU General Assembly 2025, Vienna, Austria, 27 Apr–2 May 2025, EGU25-7037, https://doi.org/10.5194/egusphere-egu25-7037, 2025.

EGU25-7227 | Orals | CL1.2.7

Analysis of nano- and micro- particles in ice cores from polar and high altitude glaciers by spICP-TOFMS 

Stanislav Kutuzov, Madeleine C. Lomax-Vogt, Lucas Carter, Paolo Gabrielli, Garret Bland, Ryan Sullivan, Gregory Lowry, and John W. Olesik

Due to its small particle size, nanoparticle (NPs) and and microparticles (μPs) could reside in the air for a long time affecting human health and the environment. Understanding of its sources and dynamics in the atmosphere remains a complex challenge since direct observations are limited. Ice cores drilled from glaciers around the world contain records of atmospheric composition over time. Single particle Inductively Coupled Plasma Time-of-Flight Mass Spectrometry (spICP-TOFMS) is uniquely capable of quickly (in ~10 minutes) measuring the estimated mass equivalent size distribution, number concentration, and elemental chemical composition (up to 70 elements excluding O, H, N, F, and the noble gases) of more than 100,000 individual insoluble mineral NPs and μPs using <0.5 mL of melted ice. spICP-TOFMS allows us not only to consider the total mass concentrations of each element but also assess distribution of particles within each sample depending on elemental composition. Here, we present the results of spICP-TOFMS application for three sets of discrete samples: 1) Ice samples from the "horizontal ice core" from the Taylor Glacier (coastal East Antarctica) (44 – 9 kyrs BP). 2) Mt. Ortles (European Alps) ice core samples spanning from the pre-Roman period (780 BCE) to the modern era (1955 CE). 3) Snow and ice samples at the Upper Fremont glacier, WY, USA collected in 2024.

Study of 28 Taylor Glacier samples using spICP-TOFMS reveals changes in the concentration, size distribution, composition, and inferred mineralogy of individual particles during the last glacial-interglacial transition providing a first assessment of natural background variability of NPs and μPs in Antarctica. Samples from the Last Glacial Maximum (LGM, 18–29 kyr) tend to contain more sub-micron particles with higher fractions of Al, Mg, Na and Ca, and lower fractions of Si suggesting an additional input of material of a different elemental composition most likely due to varying mineralogical sources during the LGM compared to the Holocene. spICP-TOFMS analysis of samples from Mt. Ortles and Upper Fremont glacier were used to investigate anthropogenic particles. We observed enrichments for: Pb, Sb, Bi, Cu, Zn, Sn, Cr, Mo and Ni in modern samples. The percentage of Pb-containing particles increased by about a factor of ten in the most modern samples compared to the oldest sample. The total % mass due to Sn, Bi, and Pb were 26 to 97x higher in the modern samples than in the pre-Roman Mt. Ortles samples, consistent with those elements having significant contributions from anthropogenic sources. This study was supported by NSF Award 1744961.

How to cite: Kutuzov, S., C. Lomax-Vogt, M., Carter, L., Gabrielli, P., Bland, G., Sullivan, R., Lowry, G., and Olesik, J. W.: Analysis of nano- and micro- particles in ice cores from polar and high altitude glaciers by spICP-TOFMS, EGU General Assembly 2025, Vienna, Austria, 27 Apr–2 May 2025, EGU25-7227, https://doi.org/10.5194/egusphere-egu25-7227, 2025.

EGU25-7265 | Posters on site | CL1.2.7

New insights on dust particles in Greenland ice cores combining state-of-the-art methods 

Mauro Masiol, Nicolas Stoll, Piers Larkman, David Clases, Raquel Gonzalez de Vega, Elena Di Stefano, Barbara Delmonte, Carlo Barbante, and Pascal Bohleber

Aerosol-related impurities trapped in ice cores can supply important insights into the mechanics of our climate system. Mineral dust particles can provide information on past atmospheric transport and ice sheet size. This information is encoded in the geochemical composition and size of the dust particles: Local dust sources are characterised by large particles. As a prominent example, changes in dust particle sizes in the RECAP ice core from the Renland ice cap (East Greenland) have been shown to reflect smaller ice cap extent during interglacial periods [1]. To better understand dust chemistry and size changes at high resolution, we applied several state-of-the-art analytical methods to samples of the RECAP and EGRIP ice cores from East Greenland: Cryo-Raman spectroscopy, Laser ablation inductively coupled plasma mass spectrometry (LA-ICP-MS) 2D mapping, coulter counter (CC), time-of-flight single particle analysis (SP ICP-TOFMS), and Low- Background Instrumental Neutron Activation Analysis (LB-INAA). We show that high-resolution LA-ICP-MS maps of Na, Al, Mg, and Fe, in accordance with Raman spectroscopy data from the same samples, reveal the clustering of particles in the microstructure and a species-dependent preferred localisation. Subsequent measurements, taken where possible on the same samples, provide new insoluble particle size and concentration data (CC) and further in-depth elemental characterisation of the dust particles (cryo-Raman, SP ICP-TOFMS, LB-INAA). We can thus reveal changes in size and composition of the dust particles between the Holocene and the last glacial period, as well as within the last glacial. We further introduce a new approach to estimating particle sizes by utilising previously gathered data, exploiting SP analyses' vast, largely untapped potential for ice core science. The know-how in combining these different state-of-the-art methods and their insight into high-resolution dust chemistry and size will also provide important assistance for interpreting the dust signal stored in the upcoming deepest ice of the Beyond EPICA – Oldest Ice Core. Work performed in the framework of the Arctic Research Program of Italy (project PRA2021-0009 “Abrupt climate change and Greenlandice cover in a high-resolution ice core record”).


[1] Simonsen, M.F., Baccolo, G., Blunier, T. et al. East Greenland ice core dust record reveals timing of Greenland ice sheet advance and retreat. Nat Commun 10, 4494 (2019). https://doi.org/10.1038/s41467-019-12546-2

How to cite: Masiol, M., Stoll, N., Larkman, P., Clases, D., Gonzalez de Vega, R., Di Stefano, E., Delmonte, B., Barbante, C., and Bohleber, P.: New insights on dust particles in Greenland ice cores combining state-of-the-art methods, EGU General Assembly 2025, Vienna, Austria, 27 Apr–2 May 2025, EGU25-7265, https://doi.org/10.5194/egusphere-egu25-7265, 2025.

EGU25-8532 | ECS | Posters on site | CL1.2.7

Dating old ice with the 36Cl/10Be ratio 

Niklas Kappelt, Eric Wolff, Marcus Christl, Christof Vockenhuber, and Raimund Muscheler

The bottommost sections of ice cores are often difficult to date, due to the low temporal resolution and possible disturbances, such as folding and missing layers. One possible tool for dating this ice is the 36Cl/10Be ratio, which decays with a combined half-life of 384 kyr years. Individual radionuclides are created by galactic cosmic rays in the atmosphere, but the ratio has been modelled to remove the varying production signal. The chronology of the recently drilled Skytrain ice core from West Antarctica ends with an age of 126 kyr BP 24 m above bedrock. Our aim was to obtain age estimates for samples in the undated section below, while improving our understanding of the 36Cl/10Be ratio as a dating tool. Two datasets were measured: an annually resolved record of the last few decades and a series of older samples from the Holocene, the last interglacial and five samples from the undated section. The data from recent decades was used to test whether the Skytrain site is affected by 36Cl loss, which occurs at low accumulation sites, such as EPICA Dome C and Little Dome C in East Antarctica, where 36Cl is gassing out as HCl. By measuring anthropogenic 36Cl from nuclear bomb tests in the 50s and 60s, we were able to confirm that the peak is found at the expected depth and that no 36Cl loss occurs. In older samples, there was a marked difference between glacial and interglacial data, with higher individual 36Cl and 10Be concentrations in glacial times. This is observed at other sites as well and can most likely be attributed to a dilution effect. However, the 36Cl/10Be ratio was also found to be higher in the last glacial period and correlated with the d18O signal, which likely results from the different physical and chemical properties of 36Cl and 10Be. While 36Cl can be found in its gaseous form or attached to particles, 10Be is always attached to particles, which yields different sensitivities to changes in temperature or precipitation. Possible mechanisms include a washout en-route, which may affect one radionuclide more than the other or an increased scavenging efficiency for 36Cl in mixed-phase clouds. While not fully understood, the correlation with d18O was used to detrend the data and estimate the age of five samples below the dated section, the oldest being 541 +55-61 kyr old.

How to cite: Kappelt, N., Wolff, E., Christl, M., Vockenhuber, C., and Muscheler, R.: Dating old ice with the 36Cl/10Be ratio, EGU General Assembly 2025, Vienna, Austria, 27 Apr–2 May 2025, EGU25-8532, https://doi.org/10.5194/egusphere-egu25-8532, 2025.

EGU25-8910 | ECS | Posters on site | CL1.2.7

Towards understanding the N2O production in dust-rich Antarctic ice using bulk and position-specific isotope analysis 

Lison Soussaintjean, Jochen Schmitt, Joël Savarino, Andy Menking, Edward Brook, Barbara Seth, Thomas Röckmann, and Hubertus Fischer

Nitrous oxide (N2O) is a potent greenhouse gas also involved in the destruction of stratospheric ozone. Unlike carbon dioxide (CO2) and methane (CH4), there is no continuous record of past atmospheric concentrations of N2O from ice cores over the last 800,000 years. This is due to the production of excess N2O in dust-rich Antarctic ice during glacial periods.

We investigated the production of N2O that happens in the ice sheet - referred to as in situ production - with the aim of systematically identifying affected ice core samples. To this end, we measured the nitrogen bulk and position-specific isotopic composition of N2O in dust-rich samples affected by in situ production in the EDC, Vostok, EDML, and Taylor Glacier ice cores. We calculated the isotopic signature of in situ-produced N2O with a mass balance approach. For this calculation, we had to determine the amount of N2O enrichment from in situ production relative to an unaffected atmospheric baseline for N2O concentration and isotopic composition. We chose to use as the atmospheric baseline the N2O record from the TALDICE ice core, which has a low dust content and is supposed to be the least affected by in situ production. To investigate a potential nitrogen precursor, we then compared the nitrogen isotopic signature of in situ-produced N2O with that of nitrate (NO3-) measured in the same samples.

These measurements reveal that the isotopic composition of the central-position N atom in the N2O molecule (δ15Nα) correlates with the nitrogen isotopic composition of NO3- with a slope of 1. However, there is no correlation between the nitrogen isotopic composition of the terminal-position N atom in N2O (δ15Nβ) and that of NO3-. Therefore, our study shows that the N2O produced in situ is hybrid, i.e., the two N atoms in the N2O molecule come from two distinct nitrogen sources. Our hypothesis is based on a reaction involving three reactants. NO3- present in the ice provides the central-position N atom in N2O. It is first converted to NO2- by a reducing species contained in the dust (e.g. Fe2+), and NO2- reacts with a yet unknown nucleophilic species that is the source of the terminal-position N atom.

How to cite: Soussaintjean, L., Schmitt, J., Savarino, J., Menking, A., Brook, E., Seth, B., Röckmann, T., and Fischer, H.: Towards understanding the N2O production in dust-rich Antarctic ice using bulk and position-specific isotope analysis, EGU General Assembly 2025, Vienna, Austria, 27 Apr–2 May 2025, EGU25-8910, https://doi.org/10.5194/egusphere-egu25-8910, 2025.

EGU25-10358 * | Orals | CL1.2.7 | Highlight

 Beyond EPICA – Oldest Ice Core: Insights from a 1.2-Million-Year-Old Climate Record 

Carlo Barbante and the Beyond EPICA Team

The Beyond EPICA – Oldest Ice project in East Antarctica marks a groundbreaking milestone in unraveling Earth’s past climate dynamics. Recent findings confirm that the paleoclimatic record extends back at least 1.2 million years, offering unprecedented opportunities to explore glacial-interglacial cycles and the mechanisms driving Earth’s climate system.

To better constrain the long-term response of Earth’s climate system to continuing greenhouse gas emissions, it is essential to turn to the past. A key advance would be to understand the shift in Earth’s climate response to orbital forcing during the 'Mid-Pleistocene transition' [MPT, 900,000 (900 kyr) to 1.2 million years (1.2 Myr) ago], when a dominant 40 kyr cyclicity gave way to the current 100 kyr period. It is critical to understand the role of forcing factors and especially of greenhouse gases in this transition. Unravelling such key linkages between the carbon cycle, ice sheets, atmosphere and ocean behaviour is vital, assisting society to design an effective mitigation and adaptation strategy for climate change. Only ice cores contain direct and quantitative information about past climate forcing and atmospheric responses.

Drilling operations reached the bedrock at a depth of 2800 meters, granting access to ancient ice. High-resolution analyses of hydrogen isotopes (δD) were conducted, with sampling resolutions down to 25 cm, providing unparalleled insights into climate and environmental fluctuations. Concurrently, dielectric profiling (DEP) measurements were employed to identify detailed climatic stratifications within the ice core.

This presentation will highlight the main results achieved so far, emphasizing their implications for understanding the transition of glacial cycles from 40,000 to 100,000 years and the long-term evolution of greenhouse gas concentrations. These findings lay the foundation for subsequent talks in this session, which will delve into isotopic, chemical, and physical analyses of the ice core.

By bridging critical gaps in our knowledge of paleoclimate, this work also establishes a robust basis for modeling future climate scenarios, reinforcing the importance of understanding Earth’s climatic past to inform predictions of its future.

How to cite: Barbante, C. and the Beyond EPICA Team:  Beyond EPICA – Oldest Ice Core: Insights from a 1.2-Million-Year-Old Climate Record, EGU General Assembly 2025, Vienna, Austria, 27 Apr–2 May 2025, EGU25-10358, https://doi.org/10.5194/egusphere-egu25-10358, 2025.

EGU25-10469 | Orals | CL1.2.7 | Highlight

Towards radiostratigraphic connectivity between Antarctica’s deep ice cores and ice-sheet margins 

Robert Bingham and the AntArchitecture Collaboration

Antarctica’s ice cores provide seminal records of past climates and calibration points for ice-sheet modelling, but are, by definition, limited to single locations. However, spatially-widespread radar-imaged internal-reflecting horizons, tied to ice-core age-depth profiles, can be treated as isochrones that may link between ice-core sites, and record a 3D age-depth structure across the Antarctic ice sheets. In 2018, the Scientific Committee for Antarctic Research programme formed the AntArchitecture consortium, which has progressively been tracing radiostratigraphy across the Antarctic ice sheets to form a baseline dataset for multiple scientific applications, for example the search for Antarctica’s oldest ice and to reconstruct past mass balance. In this presentation we focus on the use of radiostratigraphy to connect between deep ice-core sites and, in so doing, to calibrate ice-core dating profiles and extend the age-depth profiles into three dimensions and extend knowledge of the age of the ice towards the ice-sheet margins and potential future ice-coring sites. We present our best attempts at radiostratigraphic connections across both the East and West Antarctic ice sheets, and the current state of the art in connecting age-depth profiles between the two ice sheets, calibrated by Antarctica’s main ice cores. We demonstrate that radiostratigraphy is a potent companion to ice cores in the quest to reconstruct past climate and hence reduce uncertainties in projecting future ice-sheet behaviour.

How to cite: Bingham, R. and the AntArchitecture Collaboration: Towards radiostratigraphic connectivity between Antarctica’s deep ice cores and ice-sheet margins, EGU General Assembly 2025, Vienna, Austria, 27 Apr–2 May 2025, EGU25-10469, https://doi.org/10.5194/egusphere-egu25-10469, 2025.

EGU25-10761 | ECS | Posters on site | CL1.2.7

Gas extraction from continuous flow analysis for dating ice cores with 39Ar and 81Kr 

David Wachs, Florian Ritterbusch, Clara Baumbusch, Remi Dallmayr, Xin Feng, Qiao-Song Lin, Azzurra Spagnesi, Kerstin Urbach, Jie Wang, Werner Aeschbach, Carlo Barbante, Wei Jiang, Zheng-Tian Lu, Markus Oberthaler, Guo-Min Yang, and Pascal Bohleber

Paleoclimate reconstructions from ice core records can be hampered due to the lack of a reliable chronology, especially in deep ice, when the stratigraphy is disturbed and conventional dating methods cannot be applied. The noble gas radioisotopes 81Kr and 39Ar can in these cases provide robust constraints as they yield absolute, radiometric ages. 81Kr (t1/2=229 ka) covers the time span of 30-1500 ka, which is especially relevant for polar ice cores, whereas 39Ar (t1/2=268 a) with a dating range of 50-1600 a is suitable for alpine glaciers. The anthropogenic 85Kr (t1/2=10.8 a) is particularly useful to quantify contamination with modern air. Due to advances in the detection of 81Kr, 85Kr and 39Ar with Atom Trap Trace Analysis (ATTA), the sample size has been reduced to ~ 1 kg of polar ice. However, this amount can still be difficult to obtain, for example from the upcoming deepest sections of the “Beyond EPICA – Oldest Ice Core” (BEOI), for which no archive piece will be conserved.

Here, we present 85Kr and 81Kr results for gas samples from an Antarctic ice core extracted at the debubbler waste line of a continuous flow analysis (CFA) system. From the continuous melting of ~3 m long core, discrete ~ 100 mL STP gas samples have been extracted, and subsequently analyzed offline for 85Kr and 81Kr. The 85Kr results indicate a minor contamination with modern air of 1-2 %, which can likely be reduced by an earlier bypassing of contaminant air from cracks within a CFA stick and transitions between sequential CFA sticks.

The presented extraction system enables 81Kr and 39Ar dating of an ice core at numerous depths without additional ice demand, which is particularly relevant for upcoming CFA-melting campaigns of deep polar ice cores.

How to cite: Wachs, D., Ritterbusch, F., Baumbusch, C., Dallmayr, R., Feng, X., Lin, Q.-S., Spagnesi, A., Urbach, K., Wang, J., Aeschbach, W., Barbante, C., Jiang, W., Lu, Z.-T., Oberthaler, M., Yang, G.-M., and Bohleber, P.: Gas extraction from continuous flow analysis for dating ice cores with 39Ar and 81Kr, EGU General Assembly 2025, Vienna, Austria, 27 Apr–2 May 2025, EGU25-10761, https://doi.org/10.5194/egusphere-egu25-10761, 2025.

EGU25-11227 | Posters on site | CL1.2.7

First 17O-excess record for the EPICA Dome C deep ice core 

Emma Samin, Amaëlle Landais, Thomas Combacal, Antoine Grisart, Jean Jouzel, Valérie Masson-Delmotte, Bénédicte Minster, Frédéric Prié, and Barbara Stenni

Water isotopes records in polar ice cores provide insights into past climate variability through oxygen and hydrogen fractionation. The EPICA Dome C (EDC) deep ice core in Antarctica has provided δ18O and δD records over the last 800,000 years, which are known to be valuable proxies for tracking temperature variation. Combining both, the deuterium excess (d-excess = δD − 8 * δ18O) gives us information on the hydrological cycle, as it is known to reflect the evaporation stage and air mass transport. However, it is sensitive to the variations of seawater δ18O and the distillation effect of the air mass. The 17O-excess (17O-excess = ln(δ17O+1) − 0.528×ln(δ18O+1)) can provide complementary information to d-excess as it is rather sensitive to air mass mixing and supersaturated conditions along the path.

Here, we present the first record of 17O-excess for the EDC ice core, spanning over the past 126,000 to 800,000 years. We aim to investigate the potential of this tool for interpreting the reorganization of the hydrological cycle in the Southern Hemisphere. 17O-excess variations along the core show the alternation of glacial and interglacial cycles, comparable with other water isotopes and related to orbital parameters. We scrutinize the glacial-interglacial 17O-excess amplitude shift around 400,000 years ago, with amplification of variations in the most recent part, with lower minima, while maxima reach similar levels. This shift could have emerged after the Mid-Pleistocene Transition.

How to cite: Samin, E., Landais, A., Combacal, T., Grisart, A., Jouzel, J., Masson-Delmotte, V., Minster, B., Prié, F., and Stenni, B.: First 17O-excess record for the EPICA Dome C deep ice core, EGU General Assembly 2025, Vienna, Austria, 27 Apr–2 May 2025, EGU25-11227, https://doi.org/10.5194/egusphere-egu25-11227, 2025.

EGU25-11255 | ECS | Orals | CL1.2.7

Reliable Orbital Dating in Deep Ice Core Provides Accurate Marine-Ice Sequences over Old Terminations 

Anna Klüssendorf, Ellyn Auriol, Marie Bouchet, Mathieu Casado, Héloïse Guilluy, Frédéric Parrenin, Émilie Capron, Elisabeth Michel, Frédéric Prié, Elodie Brugère, Grégory Teste, Soizic Salaün, and Amaëlle Landais

Past climate and environmental changes can be reconstructed from palaeoclimate archives, including marine sediment and polar ice cores. Understanding mechanisms associated with major climate changes requires an accurate and precise chronology for each archive and the synchronisation of these individual chronologies to a common multi-proxy timescale. Discrepancies between the individual chronologies can lead to misinterpretation of the phase relationships and the climate dynamics. For old terminations that occurred more than 700,000 years ago, when using original chronologies, ice core data suggest that the increase in atmospheric CO2 concentration lags behind the sea level rise recorded in marine sediment cores. This finding strongly contradicts the established understanding of the climate mechanisms during deglaciations based on observations over the seven most recent terminations, suggesting a mismatch between the site-specific chronologies. Deep ice core age scales are generally developed based on orbital dating correlating gas orbital tracers with insolation variations. However, in the deepest and oldest section of an ice core, thermally enhanced gas diffusion and extensive annual layer thinning significantly mute the proxy records, hampering precise orbital dating. 

In this study, we evaluate the diffusion effect on the frequencies of the gas records critical for orbital dating and explore the incoherence within and between the AICC2023 ice core chronology and modelled LR04 age scale for the marine sediment cores for the period between 600,000 to 800,000 years ago utilising new high-resolution data (~700 years on average instead of >1000 years on average in the previous chronology reconstruction) from the deepest 200 metres of the EPICA Dome C (EDC) ice core. Spectral analyses of CH4, δ18O of O2, and δ(O2/N2) confirm that diffusion does not significantly affect the orbital-scale variability, which enables us to revise the existing depth-age relationship for EDC on its deepest section. Integrating chronological information from the ice core and a continuous high-resolution stable oxygen isotope record of benthic foraminifera using the statistical dating tool Paleochrono-1.1, we link the ice core chronology to marine sediment cores and propose an improved and coherent timescale to reconceive the CO2 and sea level scenario over old terminations.


How to cite: Klüssendorf, A., Auriol, E., Bouchet, M., Casado, M., Guilluy, H., Parrenin, F., Capron, É., Michel, E., Prié, F., Brugère, E., Teste, G., Salaün, S., and Landais, A.: Reliable Orbital Dating in Deep Ice Core Provides Accurate Marine-Ice Sequences over Old Terminations, EGU General Assembly 2025, Vienna, Austria, 27 Apr–2 May 2025, EGU25-11255, https://doi.org/10.5194/egusphere-egu25-11255, 2025.

EGU25-11519 | ECS | Orals | CL1.2.7

New chemical signatures and 39Ar dating from Weißseespitze ice cores (Eastern Alps): Tracing anthropogenic pollution from the Late Medieval to Early Modern Period  

Azzurra Spagnesi, Pascal Bohleber, David Wachs, Elena Barbaro, Matteo Feltracco, Daniela Festi, Jacopo Gabrieli, Linus Langenbacher, Werner Aeschbach, Markus Oberthaler, Martin Stocker-Waldhuber, Andrea Gambaro, Carlo Barbante, and Andrea Fischer

High-altitude glaciers in the western European Alps have preserved long-term records of anthropogenic air pollution, as shown by numerous ice core studies over the past three decades. These records reveal a significant increase in pollutants over the last two centuries, closely linked to industrialization, with pollutants transported from nearby regions. In contrast, long-term studies in the eastern Alps remain limited, as these glaciers were considered unsuitable for undisturbed ice core preservation due to their lower elevations and temperate basal conditions. However, recent findings suggest that, under specific circumstances, cold ice frozen to bedrock can exist below 4000 m, as demonstrated by the Weißseespitze (WSS) summit ice cap in the Eastern Alps (3499 m a.s.l.), which preserves a 6000-year-old record within ~10 m of depth, despite ongoing surface mass loss.

Building on earlier work, this study provides further insights into the WSS glacier through expanded chemical analyses of an 8.5 m deep ice core drilled in 2019, complementing previously reported data on major ions and levoglucosan. The extended dataset includes detailed profiles of 22 trace elements (Ag, As, Ba, Be, Bi, Cd, Co, Cr, Cu, Ga, In, Li, Mn, Ni, Pb, Rb, Se, Sr, Tl, U, V, Zn), carboxylic and dicarboxylic acids, obtained from discrete samples collected alongside the 2022 melting campaign performed at Ca’ Foscari University.

A Positive Matrix Factorization (PMF) analysis of the recorded impurities revealed significant anthropogenic contributions to the trace element profiles. This was supported by a Lagrangian particle dispersion model, showing that ~50% of the air masses over the WSS glacier originated in Central Europe, with a notable contribution from the Po Valley, emphasizing its historical role in pollution transport.

To refine the glacier's age-depth relationship and contextualize these findings, age constraints were obtained from micro-14C dating and 39Ar dating using atom trap trace analysis (ATTA) from a parallel ice core and additional shallow cores, integrated with the chemical dataset. This analysis determined that the glacier surface formed approximately 356 +19 -23  years prior to 2019. Additionally, the dating established a precise timeline for a significant levoglucosan and chemical peak at a depth of 6.4 meters, placing it roughly 779 +53 -63  years before 2019. The  radiometric age data were combined with an age model using the Raymond model, suitable for ice cap conditions like WSS.

Building on these insights, the regional significance of the prominent horizon at 6.4 m depth in the 2019 Weißseespitze ice core was explored by comparing the levoglucosan record with micro-charcoal data from the Schwarzboden mire in the Maneid valley, a few kilometers southeast of the glacier. This comparison revealed a striking correspondence, offering new insights into the region’s environmental history.

This study highlights the WSS glacier’s exceptional value as a long-term archive of pre-industrial pollution. However, with the industrial period already erased by ice mass loss, this archive is critically endangered. Projections suggest that 30% of the Ötztal glaciers could vanish by 2030, emphasizing the untapped potential of Eastern Alpine glaciers in reconstructing past environmental changes before they disappear.

How to cite: Spagnesi, A., Bohleber, P., Wachs, D., Barbaro, E., Feltracco, M., Festi, D., Gabrieli, J., Langenbacher, L., Aeschbach, W., Oberthaler, M., Stocker-Waldhuber, M., Gambaro, A., Barbante, C., and Fischer, A.: New chemical signatures and 39Ar dating from Weißseespitze ice cores (Eastern Alps): Tracing anthropogenic pollution from the Late Medieval to Early Modern Period , EGU General Assembly 2025, Vienna, Austria, 27 Apr–2 May 2025, EGU25-11519, https://doi.org/10.5194/egusphere-egu25-11519, 2025.

EGU25-11852 | ECS | Posters on site | CL1.2.7

Regional patterns of anthropogenic warming in East Antarctica 

Agnese Petteni, Mathieu Casado, Joel Savarino, Andrea Spolaor, Elise Fourré, Silvia Becagli, Adrien Ooms, Elsa Gautier, Amaelle Landais, Emma Samin, Massimo Frezzotti, Giuliano Dreossi, and Barbara Stenni

Global warming driven by human activities has a greater impact on polar regions than the global average, a phenomenon known as polar amplification (Casado et al. 2023; England et al. 2021). Strong warming has been directly observed in West Antarctica and in the Antarctic Peninsula. Yet, evidences in the East Antarctic Plateau region remains anecdotal (Clem et al. 2020), even though this region, characterised by thicker ice sheet, represents the largest potential source of global sea-level rise and plays a key role in understanding climatic feedbacks essential for future projections. The ERA5 reanalysis data suggest a warming trend over the recent 30-year at multiple sites on the plateau. However, the natural variability at decadal scale observed on the plateau complicates the isolation of a multi-decadal forced warming trend. In addition, the reliability of this trend estimation is constrained by the time series’ limited coverage, starting in 1940 and exhibiting a discontinuity around 1980, coinciding with the assimilation of satellite data. To address this, ice core records offer a valuable long-term climatic archive. Water stable isotopes (δ¹⁸O and δD) from ice cores, with their well-establish relationship to local temperature – commonly referred to as “paleo-thermometer” – are crucial for reconstructing past temperature variations.

In this study, we present isotopic records from four firn cores collected at the Paleo site, located in the interior of the East Antarctic Plateau. The 18-meter-deep cores were drilled during the austral summer 2019-2020 as part of the East Antarctic International Ice Sheet Traverse (EAIIST) project. By stacking the four ice cores, we enhance the signal-to-noise ratio, resulting in a record that effectively captures climate information at a scale better than interdecadal. These results are first compared to reanalysis data to evaluate their ability to represent the climatic conditions in this remote area on the plateau, which lacks direct observations. Subsequently, the extended time series is presented, offering valuable insights into climatic variability over the past ~350 years and potentially improving the isolation and quantification of the anthropogenic warming trend in this region.

How to cite: Petteni, A., Casado, M., Savarino, J., Spolaor, A., Fourré, E., Becagli, S., Ooms, A., Gautier, E., Landais, A., Samin, E., Frezzotti, M., Dreossi, G., and Stenni, B.: Regional patterns of anthropogenic warming in East Antarctica, EGU General Assembly 2025, Vienna, Austria, 27 Apr–2 May 2025, EGU25-11852, https://doi.org/10.5194/egusphere-egu25-11852, 2025.

EGU25-12402 | ECS | Posters on site | CL1.2.7

Novel insights into the microstructure and crystal-preferred orientation of million-year-old Allan Hills ice 

Nicolas Stoll, Valens Hishamunda, Margot Shaya, Colin A. Shaw, Sarah Shackleton, Ed Brook, John Higgins, and Tyler Jeffrey Fudge

Ice cores from the Allan Hills (AH) Blue Ice Area, Antarctica, are up to 6 million years of age, providing novel snapshots in time reaching back into the Miocene. However, AH ice core records are often discontinuous, probably caused by a complicated flow behaviour and, so far unknown, history. Deriving a better understanding of the past and current deformation via ice crystal orientation and microstructure analysis will help interpret these precious ice samples. We, therefore, apply a cascade of structural glaciology methods focusing on four depth regimes around identified age reversals from the 159 m long AH1901 core. Visible features in this, and other AH cores, are large, strongly elongated bubbles. We thus analyse the 2D shape preferred orientation (SPO) of almost 20,000 air bubbles within polished AH samples using established optical mapping methods. Bubble elongation (aspect ratio) is up to 3 times larger than in, e.g., the WAIS divide ice core and is comparably consistent throughout all samples, implying a critical ice-strain rate for a significant time. Similar results were derived via 3D micro-CT investigations. High-resolution grain boundary network analyses via Large Area Scanning Macroscope (LASM) reveal comparably large, bulging crystals with amoeboid shapes, indicating strong recrystallisation. Mean crystal sizes in horizontally (to the core axis) orientated samples are roughly 2-5 times larger than in vertically oriented crystals indicating highly elongated crystal shapes. Finally, we investigated the crystal-preferred orientation (CPO or fabric) within polished thin sections (300 μm) with an automated fabric analyser (G50). Preliminary data show broad single maxima CPOs with several deviating crystals. Closer investigations identify these diverging crystals as bands of crystals with a different orientation intruding the matrix of similar-orientated crystals. Comparable observations were made in the NEEM core (tilted lattice bands), and they could indicate highly localised shear zones. Further investigations on additional samples will help characterise the flow history of AH ice.

How to cite: Stoll, N., Hishamunda, V., Shaya, M., Shaw, C. A., Shackleton, S., Brook, E., Higgins, J., and Fudge, T. J.: Novel insights into the microstructure and crystal-preferred orientation of million-year-old Allan Hills ice, EGU General Assembly 2025, Vienna, Austria, 27 Apr–2 May 2025, EGU25-12402, https://doi.org/10.5194/egusphere-egu25-12402, 2025.

EGU25-12745 | Posters on site | CL1.2.7

First results from a dual-wavelength (157 & 193 nm) LA-ICP-MS/MS System for spatially-resolved chemical analysis of ice cores 

Tobias Erhardt, C. Ashley Norris, Michael Shelly, Ruben Rittberger, Linda Marko, Alexander Schmidt, and Wolfgang Müller

In recent years, laser ablation inductively coupled plasma mass spectrometry (LA-ICPMS) applied to ice-core samples has become the go-to method to investigate climate signals in highly thinned sections of ice cores and the interaction of impurities and the ice’s microstructure. Ablation is typically performed using DUV (deep UV, 193 nm or 213 nm) excimer laser sources. However, at these wavelengths ice is virtually transparent leading to high penetration of the laser energy into the ice. That means that ablation is sometimes non-controlled and likely depends on the impurity load of the ice, and may require very high on-sample fluence. This makes it challenging to generate calibrated ice-core impurity records using cryo-LA-ICPMS. One approach to overcome this is to utilize a laser wavelength that is absorbed by the ice, resulting in shallower penetration. To implement this, we have built a unique custom-designed dual-wavelength LA system that can use both 193 nm and 157 nm excimer lasers. At 157 nm, ice is strongly absorbent, which implies good energy transfer into the sample. Our setup has already been successfully used to ablate other DUV-transparent materials such as fused silica and quartz.

Here we present the design of the system and the accompanying purpose-built cryo sample holder that allows us to use both 193 nm and 157 nm laser light for the analysis of ice-core samples. The holder is designed to enable high sample throughput by keeping three 14 cm long ice core samples alongside reference materials and frozen standards inside the proven Laurin Technic S155 ablation chamber. In addition to showcasing the design of our system we will show initial results of laser ablation analyses from Greenland ice core samples over Stadial/Interstadial transitions using an Agilent 8900 ICP-MS/MS. In the presented setup the system can be used both to generate high-depth-resolution down-core time series as well as high-resolution impurity maps, both of which are essential to further our understanding of the signal preservation in the ice and to ultimately reconstruct climate variability from highly thinned ice-core records such as the >1Ma old Beyond EPICA Oldest Ice core.

How to cite: Erhardt, T., Norris, C. A., Shelly, M., Rittberger, R., Marko, L., Schmidt, A., and Müller, W.: First results from a dual-wavelength (157 & 193 nm) LA-ICP-MS/MS System for spatially-resolved chemical analysis of ice cores, EGU General Assembly 2025, Vienna, Austria, 27 Apr–2 May 2025, EGU25-12745, https://doi.org/10.5194/egusphere-egu25-12745, 2025.

EGU25-14784 | Posters on site | CL1.2.7

Beyond EPICA Little Dome C (BELDC) field seasons to bedrock 

Frank Wilhelms and the BELDC field participants 2022/23, 23/24, 24/25, stable isotope field measurements team, dating team

The European Project for Ice Coring in Antarctica (EPICA) Beyond EPICA – Oldest Ice aims at retrieving a continuous ice core record of climate feedback and forcing spanning about 1.5 Ma back in time. In that period the cyclicity of glacial/interglacial changes in continental ice sheet volume and temperature changed from 40 ka to the well-known 100 ka cycles encountered over the last 800 ka. After determining a suitable drill site Little Dome C (LDC), 35 km southwest of Concordia station, during an extensive pre-site survey, we penetrated to 2800 m depth during the third deep drilling season 2024/25, roughly spanning at least 1.2 Ma and a basal unit below 2584 m. We will report on the drilling and core processing activities, completed to the bottom at 2800 m depth.

How to cite: Wilhelms, F. and the BELDC field participants 2022/23, 23/24, 24/25, stable isotope field measurements team, dating team: Beyond EPICA Little Dome C (BELDC) field seasons to bedrock, EGU General Assembly 2025, Vienna, Austria, 27 Apr–2 May 2025, EGU25-14784, https://doi.org/10.5194/egusphere-egu25-14784, 2025.

EGU25-14884 | ECS | Posters on site | CL1.2.7

Reconstructing Mean Ocean Temperature over a full glacial cycle using noble-gas ratios from the EDC ice core 

Henrique Traeger, Markus Grimmer, Jochen Schmitt, Daniel Baggenstos, and Hubertus Fischer

The ocean is the largest heat reservoir of the planet active on millennial to orbital time scales. By observing and reconstructing its temperature changes – together with the evolution of ice sheet volume – insights on the distribution of Earth’s energy balance may be traced though time (Baggenstos et al., 2019).
MOT is reconstructed in our studies from noble gases trapped within ice cores. Noble gases are inert: as a result, they partition in a simple two reservoirs system: the atmosphere and the ocean and are not affected by biological cycles in the ocean. As the atmospheric concentration of noble gases is tied to their solubility in the ocean, and the latter is in turn mostly temperature dependent, the concentration recorded within ice cores gas bubbles or clathrates creates a continuous atmospheric record through time. As heat and noble gases are conservatively entrained into the interior of the ocean, we stress that with our MOT approach we obtain the integrated ocean heat content at a given point in time, integrating over all water parcels of the ocean which have different ventilation ages, hence which have equilibrated at the ocean surface at different points back in time. Accordingly, MOT is a convoluted signal of past sea surface temperatures biased towards regions of deep and intermediate water formation.
The majority of MOT analyses carried out thus far have focused on glacial terminations. Here, we build upon the already existing TIV & TIII data to present early results focused on the glacial cycle in-between. The EPICA Dome C ice core is used to reconstruct MOT fluctuation during Marine Isotope Stage 8 (MIS 8: 255 – 330 ka) with a millennia-scale resolution. This allows to look in the detail of a glacial inception and investigate the mechanisms triggering the onset of glaciation.


Baggenstos, D., Häberli, M., Schmitt, J., Shackleton, S. A., Birner, B., Severinghaus, J. P., Kellerhals, T., & Fischer, H. (2019). Earth’s radiative imbalance from the Last Glacial Maximum to the present. Proceedings of the National Academy of Sciences of the United States of America, 116(30), 14881–14886. https://doi.org/10.1073/pnas.1905447116

How to cite: Traeger, H., Grimmer, M., Schmitt, J., Baggenstos, D., and Fischer, H.: Reconstructing Mean Ocean Temperature over a full glacial cycle using noble-gas ratios from the EDC ice core, EGU General Assembly 2025, Vienna, Austria, 27 Apr–2 May 2025, EGU25-14884, https://doi.org/10.5194/egusphere-egu25-14884, 2025.

EGU25-14925 | ECS | Orals | CL1.2.7

Measurements of the 36Cl/10Be ratio in the deep ice of Talos Dome (East Antarctic): applications to paleomagnetism and ice dating. 

Alexis Lamothe, Mélanie Baroni, Ellyn Auriol, Mirko Severi, Aster Team, and Edouard Bard

Cosmogenic nuclides such as beryllium-10 (10Be) and chlorine-36 (36Cl) are valuable tools for dating deep ice cores and reconstructing paleomagnetic events. These nuclides are formed through interactions of target atoms in the atmosphere with galactic cosmic rays and deposited on ice sheets in aerosol form only and aerosol and gaseous forms for 10Be and 36Cl, respectively. However, questions persist regarding the preservation of their production signals in deep ice cores. In particular, low snow accumulation rates favour H36Cl migration and outgassing from the snowpack (Delmas et al., 2004; Pivot et al., 2019).

Here, we present new measurements of 10Be and 36Cl in the Talos Dome ice core, focusing on periods older than 170 ka BP. When corrected from the radioactive decay of 36Cl and 10Be, a 36Cl/10Be ratio of 0.125 is observed, consistent with ratios observed during the last 700 years in the Talos Dome ice core. The 36Cl/10Be ratio generally overestimate the reconstructed age compared to those expected from AICC2023 chronology (Bouchet et al., 2023). Thus, the consideration of climatic and chemical concentrations is necessary to correctly apply the 36Cl/10Be ratio as a dating tool.

Additionally, 10Be and 36Cl fluxes record past Earth magnetic field variations. We identify the Iceland Basin geomagnetic excursion around 190 ka as a clear stratigraphic marker, associated with a near doubling of the 10Be and 36Cl fluxes compared to background levels. By contrast, evidence for the Pringle Falls excursion(s) is less apparent. This different observation suggests that only the most intense excursions can be recorded in East Antarctic ice cores. This conclusion is of importance for future consideration of Beyond EPICA ice samples for investigating excursions and inversions after 800 ka.

Overall, our findings underscore the good preservation of atmospheric cosmogenic nuclide signals in the Talos Dome ice core, reinforcing their utility for dating deep ice and investigating paleomagnetic events.

How to cite: Lamothe, A., Baroni, M., Auriol, E., Severi, M., Team, A., and Bard, E.: Measurements of the 36Cl/10Be ratio in the deep ice of Talos Dome (East Antarctic): applications to paleomagnetism and ice dating., EGU General Assembly 2025, Vienna, Austria, 27 Apr–2 May 2025, EGU25-14925, https://doi.org/10.5194/egusphere-egu25-14925, 2025.

EGU25-15112 | ECS | Orals | CL1.2.7

Nitrate record of the 2022 Mt. Logan ice core suggests highest elevation regions sensitive to atmospheric acidity 

Kira Holland, Alison Criscitiello, Joseph McConnell, Bradley Markle, Hanaa Yousif, Britta Jensen, Sophia Wensman, Emma Skelton, Dominic Winski, Seth Campbell, and Nathan Chellman

Anthropogenic nitrogen oxide (NOx = NO + NO2) emissions have increased since the Industrial Revolution as a result of fossil fuel burning, contributing to increasing atmospheric acidity and changes to the oxidative capacity of the atmosphere. Oxidation of NOx leads to the formation of atmospheric nitrate both in the gas phase (HNO3(g)) and aerosol phase (p-NO3), which may then be removed from the atmosphere via wet and dry deposition. Ice core records of nitrate may thus be used to infer past changes in atmospheric NOx concentrations and atmospheric acidity given high enough accumulation rates to prevent substantial post-depositional photolytic loss from the snowpack. Increasing trends innitrate concentrations over the 20th century have been observed in ice core records throughout the Northern Hemisphere including Greenland and the North Pacific. However, two ice cores (1980 NW Col and 2002 PR Col ice cores) retrieved from the summit plateau (5,334 m a.s.l.) of Mt. Logan, the second tallest mountain in North America located in the glaciated region of the St. Elias Mountains in southwest Yukon, revealed no long-term trend in acid chemistry. This lack of sensitivity to increasing atmospheric acidity was largely attributed to the high elevation of the site within the free troposphere and the efficient scrubbing of atmospheric pollutants during transit across the Pacific. Here, we present a nitrate record from the new 2022 Mt. Logan ice core since 1912 CE (~256 m depth). Reconstructed accumulation at the site is extremely high with an average rate of 2.97 m weq a-1 from 1912 to 2020, implying excellent preservation of volatile species coupled with low average temperatures (-26.9°C). The nitrate record suggests a statistically significant (p < 0.01) increasing trend since 1912 CE, in contrast to both the NW Col and PR Col records. The record agrees with other Northern Hemisphere ice core nitrate records including Summit (Greenland; r = 0.49, p < 0.01, 1912–2006), Begguya (Alaska; r = 0.44, p < 0.01, 1912–2012), and Eclipse (Yukon; r = 0.30, p < 0.01, 1912–2001). These results indicate that the highest elevation regions of the North Pacific, such as Mt. Logan, are indeed sensitive to anthropogenic NOx emissions, with ice cores providing rare insight into mid-tropospheric acid chemistry where preservation is adequate.

How to cite: Holland, K., Criscitiello, A., McConnell, J., Markle, B., Yousif, H., Jensen, B., Wensman, S., Skelton, E., Winski, D., Campbell, S., and Chellman, N.: Nitrate record of the 2022 Mt. Logan ice core suggests highest elevation regions sensitive to atmospheric acidity, EGU General Assembly 2025, Vienna, Austria, 27 Apr–2 May 2025, EGU25-15112, https://doi.org/10.5194/egusphere-egu25-15112, 2025.

EGU25-15678 | ECS | Posters on site | CL1.2.7

Cryo-SEM and EBSD on air clathrate hydrates in polar ice 

Florian Painer, Maartje Hamers, Martyn Drury, Sepp Kipfstuhl, and Ilka Weikusat

In the deeper part of polar ice sheets, air clathrate hydrates (commonly referred to as air hydrates) trap most of the ancient air molecules in their crystal structure, which is the only direct paleo-atmosphere access used for paleoclimatic reconstructions. They form the cubic structure II (sII or CS-II), which consists out of cages formed by water molecules in which the air molecules are enclosed. However, their microstructure and crystallinity are poorly understood.

Studying air hydrates in polar ice is challenging because they are thermodynamically unstable and dissociate under the temperature and pressure conditions in the cold-laboratories. However, the surrounding ice acts as a pressure cell to keep them metastable for a certain amount of time (in the order of years to tens of years).

We use transmitted light microscopy paired with Cryogenic Scanning Electron Microscopy (Cryo-SEM) to investigate air hydrates in polar ice cores. Transmitted light microscopy enables the localization of air hydrates inside the ice sample. Ice grain boundaries and ice relaxation features, such as plate-like inclusions, are useful for orientation during SEM analysis. Air hydrates at or close to the samples surface already dissociate in the cold-laboratory during sample preparation, and form a characteristic structure. Controlled sublimation inside the SEM chamber allows to observe air hydrates previously located inside the ice sample and to investigate their dissociation behavior with sub-micron resolution. For the first time, we perform Electron Backscatter Diffraction (EBSD) analysis on air hydrates in polar ice, which is a powerful method to study the crystallographic structure of materials.

How to cite: Painer, F., Hamers, M., Drury, M., Kipfstuhl, S., and Weikusat, I.: Cryo-SEM and EBSD on air clathrate hydrates in polar ice, EGU General Assembly 2025, Vienna, Austria, 27 Apr–2 May 2025, EGU25-15678, https://doi.org/10.5194/egusphere-egu25-15678, 2025.

EGU25-16850 | ECS | Posters on site | CL1.2.7

Investigating the relationship between Total Air Content (TAC) variations in polar ice cores and surface climate conditions 

Héloïse Guilluy, Émilie Capron, Frédéric Parrenin, Vladimir Lipenkov, Jochen Schmitt, Zhipeng Wu, Qiuzhen Yin, Anna Klüssendorf, Amaëlle Landais, Patricia Martinerie, Barbara Seth, Hubertus Fischer, and Dominique Raynaud

Ice cores constitute a valuable archive for reconstructing climate and atmospheric composition from glacial-interglacial to annual timescales. The Total Air Content (TAC), corresponding to the total volume of air trapped in ice, reflects changes in atmospheric pressure, temperature, and pore volume at the bubble close-off at the bottom of the firn. Building on these properties, TAC has been employed as a paleoelevation proxy and more recently as an orbital dating tool. Pore volume at bubble close-off depends not only on atmospheric pressure but also on local surface conditions driving firn densification and air entrapment efficiency through processes like compaction and snow grain metamorphism.

Investigating the relative impact of different surface climate parameters on the TAC signal, requires evaluating variables such as local insolation, accumulation rate, and seasonal temperature variations. Previous studies have mainly focused on site-specific analyses, limiting broader insights into regional and global patterns. To address this gap, we compiled TAC data from 30 ice cores across Antarctica and Greenland, combining published datasets with new measurements from the EDC, EDML and TALDICE ice cores. This data compilation includes sites with highly contrasting local climatic conditions, in terms of accumulation rates (1150 to 22 mm w.e. yr-1) and surface temperatures (-14 to -58°C). In addition to surface parameters (e.g. reconstructed annual surface temperatures and accumulation rates, Half Year local Summer Insolation index and atmospheric pressures), simulated summer temperatures from an Earth system model of intermediate complexity were used to be compared to past TAC changes. Then, we apply a series of statistical analyses on the compiled dataset, including linear and multiple regression analyses as well as residual analyses, to evaluate the relationships between TAC and the different environmental parameters at orbital and millennial scales. We also compare the measured TAC datasets with TAC outputs from the IGE firn densification model.

Our results highlight regional contrasts in the relationship between TAC variations and the different surface climate parameters. For Greenlandic ice cores we observed strong correlations observed between TAC and climatic parameters. For instance, at NGRIP and GRIP sites, coefficients of determination (R2) between TAC and Half Year Summer Insolation are higher than 0.6. Antarctic sites, including those on the East plateau, exhibited more variable and site-specific responses. For example, at EDC and Dome Fuji sites, the R2 between TAC and Half Year Summer Insolation is respectively 0.3 and 0.6. These findings underline the critical importance of addressing site-dependent dynamics to use TAC as a robust environmental proxy and orbital dating tool.


How to cite: Guilluy, H., Capron, É., Parrenin, F., Lipenkov, V., Schmitt, J., Wu, Z., Yin, Q., Klüssendorf, A., Landais, A., Martinerie, P., Seth, B., Fischer, H., and Raynaud, D.: Investigating the relationship between Total Air Content (TAC) variations in polar ice cores and surface climate conditions, EGU General Assembly 2025, Vienna, Austria, 27 Apr–2 May 2025, EGU25-16850, https://doi.org/10.5194/egusphere-egu25-16850, 2025.

EGU25-17165 | ECS | Orals | CL1.2.7

How accurate was the age modelling for the Beyond EPICA ice core? 

Ailsa Chung and the Beyond EPICA community

The International Partnership on Ice Core Science (IPICS) set the “Oldest Ice” challenge of retrieving an ice core with a continuous palaeoclimatic record covering the past 1 million years. In order to determine good ice core drill sites, flow modelling is required to assess the potential age of the ice. Different age models were applied to the Beyond EPICA drill site on Little Dome C in East Antarctica. During the 2024/2025 Antarctic field season, drilling reached bedrock and the preliminary measurements from the field suggest the age of the oldest ice to be over 1.2 million years.

In this work, we compare age-depth tie points observations to both 1D and 2.5D ice flow models. The comparison shows how different models using different constraining radar surveys performed when compared with observations from the ice core. We also discuss why a simpler model may be more appropriate in the Dome C region. This validation exercise is of special interest to other ice core drilling projects where these modelling techniques have been used and for searching for new potential “Oldest Ice” drill sites.

How to cite: Chung, A. and the Beyond EPICA community: How accurate was the age modelling for the Beyond EPICA ice core?, EGU General Assembly 2025, Vienna, Austria, 27 Apr–2 May 2025, EGU25-17165, https://doi.org/10.5194/egusphere-egu25-17165, 2025.

EGU25-17368 | Orals | CL1.2.7

Basal section of the Beyond EPICA Little Dome C ice core 

Julien Westhoff and the Beyond EPICA Community

The Beyond EPICA project aims to collect ice of more than one million years of age. This ice is found approx. 200m above bedrock, the basal unit remained a mystery before drilling. We present the first results from the basal unit, i.e. the section identified from radio-stratigraphy, which seemed to be unstratified and, based on modeling results, also potentially stagnant. Variations in crystal size measured on-site reveal the gradual transition into this basal unit. In the approx. 5 m of basal ice recovered from the core, we find layered bands containing 1-2mm rocks, clogged clays sections of banded dispersed facies, and repetitive transitions of clear ice to debris-rich ice. The mineralogic composition is mainly of granitic and gneiss rocks, mainly in the size fraction of sand. With these new results, we can increase our understanding of ice sheets' formation and evolution, ice flow over the bedrock, and variations in rheology due to ice crystals.

How to cite: Westhoff, J. and the Beyond EPICA Community: Basal section of the Beyond EPICA Little Dome C ice core, EGU General Assembly 2025, Vienna, Austria, 27 Apr–2 May 2025, EGU25-17368, https://doi.org/10.5194/egusphere-egu25-17368, 2025.

EGU25-18382 | ECS | Orals | CL1.2.7

Physical properties in the shear margin of the Northeast Greenland Ice Stream 

Johanna Kerch, Audrey Wichartz, Kyra Streng, Nicolas Stoll, Daniela Jansen, Johannes Freitag, Henning Ullrich, Sepp Kipfstuhl, Dorthe Dahl-Jensen, and Ilka Weikusat

The North-East Greenland Ice Stream (NEGIS) is a major contributor to ice loss experienced by the Greenland Ice Sheet. Our current understanding of the mechanics of this highly dynamic feature is limited compared to the surrounding slowly deforming ice sheet, but significant for enhancing ice flow models and attaining more accurate sea-level rise projections. Especially the shear margins of an ice stream are the regions where, in addition to the ice stream bed, a large part of the deformation occurs. To study the deformation processes that are active in the shear margins on the basis of sub-surface ice samples will contribute to our understanding of how fast flow in ice streams is enabled. The East Greenland Ice-core Project drilled the first deep ice core in such a fast-flowing regime at the onset of NEGIS, reaching bedrock at approximately 2670 m. The EGRIP ice core data provide a comprehensive record of the crystal-preferred orientation (CPO) throughout the core. Additionally, short cores of approximately 100 m length (S5, ExS5-1, ExS5-2) were drilled in 2019 and 2022 in the shear margin south-east of the main core drilling site.

We present results from CPO analysis of these three cores, supported by density data and temperature profiles from the boreholes. Comparing our results with those from the main core reveals the effect of shear localisation in the margin on the physical properties of the ice, and highlights the significant lateral variation between the three locations set in the shear margin within distances of 2-3 km.

How to cite: Kerch, J., Wichartz, A., Streng, K., Stoll, N., Jansen, D., Freitag, J., Ullrich, H., Kipfstuhl, S., Dahl-Jensen, D., and Weikusat, I.: Physical properties in the shear margin of the Northeast Greenland Ice Stream, EGU General Assembly 2025, Vienna, Austria, 27 Apr–2 May 2025, EGU25-18382, https://doi.org/10.5194/egusphere-egu25-18382, 2025.

EGU25-18499 | ECS | Posters on site | CL1.2.7

High resolution hyperspectral, microphysical and mineralogical interdisciplinary approach applied on the 224 m long ice core drilled on the Adamello glacier (Italian Alps) 

Deborah Fiorini, Barbara Delmonte, Elena Di Stefano, Clara Mangili, Sergio Andò, Alessandro Cavallo, Susan Kaspari, Claudio Artoni, and Valter Maggi

The capability of ice-covered surfaces to reflect solar electromagnetic radiation is significantly influenced by mineral dust, one of the primary components of aerosols. This dust alters the reflectance of the ice, causing a larger portion of the radiation to be absorbed, depending on the properties of the dust layer.

The aim of this work is to apply a novel hyperspectral, microphysical and mineralogical interdisciplinary approach for the characterisation of ice cores and the entrapped mineral dust. More than 120 m of the 224 m long ADA270 ice core drilled in 2021 from the Adamello glacier (Pian di Neve, Italian Alps) has been analysed trough this method. A non-destructive Hyperspectral imaging sensor is used to create high-spatial and high-spectral resolution images in the VNIR wavelength range (380-1000 nm).

Hyperspectral measurements were performed at the EuroCold Laboratory of the University Milano-Bicocca (Italy). From these, some optical descriptors such as Albedo, Snow Darkening Index (SDI) and Impurity Index (II) (Di Mauro B. et al, 2015) were extracted. We compared results with independent measurements of dust concentration, grain size (Coulter Counter) and mineralogy (X-Ray Diffraction). Also, single-grain analyses with a Hyperspectral Imaging Microscope Spectrometer (HIMS, Central Washington University, USA) generating reflectance spectra in the same VNIR range were performed in order to explore the possibility to associate the optical footprint of dust layers to specific mineralogical mixtures.

The hyperspectral analysis of the ice core, spanning depths from 3.4 to 124 meters, revealed a sequence of melting-refreezing zones, bubbled regions, and dusty layers, these latter particularly abundant in the upper part of the core. Comparison of the SDI signal with the mineral dust concentrations confirms that, as expected, reflectance diminishes as mineral dust content rises. The mineralogical analyses indicate a notable presence of Quartz, Chlorite, and Biotite, likely due to local transport, along with Kaolinite, a secondary mineral typically linked to Saharan dust transport. By means of the HIMS system various reflectance spectra were extracted from dust samples, providing valuable insights into the optical effects of mineral dust transport through the atmosphere and aiding in the identification of its source region.

By integrating hyperspectral, microphysical, and XRD data, a comprehensive characterization of the inorganic content of the Adamello ice core can be achieved. Micro-hyperspectral measurements offer a qualitative assessment of the optical impact of individual minerals, helping to assess their influence on atmospheric optics, glacier melting rates, and the response of hyperspectral scanning systems.

How to cite: Fiorini, D., Delmonte, B., Di Stefano, E., Mangili, C., Andò, S., Cavallo, A., Kaspari, S., Artoni, C., and Maggi, V.: High resolution hyperspectral, microphysical and mineralogical interdisciplinary approach applied on the 224 m long ice core drilled on the Adamello glacier (Italian Alps), EGU General Assembly 2025, Vienna, Austria, 27 Apr–2 May 2025, EGU25-18499, https://doi.org/10.5194/egusphere-egu25-18499, 2025.

EGU25-18857 | ECS | Orals | CL1.2.7

Optical characterisation of mineral dust in polar ice: towards an improved understanding of climate-regulating processes 

Valentina Raspagni, Marco Alberto Carlo Potenza, Barbara Delmonte, Luca Teruzzi, Llorenç Cremonesi, Giovanna Scaiano, and Walter Maggi

Polar ice cores represent a unique and invaluable archive, offering an exceptional resource for enhancing our understanding of the atmospheric composition over time and its aerosol content. These cores preserve, over millennia, crucial information such as air bubbles, solid particles trapped in ice, as well as isotopes, heavy metals, and radioactive elements. Among the various paleoclimatic proxies, mineral dust is widely recognized as a key component of the climate system, strongly linked to the glacial-interglacial climate oscillations of the Quaternary period. Nevertheless, its impact on the radiative balance of the planet system remains to be fully quantified, primarily due to the considerable variations in its optical properties that occur over both space and time. In this context, laser-sensing instruments emerge as a versatile and non-destructive tool suitable for in-line characterisation of particle radiative properties.


In this work, we present an optical technique which provides two optical parameters, namely the extinction cross-section and the polarizability, of each particle passing through a focused laser beam under continuous forced flow, called Single Particle Extinction and Scattering (SPES). This method, developed by the Instrumental Optics of the Physics Department of the University of Milan, is based on the far-field, self-reference interference between the zero-angle field scattered by each nano- or microparticle and the more intense field transmitted through the sample.


This analysis has been applied to the EPICA ice core drilled at Dome C, East Antarctica, with depth range from about 200 to 2900 m.  In deeper sections, where growth and recrystallisation of ice grains might cause relocation of impurities, particular attention has been directed towards the identification of dust aggregates, which have the potential to alter the original paleoclimate signal. Preliminary results and insight on the SPES method will be presented.


How to cite: Raspagni, V., Potenza, M. A. C., Delmonte, B., Teruzzi, L., Cremonesi, L., Scaiano, G., and Maggi, W.: Optical characterisation of mineral dust in polar ice: towards an improved understanding of climate-regulating processes, EGU General Assembly 2025, Vienna, Austria, 27 Apr–2 May 2025, EGU25-18857, https://doi.org/10.5194/egusphere-egu25-18857, 2025.

EGU25-19112 | Posters on site | CL1.2.7

March 2022 warm event detected in precipitation and surface snow at Concordia Station in East Antarctica 

Giuliano Dreossi, Mauro Masiol, Daniele Zannoni, Claudio Stefanini, Claudio Scarchilli, Virginia Ciardini, Paolo Grigioni, Massimo Del Guasta, Amaëlle Landais, Mathieu Casado, Inès Ollivier, Stefan Terzer-Wassmuth, Lorenzo Copia, and Barbara Stenni

An unprecedented heatwave affected East Antarctica between 15 and 19 March 2022, triggering record-high temperatures from the coastal regions to the Antarctic plateau. The event was caused by an intense atmospheric river that transported heat and moisture from the central and southwestern subtropical Indian Ocean at lower latitudes into the interior of continental Antarctica. Although the poleward moisture advection ceased after 18 March, a counterclockwise flow of clouds around a blocking anticyclone trapped the residual moisture over Antarctica. This led to sustained high surface temperatures for several days following the atmospheric river event (Wille et al., 2024a).

The heatwave brought rain and caused significant surface melting in coastal areas and intense snowfall events in the inner Antarctic region, which contributed to an overall positive mass balance. The Italian stake farm close to Concordia Station observed an accumulation of ~7 cm from 15 February to 22 March, which represents almost 90% of the local amount of accumulation.

Although the March 2022 heatwave lasted only for some days, model results suggest that this anomaly can be retrieved from ice core records over the equivalent of several years of snow accumulation (Wille et al., 2024b).

Since 2008, daily precipitation has been collected at Concordia Station, East Antarctica. The snow collected during the March 2022 heatwave exhibits δ¹⁸O and δ²H values that are the highest recorded since precipitation collection began. On 9 January 2023, a high-resolution snow pit, sampled at 2 cm intervals, was dug at Concordia. The isotopic analysis revealed a significant peak between 12 and 16 cm in depth, with three δ¹⁸O values exceeding -40‰. These unusually high values can be directly linked to the precipitation from the March 2022 heatwave.

The oceanic origin of the water vapor was also observed in tritium (3H) levels: in the Dome C 2022 precipitation reconnaissance measurements, values were as low as 10 TU (compared to between 20 and 400 TU during the rest of the year), which is in good agreement with GNIP observation sites closer to the Antarctic coast at similar latitudes.

Understanding the effects of single heatwave events on the isotopic signal stored in snow, firn and in ice cores is fundamental to better constrain palaeoclimatological studies, where isotopic analysis is widely used in climate reconstruction studies.


Wille, J. D., and Coauthors, 2024a. https://doi.org/10.1175/JCLI-D-23-0175.1

Wille, J. D., and Coauthors, 2024b. https://doi.org/10.1175/JCLI-D-23-0176.1

How to cite: Dreossi, G., Masiol, M., Zannoni, D., Stefanini, C., Scarchilli, C., Ciardini, V., Grigioni, P., Del Guasta, M., Landais, A., Casado, M., Ollivier, I., Terzer-Wassmuth, S., Copia, L., and Stenni, B.: March 2022 warm event detected in precipitation and surface snow at Concordia Station in East Antarctica, EGU General Assembly 2025, Vienna, Austria, 27 Apr–2 May 2025, EGU25-19112, https://doi.org/10.5194/egusphere-egu25-19112, 2025.

EGU25-20335 | ECS | Posters on site | CL1.2.7

Placing the Weddell Sea Holocene elevation drop in context: New records of total air content from Fletcher Promontory and Skytrain Ice Rise 

Janani Venkatesh, Amy King, Korina Chapman, Shaun Miller, Christoph Nehrbass-Ahles, Robert Mulvaney, Eric Wolff, Xavier Faïn, Emilie Capron, and Thomas Bauska

The West Antarctic Ice Sheet (WAIS), holding close to five metres sea level equivalent of ice, has long been considered one of the major tipping elements in the Earth’s climate system. A recent study suggests that WAIS is perhaps one of the most decisive elements in this system as well (Wang et al., 2023). Total Air Content (TAC) data (a proxy for ice sheet elevation) from the Skytrain Ice Rise ice core (~79°S, 078°W, 784 m altitude) shows rapid elevation changes of around 100 m within decadal timescales around 8,000 years ago at this site (Grieman et al.,2024), which provides strong evidence towards the vulnerability of this region and the need to understand its past behaviour in high spatial and temporal resolution.

Here, we present a complete record of TAC during the Holocene from the Fletcher Promontory ice core (~78°S, 082°W, 873 m altitude) located around 220 km from the Skytrain Ice Rise site. The record covers the entire Holocene until ~11,000 years BP, measured on a high-accuracy TAC system. Using the two records from Skytrain Ice Rise and Fletcher Promontory, the long-term trends and offsets in this region during the Holocene are investigated. The reliability of the TAC data and the robustness of our measurement system are also discussed, along with implications for WAIS and possible future studies.

Wang, S. et al: Mechanisms and Impacts of Earth System Tipping Elements. Reviews of Geophysics 61, 1 (2023).  https://doi.org/10.1029/2021RG000757

Grieman, M.M., Nehrbass-Ahles, C., Hoffmann, H.M. et al.: Abrupt Holocene ice loss due to thinning and ungrounding in the Weddell Sea Embayment. Nat. Geosci. 17, 227–232 (2024). https://doi.org/10.1038/s41561-024-01375-8

How to cite: Venkatesh, J., King, A., Chapman, K., Miller, S., Nehrbass-Ahles, C., Mulvaney, R., Wolff, E., Faïn, X., Capron, E., and Bauska, T.: Placing the Weddell Sea Holocene elevation drop in context: New records of total air content from Fletcher Promontory and Skytrain Ice Rise, EGU General Assembly 2025, Vienna, Austria, 27 Apr–2 May 2025, EGU25-20335, https://doi.org/10.5194/egusphere-egu25-20335, 2025.

EGU25-21557 | ECS | Orals | CL1.2.7

Sea ice diatoms in ice cores, a novel proxy for reconstructing past Antarctic sea ice changes 

Dieter Tetzner, Elizabeth Thomas, and Claire Allen
Antarctic sea ice plays a key role in modulating regional and global climate. Over the last decade, Antarctic sea ice has presented a rapid decline. However, observational records are short, hindering our ability to directly assess the wider context of the recently observed changes. In the absence of long direct observations, ice core proxy records have the potential to yield valuable information about past environmental changes over long timescales.
In this study, we present multiple records of sea ice diatoms preserved in a set of ice cores retrieved from two sub-Antarctic islands within the seasonal sea ice zone and two coastal Antarctic Peninsula sites. The abundance of sea ice diatoms preserved in ice core layers strongly correlates with spring sea ice concentration upwind from the ice core sites. This strong relationship highlights the sea ice diatom abundance preserved in ice layers as a novel Antarctic sea ice concentration proxy.

How to cite: Tetzner, D., Thomas, E., and Allen, C.: Sea ice diatoms in ice cores, a novel proxy for reconstructing past Antarctic sea ice changes, EGU General Assembly 2025, Vienna, Austria, 27 Apr–2 May 2025, EGU25-21557, https://doi.org/10.5194/egusphere-egu25-21557, 2025.

EGU25-384 | ECS | Orals | CL1.2.10

ACCESS-ESM1.5 model simulations of AMOC shutdown during Heinrich 5: impacts on Southern Hemisphere hydroclimate 

Yanxuan Du, Josephine Brown, Laurie Menviel, Himadri Saini, Russell Drysdale, and David Hutchinson

The Last Glacial Period was characterised by repeated millennial-scale climate oscillations which are commonly referred as the Dansgaard-Oeschger (D-O) variability. During some of the coldest D-O stadials, massive icebergs discharged into the North Atlantic Ocean leading to a substantial weakening of the Atlantic Meridional Overturning Circulation (AMOC). These events are known as Heinrich events. In this study, we perform North Atlantic freshwater hosing experiments under 49 ka boundary conditions to simulate Heinrich 5 using the Australian Earth System Model ACCESS-ESM1.5 (CMIP6/PMIP4 model). We investigate the Southern Hemisphere and Australian climate response to an AMOC shutdown. The simulated temperature and precipitation changes are compared with available proxy reconstructions of Heinrich stadials, with a focus on the Southern Hemisphere. These idealised simulations provide insight into the processes linking changes in North Atlantic climate to the Southern Hemisphere, and particularly the Australian region.

How to cite: Du, Y., Brown, J., Menviel, L., Saini, H., Drysdale, R., and Hutchinson, D.: ACCESS-ESM1.5 model simulations of AMOC shutdown during Heinrich 5: impacts on Southern Hemisphere hydroclimate, EGU General Assembly 2025, Vienna, Austria, 27 Apr–2 May 2025, EGU25-384, https://doi.org/10.5194/egusphere-egu25-384, 2025.

EGU25-1253 | ECS | Posters on site | CL1.2.10

Evaluating Dansgaard–Oeschger-like Oscillations in Climate Models: A Model-Data Comparison of MIS3 Variability 

Irene Malmierca-Vallet, Louise C. Sime, Xu Zhang, John Slattery, Marlene Klockmann, Erin L. McClymont, Paul J. Valdes, and Guido Vettoretti

A model-data comparison is an effective method for evaluating both proxy-based climate reconstructions and simulated model outputs. The MIS3 period is marked by a wide range of proxy records that indicate millennial-scale climate variability globally. In this study, we use paleoclimate proxy data to assess the performance of four climate models: CCSM4, HadCM3, MPI-ESM, and COSMOS. We compare model results of Dansgaard–Oeschger (D-O)-like oscillations with recent North Atlantic sea surface temperature reconstructions from 10–50 ka. Additionally, we evaluate the models based on Antarctic warming during Greenland Stadials, the timing of Antarctic temperature changes relative to Greenland, the duration and amplitude of D-O events, and the position of the Intertropical Convergence Zone. All four models suggest that D-O event temperature anomalies are primarily driven by changes in the Atlantic Meridional Overturning Circulation (AMOC) and North Atlantic sea ice extent.

How to cite: Malmierca-Vallet, I., Sime, L. C., Zhang, X., Slattery, J., Klockmann, M., McClymont, E. L., Valdes, P. J., and Vettoretti, G.: Evaluating Dansgaard–Oeschger-like Oscillations in Climate Models: A Model-Data Comparison of MIS3 Variability, EGU General Assembly 2025, Vienna, Austria, 27 Apr–2 May 2025, EGU25-1253, https://doi.org/10.5194/egusphere-egu25-1253, 2025.

EGU25-1714 | ECS | Orals | CL1.2.10

Explaining the chain of events of the last deglaciation through the convection-advection oscillator mechanism 

Yvan Romé, Ruza Ivanovic, Lauren Gregoire, Didier Swingedouw, Sam Sherriff-Tadano, and Reyk Börner

The last glacial period, spanning between 115 and 12 thousand years before present, exhibited pronounced millennial-scale climate variability. This includes abrupt and semi-periodic transitions between cold stadial and warm interstadial climates, known as Dansgaard-Oeschger (D-O) events, and the chain of events of the last deglaciation. Abrupt climate changes have been linked to switches in regimes of the Atlantic Overturning Meridional Circulation (AMOC), but the exact mechanisms behind abrupt climate changes and AMOC regimes switches remain poorly understood.  

This work introduces the convection-advection oscillator mechanism to explain the millennial-scale climate oscillations observed in a set of HadCM3 general circulation model simulations forced with snapshots of deglacial meltwater history. The oscillator can be separated into two components acting on different time scales. The fast convection component responds to changes in vertical stratification in the North Atlantic by activating or deactivating its deep water formation sites. The slow advection component regulates the accumulation and depletion of salinity in the North Atlantic. This mechanism is triggered only when the right balance of magnitude and location of the freshwater forcing and boundary conditions are obtained.  

The chain of events of the last deglaciation may have been caused by the triggering of millennial-scale variability through this mechanism. We tested this hypothesis with HadCM3 simulations forced with two different ice sheet reconstructions and their associated meltwater forcing, and showed that under fixed LGM boundary conditions, only one of the ice sheet reconstructions can produce abrupt climate changes. Modifying the boundary conditions modify the location of the window of opportunity and, therefore, the forcing necessary to activate the convection-advection mechanism.  

The uncertainties around the ice sheet reconstructions and lack of climate-ice feedback still prevent the exact reproduction of the chain of events of the last deglaciation, but this study provides a new way to understand the window of parameters where millennial-scale variability can occur in simulations of the last deglaciation. 

How to cite: Romé, Y., Ivanovic, R., Gregoire, L., Swingedouw, D., Sherriff-Tadano, S., and Börner, R.: Explaining the chain of events of the last deglaciation through the convection-advection oscillator mechanism, EGU General Assembly 2025, Vienna, Austria, 27 Apr–2 May 2025, EGU25-1714, https://doi.org/10.5194/egusphere-egu25-1714, 2025.

EGU25-1918 | Orals | CL1.2.10

Decadal to seasonal changes in oxygen isotopes across Dansgaard-Oeschger events from speleothems in the mid-continent of North America 

Shaun Marcott, Melissa Reusche, Cameron Batchelor, Ian Orland, Feng He, R. Lawernce Edwards, and Andrea Dutton

The connection between abrupt high-latitude warming during the last glacial period and rapid temperature/hydrologic changes at lower latitudes has revealed strong inter-hemispheric teleconnections in the ocean–atmosphere system. How this connection influenced climate in the midcontinent of North America is unclear because climate archives with sufficient time resolution are scarce. This study investigates paleoclimate changes ~70–45 thousand years ago (ka) across multiple timescales (sub-annual to millennial) from speleothems in southern Wisconsin and Minnesota (USA). To do this we use fluorescent imaging (confocal laser microscopy) and a secondary ion mass spectrometer (SIMS) to collect high-resolution δ18O measurements (5-10µm) across individual stalagmite growth bands. Annual growth bands are 20-80 µm in width, allowing for subannual sampling resolution. Abrupt climate changes that were previously identified in a stalagmite from this region (Batchelor et al. 2023) are recorded as several large (2.0 to 3.0‰), negative δ18O excursions that occurred between 61–55 ka, coinciding with Dansgaard–Oeschger (DO) events 17–14. Here we extend the record from our prior work by 10 ka from a higher accumulation rate speleothem. Our high-resolution δ18O SIMS data show similar large (1 to 1.5‰) δ18O shifts during DO events 13 and 12 that occur in less than 30 years. When comparing the intra-annual δ18O gradient measured in different fluorescent bands, we observe a weaker gradient during DO interstadials, and a stronger gradient during DO stadials suggesting that seasonal changes in the hydrological system are also occurring during these events. Our results demonstrate large, abrupt temperature and hydrological responses to DO events during the last glacial period in midcontinent North America and indicate a strong seasonal climate response to DO warming and cooling. At the meeting we will present our published and unpublished measurements and related modeling simulations.

How to cite: Marcott, S., Reusche, M., Batchelor, C., Orland, I., He, F., Edwards, R. L., and Dutton, A.: Decadal to seasonal changes in oxygen isotopes across Dansgaard-Oeschger events from speleothems in the mid-continent of North America, EGU General Assembly 2025, Vienna, Austria, 27 Apr–2 May 2025, EGU25-1918, https://doi.org/10.5194/egusphere-egu25-1918, 2025.

EGU25-2027 | Orals | CL1.2.10

The role of sea ice in AMOC recovery in TraCE-21KII simulation 

Shih-Yu Lee, Yu-Shen Lin, and Feng He

Freshwater forcing (FWF) is recognized as a primary driver of abrupt Atlantic Meridional Overturning Circulation (AMOC) changes during significant paleoclimate variations. Numerous hosing experiments have been conducted to examine the sensitivity of AMOC to FWF; however, most of research effort was on the AMOC shutdown with few examining its recovery. Therefore, the processes underlying AMOC recovery remain uncertain.

This study employs version II of the TraCE-21K simulation (TraCE-21K-II) using the Community Climate System Model version 3 (CCSM3) to investigate key factors and mechanisms behind the two-phase AMOC recovery, shown in the TraCE-21K-II simulation, following the sudden cessation of FWF input at the end of the Younger Dryas (YD). Our findings reveal a strong correlation between AMOC strength and sea surface salinity (SSS) patterns in the North Atlantic, influenced differently by FWF and sea ice cover during various paleoclimate periods. Before the initial AMOC recovery, SSS is dominated by FWF input, with sea ice mostly covering high-latitude regions throughout the YD. As the FWF ceases, the interaction of warm, salty subtropical water with cold, fresh northern water induces AMOC strength oscillations. Eventually, persistent northward flow of warm, salty water leads to sea ice collapse, resulting in a sharp SSS increase and triggering the second recovery phase. These results highlight the critical role of SSS-related processes in AMOC variation and argue that the AMOC recovery may not be solely influenced by the cessation of FWF. Investigating these mechanisms further could prompt a reassessment of our current knowledge of AMOC dynamics and their implications for future climate projections.

How to cite: Lee, S.-Y., Lin, Y.-S., and He, F.: The role of sea ice in AMOC recovery in TraCE-21KII simulation, EGU General Assembly 2025, Vienna, Austria, 27 Apr–2 May 2025, EGU25-2027, https://doi.org/10.5194/egusphere-egu25-2027, 2025.

EGU25-3186 | Orals | CL1.2.10

West Antarctic ice volume variability paced by obliquity until 400,000 years ago 

Christian Ohneiser, Christina Hulbe, Catherine Beltran, Donna Condon, and Rachel Worthington

We present results from the NBP03-01A-20PCA sedimentary record which was recovered from the outer continental margin of the central Ross Embayment. Sediments comprise mud, with sub-angular to sub-rounded fine to coarse sand, common pebbles and rare cobbles. A paleomagnetic age model indicates the succession has a basal age of c. 1.1 Ma with magnetic reversals at 4.21 m, 5.74 m, and 5.85 m depth correlated with C1n-C1r.1r-C1r.1n-C1r.2r geomagnetic reversals.

Magnetic mineral concentration and micro IBRD data were considered a proxy for the proximity of the Ross Ice Shelf grounding zone and calving line to the core site. High magnetic mineral concentration and high terrigenous content correspond to sediments deposited beneath a floating ice shelf or from icebergs calved from that source. Time series analysis of these data indicate the advance and retreat of the Ross Ice Shelf—and by extension the West Antarctic Ice Sheet— were primarily paced by 41,000-year-long obliquity cycles until at least 400,000 years ago.

Insolation was predicted to control Antarctic ice volume; however, the frequency of glacial cycles inferred from global benthic foraminiferal oxygen isotopic and ice core records were originally interpreted to indicate that Antarctic ice volume variations were paced by 100,000-year-long (eccentricity) cycles from about 800,000 years ago. This interpretation was never confirmed from sedimentological reconstructions of ice margin advance and retreat cycles around Antarctica.

On seasonal timescales, ablation at the base of the western sector of the Ross Ice Shelf is controlled by the inflow of Ross Sea surface waters warmed by the summer sun. On orbital timescales, season length is suggested to control Antarctic temperature, with long summers and short winters leading to gradual warming and vice versa. We suggest that ablation, driven by circulation of warm summer surface waters under the ice shelf, is the mechanism by which long-term insolation control of sea surface temperatures produced the orbitally paced cycles observed here.

Our study reconciles the historical mismatch between high latitude insolation variations and glacial cycles inferred from distal records. We suggest that high-latitude insolation controlled Southern Ocean heat uptake and continued to be the main pacemaker of Antarctic glaciations well into the late Pleistocene. More sedimentary records from Antarctica and the Southern Ocean are required to reconstruct the true glacial history and whether different sectors of the margin are sensitive to different forcings.

Ohneiser, C., Hulbe, C.L., Beltran, C. et al. West Antarctic ice volume variability paced by obliquity until 400,000 years ago. Nat. Geosci. 16, 44–49 (2023). https://doi.org/10.1038/s41561-022-01088-w

How to cite: Ohneiser, C., Hulbe, C., Beltran, C., Condon, D., and Worthington, R.: West Antarctic ice volume variability paced by obliquity until 400,000 years ago, EGU General Assembly 2025, Vienna, Austria, 27 Apr–2 May 2025, EGU25-3186, https://doi.org/10.5194/egusphere-egu25-3186, 2025.

The Western Pacific Warm Pool (WPWP) is a region in the Western Pacific where the annual average sea surface temperature (SST) exceeds 28oC. With its substantial heat storage capacity, the WPWP plays a critical role in both oceanic and atmospheric circulations, acting as the primary source of heat and moisture for the Earth’s system. While extensive studies have been conducted on the connections between the WPWP and subtropical or mid-to-high latitudes in modern observations and global warming simulations, discussions of these mechanisms on geological timescales, especially millennial timescales, remain limited.

Here we present the energy budget of the WPWP from the Last Glacial Maximum (LGM) to pre-industrial using transient simulations TraCE (Transient Climate Evolution) – 21ka. During the glacial terminations, the shortwave radiation received by the WPWP is approximately balanced by longwave radiation, latent heat flux, and sensible heat flux. Variations in ocean heat content (OHC) trends during these periods, as well as millennial-scale fluctuations, are primarily driven by ocean heat transport (OHT), whose variation is about ten times larger than the net effect of radiation and surface heat flux.

By defining the North-South-West-East (20oN - 12 oS , 110 oE - 165 oE) four boundaries of the WPWP, we computed the OHT across each boundary and identified the southern boundary as the dominant contributor to both long-term trends and millennial-scale fluctuations. The northward meridional OHT at the southern boundary increased during relatively cold periods in the Northern Hemisphere (e.g., Heinrich Event I and the Younger Dryas, with 29% and 47% OHT increase compared to LGM) and decreased during relatively warm periods (e.g., Bølling–Allerød, with only 24% increase compared to LGM). These variations are associated with changes in the New Guinea Coastal Undercurrent (NGCUC), a downstream branch of the South Equatorial Current.

Our findings highlight a significant connection between the WPWP and the South Pacific during glacial terminations and across millennial timescales. These results provide valuable insights into the WPWP's role in modulating past climate dynamics and its broader implications for ocean-atmosphere interactions.

How to cite: Tsai, Y.-H., Lo, L., Lee, S.-Y., and Yin, Q. Z.: Energy budget analysis of the Western Pacific Warm Pool highlights the pivotal role of heat transport by the South Equatorial Current during the last deglaciation, EGU General Assembly 2025, Vienna, Austria, 27 Apr–2 May 2025, EGU25-5397, https://doi.org/10.5194/egusphere-egu25-5397, 2025.

EGU25-5403 | ECS | Orals | CL1.2.10

Land albedo feedback may have shaped the ‘fast-slow’ pattern of Dansgaard-Oeschger cycles 

Mengmeng Liu, Zihan Zhu, Erik Chavez, Iain Colin Prentice, and Sandy P. Harrison

A global set of pollen records extending through Dansgaard-Oeschger (D-O) cycles during Marine Isotope Stage 3 was combined with LOVECLIM model simulations to infer patterns of land temperature and albedo dynamics, using a 3D variational data assimilation technique. The calculated global land albedo feedback was unexpectedly large and positive, suggesting a potential role (alongside oceanic mechanisms) in the causation of these cycles. A simple zero-dimensional climate model, equipped with a capacitor standing for ocean heat storage, and an inductor standing for the non-linear feedback, illustrates a mechanism that can generate ‘fast-slow’ oscillations similar to those observed, when the equilibrium point lies in a certain range ­– while tending to converge to the equilibrium point when it lies outside that range. This critical range corresponds to a state of the Earth system where the gain of the non-linear feedback is ≥ 1. The equilibrium point is sensitive to orbital forcing, suggesting a possible mechanism by which the Earth system could enter and exit the oscillatory state.

How to cite: Liu, M., Zhu, Z., Chavez, E., Prentice, I. C., and Harrison, S. P.: Land albedo feedback may have shaped the ‘fast-slow’ pattern of Dansgaard-Oeschger cycles, EGU General Assembly 2025, Vienna, Austria, 27 Apr–2 May 2025, EGU25-5403, https://doi.org/10.5194/egusphere-egu25-5403, 2025.

EGU25-6258 | ECS | Posters on site | CL1.2.10

Glacial-Interglacial climate variability in the Subtropical Atlantic: Evidence from alkenone-based SST records at ODP Site 1058 

Mélinda Martins, Teresa Rodrigues, and Filipa Naughton

Feedback mechanisms linked to ocean circulation, ice sheets, and the carbon cycle are key drivers of Quaternary climate variability, especially during glacial periods and transitions. These processes provide critical insights into potential future climate dynamics under ocean warming. This study focuses on two intervals: 410-490 ka (including MIS 12, ~428-468 ka) and 600-700 ka (among MIS 16, ~624-678 ka). We aim to investigate changes in ocean circulation during major glacial periods (MIS 12 and MIS 16) and explore the East-West thermal gradient in the subtropical Atlantic, and its impact on Subtropical Gyre (STG) dynamics within the broader context of global climate systems, by reconstructing sea surface temperatures (SSTs) for these key periods. Samples were taken from cores U1058B and U1058C (2984 meters below sea level) from Ocean Drilling Program (ODP) Site 1058 on the Blake Outer Ridge (BOR), under the strong influence of the Gulf Stream, affecting SSTs. A total of 185 samples were processed using alkenone-based analysis to reconstruct SSTs. Alkenones were extracted from 2.5-2.6 g of sediment, identified, and SSTs were reconstructed using the alkenone Uk'37 index, applying the calibration equation of Müller et al. (1998). Our results reveal a significant SST decrease during the inception to the glacial (~23°C to ~18°C and ~23.5°C to ~19.5°C, at the onset of MIS 12 and MIS 16, respectively). The long term, SST variability displays a cyclicity of around 20-23 ka, with relatively warm/cold episodes that parallel changes in the precessional signal. The glacial-interglacial transitions (Termination V ~428 ka and VII ~624 ka) show contrasting signals: a rapid SST rise during Termination V (~18°C to ~22.5°C), driven by strong increase / maximum precession and obliquity signal, and a more gradual warming during Termination VII (~20°C to ~23.5°C), following obliquity signal. These findings provide valuable insights into Subtropical Gyre dynamics during MIS 12 and 16, enhancing our understanding of past ocean circulation.

This work, part of the Hydroshifts project (PTDC/CTA-CLI/4297/2021) funded by the Foundation for Science and Technology (FCT), used samples from ODP Expedition Leg 172.

How to cite: Martins, M., Rodrigues, T., and Naughton, F.: Glacial-Interglacial climate variability in the Subtropical Atlantic: Evidence from alkenone-based SST records at ODP Site 1058, EGU General Assembly 2025, Vienna, Austria, 27 Apr–2 May 2025, EGU25-6258, https://doi.org/10.5194/egusphere-egu25-6258, 2025.

EGU25-7757 | Orals | CL1.2.10

 Southern Ocean processes maintain Ice Age millennial-scale climate variability 

Sam Sherriff-Tadano, Ayako Abe-Ouchi, Wing-Le Chan, Takahito Mitsui, Akira Oka, Takashi Obase, Yuta Kuniyoshi, Yvan Romé, and Christo Buizert

Millennial-scale climate variability during Pleistocene Ice Ages, known as Dansgaard-Oeschger (DO) cycles, are characterised by abrupt transitions between Greenland cold stadials and warm interstadials, which coincide with gradual warming and cooling over Antarctica, respectively, via the bipolar seesaw. DO cycles are associated with reorganisations of the Atlantic Meridional Overturning Circulation (AMOC), but the mechanisms driving them remain unclear. In this study, from nudging experiments based on intrinsic millennial-scale AMOC variability in a complex climate model, we show that gradual changes in sea ice over the Southern Ocean induced by the bipolar seesaw act as a negative feedback to maintain the millennial-scale AMOC variability. Southern Ocean surface cooling during the interstadial phases enhances regional sea ice-related salt and freshwater fluxes, which eventually weakens the AMOC by strengthening the oceanic stratification over the North Atlantic by increasing and decreasing the salinity of Antarctic bottom water and Antarctic intermediate water, respectively. The Southern Ocean feedback becomes particularly important for DO cycles with long periodicities, such as those occurring during Marine Isotope Stages 5, 4, 2 and those appearing after major Heinrich events. Our results suggest that the Southern Ocean feedback helps drive the DO cycles, demonstrating the globally connected nature of these events.

How to cite: Sherriff-Tadano, S., Abe-Ouchi, A., Chan, W.-L., Mitsui, T., Oka, A., Obase, T., Kuniyoshi, Y., Romé, Y., and Buizert, C.:  Southern Ocean processes maintain Ice Age millennial-scale climate variability, EGU General Assembly 2025, Vienna, Austria, 27 Apr–2 May 2025, EGU25-7757, https://doi.org/10.5194/egusphere-egu25-7757, 2025.

EGU25-8507 | Orals | CL1.2.10

 Deglaciation and abrupt events in a coupled comprehensive atmosphere--ocean--ice sheet--solid earth model 

Uwe Mikolajewicz, Marie-Luise Kapsch, Clemens Schannwell, Katharina D. Six, Florian A. Ziemen, Meike Bagge, Jean-Philippe Baudouin, Olga Erokhina, Veronika Gayler, Volker Klemann, Virna L. Meccia, Anne Mouchet, and Thomas Riddick

During the last 20,000 years, the climate of the Earth evolved from a state much colder than today with large ice sheets covering North America and Northwest Eurasia to its present state. The fully-interactive simulation of this transition represented a hitherto unsolved challenge for state-of-the-art climate models. We use a novel coupled comprehensive atmosphere-ocean-vegetation-ice sheet-solid earth model to simulate this transient climate evolution, referred to as the last deglaciation. The model considers dynamical changes of ice sheets (shape and extent) as well as changes in the land-sea mask and river routing. The model also contains a dynamical iceberg component. An ensemble of eight transient model simulations realistically captures the key features of the last deglaciation, as depicted by proxy estimates.

In addition, our model simulates a series of abrupt climate changes, which can be attributed to different drivers. Sudden weakenings of the Atlantic meridional overturning circulation during the glacial state and the first half of the deglaciation are caused by Heinrich-event like ice-sheet surges, which are part of the model’s internal variability. We show that the timing of these surges depends on the initial state and the model parameters, illustrating the stochastic nature of the events. Abrupt events during the second half of the deglaciation are caused by a long-term shift in the sign of the Arctic freshwater budget, by changes in the opening of ocean passages and/or by abrupt changes in the river routing. In contrast to the Heinrich-event like ice-sheet surges, the abrupt events of the second half of the deglaciation are deterministic, as they occur as inherent features of the deglaciation.

How to cite: Mikolajewicz, U., Kapsch, M.-L., Schannwell, C., Six, K. D., Ziemen, F. A., Bagge, M., Baudouin, J.-P., Erokhina, O., Gayler, V., Klemann, V., Meccia, V. L., Mouchet, A., and Riddick, T.:  Deglaciation and abrupt events in a coupled comprehensive atmosphere--ocean--ice sheet--solid earth model, EGU General Assembly 2025, Vienna, Austria, 27 Apr–2 May 2025, EGU25-8507, https://doi.org/10.5194/egusphere-egu25-8507, 2025.

EGU25-8625 | Orals | CL1.2.10

Southern Hemisphere mid-latitude hydroclimate during Termination I: links to Antarctic iceberg discharge 

Russell Drysdale, Claire MacGregor, Sarah Cooley, John Hellstrom, Claire Jasper, Pauline Treble, Maddalena Passelergue, Rolan Eberhard, Rebecca Kearns, Renee Larcher, Attila Demeny, Yuchen Sun, Xu Zhang, and Gerrit Lohmann

The last deglaciation (Termination I, T-I) in the terrestrial mid latitudes of the Southern Hemisphere is well represented by records from lakes and alpine glaciers, which together provide information on regional vegetation, fire and temperature change. However, much less is known about variations in hydroclimate across this interval. We present a high-resolution, multi-proxy time series from a Tasmanian stalagmite spanning T-I. Coherent patterns in stable oxygen and carbon isotopes, growth rates, initial uranium isotope ratios and trace elements (Mg and Sr) reveal multiple, millennial-scale episodes of regional hydrological change during the deglaciation. Periods with a more positive moisture balance, inferred from low carbon isotope ratios and low Mg/Ca and Sr/Ca, occur when the climate was cooler, and coincide with lower growth rates and oxygen isotope ratios. Converse excursions reflect warmer periods with a reduced water balance. These swings in hydroclimate occur at a higher frequency than the classical millennial-scale deglaciation model of early warming - Antarctic Cold Reversal – late warming.

The stalagmite hydroclimate record shows a strong similarity to iceberg-rafted debris fluxes off the Antarctic Peninsula, with periods of increased iceberg flux coinciding with increased effective moisture over northern Tasmania. This suggests that enhanced iceberg and meltwater release altered regional ocean and atmospheric circulation, bringing cooler (and potentially wetter) conditions to Tasmania. Results from climate-model freshwater hosing experiments show that during such episodes, sea-ice cover increases and negative surface-temperature anomalies are present over the Indian, Atlantic and SW Pacific sectors of the Southern Ocean. Although rainfall itself does not increase, water balance over Tasmania is substantially enhanced during these events, consistent with the speleothem data. There is also some evidence that the patterns of retreat (re-advance) of some NZ glaciers may coincide with reduced (enhanced) moisture balance over Tasmania, implying that NZ glacier history through T-I may be more nuanced than previously proposed.

How to cite: Drysdale, R., MacGregor, C., Cooley, S., Hellstrom, J., Jasper, C., Treble, P., Passelergue, M., Eberhard, R., Kearns, R., Larcher, R., Demeny, A., Sun, Y., Zhang, X., and Lohmann, G.: Southern Hemisphere mid-latitude hydroclimate during Termination I: links to Antarctic iceberg discharge, EGU General Assembly 2025, Vienna, Austria, 27 Apr–2 May 2025, EGU25-8625, https://doi.org/10.5194/egusphere-egu25-8625, 2025.

In the Nordic seas, major warm and cold phases are thought to be related to a variable advection of warm surface waters and the occurrence or absence of deepwater formation, icebergs, sea-ice, and meltwater. The onset of the last glaciation – after the peak of MIS5e but well before MIS5d - was already accompanied by widespread ice drift, conditions which persisted almost continuously into the Holocene (~10 ka).

In this study we focused on the time period MIS5b into MIS3 (~90-60ka). With respect to the concept of a 100ky glacial-interglacial periodicity, this Middle Weichselian interval stands out in the arctic-subarctic ocean as it commenced with a deglacial phase that led to an intermittent but rather pronounced warming after ~85ka (MIS5a). By using benthic and planktic foraminiferal indicator species combined with stable isotope analyses, our data suggest that brief but intense warming episodes were responsible for ice growth and associated large sea-level drop recognized globally for glacial MIS4 (~70-65ka). Although occurring during times of decreasing summer insolation the massive size increase of surrounding ice sheets must have been facilitated through high moisture supply transferred into the polar region. MIS4 terminates in a major deglaciation (~H6) implying that the transition into MIS3 was again forced by a major warming. While this warming is difficult to verify in the Nordic seas through conventional proxies, the world-wide decrease in foraminiferal carbon isotopes at this time may indicate the involvement of the carbon system.

How to cite: Bauch, H. and Bingham, G.: Ice-ocean interactions and climate dynamics across the Middle Weichselian (~90-60ka), EGU General Assembly 2025, Vienna, Austria, 27 Apr–2 May 2025, EGU25-9244, https://doi.org/10.5194/egusphere-egu25-9244, 2025.

EGU25-9702 | Orals | CL1.2.10

Generalized stability landscape of the Atlantic Meridional Overturning Circulation 

Matteo Willeit and Andrey Ganopolski

The Atlantic meridional overturning circulation (AMOC) plays a crucial role in shaping climate conditions over the North Atlantic region and beyond, and its instability explains past abrupt climate transitions and millennial-scale glacial climate variability.
Here we use the fast Earth system model CLIMBER-X to explore the stability of the AMOC when faced with combined changes in atmospheric CO2 concentrations and FWF in the North Atlantic under different configurations of the Northern Hemisphere (NH) ice sheets.
We find four different AMOC states associated with qualitatively different convection patterns. Apart from an Off AMOC state with no North Atlantic deep-water formation and a Modern-like AMOC with deep water forming in the Labrador and Nordic seas as observed at present, we find a Weak AMOC state with convection occurring south of 55°N and a Strong AMOC state characterized by deep-water formation extending into the Arctic. Generally, the equilibrium strength of the AMOC increases with increasing CO2 and decreases with increasing FWF.
Our results show that Dansgaard-Oeschger (DO) oscillations originate from convective instability leading to transitions between the Weak and Modern AMOC states when the surface buoyancy flux integrated over the northern North Atlantic (>55°N) changes sign. Under typical mid-glacial conditions in terms of NH ice sheet size and atmospheric CO2 the model produces pronounced internal millennial-scale climate variability that resembles observed DO oscillations.

How to cite: Willeit, M. and Ganopolski, A.: Generalized stability landscape of the Atlantic Meridional Overturning Circulation, EGU General Assembly 2025, Vienna, Austria, 27 Apr–2 May 2025, EGU25-9702, https://doi.org/10.5194/egusphere-egu25-9702, 2025.

EGU25-10609 | ECS | Posters on site | CL1.2.10

Effect of Hudson Bay closure on global and regional climate under different astronomical configurations 

Zhipeng Wu, Qiuzhen Yin, Andrey Ganopolski, André Berger, and Zhengtang Guo
During the Quaternary, the Hudson Bay switched between closed (covered by ice sheet) and open (ice sheet-free) conditions due to large variations of ice sheets. However, how the closure and opening of the Hudson Bay have affected the local and global climates is still under-investigated. Using the LOVECLIM1.3 model, we have investigated the effect of the Hudson Bay closure under glacial conditions with different astronomical configurations, greenhouse gases (GHG) concentrations and Northern Hemisphere (NH) ice volume. Our model results show that the closure of the Hudson Bay could lead to a strengthening of the Atlantic Meridional Overturning Circulation (AMOC) due to the increased evaporation minus precipitation over the Labrador Sea which leads to saltier water and stronger deep convection in the Labrador Sea. This in turn leads to a warming in the NH with notable warming in the Labrador Sea and northeast North Atlantic, a cooling in the Southern Hemisphere (SH) and a northward shift of the Inter-tropical Convergence Zone (ITCZ). In addition to the large-scale climate changes, the closure of Hudson Bay also leads to a strong cooling over the Hudson Bay region due to changes of surface properties and a cooling to the southeast of Greenland due to more wind-driven sea ice export from the Arctic. However, the effect of the Hudson Bay closure depends on background climate conditions, and it could weaken or slightly reinforce the effect of the ice sheets under different astronomical configurations.

How to cite: Wu, Z., Yin, Q., Ganopolski, A., Berger, A., and Guo, Z.: Effect of Hudson Bay closure on global and regional climate under different astronomical configurations, EGU General Assembly 2025, Vienna, Austria, 27 Apr–2 May 2025, EGU25-10609, https://doi.org/10.5194/egusphere-egu25-10609, 2025.

EGU25-10664 | ECS | Orals | CL1.2.10

Magnitude of anthropogenic CO2 emissions and pre-industrial carbon cycle state as key factors which determine timing of the next glacial period 

Christine Kaufhold, Matteo Willeit, Guy Munhoven, Volker Klemann, and Andrey Ganopolski

Due to the exceptionally long atmospheric lifetime of anthropogenic CO2, anthropogenic emissions are expected to affect the timing of the next glacial cycle. This is because glacial inception depends not only on changes in solar insolation, but also on CO2 concentration. Using the fast Earth system model CLIMBER-X, we conduct long-term transient coupled climate–carbon cycle–ice sheet simulations to explore how different levels of cumulative emissions influence the predicted timing of the next glacial inception. Our results show that assumptions about the pre-industrial state of the carbon cycle and the magnitude of cumulative emissions profoundly impact the predicted timing of inception. We find that historical carbon emissions are insufficient to delay the next glacial period, which would naturally occur around 50 kyr AP (kiloyears after present). Cumulative emissions exceeding 1000 PgC are likely to postpone glacial inception until 100 kyr AP, while emissions up to 5000 PgC would still lead to glacial inception within the next 200 kyr. Millennial-scale AMOC variability, particularly its weakening into Stadial conditions, is also shown to play a critical role in the exact timing of the onset of the next glaciation. Despite this, the simulated timing of glacial inception aligns reasonably well with the predicted timing, which was found using the critical insolation–CO2 relation and a dedicated set of coupled climate–carbon cycle experiments. In these experiments, the predicted timing was identified as the point when the simulated atmospheric CO2 concentration drops below the critical threshold required to trigger glacial inception, given a specific value of maximum summer insolation at 65°N. Our study underscores the long-term impact of anthropogenic CO2 emissions on the Earth's climate, and offers new insights on the inherent predictability of glacial cycles.

How to cite: Kaufhold, C., Willeit, M., Munhoven, G., Klemann, V., and Ganopolski, A.: Magnitude of anthropogenic CO2 emissions and pre-industrial carbon cycle state as key factors which determine timing of the next glacial period, EGU General Assembly 2025, Vienna, Austria, 27 Apr–2 May 2025, EGU25-10664, https://doi.org/10.5194/egusphere-egu25-10664, 2025.

EGU25-11013 | ECS | Posters on site | CL1.2.10

An Assessment of Simulated Oxygen Isotope Changes During Spontaneous Dansgaard-Oeschger Type Oscillations in General Circulation Models 

John Slattery, Louise C. Sime, Kira Rehfeld, Nils Weitzel, Xu Zhang, Paul Valdes, Irene Malmierca-Vallet, and Francesco Muschitiello

Several general circulation models have now demonstrated the ability to simulate spontaneous millennial-scale oscillations that resemble Dansgaard—Oeschger (DO) events. It is often unclear how representative these simulations are and so to what extent they provide a reliable understanding of the drivers of DO events, particularly outside of the polar regions. To test this, we directly compare simulated δ18O changes from two isotope-enabled models to a compilation of 111 speleothem records from 67 caves across the low- and mid-latitudes. We find that both models successfully reproduce the observed pattern of changes in Europe and the Mediterranean, Asia, and Central America. However, they perform less well for Western North America, South America, and Oceania, and the simulated changes are also generally too small in their magnitude. Where the models do reproduce the observed changes, we find evidence that the isotopic variability is influenced by both local and remote drivers.

How to cite: Slattery, J., Sime, L. C., Rehfeld, K., Weitzel, N., Zhang, X., Valdes, P., Malmierca-Vallet, I., and Muschitiello, F.: An Assessment of Simulated Oxygen Isotope Changes During Spontaneous Dansgaard-Oeschger Type Oscillations in General Circulation Models, EGU General Assembly 2025, Vienna, Austria, 27 Apr–2 May 2025, EGU25-11013, https://doi.org/10.5194/egusphere-egu25-11013, 2025.

Sea ice is an essential component of the Arctic climate system and a key player in Arctic amplification. The Chukchi Sea (western Arctic Ocean) is one of the largest marginal seas in the world and has become a key area to study ecosystem change with retreating sea ice over recent centuries. Here, we analyze a suite of geochemical tracers including total organic carbon (TOC), total nitrogen (TN), δ13C and δ15N and biomarker concentrations such as highly branched isoprenoids (HBIs) and sterols from a sediment core located on the Chukchi shelf to reconstruct the sea-ice variability and corresponding phytoplankton community changes over the past century, then further evaluate the role of potential key physical drivers (e.g., AO, PDO and AMO) on sea ice in this sensitive region. The sea-ice proxy HBIs record shows a transition from extensive sea ice in the late 19th century to Marginal Ice Zone (MIZ) in AD 1930–1990s and then moderate sea-ice cover since 1990s. Rising of all HBI abundances between AD 1865–1875 indicate a transient retreat of summer ice edge off the shelf followed by a return to near-perennial sea ice till 1920–1930 as revealed by the absence of HBIs and brassicasterol. Sea ice retreat occurred again in AD 1920–1930 and followed by colder decades in 1940s–1960s before a sustained decline since the 1990s. Temporal variation in the concentration of proportion of specific phytoplankton sterols indicate generally increased in marine primary productivity since the late 1970s, which was coinciding with the decrease of sea ice cover. Our results also suggest a minor role of PDO and AMO on seasonal sea ice as compared to AO since the 20th century in agreement with model experiments.

How to cite: Bai, Y.: Variability of sea-ice cover and marine primary production in the Chukchi Sea over the Industrial Era: Insights from new lipid biomarker sedimentary records, EGU General Assembly 2025, Vienna, Austria, 27 Apr–2 May 2025, EGU25-11649, https://doi.org/10.5194/egusphere-egu25-11649, 2025.

EGU25-12091 | ECS | Orals | CL1.2.10

Ocean circulation shifts and sea-ice decline in the North Atlantic-Arctic sector during the Last Interglacial 

Marie Sicard, Agatha M. de Boer, Helen K. Coxall, Torben Koenigk, Mehdi Pasha Karami, René Gabriel Navarro-Labastida, Martin Jakobsson, and Matt O'Regan

The Last Interglacial (127,000–116,000 years before present) is characterized by higher Arctic surface temperatures relative to the pre-industrial era. During this period, the Arctic experienced significant summer sea-ice reduction, with some studies suggesting the possibility of an ice-free Arctic Ocean at the end of summers. These changes in sea-ice cover were primarily driven by increased summer solar insolation caused by orbital configuration at that time, but they may also have been influenced by shifts in oceanic conditions. Paleoceanographic studies generally assume modern-like circulation patterns when interpreting proxy data. However, the stability of oceanic circulation under Last Interglacial forcing and its potential impact on sea-ice loss remain poorly understood.

Using simulations from the last Coupled Model Intercomparison Project (CMIP6/PMIP4), we analysed differences in surface ocean circulation between the Last Interglacial and pre-industrial periods, and their effect on annual sea-ice variations. Our results indicate an anomalous cyclonic circulation over Greenland and the surrounding seas, which leads to intensified Baffin and Labrador Currents west of Greenland and a weakened East Greenland Current. These changes affect sea-ice drift and water transports outside the Arctic Basin. Furthermore, models generally simulate a strengthening of the North Atlantic subpolar gyre during the Last Interglacial, associated with increased Atlantic inflows south of Greenland and towards the Nordic Seas. Despite these changes, we found no consistent evidence of "Atlantification" of the Arctic during the Last Interglacial. This contrasts with future CO2 emission scenarios, where similar reductions in annual sea-ice volume are accompanied by Atlantification.

How to cite: Sicard, M., de Boer, A. M., Coxall, H. K., Koenigk, T., Karami, M. P., Navarro-Labastida, R. G., Jakobsson, M., and O'Regan, M.: Ocean circulation shifts and sea-ice decline in the North Atlantic-Arctic sector during the Last Interglacial, EGU General Assembly 2025, Vienna, Austria, 27 Apr–2 May 2025, EGU25-12091, https://doi.org/10.5194/egusphere-egu25-12091, 2025.

This paper examines the structure of glacial cycles, with a particular focus on the definition and complexity of cold stages in the stratigraphical record. The Middle and Late Pleistocene cold stages correspond to the classic orbitally-driven 100 ka glacial cycles. Closer examination of the global glacier-climate record also reveals that cold stages are structured within larger glacial cycles beyond the classic 100 ka pattern. ‘Mega’-glacial cycles closely correspond to 400 ka eccentricity cycles and the last two such cycles were bounded by MIS 19, 11 and 1. The last of these mega-cycles encompasses the Saalian Complex Stage in Europe, as well as the last cold stage (Weichselian Stage and equivalents) and has significant implications for how cold stages are defined.


The irregular pacing of quasi-100 ka glacial cycles is likely to represent an internal mechanism related to ice-sheet evolution through cold stages and their interaction with ocean and atmospheric circulation. Internal climate drivers also explain short-term climatic fluctuations within cold stages such as Dansgaard-Oeschger cycles and various other short-term interstadial-stadial transitions, such as the during the Late-glacial and the Younger Dryas Stadial, for example. Since the effects of global climate change are not manifested uniformly through time and space, such climatic effects result in diachronous boundaries in the geological record as well as spatial variability. This is especially characteristic of the Quaternary record where sediments and landforms record climate change over relatively short time intervals. This complexity, inherent in climate stratigraphy upon which the Quaternary stratigraphical record is built, poses challenges for regional and especially global correlations. In many studies cross-correlation within glacial cycles is achieved via the marine or ice-core records, especially for the last glacial cycle. However, whilst useful as records of time through the Quaternary, these records do not always reflect other processes on Earth. For example, it is now known that glacier behaviours around the world do not conform closely with the marine isotopic records, the latter being dominated by fluctuations in the Laurentide Ice Sheet over North America, overprinted by local factors.


Whilst orbital forces caused by the Earth’s interaction with other planetary orbits in our Solar System are pivotal in modulating and pacing climate change, the most important driver of the magnitude of climate change that we see in the Quaternary are largely internal factors. It is the coincidence of these drivers with orbital parameters that explain the structure and characteristics of glacial cycles. Whilst similarities between global climate patterns between glacial cycles are apparent, such as the saw-tooth pattern of change observed in marine isotope records, the complexity within these cycles differs within every cycle.  Thus, every glacial cycle is unique. This means that stratigraphical frameworks for subdividing, ordering and correlating structural elements of Pleistocene cold stages will also be unique for each glacial cycle and requires careful consideration and definition. This is especially important for correct correlation of intra-cold stage climatic stratigraphical events across regions and ultimately for comparison with global climate temporal frameworks such as the marine or ice-core records.  

How to cite: Hughes, P. and Gibbard, P.: Anatomy of a cold stage: deconstructing the structure of Pleistocene glacial cycles, EGU General Assembly 2025, Vienna, Austria, 27 Apr–2 May 2025, EGU25-12509, https://doi.org/10.5194/egusphere-egu25-12509, 2025.

EGU25-13110 | Orals | CL1.2.10

The role of thermohaline structure in upper waters of the western Pacific warm pool during deglaciation 

Shuai Zhang, Zhoufei Yu, Ann Holbourn, Yue Wang, Xun Gong, Fengming Chang, and Tiegang Li

The western Pacific warm pool, being the greatest source of heat and water vapor, has a significant impact on global climate change. Furthermore, it has unique properties that distinguish it from other seas, such as the barrier layer, which can govern ENSO via the thermohaline stratification structure. However, it is unclear what the tropical Pacific Ocean's state was throughout the deglacial period and how it influenced global warming. Here we reconstructed the temperature and salinity evolution history of the upper water in the core area of ​​the barrier layer area by collecting sediment core samples from the KX97322-4 station (0ºS, 159.24ºE, 2362 m water depth) of the Ontong-Java station. Based on the analysis of δ18O and Mg/Ca of two planktonic foraminifera (Globigerinoides ruber and Trilobatus sacculifer) living in different layers of the mixed layer, we reconstructed the temperature and salinity changes in the upper and lower layers of the mixed layer in this region over the past 140,000 years. The vertical temperature and salinity comparison reveals that the barrier layer has tended to strengthen over the two most recent deglaciations. Combined with the reconstruction findings of additional stations, we discovered that the barrier layer was more broadly established during the second termination period, which may explain why MIS5e is warmer than MIS1. This phenomena is linked to increased rainfall in the Indonesian Sea and decreased rainfall in the open sea area of the warm pool. Based on present ocean measurements, it is assumed that an increase in rainfall in the warm pool during the deglacial will result in a deepening of the vertical salinity stratification of the surface water, hence reinforcing the barrier layer. Our findings indicate that lateral halocline intrusion primarily controls the barrier layer on a long time scale, potentially increasing the impact of ENSO on the La Niña-like condition throughout the deglaciation period. During the Holocene, the weakening of the barrier layer correlates to an El Niño-like condition. Reconstructing seawater δ18O at 185 sites in the Indo-Pacific area revealed that rainfall variations in the western and eastern regions of the warm pool exhibited opposing tendencies. The westward movement of the rain belt may have contributed to the weakening of the barrier layer over the Holocene. Our findings give fresh evidence and a mechanical explanation for long-scale ENSO-like phenomena, particularly during the fast warming deglacial.

How to cite: Zhang, S., Yu, Z., Holbourn, A., Wang, Y., Gong, X., Chang, F., and Li, T.: The role of thermohaline structure in upper waters of the western Pacific warm pool during deglaciation, EGU General Assembly 2025, Vienna, Austria, 27 Apr–2 May 2025, EGU25-13110, https://doi.org/10.5194/egusphere-egu25-13110, 2025.

EGU25-13133 | Posters on site | CL1.2.10

Assessment of the southern polar and subpolar warming in the PMIP4 Last Interglacial simulations using paleoclimate data syntheses 

Xu Zhang, Qinggang Gao, Emilie Capron, Rachael H. Rhodes, Louise C. Sime, Rahul Sivankutty, Bette L. Otto-Bliesner, and Martin Werner

Given relatively abundant paleo proxies, the study of the Last Interglacial (LIG,∼129-116 thousand years ago, ka) is valuable to understanding natural variability and feedback in a warmer-than-preindustrial climate. The Paleoclimate Modelling Intercomparison Project Phase 4 (PMIP4) coordinated LIG model simulations which focus on 127 ka. Here we evaluate 12 PMIP4 127-ka Tier 1 model simulations against four recent paleoclimate syntheses of LIG sea and air temperatures and sea ice concentrations. The four syntheses include 99 reconstructions and show considerable variations, some but not all of which are attributable to the different sites included in each synthesis. All syntheses support the presence of a warmer Southern Ocean, with reduced sea ice, and a warmer Antarctica at 127 ka compared to the preindustrial. The PMIP4 127-ka Tier 1 simulations, forced solely by orbital parameters and greenhouse gas concentrations, do not capture the magnitude of this warming. Here we follow up on previous work that suggests the importance of preceding deglaciation meltwater release into the North Atlantic. We run a 3000-year 128-ka simulation using HadCM3 with a 0.25 SvNorth Atlantic freshwater hosing, which approximates the PMIP4 127-ka Tier 2 H11 (Heinrich event 11) simulation. The hosed 128-ka HadCM3 simulation captures much of the warming and sea ice loss shown in the four data syntheses at 127 ka relative to preindustrial: south of 40° S, modelled annual sea surface temperature (SST) rises by 1.3±0.6°C, while reconstructed average anomalies range from 2.2°C to 2.7°C; modelled summer SST increases by 1.1±0.7°C, close to 1.2-2.2°C reconstructed average anomalies; September sea ice area (SIA) reduces by 40%, similar to reconstructed 40% reduction of sea ice concentration (SIC); over the Antarctic ice sheet, modelled annual surface air temperature (SAT) increases by 2.6±0.4°C, even larger than reconstructed average anomalies 2.2°C. Our results suggest that the impacts of deglaciation ice sheet meltwater need to be considered to simulate the Southern Ocean and Antarctic changes at 127 ka.

For more information, please check our preprint here: https://egusphere.copernicus.org/preprints/2024/egusphere-2024-1261

How to cite: Zhang, X., Gao, Q., Capron, E., Rhodes, R. H., Sime, L. C., Sivankutty, R., Otto-Bliesner, B. L., and Werner, M.: Assessment of the southern polar and subpolar warming in the PMIP4 Last Interglacial simulations using paleoclimate data syntheses, EGU General Assembly 2025, Vienna, Austria, 27 Apr–2 May 2025, EGU25-13133, https://doi.org/10.5194/egusphere-egu25-13133, 2025.

EGU25-13638 | ECS | Posters on site | CL1.2.10

Unlocking Weddell Sea Ice History Through Snow Petrel Stomach Oil Deposits 

Zhongxuan Li, Ewan Wakefield, Mike Bentley, Dominic Hodgson, James Grecian, Darren Grocke, Richard Phillips, and Erin McClymont

Snow petrel (Pagodroma nivea) stomach-oil deposits offer a unique archive for reconstructing historical occupation patterns (e.g., Steele and Hiller, 1997) and assessing Antarctic sea-ice variability (e.g., McClymont et al., 2022). Snow petrels forage within the summer sea ice but return to ice-free bedrock to nest, creating stomach-oil deposits that encapsulate records of their diet and the environmental conditions within the sea ice. This study examines four deposits (SVMUM003, 005, 007, 009) spanning the last ~30,000 years, collected from Svarthamaren, in Dronning Maud Land, East Antarctica. Using gas chromatography-mass spectrometry (GC-MS) to analyze fatty acids and alcohol biomarkers, alongside isotope ratio mass spectrometry (IRMS) for stable carbon and nitrogen isotope analysis, we identify dietary shifts potentially linked to changes in foraging behaviour. These shifts are associated with environmental drivers including sea-ice extent and oceanographic conditions. Our findings highlight the potential of snow petrel stomach oil deposits as proxies for long-term ecological monitoring in polar ecosystems. By revealing changes in marine food web dynamics and the impacts of environmental variability, this research enhances our understanding of how Antarctic top predators respond to shifting environmental conditions.

Steele, W.K. and Hiller, A., 1997. Radiocarbon dates of snow petrel (Pagodroma nivea) nest sites in central Dronning Maud Land, Antarctica. Polar Record33(184), pp.29-38.

McClymont, E.L., Bentley, M.J., Hodgson, D.A., Spencer-Jones, C.L., Wardley, T., West, M.D., Croudace, I.W., Berg, S., Gröcke, D.R., Kuhn, G. and Jamieson, S.S., 2022. Summer sea-ice variability on the Antarctic margin during the last glacial period reconstructed from snow petrel (Pagodroma nivea) stomach-oil deposits. Climate of the Past18(2), pp.381-403.


How to cite: Li, Z., Wakefield, E., Bentley, M., Hodgson, D., Grecian, J., Grocke, D., Phillips, R., and McClymont, E.: Unlocking Weddell Sea Ice History Through Snow Petrel Stomach Oil Deposits, EGU General Assembly 2025, Vienna, Austria, 27 Apr–2 May 2025, EGU25-13638, https://doi.org/10.5194/egusphere-egu25-13638, 2025.

EGU25-15866 | ECS | Orals | CL1.2.10

A novel method for sea ice reconstructions using satellite calibration of bromine enrichment records in Arctic ice cores 

Federico Scoto, Niccolo Maffezzoli, Alfonso Saiz-López, Carlos A. Cuevas, Alessandro Gagliardi, Cristiano Varin, and Andrea Spolaor

Paleo-records such as marine sediments and ice cores are commonly used to extend our knowledge about past sea-ice cover during the period prior to instrumental observations. Several studies (Spolaor et al., 2016, Saiz Lopez and Von Glasow, 2012) have identified bromine in ice cores as a potential proxy for past sea ice conditions. During polar springtime, in fact, the photochemical recycling of bromine is extremely efficient over first year sea ice (FYSI), resulting in enhanced concentrations of inorganic gas phase bromine (e.g. BrO) compared to the ocean surface, multi-year sea ice or snow-covered land. This process is known as “bromine explosion” and is detected by satellite sensors and in-situ observations from early March
to late May. After emission, the BrO plume is frequently carried for several days by high-latitude cyclones in the lower troposphere until it reaches land and falls in the form of bromine enriched snow compared to seawater Br/Na ratio.  Here, we present the first statistical validation of this proxy using satellite sea ice observations. By combining bromine enrichment (relative to seawater, Brenr) records from three Greenlandic ice cores with satellite sea ice imagery over a span of three decades, we demonstrate its efficacy. During the satellite era (1984–2016), Brenr values in the ice cores show significant correlations with first-year sea ice formed in the Baffin Bay and Labrador Sea, confirming that gas-phase bromine enrichment processes, which predominantly occur over sea ice surfaces, are the primary drivers of the Brenr signal in ice cores. Furthermore, to evaluate Brenr’s ability to capture historical sea ice variability, we compare 20th-century Arctic sea ice historical records and proxy data with reconstructions derived from an autoregressive–moving-average (ARMA) model. The results show overall strong agreement. While further improvements are needed—such as site-specific calibrations and detailed studies on bromine transport dynamics—this study introduces a novel quantitative method for reconstructing past seasonal sea ice variability using bromine enrichment in ice cores

How to cite: Scoto, F., Maffezzoli, N., Saiz-López, A., Cuevas, C. A., Gagliardi, A., Varin, C., and Spolaor, A.: A novel method for sea ice reconstructions using satellite calibration of bromine enrichment records in Arctic ice cores, EGU General Assembly 2025, Vienna, Austria, 27 Apr–2 May 2025, EGU25-15866, https://doi.org/10.5194/egusphere-egu25-15866, 2025.

EGU25-16252 | ECS | Orals | CL1.2.10

Southern Hemisphere leads global temperature changes during the last Glacial Cycle 

Jean-Philippe Baudouin, Matteo Willeit, Nils Weitzel, Lukas Jonkers, Stefan Mulitza, and Kira Rehfeld

Glacial inceptions and terminations are driven by orbital forcing and non-linear responses of the carbon cycle and ice sheets. Traditional theory primarily points to peak summer insolation at 65°N to explain changes in Northern Hemisphere ice sheet extent, a process amplified by atmospheric CO2 concentration. In the meantime, several studies of the last deglaciation find that Southern Hemisphere temperatures and atmospheric CO2 concentration increase earlier than temperatures in the Northern Hemisphere. Hence, Northern Hemisphere ice sheets may be more strongly coupled to surface temperature in the Southern Hemisphere than in the Northern Hemisphere. We expand this analysis for the entire last glacial cycle, with regional reconstructions of Sea Surface Temperatures. We find that the Southern Hemisphere leads the Northern Hemisphere by 3kyr for timescales above 10kyr. In addition, variations in the Southern Hemisphere show significantly larger amplitudes and correlate with peak summer insolation at 65°N. We test a range of mechanisms using CLIMBER-X and LOVECLIM simulations, including direct effects of orbital forcing and AMOC variability, to explain these results. These findings bring a new understanding of the role of the bipolar seesaw and the orbital forcing to explain temperature variability on timescales above 10kyr. Finally, our study provides new insights into the triggers of glacial inception and termination.

How to cite: Baudouin, J.-P., Willeit, M., Weitzel, N., Jonkers, L., Mulitza, S., and Rehfeld, K.: Southern Hemisphere leads global temperature changes during the last Glacial Cycle, EGU General Assembly 2025, Vienna, Austria, 27 Apr–2 May 2025, EGU25-16252, https://doi.org/10.5194/egusphere-egu25-16252, 2025.

EGU25-17150 | ECS | Posters on site | CL1.2.10

Greenland ice core isotope variability is controlled by systematic changes of depositional noise 

Nora Hirsch, Andrew Dolman, Thomas Münch, and Thomas Laepple

Ice core stable water isotopes are among the few proxies capable of capturing past climate variability at timescales up to decades throughout and beyond the last Glacial period. They are therefore used to assess climate variability across different global mean temperatures and climate states. However, a significant portion of the isotope variability in ice cores can be attributed to noise, originating, for example, from stratigraphic disturbances at the snow surface and irregular, patchy precipitation events (i.e., precipitation intermittency). This additive noise is influenced by climate system components like accumulation, precipitation, or wind, which can systematically shift over time and across different climate states. Still, most recent studies on isotope variability have largely overlooked the impact of changing noise levels. In this study, we therefore use data from the Greenland ice cores GRIP, GISP2, and NGRIP to show how the common (signal) variability and the independent (noise) variability have evolved over the past 100,000 years and how these variations correlate with the prevailing climate state and accumulation rates. Our findings highlight that systematic fluctuations in noise levels must be accounted for as an additional source of uncertainty when comparing isotope variability across both high and low frequencies between different time periods.

How to cite: Hirsch, N., Dolman, A., Münch, T., and Laepple, T.: Greenland ice core isotope variability is controlled by systematic changes of depositional noise, EGU General Assembly 2025, Vienna, Austria, 27 Apr–2 May 2025, EGU25-17150, https://doi.org/10.5194/egusphere-egu25-17150, 2025.

EGU25-17742 | Posters on site | CL1.2.10

Tracing Past Northern Hemisphere Meltwater Events: Source Dynamics, Oceanic Transport, and Atmospheric Impacts in Proxy Records 

Ruza Ivanovic, Laura Endres, Yvan Rome, Julia Tindall, and Heather Stoll

The large-scale release of meltwater from continental ice sheets to the North Atlantic during past deglaciations at times played a pivotal role in the reorganization of atmospheric patterns, climate, and ocean circulation. However, reconstructing these events and their impact on the earth system in proxy records is not trivial due to several uncertainties in ice sheet geometries and derived meltwater histories.

Firstly, meltwater might originate from different sectors of an ice sheet, carrying unique isotopic signatures, and secondly, changes in ice sheet geometry associated with the meltwater release directly affects large-scale atmospheric conditions. Deriving the meltwater fluxes directly from an ice sheet reconstruction propagates the underlying uncertainties about ice sheet extent while adding additional uncertainty related to the timing and exact location of the discharge to the ocean. Moreover, direct evidence of melt events is limited because the relevant Arctic regions were often covered with sea ice during a glacial period, and most proxy locations capture localized signals. Most model studies of freshwater “hosing” simplify the discharge region to a relatively uniform distribution and apply meltwater to a large portion of the North Atlantic basin. However, to reconstruct the surface meltwater signal in the North Atlantic, a more detailed study with specific meltwater outlet locations is needed.

We perform a set of glacial period HadCM3 simulations with conservative dye tracers to examine the probable pathways and associated uncertainties in relating a surface Atlantic meltwater anomaly to proxy archives such as speleothems or sediment cores. Our results suggest a direct dependency of the archives’ signal on meltwater source region, and we are able to determine which of the source regions undergo more or less efficient meltwater dispersal by the surface and/or deep North Atlantic. Additionally, melt events from different origins produce different spatial fingerprints of melting, which may be used to reconstruct plausible melt histories from proxy record compilations. Further analysis points to the crucial role of the strength of Atlantic deep convection in mediating the re-distribution of meltwater throughout the ocean. The disruption of Atlantic deep convection impacts atmospheric conditions, and we demonstrate the effect of changes in pressure, winds, precipitation and evaporation on our ability to detect Arctic-Atlantic meltwater in terrestrial records.

How to cite: Ivanovic, R., Endres, L., Rome, Y., Tindall, J., and Stoll, H.: Tracing Past Northern Hemisphere Meltwater Events: Source Dynamics, Oceanic Transport, and Atmospheric Impacts in Proxy Records, EGU General Assembly 2025, Vienna, Austria, 27 Apr–2 May 2025, EGU25-17742, https://doi.org/10.5194/egusphere-egu25-17742, 2025.

EGU25-19105 | Posters on site | CL1.2.10

The SCAR ICEPRO Action Group: an international collaboration effort for improving paleoclimate research in the Southern Ocean 

Johan Etourneau, Dimitri Evangelinos, Carlota Escutia, Linda Amrbrecht, Amy Leventer, Bella Duncan, Juliane Müller, Rahul Mohan, Manish Tiwari, Rob Dunbar, Guiseppe Cortese, Minoru Ikehara, Erin McClymont, Laura de Santis, Claire Allen, Xiaoxia Huang, Andres Rigual, and Richard Levy and the SCAR Action Group ICEPRO

Reconstructing past hydrological and biogeochemical cycles, as well as sea ice variability in the Southern Ocean—especially along the Antarctic margin—relies on several micropaleontological, inorganic, and organic geochemical proxies preserved in marine sediments that have been developed and validated. However, robust local and regional calibrations for most of these paleoproxies, across the water column and in sediments, are still lacking when compared to present-day conditions and observations, hindering the quantification of past environmental variability. ICEPRO aims to address this gap by enhancing our understanding of past ocean-ice-earth interactions, linking modern observations with paleo-records through transnational collaborations on (paleo)environmental studies in the Southern Ocean. To achieve this goal, ICEPRO brings together international partners from diverse research disciplines (e.g., (paleo)climatologists, (paleo)oceanographers, biologists, and modelers) to coordinate and harmonize joint research activities, including sampling strategies, methodologies, proxy calibrations, and the planning of future Antarctic expeditions. Here, we present the main activities of ICEPRO.

How to cite: Etourneau, J., Evangelinos, D., Escutia, C., Amrbrecht, L., Leventer, A., Duncan, B., Müller, J., Mohan, R., Tiwari, M., Dunbar, R., Cortese, G., Ikehara, M., McClymont, E., de Santis, L., Allen, C., Huang, X., Rigual, A., and Levy, R. and the SCAR Action Group ICEPRO: The SCAR ICEPRO Action Group: an international collaboration effort for improving paleoclimate research in the Southern Ocean, EGU General Assembly 2025, Vienna, Austria, 27 Apr–2 May 2025, EGU25-19105, https://doi.org/10.5194/egusphere-egu25-19105, 2025.

EGU25-19343 | ECS | Posters on site | CL1.2.10

Ocean control on glacial sea ice in the Nordic Seas 

Wanyee Wong, Bjørg Risebrobakken, Malin Ödalen, Amandine Aline Tisserand, Kirsten Fahl, Ruediger Stein, and Eystein Jansen

To better understand processes in the Nordic Seas and their connections to large-scale climate variability during Dansgaard-Oeschger (D-O) events, we reconstructed sea ice conditions and subsurface temperatures in the eastern Fram Strait for the period between 40 and 33.5 ka b2k. By integrating our new results with comparable sea ice records from the southeastern Nordic Seas and a published reconstruction of Atlantic Meridional Overturning Circulation (AMOC) strength, we find that AMOC strength cause both expected and unexpected changes in sea ice extent in the Nordic Seas during the study period that spans multiple D-O events.

Under strong AMOC states during Greenland Interstadials, the eastern Nordic Seas were ice-free, likely driven by substantial ocean heat transport via the consistent inflow of warm Atlantic Water. A similarly strong AMOC states was, however, related to an extensive sea ice cover in the eastern Fram Strait despite ice-free conditions in the southeastern Nordic Seas during Greenland Stadials. Despite a comparable strength of AMOC, less heat reached the eastern Fram Strait during Greenland Stadials than during Interstadials.

When the AMOC strengthened, sea ice extent steadily increased in the eastern Fram Strait, while the southeastern Nordic Seas showed a pronounced decreasing trend. This suggests enhanced oceanic heat release in the south before it was transported to the north.

During a somewhat weakened AMOC state, sea ice occupied all of the eastern Nordic Seas independent of whether it was a Greenland Stadial or Interstadial, suggesting an enhanced heat release in the North Atlantic and a deepening of the Atlantic Water layer in the Nordic Seas.

When the AMOC was weak, the southeastern Nordic Seas were largely frozen, while the eastern Fram Strait experienced seasonal ice-free conditions, regardless of whether it was during Greenland Stadials or Interstadials. This pattern suggests that the heat which accumulated beneath the halocline and sea ice cover in the eastern Nordic Seas eventually upwelled, when the submerged Atlantic Water encountered the continental slope in the eastern Fram Strait.

How to cite: Wong, W., Risebrobakken, B., Ödalen, M., Tisserand, A. A., Fahl, K., Stein, R., and Jansen, E.: Ocean control on glacial sea ice in the Nordic Seas, EGU General Assembly 2025, Vienna, Austria, 27 Apr–2 May 2025, EGU25-19343, https://doi.org/10.5194/egusphere-egu25-19343, 2025.

EGU25-19820 | ECS | Orals | CL1.2.10

Fluctuating sea ice margins over the last ~50 kyr from the Sør Rondane mountains, East Antarctica, from a novel biological archive 

Yasmin Cole, Dominic Hodgson, Michael Bentley, Eleanor Maedhbh Honan, and Erin McClymont

There is spatial and temporal variability in the density of sea ice reconstructions available around Antarctica through the Holocene and the preceding Last Glacial Maximum. This study provides the first continuous sea ice reconstruction for the Princess Ragnhild Coast (20 °E and 34 °E), spanning the last ~50,000 years (Marine Isotope Stage 3, the Last Glacial Maximum, the deglaciation and the Holocene). We use snow petrel (Pagodroma nivea) stomach-oil deposits as archives of the sea ice environment in which the seabirds forage. For our study site, the snow petrels integrate information spanning the Atlantic and Indian Ocean sectors of the Southern Ocean, within ~1000 km of the coastline.  Our region of study currently has no Holocene reconstructions and only inferred Last Glacial Maximum sea ice reconstructions (Lhardy et al., 2021; Crosta et al., 2022).

Here, we use bulk stable isotopes, fatty acid ratios and elemental data to infer that sea ice in the Princess Ragnhild Coast area had a limited expansion during the Last Glacial Maximum. In agreement with previously inferred limits (Lhardy et al., 2021) our data suggests that the sea ice limits remained within ~500km of the continent edge over our time interval of interest. We also see a large negative trend in nitrogen isotopes between the Last Glacial Maximum and Holocene, in agreement with trends seen in marine sediment cores (Ai et al., 2021) although we suggest that diet largely remains the same throughout.

How to cite: Cole, Y., Hodgson, D., Bentley, M., Honan, E. M., and McClymont, E.: Fluctuating sea ice margins over the last ~50 kyr from the Sør Rondane mountains, East Antarctica, from a novel biological archive, EGU General Assembly 2025, Vienna, Austria, 27 Apr–2 May 2025, EGU25-19820, https://doi.org/10.5194/egusphere-egu25-19820, 2025.

EGU25-20191 | Orals | CL1.2.10

Major Hydroclimate shifts in Europe during severe glacial periods (MIS 16 and MIS 12)  

Filipa Naughton, Dulce Oliveira, Teresa Rodrigues, Stephanie Desprat, Samuel Toucanne, Cesar Morales-del-Molino, David Hodell, Montserrat Alonso-Garcia, Fatima Abrantes, Sandra Gomes, and Maria Fernanda Sanchez Goñi

Global warming and unprecedented increase in CO2 urgently call for improved understanding of the climate system. The acceleration of ice sheet and sea ice melting, the weakening of the Atlantic Meridional Overturning Circulation (AMOC) to a tipping point for its collapse, and the observed anomalous distribution of heat in the North Atlantic region are severely contributing to an intensification of climate hazards (droughts, wildfires, storms and floods) in vulnerable regions. Understanding ocean-atmosphere dynamics and its role in precipitation distribution and intensification of hydroclimate hazards in highly vulnerable regions, as SW Europe, is a key priority.
We studied two severe glacial periods such as the Marine Isotopic Stages (MIS) 16 (621–676 ka) and MIS 12 (424–478 ka) and their terminations (TVII:  ~ 625 kyr and part of the TV: ~ 430 kyr, since there is a hiatuses). Each glaciation was characterised by expanding global ice-sheets from the time of glacial onset to the beginning of the deglaciation and are marked by instabilities of Northern Hemisphere ice sheets during the glacial inception, before the peak glaciation and during deglaciation. Northern Hemisphere ice sheets instabilities are however stronger after the peak glacial as revealed by maxima of ice-rafted detritus deposition in the North Atlantic. The major difference between the two glacials has been attributed to a more northern position of the Artic front during MIS 16 when compared to MIS 12. 
Here we present direct land-sea- comparison (including pollen, alkenone derived SST, % C37:4 and benthic 18O) of IODP Site U1385 (Expedition 339), SW Iberian margin, covering MIS 16, TVII, MIS 12 and partially TV. Both glacials are marked by 3 main episodes of semi-desert plants expansion (dry) intercalated by two episodes of heathland expansion (wet). Although these hydroclimate changes are mainly controlled by precession, the distribution of moisture in the north Atlantic region, including the western Iberian Peninsula and northern Hemisphere ice sheets is completely dependent on the position and intensity of both the Arctic front and polar jet stream. The comparison of Site U1385 Sea Surface Temperatures (SST) with other available North Atlantic records allows us to infer the position and intensity of the Jet Stream in each processional cycle. Furthermore, the driest Iberian Peninsula phases within MIS 16 and MIS 12 seem to have been amplified by pulses of meltwater from the Eurasian ice sheets as previously demonstrated for the last glacial period. 


How to cite: Naughton, F., Oliveira, D., Rodrigues, T., Desprat, S., Toucanne, S., Morales-del-Molino, C., Hodell, D., Alonso-Garcia, M., Abrantes, F., Gomes, S., and Sanchez Goñi, M. F.: Major Hydroclimate shifts in Europe during severe glacial periods (MIS 16 and MIS 12) , EGU General Assembly 2025, Vienna, Austria, 27 Apr–2 May 2025, EGU25-20191, https://doi.org/10.5194/egusphere-egu25-20191, 2025.

EGU25-20249 | Orals | CL1.2.10

The CMIP7-PMIP FastTrack abrupt-127k simulation : an opportunity to test Arctic sea ice representation in climate models 

Masa Kageyama, Christian Stepanek, Louise Sime, Rachel Diamond, Chris Brierley, David Schroeder, and Irene Malmierca-Vallet

According to CMIP6 projections, all socio-economic scenarios show a rapidly warming climate with substantial polar amplification that will lead the Arctic becoming ice free during summer. This absence of summer sea ice acts as a positive feedback for Arctic warming and impacts regional to global scale (Bruhwiler et al., 2021).

The last interglacial, ~127,000 years ago, is a past warm climate state with significantly reduced prevalence of Arctic sea ice. This period provides a valuable out-of-sample test for climate models with which future projections are computed and may help us to better understand processes and climate patterns related to a blue Arctic.

The Last Interglacial (~127,000 years ago) is a period when orbital parameters caused much increased boreal high-latitude summer insolation forcing. The fourth phase of the Paleoclimate Modelling Intercomparison Project (PMIP4) identified in the lig127k simulation substantial model-spread of simulated minimum annual Arctic sea ice conditions (Kageyama et al., 2020; Sime et al., 2023). To enable a better understanding of the origin of model-model discord the paleoclimate science community has proposed simulation abrupt-127k (Sime et al., in prep.) as part of the FastTrack portfolio of the seventh interation of the Climate Modelling Intercomparison Project (CMIP7, Dunne et al., 2024). While simulation abrupt-127k inherits orbital and greenhouse gas parameters of PMIP4 simulation lig127k, its layout follows the approach of CMIP simulation abrupt-4xCO2, where the initial scientific focus is on a comparably short period (~100 model years) after model initialisation rather than on the quasi-equilibrated climate as in PMIP4 simulation lig127.

This presentation will outline the rationale and utility of CMIP7 FastTrack simulation abrupt-127k to a) increase the model ensemble from the classical PMIP to the wider CMIP framework; b) focus on processes and feedbacks that translate modified climate forcing into Arctic climate towards refining our understanding of the apparent model-model discord found in lig127k; c) enhance analysis of simulated sea ice conditions and dynamics based on the standardized protocol for sea-ice related climate model outputs by the Sea-Ice Model Intercomparison Project (SIMIP; Notz et al., 2016).

How to cite: Kageyama, M., Stepanek, C., Sime, L., Diamond, R., Brierley, C., Schroeder, D., and Malmierca-Vallet, I.: The CMIP7-PMIP FastTrack abrupt-127k simulation : an opportunity to test Arctic sea ice representation in climate models, EGU General Assembly 2025, Vienna, Austria, 27 Apr–2 May 2025, EGU25-20249, https://doi.org/10.5194/egusphere-egu25-20249, 2025.

EGU25-504 | ECS | Orals | CL1.2.12

Plio-Pleistocene CO2 drawdown related to wildfire-induced terrestrial organic carbon burial 

Thamizharasan Sakthivel, Prosenjit Ghosh, Sajid Ali, and Mohd Munazir Chauhan

The Plio-Pleistocene transition (1.5–3 million years ago) was marked by a significant drop in the atmospheric CO2 level by approximately 140 ppm, driving global cooling and amplifying glacial-interglacial cycles [1,2]. While glaciation-induced continental erosion and terrestrially derived organic carbon (OC) burial are typical factors considered key drivers, these processes do not fully explain the causal mechanism in driving the CO2 drawdown without including regions near mid- and low-latitudes [3]. The ecosystem responses to wildfires and post-fire storms can help elucidate these changes. Here, we investigate the impact of wildfires on OC burial rates at regional and global scales from 4 to 1.5 Ma. Regionally, we reconstructed wildfire activity across South Asia using stable nitrogen isotopes of fixed ammonium in clay minerals and pyrogenic carbon abundances. Our study focused on sedimentary records from the Kashmir Siwalik sedimentary succession and the Nicobar Fan sediments from IODP Expedition 362, Site U1480, which provide insights into processes associated with the Andaman-Nicobar accretionary prism and the Indo-Myanmar ranges. The findings reveal a significant intensification of wildfire activity during the Plio-Pleistocene transition (1.5–3.0 Ma), accompanied by a 2.9- and 2.4-fold increase in continental erosion rates and organic carbon burial flux compared to the early Pliocene (3.0–4.0 Ma). We compiled a comprehensive wildfire dataset on a global scale, integrating 20 proxy records from continental and marine sediments. By combining sediment OC content and Mass Accumulation Rate data from 23 ODP/IODP sites worldwide, we quantified the global rate of OC burial. Our findings reveal a dramatic 4.8-fold increase in wildfire activity and a 1.5-fold rise in global OC burial rates, from 2.29 ± 0.48 Mt C per year during the early Pliocene to 3.52 ± 0.80 Mt C per year at the Plio-Pleistocene transition. These results highlight the significant role of fire-driven processes in atmospheric CO2 drawdown, a mechanism that previous studies have largely overlooked.

References:

[1] Hönisch et al., 2023. Science, 382(6675), p.eadi5177.

[2] Hansen et al., 2013. Philos. Trans. R. Soc. A Math. Phys. Eng. Sci. 371(2001), p.20120294.

[3] Herman et al., 2013. Nature, 504(7480), pp.423-426.

How to cite: Sakthivel, T., Ghosh, P., Ali, S., and Munazir Chauhan, M.: Plio-Pleistocene CO2 drawdown related to wildfire-induced terrestrial organic carbon burial, EGU General Assembly 2025, Vienna, Austria, 27 Apr–2 May 2025, EGU25-504, https://doi.org/10.5194/egusphere-egu25-504, 2025.

Fire regimes have distinct global controls, and how burnt area, wildfire size and wildfire intensity independently respond to changes in climate, vegetation, and human activity remains challenging to quantify. Here, we use robust empirical models of burnt area, fire size and a measure of intensity to explore the global sensitivity of fire regimes to changes in climate, atmospheric CO2 and human activity under contrasting climate states, specifically at the end of the century under two climate change mitigation scenarios and at the Last Glacial Maximum. Our simulations show a global shift in wildfire patterns by 2100 CE under both low- and high-mitigation scenarios with reduced burnt area in tropical regions but larger and more intense wildfires in extra-tropical regions. Under low mitigation, increases in burnt area worldwide overwhelm the current human-driven declining trend, with fire size and intensity increasingly limited by dryness and vegetation fragmentation. Under different future conditions burnt area continues to increase due to changes fuel availability and dryness, fire intensity is increasingly limited by fuel build-up, and fire size by fuel continuity. These trends differ from those shown in simulations at the last Glacial Maximum, which show decreased burnt area, alongside increased fire size and intensity compared to present, consistent with sedimentary charcoal evidence. The decoupling between different fire properties occurs because of the different temporal and spatial scales on which the controls of burnt area, fire size and fire intensity operate. Under future conditions, the effect of a warming climate and increasing atmospheric CO2 amplify each other, whereas in cold climate with low atmospheric CO2, they dampen each other. These findings have immediate implications for the improvement of process-based fire models, which currently do not take the distinctions between these fire properties into account. They also suggest that the current observed patterns of fire regimes today may not hold constant under changing conditions.

How to cite: Haas, O., Prentice, C., and P. Harrison, S.: Assessing the sensitivity of fire regimes to climate, atmospheric CO2 and human activity under past and future conditions , EGU General Assembly 2025, Vienna, Austria, 27 Apr–2 May 2025, EGU25-1704, https://doi.org/10.5194/egusphere-egu25-1704, 2025.

EGU25-1823 | Orals | CL1.2.12

Pyrogenic Compounds in Tropical Australian Stalagmites Record Changes in Bushfire-Climate Relationships Coincident with the Arrival of European Pastoralists 

Rhawn Denniston, Stefania Ondei, Elena Argiriadis, Emma Rowe, David Bowman, John Cugley, David Woods, Robert Kershaw, Magdalena Lee, Veronica Schuchart, Todd Carter, and Kathryn Allen

Australia has long been recognized as one of the world’s fire hotspots, but the Black Summer of 2019-2020, when 97,000 km2 were scorched across southeastern Australia, and the larger fires of northern Australia’s savanna and desert in 2023, may indicate a shift toward a higher level of fire activity. Placing these events in context requires developing precisely-dated, high resolution records of bushfire through periods with different climate and land use mean states. We reconstructed bushfire activity for the period 1110-2009 CE using polycyclic aromatic hydrocarbons (PAH) in three precisely-dated, fast-growing, and partially overlapping aragonite stalagmites from cave KNI-51, located in the central Australian tropical savanna. PAH molecular weights are tied to combustion temperature (i.e., low molecular weights form in lower temperature fires), and thus our record preserves evidence of both the timing and intensity of bushfire over the majority of the last millennium.

Comparisons of burn scar satellite imagery with temporal changes in PAH abundances in recently deposited stalagmite suggest that airfall (smoke and ash) from fires within a 5 km radius is primarily responsible for transmitting PAH to the land surface over the cave, a finding supported by our recent controlled burn and irrigation experiment. The rapid growth rate of KNI-51 stalagmites (1-2 mm yr-1), coupled with the extremely thin soils above the cave, appear to allow for transmission and preservation of multi-annual paleofire signals.

To investigate the effects of external forcing on bushfire activity over the last millennium, we applied linear mixed-effect regression to the PAH data, and also included monsoon rainfall (using oxygen isotope ratios from the same stalagmites), annual surface air temperature (using output from the CESM-Last Millennium Ensemble), antecedent fire (using the same stalagmite PAH record), and timing with respect to the arrival of European pastoralists (EP) and their cattle in the 1880s.

The model reveals significant differences prior to and following the arrival of EP. Most notably, prior to the arrival of EP, rainfall was significantly correlated with low and medium intensity fires, but not high intensity ones. After the arrival of EP, the correlation between rainfall and fire activity decreased markedly, and showed no statistically significant correlation to any fire intensity. Similarly, prior to the arrival of EP, antecedent fire activity (determined as the sum of PAH within the previous 5 years) was correlated with all levels of fire intensity, but after EP arrival, only high intensity fires are correlated with such antecedent burning. Our findings thus suggest that fire activity following the arrival of EP in the eastern Kimberley has been distinct from any other extended period of the last nine centuries.

How to cite: Denniston, R., Ondei, S., Argiriadis, E., Rowe, E., Bowman, D., Cugley, J., Woods, D., Kershaw, R., Lee, M., Schuchart, V., Carter, T., and Allen, K.: Pyrogenic Compounds in Tropical Australian Stalagmites Record Changes in Bushfire-Climate Relationships Coincident with the Arrival of European Pastoralists, EGU General Assembly 2025, Vienna, Austria, 27 Apr–2 May 2025, EGU25-1823, https://doi.org/10.5194/egusphere-egu25-1823, 2025.

EGU25-2611 | Posters on site | CL1.2.12

Increasing spring dryness accelerates transitions toward pyrogenic vegetation in eastern boreal North America 

Martin Girardin, Adam A Ali, Dorian Gaboriau, Jonathan Lesven, Cécile Remy, Victor Danneyrolles, Hugo Asselin, Etienne Boucher, Dominique Arseneault, Fabio Gennaretti, Pierre Grondin, Michelle Garneau, Gabriel Magnan, Sylvie Gauthier, Bianca Fréchette, and Yves Bergeron

Ongoing climate change is increasing vegetation flammability, intensifying fire activity in the boreal forests of eastern North America. This situation suggests a potential tipping point in fire regimes, raising critical questions about their impact on the biodiversity and structure of these ecosystems. To gain a deeper understanding of landscape dynamics and ongoing environmental changes, it is essential to understand how this climate, vegetation and fire linkages operate across various temporal and spatial scales. By integrating paleo-datasets (charcoal, pollen, chironomids, and testate amoebae) with model simulations of vapor pressure deficit (VPD) and plant-available soil water (ASW) over the past 8,000 years, we show that drier spring conditions over the last 3,000 years led to fewer but larger and more severe fire episodes, peaking within the last 250 years. This shift in fire regimes promoted an increase in fire-adapted conifer species, particularly Pinus banksiana, across the landscape. These findings challenge previous projections of increased dominance by thermophilous species under climate change scenarios and instead suggest an expansion of pyrophilous vegetation. Such ecological transitions are set to drive significant environmental and socio-economic consequences.

How to cite: Girardin, M., Ali, A. A., Gaboriau, D., Lesven, J., Remy, C., Danneyrolles, V., Asselin, H., Boucher, E., Arseneault, D., Gennaretti, F., Grondin, P., Garneau, M., Magnan, G., Gauthier, S., Fréchette, B., and Bergeron, Y.: Increasing spring dryness accelerates transitions toward pyrogenic vegetation in eastern boreal North America, EGU General Assembly 2025, Vienna, Austria, 27 Apr–2 May 2025, EGU25-2611, https://doi.org/10.5194/egusphere-egu25-2611, 2025.

EGU25-2651 | ECS | Orals | CL1.2.12

Afromontane Fire is a Novel, Transformative, and Human-driven Disturbance 

Andrea Mason, Eleanor Pereboom, James Russell, Sarah Ivory, Richard Vachula, Sloane Garelick, and Bob Nakileza

Tropical alpine environments are some of the most sensitive areas in the world to climate change. The effects of climate change are already apparent in African montane environments as glaciers have significantly retreated and recent droughts, fires, and floods have impacted local communities and ecosystems. The short duration of observational records limits our ability to test whether these disturbances result from natural climate variability or human activity. We used lake sediment cores spanning the last 12 ka from the Rwenzori Mountains, Uganda-D.R.C., to test relationships between fire regimes, vegetation, and climate at two distinct elevations. At mid-elevations, fire activity is suppressed during the warm, wet African Humid Period, but increases with drying and cooling over the late Holocene. At 2 ka, fire abruptly increases triggering a sudden shift to a grass dominated ecosystem, most likely as a result of human ignitions associated with the Iron Age in Africa. At high elevations, despite recent large-scale destructive fires, there is no evidence for local fire over the last 12 ka until the 21st century, implying that fire is novel disturbance in the afroalpine zone. Our results show humans, rather than climate, are a major driver of afromontane fire likely through their control on ignition and as result, changes in fire regimes can cause dramatic ecosystem transformation. Thus, the creation of management plans for these unique ecosystems which focus on prevention of human ignitions are critical for these unique ecosystems, especially in the context of future climate change.

How to cite: Mason, A., Pereboom, E., Russell, J., Ivory, S., Vachula, R., Garelick, S., and Nakileza, B.: Afromontane Fire is a Novel, Transformative, and Human-driven Disturbance, EGU General Assembly 2025, Vienna, Austria, 27 Apr–2 May 2025, EGU25-2651, https://doi.org/10.5194/egusphere-egu25-2651, 2025.

EGU25-5787 | ECS | Posters on site | CL1.2.12

Evaluating proxy-based vegetation reconstructions against model-based approaches: A case study from Europe during the late Last Glacial period 

Oliver A. Kern, Philipp Schlüter, Andreas Maier, and Nikki Vercauteren

In recent years, there have been considerable improvements in reconstructing past environments. However, the majority of studies focuses either on the Holocene period (ca. 12 ka BP until present) or the Last Glacial Maximum (LGM, ca. 21 ka BP). Since going further back in time encompasses additional challenges, we aim to assess the capabilities and robustness of methods that are currently in use to reconstruct the paleovegetation during the late Last Glacial period (ca. 60–20 ka BP). We compare four different methods of reconstructing past vegetation cover in Europe during the Last Glacial and highlight the strengths and limitations of each method: 1) The classical biomisation approach using fossil pollen data that assigns taxa into plant functional types (PFTs) and PFTs into biomes based on ecological traits and climatic preferences. 2) The REVEALS (Regional Vegetation Abundance from Large Sites) algorithm, which utilizes fossil pollen data in conjunction with taxon-specific parameters (e.g., relative pollen productivity) to estimate the regional plant cover. 3) The dominant biomes derived from the Biome4 global vegetation model using bioclimatic variables from a global climate model output (HadAMH3 and HadCM3). 4) A dedicated vegetation model that statistically reconstructs land-cover from the output of a global climate model (HadAMH3 and HadCM3) using the present climate-vegetation relationship and a CO2 correction factor. Our results show that all methods reconstruct a glacial vegetation dominated by open landscapes (e.g., tundra and steppes) and coniferous forests to various degrees. The existence of transient local patches of mixed and temperate forests is consistent with the general interpretation of glacial landscapes in Europe in the literature. However, regional and chronological discrepancies as well methodological challenges render it difficult to decipher which method most closely represents the actual paleovegetation. Nonetheless, exhausting qualitative and quantitative comparisons across different methods using different approaches allow us to limit the ecological range of the potential vegetation. Such a better comprehension of glacial environments has major implications for our understanding of human (Neanderthals and anatomically modern humans) and faunal population dynamics of in Europe, particularly in response to climatic transitions.

How to cite: Kern, O. A., Schlüter, P., Maier, A., and Vercauteren, N.: Evaluating proxy-based vegetation reconstructions against model-based approaches: A case study from Europe during the late Last Glacial period, EGU General Assembly 2025, Vienna, Austria, 27 Apr–2 May 2025, EGU25-5787, https://doi.org/10.5194/egusphere-egu25-5787, 2025.

To unravel which processes are responsible for changes in atmospheric CO2 the carbon isotopes are useful helpers widely applied in the past. This study helps to better understand long-term changes in 13C, which has also consequences for the interpretation of atmospheric δ13CO2 measured together with CO2 in ice cores. 

The 13C cycle of the Plio-Pleistocene, as recorded in δ13C of benthic foraminifera, has power in periodicities related to the long eccentricity cycle of 405-kyr that is missing in corresponding climate records (e.g. δ18O). Using a global carbon cycle model I show that the long eccentricity cycle in δ13C might have been caused by variations in the isotopic signature of geological sources, namely of the weathered carbonate rock (δ13Crock) or of volcanically released CO213Cv). This closure of the 13C cycle in these peridicities also explains the offset in atmospheric δ13CO2 seen between the penultimate and the last glacial maximum. The necessary isotopic signatures in δ13Crock or δ13Cv which align my simulations with reconstructions of the 13C cycle on orbital timscales have most power in the obliquity band (41-kyr) suggesting that land ice dynamics are the ultimate cause for these suggested variations. Since the Asian monsoon as reconstructed from speleothems has also an obliquity-related component it is possible that these proposed changes in weathering are indeed, at least partly, connected to the monsoon as previously suggested. Alternatively, the suggested impact of land ice or sea level on volcanic activity might also be influential for the 13C cycle. This indirect influence of ice sheets on the long eccentricity cycle in δ13C implies that these processes might not have been responsible for the 405-kyr periodicity found in ice-free times of the pre-Pliocene parts of the Cenozoic.

See preprint (https://doi.org/10.5194/cp-2024-63) for details.

How to cite: Köhler, P.: Closing the Plio-Pleistocene 13C cycle in the 405-kyr periodicity by isotopic signatures of geological sources , EGU General Assembly 2025, Vienna, Austria, 27 Apr–2 May 2025, EGU25-5934, https://doi.org/10.5194/egusphere-egu25-5934, 2025.

EGU25-6454 | ECS | Posters on site | CL1.2.12

Sustained deep-water formation in the Nordic Seas during Marine Isotope Stages 5 and 4 and implications for carbon storage in the North Atlantic 

Tim Stobbe, Henning Bauch, Daniel Frick, Jimin Yu, and Julia Gottschalk

Changes in the formation of North Atlantic Deep Water (NADW) and the expansion of southern-sourced waters in the Atlantic Ocean are linked to enhanced marine carbon storage during glacial and stadial periods, explaining late Pleistocene atmospheric CO2 variations. However, the role of deep-water formation in the Nordic Seas, a key NADW source, and its influence on Atlantic overturning remains unclear, especially after the last glacial maximum. In this study, we present high-resolution reconstructions of bottom water [CO32-] from Cibicidoides wuellerstorfi, along with stable isotopes and aragonitic pteropod abundances in marine sediment core PS1243 from the deep Norwegian Sea, to explore past deep-water dynamics and their impact on carbon cycling. Our data suggest continuous formation of dense, well-ventilated deep waters during Marine Isotope Stages 5 and 4, with a deepening of the aragonite compensation depth during the MIS 5b-to-4 transition. MIS 5e indicates resilience of Nordic Seas overturning in spite of a warmer North Atlantic and suggested summer Arctic sea ice reduction. A compilation of Atlantic [CO32-] records suggests that dense waters from the Nordic Seas expanded into the western North Atlantic, reducing its carbon storage capacity during MIS 4 and stadial MIS 5. Our study highlights differences in the sensitivity of Atlantic and Nordic Seas overturning to past climate conditions, with implications for the Atlantic's role in atmospheric CO2 variations.

How to cite: Stobbe, T., Bauch, H., Frick, D., Yu, J., and Gottschalk, J.: Sustained deep-water formation in the Nordic Seas during Marine Isotope Stages 5 and 4 and implications for carbon storage in the North Atlantic, EGU General Assembly 2025, Vienna, Austria, 27 Apr–2 May 2025, EGU25-6454, https://doi.org/10.5194/egusphere-egu25-6454, 2025.

EGU25-7116 | Posters on site | CL1.2.12

Radiocarbon ages of western Pacific intermediate waters during the past 25 kyrs: Implications for global carbon cycling 

Martina Hollstein, Markus Kienast, Gema Martínez-Méndez, Lowell Stott, Stephan Steinke, Ricardo De Pol-Holz, John Southon, and Mahyar Mohtadi

The rapid increase of atmospheric carbon dioxide (CO2) and the concurrent decline in Δ14C during the last deglaciation were mainly ascribed to the release of old, 14C-depleted CO2 from an abyssal ocean reservoir, specifically the Southern Ocean, or the deep Pacific Ocean via intermediate waters. In support of this hypothesis, several records from intermediate waters around the globe depict a drop in Δ14C during the deglaciation. However, other records closer to the source regions of intermediate waters do not depict this anomaly and thus, question the hypothesis. Alternative scenarios include the release of 14C-depleted CO2 by hydrothermal vents, volcanoes and pockmarks. An ideal region to test the hypothesized scenarios is the western equatorial Pacific Ocean (WEP), where intermediate waters of southern and northern origin converge.

We present paired planktic and benthic foraminiferal 14C ages from a depth transect (404 – 2210 m) of seven gravity cores from the WEP that cover the past 25 kyrs. Our records do not show any discernible Δ14C anomaly during the Last Glacial Maximum and initial deglaciation making the WEP an unlikely candidate for the release and ventilation of oceanic CO2 to the atmosphere. However, the intermediate-depth records consistently show anomalously low benthic Δ14C values during the final stage of the deglaciation and early Holocene. This Δ14C variability will be discussed in the context of potential sources and mechanisms.

How to cite: Hollstein, M., Kienast, M., Martínez-Méndez, G., Stott, L., Steinke, S., De Pol-Holz, R., Southon, J., and Mohtadi, M.: Radiocarbon ages of western Pacific intermediate waters during the past 25 kyrs: Implications for global carbon cycling, EGU General Assembly 2025, Vienna, Austria, 27 Apr–2 May 2025, EGU25-7116, https://doi.org/10.5194/egusphere-egu25-7116, 2025.

EGU25-8309 | ECS | Posters on site | CL1.2.12

Quantifying carbon burial on the Northwest Australian shelf: Connections with Late Pleistocene climatic patterns  

Arianna V. Del Gaudio, Or M. Bialik, Gerald Auer, and David De Vleeschouwer

The Pleistocene is characterized by substantial variations in ice volume and pronounced climatic oscillations. Over the last 1 million years, glacial-interglacial climate cycles are marked by increasing amplitude and by a pronounced decrease in pCO₂ levels during glacial intervals. The mechanisms driving this carbon cycle reorganization, and a full quantification of oceanic and sedimentary carbon sinks during glacials, remain unresolved. To address this question, we measure organic and inorganic δ13C, as well as the total organic carbon (TOC) to quantify export productivity and organic carbon burial changes on the NW Shelf of Australia.

Bulk carbonate sediments from IODP Expedition 356 Site U1460 (27°22′S, 112°55′E), collected at a water depth of 214.5 mbsf, are the focus of this study. This site, located on the outer North West Shelf of Australia, is influenced by the competition between the southward flowing oligotrophic Leeuwin Current and the colder norward flowing West Australian Current. During glacial intervals, the West Australian Current is dominant, facilitating enhanced productivity through wind driven upwelling. These dynamics suggest that the region could have acted as a significant organic carbon sink during Late Pleistocene glacials, with high rates of organic carbon accumulation on the western Australian shelf and continental slopes. Here, we present preliminary results from δ¹³C and TOC analyses spanning the last ~600,000 years. These data provide insights into the variability of organic carbon burial and its contribution to the global carbon cycle in the Mid- to Late Pleistocene, advancing our understanding of carbon storage mechanisms in response to climatic shifts.

How to cite: V. Del Gaudio, A., M. Bialik, O., Auer, G., and De Vleeschouwer, D.: Quantifying carbon burial on the Northwest Australian shelf: Connections with Late Pleistocene climatic patterns , EGU General Assembly 2025, Vienna, Austria, 27 Apr–2 May 2025, EGU25-8309, https://doi.org/10.5194/egusphere-egu25-8309, 2025.

EGU25-8406 | Orals | CL1.2.12

Southern Ocean contribution to glacial atmospheric CO2 decline across the mid-Pleistocene transition 

Julia Gottschalk, Adam P. Hasenfratz, Jennifer L. Middleton, Jesse R. Farmer, Elisabeth Michel, Chandranath Basak, Jean E. Hanley, Carol A. Knudson, Samuel L. Jaccard, Frank Lamy, and Gisela Winckler

The mid-Pleistocene transition (MPT) is arguably the most enigmatic long-term climate shift of the Quaternary and is characterized by increasingly severe glacial conditions about 1.2 to 0.6 million years ago. Although the MPT was suggested to be linked with a continuous lowering of glacial atmospheric CO2 (CO2,atm) levels, the processes underlying this CO2,atm decline are incompletely understood. Here we compare two new benthic foraminiferal (Cibicidoides/Cibicides sp.) δ13C records reflecting Circumpolar Deep Water (CDW), from central South Pacific International Ocean Discovery Program Site U1541 (54.2°S, 125.4°W, 3606 m water depth) and Southeast Atlantic Ocean Drilling Program Site 1094 (53.2°S, 05.1°E, 2807 m water depth), with similar records from the global ocean to identify possible reorganizations in the oceanic respired carbon pool over the past 2 million years that may explain CO2,atm changes across the MPT. We show a good agreement between lower CDW δ13C signatures in the central South Pacific and in the Southeast Atlantic, and a wide-spread glacial decline in CDW δ13C signatures across five Southern Ocean sites during the MPT. This points at a contribution from reduced glacial CDW ventilation and increased glacial respired carbon storage in the Southern Ocean to the glacial CO2,atm decline across the MPT. We also highlight an Atlantic-Pacific Southern Ocean-wide increase in the magnitude of deglacial CDW δ13C shifts during the MPT, which coincides with an amplitude increase in glacial-interglacial Antarctic Circumpolar Current flow strength variations (Lamy et al., 2024). This highlights that not only an increased Southern Ocean respired carbon storage might have driven CO2,atm variations across the MPT but also more efficient outgassing of that carbon during deglacial phases post-MPT. We will address potential linkages of glacial respired carbon storage and deglacial outgassing to changes in Antarctic ice sheet dynamics and southern hemisphere westerlies across the MPT.

References:
Lamy, F., Winckler, G., Arz, H., Farmer, J., Gottschalk, J., Lembke-Jene, L., Middleton, J.L., et al., 2024. Five million years of Antarctic Circumpolar Current strength variability. Nature 627, 789–796. doi: 10.1038/s41586-024-07143-3

How to cite: Gottschalk, J., Hasenfratz, A. P., Middleton, J. L., Farmer, J. R., Michel, E., Basak, C., Hanley, J. E., Knudson, C. A., Jaccard, S. L., Lamy, F., and Winckler, G.: Southern Ocean contribution to glacial atmospheric CO2 decline across the mid-Pleistocene transition, EGU General Assembly 2025, Vienna, Austria, 27 Apr–2 May 2025, EGU25-8406, https://doi.org/10.5194/egusphere-egu25-8406, 2025.

EGU25-8759 | Orals | CL1.2.12

Challenges and insights in comparing simulated tree cover changes over the last 20,000 years with reconstructions for the Northern Hemisphere 

Anne Dallmeyer, Laura Schild, Martin Claussen, Thomas Kleinen, and Ulrike Herzschuh

Pollen records are the most widespread archive for past climate and vegetation changes, offering valuable insights into Earth’s environmental history. These records provide a unique opportunity to evaluate Earth System Models. In recent years, the availability of quantitative plant cover reconstructions on a continental scale has increased, exemplified by the consistent dataset of REVEALS-based reconstructions provided by Schild et al. (2024) for the entire Northern Hemisphere.

We use this data set for comparison with the changes in tree cover simulated by the Max Planck Institute Earth System Model (MPI-ESM) for the last 20,000 years. While the overall agreement between model and data is promising, there are significant regional discrepancies. Notable differences emerge in boreal regions such as Alaska/Western Canada and Siberia, where the model predicts a delayed and weaker tree cover increase during the deglaciation. Conversely, in temperate forest-steppe transition zones, the model shows an earlier and stronger tree cover expansion, balancing out the Northern Hemispheric mean change.

However, systematic biases complicate the interpretation of this comparison. For instance, the model tends to simulate excessively cold conditions in boreal latitudes, while the reconstructions likely overestimate tree cover in these regions. As a result, the agreement in vegetation history remains uncertain leaving the comparison of absolute values between reconstructions and model results questionable. An EOF analysis highlights common modes of vegetation changes over the last 20,000 years in MPI-ESM and reconstructions, deepening our understanding despite these uncertainties.

References:  Schild, L., Ewald, P., Li, C., Hébert, R., Laepple, T., and Herzschuh, U.: LegacyVegetation 1.0: Global reconstruction of vegetation composition and forest cover from pollen archives of the last 50 ka, Earth Syst. Sci. Data Discuss. [preprint], https://doi.org/10.5194/essd-2023-486, in review, 2024

How to cite: Dallmeyer, A., Schild, L., Claussen, M., Kleinen, T., and Herzschuh, U.: Challenges and insights in comparing simulated tree cover changes over the last 20,000 years with reconstructions for the Northern Hemisphere, EGU General Assembly 2025, Vienna, Austria, 27 Apr–2 May 2025, EGU25-8759, https://doi.org/10.5194/egusphere-egu25-8759, 2025.

EGU25-10783 | Posters on site | CL1.2.12

Reconstruction of Post-Wildfire Soil Erosion Using Lake Archives (1975-2024): a French Mediterranean case study 

Romain Ducruet, Olivier Evrard, and Anthony Foucher

Wildfires are among the main disturbances affecting Mediterranean ecosystems. These extreme events significantly impact erosion dynamics over long periods and can affect environmental systems by causing excessive sediment transfers downstream. Traditional methods for studying soil erosion in post-wildfire contexts generally focus on short temporal scales, such as months or a few years after wildfire events. 

However, this temporal framework does not allow to capture the dynamics, trajectory, and resilience of erosion processes over a longer time scale (e.g. 20 years). In this context, the study of sedimentary archives provides a powerful resource for reconstructing the resilience of ecosystems to such disturbances.

This study is based on the analysis of sediment cores collected in a small reservoir draining the Peguière headwater catchment (Var, 0.18 km², south-east France), which was completely affected by a historic wildfire in 2003. These sediment cores were dated using natural and artificial radionuclides (210Pbxs, 137Cs), and their physical and chemical properties were characterized using a range of techniques, including high-resolution geochemical elemental analysis (XRF), tomography scanning, and the characterization of  organic matter properties.

Initial results show that this wildfire caused significant changes in geochemical properties of sediment. Certain elements, especially manganese, became more abundant during the post-fire period, which was also observed for radionuclides such as 137Cs. The post-fire period was also characterized by a change in the properties of organic matter and an acceleration of sediment inputs into the reservoir.

These post-fire processes affect the reservoir water quality and highlight the consequences of fire damage on long-term soil stabilization, plant cover and regeneration.

These retrospective and multi-proxy approaches provide a comprehensive understanding of the resilience of post-fire erosion dynamics. Understanding these processes over extended timescales will improve landscape management and the implementation of environmental protection measures to fight against the detrimental effects of wildfire on the degradation of soil and water resources.

How to cite: Ducruet, R., Evrard, O., and Foucher, A.: Reconstruction of Post-Wildfire Soil Erosion Using Lake Archives (1975-2024): a French Mediterranean case study, EGU General Assembly 2025, Vienna, Austria, 27 Apr–2 May 2025, EGU25-10783, https://doi.org/10.5194/egusphere-egu25-10783, 2025.

EGU25-12616 | Orals | CL1.2.12

Silicic acid leakage during Last Glacial Maximum and glacial termination 

Ying Ye, Peter Köhler, Martin Butzin, and Christoph Völker

Changes in the marine biological carbon pump during glacial times have been supposed to contribute to the glacial CO2 drawdown. One particular hypothesis that received attention during last two decades is the Silicic Acid Leakage Hypothesis (SALH), which proposed the Si leakage during glacial times from the Southern Ocean (SO) was transported towards lower latitudes and then contributed to enhanced biological productivity there and thus to global cooling by lowering atmospheric pCO2.

Thanks to the flexible stoichiometry (C:N:Si:Chl ratios) implemented in the biogeochemistry model REcoM (used with AWIESM2), we are able to study Si leakage based on changes in diatom physiology and its effect on nutrient supply to low-latitude surface waters. Our simulations show a significant increase of Si:N ratios in surface seawater in the SO and southern-sourced mode waters at Last Glacial Maximum (LGM) when compared to pre-industrial, confirming the first part of SALH. However, due to stronger stratification and weaker upwelling during LGM, these Si-enriched waters cannot be transported to the low-latitude surface to induce higher diatom growth, arguing against the second part of SALH but in agreement with reconstructions of marine opal accumulation rates. Instead, the simulation of the beginning of the glacial termination reveals that Si leakage during deglaciation drives a low-latitude productivity increase, supporting the more recent Silicic Acid Ventilation Hypothesis (SAVH). The effect of increased biological carbon uptake is more than compensated by intense CO2 outgassing through stronger ventilation, resulting in a rapid CO2 rise during deglaciation.

How to cite: Ye, Y., Köhler, P., Butzin, M., and Völker, C.: Silicic acid leakage during Last Glacial Maximum and glacial termination, EGU General Assembly 2025, Vienna, Austria, 27 Apr–2 May 2025, EGU25-12616, https://doi.org/10.5194/egusphere-egu25-12616, 2025.

EGU25-12867 | ECS | Posters on site | CL1.2.12

Carbonate counter pump strength and its impact on atmospheric pCO2 over the past 800 ka: evidence from Southern Ocean micropaleontological and geochemical data  

Nicolas Pige, Yu Wang, Stéphanie Duchamp-Alphonse, Sophie Sépulcre, Vishnu Thuruttath Unnikrishnan, Margaux Brandon, Amaëlle Landais, and Elisabeth Michel

During the glacial-interglacial transitions of the past 800 000 years (800 ka), commonly referred to as “glacial terminations”, atmospheric CO2 concentrations (pCO2) rose by 50-100 ppm. Biological productivity from the Southern Ocean (SO) significantly impacted these variations through changes in the Biological Carbon Pump strength, which includes the Soft Tissue Pump (STP) i.e., the net downward flux of phytoplanktonic organic carbon, and the Carbonate Counter Pump (CCP) i.e., the export of planktonic calcium carbonates increasing the surface-to-depth alkalinity gradient. Both modulate ocean-atmosphere exchanges as they respectively decrease and increase CO2 concentrations in the surface ocean and hence the atmosphere. Paleoclimate studies focusing on the SO highlight decreasing STP from the Subantarctic as a potential driver of increasing pCO2 during glacial terminations. A few studies have demonstrated the probable impact of CCP on pCO2 over specific glacial terminations (Duchamp-Alphonse et al., 2018; Brandon et al., 2022; Anderson et al., 2024) but very little is known about CCP patterns over the past 800 ka.  

This study aims to reconstruct changes in CCP strength over the past 800 ka and assess their impacts on pCO2. Following the exact same strategy as the one developed by Brandon et al., (2022), we performed micropaleontological (coccolith and foraminifera abundances and morphometrics) and geochemical analyses (CaCO3, CaXRF, d13CN. pachyderma, d18ON. pachyderma) on sediment core MD97-2115 (43°10,84S, 171°48,55W), retrieved in the Pacific sector of the Subantarctic Zone. Preliminary results show that the carbonate fine fraction (< 20µm) of the sediment is mainly composed of coccoliths (Emiliania huxleyi and Gephyrocapsa morphotypes; Coccolithus pelagicus; Calcidiscus leptoporus) and might be used as a CCP signal.  


Anderson, H. J. et al. Millennial-Scale Carbon Flux Variability in the Subantarctic Pacific During Marine Isotope Stage 3 (57–29 ka). Paleoceanography and Paleoclimatology 39, e2023PA004776 (2024).

Brandon, M. et al. Enhanced Carbonate Counter Pump and upwelling strengths in the Indian sector of the Southern Ocean during MIS 11. Quaternary Science Reviews 287, 107556 (2022).

Duchamp-Alphonse, S. et al. Enhanced ocean-atmosphere carbon partitioning via the carbonate counter pump during the last deglacial. Nature Communications 9, 1–10 (2018).

How to cite: Pige, N., Wang, Y., Duchamp-Alphonse, S., Sépulcre, S., Thuruttath Unnikrishnan, V., Brandon, M., Landais, A., and Michel, E.: Carbonate counter pump strength and its impact on atmospheric pCO2 over the past 800 ka: evidence from Southern Ocean micropaleontological and geochemical data , EGU General Assembly 2025, Vienna, Austria, 27 Apr–2 May 2025, EGU25-12867, https://doi.org/10.5194/egusphere-egu25-12867, 2025.

Understanding the roles of human land use and climate in shaping past fire regimes is key to predicting future landscape fires and informing effective management decisions. This is especially true for southeast Australia, which has some of the most flammable vegetation on the planet and faces the ongoing impacts of mega wildfires. There is also an ongoing debate on the need for a cultural approach to fire management. Using the Bass Strait Islands as a case study, this talk explores vegetation, fire regimes, Aboriginal land use, and climate change during the Holocene. It provides insights into how the interplay between cultural burning practices and climate influenced fire regimes and shaped the landscape, which has implications for effective future fire management in the region.

How to cite: Adeleye, M.: The impact of cultural burning and climate change on landscape fires, EGU General Assembly 2025, Vienna, Austria, 27 Apr–2 May 2025, EGU25-13287, https://doi.org/10.5194/egusphere-egu25-13287, 2025.

EGU25-13359 | Orals | CL1.2.12 | Highlight

Impact of Southern Ocean processes on atmospheric CO2 concentration 

Laurie Menviel, Paul Spence, Andrew Kiss, Matthew Chamberlain, Hakase Hayashida, Darryn Waugh, Matthew England, Himadri Saini, and Katrin Meissner

The Southern Ocean (SO) is believed to play a pivotal role in modulating atmospheric CO2 concentrations, both across glacial/interglacial cycles and during abrupt climate shifts. Previous studies using coarse-resolution Earth system models have suggested that stronger southern hemisphere westerly winds enhance the upwelling of deep waters, which in turn increases CO2 outgassing. However, mesoscale processes have a significant impact on Southern Ocean circulation. To better capture these dynamics, we assess the effects of changes in the position and strength of the southern hemisphere westerlies through a series of numerical simulations using the eddy-rich and eddy-permitting ocean, sea-ice, and carbon cycle model, ACCESS-OM2. Our results show that a 10% increase in southern hemispheric westerly wind stress leads to a 0.13 GtC/yr increase in Southern Ocean CO2 outgassing. We also find that a poleward shift of the SH westerlies enhances CO2 outgassing, with a sensitivity of 0.08 GtC/yr for a 5-degree poleward shift. 
We further compare the impact and timescale of the Southern Ocean carbon cycle changes driven by dynamic wind variations with those resulting from changes in Antarctic Bottom Water transport and iron fertilisation.

How to cite: Menviel, L., Spence, P., Kiss, A., Chamberlain, M., Hayashida, H., Waugh, D., England, M., Saini, H., and Meissner, K.: Impact of Southern Ocean processes on atmospheric CO2 concentration, EGU General Assembly 2025, Vienna, Austria, 27 Apr–2 May 2025, EGU25-13359, https://doi.org/10.5194/egusphere-egu25-13359, 2025.

EGU25-13361 | ECS | Posters on site | CL1.2.12

Interglacial climate, wildfire, and vegetation dynamics in southeastern Siberia over the last 580,000 years 

Jade Margerum, Julia Homann, Stuart Umbo, Maria Box, Gernot Nehrke, Jasper Wassenburg, Thorsten Hoffmann, Anton Vaks, Aleksandr Kononov, Alexander Osintsev, Alena Giesche, Andrew Mason, Franziska A. Lechleitner, Gideon M. Henderson, Ola Kwiecien, and Sebastian F.M. Breitenbach

Wildfires are a rapidly increasing threat to boreal forests. Our current understanding of the drivers behind wildfires and their environmental impact, while growing, is based mostly on data that is limited to the observational period. 

Our most crucial findings reveal that both the LIG and MIS 11 had levoglucosan levels more than double the average observed in other interglacials, indicating a high frequency of wildfire occurrence. Despite similarities in climatic background conditions and a shift from more hardwood (i.e., deciduous) forests to denser softwood-dominated (i.e., coniferous) forests toward the end of each interglacial, the wildfire behaviour differed significantly: both MIS 11 and the Last Interglacial exhibit overall high wildfire activity, but MIS 11 shows a declining trend in wildfires towards its end, while the Last Interglacial experiences a sharp increase in wildfire activity during its final stages. We hypothesise that consistently warmer, more humid conditions throughout MIS 11 allowed for emergence of stable forest ecosystems with a lower susceptibility to wildfires, resulting in lower wildfire vulnerability with declining temperatures closer to the end of the interglacial compared to the LIG. The LIG, especially towards the end, is characterised by shifts towards open forests composed of fire-prone species, which prompted increased wildfire activity additionally boosted by drier and cooler conditions.

Our reconstruction provides a framework for understanding long-term interactions between climate and biosphere. By linking interglacial wildfire dynamics with vegetation changes, we highlight how climatic variability modulates ecological resilience and fire susceptibility in boreal regions. This study offers insights into the potential responses of contemporary taiga ecosystems to ongoing anthropogenic climate change, where rising temperatures and shifting precipitation patterns alter biomes and may amplify fire activity.

How to cite: Margerum, J., Homann, J., Umbo, S., Box, M., Nehrke, G., Wassenburg, J., Hoffmann, T., Vaks, A., Kononov, A., Osintsev, A., Giesche, A., Mason, A., A. Lechleitner, F., M. Henderson, G., Kwiecien, O., and F.M. Breitenbach, S.: Interglacial climate, wildfire, and vegetation dynamics in southeastern Siberia over the last 580,000 years, EGU General Assembly 2025, Vienna, Austria, 27 Apr–2 May 2025, EGU25-13361, https://doi.org/10.5194/egusphere-egu25-13361, 2025.

The advent of large, open-access databases such as Neotoma has revolutionized the field of paleoecology, providing unprecedented opportunities to conduct large-scale analyses of past environmental change. These databases allow for the integration of thousands of fossil pollen records, enabling a more comprehensive understanding of spatial and temporal variability across ecosystems. By combining these data with advanced numerical methods and/or other proxies, we can refine our understanding of how past climatic changes influenced biodiversity. This integrated approach holds the potential to push paleoecology into exciting new directions, with implications for forecasting future climate and biodiversity changes.

Our work explores innovative uses of fossil pollen datasets, particularly large-scale compilations of Late Quaternary records, to investigate long-term vegetation dynamics and climate change. We apply novel spatio-temporal techniques to gain new insights into biodiversity change. This approach has enabled us to uncover global patterns of vegetation change and deepen our understanding of climate-vegetation interactions (Mottl et al. 2021a). By quantifying rates of ecological change (Mottl et al. 2021b), we demonstrated that vegetation rates of change began accelerating globally between three to four thousand years ago, and that recent rates of change now are even higher than those associated with the end of the last ice age. Our follow-up comparative study comparing our results with other proxies across the Amazon, provided a much-needed interdisciplinary framework to examine past environmental conditions in this region (Albert et al. 2023), showing that rates of change in both geological and paleoecological records are exceptionally high over recent geological times.

When handling such large, heterogeneous datasets (e.g., fossil pollen compilations) for advancing paleoecological research, reproducibility is essential. The integration of open-access databases like Neotoma into research workflows must be accompanied by rigorous, transparent procedures for data sourcing, cleaning, filtering, and analysis. The establishment of reproducible workflows ensures that the entire process, from dataset compilation to final analysis, is transparent, reliable, and accessible for future researchers. In all our work, we emphasize the importance of standardized data preparation and validation steps, using our newly developed FOSSILPOL workflow (Flantua et al. 2023; FOSSILPOL website). This not only facilitates the synthesis of complex datasets but also fosters interdisciplinary collaboration. By ensuring that the analysis of paleoecological data is fully reproducible, we can reduce biases, improve the quality of results, and build a robust foundation for further interdisciplinary climate and biodiversity studies.

REFERENCES

Albert, J. S. et al. (2023). Human impacts outpace natural processes in the Amazon. Science, 379(6630), eabo5003. 

Flantua et al. (2023). A guide to the processing and standardization of global palaeoecological data for large‐scale syntheses using fossil pollen. Global Ecology and Biogeography, 32(8), 1377–1394.

Fossilpol website: https://hope-uib-bio.github.io/FOSSILPOL-website/index.html

Mottl et al. (2021a). Global acceleration in rates of vegetation change over the past 18,000 years. Science, 372(6544), 860–864.

Mottl et al (2021b). Rate-of-change analysis in paleoecology revisited: A new approach. Review of Palaeobotany and Palynology, 293, 104483.


How to cite: Flantua, S., Mottl, O., and Felde, V.: Advancing understanding of past environmental dynamics: Reproducible analytical workflows with large-scale fossil pollen compilations, EGU General Assembly 2025, Vienna, Austria, 27 Apr–2 May 2025, EGU25-17582, https://doi.org/10.5194/egusphere-egu25-17582, 2025.

EGU25-20051 | Posters on site | CL1.2.12

Reconstructing Holocene Vegetation, Fire, and Climate Interactions in the Mediterranean Using Speleothem Archives 

Nicolò Ardenghi, Andrea Columbu, Rhawn Denniston, Giovanni Zanchetta, Ilaria Isola, and Elena Argiriadis

Understanding the long-term interactions among vegetation, fire, and climate is critical for interpreting ecosystem responses to climatic perturbations. Project Prometheus investigates Holocene paleofire dynamics, vegetation shifts, and climate variability in the Mediterranean, using speleothem records from caves in Italy (Alps, Apennines, Sardinia) and the Balkans. By integrating multiple proxies, including polycyclic aromatic hydrocarbons (PAHs) as fire markers and n-alkanes as a proxy for vegetation composition and terrigenous input, this project aims to provide insights into the environmental drivers of fire activity from millennial to sub-centennial timescales, thus creating a high resolution fire history for the Mediterranean region.

Speleothems offer a novel paleoenvironmental archive, and we apply an advanced hydrocarbon extraction protocol adapted from a study on Australian stalagmites1. This method, which includes slow acid dissolution in a clean-room setting to minimize contamination and maximize compound yields, has significantly improved the detection limits and expanded the range of PAHs identified2. Uranium-thorium (U-Th) dating ensures a precise chronological framework, enabling robust correlation between fire, vegetation, and climate proxies.

Here we present results from the initial phase of the project, analyizing a dozen archives from Italy, Greece, and Northern Macedonia, at low resolution (millennial- and sub-millennial-scale). Preliminary results, will provide a first indication of technique effectiveness, archive quality, and regional historical variations (if any) in paleofire regimes. Comparative studies with paleofire data from lake sediments in Italy, where shifts in fire regimes have been previously documented, as well as with modern fire data derived from registries and satellite observations, will help contextualizing our findings within broader regional fire histories.

This research advances our understanding of vegetation-wildfire-climate interactions in the Mediterranean by contributing high-resolution, multi-proxy reconstructions from an understudied archive. By linking past fire and vegetation responses to climatic variability, it provides critical context for assessing future ecosystem resilience and informing land management policies under changing climate conditions.

How to cite: Ardenghi, N., Columbu, A., Denniston, R., Zanchetta, G., Isola, I., and Argiriadis, E.: Reconstructing Holocene Vegetation, Fire, and Climate Interactions in the Mediterranean Using Speleothem Archives, EGU General Assembly 2025, Vienna, Austria, 27 Apr–2 May 2025, EGU25-20051, https://doi.org/10.5194/egusphere-egu25-20051, 2025.

EGU25-2929 | Orals | CL1.2.13 | Highlight

Quantifying the effects of climate change and human predation on the extinction of Late Pleistocene megafauna  

Axel Timmermann, Thushara Venugopal, and Pasquale Raia

Whether excessive hunting of Homo sapiens caused the extinction of Late Pleistocene megafauna or whether deglacial climate change was the main culprit has remained a controversial issue. Previous studies have focused on statistical relationships between human arrival time and megafauna disappearance, but so far no quantitative dynamical model has been presented that addresses this important issue. Here we introduce a new dynamical Lotka Volterra reaction diffusion partial differential equation model that explicitly simulates biomass variations of 2178 mammal species (including H. sapiens) across the globe, as well as predator/prey relationships and competition.  Key demographic parameters of this realistic model are estimated from allometric bodymass scaling relationships and the herbivore carrying capacity is obtained by combining habitat information and net primary information. The model simulates the patterns of key biological parameters, such as species richness, diversity, evenness and predator/prey relationships in close agreement to observational estimates. Changes in carrying capacity and climate parameters across the last glacial termination and into the Holocene have been estimated using the 3 million year transient paleo climate simulation conducted with the CESM1.2 earth system model at the IBS Center for Climate Physics. For Homo sapiens, the model also accounts for cultural carrying capacity. By turning on and off the human component during our transient simulations, we can determine the impact of agressive hunting on mammal populations and on megafauna in particular. Furthermore, by repeating these experiments for fixed climate time slices (Last Glacial Maximum, Mid Holocene), we can assess the climatic effect. Our model results demonstrate that 1) megafauna extinction was caused by excessive human predation, 2) in the absence of human hunting, there is no megafauna extinction, 3) deglacial climate change accelerates the overkill, because it increases the habitat suitability of humans in key areas of Eurasia.

How to cite: Timmermann, A., Venugopal, T., and Raia, P.: Quantifying the effects of climate change and human predation on the extinction of Late Pleistocene megafauna , EGU General Assembly 2025, Vienna, Austria, 27 Apr–2 May 2025, EGU25-2929, https://doi.org/10.5194/egusphere-egu25-2929, 2025.

EGU25-3636 | ECS | Posters on site | CL1.2.13

Magnetic fabric of Tajik loess-palaeosols as a palaeowind and process indicator 

Ramona Schneider, Ekaterina Kulakova, Bjarne Almqvist, and Thomas Stevens

Reconstructing past wind directions is critical in constraining synoptic scale climate regimes in the geologic past. Such wider scale understanding of past climate helps frame the climatic and environmental conditions that past human populations were exposed to. This is particularly important in regions such as Сentral Asia, at the interface of a range of climate zones. Palaeolithic tools are extensively embedded within the loess-palaeosol sequences of the Khovaling Loess Plateau, Southern Tajikistan, yet little is known about the environmental conditions these hominin groups faced.

Magnetic techniques applied to loess-palaeosol sequences are particularly insightful for investigating dust transport dynamics and variations in the intensity of hydroclimate. Anisotropy of magnetic susceptibility (AMS) in particular measures the magnetic fabric, i.e., the orientation of magnetic particles in an oriented sample, which can provide insights into palaeowind directions and post-depositional processes. Here we apply AMS to three different loess-palaeosol sections of the Khovaling Loess Plateau, approximately spanning the past 1 Ma, in order to assess if this technique allows us to reconstruct palaeowind directions for this region of Central Asia.

Our results reveal the first palaeowind directions reconstructed for the Khovaling Loess Plateau. We present AMS data from three sites on the Khovaling Loess Plateau and demonstrate the potential and limitations of this data for reconstructing palaeowind directions. We investigate the question to which degree local winds, responsible for loess deposition on the Khovaling Loess Plateau, are related to broader atmospheric circulation patterns. We also explore how AMS data can be combined with other palaeoenvironmental proxies, such as frequency-dependent magnetic susceptibility as an indicator of palaeoprecipitation, and how this technique can be used to assess sediment reworking.

How to cite: Schneider, R., Kulakova, E., Almqvist, B., and Stevens, T.: Magnetic fabric of Tajik loess-palaeosols as a palaeowind and process indicator, EGU General Assembly 2025, Vienna, Austria, 27 Apr–2 May 2025, EGU25-3636, https://doi.org/10.5194/egusphere-egu25-3636, 2025.

EGU25-3814 | ECS | Posters on site | CL1.2.13

napari-sediment: An open-source plugin for hyperspectral sediment core analysis 

Petra Zahajská, Guillaume Witz, and Martin Grosjean

Hyperspectral imaging (HSI) is revolutionising sediment core analysis in environmental and geoscience research, providing high-resolution, non-destructive insights into biogeochemical processes. However, analysing the large, complex datasets generated by HSI requires specialised tools. Existing commercial solutions often lack flexibility and transparency, hindering open science practices.

To address this, we introduce napari-sediment, an open-source plugin for the napari image analysis platform. This plugin provides a user-friendly graphical interface to implement a complete workflow for hyperspectral sediment core analysis, including:

  • Preprocessing: Background correction and noise reduction.
  • Data exploration: Interactive visualisation and statistical analysis of spectral data.
  • Endmember extraction: Identification of pure spectral signatures.
  • Quantitative analysis: Calculation of spectral indices for substance quantification and visualisation of spatial distributions.

napari-sediment streamlines the analysis of hyperspectral sediment core data, enabling researchers to efficiently extract valuable information on pigment distributions, mineral composition (limited), and organic matter content (qualitative). By leveraging the napari framework, the plugin fosters reproducibility and collaboration in the growing field of hyperspectral sedimentology. Here, we demonstrate the capabilities of napari-sediment and highlight its potential for advancing paleoclimate research, environmental monitoring, and geological investigations.

How to cite: Zahajská, P., Witz, G., and Grosjean, M.: napari-sediment: An open-source plugin for hyperspectral sediment core analysis, EGU General Assembly 2025, Vienna, Austria, 27 Apr–2 May 2025, EGU25-3814, https://doi.org/10.5194/egusphere-egu25-3814, 2025.

EGU25-4815 | Orals | CL1.2.13

Integrated imaging fingerprints of anoxic concretions track 7000 years of abrupt and extreme Arctic winter climate change 

Willem van der Bilt, Barnabás Csiszár, Sher-Rine Kong, and Andreea Auer

Paleo data play a critical role in constraining the future evolution of climate in the Arctic, our planet`s most rapidly warming region. However, most proxies capture past change during the brief summers, when biological indicators are synthesized, and the availability of liquid water as well as the absence of snow allows sediment transport. As a result, far less is known about climate variability in other seasons. This bias is of consequence, because simulations hint at more extensive winter variability. Also, these changes affect regional and global climate by impacting surface albedo, glacier melt, and biodiversity. This work helps close this knowledge gap, by providing a 7000-year long record of abrupt and extreme Arctic winter climate change. For this purpose, we analyzed lake sediments – sensitive recorders of surface change, taken from a high-altitude basin – amplifying the imprint of winter season change, on Svalbard – a High Arctic climate change hotspot. By characterizing variations in geochemistry with X-Ray Fluorescence (XRF), density with Computed Tomography (CT), and anoxia with Hyperspectral Imaging (HI), we provide multiple lines of evidence for the presence of concretions that formed after extreme winters triggered widespread anoxia owing to residual lake ice feedbacks. Comparison with ice core records and climate model simulations suggests that these abrupt shifts were triggered by volcanic eruptions. Our findings highlight the potential of imaging techniques to fingerprint the geochemical imprint of winter climate change, and further challenge the notion that Holocene climate was stable.

How to cite: van der Bilt, W., Csiszár, B., Kong, S.-R., and Auer, A.: Integrated imaging fingerprints of anoxic concretions track 7000 years of abrupt and extreme Arctic winter climate change, EGU General Assembly 2025, Vienna, Austria, 27 Apr–2 May 2025, EGU25-4815, https://doi.org/10.5194/egusphere-egu25-4815, 2025.

EGU25-5809 | ECS | Posters on site | CL1.2.13

High-Resolution Insights into Climate-Eutrophication-Anoxia Interactions in Late-Glacial Soppensee  

Stan Schouten, Petra Zahajská, and Martin Grosjean

Climate warming is projected to intensify the eutrophication and deoxygenation of lakes globally, exacerbating the already severe consequences for society and ecosystems. Sedimentary archives record the complex interplay between climate, lake mixing, algal production, nutrient dynamics, anoxia and related chemical feedback. However, eutrophication phases could be short-lived, and relevant changes may happen at sub-decadal timescales. Often, eutrophic or anoxic phases are preserved in a few centimetres of sediment and cannot be studied in detail with conventional methods. Imaging techniques aid in investigating eutrophication and deoxygenation in the past by providing continuous, high-resolution and very large data sets for statistical analysis. This study utilises high-resolution techniques — hyperspectral imaging and X-ray fluorescence — to analyse hysteresis behaviour, leads and lags among drivers and responses, and temperature-eutrophication-anoxia relationships in the well-dated Late-Glacial lacustrine sediments of Soppensee (Switzerland). 

Soppensee got eutrophic and developed anoxia during the second half of the Bølling. Phosphorus (P) was efficiently recycled (reductive dissolution) further fuelling eutrophication. Eutrophication lagged warming by 300 years suggesting that warm temperatures were pre-conditional to eutrophication and anoxia while not directly triggering it; Instead, eutrophication responded non-linearly to vegetation dynamics and tree cover around the lake, exhibiting a threshold at 75% tree pollen (TP) and showing hysteresis behaviour. At the onset of eutrophication, the response of anoxia was immediate. Cyanobacteria bloomed with a lead of ~50 years before other phototrophic primary producers, highlighting their potential role as early ecosystem pioneers.

When eutrophication decreased due to landscape opening (TP < 75%) caused by a cold interval (GI1d, Older Dryas), the lake became well-mixed, and P started to become sequestered in sediments, further remediating lake eutrophication. During the warm phases of the Allerød, two more eutrophic and anoxic phases occurred. However, their amplitudes further decreased due to the effective sequestration of P (suppressed chemical feedback). Eutrophication disappeared at the start of the Younger Dryas when the landscape opened, and the lake was well mixed.

This high-resolution study demonstrates the potential of sedimentary imaging techniques to detect short-lived events, rapid regime shifts, leads and lags between forcing and responses in ancient ecosystems.

How to cite: Schouten, S., Zahajská, P., and Grosjean, M.: High-Resolution Insights into Climate-Eutrophication-Anoxia Interactions in Late-Glacial Soppensee , EGU General Assembly 2025, Vienna, Austria, 27 Apr–2 May 2025, EGU25-5809, https://doi.org/10.5194/egusphere-egu25-5809, 2025.

EGU25-6204 | ECS | Orals | CL1.2.13

Low Counts, High Stakes: Challenges in micro- Geochemical Imaging of Paleoclimate Archives 

Laura Schley, Rik Tjallingii, Gert Jan Weltje, Konstantin Mittelbach, Michael Strasser, and Arne Ramisch

Imaging techniques, such as micro-X-ray fluorescence (µ-XRF), are critical tools for paleoenvironmental reconstructions. Recent advances in two-dimensional (2D) mapping enable detailed spatial and temporal analyses of paleoclimate archives, providing unprecedented insights into past environmental changes. However, generating high-resolution geochemical maps often requires tradeoffs between measurement time and data quality. Limited exposure times per pixel result in low counts and frequent zero values, which increase noise and variability in the data. The compositional nature of count data introduces additional challenges, as zeros and zero replacement strategies can compromise the effectiveness of log-ratio transformations.

This study investigates the impact of low-count µ-XRF data using maps from laminated lake sediments in Lake Ammersee, Germany. The varves in this archive record seasonal changes, with Ca-enriched layers forming during summer and Ti-enriched detrital layers indicating flood events. We analyzed 2D maps from eight repetition measurements and simulated extended exposure times by stacking them. Additionally, synthetic datasets were used to simulate both low (mean count intensity < 10) and high (mean count intensity > 10,000) count rate scenarios.

Our results reveal that low-count data exhibit persistent artifacts in both native and log space. Spurious correlations and clusters of elemental ratios remain evident, even after log-ratio transformations, and are most pronounced in low-intensity datasets. These artifacts complicate the reconstruction of paleoclimate proxies and the interpretation of geochemical records. Increasing count rates by extending the measurement time may provide a short-term solution to reduce these artifacts. However, current methodologies for addressing low-count compositional data and zero-replacement strategies remain inadequate, particularly for high-resolution imaging techniques. Advancing statistical approaches is essential to develop robust frameworks for interpreting paleoclimate proxies.

How to cite: Schley, L., Tjallingii, R., Weltje, G. J., Mittelbach, K., Strasser, M., and Ramisch, A.: Low Counts, High Stakes: Challenges in micro- Geochemical Imaging of Paleoclimate Archives, EGU General Assembly 2025, Vienna, Austria, 27 Apr–2 May 2025, EGU25-6204, https://doi.org/10.5194/egusphere-egu25-6204, 2025.

EGU25-7319 | Posters on site | CL1.2.13

Using micro-computed tomography (µCT) to measure annually resolved sediment fluxes in varved sediments 

Pierre Francus and Marie-Eugenie Jamba

Annually laminated sediments (varves) are excellent paleoclimate archives because of their high temporal resolution and because they contain their own chronology that can be converted to calendar years. However, their studies can be tedious because they can be disturbed, irregular or very thin, sometimes less than a mm. Here we explore the potential of micro-computed tomography (µCT) to unlock paleoclimate signals from varved records.

First, we show the added value of performing varve counts and thickness measurements from a 3D volume instead of a randomly sampled single 2D plane that is commonly used.

Second, we investigate the possibility to obtain density measurements for each varve, allowing calculating annually resolved sediment fluxes in gr cm-2 a-1. To achieve this, we µCT-scanned several varved sequences containing sediments covering a wide range of density and extracted their linear attenuation. Then, discrete volumetric samples were subsampled, weighted, gradually dried every 30 minutes and µCT-scanned each time at two different incident energies. This allowed establishing a calibration of water content based on linear attenuation coefficients. Once the density and water content were obtained, the next step was to calculate the density and the mass accumulation rate for each varve.

This approach will pave the way for “forward modelling,” namely the modelling of climate indicators (proxy) contained in natural archives. This method is recognized as a way of improving paleoclimate reconstructions, as it is less sensitive to the non-linearity of the physical processes involved in the formation of proxies than the statistical models that are commonly used.

How to cite: Francus, P. and Jamba, M.-E.: Using micro-computed tomography (µCT) to measure annually resolved sediment fluxes in varved sediments, EGU General Assembly 2025, Vienna, Austria, 27 Apr–2 May 2025, EGU25-7319, https://doi.org/10.5194/egusphere-egu25-7319, 2025.

EGU25-7352 | Orals | CL1.2.13

Using dual-energy CT to discriminate sediment facies in a varved sequence  

Pierre Francus and Margherita Martini

The attenuation of X-ray is influenced by the density (electron density, ρe) and the elemental composition (effective atomic number, Zeff) of the object being imaged. The incident X-ray beams energy controls the relative importance of these two properties in the resulting X-ray attenuation. Yet, dual-energy X-ray computed tomography, or using two incident X-ray beams of different energy, has been used in medical sciences to distinguish the different compounds within a sample based on their density (electron density, ρe) and elemental composition (effective atomic number, Zeff).

An innovative approach, i.e., the stoichiometric calibration for dual-energy X-ray computed tomography, was already successfully implemented to identify single and homogeneous minerals easily and non-destructively. It is here applied for the first time to a varved sequence with three distinct facies. The output of dual-energy X-ray computed tomography was compared against elemental geochemistry obtained at the same resolution using a micro-XRF core scanner. The three individual facies can be successfully differentiated using dual-energy X-ray computed tomography because their range of ρe and Zeff values allow their discrimination. Correlations with elemental geochemistry are also discussed but are less conclusive, probably because of variations in grain size and porosity, and because these high-resolution analyses were not performed at the exact same location. We discuss the limitations when using dual-energy X-ray computed tomography on sediments but also demonstrates its potential to quantitatively study sediment cores in a non-destructive way.

This presentation is based on https://doi.org/10.1002/dep2.271

How to cite: Francus, P. and Martini, M.: Using dual-energy CT to discriminate sediment facies in a varved sequence , EGU General Assembly 2025, Vienna, Austria, 27 Apr–2 May 2025, EGU25-7352, https://doi.org/10.5194/egusphere-egu25-7352, 2025.

Archaeological culture reflects ancient human activities and cultural characteristics in a certain time and space, and its evolution process is of great significance to archaeological research and the exploration of civilization. In this paper, we took the Taihu Lake region in the lower Yangtze River of China during the Neolithic period as the research area (Fig.1). Based on the site information automatically obtained from the corresponding Chinese archaeological text data by the information extraction method in this research area, we adopted the complex network analysis method and constructed the network model for the four consecutive archaeological cultures of Majiabang, Songze, Liangzhu, and Maqiao, respectively, with the parameters of the cost distance between the sites calculated taking into account the topographical factors of the slope, undulation, etc.(Fig.2) The structural characteristics of prehistoric societies in the four different periods were deeply explored from three aspects: small-worldness, network accessibility and network stability. The law and trend of regional cultural evolution were analyzed. The results are as follows: (1) The Neolithic cultures of the circum-Taihu region as a whole exhibit the property of small-worldness, suggesting that prehistoric societies showed a homogeneous and uniform pattern of connections in the overall region. (2) The network structure of sites from Majiabang to Liangzhu period showed a tight and stable evolution trend. However, from Liangzhu to Maqiao period, the cultural development began to decline, showing signs of entering a depression. The archaeological cultural network model proposed in this paper provides a new way of thinking for quantitatively understanding the social structure and evolutionary laws of early human societies around the Taihu Lake area, and provides a quantitative analysis method for exploring the characteristics and laws of regional cultural evolution, and promotes scientific archaeological research by providing an important method.

KeywordsTaihu Lake in China; Neolithic period; Complex network model; Archaeological culture; Culture evolution

Fig.1 Schematic diagram of the area around Taihu Lake

Fig.2 Spatial structure network of archaeological sites (a) Majiabang culture; (b) Songze culture; (c) Liangzhu culture; (d) Maqiao culture

How to cite: Yang, L., Li, H., and Zhao, Y.: Network Model Construction and Evolution of Prehistoric Archaeological Cultures Based on Textual Data of Archaeological Sites—Taking Neolithic Archaeological Sites in Circum-Taihu Lake Region in China as an Example, EGU General Assembly 2025, Vienna, Austria, 27 Apr–2 May 2025, EGU25-7973, https://doi.org/10.5194/egusphere-egu25-7973, 2025.

Over the past decades coral skeletons have become established as excellent archives of environmental changes, with seasonal banding in either skeletal density or trace element geochemistry providing a method of reconstructing annual to sub-annual processes. Density banding was first observed using radiography to produce two-dimensional images of a skeletal slab. More recently, micro-tomography has been used to develop three-dimensional reconstructions of a skeletal sample, which provides opportunities to understand microstructural changes and associated variations in bulk density in different compartments of coral skeletons. Here, we use micro-tomography to track changes in density in two species of Caribbean coral, Siderastrea siderea and Pseudodiploria strigosa. Specifically, we develop a method that involves unsupervised learning for instance segmentation of microstructrual features such as corallites. We then combine this with semantic segmentation to separate individual voxels as either open space or coral skeleton, from which we can calculate and then track changes in porosity and thus bulk density. The results show that there are clear changes in the rate of extension throughout an annual cycle, and by tracking these variations we observe clear changes in porosity associated with environmental disturbances such as volcanic eruptions. Additionally, we show that these changes manifest differently in different compartments of the coral skeleton. Finally, we develop panoptic segmentation methods as a tool to overcome non-linearities in coral extension across the surface of the coral, by following the extension of individual features throughout the growth of the skeletal sample.

How to cite: Sheldrake, T. and Vincent, J.: Opportunities and challenges in the reconstruction of environmental processes using segmented micro-CT scans of coral skeletons, EGU General Assembly 2025, Vienna, Austria, 27 Apr–2 May 2025, EGU25-8607, https://doi.org/10.5194/egusphere-egu25-8607, 2025.

EGU25-9522 | ECS | Orals | CL1.2.13

Evolution of sedimentary environments in an axial rift system: the Lower Omo Valley (Turkana Depression, Ethiopia) for the past four million years 

Perrine Poirier, Alexis Nutz, Vincent Godard, Didier Granjeon, Mathieu Schuster, Doris Barboni, Ghislain Gassier, and Jean-Renaud Boisserie

The time interval between 4 Ma and 0.8 Ma is pivotal for the evolutionary history of hominids in eastern Africa, and particularly in the Turkana Depression (East African Rift System, Kenya / Ethiopia). It coincides with a number of major evolutionary events, including the evolution and disappearance of the genus Australopithecus, the appearance of the genus Homo, the first expansions to Eurasia, and many technological innovations, especially the Lomekwian, Oldowayan and Acheulean lithic industries. This period is also marked by pronounced environmental changes, relatively well constrained at the global scale using marine records, but still poorly documented on the continents. Indeed, little information exists on their impact on landscapes, whose configuration, dynamics, spatial expansion are inevitably intertwined with other factors at play at the regional and local scale.

In this contribution, we aim at reconstructing the evolution of sedimentary environments and landscapes in the Lower Omo Valley (Ethiopia) for the past four million years to provide a better understanding of the physical environments in which local biological and cultural evolutions took place. To do so, we investigated the evolution of sedimentary systems and landscape dynamics in the Lower Omo Valley combining a Landscape Evolution Model (Landlab) to constrain the input sediment flux with a stratigraphic forward model (DionisosFlow, Beicip-Franlab). To assess the consistency of model reconstructions, we compare model outputs to sedimentary architectures, volumes of eroded and deposited sediments and facies distribution derived from field observations and seismic data. Subsequently, we will present and discuss the roles of the different forcings, such as changes in precipitation and tectonic uplift, that drove the evolution of the sedimentary system.

How to cite: Poirier, P., Nutz, A., Godard, V., Granjeon, D., Schuster, M., Barboni, D., Gassier, G., and Boisserie, J.-R.: Evolution of sedimentary environments in an axial rift system: the Lower Omo Valley (Turkana Depression, Ethiopia) for the past four million years, EGU General Assembly 2025, Vienna, Austria, 27 Apr–2 May 2025, EGU25-9522, https://doi.org/10.5194/egusphere-egu25-9522, 2025.

EGU25-10564 | ECS | Posters on site | CL1.2.13

Reconstructing storminess from aeolian sand influx to peat bogs using X-ray computed tomography 

Ylva Palmgren, Matt O'Regan, and Malin Kylander

In recent years the use of aeolian sand influx (ASI) analyses on ombrotrophic peat sequences (c.f. Björck and Clemmensen, 2004) has become an increasingly popular method for reconstructing past storminess. This method is based on the assumption that all mineral grains deposited on the surface of the hydrologically isolated bog must have been brought to the site by wind. Thus, changes in the amount and size of the mineral grains found over time/depth can be related to past storm frequency and intensity. During the last two decades, several different methods of quantifying ASI have been developed. Three major drawbacks of these methods are that they are (i) often time- and labour intensive; (ii) rely on high temperature dry ashing to remove organic material from samples before ASI quantification and (iii) non-continuous, requiring discrete sampling.

In an attempt to address these issues, we investigate whether X-ray computed tomography (CT) can be used to count and measure sand grains in peat. Drawing from the methods used by Cederstrøm et al. (2021) for IRD quantification in marine sediments, we added known amounts of sand (manually counted) in certain grain size fractions (63-1000, 125-1000, 63-125, 125-250, 250-500 and 500-1000 µm) and with known grain size distributions (laser diffraction) to test peat samples. The samples were then CT-scanned at a voxel resolution of 27.5 µm, and in the resulting 3D imagery, sand grains were identified, counted and measured using basic image processing tools. Our preliminary results indicate that it is possible to reliably count and measure sand grains in peat using a CT-based method, especially for grain sizes larger than 4-5 voxels (≥125 µm in this study). Grain size distributions for peat samples with sand grains ≥125 µm acquired through the CT method are strongly correlated to standard laser diffraction results (r = 0.81–0.98, p < 0.01). Similarly, CT-based and manual grain counts show a strong correlation (r = 0.94–1.00, p < 0.01) and the number of grains counted using the CT method differs on average by only 4 % from manual counts. Early-stage trials with full peat sequences further indicate that CT could be a reliable and efficient method for quantifying ASI and reconstructing past storm variability.

References

Björck, S., Clemmensen, L., 2004. Aeolian sediment in raised bog deposits, Halland, SW Sweden: A new proxy record of Holocene winter storminess variation in southern Scandinavia? Holocene 14, 677–688. https://doi.org/10.1191/0959683604hl746rp

Cederstrøm, J.M., van der Bilt, W.G.M., Støren, E.W.N., Rutledal, S., 2021. Semi-automatic ice-rafted debris quantification with computed tomography. Paleoceanography and Paleoclimatology 36, e2021PA004293. https://doi.org/10.1029/2021PA004293

How to cite: Palmgren, Y., O'Regan, M., and Kylander, M.: Reconstructing storminess from aeolian sand influx to peat bogs using X-ray computed tomography, EGU General Assembly 2025, Vienna, Austria, 27 Apr–2 May 2025, EGU25-10564, https://doi.org/10.5194/egusphere-egu25-10564, 2025.

EGU25-10624 | Orals | CL1.2.13

Disruptions in ecological resources as a driver for human and mammalian evolution in the South Kenya Rift: the 1 million-year-long Olorgesailie core record 

René Dommain, Richard Potts, Anna K. Behrensmeyer, Alan Deino, Simon Riedl, Peter deMenocal, Emily Beverly, Rahab Kinyanjui, Rachel Lupien, Veronica Muiruri, R. Bernhart Owen, Mona Stockhecke, Erik Brown, and James Russell

The Olorgesailie Basin in the South Kenya Rift preserves the oldest known evidence for the emergence of the Middle Stone Age (MSA) in eastern Africa between 320 and 295 ka. The MSA permanently replaced Acheulean technology in the South Kenya Rift following its persistence in the Olorgesailie Basin between 1.2 Ma and 500 ka. The transition in hominin technologies between 500 and 320 ka is significant as the MSA is typical of early Homo sapiens and is furthermore distinguished by novel behaviours like social exchange networks and symbolic communication. Contemporaneous with the emergence of the MSA was a turnover in mammal species in the South Kenya Rift – one of the largest Pleistocene turnovers recorded in East Africa – from large-bodied grazers to smaller-sized species of broader ecology. This fundamental biotic and behavioural shift suggests that considerable environmental change occurred in the region during that time. To test this hypothesis, we drilled the adjacent Koora basin and recovered a 139-m-long sediment core for evidence of past environmental dynamics in the South Rift. With 22 40Ar-39Ar ages we established the most-precisely dated core record for the past 1 Myr from East Africa. A combination of microfossil, isotope, geochemical, and sedimentological analyses was used to reconstruct freshwater availability, vegetation cover, hydroclimate and aquatic conditions. Diatom and XRF-elemental records indicate a phase of relatively stable high lake levels from 1 Ma to 470 ka dominated by freshwater conditions. The remainder of the record shows highly fluctuating lake levels with numerous periods of desiccation and shifting fresh to saline lake waters. Similarly, vegetation reconstruction based on phytoliths and carbon isotopes shows a mixed woody grassland environment, typical of savannas until 400 ka, followed by a phase in which rapid shifts between woody and grassland cover occurred, during which grassland composition shifted between C3 and C4 dominance. Collectively, the lake level and vegetation records point to highly variable moisture supply and associated disruptions in ecological resources after 400 ka, which impacted both hominins and mammal communities. We propose that a combination of climate variability and enhanced tectonic activity in the rift resulted in spatial and temporal variations in freshwater availability and habitats that favoured hominins and mammals with broader ecological flexibility and resilient adaptations.       

How to cite: Dommain, R., Potts, R., Behrensmeyer, A. K., Deino, A., Riedl, S., deMenocal, P., Beverly, E., Kinyanjui, R., Lupien, R., Muiruri, V., Owen, R. B., Stockhecke, M., Brown, E., and Russell, J.: Disruptions in ecological resources as a driver for human and mammalian evolution in the South Kenya Rift: the 1 million-year-long Olorgesailie core record, EGU General Assembly 2025, Vienna, Austria, 27 Apr–2 May 2025, EGU25-10624, https://doi.org/10.5194/egusphere-egu25-10624, 2025.

EGU25-10919 | ECS | Posters on site | CL1.2.13

The HESCOR Database: Bridging Human and Earth Science Data 

Elena Robakiewicz, Philipp Schlüter, and Verena Foerster

The Human and Earth System Coupled Research (HESCOR) project at the University of Cologne aims to increase interdisciplinary discussion in research related to the Earth and Human Systems by collaborating across disciplines to create model-tested hypotheses and analyze data. Given the broad range of jargon and data from researchers across the humanities, natural sciences, and social sciences, HESCOR promotes methods that lower barriers and encourage interdisciplinary discourse and data sharing to better link often diverse and distinct data from different disciplines. Within HESCOR, clearly defined workflows, protocols, and a 3-tiered database serve as the foundation of the interdisciplinary process. Standard workflows and protocols help structure conversations and set expectations so that HESCOR researchers can continue interdisciplinary dialogue and documentation throughout data processing. By organizing HESCOR data in well-defined tiers (Tier I – standardized metadata, Tier II – reorganized and quality-controlled data within a HESCOR framework, and Tier III – interpreted data), the HESCOR Database reflects the research stages of data analysis – processing data for modelling along the way. This structure allows HESCOR members to better communicate data interpretations across academic fields and formulate models that can help reconstruct causal links between the Human and Earth Systems. The HESCOR database prioritizes uniform metadata, substantial documentation, and clearly defined interpretations to provide orderly data across the natural sciences, social sciences, and humanities applicable to a broader set of researchers. Utilizing a soon-to-be published Late Pleistocene paleoenvironmental record from Lake Nakuru, Kenya, we demonstrate the workflow created at HESCOR to increase communication across disciplines to further understanding of the interplay between the Human and Earth Systems.

How to cite: Robakiewicz, E., Schlüter, P., and Foerster, V.: The HESCOR Database: Bridging Human and Earth Science Data, EGU General Assembly 2025, Vienna, Austria, 27 Apr–2 May 2025, EGU25-10919, https://doi.org/10.5194/egusphere-egu25-10919, 2025.

EGU25-12973 | ECS | Posters on site | CL1.2.13

Microscale Alkenone Heterogeneity and Replicability of Ultra-High-Resolution SST Proxies in Laminated Marine Sediments 

Jannis Viola, Lars Wörmer, Kai-Uwe Hinrichs, and Thomas Laepple

Alkenones in marine sediments are a key proxy for the reconstruction of past sea surface temperatures. Recent advances in mass spectrometry imaging (MSI) allow the Uk’37 proxy to be measured at the micrometer scale. Such high resolutions can theoretically provide a resolution similar to the observational record and hold the promise of reconstructing continuous climate records from subseasonal or interannual to centennial and millennial timescales. However, due to processes occurring during and after deposition, as well as the sampling and measurement procedures, it is unclear how much climate signal is preserved at these small spatial scales.

Here, we investigate this question using biomarker MSI on sediment records from the Santa Barbara Basin (SBB), a key site for Californian Current and Northeast Pacific SST reconstructions. We perform replicated MSI measurements on sediments with varying degrees of lamination to analyze the spatial structure and spatial reproducibility of the alkenone signal. 

We find that biomarker distributions are spatially heterogeneous even within laminae but exhibit small scale clustering. Spatial maps exhibit increased similarity in submm scale and with longer ranges and less overall variability within laminated horizons.

These findings have implications for the conversion of spatial biomarker data to time series reconstructions, as spatial heterogeneity patterns can act as an additional noise source during processing but can be accounted for using optimized 2D map to 1D timeseries conversion methods.

Using the replicated setup, we can derive the signal content and independent noise levels across varying sediment conditions. For our MSI-derived SST reconstructions this leads to signal-to-noise ratios ranging from ~1-3 integrated SNR at interannual resolution to ~4-6 integrated SNR at subdecadal (ENSO) timescales. The resulting SNRs can be used to infer optimal sampling strategies to tailor the resolution to the desired timescales of the studies for MSI based reconstructions as well as for discrete, traditional sampling efforts.

The findings imply that MSI based alkenone Uk’37 records at SBB during the Holocene and late Pleistocene, supported by careful noise & uncertainty estimations, can provide an upper limit for the reconstruction of SST variability beyond the instrumental record.

How to cite: Viola, J., Wörmer, L., Hinrichs, K.-U., and Laepple, T.: Microscale Alkenone Heterogeneity and Replicability of Ultra-High-Resolution SST Proxies in Laminated Marine Sediments, EGU General Assembly 2025, Vienna, Austria, 27 Apr–2 May 2025, EGU25-12973, https://doi.org/10.5194/egusphere-egu25-12973, 2025.

EGU25-15147 | Posters on site | CL1.2.13

Enhancing Lithofacies Identification Through X-Ray Computed Tomography 

Yen-Hsi Wu, Jyh-Jaan Steven Huang, Neng-Ti Yu, Jiun-Yee Yen, Shyh-Jeng Chyi, and Jia-Hong Chen

Understanding lithofacies, defined by distinct sedimentary characteristics, is fundamental for deciphering depositional processes and reconstructing paleo-environments. While conventional methods like visual core description and grain size analysis are widely employed, they often face challenges, such as incomplete observation of internal structures, discrete sampling intervals, and potential for subjective interpretations, which may hinder the accuracy of lithofacies identification. X-ray Computed Tomography (CT), a non-destructive, high-resolution, and widely applicable imaging technique, addresses these limitations by enabling three-dimensional visualization and quantitative analysis of sediment cores. This study evaluates the feasibility of CT in assisting lithofacies identification by analyzing two sediment cores from the Dapeng Bay region in southwestern Taiwan. Beyond its qualitative capability to reveal imperceptible structures, CT-derived parameters were employed to quantify sedimentary features, such as grain size variability and internal structures, including ratios of different CT-intensity ranges (indicating materials of varying density or composition), mean CT intensity, coefficient of variation, and morphological characteristics. By combining these parameters, fourteen lithofacies were identified and further grouped into three sedimentary facies: lagoonal, channel, and tidal flat. This facilitates the reconstruction of a 500-year depositional history, highlighting the transition from lagoonal to tidal flat systems and elucidating depositional mechanisms influenced by high-energy events. This study establishes an objective and standardized framework that integrates qualitative CT imaging with quantitative parameterization to assist lithofacies identification. By reliably capturing subtle sedimentary variations and enabling consistent application across multiple sediment cores, this approach also supports systematic examination of spatial coverage and provides valuable insights into sedimentary environments across temporal and spatial scales.

How to cite: Wu, Y.-H., Huang, J.-J. S., Yu, N.-T., Yen, J.-Y., Chyi, S.-J., and Chen, J.-H.: Enhancing Lithofacies Identification Through X-Ray Computed Tomography, EGU General Assembly 2025, Vienna, Austria, 27 Apr–2 May 2025, EGU25-15147, https://doi.org/10.5194/egusphere-egu25-15147, 2025.

EGU25-15503 | ECS | Orals | CL1.2.13

Preliminary Assessment of Peat Deposits Imaging Using VNIR (400–1000 nm) Hyperspectral Scanning: Organic Matter and Humification Case Study 

Maurycy Żarczyński, Kamila Kostrzewska, Barbara Zawistowska, and Sambor Czerwiński

Wetlands are one of the most valuable yet most threatened terrestrial ecosystems. These ecosystems are essential in regulating the long-term carbon cycle, maintaining hydrological balance, and serving as local biodiversity hotspots. However, human activities have heavily impacted these ecosystems for centuries, changing them from carbon sinks into carbon sources. Current climate change and land use changes speed up this process globally. Conservation and restoration efforts require a better understanding of these negative phenomena. Studying how peat deposits change over time and across different areas is essential to make informed decisions. This research helps link environmental impacts to how wetlands respond, enabling more effective management strategies.

However, typical high-resolution spatiotemporal studies require numerous drill sites, abundant samples, and analytical techniques, substantially limiting the investigation scope. Non-destructive imaging techniques such as hyperspectral scanning imaging (HSI) might help overcome these limitations by allowing rapid analyses of lengthy peat profiles. Therefore, HSI is a promising tool for paleoenvironmental investigations and can potentially be used in conservation efforts of degraded peatlands.

We selected a peatland in northern Poland to test the HSI's ability to accurately trace organic matter accumulation and peat humification in several microhabitats. Peat excavation sites indicate that human activities have impacted this location in the past, and different processes (like drainage) might have been recorded affecting the peat, leading to the lowering of the water table. We cored in 5 sites and obtained 5.2 m of material, capturing undisturbed and heavily humified deposits. Cores were subsampled every 5 cm. We used estimated organic matter content (OM) by loss on ignition and von Post humification degree. We confronted these results with high-resolution hyperspectral scanning imaging (HSI) of peat cores in the VNIR (400–1000 nm) range. Finally, we compared both approaches using linear regression and machine learning approaches, i.e., random forest and gradient boosting, to find associations between the datasets. Overall, machine learning models generalize OM and humification tendencies in the deposits to a satisfactory level. Further investigation with numerous drills per site, more diverse material, and increased training set size might provide an invaluable opportunity to identify the current condition of the peatlands. In the future, they can provide a rapid and independent tool for checking restoration efforts.

The work was supported by the National Science Centre, Poland, under the research project „Exploring methods of hyperspectral imaging of lake sediments: proxy development and calibration,” no UMO-2023/51/D/ST10/00801

How to cite: Żarczyński, M., Kostrzewska, K., Zawistowska, B., and Czerwiński, S.: Preliminary Assessment of Peat Deposits Imaging Using VNIR (400–1000 nm) Hyperspectral Scanning: Organic Matter and Humification Case Study, EGU General Assembly 2025, Vienna, Austria, 27 Apr–2 May 2025, EGU25-15503, https://doi.org/10.5194/egusphere-egu25-15503, 2025.

EGU25-15770 | ECS | Orals | CL1.2.13

Southern California’s 2000-year wildfire history: Long-term trends and decadal variability 

Weimin Liu, Susanne Alfken, Jenny Wendt, Tripti Bhattacharya, Tiffany Napier, Arndt Schimmelmann, Kai-Uwe Hinrichs, and Lars Wörmer

Wildfires are one of the most destructive climate-related hazards, causing significant economic and environmental impacts globally. Paleo-wildfire records provide insights into how climate change influences wildfire dynamics, including shifts in severity and frequency. In the western USA, studies using sedimentary charcoal have shown that long-term wildfire variations are closely tied to changes in temperature and aridity. However, short-term variability in paleo-wildfire activity remains understudied.

Here, we investigated high-accumulation varved sediment deposits from the Santa Barbara Basin (SBB) off California. The analyzed cores (SPR0901-05BC and MV0811-14TC) span the last two millennia. By analyzing monosaccharide anhydrides (MAs) as molecular fire-markers at sub-millimeter spatial resolution using mass spectrometry imaging (MSI), we obtained paleo-wildfire records with interannual to decadal temporal resolution. The MAs record shows a similar trend to historical fire data for the last century, demonstrating the feasibility of using MAs as proxies for paleo-wildfire reconstruction.

A mixture model was applied to decompose the raw MAs record into two components: (1) a low-resolution background signal, potentially from fire-derived markers deposited in soil and gradually released into the ocean through long-term erosion and transport, and (2) a high-resolution peak signal, likely reflecting aerosol and/or rapid river deposition following fires. The background signal aligns with wildfire history reconstructed from charcoal records in the western USA, showing high biomass burning during the Medieval Climate Anomaly (MCA) and the settlement era, and low biomass burning during the Little Ice Age (LIA).

By analyzing the density of high-resolution peak signals, we reconstructed a decadal-scale fire frequency record for Southern California. This record provides detailed insights into changes in wildfire frequency during the MCA and the subsequent transition to the LIA. Overall, the fire frequency correlates positively with pre-20th-century variations in temperature and aridity on decadal timescales, indicating that the wildfire frequency was significantly influenced by decadal fluctuations in climate conditions.

How to cite: Liu, W., Alfken, S., Wendt, J., Bhattacharya, T., Napier, T., Schimmelmann, A., Hinrichs, K.-U., and Wörmer, L.: Southern California’s 2000-year wildfire history: Long-term trends and decadal variability, EGU General Assembly 2025, Vienna, Austria, 27 Apr–2 May 2025, EGU25-15770, https://doi.org/10.5194/egusphere-egu25-15770, 2025.

EGU25-16739 | Posters on site | CL1.2.13

Seasonal Timing of Shellfish Collection and Paleoenvironmental Reconstruction from Archaeological Shells at Blombos Cave, South Africa 

Carin Andersson, Jovana Milic’, Ozan Göktürk, and Karen van Niekerk

The Blombos Cave, located on the southern coast of South Africa, is a key site for understanding the behavioural evolution of modern humans during the Middle Stone Age. This study examines the seasonal timing of shellfish collection and the marine climate's seasonality near Blombos Cave through stable oxygen isotope analysis of the marine gastropod Turbo sarmaticus. By analyzing the δ18O values in sequential growth increments of T. sarmaticus shells from archaeological layers, we reconstruct past sea surface temperatures (SSTs) and infer patterns of human occupation over the period 100–70 ka. The δ18O data show distinct seasonal fluctuations in SSTs with an amplitude of approximately 4°C. These fluctuations are consistent with the present-day seasonal variation in sea surface temperatures at Blombos Cave, which is influenced by the interaction between the Agulhas Current (bringing warmer waters from the Indian Ocean) and the Benguela Current (bringing cooler waters from the Atlantic). The isotopic evidence also provides insight into the seasonality of human occupation at Blombos Cave. Preliminary findings suggest that early Homo sapiens primarily inhabited the site during the warmer seasons, likely focusing on marine resource exploitation at that time. Ongoing research will incorporate clumped isotope analysis to provide an independent temperature proxy, improving our estimates of past oxygen isotopic composition in coastal waters and enhancing reconstructions of SST and occupation seasonality.

How to cite: Andersson, C., Milic’, J., Göktürk, O., and van Niekerk, K.: Seasonal Timing of Shellfish Collection and Paleoenvironmental Reconstruction from Archaeological Shells at Blombos Cave, South Africa, EGU General Assembly 2025, Vienna, Austria, 27 Apr–2 May 2025, EGU25-16739, https://doi.org/10.5194/egusphere-egu25-16739, 2025.

EGU25-18824 | ECS | Posters on site | CL1.2.13

Interannual to decadal climate variability during the past 2,000 years in the Western Mediterranean using Mass Spectrometry Imaging 

Maria-Sofia Kapiri, Lars Wörmer, Susana Lebreiro, Weimin Liu, Stefan Platikanov, Teresa Rodrigues, Emilia Salgueiro, Aurelio Tobias, Heidi Taubner, Jenny Wendt, Igor Obreht, Patrizia Ziveri, and Belen Martrat

The Mediterranean Sea is expected to be one of the regions most severely impacted by current and future climate change. In fact, it is already experiencing more frequent and severe hydro-extremes (floods and droughts), which are to be exacerbated in the near future, together with thermal-extremes (heat and cold waves) as yet to be evaluated in seasonality and predictability. 

While past centennial-scale climate fluctuations in this region have already been investigated, however, little is known about higher frequency variability, i.e. variability at human timescales. This study aims to investigate the hydroclimate dynamics and Sea Surface Temperature (SST) variability over the past ~2,000 years at unprecedented temporal resolution, by using high-resolution biomarker analyses. 

Therefore, we integrated Mass Spectrometry Imaging (MSI) and conventional alkenone analysis to achieve sub-annual to decadal resolution in SST reconstructions from marine sediments collected in the Western Mediterranean and the Tagus areas from the Iberian margin. MSI is further combined with elemental proxies derived from μXRF mapping, including indicators of continental input and marine productivity.

Preliminary results reveal significant centennial-scale SST fluctuations and hydroclimate variability over the past ~2,000 years, including climatic transitions such as the Late Little Ice Age (LaLIA; 6th–7th centuries), the Little Ice Age (LIA; ca. 13th–19th centuries) and the Post-Industrial period (19th century onwards). We will present an overview of how these transitions impacted interannual to decadal climate variability. Such knowledge will advance our understanding of climate dynamics and their regional consequences, which is essential for addressing the associated societal-economic challenges.

Acknowledgements: The project that gave rise to these results received the support of a fellowship from the ”la Caixa” Foundation (ID LCF/BQ/DI24/12070003).

How to cite: Kapiri, M.-S., Wörmer, L., Lebreiro, S., Liu, W., Platikanov, S., Rodrigues, T., Salgueiro, E., Tobias, A., Taubner, H., Wendt, J., Obreht, I., Ziveri, P., and Martrat, B.: Interannual to decadal climate variability during the past 2,000 years in the Western Mediterranean using Mass Spectrometry Imaging, EGU General Assembly 2025, Vienna, Austria, 27 Apr–2 May 2025, EGU25-18824, https://doi.org/10.5194/egusphere-egu25-18824, 2025.

EGU25-19047 | ECS | Posters on site | CL1.2.13

Experimental Constraints on the Impact of Shell Dissolution on the Mg/Ca Temperature Relationship in the Polar Foraminifera Species Neogloboquadrina pachyderma 

Thomas Weiss, Audrey Morley, Alessio Fabbrini, Ulysses Ninnemann, Gavin Foster, and Rachel Brown

Mg/Ca and δ18O in foraminiferal shells are the most commonly used paleoclimate proxies for ocean temperature, salinity, and global ice volume. It is hypothesized that preferential dissolution of more soluble shell features and heterogenous shell chemistry as well as recrystallization can alter original shell chemistry as foraminifera sink below the lysocline into the deep ocean to be deposited as sediments. Core top studies have provided valuable insight into this process using closely grouped core tops with similar calcification conditions at the sea surface and different bottom water carbonate chemistry. They have proposed corrections for downcore Mg/Ca and/or δ18O based paleoclimate records using size normalized shell weights or past carbonate chemistry. However, it is impossible to unequivocally disentangle the effects of original calcification conditions and dissolution on core top shell chemistry at multiple sites. Recent studies have shown that foraminiferal shell dissolution can be simulated through lab-based experiments and dissolution intensity constrained using X-ray microcomputed tomography (Micro-CT) scans of the dissolved shells. We investigated dissolution effects by simulating dissolution of Neogloboquadrina pachyderma, the dominant polar foraminiferal species. Living N. pachyderma were collected from one station in the Greenland Sea via plankton tows and frozen at -80°C prior to dissolution experiments. Aliquots of 200 and 300 picked shells were dissolved in acidified Labrador Sea bottom water on a shaker table for two and three days respectively. An additional 189 shells were kept undissolved as a control. Micro-CT scans show that the average percentage of low-density calcite increased from 33.3 ± 3.6% for the undissolved shells, to 39.2 ± 4.3% for the two-day dissolved shells, to 44.8 ± 6.5% for the three-day dissolved shells, demonstrating an increase in dissolution intensity with an increase in dissolution time. We present δ18O and solution and LA-ICPMS based Mg/Ca results from the experiments that constrain the impact of dissolution on foraminiferal shell chemistry and propose a new framework for handling dissolution when generating foraminiferal chemistry-based paleoclimate records.

How to cite: Weiss, T., Morley, A., Fabbrini, A., Ninnemann, U., Foster, G., and Brown, R.: Experimental Constraints on the Impact of Shell Dissolution on the Mg/Ca Temperature Relationship in the Polar Foraminifera Species Neogloboquadrina pachyderma, EGU General Assembly 2025, Vienna, Austria, 27 Apr–2 May 2025, EGU25-19047, https://doi.org/10.5194/egusphere-egu25-19047, 2025.

EGU25-21298 | Orals | CL1.2.13

Late Cenozoic Eastern African Aridification, Vegetation Change, and Behavioral Diversity from Enamel Isotopes 

Daniel Green and Kevin Uno and the Turkana Miocene Project Coauthors

Eastern African geochemical and paleovegetation records hint at the presence of C4 photosynthesis in the Early Miocene (~21 Ma), long before the origin and diversification of hominins, and during a period of relative global climatic stability. Evidence of C4 proliferation and its impact on faunal behavior and ecosystem structure, however, is lacking from stable isotope records in mammalian tooth enamel, one of the most abundant and resilient archives of past diet and ecological change. We present novel and published enamel stable oxygen and carbon isotope records from 22 eastern African fossil assemblages; totaling 1252 specimens dating from 29 to 4 Ma. Oxygen isotope compositions indicate cooling and drying from the Oligocene into a hydrologically diverse Miocene, setting the stage for a shift to the consumption of C4 resources potentially as early as 13 Ma and in larger amounts beginning at 10 Ma. Faunal stable isotope variability within and between Early Miocene sites suggest that a C3-dominated eastern Africa nevertheless hosted varied hydrological regimes and animal behaviors across different sites. Taxa such as anthracotheres and giraffoids occupy consistently semi-aquatic or sub-canopy browsing niches. Primates, however, exhibit exceptional behavioral plasticity, with the large-bodied Early Miocene ape Afropithecus deriving most water from flowing surface sources at Buluk (Turkana Basin, Kenya) instead of from canopy vegetation as at other sites. The ecological and hydroclimate transformations from the Paleogene into the Neogene help explain how C3 landscapes became primed for Late Miocene C4 expansion and hosted behavioral diversity that shaped an emerging African savanna fauna, and the behavioral plasticity of our ancestors.

Turkana Miocene Project coauthors include: Eipa Aoron, Sneha Bapana, Catherine Beck, Paul Barrett, Mikael Fortelius, Craig Feibel, Aryeh Grossman, Greg Henkes, Ashley House, Francis Kirera, Martin Kirinya, Daeun Lee, Cynthia Liutkus-Pierce, Sam Lavin, Ellen R. Miller, Christopher Poulsen, Patricia Princehouse, John Rowan, Gabrielle Russo, William Sanders, Mae Saslaw, Ruth Tweedy, Linet Sankau, Natasha S. Vitek, and Indrė Žliobaitė.

How to cite: Green, D. and Uno, K. and the Turkana Miocene Project Coauthors: Late Cenozoic Eastern African Aridification, Vegetation Change, and Behavioral Diversity from Enamel Isotopes, EGU General Assembly 2025, Vienna, Austria, 27 Apr–2 May 2025, EGU25-21298, https://doi.org/10.5194/egusphere-egu25-21298, 2025.

EGU25-1067 | ECS | Orals | SSP3.8

Multiproxy evaluation of the Paleohydrology of the Sakarya River during the Last Milennium, NW Anatolia 

Hilal Okur, Mehmet Korhan Erturaç, Meltem Çelen, Eren Şahiner, Zeki Bora Ön, Sena Akçer Ön, Nesibe Köse, Hüseyin Tuncay Güner, Nurgül Karlıoğlu Kılıç, and Mehmet Salim Öncel

Paleohydrology studies are an emerging field of research linked to paleoclimatology and hazard estimation studies. Understanding the patterns of extreme events in the context of global change is of great importance, especially for regions where extreme events are an integral part of the hydrological regime, due to their social (e.g., vulnerability) and political (resilience and adaptation) implications. For many regions of the world where the instrumental record is very short and there are no historical records of hydrological events. These instrumental records can be extended by hundreds to thousands of years by reconstructing especially paleoflood events using fluvial archives.

We present the first detailed paleohydrology study in Anatolia. Our research focuses on the lower reaches of the Sakarya River at Adapazarı Basin, NW Anatolia, Türkiye. Here, the due unique tectonic setting controlled by the North Anatolian Fault, deposition of a 4.5-meter-thick fine-grained floodplain sediment since CE 1350 was possible. This timing constraint corresponds to the reign of the Ottoman Empire as well as to the Little Ice Age (LIA), an intermitted period(s) of cold and dry climate defined for the northern Europe. The characterization of past flow regimes of the river and the detailed identification of paleohydrology events within the studied section have been facilitated through a multidisciplinary and multi-proxy approach (grain size, mineralogy, geochemistry). All identified events have been precisely dated using age-depth model based on dendrochronology, radiocarbon, luminescence, and event-based dating techniques.

The focus sedimentary record revealed that the Sakarya River experienced distinct long-duration regular flow and drought episodes with intermittent flooding events for the last 600 years. Within this time frame, with intervals of uncertainty, three dry and three regular hydrological regimes have been identified from the year CE 1350 to 1950. Within these hydrological regimes, 9 periods of extreme drought and 10 flood events have been identified. These episodes are closely comparable with the published local and regional paleo-climatic record.

How to cite: Okur, H., Erturaç, M. K., Çelen, M., Şahiner, E., Ön, Z. B., Akçer Ön, S., Köse, N., Güner, H. T., Karlıoğlu Kılıç, N., and Öncel, M. S.: Multiproxy evaluation of the Paleohydrology of the Sakarya River during the Last Milennium, NW Anatolia, EGU General Assembly 2025, Vienna, Austria, 27 Apr–2 May 2025, EGU25-1067, https://doi.org/10.5194/egusphere-egu25-1067, 2025.

EGU25-1438 | Posters on site | SSP3.8

Climatic versus Anthropogenic Influences on Sediment Delivery to the Gulf of Mexico Marginal Sea since 5000 y BP 

Peter Clift, Bailey Wycoff, Andrew Carter, Samuel Mũnoz, and Tammy Rittenouer

We present a compilation of provenance data derived from the lower reaches of the Mississippi river showing how the source of sediment supplied to the lower reaches has changed through time in the recent geologic past. We integrate data from a late Holocene point bar, its associated oxbow lake (False River) and the channel plug that infilled since ~500 y BP, as well as another oxbow located upstream at Lake St John. Another finer grained sediment record was derived from coring close to the Mississippi south of New Orleans. The sediments were analysed for an array of major elements, Sr and Nd isotopes, as well as detrital zircon U-Pb geochronology. Grain size is a critical factor in controlling the provenance because suspended sediment is transported rapidly through the river compared to coarse-grained material which travels more slowly as bedload. The radiogenic isotope signature of the fine-grained sediment shows a long-term shift since 4.5 ka towards more radiogenic signatures indicative of more erosion from ancient continental crust, likely the Appalachians and Mid Continent rather than the Rocky Mountain foreland, although this remains the dominant source of material supplied to the Gulf of Mexico. While some of this shift may be anthropogenic, the trend suggests long-term drying of the continental interior and reduced erosion of the foreland. Nonetheless, sand-silt sized zircon U-Pb ages indicate that between 1600 and ~1920 CE flood sediments were dominated by supply from the Missouri River, which is largely sourced from the Rocky Mountain foreland. From 500 BCE until 1600 CE supply was more skewed to the Upper Mississippi and Red River, and with some input from the Arkansas River, also derived from the west. Coarse grained sediments deposited in the lower reaches during the last 10 years show a high degree of variability which we interpret to reflect reduced sediment buffering driven by the inability of the lower reaches to meander and recycle flood sediments in the way expected prior to the installation of levees. The modern tributaries all carry sediment that is much more altered than was true in the recent geological past and reflects heightened soil erosion driven by agriculture. The modern Mississippi is a poor analogue for the natural state of the river when compared to ancient geological deposits.

How to cite: Clift, P., Wycoff, B., Carter, A., Mũnoz, S., and Rittenouer, T.: Climatic versus Anthropogenic Influences on Sediment Delivery to the Gulf of Mexico Marginal Sea since 5000 y BP, EGU General Assembly 2025, Vienna, Austria, 27 Apr–2 May 2025, EGU25-1438, https://doi.org/10.5194/egusphere-egu25-1438, 2025.

EGU25-1688 | ECS | Posters on site | SSP3.8

Sedimentary and diagenetic processes at the origin of the 3D architecture of heterogeneous lacustrine and palustrine limestones. 

Thibaut Jamey, Simon Andrieu, Céline Mallet, Gautier Laurent, Eglantine Husson, and Mohamed Azaroual

Lacustrine and palustrine carbonates form in lakes and swamps of various shapes and sizes. They can accumulate through chemical or biological processes and are constantly under the influence of external alteration sources such as meteoric waters, vegetation or fauna. Thus, there are the result of a complex primary fabric later modified by early and late diagenesis processes which makes them highly heterogeneous.

Their study is mainly motivated by their ability to act as a reservoir for underground water or for Carbon Capture & Storage (CCS), which both require a precise understanding of their structure and variability of permeable bodies.

The 3D architecture and the scale of heterogeneity of such carbonates remains a question as depositional and alteration processes can occur on centimetre scales or less (e.g., roots), to metre and kilometre scale (e.g., subaerial exposure). This variability cannot be assessed without any large, pluri-directional outcrop or without a high density of cored boreholes.

The O-ZNS platform (“Observatoire des transferts dans la Zone Non-Saturée”) located near Orleans, France, is an observatory of the vadose zone of the Beauce aquifer. The host rocks are aquitanian lacustrine and palustrine limestones (the Beauce Limestones formation).

The observatory offers an exceptional 20 m deep and 6 m diameter well surrounded by eight cored boreholes (20-25 m deep) within a radius of 30 m, which were described at a centimetric scale (1:6).

Our study focuses on the control of the 3D architecture of the sedimentary facies by understanding the chronology of the successive depositional environments. Also, it aims to consider the diagenetic overprint of the Beauce Limestones to decipher what is the impact of the primary fabric on secondary processes that finally lead to the heterogeneities we observe today.

This contribution will present: (1) How the 16 sedimentary facies distributed in 4 depositional environments (lake, lake margins, external palustrine, internal palustrine) vary at a decametric scale, (2) the paleo-environmental evolution of the site, located at the transition between lacustrine and palustrine settings, built thanks to the correlation of 8 transgressive-regressive cycles, and (3) the link between sedimentary facies, diagenesis and petrophysical properties (porosity, permeability).

How to cite: Jamey, T., Andrieu, S., Mallet, C., Laurent, G., Husson, E., and Azaroual, M.: Sedimentary and diagenetic processes at the origin of the 3D architecture of heterogeneous lacustrine and palustrine limestones., EGU General Assembly 2025, Vienna, Austria, 27 Apr–2 May 2025, EGU25-1688, https://doi.org/10.5194/egusphere-egu25-1688, 2025.

International Ocean Discovery Program (IODP) Site U1417, located in the Surveyor Fan (Gulf of Alaska), preserves hemi-pelagic sediments influenced by glacial and fluvi­al depositional processes from the Cordilleran Ice Sheet in the Chugach–St. Elias Mountains and Coastal Mountains. A total of 441 samples from the late Miocene to early Pleistocene were used to measure the biogenic opal content and calculate its flux to trace the degree of diatom productivity in surface water and depositional history. In general, the biogenic opal content confirms the division of the lithostratigraphic units and subunits: diatom-bearing clay-rich intervals versus clast-rich terrigenous intervals. Despite large fluctuations from the late Miocene to early Pleistocene, the variation of biogenic opal content and deposition of biogenic opal flux might have been controlled by global climate change, such as the high levels during the Late Miocene Biogenic Bloom (LMBB) and mid-Pliocene Warmth (MPW) and its abrupt decline at the Northern Hemisphere Glaciation (NHG). These variations of surface water productivity may be attributed to the basin-to-basin redistribution of nutrients by global thermohaline circulation and the related Pacific Ocean ventilation in response to global climate change.

How to cite: Khim, B.-K., Kim, S., and Asahi, H.: Biogenic opal deposition in the Surveyor Fan (IODP Site U1417) of the North Pacific during the late Miocene to early Pleistocene, EGU General Assembly 2025, Vienna, Austria, 27 Apr–2 May 2025, EGU25-1739, https://doi.org/10.5194/egusphere-egu25-1739, 2025.

East Asian summer monsoon (EASM) played key role in controlling the hydroclimate of East Asia continent regions. However, the Late Holocene changes of EASM in its northern margins are still unclear, which urgently needs to be revealed in the field of climate research. Here we systematically analyze the grain size of peat ash from core ZB-7 in the Zhibian peatland and core DFHN-2 in the Dongfanghongnan peatland to address this issue. Results show that the silt fraction occupies the most component of peat ash in cores ZB-7 and DFHN-2. The grain size distribution curves of peat ash of two cores display single peak pattern. The probability cumulative curves of two cores exhibit as two-sections mode. Three end-members (EMs) displaying single peak are identified in cores ZB-7 and DFHN-2. The EM2 of core ZB-7 and EM1 of core DFHN-2 represent the contributions of surface runoff. The EM2 of core ZB-7 demonstrates a series of periodicities, such as 1000a, 500a, 210a, 110a, 88a and 66a during the Late Holocene. The correlation relationship analyses indicate that the EM2 of core ZB-7 and total solar insolation (TSI) show opposite phase with El Niño-Southern Oscillation (ENSO) activities. Furthermore, five evolutionary stages of the EASM in northern margins were identified. Less ENSO activities and declined TSI regulated the decreased precipitation during stage 1 (4338-3479 cal. yr BP). The frequent ENSO activities and declined TSI induced low precipitation in stage 2 (3479-2297 cal. yr BP). In stage 3 (2297-949 cal. yr BP), the continuously decreasing ENSO activities resulted in high precipitation. Frequent ENSO activities and low TSI induced low precipitation during stage 4 (949-231 cal. yr BP). While the increase in TSI and decrease in ENSO activities regulated increased precipitation during stage 5 (231 cal. yr BP-Present). This study would expand our predictions on the future hydroclimate changes in monsoon northern margins.

How to cite: Zhang, M.: Late Holocene variations and driving mechanisms of the East Asian summer monsoon in northern margins: Evidence from peat ash grain size, EGU General Assembly 2025, Vienna, Austria, 27 Apr–2 May 2025, EGU25-2109, https://doi.org/10.5194/egusphere-egu25-2109, 2025.

EGU25-2703 | ECS | Orals | SSP3.8

Bedding-parallel fibrous calcite veins in Permian carbonate, central Thailand 

Tindikorn Kanta and Piyaphong Chenrai

Bedding-parallel fibrous calcite veins (BPCVs) are prevalent in sedimentary basins and typically formed in petroleum source rock. This study examines the development of BPCVs in the Permian carbonate of the Khao Khwang Formation in central Thailand using petrographic, geochemical, and isotopic investigations, as well as total organic carbon (TOC) evaluation. Five rock specimens, comprising ten veins and five host rocks, were examined. The findings indicate that BPCVs display cone-in-cone and beef structures, categorizing them as unitaxial veins. The geochemical analyses and stable isotope compositions indicate that local fluid sources derived from inorganic carbonates and diagenetic formation fluids in the microbial methanogenic zone. Oxygen isotope analysis indicates that vein development occurred at late diagenetic stage. In situ U-Pb dating reveals that fibrous calcite veins originated from the Early to Middle Permian. The development of BPCVs linked to petroleum source rock provides critical insights into the history of fluids and petroleum generation within sedimentary basins.

How to cite: Kanta, T. and Chenrai, P.: Bedding-parallel fibrous calcite veins in Permian carbonate, central Thailand, EGU General Assembly 2025, Vienna, Austria, 27 Apr–2 May 2025, EGU25-2703, https://doi.org/10.5194/egusphere-egu25-2703, 2025.

EGU25-4791 | ECS | Posters on site | SSP3.8

Modern Sedimentary Mechanisms and Evolution of Extreme Event Layers Offshore Southwestern Taiwan 

Bo-Hong Wang and Chih-Chieh Su

Taiwan is located in the western Pacific typhoon corridor and the Pacific Ring of Fire, where typhoons and earthquakes frequently happen, making submarine geohazards prone to occur. As the second longest river in Taiwan, the annual sediment load of the Gaoping River averages approximately 35.61 million tons, making it the dominant contributor of terrestrial sediments offshore southwestern Taiwan. Su et al. (2018) pointed out that the sedimentation rate in most areas offshore southwestern Taiwan is less than 0.5 cm/year, and the upper continental slope in the northern part is relatively more stable compared to the southern part. Natural disasters significantly influence sediment distribution and sedimentation processes off the southwestern Taiwan. In 2005, Typhoon Haitang caused heavy rainfall, leading to the rapid transport of large amounts of suspended materials from the Gaoping River to the offshore area of southwestern Taiwan. Based on the radionuclides data published by Huh et al. (2009), a distinct Typhoon Haitang event layer can be observed, and the high-activity layer associated with the 1963 global fallout can also be identified. In this study, we intend to integrate the findings of Huh et al. (2009) regarding the application of radionuclides with 13 box core samples collected in 2023 from the same locations (the shelf and slope areas on the northern and southern sides of the Gaoping Canyon). We aim to utilize the multi-tracer approach and grain size distribution to assess modern sedimentary event records, sediment transport pathways, and potential disaster risks offshore southwestern Taiwan. Additionally, we plan to analyze the correlation of sedimentary sequences across different coring sites, as well as their temporal variations in sedimentary records at the same site. The current results indicate a positive correlation between sediment porosity and water depth. Grain size analysis shows that the median grain size and sorting decrease as water depth increases. The higher sand content observed on the northern shelf is due to northward coastal currents and overflow effects at the canyon head. Future research will focus on investigating hydrodynamic differences across various layers to better understand sedimentary dynamics over the past two decades. This study will further examine how bioturbation affects radioactive dating results, which will help to establish a more accurate chronological model for sedimentary records.


References

Chih-An Huh, Hui-Ling Lin, Saulwood Lin, Ya-Wen Huang, Modern     accumulation rates and a budget of sediment off the Gaoping (Kaoping) River, SW Taiwan: A tidal and flood dominated depositional environment around a submarine canyon, Journal of Marine Systems, Volume 76, Issue 4, 2009, Pages 405-416, ISSN 0924-7963, https://doi.org/10.1016/j.jmarsys.2007.07.009

Su, C.-C., S.-T. Hsu, H.-H. Hsu, J.-Y. Lin, and J.-J. Dong, 2018: Sedimentological characteristics and seafloor failure offshore SW Taiwan. Terr. Atmos. Ocean. Sci., 29, 65-76, doi: 10.3319/TAO.2017.06.21.01

How to cite: Wang, B.-H. and Su, C.-C.: Modern Sedimentary Mechanisms and Evolution of Extreme Event Layers Offshore Southwestern Taiwan, EGU General Assembly 2025, Vienna, Austria, 27 Apr–2 May 2025, EGU25-4791, https://doi.org/10.5194/egusphere-egu25-4791, 2025.

EGU25-5284 | ECS | Posters on site | SSP3.8

Study on the long-term shoreline extraction and analysis method on the east coast of Korea using Python toolkit 

Ho-Jun Yoo, Tae-Soon Kang, Dong-Soo Hur, and Sung-Soon Yoon

  In recent years, with the development of computer vision analysis and the free release of satellite images, it has become possible to observe and evaluate coastal and shoreline changes through satellite images. However, the shorelines obtained by satellite detection are instantaneous at the time of satellite capture, and some correction processes are required to validate them with actual monitoring data and ensure their reliability.

  In this study, Landsat and Sentinel-2 satellite images, along with a Python toolkit, were used to analyze shoreline data over a 40-year period on the east coast of Korea. Validation was performed using national research monitoring data collected bi-quarterly over approximately 10 years for 9 sites. Data containing changes greater than the standard deviation and errors in the data itself were removed from the shoreline results. The accuracy of the shoreline data was corrected by comparing it with monitoring data and reflecting the conditions of offshore external forces.

  All of the shoreline changes over the past 40 years have shown a relatively stable change of less than 3m per year. However, there has been rapid continuous change over the past 10 years. This is likely due to recent coastal development, including direct and indirect impacts from artificial structures, nourishment effects, and natural erosion.

  Continuous collection and analysis of shoreline change data are necessary to ensure the stability and management of coastal buffer zones, including coastal hinterlands and sandy beaches, long-term equilibrium, and continuous shoreline changes caused by extreme typhoons, human impacts, and changes in artificial structures. Ensuring coastal resilience and stability through satellite data and analysis methods is crucial. We plan to detect continuous shoreline changes on both the east and west coasts of Korea. Furthermore, research will be needed on digital twin-based data display to ensure convenience for stakeholders and respond effectively to coastal erosion.

How to cite: Yoo, H.-J., Kang, T.-S., Hur, D.-S., and Yoon, S.-S.: Study on the long-term shoreline extraction and analysis method on the east coast of Korea using Python toolkit, EGU General Assembly 2025, Vienna, Austria, 27 Apr–2 May 2025, EGU25-5284, https://doi.org/10.5194/egusphere-egu25-5284, 2025.

       The Dangerous Grounds, located along the southern margin of the South China Sea, has undergone substantial tectonic and paleogeographic changes during the Cenozoic, spanning three distinct evolutionary stages: continental rifting, breakup from South China and southward drift, and collision with Borneo. This study utilized a robust dataset comprising 67 seismic reflection profiles, complemented by drilling and dredging data, to quantitatively reconstruct the sedimentary filling history of the Dangerous Grounds. By correlating sediment budget outcomes with the spatial distribution characteristics of sediment thickness, we have gained valuable insights into the region’ s geological evolution.

       Our findings reveal a progressive increase in sediment budgets across the three tectonic stages, despite relatively stable sediment budgets during the southward drift stage associated with seafloor spreading. Spatial analysis of sediment distribution, as revealed by sediment isopath maps, shows a continued decrease in the north and expansion in the south and west, suggesting the influence of regional tectonic transitions and variations in paleogeographic environment. By integrating the temporal and spatial distribution of depocenters with drilling results and sediment provenance geochemical analyses, we provides a comprehensive regional perspective on the factors controlling sediment budget trends, including regional tectonic transitions, variations in paleogeographic environment (such as climate, sea level, and sedimentary facies, and the evolution of local river systems).

       The sedimentary inputs to the Dangerous Grounds have shifted over time, with Paleocene-Eocene sediments primarily originating from the north. From the Oligocene to the Early Miocene, northern sediment supply progressively declined, while inputs from the southwest, transported through river systems originating in the Indochina and Malay Peninsulas, gradually increased. Since the Mid-Miocene, the collision with Borneo has led to enhanced sediment supply from the south, with sediments predominantly accumulating along slope edges, channel outlets, and within the Nansha Trough.

How to cite: Wang, F. and Ding, W.: Impacts of Tectonic-Paleogeographic Transitions on Cenozoic Sedimentary Distribution in the Dangerous Grounds, South China Sea, EGU General Assembly 2025, Vienna, Austria, 27 Apr–2 May 2025, EGU25-5567, https://doi.org/10.5194/egusphere-egu25-5567, 2025.

Grain-size of clastic sediment is generally considered to be the result mainly of physical processes active during transport and deposition (e.g. grain-size sorting by dimension/density, sediment by-pass); less importance is generally given to other factors, such as the parent rock lithology. In this work, we investigate the control exerted by the parent rock lithology on the grain-size of daughter sediments. Our approach combines fieldwork-based sediment characterization (in-situ grain-size measurements and petrographic analysis of pebbles > 2 cm), laboratory analyses (sieving, measurement and petrographic point counting at the microscope on grains < 2 cm) and geospatial statistics of the source area.

To do so, we selected as study site a sandy-gravelly bar of the Avisio River, located in Valle di Fassa (Dolomites, Italy) which is sourced by a relatively small catchment area made by very different parent rocks. This allows us to disregard the effect of sediment transport from the source to the sampled depositional site, i.e. to consider the analysed samples representative of the sediment produced at the source by the studied catchment. The lithologies exposed in the catchment area are mainly represented by (i) dolostones, (ii) mafic to intermediate volcanics and (iii) limestones and sandstones, which all outcrop in similar proportions. From the fluvial bar, we collected sand and gravel samples analysing their dimensional (pebble measurements and grain-sizes sieving) and compositional properties (rock identification and sedimentary petrography). We analysed both the overall grain-size and composition of the collected samples and the composition of each grain-size fraction between 16 cm and 0.075 mm contained in each sample. Moreover, we performed a GIS-based geospatial analysis of the sediments source area to quantify the rock type distribution and have the true geology of the source region to be compared with its image provided by its daughter sediments.

Our results show a significant relationship between grain-size and sediment composition: gravels are mainly made by dolostone pebbles, while sands are mainly composed of volcanic grains. This trend persists across the separated grain-size portions: sediment fractions > 1 mm are richer in dolostone grains, while sediments fractions < 1 mm are richer in volcanic grains, and proves that dolostone and volcanic rocks feed at the source daughter sediments with dramatically different grain-size curves. Moreover, none of the samples shows the same proportion of the compositional distribution derived from the GIS-based geospatial analysis (i.e., similar proportion between the three lithologies considered).

These findings indicate that since their origin, sediment grain-size is strongly controlled by different weathering effects on the diverse parent rocks and therefore distinct grain-sizes provide very different geologic scenarios for the same source rock geology. This, while often overlooked, significantly impact provenance studies aimed to paleo-geologic reconstructions and must be also carefully considered in facies tract models, challenging the assumption that grain-size variations along depositional systems are solely due to physical processes acting on sediments having at the origin a simple grain-size distribution.

How to cite: Pezzoli, S., Menegoni, N., and Di Giulio, A.: Parent rocks control on grain-size of daughter sediments and implications for provenance studies: insights from the Avisio River (Dolomites, Italy), EGU General Assembly 2025, Vienna, Austria, 27 Apr–2 May 2025, EGU25-6440, https://doi.org/10.5194/egusphere-egu25-6440, 2025.

EGU25-6880 | Orals | SSP3.8

Ayeyarwady-Thanlwin Rivers Shelf Sediment Dispersal: A High-Discharge Tidally-Dominated Monsoon-Influenced Tectonically-Active Setting 

Steven Kuehl, Evan Flynn, Day Wa Aung, Ko Yi Hla, and Courtney Harris

The Ayeyarwady-Thanlwin rank among the world’s top three river systems in terms of sediment load, and discharge into the energetic shelf environment of the Northern Andaman Sea.  The fate of this material has been investigated through a range of interdisciplinary studies since a 2017 field campaign to the present, and here we synthesize the resulting findings based on a combination of sedimentological, geochemical and oceanographic insights.  With no dams along the mainstems, this system has remained in a relatively steady-state condition during the past century, despite increasing human pressure, primarily from land-use changes and river sand mining. Tectonic setting plays a first-order control on the fate of the rivers’ sediment, with the formation of a mid-shelf pull-apart basin, the Martaban Depression, that serves as the major depocenter for this system.  Oceanographic conditions conspire to feed the rivers’ sediment into the Depression through the action of tides, waves and monsoon-driven circulation.  Extreme tides up to 7 m in amplitude keep sediment in suspension in an extensive shallow embayment, the Gulf of Martaban, before this material is released to the offshore Depression, likely because of some combination of spring-neap excursions, near-bed turbidity flows, or rapid offshore transport during cyclones.  Monsoon winds drive circulation toward the east during the SW Monsoon, coincident with the period of highest river discharge, further focusing sediment discharged from the numerous western Ayeyarwady distributaries into the Gulf.  Modeling results suggest surface and bottom net transport toward the Gulf may occur throughout the year.

Seabed geochemistry contributes much toward our understanding of shelf circulation and sediment dispersal patterns, and the preservation of the immense sediment-associated terrestrial organic carbon discharged by the rivers.  Core-scanning XRF elemental ratios show pronounced east-west trends that are attributed to three distinct sources: the Ayeyarwady, Thanlwin, and small rivers draining the Indo-Burman Range (IBR).  Distinct geochemical signatures on the shelf fronting the IBR suggest that sediment dispersal from the Ayeyarwady-Thanlwin is largely constrained to the Andaman Sea shelf. Downcore profiles of stable carbon isotopes from the Northern Andaman Sea show remarkably uniform values during the past century, suggesting that land-use changes evident in the catchment, especially during the past 50 years, are not preserved in the offshore record.  We suggest that extensive tidal reworking in the Gulf efficiently mutes such signals in the downcore record. Organic carbon studies further suggest that very little remineralization of terrestrial organic matter occurs during transport from the Gulf to the Depression, despite reworking and consequent oxidation in the Gulf.  Based on geochemical budgets of particle-reactive radionuclides scavenged from seawater, we estimate that significant onshore flow of open ocean water must occur, along with the substantial input of marine organic matter.  The absence of an observed “sediment priming” effect reflets the recalcitrant nature of this carbon pool.  The Ayeyarwady-Thanlwin system represents an end member within the family of such systems, and underscores the role of tectonic and oceanographic conditions in determining sediment dispersal and accumulation patterns in the marine environment.

How to cite: Kuehl, S., Flynn, E., Wa Aung, D., Yi Hla, K., and Harris, C.: Ayeyarwady-Thanlwin Rivers Shelf Sediment Dispersal: A High-Discharge Tidally-Dominated Monsoon-Influenced Tectonically-Active Setting, EGU General Assembly 2025, Vienna, Austria, 27 Apr–2 May 2025, EGU25-6880, https://doi.org/10.5194/egusphere-egu25-6880, 2025.

EGU25-7363 | Orals | SSP3.8

Continental input and its relationship with biological sedimentary constituents over the MIS 6 to MIS 1 in the SW Gulf of Mexico 

Elsa Arellano-Torres, Sandra M. Villafuerte-Bazaldua, Priyadarsi Roy, and Juan José Kasper-Zubillaga

To unveil the relationship between reconstructed paleoclimatic and paleoceanographic changes based on geochemical proxies, we analyzed the marine sediment Core RC10-265PC retrieved from the Gulf of Mexico (GoM). The core spans the interval from Marine Isotope Stage (MIS)-6 to MIS-1 at a glacial to interglacial scale resolution. We studied the relationship between changes in biogenic constituents as proxies of primary productivity and those in continental terrigenous contributions as a source of micronutrients. The core constituents were identified and described by determining carbon content, the elemental concentration by X-ray fluorescence (XRF), and the mineral phases by X-ray diffraction (XRD). The biological constituents include total organic carbon (TOC) and calcium carbonate (CaCO3), whereas terrigenous constituents mainly include the major elements Si, Fe, K, Al, and Ti. In the core, we observed four ash deposits with high Si, K, and Zr concentrations but low in Al, Fe and Ca. Although they were a few cm thick, they did not contribute to increasing primary production. The XRD analysis in the bulk sediments shows that the most abundant mineral phases are calcite, phyllosilicates, quartz, feldspar, and pyroxene. Overall, increases in terrigenous components occurred during the early MIS-6, from MIS-5e to MIS-2, and during MIS-1. In parallel, a decrease in CaCO3 occurred, sometimes coincident with TOC increases. The former suggests a dilution of calcareous by terrigenous components that possibly arrived at the basin by riverine inputs. Such an input increase is not in tune with the latitudinal displacement of the Intertropical Convergence Zone nor with orbital periodicities. However, neighbouring evidence suggests moisture and runoff increase at the regional level, revealing that the oligotrophic oceanographic conditions in the GoM have remained for approximately 180 ka. Such findings expose several ecological implications if eutrophic conditions emerge under modern climate change.

How to cite: Arellano-Torres, E., Villafuerte-Bazaldua, S. M., Roy, P., and Kasper-Zubillaga, J. J.: Continental input and its relationship with biological sedimentary constituents over the MIS 6 to MIS 1 in the SW Gulf of Mexico, EGU General Assembly 2025, Vienna, Austria, 27 Apr–2 May 2025, EGU25-7363, https://doi.org/10.5194/egusphere-egu25-7363, 2025.

The Ayeyarwady and Thanlwin Rivers deliver ~485 Mt of sediment/year to the northern Andaman Sea. The Ayeyarwady river mouths empty via the Ayeyarwady Delta, while the Thanlwin empties into the Gulf of Martaban located east of the delta. The Gulf of Martaban is a macrotidal, shallow embayment, and the abundant sediment supply and tidal energy make it one the world’s largest perennially turbid zones. Seasonal monsoons bring high precipitation during summer when winds are energetic and from the southwest (SW), and dry during winter when winds are moderate and from the northeast (NE). Surface circulation implies that sediment would be trapped in the northern Andaman Sea during SW monsoon and exported to the Bay of Bengal during the NE monsoon. A clinoform depocenter has been found seaward of the Gulf, and a second depocenter on the northwest side of the delta in the Bay of Bengal. The phasing and timing of sediment delivery to these depocenters has relevance for sediment budget, event preservation, and carbon cycling, however, the sediment delivery mechanisms to these depocenters remain a question.

To address this, a coupled hydrodynamic and sediment transport numerical model was used to quantify suspended sediment dispersal offshore of the Ayeyarwady delta and within the Gulf of Martaban. Based on the Regional Ocean Modeling System (ROMS), it accounted for suspended sediment fluxes and used SWAN (Shallow Waves Nearshore) for waves. Open boundary and atmospheric conditions were derived from available global model products to account for larger scale ocean conditions and winds. The model has been run using different versions of initial sediment bed grain size distributions, based on either simple assumptions or historical and recent grain size observations. The magnitude of suspended sediment flux shows sensitivity to the initial grain size distribution, but the overall seasonal and tidal trends are less sensitive.

Model applications to date have focused on quantifying the variability of suspended sediment flux over tidal and seasonal timescales. The model has been run for two one-month cases: one each representative of the winter and the summer monsoon. Results indicated that offshore of the delta, surface currents flowed eastward during the summer monsoon and westward during the winter monsoon. The bottom currents offshore of the delta, however, showed less dependence on seasonal signals and were westward on average for both the summer and winter model runs. Within the macrotidal Gulf of Martaban, turbidity was maintained by asymmetric tidal trapping. Sediment export from the Gulf primarily directed toward the Martaban Depression Clinoform, with very little sediment delivered westward to the Bay of Bengal.  Sediment export was larger during the summer than the winter monsoon, and especially high during spring tides that extended the turbid area to the vicinity of the clinoform.  

How to cite: Harris, C. and Du, Z.: Seasonal and tidal variability in suspended sediment dispersal offshore of the Ayeyarwady delta, Myanmar: results from a numerical model, EGU General Assembly 2025, Vienna, Austria, 27 Apr–2 May 2025, EGU25-7518, https://doi.org/10.5194/egusphere-egu25-7518, 2025.

EGU25-7649 | Orals | SSP3.8

Sediment source to sink process and controlling mechanism from the Bengal Bay to the East Siberian Sea of Asian continental margin  

Xuefa Shi, Shuqing Qiao, Shengfa Liu, Jianjun Zou, Yanguang Liu, Zhengquan Yao, Kunshan Wang, Limin Hu, and Jingrui Li

The Asian continental margin is located at the convergence and collision boundary of the Eurasian, Pacific and Indo-Australian plates, and is subjected to the strongest land-sea interactions and the most frequent exchanges of material and energy. The rivers in the Asian continental margin contributes about two-thirds of the global sediments from rivers to the ocean, which has a great impact on the sedimentation, biogeochemical processes and marine ecology of the marginal seas and the global oceans. Through international cooperation, we have studied the sediment source to sink system and paleoenvironment in the Asian continental margin from the East Siberian shelf in the north to the Bay of Bengal in the south. We compiled a serial of sediment type map with different scales of the Asian continental margin, and elaborated the distribution pattern of the sediments; We established a set of effective provenance tracing index system to elucidate the properties of fluvial sediments, identified the sediments provenance in Bay of Bengal, east China seas, Sea of Japan, and East Siberian Sea, described the transport and deposition processes of the fluvial sediment in the sea, and established the sedimentation model for the key areas; The source, input mode and burial of organic carbon on the shelf at different latitudes and their response to natural processes and human activities have been quantitatively evaluated; The controlling mechanism of sediment source-sink process impacted by the Asian monsoon, sea level change, uplift of Tibetan Plateau, sea current and sea ice variations has been revealed.

How to cite: Shi, X., Qiao, S., Liu, S., Zou, J., Liu, Y., Yao, Z., Wang, K., Hu, L., and Li, J.: Sediment source to sink process and controlling mechanism from the Bengal Bay to the East Siberian Sea of Asian continental margin , EGU General Assembly 2025, Vienna, Austria, 27 Apr–2 May 2025, EGU25-7649, https://doi.org/10.5194/egusphere-egu25-7649, 2025.

EGU25-8410 | ECS | Orals | SSP3.8 | Highlight

Sedimentary Signatures of Typhoon: Insight from Core Record in the South China Sea 

Yu-Huang Chen, Chih-Chieh Su, Pai-Sen Yu, Tai-Wei Hsu, Sheng-Ting Hsu, Hsing-Chien Juan, and Yuan-Pin Chang

Sedimentary records of event deposits are crucial for regional natural disaster risk assessments and hazard history reconstructions. This study aims to identify deep-sea typhoon deposits through immediate post-event sampling following super typhoon Haiyan (2013) and typhoon Morakot (2009). After super typhoon Haiyan passed through the South China Sea in 2013, five gravity cores were collected along the typhoon path in the southern South China Sea Basin (>3800 mbsl). The results showed that Super Typhoon Haiyan deposits with clear graded bedding are preserved at the top of all cores. The thickness of the typhoon layers ranges from 20 to 240 cm and is related to changes in typhoon intensity. The lack of river-connected submarine canyon systems limited the transportation of terrestrial sediments from land to sea. Super Typhoon Haiyan-induced large surface waves played an important role in carrying suspended sediment from the Philippines. A distinctive feature is that Mn-rich layers were found at the bottom of the typhoon layers, potentially linked to the soil and rock composition of the Palawan region, which experienced tsunami-like storm surges caused by super typhoon Haiyan. Similar Mn-rich layer characteristics were also observed in the typhoon Morakot (2009) layer in the sediment cores from the lower reach of Gaoping submarine canyon. These Mn-rich layers may serve as a proxy for sediment export from large-scale extreme terrigenous events. This study provides the first sedimentary record of extreme typhoon events in the deep basin of South China Sea, which may shed light on reconstructing regional hazard history.

How to cite: Chen, Y.-H., Su, C.-C., Yu, P.-S., Hsu, T.-W., Hsu, S.-T., Juan, H.-C., and Chang, Y.-P.: Sedimentary Signatures of Typhoon: Insight from Core Record in the South China Sea, EGU General Assembly 2025, Vienna, Austria, 27 Apr–2 May 2025, EGU25-8410, https://doi.org/10.5194/egusphere-egu25-8410, 2025.

EGU25-8426 | ECS | Orals | SSP3.8

Relative influence of allogenic forcings on shallow-marine sedimentary archives, Taiwan Western Foreland Basin 

Amy I. Hsieh, Romain Vaucher, James A. MacEachern, Christian Zeeden, Chuqiao Huang, Andrew T. Lin, Ludvig Löwemark, and Shahin E. Dashtgard

An analysis of allogenic forcing on shallow-marine strata of the Miocene–Pliocene Kueichulin Formation in the Taiwan Western Foreland Basin shows that changes in the sedimentary record were predominantly driven by: 1) orogenesis and basin subsidence, 2) precession-driven changes in hydroclimate, and 3) obliquity-driven changes in atmospheric and ocean circulation.

The transition from a wave-dominated open shelf to a tide-dominated shallow-marine deltaic environment was influenced by a combination of basin subsidence and the denudation of Taiwan. The rapid deepening of the Western Foreland Basin near 5400 Ka and low sedimentation rates resulted in the formation of lower offshore to distal delta front environments, characterized by limited fluvial and storm influences. Shallow-marine deltaic environments formed as sediment from Taiwan filled the Western Foreland Basin, as a result of accelerated uplift after 4920 Ka, and rapid erosion of the orogen by tropical cyclone precipitation intensified. Tidal currents also intensified as the paleo-Taiwan Strait became shallower and narrower with continued uplift and southwest migration of Taiwan. The sedimentary record also shows a strong link between sedimentation and hydroclimate, driven by eccentricity-modulated precession. Tropical cyclone deposition corresponds to precession maxima, with amalgamated beds that form during periods of sea-level minima. Periods of high obliquity and associated changes in atmospheric and ocean circulation also resulted in a strengthening of tidal currents, recorded as a prevalence of tidal beds in the stratal record.

The findings of this study demonstrate the effectiveness of shallow-marine strata as a paleoenvironmental archive with the potential to resolve the influence of competing allogenic controls on sedimentary systems, which is crucial for understanding how depositional systems responded to climate change, tectonic activity, and sea-level fluctuations throughout Earth’s history.

How to cite: Hsieh, A. I., Vaucher, R., MacEachern, J. A., Zeeden, C., Huang, C., Lin, A. T., Löwemark, L., and Dashtgard, S. E.: Relative influence of allogenic forcings on shallow-marine sedimentary archives, Taiwan Western Foreland Basin, EGU General Assembly 2025, Vienna, Austria, 27 Apr–2 May 2025, EGU25-8426, https://doi.org/10.5194/egusphere-egu25-8426, 2025.

EGU25-8616 | ECS | Orals | SSP3.8

Controls on sedimentary deposits in the coastal environments of the Paris Basin at the Eocene-Oligocene transition. 

Mathilde Beernaert, Laurence Le Callonnec, Fabrice Minoletti, Hugues Bauer, Didier Merle, Jean-Paul Baut, and Bertrand Génault

The Eocene-Oligocene Transition (‘EOT’) marks a global deterioration in climate associated with the establishment of the Antarctic polar ice cap, but is poorly constrained in continental areas. In Europe, a marked seasonality and a major replacement of European flora and fauna by Asian species (the ‘Grande Coupure’ described by Stehlin, 1909) were recorded during this period. Deposits at the ocean-continent interface are recorded in the Paris Basin at the EOT, from the lagoon-marine to the lacustrine domains. Lithology and facies distribution are therefore controlled by mechanisms on a global and local scale (tectono and glacio-eustatism, climate, tectonic), which need to be differentiated and highlighted. We present a mineralogical, elemental and isotopic geochemistry record of three Upper Priabonian to Upper Rupelian sections located in the northern Paris basin (Cormeilles-en-Parisis, Le Pin-Villeparisis and Saint-Soupplets), near the Bray anticline. Cormeilles-en-Parisis, the westernmost, is located in the Saint-Denis synclinal and shows the most complete sedimentary sequence, more clayey and carbonaceous. It is fossiliferous but not very diverse. The Saint-Soupplets section, located on the eastern flank of the perianticlinal end of the Bray, shows the same sequence of formations as the Cormeilles-en-Parisis section, but is characterised by sandier deposits with current and erosive figures. The Le Pin-Villeparisis section, located on the western flank of the Bray anticline and between the two other sections, is truncated in its upper part and relatively condensed. It is essentially clayey and mostly barren of fossils.

In the Upper Priabonian, the sedimentary record shows a tectonic pulse at the origin of terrigenous inputs and the creation of positive topography, then the Late Eocene regression and the decrease of the tectonic activity inducing the progradation of continental deposits. In the Lower Rupelian, the long-term increase in detrital terrigenous deposits and the environmental changes suggested by floral and faunal data are probably due to the combination of tectonics and eustatism. To the west (Cormeilles-en-Parisis section), a few evaporitic levels show a lagoonal environment that is almost always submerged. To the east, the sections are incomplete (erosive levels and missing formations), influenced by the structure of the anticline, which forms a topographic barrier and a positive relief. The absence of certain formations and the presence of a clearly lacustrine formation at the top of the Le Pin-Villeparisis section show the proximity of the coastline, which is more prone to emersion when subjected to tectonic uplift. 


Reference: 

Stehlin, H., 1909. Remarque sur les faunules de mammifères des couches éocènes et oligocènes du Bassin de Paris. Bull. Société Géologique Fr. 19, 488–520.

How to cite: Beernaert, M., Le Callonnec, L., Minoletti, F., Bauer, H., Merle, D., Baut, J.-P., and Génault, B.: Controls on sedimentary deposits in the coastal environments of the Paris Basin at the Eocene-Oligocene transition., EGU General Assembly 2025, Vienna, Austria, 27 Apr–2 May 2025, EGU25-8616, https://doi.org/10.5194/egusphere-egu25-8616, 2025.

EGU25-9213 | Orals | SSP3.8

Interstitial soluble salts in Dead Sea lakes sediments as monitors of the East Mediterranean-Levant hydroclimate during the past ~ 100 kyr 

Mordechai Stein, Omri Khalifa, Pamela Schimmer, Amitai Katz, and Boaz Lazar

Temporal variations in the Na/Cl, Mg/Cl, Br/Cl, Br/Mg ratios of deep brines that filled the Dead Sea Basin during the past ~100 kyr were retrieved from soluble salts within the lake’s sediments. The soluble salts were extracted from cores drilled in the Dead Sea floor and sediments of the last glacial from the high margins of the Dead Sea. The variations in these elemental ratios (e.g., declining/rising Na/Cl ratios) reflect processes of halite precipitation/dissolution during arid/wet periods in the drainage basin, respectively, and exchanges between the epilimnion and hypolimnion brine. Ions of Na+ and Cl- were mainly supplied to the brines by the dissolution of the Mount Sedom salt diapir and halite deposits at the lake’s margins (e.g., halite which precipitated during arid periods of the last interglacial). The main observations are: (1) Between ~100-30 ka the deep lake’s hypolimnion evolved through a steady “enrichment” by Na+ and Cl- ions, due to continuous dissolution of marginal halite and/or from the Mt. Sedom salt diapir. Towards the end of this period, between ~43-30 ka, the Amiaz plain, a marginal basin, that comprised a semi-isolated water body, witnessed frequent episodes of halite precipitation/dissolution with temporal patterns that resemble millennial temperature (δ18O) variations in the Greenland ice core; (2) Between ~30-18 ka (MIS 2), when Lake Lisan reached its highest stands and maximum spatial expansion, the soluble salts indicate on frequent changes in the composition of the hypolimnion, reflecting centennial dissolution cycles of the Mt. Sedom salt diapir; (3) Between ~18-9 ka, when the lake declined to low levels, the variations in the elemental ratios reveal several episodes of enhanced supply of freshwater to the shrinking lake, causing massive halite dissolution and supply of Na+ and Cl- to the hypolimnion. The long-term (~100 kyr) pattern in the elemental ratios of the hypolimnion resembles global CO2 concentrations and sea temperature trends, while the short-term fluctuations in these ratios are correlated with short warm/cold cycles in the Greenland ice core δ18O data, indicating a strong impact of the global climate engines on the regional hydro-climate in long and short time scales.

How to cite: Stein, M., Khalifa, O., Schimmer, P., Katz, A., and Lazar, B.: Interstitial soluble salts in Dead Sea lakes sediments as monitors of the East Mediterranean-Levant hydroclimate during the past ~ 100 kyr, EGU General Assembly 2025, Vienna, Austria, 27 Apr–2 May 2025, EGU25-9213, https://doi.org/10.5194/egusphere-egu25-9213, 2025.

EGU25-9273 | ECS | Orals | SSP3.8

Elementome trajectories: a framework for studying ecosystem biogeochemical shifts in paleoenvironmental records. 

Javier de la Casa Sánchez, Josep Peñuelas, Miquel de Cáceres, Jordi Sardans, Sergi Pla-Rabés, Mario Benavente, Santiago Giralt, Armand Hernández, Pedro Raposeiro, Álvaro Castilla-Beltrán, Lea de Nascimento, and Sandra Nogué

X-ray fluorescence (XRF) and other advanced analytical techniques provide detailed information on geochemical composition in chronologically dated sedimentary sequences. These methods yield high-resolution data on elemental concentrations and ratios, enabling the reconstruction of past environmental conditions. In this contribution, we introduce a novel approach that uses multivariate analysis of all available biogeochemical and geochemical data (elementome) to characterize the trajectories of elemental composition over time and link them to drivers of environmental change. Our analysis of records from Atlantic islands, characterizing the magnitude, graduality and direction of biogeochemical shifts in paleoecological records from several archipelagos, shed light to a potential modern-time shift towards organic-dominated elementomes; and on the effect of human arrival and climate changes on the stability of ecosystem elementomes. Moving ahead, elementome trajectories hold promise as descriptive tools for paleoecology, but also in the interpretation of biogeochemical shifts at any timescale.

How to cite: de la Casa Sánchez, J., Peñuelas, J., de Cáceres, M., Sardans, J., Pla-Rabés, S., Benavente, M., Giralt, S., Hernández, A., Raposeiro, P., Castilla-Beltrán, Á., de Nascimento, L., and Nogué, S.: Elementome trajectories: a framework for studying ecosystem biogeochemical shifts in paleoenvironmental records., EGU General Assembly 2025, Vienna, Austria, 27 Apr–2 May 2025, EGU25-9273, https://doi.org/10.5194/egusphere-egu25-9273, 2025.

EGU25-9382 | ECS | Orals | SSP3.8

Sediment recycling in the South Pyrenean Foreland Basin: impact of grain size and source rock distribution on compositional signatures 

Marta Roigé, David Gómez-Gras, Xavier Coll, Daniel Stockli, Antonio Teixell, Salvador Boya, and Miquel Poyatos-Moré

Sedimentary provenance studies have long played a crucial role in elucidating source-to-sink processes across various tectonic settings throughout geological time. Foreland basins, in particular, record the erosional and exhumation history of their source areas, offering valuable insights into the chronology of deformation and the evolution of drainage areas. However, detrital signatures do not always fairly represent the composition of their drainage areas. Therefore, efforts are needed to better understand the factors controlling signal propagation from primary sources to ultimate sinks. The Jaca-Pamplona basin in the southern Pyrenees provides an excellent opportunity to explore the propagation and distribution of provenance signals in a setting with multiple source areas. We present combined data from detrital zircon U-Pb dating, sandstone petrography, and pebble point counting which allow us to infer the source area composition, its evolution, and the controls on provenance signal propagation. Our results indicate that alluvial fans had a source area composed of the North Pyrenean Zone and earlier, deep-marine synorogenic deposits, as evidenced by the overwhelming presence of recycled turbidite clasts. However, detrital zircon U-Pb age data from these alluvial fan deposits show a dominant Cadomian signature, while the turbidites exhibit a dominant Variscan signature, highlighting the complexity introduced by sediment recycling. We propose that the areal distribution of source rocks in the drainage area, transport distance, and differential weathering processes can explain this compositional effect. This is further supported by the clear grain-size dependence of the petrographic detrital modes, which show a positive correlation between grain size and the amount of recycled grains. Therefore, this study underscores the importance of integrating various provenance techniques to improve provenance reconstructions and to identify the intrinsic factors controlling the propagation and representativity of sediment sources.

How to cite: Roigé, M., Gómez-Gras, D., Coll, X., Stockli, D., Teixell, A., Boya, S., and Poyatos-Moré, M.: Sediment recycling in the South Pyrenean Foreland Basin: impact of grain size and source rock distribution on compositional signatures, EGU General Assembly 2025, Vienna, Austria, 27 Apr–2 May 2025, EGU25-9382, https://doi.org/10.5194/egusphere-egu25-9382, 2025.

EGU25-9822 | ECS | Posters on site | SSP3.8

A multi-proxy reconstruction of past erosion dynamics based on lake sediments from the northern Ecuadorian Andes 

Bjarne Heyer, Lisa Feist, Volker Karius, Agnieszka Halaś, Michal Słowiński, Liseth Pérez, Patricia Mothes, Elizabeth Velarde-Cruz, Alejandra Valdés-Uribe, Ana Mariscal Chávez, and Elisabeth Dietze

Lake sediments in mountain areas worldwide have been analysed to reconstruct erosion dynamics on local to regional scales. In the tropical Andes, an area of globally-relevant biodiversity hotspots and carbon sinks, long-term erosion patterns in response to climate and land use change are poorly known. In this study we examine the local erosion history as archived in a high-elevation (<3,700m asl) caldera lake north of Ecuador’s capital Quito. A multi-proxy approach was conducted on a 72 cm-long lake sediment core retrieved from Caricocha in the Mojanda Lake Region, including visual core description, X-ray fluorescence (XRF) core-scanning, magnetic susceptibility (MS), C/N and grain-size analyses. Two radiocarbon dates were combined with tephra-stratigraphy to derive a viable timeframe for sediment accumulation. Data obtained from XRF, MS, C/N and grain-size analyses were evaluated using multivariate statistical methods. Results from cluster and principal component analysis revealed at least 3 stratigraphic units alternating with at least 8 tephra layers. We will discuss a multi-proxy approach to identify different sedimentary environments, sources of material and underlying patterns in this volcanically active region. Including log-transformed element ratios of the XRF data we report on the challenges to disentangle proxies for past erosion dynamics from further palaeoenvironmental conditions, of relevance for future land use under climate change.

How to cite: Heyer, B., Feist, L., Karius, V., Halaś, A., Słowiński, M., Pérez, L., Mothes, P., Velarde-Cruz, E., Valdés-Uribe, A., Mariscal Chávez, A., and Dietze, E.: A multi-proxy reconstruction of past erosion dynamics based on lake sediments from the northern Ecuadorian Andes, EGU General Assembly 2025, Vienna, Austria, 27 Apr–2 May 2025, EGU25-9822, https://doi.org/10.5194/egusphere-egu25-9822, 2025.

EGU25-11379 | ECS | Posters on site | SSP3.8

Superposition and Intra-Stratal Bedding: Comparing the effects of different diagenetic models on stratigraphy. 

Theresa Nohl, Axel Munnecke, and V. Paul Wright

The principles of stratigraphy, rooted in the foundational works of Nicolaus Steno, William Smith, and Johannes Walther, assert that sedimentary layers are deposited sequentially and preserve a temporal and environmental record. While these principles have guided stratigraphic interpretation for centuries, carbonate successions challenge their straightforward application due to the impact of diagenetic processes. This was clear to earlier work on diagenetic bedding by e.g. Robin Bathurst or Werner Ricken, who discussed the implications for their models. More recent work on early diagenetic transformations, including dissolution, cementation, and differential compaction, can modify or completely obscure primary depositional features, resulting as well in a specific type of secondary “diagenetic bedding,” introducing intra-stratal lithological patterns that mimic primary bedding but are unrelated to depositional events.

Here we compare the mechanisms behind a variety of types of diagenetic bedding, with a focus on their implications for stratigraphy, paleoenvironmental reconstruction, and geochronology. We demonstrate how secondary features can disrupt traditional stratigraphic assumptions, obscure temporal resolution by combining distinct depositional layers into single beds or splitting original layers into multiple diagenetic units, and explore how differential preservation of aragonitic and calcitic components introduces spatial and temporal variability in fossil records, potentially disrupting correlations across stratigraphic sections. We summarise for the individual diagenetic models the key features to identify diagenetic bedding and the potential implications for stratigraphic applications.

How to cite: Nohl, T., Munnecke, A., and Wright, V. P.: Superposition and Intra-Stratal Bedding: Comparing the effects of different diagenetic models on stratigraphy., EGU General Assembly 2025, Vienna, Austria, 27 Apr–2 May 2025, EGU25-11379, https://doi.org/10.5194/egusphere-egu25-11379, 2025.

EGU25-11785 | Posters on site | SSP3.8

Facies modeling of Cenozoic successions in the Gunsan Basin using statistical methods 

Changyoon Lee and Sun Young Park

The Gunsan Basin is located between the eastern Chinese coast and the Korean Peninsula. The basin originated during the Cretaceous due to tectonic activity. After several rifting events, the final rift occurred during the Oligocene. Since the Miocene, the postrift phase has been ongoing to the present day. This study focuses on the interval of the final rifting event of the Cenozoic. The Gunsan Basin remains a frontier basin for hydrocarbon exploration, with only five wells drilled between 1975 and 1991. The study area is located in the eastern sag, known as the East Subbasin, approximately 26 km from the nearest well. Typically, more than 10 wells are needed near a reservoir to predict sand bodies effectively. In this study, we employed geostatistics to generate facies models. The Sequential Indicator Simulation (SIS), one of the stochastic methods, is particularly effective for modeling facies in areas with sparse well data. The pixel-based SIS approach is using trend maps, especially when lateral information is unavailable. These trend maps, derived from the RMS (Root Mean Square) attribute, are based on amplitude and help delineate facies. During the Miocene, the paleoenvironments in the depocenter and margin were lacustrine and littoral, respectively, and the lithology was interpreted as mudstone and sandstone. The transition from littoral to lacustrine environments is attributed to thermal subsidence. Through attribute analysis, we indirectly infer the rift system and the associated facies changes.

How to cite: Lee, C. and Park, S. Y.: Facies modeling of Cenozoic successions in the Gunsan Basin using statistical methods, EGU General Assembly 2025, Vienna, Austria, 27 Apr–2 May 2025, EGU25-11785, https://doi.org/10.5194/egusphere-egu25-11785, 2025.

EGU25-11902 | ECS | Orals | SSP3.8

Spatial and temporal evolution of tidal channels' submarine geomorphology in the northern Venice Lagoon, Italy 

Taha Lahami, Irene Guarneri, Daphnie Galvez, Antonio Petrizzo, Mariacristina Prampolini, Valentina Grande, Giorgio Castellan, Federica Rizzetto, Federica Foglini, and Fantina Madricardo

Tidal environments are highly dynamic systems whose evolution is shaped by a complex interplay of natural and anthropogenic factors. These systems respond to intricate hydrodynamic processes such as tidal asymmetry, sedimentation, and channel morphodynamics. These environments are characterised by the presence of tidal channels, which are critical for ecosystem functioning as they facilitate the exchange of water, sediments, and nutrients. Despite their importance, the spatial and temporal evolution of tidal channels remains insufficiently studied, particularly in terms of their morphological and sedimentological characteristics. Information on their evolution is particularly relevant in densely populated areas, where natural processes are closely connected with anthropogenic pressures.

This study aims to explore the tidal channel seafloor characteristics and spatiotemporal evolution focussing on a case study from the northern Venice Lagoon.

With this aim, high-resolution MultiBeam Echo-Sounder (MBES) bathymetry and backscatter data were acquired over an eight-year period, in 2013 and 2021. Ground truth sediment samples and seabed video footage were collected to characterize the substrate and validate the maps produced from the MBES acoustic data. Morphological features were analyzed in a GIS environment using bathymetric data.  The analysis identified both erosional and depositional features, finding depositional features dominating the study area. A seafloor sediment map was generated by classifying backscatter data using the unsupervised Jenks Natural Breaks algorithm. To assess changes over time, data from 2013 were compared to those gathered in 2021. Our findings suggest that deposition processes were predominant, with an overall net sediment accumulation of 542.7 · 10³ m³, strongly influenced by anthropogenic activity, related to the recent operation of mobile barriers at the lagoon inlets and salt marsh restauration efforts in the area.

In the context of rising mean sea levels and associated adaptation measures, this work not only enhances understanding of highly valuable and vulnerable transitional environments but also helps to assess the long-term impact of anthropogenic interventions.

Aknowledgements

This work was partially carried out within the Research Program Venezia 2021, with the contribution of the Provveditorato for the Public Works of Veneto, Trentino Alto Adige and Friuli Venezia Giulia, provided through the concessionary of State Consorzio Venezia Nuova and coordinated by CORILA. The authors acknowledge the facilities of the International Centre for Advanced Studies on River-Sea Systems DANUBIUS-RI (https://www.danubius-ri.eu/ ) in undertaking this research.

How to cite: Lahami, T., Guarneri, I., Galvez, D., Petrizzo, A., Prampolini, M., Grande, V., Castellan, G., Rizzetto, F., Foglini, F., and Madricardo, F.: Spatial and temporal evolution of tidal channels' submarine geomorphology in the northern Venice Lagoon, Italy, EGU General Assembly 2025, Vienna, Austria, 27 Apr–2 May 2025, EGU25-11902, https://doi.org/10.5194/egusphere-egu25-11902, 2025.

EGU25-11989 | ECS | Posters on site | SSP3.8

Tephrochronological analysis of the Plio-Pleistocene Chemeron Formation, Baringo Basin, Kenya: Refining stratigraphy and constraining chronology of vertebrate fossil sites 

Adeera Batlay, Catherine Beck, John Kingston, Emma Mbua, Matthew M. Skinner, Tracy Kivell, and Habiba Chirchir

Tephrochronology provides a stratigraphic approach to correlating geologic and paleoenvironmental events using volcanic ash layers. Stratigraphic correlation, especially over local and regional scales, plays a vital role in tracing the evolutionary trajectory of our hominin relatives across space and time in eastern Africa. The goal of this study is to employ tephrochronology to distinguish tephra layers within the Chemeron Formation at the site of Sinibo, Kenya. The Chemeron Formation is a sequence of Plio-Pleistocene sediments spanning the 5.3 to 1.6 Ma interval in the eastern foothills of the Tugen Hills — a fault block in the Baringo Basin of the Kenyan Rift Valley. This formation is an ideal site for the application of tephrochronology, as it comprises multiple tuff units interbedded with fluvial and lacustrine deposits that yield mammalian fossils, including hominins. In this project tephra layers from the Sinibo section are differentiated by analysing the geochemistry of volcanic glass shards from the tephra and establishing potential isochronous volcanic events in the stratigraphic record. Tephra samples analysed in this study were collected in the field and analysed for major element geochemistry using an Electron Microprobe. Distinct tephras were reconfirmed, including the Lokochot and Tulu Bor tuffs that are found broadly across eastern Africa. Ultimately, the tephra sequence from the relatively continuous section at Sinibo will be used to constrain the chronostratigraphy of fossil sites in structurally disrupted sequences in the Chemeron Formation. This work builds upon previous analyses (Namwamba, 1993) and is integrated with existing stratigraphy.

How to cite: Batlay, A., Beck, C., Kingston, J., Mbua, E., Skinner, M. M., Kivell, T., and Chirchir, H.: Tephrochronological analysis of the Plio-Pleistocene Chemeron Formation, Baringo Basin, Kenya: Refining stratigraphy and constraining chronology of vertebrate fossil sites, EGU General Assembly 2025, Vienna, Austria, 27 Apr–2 May 2025, EGU25-11989, https://doi.org/10.5194/egusphere-egu25-11989, 2025.

The relationship between depositional environments and transportation processes associated with the general properties of formed siliciclastic sediments has greatly interested researchers. The grain shape properties of the sediments reflect the transport mechanisms of different geomorphological and sedimentary environments. The spread of new, high-resolution analytical methods has made it possible to quickly examine the grain shape properties of a large number of individual mineral grains. We investigated three sediment types from different environments (aeolian, fluvial, glacial, [n=27]) using automated image analysis (Malvern Morphologi G3-ID). During the analysis and data processing (e.g. Kruskal-Wallis, MANOVA, PCA) we examined four variables related to grain shape, which were the following: HS circularity (form, roundness), convexity (surface texture), solidity (roundness) and elongation (form). Our vital aim was to determine the key variables that can help to distinguish certain geomorphological environments and define the possible limits and boundaries of each granulometric feature of the medium sand fraction (250-500 µm). Five groups were distinguished according to the three types of environment (p<0.001; α=0.05). The grains from the aeolian and glacial sediments each formed a separate group, while the grains from the fluvial environments were classified into three groups. HS circularity was the most effective attribute, and the elongation variable proved to be the least influential parameter in differentiating sedimentary environments. However, the high values (mean: 0.24-0.3) of the elongation variable indicate a very fresh state of grains from glacial and certain fluvial samples. The HS circularity value changes slowly over time, and a large amount of energy is needed to increase the roundness value, but relatively less time and presumably shorter distance are required to decrease the surface roughness. We tried to interpret the results by comparing the granulometric properties of recent sediment grains with paleo sediments (aeolian and fluvial, n=15). One additional group was formed containing the highest granulometric values of the investigated samples, and the other sediments were classified into the recent fluvial and aeolian groups. Although according to their stratigraphic position, they should have been classified into the opposite sediment groups, indicating that the paleo-aeolian sediments bear the transport features of the fluvial medium and vice versa. By increasing the number of samples and documentation of grains in various geomorphological environments makes it possible to delineate preliminary grain shape boundaries (e.g. for solidity glacial-fluvial: 0.95; fluvial-aeolian: 0.97). However, this may also have a hindering effect, as the grouping methods hide the differences in some parameters within the classified sediments. Presumably, for example, the aeolian environments may be as diverse as the fluvial ones and need to be studied separately. It is important to note that the presented granulometric fingerprinting method can only provide comprehensive and detailed insights into the depositional environment of the mineral particles when applied together with other proxies.

Support of the National Research, Development and Innovation Office (Hungary) under contract NKFIH FK138692 is gratefully acknowledged.

How to cite: Gresina, F., Farkas, B., Magyar, G., Szalai, Z., and Varga, G.: Comparison of recent sediments from different geomorphological environments using automated static image analysis with insight into its applicability to paleo archives, EGU General Assembly 2025, Vienna, Austria, 27 Apr–2 May 2025, EGU25-12819, https://doi.org/10.5194/egusphere-egu25-12819, 2025.

Alum Shale is a finely laminated organic-rich sedimentary rock which has recorded an anoxic-euxinic period which lasted for more than 20 My during tthe Cambrian and early Ordovician in the current-day Scandinavian region. A younger section (Tremadocian) of Alum Shale formation is located in Estonia, eastern part of the Baltic Paleobasin.

A 10-meter section of Alum Shale (black shale) and associated sediments (glauconitic sandstone, grey shale, sandstone) were scanned in core PED-403 with a Geotek XRF analyser, attached to automated Geotek-MSCL workstation. The concentrations of Mo, U, Ti, Al, S, and Si were analysed and corrected by measuring in-house reference samples.

Mo and U mostly co-vary in the sediments, but certain sections indicate a preferential uptake of Mo instead of U, indicating periods where particulate shuttle was active during slightly more oxic periods. Fine laminae also contain very low Mo and U enrichments, pointing to short-lived oxygenated conditions instead of prevailing perennial oxygen minium zone conditions on the shelf. Suble redox changes do not correlate with sedimentary textures described in the core. Systematic cyclicity was detected in the case of Ti, Al and Si. Sørensen et. Al. (2020) have demonstrated that astronomically forced climate cycles have been recorded in Cambrian-age Scandinavian Alum Shale cores. With follow-up analyses we wish to reveal whether cycles detected in the Estonian core have similar forcings.

This study was supported by EGT-TWINN project (GA no 101079459).

How to cite: Vind, J., Plado, J., and Põldsaar, K.: Millimeter-scale scanning of redox-sensitive elements in Tremadocian Alum Shale for revealing subtle redox variations and cyclicity, northwestern Estonia, Baltic Palaeobasin, EGU General Assembly 2025, Vienna, Austria, 27 Apr–2 May 2025, EGU25-13006, https://doi.org/10.5194/egusphere-egu25-13006, 2025.

EGU25-14906 | ECS | Posters on site | SSP3.8

Subsurface dissection of Holocene inter-reef Halimeda bioherms: morphology, facies and latitudinal variations in the northern Great Barrier Reef 

Zsanett Szilagyi, Luke Nothdurft, Jody Webster, Mardi McNeil, Juan Carlos Braga, Trevor Graham, Bethany C. Behrens, Yusuke Yokoyama, Robin Beamen, Victorien Paumard, Jeffrey Shragge, Sarah Goh, Jacquelin Reeves, Lara Picton, and Helen Bostock

Halimeda, calcareous green algae, bioherms are among the largest inter-reef biogenic structures in the Great Barrier Reef, spanning over >6000 km2 of the continental shelf – an area exceeding the adjacent coral reefs at equivalent latitudes1. Previous studies have shown the peculiar circular to reticulate shapes, the internal structure and volume of these accumulations, underscoring their significant contribution to the global neritic carbonate factory throughout the Holocene2,3. However, a comprehensive understanding of the formation and development of these uniquely shaped bioherms has been hindered by the absence of densely spaced core samples that target bioherm morphologies.

This study presents new data from the 2022 RV Investigator voyage IN2022_V07 “Halimeda bioherms: Origins, function and fate in the northern Great Barrier Reef (HALO)”. Forty-two densely spaced vibrocores were collected (up to 6 m length) over 3 inter-reef sites between lat 15⁰ 48’ 45” S and lat 13⁰ 21’ 11” S. Core locations to target bioherm morphotypes were collected with the aid of 50 cm resolution multibeam bathymetry data, and closely spaced sub-bottom profiles collected during the voyage. A total of almost 200 m of cores have been scanned with high-resolution CT, 50 m of core have been split, logged, scanned with multi-sensor core logger (magnetic susceptibility, spectrophotometer, X-ray fluorescence) and subsampled for grain size, composition and microfossil analysis to show a variety of facies ranging from estuarine to coral-rich deposits. Selected cores have been sub-sampled for radiocarbon dating of Halimeda grains, benthic foraminifers, and organic rich mud (23 samples), spanning from 12 ka to present, aligning with previous findings3. Initial observations revealed further facies complexity than previously thought in morphotypes, including Halimeda floatstone-rudstone and Foraminiferal wackestone-packstone facies in the south, while having facies minor mud matrix and richer in coral, mollusc, rhodolith and lithified clumps abundance towards north. This new dataset significantly advances our understanding of Halimeda bioherm morphology, development, and regional influences, providing new insights into their formation processes and ecological significance.


References:

  • McNeil, M. A., Webster, J. M., Beaman, R. J., and Graham, T. L., 2016, New constraints on the spatial distribution and morphology of the Halimeda bioherms of the Great Barrier Reef, Australia: Coral Reefs, v. 35, no. 4, p. 1343-1355. doi: 10.1007/s00338-016-1492-2
  • McNeil, M., Nothdurft, L. D., Dyriw, N. J., Webster, J. M., and Beaman, R. J., 2021, Morphotype differentiation in the Great Barrier Reef Halimeda bioherm carbonate factory: Internal architecture and surface geomorphometrics: The Depositional Record, v. 7, p. 176– 199. doi: https://doi.org/10.1002/dep2.122
  • McNeil, M., Nothdurft, L. D., Hua, Q., Webster, J. M., and Moss, P., 2022, Evolution of the inter-reef Halimeda carbonate factory in response to Holocene sea-level and environmental change in the Great Barrier Reef: Quaternary Science Reviews, v. 277. doi: 10.1016/j.quascirev.2021.107347

How to cite: Szilagyi, Z., Nothdurft, L., Webster, J., McNeil, M., Braga, J. C., Graham, T., Behrens, B. C., Yokoyama, Y., Beamen, R., Paumard, V., Shragge, J., Goh, S., Reeves, J., Picton, L., and Bostock, H.: Subsurface dissection of Holocene inter-reef Halimeda bioherms: morphology, facies and latitudinal variations in the northern Great Barrier Reef, EGU General Assembly 2025, Vienna, Austria, 27 Apr–2 May 2025, EGU25-14906, https://doi.org/10.5194/egusphere-egu25-14906, 2025.

EGU25-15355 | ECS | Orals | SSP3.8

Luminescence dating of core DLC70-2 from the North Yellow Sea in China and its implication for late Quaternary transgressions 

Nan Tang, Zhongbo Wang, Penghui Lin, Yuexin Liu, Zonghui Wu, Haozheng Tian, Xi Mei, Jun Sun, Jianghao Qi, Rihui Li, Shuyu Wu, Hongxian Chu, and Zhongping Lai

Reliable chronology is crucial for reconstructing the sedimentary history and sea level fluctuations. However, the lack of robust ages for late Quaternary deposits on the North Yellow Sea (NYS) shelf hampered our understanding of its sedimentary processes. In this study, quartz optically stimulated luminescence (OSL) and feldspar post-infrared infrared stimulated luminescence (post-IR IRSL) dating protocol were utilized to establish a detailed chronostratigraphy for the upmost 30 m of core DLC70-2 from the central NYS. Based on lithology features and dating results, three transgressive layers (hereafter referred as T1, T2 and T3, respectively from top to bottom) were identified. The consistency between two OSL dates (10.3-6.7 ka) and six radiocarbon (14C) dates (10.4-4.9 cal ka BP) indicates that the T1 layer deposited during MIS 1. Five quartz samples yielded saturation ages of >53 ka, combined with one feldspar pIRIR290 age of 76±7 ka from the top of the T2, suggested that the T2 layer should have formed no later than MIS 5. For T3 layer, two saturated quartz ages of >71 ka and a feldspar corrected age (191±17 ka) revealed that the T3 layer has formed at least during MIS 7. 
Based on the renewed chronostratigraphy of core DLC70-2, we reconstruct a comprehensive late Quaternary stratigraphy using ten previously published cores from the Bohai Sea and Yellow Sea. The occurrence of cold-water species Buccella frigida and Protelphidium tuberculatum during MIS 5 indicates there existed a cold-water mass (cyclonic eddy) similar to present-day marine circulation. Additionally, the late Quaternary stratigraphic correlation is supported by the previously chronostratigraphic reconstruction of coastal loess. These findings will enhance our comprehending on the sedimentary processes and their paleo-environment changes on the eastern Chinese shelves during late Quaternary.
Key words: luminescence dating; North Yellow Sea; late Quaternary; stratigraphic construction; transgressive deposits; core DLC70-2

How to cite: Tang, N., Wang, Z., Lin, P., Liu, Y., Wu, Z., Tian, H., Mei, X., Sun, J., Qi, J., Li, R., Wu, S., Chu, H., and Lai, Z.: Luminescence dating of core DLC70-2 from the North Yellow Sea in China and its implication for late Quaternary transgressions, EGU General Assembly 2025, Vienna, Austria, 27 Apr–2 May 2025, EGU25-15355, https://doi.org/10.5194/egusphere-egu25-15355, 2025.

High-resolution (millennial-scale) chronology is becoming more and more important in sedimentary process reconstruction, which could uncover unexpected events, in particular hiatus. It is assumed that sediments in  endorheic basin should be continuous. However, Our large luminescence chronology data revealed that, since late Quaternary, hiatus were common in the cores of the endorheic Qaidam Basin in the Tibetan Plateau, especially in the Last Glaciation Maximum (LGM) during which the endorheic lakes dried up and then the wind erosion was dominant.

Our large dataset of luminescence dating in deltas/fluvial-plains also displayed similar discontinuous pattern in core sediments, demonstrating unexpected hiatus which was omitted by previous studies, as well as the impacts of human activities revealed by changes of sedimentation rate.

It is strongly recommended the wider application of high-resolution chronostratigraphic methods in sedimentary research, and dense sampling for optically stimulated luminescence (OSL) dating. The combination of Single Aliquot Regeneration (SAR) protocol (Murray and Wintle, 2003) and Standardized Growth Curve (SGC) protocol (Roberts and Duller, 2004; Lai, 2006), SAR-SGC (Lai and Ou, 2013), routine used in our laboratory, will be of great help in this regard, which could save machine measurement time for at least 70%.

Key words: Luminescence chronology; high resolution; hiatus; sedimentary process.


References

Lai, Z.P., 2006, Testing the use of an OSL standardized growth curve (SGC) for determination on quartz from the Chinese Loess Plateau: Radiation Measurements, 41, 9–16, doi:10.1016/j.radmeas.2005.06.031.

Lai, Z.P, Ou, X.J., 2013. Basic procedures of optically stimulated luminescence (OSL) dating. Progress in Geograpgy, 32, 683-693 (in Chinese with English abstract).

Murray, A.S., and Wintle, A.G., 2003, The single aliquot regenerative dose protocol: potential for improvements in reliability: Radiation Measurements, 37, 377–381, doi:10.1016/S1350-4487(03)00053-2.

Roberts, H.M., and Duller, G.A.T., 2004, Standardised growth curves for optical dating of sediment using multiple-grain aliquots: Radiation Measurements, 38, 241–252, doi:10.1016/j.radmeas.2003.10.001.

How to cite: Lai, Z.: Chronological data is the best proxy in sedimentary process reconstruction, EGU General Assembly 2025, Vienna, Austria, 27 Apr–2 May 2025, EGU25-15450, https://doi.org/10.5194/egusphere-egu25-15450, 2025.

EGU25-15862 | Orals | SSP3.8

Submarine geomorphology of tidal channels in the northern Venice Lagoon, Italy 

Mariacristina Prampolini, Taha Lahami, Giorgio Castellan, Daphnie Galvez, Antonio Petrizzo, Valentina Grande, Christian Ferrarin, Federica Foglini, Federica Rizzetto, and Fantina Madricardo

The morphodynamics of coastal tidal wetlands and salt marshes are closely tied to the tidal channel networks that link these ecosystems to the sea. Tidal channels, shaped by strong currents and dynamic bathymetry, are vital for sediment transport and key ecological functions in coastal environments. They act as pathways for sediment, nutrients, and organic matter, supporting the health and resilience of tidal wetlands. These networks provide essential ecosystem services, including erosion control and habitats for fish and shellfish, which are crucial for biodiversity and fisheries.

However, tidal wetlands face growing threats from human activities. Dredging disrupts sediment transport and alters flow patterns, leading to habitat loss. Increased navigation accelerates bank erosion and raises water turbidity, degrading habitat quality. Coastal infrastructure, such as seawalls and dikes, further fragments these ecosystems, disrupting natural hydrological processes. Climate change exacerbates these pressures through rising sea levels and more frequent storms, accelerating wetland degradation.

Understanding the geomorphology and sediment dynamics of tidal channels is critical for managing these ecosystems, to mitigate natural and human-induced changes, enhance biodiversity, and promote sustainable management. Geomorphological studies often rely on satellite imagery and aerial surveys to analyze channel morphology and path changes. Seismic surveys and laboratory experiments contribute to understanding large-scale and fine-scale geomorphic processes. However, few studies employ high-resolution multibeam echosounder systems to document the detailed underwater morphology of tidal channels, with limited work on their three-dimensional structures.

This study aims to deliver a detailed 3D mapping of the seafloor morphology and sediment distribution in the tidal channels of the northern Venice Lagoon (Italy), one of the most studied coastal lagoons globally. While many studies have explored the migration and evolution of Venetian tidal channels, fewer have focused on high-resolution 3D mapping of their underwater features. We conducted morphometric analyses and classified channel substrates by means of high-resolution multibeam echosounder data validated with grab samples and video footage. The approach integrated bathymetric derivatives, expert geomorphic interpretation, and supervised classification of acoustic backscatter to produce a comprehensive understanding of tidal channel features.

The findings reveal fine-scale details of tidal channel seafloor geomorphology, providing new insights into their structure and functioning. This research enhances our understanding of tidal channel dynamics and offers valuable information for preserving and managing these critical ecosystems effectively.

How to cite: Prampolini, M., Lahami, T., Castellan, G., Galvez, D., Petrizzo, A., Grande, V., Ferrarin, C., Foglini, F., Rizzetto, F., and Madricardo, F.: Submarine geomorphology of tidal channels in the northern Venice Lagoon, Italy, EGU General Assembly 2025, Vienna, Austria, 27 Apr–2 May 2025, EGU25-15862, https://doi.org/10.5194/egusphere-egu25-15862, 2025.

EGU25-18440 | ECS | Posters on site | SSP3.8

A new sediment mobility and seabed disturbance geo-spatial toolbox (Sed-mob-bed Tool) 

Shauna Creane, Aelita Totska, and Mark Coughlan

On continental shelf seas, the spatial and temporal interaction between hydrodynamic processes and seabed substrate impacts seabed evolution and sediment distribution. For instance, when the magnitude of bed shear stress, induced by waves and/or currents, is greater than the threshold of movement, sediment is mobilised, giving rise to a range of dynamic bedforms and intricate local and regional sediment transport systems. These processes have direct implications for a wide range of offshore economic exploits (e.g., siting renewable energy and telecommunication infrastructure).

This area of research is currently at the forefront of policy and society due to the ongoing climate crisis. For instance, the Renewable Energy Directive (Directive (EU) 2023/2413) sets the European Union renewable energy target to at least 42.5 % by 2030. With offshore renewables playing a key role in reaching this objective (111 GW by 2030), the demand on the seabed is increasing. A common challenge in exploiting such offshore resources is characterising and monitoring Europe’s variable and dynamic seabed which poses significant risks to the siting and installation of engineering structures. The fiscal implications of poor background knowledge of geological and geotechnical risk before construction onset are well demonstrated by previous projects in Europe. To promote the growth of this sector in a sustainable and economically efficient manner, alongside other existing and prospective industries, the development of integrated geo-spatial tools that facilitate the interrogation of key oceanographic and geological datasets to generate standardised indicators are paramount.

To date, the characterisation and description of sediment mobilisation and seabed disturbance has been carried out using a labour and expertise intensive process. This Project will develop a ‘Sediment mobility and seabed disturbance geo-spatial toolbox (Sed-mob-bed Tool)’, a time-saving, reliable and repeatable means of qualifying and quantifying sediment mobility for a range of sediment types. This novel Sed-mob-bed Tool will facilitate the interrogation of spatial oceanographic and sedimentological datasets to produce a set of standardised sediment mobility and seabed disturbance indices (e.g., Mobilisation Frequency Index (MFI), Seabed Disturbance Index (SDI) and Sediment Mobility Index (SMI)) applicable to international end-users. Several research questions will be addressed, including:

  • What are the key physical processes, sedimentological characteristics and parameters critical to sediment mobility?
  • What are the most effective geospatial tools to garner this information?
  • Can this be applied in a way that is geostatisically robust?
  • How well do these approaches perform (i) in differing seabed morphological settings, and (ii) at scale?

The developed tool will be tested under several different environmental and seabed conditions. This includes an application to Irish Waters as a case study, leveraging the wealth of existing national and European level datasets (e.g., INFOMAR, EPA, EMODnet, GSI, Marine Institute). The results of which will be of particular interest to a cross-disciplinary group of practitioners including marine archaeologists, oceanographers, marine geoscientists, and engineers. The methodology and results from this work will ultimately provide a scientific knowledge base for the sustainable growth of the marine economy.

How to cite: Creane, S., Totska, A., and Coughlan, M.: A new sediment mobility and seabed disturbance geo-spatial toolbox (Sed-mob-bed Tool), EGU General Assembly 2025, Vienna, Austria, 27 Apr–2 May 2025, EGU25-18440, https://doi.org/10.5194/egusphere-egu25-18440, 2025.

EGU25-224 | ECS | Orals | SSP4.1

Glacial-deglacial bloom of giant diatoms in the tropical western Pacific through utilization of subsurface nutrients 

Wenqin Cai, Enqing Huang, Shuangquan Liu, and Jun Tian

During the Pleistocene epoch, diatom mat blooming occurred in the global ocean for serval times, particularly during several glacial periods (MIS 14, 12, 6, 4, 2). One intriguing phenomenon related to these blooming is the deposition of Ethmodiscus rex diatom mats in tropical-subtropical oligotrophic marine zones. However, the causal mechanism of this occurrence, known as the " Ethmodiscus rex problem " remains under debate and it is crucial to understand this mechanism. This study investigates the diatom mat core GT01, which was enriched in E. rex and retrieved from the Mariana Trench’s Challenger Deep in the Western equatorial Pacific Ocean. We aim to determine the geological age of the diatom blooming event through AMS 14C dating and to explore the nitrogen source of the diatom bloom using δ13C, δ15Norg, and other proxies, and conduct a semi quantitative assessment of the sea surface productivity status during that period.


By comparing the nitrogen isotope signals and considering the isotopic fractionation effects of diatom biology and remineralization, it is suggested that the main source of nitrogen nutrients for E. rex diatom bursts is subsurface nitrate rather than the "new nitrogen". This viewpoint aligns with the findings of previous biological studies on Ethmodiscus species. Based on the nitrogen nutrient source, there is a further hypothesis that E. rex diatoms may also uptake nutrients such as phosphate concurrently with subsurface nitrate. The carbon isotope signal indicates a significant increase in marine primary productivity during the flourishing of E. rex diatoms. The extensive remineralization of organic matter during deposition, along with the substantial production of respired carbon, may have contributed to the reduction of atmospheric CO2 concentration during glacial periods.


As primary producer in the ocean, diatoms are crucial in coupling nitrogen and carbon cycles in marine ecosystems. Investigating the nutrient sources and productivity of diatom mats is vital for gaining insights into the oceanic carbon and nitrogen cycles. These findings enhance our understanding of global biogeochemical cycles and their broader implications for past marine productivity and climate regulation.

How to cite: Cai, W., Huang, E., Liu, S., and Tian, J.: Glacial-deglacial bloom of giant diatoms in the tropical western Pacific through utilization of subsurface nutrients, EGU General Assembly 2025, Vienna, Austria, 27 Apr–2 May 2025, EGU25-224, https://doi.org/10.5194/egusphere-egu25-224, 2025.

EGU25-247 | Orals | SSP4.1

Radiolarian Microfossils as a Tool for Reconstructing Sea Surface Temperature of the past in the Northwest Pacific 

Kenji Matsuzaki, Takuya Itaki, Yoshimi Kubota, Kyung Eun Lee, Isao Motoyama, Takuya Sagawa, Keiji Horikawa, Masafumi Murayama, and Hajime Obata

We investigate the suitability of radiolarian species as palaeoceanographic proxies in the Northwest Pacific Ocean using 33 new core-top samples collected since 2021 during Joint Usage/Research Center for Atmosphere and Ocean Science (JURCAOS, Japan), combined with existing datasets published by authors of this study. The main target of this study is to review the suitability of radiolarian species as a paleoceanographic proxy and to develop a robust methodology to estimate past Sea Surface Temperature based on radiolarian species abundances. For this purpose, we compiled our new data from the East China Sea and Central Northwest Pacific with previous datasets obtained in the same area, Japanese coast, and Japan Sea. Our analysis revealed considerable differences between Sea of Japan and Northwest Pacific radiolarian assemblages, suggesting different responses of biota to environmental changes in this marginal sea; thus, we excluded Sea of Japan data from Northwest Pacific Sea Surface Temperature (SST) reconstructions. Factor Analysis identified four radiolarian assemblages in the Northwest Pacific and East China Sea, each associated with specific water masses and SST ranges: Subtropical, Sea of Okhotsk-related subarctic, Oyashio Current to transitional zone-related, and coastal water assemblages. Warm-water species (e.g., Tetrapyle circularis/fruticosa, Dictyocoryne tetrathalamus) showed strong correlation with temperatures above 24°C, while cold-water species (e.g., Lithomelissa setosa, Ceratospyris borealis) were linked to temperatures below 14°C. Literature review suggests these radiolarian-based SST reconstructions primarily reflect summer conditions. Using weighted averaging partial least squares analysis, we reconstructed past summer SSTs at IODP Site U1429 in the northern East China Sea with high precision (R²=0.97, ±1.4°C). These reconstructions align well with Globigerinoides ruber Mg/Ca-based summer SSTs, despite minor glacial period discrepancies, while showing consistent offsets from alkenone-based estimates, likely due to seasonal biases.

How to cite: Matsuzaki, K., Itaki, T., Kubota, Y., Lee, K. E., Motoyama, I., Sagawa, T., Horikawa, K., Murayama, M., and Obata, H.: Radiolarian Microfossils as a Tool for Reconstructing Sea Surface Temperature of the past in the Northwest Pacific, EGU General Assembly 2025, Vienna, Austria, 27 Apr–2 May 2025, EGU25-247, https://doi.org/10.5194/egusphere-egu25-247, 2025.

Eocene is one of the most eventful epochs of Earth’s geologic history, ranging from a series of global warming events in the early Eocene (~56-47 Ma) to an icehouse transition at the end of Eocene to Oligocene. Kutch, a pericratonic rift basin at the western boundary of India, hosts thick sedimentary strata with intervening marine deposits of Eocene with hiatus at Lutetian (~47-42 Ma) and Priabonian (~37-33 Ma). Given Kutch's equatorial paleolatitudinal position (~10°S-10°N) during the Eocene, it is particularly interesting to investigate the basin's response to global climatic perturbations. Bulk sediment samples from Naredi (Ypresian), Harudi, and Fulra Limestone (Bartonian) formations are collected at 0.5-meter intervals or at lithological changes, whichever provided a finer resolution. Stable isotope analyses of organic carbon (δ¹³Corg) from the samples are performed. A pronounced negative δ¹³Corg excursion indicative of Eocene Thermal Maximum (ETM2) is recorded from the first fossil-bearing shale beds with the occurrence of larger benthic foraminifera (LBF). The Assilina Limestone Unit, the topmost fossiliferous bed of the Naredi Formation, records the Early Eocene Climatic Optimum (EECO). The top of Naredi and basal Harudi Formation has relatively lower δ¹³Corg values in the range of -24 to -26‰ (VPDB). δ¹³Corg values are relatively higher from the overlying coquina shell beds, and another negative excursion (~1.5‰ VPDB) has been observed concurrently to the Nummulites obtusus bed. This negative excursion is likely linked to the Middle Eocene Climatic Optimum (MECO) warming event. An abundance of other LBFs like Nummulites spectabilis and Nummulites vredenburgi have been noticed at this level. No major shift in the δ¹³Corg profile has been noticed in the overlying carbonate platform deposit of the Fulra Limestone Formation. The limestone is highly fossiliferous, dominated by diverse species of LBF such as Discocyclina, Assilina and Nummulites. This investigation indicates a correlation between sea-level rise and global warming events during the Eocene epoch in the paleo-equatorial Kutch Basin. Elevated temperatures and increased nutrient input during the EECO and MECO fostered the growth and diversification of LBF like Nummulites and Assilina. These warm, nutrient-rich conditions enabled LBF to achieve high diversity, abundance, larger sizes, and an expanded latitudinal range in the middle Eocene, demonstrating their adaptability to global warming. The observed negative δ¹³C excursion in the Naredi and Harudi formations is likely linked to sea-level fluctuations and changes in terrestrial carbon input to the marine environment. This study contributes to a better understanding of the complex interplay between climate change, sea-level fluctuations, and carbon cycling at the Kutch Basin during the Eocene.

How to cite: Chaudhuri, S., Mitra, A., and Claeys, P.: Paleoclimate and paleoenvironmental reconstructions of the Kutch Basin, India, during the Eocene: Insights from geochemical and micropaleontological signatures, EGU General Assembly 2025, Vienna, Austria, 27 Apr–2 May 2025, EGU25-690, https://doi.org/10.5194/egusphere-egu25-690, 2025.

This study examines the sedimentation of the calcified microbes in the late Miaolingian and Furongian microbialites in response to relative sea-level changes. The microbialites mainly bulge out as undifferentiated microbial boundstones observed as leiolitic bioherms in the upper reaches of four third-order depositional sequences, as recognized through the Gushan, Changshan and Fengshan formations. A flat-bedded biostromal thrombolite also developed in the lower Furongian strata, with a variety of poorly-preserved calcimicrobes. In geologic record, the variety of microbialites is widely attributed to the microbial mats of diverse size and bionetwork. The cyanobacteria are believed to predominate other mat-building microorganisms in mediating a sophisticated in-situ carbonate precipitation across the Miaolingian-Furongian boundary interval. A rapid shift in the microbialite microfabric from Miaolingian to Furongian is observed in the study area, which is marked by a substantial increase in the diversity and abundance of calcified microbes. The Miaolingian leiolitic bioherms hold abundant crust-forming structures in the mixed ground mass of micrite and microspar. With reduced occurrence, these possible microbial structures with uncertain biological affinity extend upward across Miaolingian-Furongian boundary. The Furongian leiolitic bioherms are unique as they developed in response to forced regression during third-order relative sea level fall. The well-preserved calcimicrobes recovered from these bioherms include Girvanella, Subtifloria, Epiphyton and Renalcis confirm the recovery phase of microbial carbonate abundance and the intense cyanobacteria calcification episode of Cambrian-Early Ordovician. The recovery of Epiphyton from the Furongian microbialites in the study area contradicts the possible decline in Epiphyton abundance at the end of Miaolingian series, as reported from other parts of the North China Platform. This study offers significant implications towards the sedimentation pattern in the shallow skeleton-deficient sea during Furongian before the metazoan radiation of the middle Ordovician.

How to cite: Latif, K., Riaz, M., and Xiao, E.: Late Miaolingian to Furongian Transition in Calcified Microbes from the North China Platform (Shanxi Province): Implications for Microbialite Development, EGU General Assembly 2025, Vienna, Austria, 27 Apr–2 May 2025, EGU25-937, https://doi.org/10.5194/egusphere-egu25-937, 2025.

EGU25-1398 | ECS | Posters on site | SSP4.1

An Analysis of Floridian Foraminifera in Past Hurricane Sediment. 

Savannah Watson, Christopher Dellapena, and Timothy Dellapenna

Foraminifera are benthic microorganisms that are used as environmental proxies due to their sensitivity to changes in their surrounding living conditions. This study focuses on shifts in species abundance and diversity of foraminiferal assemblages from western Florida. This research has explored how Floridian hurricane activity and other related factors, including resuspended sediment contaminants, influenced these shifts. Samples were taken from vibracore PR-30, a sediment core taken along a barrier island, a location particularly vulnerable to hurricane events. These factors have all been analyzed in a comprehensive survey of the foraminifera present and XRF scans of potential contaminants in the sediment. We hypothesized that foraminiferal assemblages would decline in abundance and diversity in response to these factors. The preliminary data from a few of the samples has proven to be consistent in diversity and abundance with small variations between samples. This could suggest a strong resilience and ability to recover in Flordian ecosystems or that this period of time in the sediment had not yet experienced a severe weather event, leaving little data. More data collection and analysis will be necessary to achieve a comprehensive understanding of the vibracore foraminifera and the effects of hurricanes on marine ecosystems. The results of this study will help create a strengthened understanding of ecosystem resilience and recovery. As climatic events intensify, a strong understanding of the resilience of marine ecosystems will be key to understanding the long lasting effects caused by severe weather events. 

How to cite: Watson, S., Dellapena, C., and Dellapenna, T.: An Analysis of Floridian Foraminifera in Past Hurricane Sediment., EGU General Assembly 2025, Vienna, Austria, 27 Apr–2 May 2025, EGU25-1398, https://doi.org/10.5194/egusphere-egu25-1398, 2025.

EGU25-2258 | ECS | Orals | SSP4.1

Global sea level controlled the deep low-salinity pool evolution in the Japan Sea since the last glacial period 

Zhi Dong, Xuefa Shi, Jianjun Zou, Shizhu Wang, Yanguang Liu, and Xinqing Zou

Understanding past changes in oceanic circulation and the corresponding heat, salt delivery variations are essential for assessing the climatic roles of ocean dynamic processes since the last glacial period. Unravelling salinity budget variation in the North Pacific and its controls is important to better understand the North Pacific Intermediate/Deep Water formation and associated climate impacts. The Tsushima Warm Current (TWC), the northernmost Kuroshio branch entering the semi-closed Japan Sea through the shallow strait, is regarded as a fundamental component for oceanographic changes in the Japan Sea.

To obtain a comprehensive history of the Japan Sea salinity budget, this study reconstructed the evolution history of the TWC inflow by compiling paleo-hydrographic records in the Japan Sea, including the radiolarian, diatom, coccolithophore, and planktonic foraminiferal assemblages. Following a persistent but weakened TWC inflow during Marine Isotope Stage 3, radiolarian assemblage data revealed that the TWC taxa disappeared since ~30 thousand years ago (ka). The synchronous onset of the low salinity anomaly event was in response to the cutoff of saline TWC inflow due to the rapid fall in global sea level at 30 ka. Extreme restriction of seawater exchange caused a persistent freshening of the glacial Japan Sea and formed a low-salinity water mass in the upper ocean. The compiled microfossil data confirmed that the Japan Sea accumulated excess freshwater during the glacial sea-level lowstands and the low-salinity pool extended downward to ~900 m depths. Coinciding with the peak of the low salinity anomaly event (minimum values of ∼20 psu), re-emerging TWC inflow after 19 ka reflected the reconnection of the open ocean to the Japan Sea. The persistent TWC inflow mainly drove the reduction in magnitude of the deep low-salinity pool during the last deglaciation. As a large and isolated freshwater sink for the glacial North Pacific, the deep low-salinity pool evolution could potentially have strong impacts on the North Pacific salinity budget and subsequent large-scale circulation.

How to cite: Dong, Z., Shi, X., Zou, J., Wang, S., Liu, Y., and Zou, X.: Global sea level controlled the deep low-salinity pool evolution in the Japan Sea since the last glacial period, EGU General Assembly 2025, Vienna, Austria, 27 Apr–2 May 2025, EGU25-2258, https://doi.org/10.5194/egusphere-egu25-2258, 2025.

In 2023, Plymouth City Council created the Plymouth Sound National Marine Park. While this declaration carries no conservation status, it is based on the European recognition of the area as a Special Area of Conservation in 2005 by Natural England. Marine Research Plymouth, in collaboration with Plymouth City Council, is promoting research into the development of Plymouth Sound since the Last Glacial Maximum. In 1988, two boreholes were drilled into the palaeo-channel of the River Tamar in the middle of Plymouth Sound. The buried channel, which had been located during a geophysical survey, recorded a succession of gravels, saltmarsh, inter-tidal mud flats and open marine sands: all of which contain diagnostic microfossil assemblages. A comparable succession has been recorded near Jersey in another series of marine boreholes in the base of which there is a peat that has been carbon dated as 8300 years b.p.

The Plymouth Sound and Jersey data record the Holocene rise in sea-level following the Last Glacial Maximum (LGM) (20,000–18,000 years b.p.) when the British-Irish ice sheet extended as far south as the north coast of Cornwall. At the LGM, sea level was 125–130 m below the present day and the coastline was almost at the edge of the Continental Shelf. The amelioration in climate and the Holocene sea-level rise generated the present sub-environments of Plymouth Sound and the other rias in South-West England. The present glacial/interglacial cycle is, however, only the latest of a series of climate cycles, numbering perhaps 20+ over the last 2 million years.

Before, and after, the LGM – when permafrost was extensive in South-West England – the caves of South Devon hosted both a significant megafauna and hominin remains and the combination of this terrestrial palaeontology and the marine (foraminiferal) record makes the area of great significance in understanding the Late Pleistocene and Holocene.

How to cite: Hart, M. and Smart, C.: Plymouth Sound Boreholes: a record of sea level rise in the Plymouth Sound National Marine Park (South-West England, U.K.) since the Last Glacial Maximum, EGU General Assembly 2025, Vienna, Austria, 27 Apr–2 May 2025, EGU25-2883, https://doi.org/10.5194/egusphere-egu25-2883, 2025.

The ocean productivity plays a crucial role in the ocean carbon cycle by influencing atmospheric CO2 levels. Although upper water column mixing associated with East Asian monsoon and terrestrial weathering input are the primary sources of surface water nutrients in the northern South China Sea (SCS), their contributions to paleo-productivity changes in the northern SCS during the late Pleistocene remains contentious. This study reconstructs paleo-productivity, East Asian monsoon dynamics, and terrestrial nutrient matter inputs over the past 350kyr, using multiple proxies, including the relative abundance of planktonic foraminifer Globigerina bulloides, sediment TOC content, TOC/TN ratio, the ratio of mixed-layer species to thermocline species, the thermal gradient of the upper water column and δ18Oresidual from International Ocean Discovery Program (IODP) Site U1505. The results reveal a distinct glacial-interglacial cyclicity with higher paleo-productivity attributed to increased terrestrial nutrient inputs and intensified East Asian winter monsoon during glacial lowstands. Furthermore, paleo-productivity exhibits a pronounced ~23 kyr cyclicity and is coupled with enhanced East Asian summer monsoon intensity during periods of low-latitude insolation maximum, suggesting a precession forcing on paleo-productivity via East Asian summer monsoon intensity and insolation maximum.

How to cite: Xu, Y., Li, B.-H., and Cui, Q.: Planktonic Foraminifera Reveal Late Pleistocene Paleo-Productivity Changes in the Northern South China Sea, EGU General Assembly 2025, Vienna, Austria, 27 Apr–2 May 2025, EGU25-2985, https://doi.org/10.5194/egusphere-egu25-2985, 2025.

Charophytes, a group of green algae, are one of the main components found in continental carbonate microfacies. The combination of the palaeontologic (taxonomic and taphonomic) study with the sedimentologic analysis has demonstrates that the charophyte microfacies are highly diverse, representing a broad diversity of environments. However, the integration of these palaeoecological data with geochemical proxies (stable isotopes and elementary geochemistry) has not been poorly explored

Sixty-three thin sections from different levels were obtained along the 50 m-thick carbonate section of La Pedrera de MeiàKonservat-Lagerstätte (Southern Pyrenees, Spain). Two thin sections were obtained from charophyte-rich beds, which is demonstrated as useful to study charophytes in thin sections. A combined sedimentological study and taphonomic analysis of the fossils was performed to make palaeoecological inferences. The results were latter integrated with the palaeoenvironmental proxies, mainly elementary geochemistry and δ18O previously described in the same facies with the objective of refining the palaeoenvironmental reconstruction of the lake.

According to the palaeoecologial analysis, two communities are distinguished. Monospecific Echinochara sp.-Charaxis spicatus meadows solely occurred in temporary lakes formed during the early stages of the infilling. These meadows were associated to high Al, K, Fe and Ti concentrations, which suggests that the infilling of these lakes was associated to meteoric waters. The δ18O indicates intermittent periods of evaporation, which favoured the formation of cyanobacterial crusts around charophyte remains and the formation of mud-cracks visible in thin sections under the microscope.

The second charophyte assemblage coincides with the last stage of the lake infilling and was characterized by having two distinct communities, freshwater and brackish. The freshwater community as composed of mixed meadows with Atopochara-Clavatoraxis, Clavatoroidae utricles -Clavatoraxis, and Ascidiella-Favargerella plants while the meadows of brackish settings were composed of Porocharacean – Charaxis sp. and Echinochara sp.-Charaxis spicatus plants. This latter flora was associated to miliolids and broken dasycladaleans, suggesting brackish conditions. The Sr/Ba ratios are high suggesting marine influence, but REE+Y concentrations, and δ18O values previously reported for these lacustrine carbonates suggest predominantly freshwater conditions. These geochemical results suggest the establishment of dominantly freshwater environments with rare brackish to marine influence. This interpretation aligns with the presence of distinct brackish and freshwater charophyte assemblages, along with organisms exhibiting marine affinities, such as miliolids and dasycladaleans.

The present work demonstrates the value of cross-validation between geochemical and palaeontological and palaeoecological data of lacustrine settings that contain benthic organisms, such as charophytes and ostracods. In addition, this work also provides insights to understand the palaeoenvironmental conditions necessary for the thriving of these organisms in fossil lakes.

How to cite: Perez-Cano, J., Gil-Delgado, A., Oms, O., and Mercedes-Martín, R.: Integrating Charophyte Paleoecology and Geochemical Proxies in the La Pedrera de Meià Konservat-Lagerstätte (Southern Pyrenees, Spain): A Tool for better understanding fossil lacustrine settings, EGU General Assembly 2025, Vienna, Austria, 27 Apr–2 May 2025, EGU25-4519, https://doi.org/10.5194/egusphere-egu25-4519, 2025.

The Late Pleistocene Szekou Formation in southern Taiwan preserves an exceptional fossil assemblage that includes marine vertebrates, mollusks, and microfossils, which offers a unique peek into the paleo-lagoon environment during a period of rapid tectonic uplift and sea-level fluctuations. Previous studies utilizing sedimentological and lithofacies analyses, fossil assemblages, and stable isotope analyses, suggests a semi-open to open lagoonal system surrounded by barrier islands that provide partial isolation from the open ocean. However, the stratigraphic complexities, inconsistent sampling, and limited dating methods have led to contradictory interpretations and coarse age estimates, with the stratigraphic age roughly constrained between 30,000 and 260,000 years.

Recently, the National Museum of Natural Science's discovery of numerous in-situ preserved cetacean fossils, combined with new core data from the Geological Survey and Mining Management Agency, has provided new chronological evidence to further clarify the paleoenvironmental conditions. We integrated GNSS-based sampling location and elevation data to ensure accuracy. Carbon isotope ratio (δ13C) range from -22‰ to -25‰, while organic carbon-to-total nitrogen ratios (C/N) range between 7 and 29, suggesting C3 terrestrial plants or marine dissolved organic carbon as primary organic matter source(s). Additionally, foraminiferal assemblages indicate that the lagoon's water depth (60 meter) exceeded earlier estimates of 20 meters.

By integrating stratigraphically continuous core materials, stable isotope ratios and foraminifera data, this study reconciles prior discrepancies in paleoenvironmental interpretations of the Szekou formation. It reconstructs the sequential evolution of the Szekou lagoon, from its initial formation to later stages of development, emphasizing the influence of rapid uplift and sea level fluctuations on lagoon-ocean connectivity. Ultimately, this research seeks to contribute to broader understanding of evolution of coastal lagoons during the Late Pleistocene in southern Taiwan.

How to cite: Chen, Z.-D., Yang, T.-R., and Löwemark, L.: Integrating Microfossil and Geochemical Evidence to Refine our understanding of the Paleoenvironmental Evolution of the Szekou Formation, EGU General Assembly 2025, Vienna, Austria, 27 Apr–2 May 2025, EGU25-4797, https://doi.org/10.5194/egusphere-egu25-4797, 2025.

Calcareous nannofossils are essential tools for reconstructing palaeoenvironmental conditions and understanding evolutionary trends in plankton organisms during the Late Cretaceous. This study presents a comparative morphometric analysis of the Aspidolithus enormis - parcus group from the Lower Campanian and distant sections of the deep-water Rhenodanubian Supergroup (Loibichl, Eastern Alps, Austria) and the pelagic Smoky Hill Member of the Niobrara Formation (Western Interior Seaway, Kansas, USA). The aim is to refine our understanding of the evolutionary trends within this group, particularly in response to changing palaeoceanographic and climatic conditions.

Morphometric analysis of Aspidolithus taxa in both sections reveals that A. enormis (“small A. parcus”) can be clearly distinguished from A. parcus based on the total length of the coccolith, with a threshold of approximately 8.5 µm. A. enormis consistently exhibits a smaller coccolith size (< 8.5 µm), while A. parcus is characterized by a larger size (> 8.5 µm). However, despite clear size differences between A. enormis and A. parcus, statistical differentiation between the subspecies of A. parcus (A. parcus parcus, A. parcus expansus, and A. parcus constrictus) based on the ratio of central area width to external ring width (b/a) was not observed in either of the studied sections.

Interestingly, both the sections exhibit a similar pattern in which size variation in the b/a ratio correlates with sea surface temperature, with larger central areas associated with higher temperatures.

These findings reinforce the hypothesis that the Aspidolithus group exhibits regional consistency in response to environmental fluctuations, highlighting the applicability of nannofossil morphometry for palaeoenvironmental reconstructions and stratigraphic correlation.

How to cite: Granero Ordóñez, P., Wagreich, M., and Wierzbicki, A.: Morphometric and Palaeoenvironmental Analysis of Aspidolithus (Calcareous Nannofossils): Rhenodanubian Flysch Zone (Eastern Alps, Austria) vs. Niobrara Formation (Kansas, USA), EGU General Assembly 2025, Vienna, Austria, 27 Apr–2 May 2025, EGU25-5844, https://doi.org/10.5194/egusphere-egu25-5844, 2025.

EGU25-6742 | Orals | SSP4.1

A novel method for improved estimates of absolute microfossil abundance: A big step towards a deep-time terrestrial productivity proxy 

Chris Mays, Michael Hren, Marcos Amores, Richard Tyson, and Anthony Mays

A holy grail of both palaeoecology and biogeochemistry has been an accurate proxy of past biological productivity. Such a metric would offer a way to identify and quantify Earth’s deep-time ecosystem and carbon cycle function (and dysfunction). Plants have been the principal contributors to the terrestrial carbon cycle for hundreds of millions of years. We hypothesise that their absolute abundances in the fossil record can indicate ecosystem-mediated changes in carbon sequestration rates (='terrestrial net ecosystem productivity').

Many key parameters of biological systems—e.g., productivity, population sizes, biomass—are best expressed as absolute values. Unlike proportional data (e.g., percentages), absolute values provide standardized metrics for comparing the functioning of organisms, species and ecosystems across time and space. Since it is generally impractical to count entire populations, statistically significant abundance estimates require an accurate and precise sampling method. These typically entail more data collection effort (or time) than proportional data.

Firstly, we present a new method for precise estimates of microfossil concentrations: the ‘field-of-view subsampling’ (FOVS) method. It applies ecological quadrat sampling principles to microfossil samples spiked with exotic markers (e.g., Lycopodium spores). We tested the new FOVS method against the traditional ‘linear method’ with two case studies: 1, computer simulations; and 2, observational data of terrestrial organic microfossils from the end-Permian event (EPE; c. 252 Ma) records of eastern Australia. Four output parameters were measured: 1, absolute abundance (measured as specimens per unit sample size [e.g., sediment mass]); 2, accuracy (measured as variance from an idealised data set); 3, precision (measured as statistical error); and 4, data collection effort (measured as time). The FOVS method consistently provided estimates with greater accuracy, and higher precision and/or reduced effort under almost all conditions.

Secondly, we assessed the potential application of this method (and others) for gauging palaeoproductivity. As a result of this review, we: 1, identified the factors that influence the preservation of land-derived organic carbon in the fossil record; 2, adapted and applied a framework of modern ecosystem productivity to prehistoric settings by incorporating post-burial impacts; and 3, explored the conditions under which terrestrial organic microfossil concentrations may provide valid estimates of relative changes in palaeoproductivity.

Lastly, we demonstrate how refined estimates of deep-time terrestrial productivity may be achieved in the future. This would lead to more precise land carbon cycle models since the emergence of large land plants >360 million years ago.

Although we have explored a narrow application of the new method to palaeoproductivity, the range of potential applications is far broader. In the microfossil realm, the method can be immediately applied to any study using exotic markers (e.g., Lycopodium spores) for absolute abundances. Given its demonstrable increased efficiency, we recommend the FOVS method as the new standard for such absolute abundance estimates.

How to cite: Mays, C., Hren, M., Amores, M., Tyson, R., and Mays, A.: A novel method for improved estimates of absolute microfossil abundance: A big step towards a deep-time terrestrial productivity proxy, EGU General Assembly 2025, Vienna, Austria, 27 Apr–2 May 2025, EGU25-6742, https://doi.org/10.5194/egusphere-egu25-6742, 2025.

EGU25-6986 | ECS | Posters on site | SSP4.1

Abyssal record of Eocene warming in the Tasman Sea 

Irene Peñalver Clavel, Elisa Laita, Edoardo Dallanave, Rupert Sutherland, Thomas Westerhold, Gerald R. Dickens, Blanca Bauluz, and Laia Alegret

The Middle Eocene Climatic Optimum (MECO) was a global warming period that interrupted the gradual cooling trend of the middle-late Eocene at around 40 Ma. It is characterized by high temperatures, increased pCO2 levels in the atmosphere, and marine carbonate dissolution. Its gradual onset, rapid termination, long duration (500 kyr), and the lack of a global negative carbon isotope excursion clearly differentiate the MECO from other Eocene hyperthermals, making its study of utmost interest to understand the effects of warming on the carbon cycle. Herein, we present the first record of the benthic foraminiferal response to the MECO at abyssal depths, and we reconstruct the paleoenvironmental impact. The Eocene sediment samples from International Ocean Discovery Program Site U1511 in the Tasman Abyssal Plain (Southwest Pacific Ocean) were deposited below the CCD and contain well-preserved agglutinated benthic foraminifera. The foraminiferal assemblages show low diversity values across the whole study interval. The MECO is characterized by the dominance of the opportunistic species Spiroplectammina spectabilis, which points to environmental instability and changes in food availability, likely linked to water column stratification associated with warming. Mineralogical analyses show an increase in smectite content during the MECO, suggesting changes in deep-water sources. These findings are consistent with previously documented changes in ocean circulation and nutrient dynamics in the region during the MECO.

How to cite: Peñalver Clavel, I., Laita, E., Dallanave, E., Sutherland, R., Westerhold, T., Dickens, G. R., Bauluz, B., and Alegret, L.: Abyssal record of Eocene warming in the Tasman Sea, EGU General Assembly 2025, Vienna, Austria, 27 Apr–2 May 2025, EGU25-6986, https://doi.org/10.5194/egusphere-egu25-6986, 2025.

EGU25-7355 | ECS | Orals | SSP4.1

A comparative study of lacustrine ostracods and mollusks of the Dinarides and Serbian Lake Systems 

Katja Mužek, Oleg Mandic, Valentina Hajek-Tadesse, Nevena Andrić-Tomašević, and Ljupko Rundić

Intramontane basins serve as exceptional archives of long-term climate, depositional and environmental changes. Additionally, these basins are biodiversity hotspots, harboring freshwater lacustrine fauna, making them invaluable for studying the interplay between paleoenvironmental dynamics and evolutionary processes.

During Miocene, a multitude of intramontane basins emerged within the Dinarides mountain range. The basins were filled with a series of long-lived lakes, hosting endemic lacustrine fauna significant for understanding Neogene paleoenvironments and paleogeography. Two freshwater systems, representing distinct paleobiogeographic entities, occupied areas corresponding to present-day Croatia and Bosnia and Herzegovina (Dinarides Lake System, DLS) and Serbia, Kosovo, and North Macedonia (Serbian Lake System, SLS). Faunal samples were collected from various localities within the DLS and a single locality in the SLS. Within the DLS, key sites include the Kupres, Livno, and Tomislavgrad basins in Bosnia and Herzegovina, whereas the samples retrieved from the SLS belong to the Valjevo-Mionica Basin in western Serbia.

This research aims to comprehensively revise and provide detailed taxonomic descriptions of the freshwater benthic assemblages from both the DLS and SLS. Comparative analysis of ostracod and mollusk compositions has been used to investigate evolutionary connections between species in these intramontane lacustrine systems. The ostracod fauna is of particular interest due to the absence of in-depth descriptions and detailed figures. In contrast, mollusk assemblages have been thoroughly revised and described in previous publications. Correlation within the DLS is based on ostracod and mollusk samples from the Table section (Livno Basin), the Kongora section (Tomislavgrad Basin), and the Fatelj section (Kupres Basin). A taxonomic analysis was conducted using samples from the Ribnica section of the Valjevo-Mionica Basin to compare this fauna with that of the SLS.

The future direction of this research involves expanding comparative taxonomic analyses with other Neogene long-lived lakes, aiming to provide deeper insights into evolutionary patterns and further our understanding of faunal developments.

How to cite: Mužek, K., Mandic, O., Hajek-Tadesse, V., Andrić-Tomašević, N., and Rundić, L.: A comparative study of lacustrine ostracods and mollusks of the Dinarides and Serbian Lake Systems, EGU General Assembly 2025, Vienna, Austria, 27 Apr–2 May 2025, EGU25-7355, https://doi.org/10.5194/egusphere-egu25-7355, 2025.

EGU25-8064 | ECS | Posters on site | SSP4.1

Micropaleontological insight into the Badenian Sea from the North Croatian Basin 

Monika Milošević, Viktória Baranyi, Vlasta Ćosović, Valentina Hajek-Tadesse, Ines Galović, and Mirjana Miknić

During the Badenian (Langhian-early Serravallian), a diverse biocenosis inhabited the warm marine environments of the epicontinental Central Paratethys Sea. The investigated site in the southeastern part of the Pannonian Basin (North Croatian Basin) provides a unique insight into the palaeoenvironmental evolution of that part of the sea, including changes in water depth, salinity, oxygen, and nutrient levels. A multi-micropaleontological study integrated benthic and planktonic foraminifera, ostracods, calcareous nannoplankton, palynological assemblages, and diversity proxies. This approach encompasses biostratigraphic dating and detailed paleoenvironmental reconstruction.

The studied sediments described a transition from an oligotrophic deeper marine environment, frequently influenced by terrigenous input  (river discharge) to shallow marine habitats. A short-lived eutrophication event, likely triggered by high nutrient activity and transport into the marine basin, occurred slightly above the volcanoclastic layer, correlative to dated tuff in the vicinity (14.4 ± 0.03 Ma, Marković et al., 2021). Following the overall shallowing trend, the environment stabilized into a shallow, oligotrophic state.

This research contributes to a refined understanding of the Miocene environmental history of the southern Pannonian Basin, adding more pieces to  the puzzle called the evolutionary history of the  Central Paratethys. By integrated multiple proxy groups, we aimed to elucidate the timing and character of key environmental changes within this region.


Marković, F.; Kuiper, K.; Ćorić, S.; Hajek-Tadesse, V.; Kučenjak, M.H.; Bakrač, K.; Pezelj, Đ. & Kovačić, M. (2021): Middle Miocene marine flooding: New 40Ar/39Ar age constraints with integrated biostratigraphy on tuffs from the North Croatian Basin. Geologia Croatica, 74(3), 237–252. 


ACKNOWLEDGMENTS

This research was conducted in the scope of the internal research project „RAMPA - Development of Miocene paleoenvironments in Croatia and their connection with global events“at the Croatian Geological Survey, funded by the National Recovery and Resilience Plan 2021–2026 of the European Union – NextGenerationEU, and monitored by the Ministry of Science and Education of the Republic of Croatia.

Partly this research was also supported by the internal research project WEGETA – Weathering and vegetation intertwined-multiproxy approach to understand the fate of terrestrial ecosystems in times of global climate change“ at the Croatian Geological Survey, funded by the National Recovery and Resilience Plan 2021–2026 of the European Union – NextGenerationEU, and monitored by the Ministry of Science and Education of the Republic of Croatia and „PYROSKA – Miocene syn-rift evolution of the North Croatian Basin (Carpathian-Pannonian Region): a multi-proxy approach, correlation and integration of sedimentary and volcanic record“ at the Croatian Geological Survey, funded by Croatian Science Foundation, Installation Research projects (UIO-2019-04-7761).


How to cite: Milošević, M., Baranyi, V., Ćosović, V., Hajek-Tadesse, V., Galović, I., and Miknić, M.: Micropaleontological insight into the Badenian Sea from the North Croatian Basin, EGU General Assembly 2025, Vienna, Austria, 27 Apr–2 May 2025, EGU25-8064, https://doi.org/10.5194/egusphere-egu25-8064, 2025.

EGU25-8192 | ECS | Orals | SSP4.1

Deciphering continental and oceanic climate signals in early Pliocene sediments from the Iberian Margin  

Laura Martín García, Francisco J. Jiménez-Espejo, Diana Ochoa, Timothy Helbert, William Clark, and José-Abel Flores

The Iberian Margin, including the Portugal Shelf, is a distinctive area in our planet, characterized by a narrow continental shelf where detrital sediments transported by rivers record continental climate patterns. Ocean dynamics in this region are strongly influenced by the Mediterranean Outflow Water (MOW), and the North Atlantic subtropical gyre, both key components of the Atlantic Meridional Overturning Circulation (AMOC) and essential for understanding climate dynamics.

Past research has demonstrated that sedimentary processes from this region are driven by astronomically-forced climatic mechanisms. This study assesses the interaction of continental and oceanic processes along the Iberian Margin during the early Pliocene, an interval of significant palaeoceanographic interest marked by the reestablishment of the MOW after the Messinian Salinity Crisis.

For this, a high-resolution study of calcareous nannofossils assemblages and X-ray fluorescence (XRF) analyses were carried out on sedimentary material retrieved from the 397 IODP expedition (site 1587, southwestern Iberian Margin). Calcareous nannofossils assemblages reveal changes in paleoenvironmental parameters such as productivity and sea surface temperatures, while XRF data indicate changes in continental input.

Based on spectral and wavelet analyses of the XRF data, we identify a robust astronomical signal of precessional origin in the sediments. Moreover, the abundance of Reticulofenestra minuta and Reticulofenestra pseudoumbilicus larger than 7 µm correlates with eccentricity-driven orbital changes. In contrast, Reticulofenestra producta, R. haqii y R. minutula exhibit declining abundance at the base of the Pliocene, suggesting modulation by oceanic mechanisms independent of astronomical forcing. These findings thus evidence the role of orbital-driven climate processes (eccentricity and precession) shaping the continental input. Furthermore, the calcareous nannofossil association reflects distinct ocean dynamics associated to the North Atlantic and processes that determine variability in productivity in the region.

How to cite: Martín García, L., Jiménez-Espejo, F. J., Ochoa, D., Helbert, T., Clark, W., and Flores, J.-A.: Deciphering continental and oceanic climate signals in early Pliocene sediments from the Iberian Margin , EGU General Assembly 2025, Vienna, Austria, 27 Apr–2 May 2025, EGU25-8192, https://doi.org/10.5194/egusphere-egu25-8192, 2025.

EGU25-8200 | ECS | Orals | SSP4.1

Coccolithophore paleoproductivity variability as a proxy of ocean surface dynamics and climate variability in the Gulf of Cadiz during the Mid-Brunhes Event (MIS 12-11) 

María González-Martín, Andrés Salvador Rigual-Hernández, Alba González-Lanchas, Bárbara Balestra, and José Abel Flores

This study focuses on high-resolution analyses of coccolithophore assemblages from a sediment core retrieved at IODP Site U1386, located in the Gulf of Cádiz. This area plays a crucial role in studying the Atlantic-Mediterranean water exchange. Our samples span the Termination V period (MIS 12-11, 434-404 kyr) that roughly corresponds with Mid-Brunhes Event, a major global climatic shift in glacial-interglacial cycles during the Quaternary. The main objective is to reconstruct coccolithophore paleoproductivity variations and use it as an indicator of surface ocean dynamics and environmental conditions during this critical interval of global environmental change.

Our results reveal higher paleoproductivity during the interglacial period (MIS 11), with an average of 8.33 × 10⁹ coccoliths/g, compared to lower paleoproductivity during the glacial period (MIS 12), with an average of 4.23 × 10⁹ coccoliths/g. This difference is also reflected in nannoplankton assemblage composition: with cold-water species such as Coccolithus pelagicus subsp. pelagicus dominating during the glacial, and an increase in warm-water species during the interglacial. These patterns are consistent with a cooling in sea surface temperatures (SST) during the glacial period and warming during the interglacial, and with benthic δ¹⁸O values, which were higher in the glacial and lower in the interglacial, reflecting an increase in Northern Hemisphere ice cover during the cold period. Our data, along with previous studies, suggest that MIS 12 in the study region was characterized by severe climatic conditions, with intensified circulation of subpolar surface water masses into the study region and a potential southward migration of the polar front. In contrast, during MIS 11, the climate was warmer, with intensified influence from subtropical surface water masses. Additionally, we observe a significant decrease in paleoproductivity around 430 kyr, coincident with severe SST cooling and peaks in ice-rafted debris (IRD), which could correlate with Heinrich type Event 4 (Ht-4), previously observed in the Iberian margin.

How to cite: González-Martín, M., Rigual-Hernández, A. S., González-Lanchas, A., Balestra, B., and Flores, J. A.: Coccolithophore paleoproductivity variability as a proxy of ocean surface dynamics and climate variability in the Gulf of Cadiz during the Mid-Brunhes Event (MIS 12-11), EGU General Assembly 2025, Vienna, Austria, 27 Apr–2 May 2025, EGU25-8200, https://doi.org/10.5194/egusphere-egu25-8200, 2025.

EGU25-8820 | Orals | SSP4.1

A Miocene Climatic Optimum Tropical Barrier Reef: Combining biomarker and facies analysis to understand conditions of reef survival.  

Benjamin Petrick, Lars Reuning, Lorenz Schwark, Or Bialik, and Miriam Pfeiffer

One of the key questions is how and if large complex reef systems can survive under future climate change scenarios. It is known that during the Middle Miocene, there were extensive reefs across the Indo-Pacific. Since the Middle Miocene was a time of global temperatures and CO2 similar to end-of-century predictions, this is an ideal time interval to study. However, there has been a lack of multi-million-year proxy records from these ecosystems for the Miocene. For the first time, we present an SST record from a site (IODP U1464) near the large Miocene Barrier Reef on the NW Shelf of Australia. In this study, we use biomarkers to reconstruct oceanic conditions and look at the changing environments from a carbonate facies perspective. Our research shows that the reef system might have initiated at temperatures that were close to modern summer values in the region. However, during the height of the Miocene Climatic Optimum, when summer temperatures reached 34°C, the reef system was at its maximum extent. Arid conditions, heat-tolerant corals, and a low local subsidence rate allowed the barrier reef to tolerate the hot summer conditions. When the sea level dropped, and sabkhas covered the site during the Middle Miocene climate transition, cooler SSTs allowed for faster reef growth. However, starting at 12 Ma, higher summer SSTs and increased local subsidence led to the end of the barrier system and the continuous collapse of the reef between 11-7 Ma. This suggests that a reduction in stressing conditions is critical for reef survival in a warmer world. Predictions for rapidly changing oceanic conditions coupled with sea-level rise indicate that future climate change will harm modern large complex reefs, much like during the Late Miocene.

How to cite: Petrick, B., Reuning, L., Schwark, L., Bialik, O., and Pfeiffer, M.: A Miocene Climatic Optimum Tropical Barrier Reef: Combining biomarker and facies analysis to understand conditions of reef survival. , EGU General Assembly 2025, Vienna, Austria, 27 Apr–2 May 2025, EGU25-8820, https://doi.org/10.5194/egusphere-egu25-8820, 2025.

EGU25-8949 | Orals | SSP4.1

Contrasting changes in phytoplankton assemblage and size to environmental shifts in the Mediterranean Sea using novel deep-learning protocols 

Camille Godbillot, Baptiste Pesenti, Karine Leblanc, Luc Beaufort, Cristele Chevalier, Julien Di Pane, Xavier Durrieu de Madron, and Thibault de Garidel-Thoron

Understanding the spatial and temporal changes in phytoplankton assemblages is essential in the context of climate change, due to their impact on carbon burial and the marine food web. Here we investigate the effects of environmental shifts in the Mediterranean Sea on phytoplankton taxonomy and size structure using an AI-based approach. We analyzed two sediment trap series from the northwestern Mediterranean Sea between 2010 and 2018: one in the oligotrophic Ligurian Sea and the other in the Gulf of Lion, a region where deep convection occurs regularly in the winter. We used novel deep-learning protocols for image analysis to generate data for phytoplankton particle fluxes, size distributions, and relative assemblages, with a focus on coccolithophores and diatoms. This automated approach enabled the rapid, high-throughput processing of microscope images, producing a standardized dataset across both time series. Our results show a general decline of phytoplankton fluxes towards the seafloor, mirroring the decrease in vertical mixing that affects the water column. Both sites show a shift towards phytoplankton species associated with stratified and nutrient-depleted conditions, but with contrasting patterns despite their proximity: In the Ligurian Sea, deep-dwelling coccolithophore species become increasingly dominant, while in the Gulf of Lion, summer-associated siliceous species, including large diatoms and silicoflagellates, show an increase. These contrasting trends likely result from differences in nutrient inputs and surface pH changes between the sites. We find that the increasing dominance of smaller phytoplankton in the Ligurian Sea leads to a reduction in carbon burial efficiency, while in the Gulf of Lion, the enhanced contribution of larger diatoms may sustain relatively higher export and burial rates in the future. These findings highlight the heterogeneous responses of phytoplankton communities to the increasing surface temperatures and stratification in the Mediterranean Sea, and their contrasting impact on carbon burial. 

How to cite: Godbillot, C., Pesenti, B., Leblanc, K., Beaufort, L., Chevalier, C., Di Pane, J., Durrieu de Madron, X., and de Garidel-Thoron, T.: Contrasting changes in phytoplankton assemblage and size to environmental shifts in the Mediterranean Sea using novel deep-learning protocols, EGU General Assembly 2025, Vienna, Austria, 27 Apr–2 May 2025, EGU25-8949, https://doi.org/10.5194/egusphere-egu25-8949, 2025.

This study examines the paleoenvironmental evolution of the Qom Formation using biostratigraphy and petrography within a sequence stratigraphic framework to figure out spatial and temporal distribution of the depositional characteristics. The upper part of the Qom Formation (members e and f) was deposited in the northern branch of the Tethyan Seaway in the Central Iran Basin, and investigated along the Dochah and Jujukzar sections. Calcareous nannofossils and large benthic foraminifera indicate the succession was deposited during the early to middle Burdigalian in the Central Iran Basin. According to nannofossil assemblages two biozones NN2 (Discoaster Druggii zone) and lower part of NN4 (Sphenolithus heteromorphus zone) of Burdigalian age are identified in both members of the Qom succession. With respect to nannofossil zones, a hiatus (NN3, ca. 19-18 Ma) is recognized, related to erosion. Based on large benthic foraminifera, SBZ25 biozone including Borelis melo curdica (Burdigalian) is recognized in the member f of the Qom Formation. Based on petrography, ten depositional facies were deposited in four facies belts including lagoon, shoal, mid ramp, and basin, propagated in a ramp-type platform in the Qom Basin. Regarding stacking pattern of facies, three 3rd-orderdepositional sequences were formed at the time, driven by relative sea-level changes. Regarding the sequence stratigraphic context, the upper part of the member e and member f are stratigraphically equivalent as evident by biostratigraphic and sedimentary evidence, which has not been investigated in previous studies. This study underscores and evaluates the sequence stratigraphy and sedimentary model of the Qom Basin in a high-resolution scale.

Key words: Qom Formation, Biostratigraphy, Sequence stratigraphy, Tethyan Seaway

How to cite: Sharifi-Yazdi, M., Ćorić, S., and Wagreich, M.: Biostratigraphy and depositional characteristics of the northern part of the Tethyan Seaway (Burdigalian, Central Iran) in a sequence stratigraphic framework, EGU General Assembly 2025, Vienna, Austria, 27 Apr–2 May 2025, EGU25-9166, https://doi.org/10.5194/egusphere-egu25-9166, 2025.

EGU25-9838 | Orals | SSP4.1

Calcareous nannoplankton response to Oceanic Anoxic Event 2 (Cenomanian-Turonian, Late Cretaceous) 

Cinzia Bottini, Edna Tungo, Elisabetta Erba, and Gerson Fauth

The Cenomanian/Turonian boundary interval was marked by an extreme environmental change coinciding with Oceanic Anoxic Event 2 (OAE 2; ~94 Ma) characterized by global warming, accelerated hydrological cycle, enhanced production and bu­rial of organic matter and high concentrations of CO2. The causes are linked to Large Igneous Provinces (LIPs) activity, which released vast amounts of greenhouse gases into the ocean-atmosphere system as well as toxic metals responsible of altered chemistry and structure of the oceans. Also, the OAE 2 experienced a significant brief period of cooling (ca. 40 kyr) occurred known as the Plenus Cold Event (PCE), firstly identified and described in the Eastbourne section (Sussex, England). In its complex, the OAE 2 represents a key case study to understand the dynamics of oceanic process as well as the response of biota to climate change.

In this work we present data on calcareous nannofossils from the Eastbourne section, which is a reference section for OAE 2, with the general aim to implement our understanding of the effects of OAE 2 perturbation on calcareous nannoplankton. Specifically, 44 samples were analysed for morphometry of Eprolithus floralis and assemblage composition. For each sample nannofossil temperature and nutrient indices were also calculated.

We selected Eprolithus floralis because is a nannolith taxon, heavily calcified and with a reconstructed preference of cooler waters. Previous morphometric investigations focused on coccolith taxa (i.e. Biscutum constans, Discorhabdus ignotus, Zeugrhabdotus erectus and Watznaueria barnesiae) predominantly associated with fertility fluctuations in surface waters.

Results show that E. floralis underwent significant size variations across OAE 2 with a decrease in the total diameter during OAE 2 of ca. 0.5 μm. Minimum sizes are reached in the latest part of OAE 2 (chemostratigraphic peak B), with specimens ca. 1 μm smaller than in pre- and post-OAE 2 intervals.

Two distinct E. floralis morphotypes were separated, one with spiky and one with rounded elements. The latter morphogroup, more abundant during OAE 2, has a relatively smaller (ca. 0.2 μm) total average diameter.

The diaphragm diameter also shows size changes but with opposite trends, thus specimens have larger diameter during OAE 2 except for peak B which is characterized by the smallest values.

Our findings indicate that morphometric fluctuations are unrelated to abundance. Moreover, although E. floralis is as a cold-water species, its abiundance is unrelated to temperature fluctuations across OAE 2, including the PCE.

The main size patterns of E. floralis are partially similar to those of B. constans, D. ignotus and Z. erectus possibly suggesting that common environmental stressors affected all these species. We speculate that also E. floralis used the strategy to reduce the average size to cope with excess CO2 and/or toxic metals. Moreover, we do see a change in the dominance of the morphotypes probably suggesting that those with rounded shape and smaller size were better adaptable to/ less stressed by the OAE 2 perturbation.

How to cite: Bottini, C., Tungo, E., Erba, E., and Fauth, G.: Calcareous nannoplankton response to Oceanic Anoxic Event 2 (Cenomanian-Turonian, Late Cretaceous), EGU General Assembly 2025, Vienna, Austria, 27 Apr–2 May 2025, EGU25-9838, https://doi.org/10.5194/egusphere-egu25-9838, 2025.

Foraminifera's diverse reproductive strategies contribute greatly to their capacity for evolutionary change and their remarkable success throughout Earth's history. This includes sexual reproduction (where genetic material from two individuals is combined), asexual reproduction (where offspring are produced from a single parent) and multiple fission events, giving them the ability to evolve and thrive over time, and the potential to adapt to new environments, develop new traits and diversify into new species. Previous laboratory studies have consistently shown that foraminifera can each produce a large number of offspring from a single reproductive event, but finding foraminifera during their reproductive phase in nature is a rarity.


Here we report on symbiont-bearing foraminifera of the genus Peneroplis in a reproductive state from two natural sites in the Pacific Ocean that are in the process of releasing their juveniles. Findings of adult Peneroplis parent shells with pre-emergent juveniles contained within the test provided a rare opportunity to examine the range of morphologic variability within a single brood of offspring resulting. The adult specimens were complete and contained numerous calcified megalospheric juveniles. We examined the parental test and the megalospheric juveniles by high-resolution Scanning Electron Microscopy to document the quantity, morphology, and size range of the juveniles and to provide novel insight into the reproductive biology and ontogenetic constraints of P. pertusus. The juveniles are non-uniform and highly heterogenous, varying in size, ornamentation, position of the flexostyle, and extent of test deformations. We also report on morphological features in normal and deformed juvenile tests as displayed in the proloculus and the flexostyle. To test whether the juvenile test deformations are expressed in adults, more than 100 specimens of P. pertusus were examined. Previous studies suggested that juvenile test deformities can be carried through into the adult. Our study shows, however, that test abnormalities among juveniles are not expressed in adults of natural population, indicating that they are either transitioning to normal growth forms or are not viable. The small juveniles ultimately become the proloculus and associated juvenile chamber(s) of adults, features that are used in the taxonomy of some larger foraminifera. Morphological features of juveniles and prolocular size across contemporary populations and among populations through time may be used to infer ecological and paleoecological conditions. Results of this study inform such investigations.

How to cite: Langer, M. R., Trubin, I., Tian, S. Y., and Goldstein, S. T.: Size range, morphotypes, and test deformations in juvenile megalospheres of the symbiont-bearing foraminifer Peneroplis: Windows on evolutionary processes and past environments, EGU General Assembly 2025, Vienna, Austria, 27 Apr–2 May 2025, EGU25-9929, https://doi.org/10.5194/egusphere-egu25-9929, 2025.

EGU25-10620 | ECS | Orals | SSP4.1

South eastern Indian Ocean (ODP Site 752) paleoceanographic conditions during the Middle to Late Miocene based on calcareous nannofossils assemblages 

Xabier Puentes Jorge, Arianna V. Del Gaudio, Werner E. Piller, David De Vleeschower, Tamara Hechemer, Jing Lyu, and Gerald Auer

The Middle to Late Miocene represents an important time interval on a global scale. Due to continental reorganisation in the Indian Ocean (IO) a near-modern monsoonal wind system was established, a series of climatic changes linked to the Middle Miocene Climatic Transition occurred and the subsequent shift of the region dominated by the Westerlies to the north took place during the Late Miocene. However, how these processes and forcing mechanisms interact and affect the surface ocean dynamics in the southern subtropical IO is poorly understood. In this regard, Ocean Drilling Program (ODP) Site 752, located on the west flank of Broken Ridge (30° 53.475ˈS/93° 34.652ˈE), represents a key location to study how the above-mentioned processes may have affected the surface currents in the eastern sector of the subtropical IO during the Middle to Late Miocene.

In order to ascertain changes in the surface ocean conditions and their connection to surface currents dynamics between 7.31 and 16.06 Ma, we evaluated the overall changes in the calcareous nannofossil assemblage at Site 752. For this purpose, we performed a quantitative study on 122 calcareous nannofossil samples (with a temporal resolution of ~60 kyr) and performed statistical analyses to observe variations in the assemblage composition. The UPGMA (Bray-Curtis) clustering ordination analyses revealed a total of 5 clusters (Cluster 1-5), defined at a cut-off distance of ~0.76 and a cophenetic correlation coefficient of 0.75. Additionally, Cluster 5 was divided into two sub-clusters (Cluster 5a-5b), at a cut-off distance of ~0.77.

Cluster 1 indicates high nutrient availability due to the abundance of Reticulofenestra minuta. Cluster 2 also indicates high nutrient supply in the region, as per the high abundance of R. minuta, differing from Cluster 1 by the presence of Calcidiscus leptoporus and Coccolithus pelagicus, both indicative of cold surface waters with a deep mixed layer. Cluster 3 is characterised by the concomitant presence of species typical of warm/cold stratified/mixed regions, such as Discoaster spp., C. pelagicus and R. pseudoumbilicus. Cluster 4 is dominated by Reticulofenestra haqii and Reticulofenestra producta, which thrive in warm and oligo/mesotrophic conditions. Reticulofenestra producta is also abundant in Cluster 5a. However, the high abundances of Reticulofenestra perplexa and R. pseudoumbilicus indicate more moderate nutrient conditions with relatively cold surface waters compared to Clusters 1 to 4. Lastly, Cluster 5b is characterised by an increase in the abundance of R. pseudoumbilicus and the common presence of R. haqii, indicating warmer surface water conditions compared with Cluster 5a.

Temporal progression from Cluster 4 to Cluster 2 over our study interval reflects a distinct shift to higher nutrient palaeoceanographic conditions at the Broken Ridge between 15–8 Ma. This change in surface water nutrient availability can be linked to an invigoration of the Antarctic Circumpolar Current and the Southern Indian Ocean Current at ODP Site 752. These shifts indicate the impact of the Middle to Late Miocene northward migration of the Westerlies (from 40 to 30º S) on mid-latitude paleoceanographic conditions and confirm the proposed shift in global nutrient cycling around 11 Ma ago.

How to cite: Puentes Jorge, X., V. Del Gaudio, A., E. Piller, W., De Vleeschower, D., Hechemer, T., Lyu, J., and Auer, G.: South eastern Indian Ocean (ODP Site 752) paleoceanographic conditions during the Middle to Late Miocene based on calcareous nannofossils assemblages, EGU General Assembly 2025, Vienna, Austria, 27 Apr–2 May 2025, EGU25-10620, https://doi.org/10.5194/egusphere-egu25-10620, 2025.

EGU25-10717 | Orals | SSP4.1

Coccolithophore calcite production from nannofossil records  

Alba González-Lanchas, Baumann Karl-Heinz, Stoll Heather M., Flores José-Abel, Fuertes Miguel Angel, and Rickaby Rosalind E.M.

The production, export and accumulation of calcite (CaCO3) are key components of the marine carbon system and the global carbon cycle. Coccolithophores are responsible for ~20-80% of the open ocean CaCO3 production. Over geological timescales, their activity significantly influences the global carbon cycle, impacting long-term climate evolution. Despite the critical importance of this group, an integrated understanding of the environmental factors that control their CaCO3 production remains incomplete. This uncertainty arises from difficulties extrapolating laboratory-based findings to natural settings and challenges interpreting fossil records. We present new profiles of the distribution of key coccolithophore species and groups in the modern Atlantic Ocean alongside detailed morphometric analyses at the individual coccolith level. Applying a suite of advanced micropaleontological and morphometric techniques on well-preserved surface sediment materials, we explore different pathways for reconstructing coccolithophore physiology and CaCO3 production from nannofossil records. This research provides new insights into the dominant environmental controls over coccolithophore CaCO3 production in response to natural oceanic forcing. Relationships between coccolithophore assemblage structure, group-specific physiology, morphometric variability and CaCO3 production with the environment contribute to the understanding of the role of coccolithophores in the marine carbon cycle and provide a basis for a novel application of nannofossil assemblages for the reconstruction of past oceanic physicochemical conditions.

How to cite: González-Lanchas, A., Karl-Heinz, B., Heather M., S., José-Abel, F., Miguel Angel, F., and Rosalind E.M., R.: Coccolithophore calcite production from nannofossil records , EGU General Assembly 2025, Vienna, Austria, 27 Apr–2 May 2025, EGU25-10717, https://doi.org/10.5194/egusphere-egu25-10717, 2025.

EGU25-10772 | ECS | Posters on site | SSP4.1

Micro X-ray CT Scanning of planktonic foraminifera tests (Globigerina bulloides) for Paleoceanographic reconstructions of ocean carbonate chemistry 

Saran Lee-Takeda, Shinya Iwasaki, Katsunori Kimoto, Naomi Harada, and IODP Expedition 395 Science Party

The carbonate ion concentration ([CO₃²⁻]) in the deep ocean is a key parameter for reconstructing ocean carbonate chemistry and understanding its role in the global carbon cycle. The dissolution of planktonic foraminiferal tests has long been used as a proxy for past deep ocean [CO₃²⁻] variability (Lohmann, 1995; Broecker and Clark, 2001a,b, 2003). However, traditional dissolution proxies, such as size-normalized weight (SNW), have inherent limitations in quantitatively constraining past fluctuations in deep-sea carbonate chemistry. For instance, fossil tests are often filled with sediments, making it difficult to clean them without damaging the original shell. Additionally, the initial size-normalized weight (SNW) values are influenced by ambient environmental conditions (such as the surface water [CO₃²⁻]) during calcification (Barker and Elderfield, 2002; Broecker and Clark, 2004).

  To address these limitations, a new quantitative approach has been developed to reconstruct bottom water saturation with respect to calcite (Δ[CO₃²⁻]) using micro X-ray computed tomography (MXCT) to separately evaluate the density of the test surface and interior. This method has been employed to reconstruct ocean carbon storage during the Last Glacial Period (Iwasaki et al., 2022). Δ[CO₃²⁻] represents the difference between the carbonate ion concentration at saturation and the in situ carbonate ion concentration, providing an effective method for reconstructing past carbonate ion levels. This technique enables high-resolution, non-destructive three-dimensional analysis of foraminiferal test microstructures, offering more precise constraints on past ocean carbonate chemistry (Iwasaki et al., 2023; Kimoto et al., 2023).

  In this study, we applied MXCT technology at the Japan Agency for Marine-Earth Science and Technology (JAMSTEC) to investigate foraminiferal test dissolution patterns in the North Atlantic on orbital timescales. We constructed three-dimensional models of Globigerina bulloides to examine its dissolution processes from the Pliocene to the Pleistocene. Previous dissolution experiments have shown that the inner calcite of G. bulloides dissolves selectively, and dissolution intensity can be evaluated using CT histogram patterns (Iwasaki et al., 2015). Our research results are consistent with previous studies showing that as shell dissolution progresses, the shape of the CT value histogram shifts toward a bimodal distribution. These findings contribute to improving alternative dissolution-based proxies and enhancing our understanding of the oceanic carbonate system’s response to climatic and oceanographic changes.

How to cite: Lee-Takeda, S., Iwasaki, S., Kimoto, K., Harada, N., and 395 Science Party, I. E.: Micro X-ray CT Scanning of planktonic foraminifera tests (Globigerina bulloides) for Paleoceanographic reconstructions of ocean carbonate chemistry, EGU General Assembly 2025, Vienna, Austria, 27 Apr–2 May 2025, EGU25-10772, https://doi.org/10.5194/egusphere-egu25-10772, 2025.

EGU25-11038 | ECS | Orals | SSP4.1

Benthic foraminiferal assemblage response to the Early-Middle Pleistocene sea-level variations in the south-eastern Indian Ocean 

Anna Arrigoni, Werner E. Piller, Briony Mamo, Benjamin Petrick, and Gerald Auer

One of the most studied and debated time intervals in our planet‘s recent climate history is the Early-Middle-Pleistocene Transition (EMPT). It represents a significant reorganization in the global climate system between 1.2-0.7 Ma, without any considerable variation in the orbital parameters controlling Earth’s insolation. This climate rearrangement is exemplified by a strengthening of ice ages and a switch in the periodicity of the glacial/interglacial changes from 41 kyr to a quasi-100 kyr cyclicity. The causes of the onset of this global climatic transition remain unclear, and its impact on equatorial to mid-latitude shelf areas is, to date, scarcely investigated.

IODP Site U1460 (27°22.4949′S, 112°55.4296′E; 214.5 mbsl) is located in the south-eastern Indian Ocean, on the uppermost slope of the Carnarvon Ramp. The study area is of particular interest, as it allowed the recovery of an expanded EMPT section and appears to have never been exposed to sub-aerial conditions during the sea-level lowstands during the glacial phases. Therefore, it is well-suited to assess the sensitivity of the western Australian carbonatic platform at high resolution to the EMPT sea level fluctuations.

The studied sedimentary sequence represents a time interval between 639.91 and 1092.34 ka, from marine isotope stage (MIS) 16 to MIS 32. For this period, we reconstructed the plankton/benthos (P/B) ratio to qualitatively establish the eustatic fluctuations in the region, as highstand and lowstand stages correspond to higher and lower values of the P/B ratio, respectively.

The P/B ratio has been coupled with a benthic foraminiferal assemblage study to ascertain the ecological variations in the area and their link to the glacial-interglacial-induced sea level oscillations. Benthic foraminiferal assemblages revealed a polyspecific and highly diversified assemblage. Specifically, within the studied interval, we recorded more than 318 species, most of which are represented by <1% abundance. Preliminary data allowed to distinguish a first part of the record (MIS 27-23) dominated by Cibicidoides spp., Heterolepa spp., Trifarina bradyi, and nodosarids, from the most recent interval (MIS 22-16), which recorded abundant agglutinated tests (e.g., Gaudryina spp., Textularia spp., Spirotextularia spp.), Cibicidoides spp., Heterolepa spp., Siphogenerina spp., uvigerinids and bolivinids. Other common taxa are Lenticulina spp., Nuttallides umbonifer, cassidulinids and lagenids.

Benthic assemblage analysis revealed that diversity remains high throughout the record (average Shannon H´ = 4.24) but tends to decrease during interglacial intervals (average Shannon H´ = 4.001). Such a diversity decrease supports the persistence of warmer, more tropical conditions during interglacials at the study Site. Agglutinated tests’ abundance increases towards the most recent part of the record, but no significant changes in their abundance are noticeable at the glacial-interglacial turns. Conversely, the increase of dominance during the interglacial phases (MIS 17, MIS 19 and MIS 21) in the youngest part of the record seems to be linked to an increase in the uvigerinids abundance and a concomitant decrease in Cibicides/Cibicidoides abundance. The oldest part of the record (between 1092.34-755.59 ka) registered an important decline in the number of uvigerinids and a contemporary increase in the abundance of Trifarina bradyi and cassidulinids.

How to cite: Arrigoni, A., Piller, W. E., Mamo, B., Petrick, B., and Auer, G.: Benthic foraminiferal assemblage response to the Early-Middle Pleistocene sea-level variations in the south-eastern Indian Ocean, EGU General Assembly 2025, Vienna, Austria, 27 Apr–2 May 2025, EGU25-11038, https://doi.org/10.5194/egusphere-egu25-11038, 2025.

EGU25-11634 | Orals | SSP4.1

The Laboratory of Historical Geology and Biogeosciences (National and Kapodistrian University of Athens) Micropaleontology collection: a first glance 

Maria Triantaphyllou, Vasiliki-Grigoria Dimou, Elisavet Skampa, Katerina Kouli, Theodora Tsourou, George Kontakiotis, Eva Besiou, Margarita Dimiza, Elizabeth Stathopoulou, Hara Drinia, and Assimina Antonarakou

 
The curation of Micropaleontology collection at the Laboratory of Historical Geology and Biogeosciences (HG-BioGeoSci), National and Kapodistrian University of Athens (NKUA), undergoes the auspices of the newly introduced MSc programme in Industrial and Environmental Applications in Micropaleontology (IdEA-M, https://idea-m.com/) at the Department of Geology and Geoenvironment. Originated as ‘Laboratory of Geology and Paleontology’ in 1906, HG-BioGeoSci incorporated micropaleontological collections mainly since the mid ’70s, when Professor Michael D. Dermitzakis established Micropaleontology as an educational discipline in the Greek academic domain. The scope of this project is to create a free access database of all micropaleontological objects stored in the HG-BioGeoSci, not only for educational purposes but also benefiting all interested parties to visit and study the collections. The Micropaleontology collection comprises the main microfossil groups/proxies (nannofossils and coccolithophores, foraminifera, pollen, dinoflagellates and other palynomorphs, ostracods, siliceous microfossils etc.), dated from the Paleozoic to the present day. In terms of geographic distribution, the majority of the micropaleontological items comes from the Greek territory and the broader Mediterranean area as also other locations worldwide, including samples collected by the global deep-sea drilling programs (DSDP, ODP, IODP, ICDP). The material mostly refers to microscope slides, isolated specimens or species assemblages, thin sections, mounted SEM stubs and filtered water samples. Except from the microfossil content, the raw material comprising rock samples, marine and terrestrial core records, surface sediments, sediment traps, as well as sample residues is also documented in a digital database. The database displays a 2 level classification where all different types of microfossils are documented, labeled with a unique Laboratory code and linked to all available data, i.e., lithology/material type, sampling date and methods, preparation date and analysis techniques, biozone/ biostratigraphic assignment, applied biozonal scheme, age, paleoenvironment type, owner, analyst, references list, repository and notes (e.g., field notes, photos, original drawings, derived publications etc.).
Up to now, more than 8.000 calcareous nannoplankton preparations have been entered associated with more than 20.000 entries of sample residues and raw samples, while it is estimated that the total amount of the Micropaleontology collection at HG-BioGeoSci will exceed 130.000 entities.

How to cite: Triantaphyllou, M., Dimou, V.-G., Skampa, E., Kouli, K., Tsourou, T., Kontakiotis, G., Besiou, E., Dimiza, M., Stathopoulou, E., Drinia, H., and Antonarakou, A.: The Laboratory of Historical Geology and Biogeosciences (National and Kapodistrian University of Athens) Micropaleontology collection: a first glance, EGU General Assembly 2025, Vienna, Austria, 27 Apr–2 May 2025, EGU25-11634, https://doi.org/10.5194/egusphere-egu25-11634, 2025.

EGU25-12328 | Orals | SSP4.1

Phytoplankton Communities across the Eocene-Oligocene Transition: A Paleo-Atlantic Meridional Transect 

Jorijntje Henderiks, Manuela Bordiga, and Steve M. Bohaty

Marine phytoplankton play a fundamental role in marine ecosystems and are sensitive to changes in ocean temperature and associated ocean properties (such as dissolved CO2 and nutrient availability). Fossil time series recovered from the deep-sea are unique archives of the long-term adaptation and evolution of marine algae with mineralized parts, such as coccolithophores and diatoms. For example, ample evidence exists for long-term compositional overturn and extinctions in marine plankton communities across the Eocene Oligocene transition (EOT; ~34.5-33.7 Ma), when a globally warm and largely ice-free climate shifted to an overall cooler state with major ice sheets on Antarctica. Early studies already highlighted how coccolithophore species compositions and their latitudinal contrasts drastically changed from the late Eocene to the early Oligocene. Here, we revisit these meridional gradients in species composition across a north-south transect in the Atlantic and Southern Ocean, in order to detail the cell size distribution of ancient coccolithophores and to determine the timing of phytoplankton community shifts on a common age scale. Calcareous nannofossil census counts confirm the existence of distinct regional signatures and ecological gradients between sites. Coccolithophore communities in the Southern Ocean stood out with lowest species richness and largest cells, whereas the Atlantic sites hosted more species with smaller cells. A decrease in mean cell size across the EOT was most pronounced in the Southern Ocean, where communities became dominated by medium-sized Reticulofenestra daviesii during the early Oligocene. In the Atlantic, phylogenetically related taxa (small Reticulofenestra spp. and Cyclicargolithus floridanus) increased in prominence in the cooler and glaciated world. The compositional changes and decrease in mean cell size of common taxa are consistent with increased cellular growth rates, major changes in the mixed layer depth and (seasonally) increased nutrient entrainment into the upper photic zone. This is supported by regional gradients in δ13C between surface- and deep-sea carbonates (indicating alleviation of nutrient-limitation) and abrupt increases in siliceous microfossils in the Southern Ocean and equatorial Atlantic sedimentary archives, although the latter may relate to changes in seafloor preservation of silica because of changes in deep water mass properties.

How to cite: Henderiks, J., Bordiga, M., and Bohaty, S. M.: Phytoplankton Communities across the Eocene-Oligocene Transition: A Paleo-Atlantic Meridional Transect, EGU General Assembly 2025, Vienna, Austria, 27 Apr–2 May 2025, EGU25-12328, https://doi.org/10.5194/egusphere-egu25-12328, 2025.

During the Cenomanian, one of the largest transgressions took place in the southern Tethys, where huge sequences of calcareous sediments were deposited on a wide platform. In Israel, the Cretaceous Judea Group is the most lithologically diverse and least studied in terms of the calcareous nannofossils. Three sections of the Kefar Shaul Fm. in the Judea Mts and CT2 borehole in Mt Carmel area were selected for the palaeocological reconstruction of the Albian-Cenomanian basin.

The 237.6 m deep borehole CT2 (32.7°N 34.98°E) penetrates the Yagur (dolomite), Isfiye (dolomitised chalk), Tavasim Tuff and Arqan (micritic carbonates, chalk) formations, which have been probed at 2 m intervals, with 97 samples for palaeoecological analysis. The Kefar Shaul sections (31°44'42"N 35°08'13"E; 31°45'12"N 35°07'16"E; 31°35'23"N 35°23'56"E) are represented by soft light yellowish very clayey marls and argillaceous limestones (~30 m); 40 samples for biostratigraphic and palaeoecological analysis have been taken at 0.3–1 m intervals.

The entire succession of borehole CT2 belongs to (sub)zones NC9b, UC0a–b (all Upper Albian), UC0c (Upper Albian – Lower Cenomanian), UC1, UC2 (Lower Cenomanian), and UC3 (Middle – Upper Cenomanian).

In the combined Kefar Shaul section of the Jerusalem Area, Subzone UC3d (Upper Cenomanian), undivided interval of Subzone UC3e – Zone UC4 (Upper Cenomanian) and Subzone UC5a (Upper Cenomanian) are recognized.

The quantitative analysis of nannofossils suggests that the general dominance of Watznaueria spp. throughout the whole successions in the Carmel and Jerusalem areas points to quite warm, open marine or coastal, generally oligotrophic conditions. Due to poor nutrient supply, the productivity of the calcareous nannoplankton was quite low. Low values of the Shannon index, Evenness and Species richness can be interpreted as reflecting unstable environment.

In the Carmel area, the Upper Albian Isfiye Fm. accumulated under temperate, oligotrophic conditions. The lower part of the Arqan Fm. (Upper Albian) was deposited under temperate climate but mesotrophic conditions. The higher (Lower Cenomanian) part of the Arqan Fm. was deposited in oligotrophic waters and relatively warm climate. The uppermost (Middle–Upper Cenomanian) part of the Arqan Fm. was accumulated during a progressively cooling period, yet characterized by alternating warming and cooling phases and oligotrophic conditions.

In borehole CT2, the Oceanic Anoxic Event 1d is recorded in the Isfiye Fm. and Middle Cenomanian Event I is detected in the Arqan Fm.; both datums corroborate well with the globally recorded carbon isotopic anomalies. The oxygen isotope analysis suggests temperate (~26°C) conditions during the Late Albian–Early Cenomanian followed by warming in the late Early Cenomanian, with temperatures gradually increasing to ~32°C towards the Middle Cenomanian.

The Kefar Shaul Fm. corresponds to the upper part (Middle–Upper Cenomanian) of the Arqan Fm. in the Carmel area and reflects oligotrophic conditions with mesotrophic phases, during a progressively warming period with episodes of cooling. The oxygen isotope data indicate approximate temperatures of 29–33℃ for the Late Cenomanian. The Kefar Shaul Fm. probably represents the deepest open marine facies of the Judea Group.

The project is supported by the Israel Ministry of National Infrastructure.

How to cite: Ovechkina, M.: Calcareous nannofossils and stable isotopes as proxies for understanding paleoenvironmental evolution of the Levant Basin during the Albian–Cenomanian, EGU General Assembly 2025, Vienna, Austria, 27 Apr–2 May 2025, EGU25-12449, https://doi.org/10.5194/egusphere-egu25-12449, 2025.

EGU25-14574 | ECS | Posters on site | SSP4.1

Linking foraminiferal distribution to coastal dynamics in Singapore 

Yu Ting Yan, Stephen Chua, Abang Nugraha, Isaac Lai, Koi Siek, Benjamin Horton, and Adam Switzer

Singapore is a highly urbanized country, where much of its natural coastline has been modified to protect against erosion and rising sea levels. While coastal developments play a crucial role to safeguard against sea level changes, they can significantly affect the coastal dynamics and ecological health of the coastal environments. To assess and monitor the impact of urbanization and environmental changes on these coastal systems, foraminifera serve as valuable environmental indicators. Here, we collected 20 surface sediment samples over a year period from five study sites of Singapore and Johor Straits to characterise the foraminiferal assemblages and sediment composition of different coastal environments (e.g., highly engineered coastlines, sandy beach). Foraminiferal assemblages show strong relationship with sediment type and organic content. In the Johor Strait, where sediments are predominantly muddy with higher organic content, there is a low diversity assemblage dominated by agglutinated taxa (e.g., Ammobaculites sp.). Conversely in the Singapore Strait, where sediments are generally coarser with lower organic content, there is a high diversity assemblage dominated by calcareous taxa (e.g., Elphidium sp.). This study presents important baseline data to understand the coastal dynamics and for environmental monitoring in Singapore, and therefore, help provide a framework for interpreting past coastal and climatic changes and inform coastal management decisions in the face of urbanization and warming climate.

How to cite: Yan, Y. T., Chua, S., Nugraha, A., Lai, I., Siek, K., Horton, B., and Switzer, A.: Linking foraminiferal distribution to coastal dynamics in Singapore, EGU General Assembly 2025, Vienna, Austria, 27 Apr–2 May 2025, EGU25-14574, https://doi.org/10.5194/egusphere-egu25-14574, 2025.

EGU25-14824 | ECS | Posters on site | SSP4.1

Holocene climate fluctuations and vegetation dynamics in northeastern Taiwan reconstructed through pollen analysis from Shenmihu Lake 

Xin-An Chen, Ludvig Löwemark, and Liang-Chi Wang

Shenmihu is a lake in northeastern Taiwan at an elevation of approximately 1100 meters, marking the boundary between broadleaf and coniferous forests. Pasania currently dominates the surrounding vegetation. This study aims to reconstruct environmental changes in the Shenmihu catchment over the past 10000 years during the Holocene through pollen analysis. Because plants produce pollen, which is often preserved in sediments, pollen analysis is a crucial proxy for investigating how vegetation distributions have responded to shifts in climate and human agricultural activities.

The results show that, although Pasania generally dominates the region, Alnus populations increased between 4900 and 900 cal BP, becoming the main species from 3500 to 1400 cal BP. This shift was likely driven by cooler climates and significant disturbances, such as typhoons that triggered landslides. These findings underscore the importance of climate fluctuations and extreme weather events in shaping local vegetation over time. Additionally, human agricultural activities likely played a role in altering plant communities, illustrating the complex interplay between natural and anthropogenic factors.

To understand broader regional trends, pollen data from Shenmihu were compared with records from Cuifeng Lake and Retreat Lake, both located in northeastern Taiwan. Through this comparative approach, the study aims to document past climate fluctuations in northeastern Taiwan and assess how vegetation distribution evolved throughout the Holocene.

How to cite: Chen, X.-A., Löwemark, L., and Wang, L.-C.: Holocene climate fluctuations and vegetation dynamics in northeastern Taiwan reconstructed through pollen analysis from Shenmihu Lake, EGU General Assembly 2025, Vienna, Austria, 27 Apr–2 May 2025, EGU25-14824, https://doi.org/10.5194/egusphere-egu25-14824, 2025.

EGU25-15159 | ECS | Posters on site | SSP4.1

Benthic foraminifera as paleoceanographic tracers in the southeastern Indian Ocean during the Middle to Late Miocene: New insights from ODP Site 752 

Tamara Hechemer, Werner E. Piller, Xabier Puentes-Jorge, Christoph Hauzenberger, Jassin Petersen, Patrick Grunert, Arianna V. Del Gaudio, David De Vleeschouwer, Or M. Bialik, Anna Joy Drury, Beth Christensen, Jing Lyu, and Gerald Auer

The Miocene Climatic Optimum (MCO) represents a climate period characterized by lower ice volumes and temperatures that were 3-4°C warmer than today. Indian Ocean Sub-Antarctic Mode Water (SAMW) is primarily formed south of 30°S and is the main return path for deep waters to the surface, migrating and intermixing northwards at Intermediate Water (IW) depths. The modern SAMW transports nutrients into the lower latitudes, strongly impacting mid- and low latitude productivity. During warmer climates, decreasing sea ice may increase nutrient trapping in the Southern Ocean, reducing the nutrient flux through SAMW into the lower latitudes. To better understand trajectories of nutrient fluxes in future climate change scenarios studies in past warm climate analogues of the near future – such as the MCO – are necessary. Thus, we use Ocean Drilling Project (ODP) Site 752, located on Broken Ridge in the southeastern Indian Ocean at a water depth of 1086.3 m, as a key location for understanding changes in IW conditions.                                               

This study aims to reconstruct paleoenvironmental conditions and bottom-water oxygenation at ODP Site 752 during the Middle to Late Miocene (15-8 Ma) using benthic foraminifera assemblages as a proxy for bottom-water-oxygenation and the enhanced Benthic Foraminifera Oxygen Index (eBFOI) for calculating dissolved oxygen content. We combine these assemblage data with Mg/Ca ratios of Cibicidoides wuellerstorfi and Cibicidoides mundulus as a proxy for bottom water temperatures (BWT). For reconstructing sea surface temperatures (SST), and temperatures from the open ocean thermocline, the Mg/Ca data were additionally gathered on the foraminifera species Globigerina bulloides (SST) and Globorotalia menardii (thermocline). We aim to analyze temperature variability through the water column to investigate influxes from cooler water bodies by increasing SAMW intensity and compare our new temperature data with our benthic foraminiferal assemblages. Therefore, we  provide novel insights into Late Miocene IW circulation changes and deep water mass variation with the progressive northward shift of the Subantarctic Tropical Front (SAF).

We present a high-resolution record of benthic foraminifera, tracing paleoenvironmental changes in deep water masses in addition to IW variation in the southeastern Indian Ocean. After the MCO, benthic foraminifera assemblages, and respectively the eBFOI indicate a relatively high oxic environment.  Starting around 11 Ma, we first detect an increase of dysoxic conditions and deep infaunal foraminifera, e.g. the genus Bolivina spp., with minimal variation in the dissolved oxygen content of the bottom water. Such an assemblage shift is contemporary with increased current winnowing following the northward migration of the SAF. Furthermore, the higher abundance of epiphytic species Cibicidoides wuellerstorfi and Lobatula lobatula, and also Vulvulina pennatula as an elevated epifauna, support an increase in bottom current energy at Broken Ridge from 15 to 11 Ma. Combined, our assemblages and Mg/Ca paleotemperature data suggest that the strengthening of the SAMW and Antarctic Intermediate Water formation in the Late Miocene, since about 11 Ma, resulted in notable changes in bottom water conditions at Broken Ridge, including the increase of current winnowing.

How to cite: Hechemer, T., E. Piller, W., Puentes-Jorge, X., Hauzenberger, C., Petersen, J., Grunert, P., V. Del Gaudio, A., De Vleeschouwer, D., M. Bialik, O., Drury, A. J., Christensen, B., Lyu, J., and Auer, G.: Benthic foraminifera as paleoceanographic tracers in the southeastern Indian Ocean during the Middle to Late Miocene: New insights from ODP Site 752, EGU General Assembly 2025, Vienna, Austria, 27 Apr–2 May 2025, EGU25-15159, https://doi.org/10.5194/egusphere-egu25-15159, 2025.

EGU25-15553 | ECS | Orals | SSP4.1

A Late Miocene paleobotanical record from the Peruvian Pisco Formation 

Diana Ochoa, Juan-Felipe Montenegro, Rodolfo Salas-Gismondi, Matthieu Carre, and Jose-Abel Flores

Coastal xeric ecosystems face a major threat under the current global warming trend. Changes in water availability and precipitation patterns can contribute to the development of new landscapes and affect existing biotic interactions. The late Miocene, characterized by warm climates and comparable pCO2 values (∼400 ppm), presents an opportunity to understand future warming scenarios for dry coastal ecosystems. In this study, we present the first-known late Miocene paleobotanical record from the Peruvian coast (15ºS), where a non-vegetated desert is found today. Recalibrated leaf-based precipitation estimates indicate that coastal rainfall values were 4 times higher than today; while significant wetter conditions compared to the present existed on the western slopes during the austral summer. The combined paleobotanical record reveals a diverse community dominated by elements typical of modern dry forests rather than desert-like habitats, including a mixture of lowland and Andean wooded taxa. These findings suggest a substantial shift in the ecosystem that allowed the development of a greener woodland landscape along the central Peruvian coastal region during the warmth of the late Miocene. Although the sources of extra humidity remain uncertain, warmer sea surface temperatures in the eastern Pacific and local convection may have contributed to the additional moisture. Moreover, intensified or even a permanent El-Niño state during the warmer late Miocene could have potentially served as an additional moisture source. Regardless of the mechanism, our results provide compelling evidence of reduced aridity, leading to a greening of the coastal Peruvian desert and large-scale biome and landscape changes in response to the Miocene greenhouse climate.

How to cite: Ochoa, D., Montenegro, J.-F., Salas-Gismondi, R., Carre, M., and Flores, J.-A.: A Late Miocene paleobotanical record from the Peruvian Pisco Formation, EGU General Assembly 2025, Vienna, Austria, 27 Apr–2 May 2025, EGU25-15553, https://doi.org/10.5194/egusphere-egu25-15553, 2025.

The Ross Sea is a globally significant annual atmospheric CO2 sink and hosts the largest phytoplankton bloom. It is characterized by a shallow carbonate compensation depth (CCD) and crucial water mass transformations. This study investigates the distribution of calcareous foraminifera and microtektites to evaluate carbonate preservation in surface sediments approximately 0.8 million years old.

In the western Ross Sea (WRS), pale-yellow microtektites originating from northern Victoria Land are distributed along the pathway of cold shelf water (SW), influenced by terrestrial input from the Victoria Land shelf. Calcareous benthic and pelagic foraminifera dominate in the central and eastern Ross Sea (CRS and ERS), following the pathways of warm Modified Circumpolar Deep Water (MCDW) and/or Circumpolar Deep Water (CDW). Surface sediments in these regions contain few diatoms and a higher proportion of >125 μm sediment fractions.

In the CRS, foraminiferal assemblages are dominated by Trifarina earlandi, with common occurrences of Ehrenbergina glabra, Globocassidulina biora, and Cibicides spp., along with abundant Neogloboquadrina pachyderma. In the ERS, G. biora dominates, accompanied by E. glabra and N. pachyderma. The Ross Sea’s shallow CCD, ranging from 350–400 m to 500–550 m, coexists with calcareous foraminiferal assemblages in sediments at depths of 400–600 m, suggesting that CCD depth is not the primary factor governing carbonate preservation.

The distribution of calcareous foraminifera aligns with water current pathways, highlighting water temperature as the key determinant of their survival. The temperature of MCDW, modulated by mixing with cold SW, plays a critical role in carbonate preservation.

How to cite: Wang, X.: Interactions Between Water Masses and Carbonate Preservation in the Ross Sea: Evidence from Foraminiferal and Microtektite Distribution, EGU General Assembly 2025, Vienna, Austria, 27 Apr–2 May 2025, EGU25-15615, https://doi.org/10.5194/egusphere-egu25-15615, 2025.

EGU25-16502 | Orals | SSP4.1

East China Sea climate and Kuroshio variability since the Last Glacial Maximum 

Stephen Obrochta, Yoshiya Hatakeyama, Sochichiro Oda, Soma Sato, Anjalia Wardani, Rizkysafira Ishendriati, Seira Izawa, Yuri Miyakoshi, Takahiro Inanobe, Yuto Kujiraoka, Yoshimi Kubota, Takuya Sagawa, Hideko Takayanagi, Yusuke Yokoyama, and Yosuke Miyairi

The Kuroshio is crucial in transporting heat and materials poleward. Its variability interacts with the global climate system and affects local and regional climates. However, long-term Kuroshio variability remains poorly understood, especially during the last glacial time. Here, we use a depth sediment cores recovered from the northern Okinawa Trough to investigate past Kuroshio variability. Radiocarbon results indicate that the recovered cores range in age from modern to ~50 ka. Bottom water temperature on the eastern edge of the trough at a relatively shallow site (~300 mbsl) was stable during the past 12 ka, with little increase during the Holocene. We estimate that this site experience ~60 m sea level rise. Based on World Ocean Atlas data for the site, an increase in depth of 60 m corresponds roughly to a 2˚C temperature decrease. Thus, Holocene warming was likely offset by rising sea level. The results further suggest that the vertical temperature gradient and thus the temperature structure was similar at 12 ka to the late Holocene, probably related to the existence of the Kuroshio main axis since that time.

How to cite: Obrochta, S., Hatakeyama, Y., Oda, S., Sato, S., Wardani, A., Ishendriati, R., Izawa, S., Miyakoshi, Y., Inanobe, T., Kujiraoka, Y., Kubota, Y., Sagawa, T., Takayanagi, H., Yokoyama, Y., and Miyairi, Y.: East China Sea climate and Kuroshio variability since the Last Glacial Maximum, EGU General Assembly 2025, Vienna, Austria, 27 Apr–2 May 2025, EGU25-16502, https://doi.org/10.5194/egusphere-egu25-16502, 2025.

The Fergana Basin, one of the largest depressions in Central Asia, is situated within the intermountain range of the southwestern Tien Shan. The final stage of marine sedimentation in the basin, represented by middle Eocene layers, marks the onset of the Asian aridification. This shift in paleoenvironmental conditions coincided with significant global changes, including the restriction of the Peri-Tethys, the isolation of Asian realms, and alterations in oceanographic and climatic systems. Microfossil assemblages provide important information about changes in the palaeoenvironment. Despite the abundance and importance of foraminifera and ostracods in the Fergana Basin, the paleoenvironmental conditions, species diversity, and paleobiogeography remain poorly understood, largely due to the outdated literature, most of which is in Russian. The present study focuses on foraminiferal and ostracod assemblages to gain new insights into environmental changes within the Fergana Basin and its connections to other marine basins during the middle Eocene. The material analyzed in this study comprises foraminifera and ostracods collected from the Sauk-Tanga section (40° 2'50.82"N, 70°15'42.70"E) and the Chamangul section (40° 1'50.34"N, 70°26'7.82"E), both located in the southern part of the Fergana Basin. The study site is located within the Madygen Geopark in the Batken Region of Kyrgyzstan, and the sections comprise an expanded middle Eocene clay sequence.

A total of 17 foraminiferal species and 11 ostracod species were identified. The foraminiferal community is characterized by three distinct assemblages: one dominated by Cribroelphidium, one comprising a combination of Ammonia, Cribroelphidium, and Nonion, and another dominated solely by Nonion. A comprehensive analysis of the micropaleontological assemblages indicates that conditions were shallow and fully marine during the Middle Eocene epoch. The environmental conditions are marked by elevated oxygen levels within the water column, extending from the intertidal zone to the high subtidal regions, in contrast to the low oxygen conditions prevalent within the sediments. The microfauna recovered is comparable to faunal communities in Europe and western Siberia, as well as neighboring regions such as the Tajik and Tarim basins. However, it differs significantly from the microfauna of the Turan Basin. The findings indicate that the Fergana Basin functioned as a transitional zone between the western Peri-Tethys and the easternmost realms, contradicting previous hypothesis that it merely served as a gulf. This novel perspective contributes to a more comprehensive understanding of the region's paleogeography and its significance in broader paleoenvironmental changes.

How to cite: Trubin, Y., Winkler, A., and Langer, M.: Paleoenvironmental reconstruction and transitional role of the Fergana Sea (Central Asia) during the middle Eocene through the lens of Micropaleontology, EGU General Assembly 2025, Vienna, Austria, 27 Apr–2 May 2025, EGU25-17334, https://doi.org/10.5194/egusphere-egu25-17334, 2025.

EGU25-17546 | ECS | Posters on site | SSP4.1

Orbitally driven nannoplankton evidence of surface ocean cooling and productivity in the Late Cretaceous greenhouse world  

Deborah Tangunan, Paul R. Bown, Andrew S. Gale, Maria Rose Petrizzo, James D. Witts, and Richard J. Twitchett

The Mid-Cenomanian Event (MCE) was a period of significant climatic and oceanographic perturbation, marked by a global carbon isotope excursion (CIE) and ecological shifts in marine systems. Current evidence from macrofauna and neodymium isotopes highlights increased Boreal influences in northwest European epicontinental seas during this interval. Here we use calcareous nannoplankton from the Lydden Spout section (Dover, east Kent, United Kingdom) to reconstruct the surface water conditions and evaluate their response to MCE. We found a notable increase in the high productivity taxa Biscutum constans and small Zeugrhabdotus spp., coinciding with the double-peaked CIE that characterises the MCE. The most significant changes in the productivity and stratification indices also occur at these CIE levels, suggesting enhanced nutrient availability, possibly driven by intensified upwelling or terrestrial nutrient runoff. A relative decline in the generalist taxon Watznaureia barnesiae underscores reduced water column stratification. This change in surface water nutrient dynamics and stratification is also evident in planktonic foraminifera, which show the disappearance of thermocline-dwelling oligotrophic rotaliporids for the duration of the CIE and emergence of meso-eutrophic taxa (Petrizzo and Gale, 2023).

The nannofossil temperature indices indicate transient warming maxima immediately preceding and midway through the MCE (between the two CIE peaks), a short cooling interval just above the MCE onset and a step down to cooler conditions from the upper MCE.  The cold-water species Repagulum parvidentatum increased to higher levels and then peak values coincident with the two CIE maxima, and a second cold water/high latitude specialist, Seribiscutum primitivum has a consistent first appearance coincident with the lower CIE peak and persists until just after the event termination. This surface water cooling is also indicated by bulk sediment δ¹⁸O records showing episodes of cooler sea surface temperatures (SSTs; Petrizzo and Gale, 2023), which coincide with precession-paced high-amplitude cooling cycles during the low to mid-MCE. Additionally, the occurrences of Boreal-affiliated macrofossil taxa, such as the belemnite Praectinocamax and the bivalves Chlamys arlesiensis and Oxytoma seminudum, are interpreted as marking the incursion of cooler Boreal waters into the proto-Atlantic during this interval (Gale and Kennedy, 2022).

Our analysis suggests that orbital forcing, and particularly precession and eccentricity cycles, played a significant role in modulating climatic and oceanographic conditions during the MCE. Orbital forcing, particularly 100 kyr and 405 kyr eccentricity cycles, modulated carbon cycle, climatic, and ecological changes, with precession-driven variations influencing terrigenous input and productivity. The interplay between orbital forcing and nannoplankton diversity further supports the influence of orbital pacing on the carbon cycle. The 405 kyr eccentricity maxima correspond with minima in nannoplankton diversity and communities indicative of cooler SSTs and higher productivity.  This suggests that eccentricity maxima were associated with enhanced nutrient availability, fostering increased primary productivity and communities dominated by fewer opportunistic taxa, resulting in lower overall diversity. These findings highlight the complexity of climatic and oceanographic dynamics during the MCE, revealing transient cooling episodes that disrupt the predominantly warm conditions of the Cenomanian.

How to cite: Tangunan, D., Bown, P. R., Gale, A. S., Petrizzo, M. R., Witts, J. D., and Twitchett, R. J.: Orbitally driven nannoplankton evidence of surface ocean cooling and productivity in the Late Cretaceous greenhouse world , EGU General Assembly 2025, Vienna, Austria, 27 Apr–2 May 2025, EGU25-17546, https://doi.org/10.5194/egusphere-egu25-17546, 2025.

EGU25-18723 | ECS | Posters on site | SSP4.1

The reversal of valve overlap in Cyprideis (Ostracoda, Crustacea) as a mechanism for sympatric speciation in the Pebas System (Miocene) of Western Amazonia  

Andres Salazar Rios, Martin Gross, Maria Belen Zamudio, and Werner E. Piller

During the Miocene, a huge (~1 million km2), long-lived (~10 myr) aquatic environment, the so-called Pebas System (Hoorn et al., 2010), existed in Western Amazonia, which is known for its highly diverse and endemic mollusk and ostracod faunas (Gross et al., 2014; Nuttall, 1990; Purper, 1979; Wesselingh, 2006). In the latter group, the asymmetrical-shelled genus Cyprideis is the most relevant, both in terms of abundance and number of endemic taxa, generating a flock of species in the Pebas System (Gross et al., 2014; Whatley et al., 1998). Although the understanding of certain aspects of this flock, such as taxonomy, has improved in recent years, the mechanisms responsible for this speciation remain elusive. In this study, we focus on a peculiar feature of the Cyprideis species flock, as about one-third of its species have a ‘reversed’ hinge and valve overlap compared to what is typical for the genus.

Several outcrops (Marañón Basin, Peru) and boreholes (Solimões Basin, Brazil) yielded abundant and well-preserved material of some little known species (Cyprideis caraionae Purper & Pinto, 1985, Cyprideis krsticae Purper & Pinto, 1985 and Cyprideis retrobispinosa Purper & Pinto, 1983) with complete ‘populations’ (males, females and juvenile stages) within the samples, allowing us to understand the variation of these species over a broad temporal span (~16-13 Ma). Our analyses demonstrate that the development of a shell reversal from previous ‘normal’ shelled Cyprideis species is an effective mechanism for reproductive isolation of the populations, and hence, of sympatric speciation in the Pebas biome.

How to cite: Salazar Rios, A., Gross, M., Zamudio, M. B., and Piller, W. E.: The reversal of valve overlap in Cyprideis (Ostracoda, Crustacea) as a mechanism for sympatric speciation in the Pebas System (Miocene) of Western Amazonia , EGU General Assembly 2025, Vienna, Austria, 27 Apr–2 May 2025, EGU25-18723, https://doi.org/10.5194/egusphere-egu25-18723, 2025.

EGU25-20071 | ECS | Posters on site | SSP4.1

Palaeoenvironment of the Sarmatian-Pannonian boundary in the Vienna Basin 

Niklas Schmied, Christopher Berndt, Martin Maslo, and Petra Heinz

Ostracods and foraminifers are often used as proxies to reconstruct paleoenvironments and their changes through time. In this study, they are utilized to give insights on the environmental transitions at the Sarmatian-Pannonian-boundary of the Vienna Basin at which various layers of accumulated ascidian spiculae were previously observed.
A drill core was taken during the expansion of the subway network in Vienna. It originates from the depth range of 38-42 meters below surface which is suggested to represent the transition from the Sarmatian to the Pannonian stages at this location. Selected 5cm segments were extracted from the core and processed. The preparation included wet sieving with 125 and 250µm mesh size. After oven-drying, the remaining sediment was split, and the microfossils were picked. Ostracods and foraminifers were identified using literature and paleoenvironmental changes were inferred based on variations in their assemblages along the core.
Preliminary results reveal distinct patterns in the assemblages of ostracods and foraminifers. At 42m below surface no ostracods and very few foraminifers are present indicating high sedimentation rates. At 40,5m below surface the identified ostracods species belong to Loxoconchidae and Leptocytheridae families and foraminifers belong to the families Elphidiidae and Miliolidae. At 38m below surface no foraminifers are present, and the ostracods belong to Candonidae families which are associated with lacustrine waters.

How to cite: Schmied, N., Berndt, C., Maslo, M., and Heinz, P.: Palaeoenvironment of the Sarmatian-Pannonian boundary in the Vienna Basin, EGU General Assembly 2025, Vienna, Austria, 27 Apr–2 May 2025, EGU25-20071, https://doi.org/10.5194/egusphere-egu25-20071, 2025.

Moyano strongly pointed out that the origins and evolutionary history of the Bryozoa both Antarctica and magellanic South America could not be understood without reference to the still  poorly known but very  extensive Paleocene and Lower Miocene  faunas of Patagonia (see Moyano, 1983.

The taxonomic studies with the extensive use of SEM of more than 110 bryozoan specimens of the Early Paleocene (Danian) and the Lower Miocene of the southern South America  (Patagonia) from the Canu’s collections (1908-1911) at the Bernardino Rivadavia Museum have revealed that cyclostomes and cheilostomes  have their taxonomical  counterparts among the late Early Eocene fauna of Seymour Island, Antarctic Peninsula (Hara, 2008). One of the example is the  anascan  microporoidean  represented by austral Aspidostoma Hincks, 1881 genus, known from the Paleogene and the Neogene strata of the triangle Antarctica-South America-Australia-New Zealand. It shows their  earliest  fossil record in the Lower Danian of Patagonia, therefore Patagonia should be  consider as an important place of origin and migration route of this genus. A rich occurrence of Aspidostoma  has been also described from the late Early Eocene, clastic sediments of the La Meseta Fm. on Seymour Island  (Hara 2001).  Other bryozoans such as umbonulomorph (lepraliellids) represented by  multilaminar, massive Celleporaria  Lamouroux, 1821  occur also in the shallow-water Roca Fm. of Patagonia and predated  the rich  occurrence of this genus from the late Early Eocene of the La Meseta Fm. (Seymour Island). Particularly important for taxonomy and closest biogeographical connection of South America-Antarctic during the Early Paleocene up to the Lower Miocene has the  common occurrence of several  globular, multilaminar cyclostomes of CerioporaReptomulticava, as well as reticulate colonies of Reticresis, branched microporidean Aspidostoma, and nodular multilaminar umbonulomorphs of Celleporaria and  Osthimosia.

Biogeographical  comparision of the southern South America  bryozan fauna  of the Early Paleocene age is interesting because  the Canu’s collections contains important  information  that some of the taxa have the earliest  fossil records in the Patagonian  shallow-water  Roca Fm., which predated  the younger New Zealand and Antarctic  bryozans ranging from the latest Paleocene- Early Eocene.

The Southern Ocean  bryozoans seems to be a product of the long period of evolution in situ, possibly streaching back to late Cretaceous, therefore the reconstruction of the Cenozoic ecosystem,  possible migration routes and  paleobiogeography  of the Weddellian Province of the southern hemisphere should be refer to the Antarctic fauna, possibly of the Createous age. 

Hara U., 2001 – Bryozoa from the Eocene of Seymour Island, Antarctic Peninsula. Palaeontologia Polonica. In: Palaeontological Results of the Polish Antarctic Expeditions, Part III, 60: 33–156.

Hara U., 2008. Biogeographical relationship of the Cenozoic South America -Antarctic  bryozoan biota: an example  of austral Aspidostoma genus in Antarctica: a Keystone in Changing  World – Online Proceedings of the 10th ISEAS, edited  by A. K. Cooper and C.R.Raymond et al. USGS open File Report 2007-xxx, Extended Abstract yyy, 1-5.

Moyano, G.H.,I., 1983. Southern Pacific  Bryozoa : a general view with emphasis on Chilian species. Gayana, Zoologia, 46, 1-45.


How to cite: Hara, U.: Biogeographical links of the South American-Antarctic bryozoan biota in Cenozoic (Early Paleocene-Miocene), EGU General Assembly 2025, Vienna, Austria, 27 Apr–2 May 2025, EGU25-20474, https://doi.org/10.5194/egusphere-egu25-20474, 2025.

EGU25-21237 | ECS | Orals | SSP4.1 | Highlight

High-latitude paleoecological response to early Eocene warming events 

Heather L. Jones, Bryan Niederbockstruck, Denise K. Kulhanek, and Ursula Röhl

As atmospheric carbon dioxide continues to rise at unprecedented rates, it is imperative that we better understand the potential long-term effects of warming on marine communities. Calcareous nannoplankton are likely particularly sensitive to the effects of rising CO2, and as one of the most important groups of mineralizing phytoplankton, their response to climatic change will have a knock-on effect on both marine food web dynamics and biogeochemical cycling.

As calcareous nannoplankton have a rich global fossil record spanning the last ~220 million years of Earth history, it is possible to examine how they were affected by high CO2 conditions in the geological past. These data can then be fed into Earth System Models, allowing for better predictions as to how modern communities might be affected by – and recover from – current global climate change. The earliest Eocene ca. 52 - 56 million years ago (Ma) is an excellent case study as to how the Earth system might respond to ‘worst-case’ climate scenarios. Additionally, as the high CO2 world of the early Eocene was punctuated by transient warming events of different magnitudes and durations, it is possible to examine potential threshold paleoecological responses to warming, as well as the recovery rates following individual events.

Here, we present new high-resolution data documenting changes in early Eocene calcareous nannoplankton community composition from two high-latitude International Ocean Discovery Program (IODP) sites (Site U1553 and Site U1514) in the historically understudied Southern Hemisphere. As well as elucidating how climatically sensitive, high-latitude communities were affected by high CO2 conditions, direct comparison of our data with published lower latitude records will reveal any ocean basin- or region-specific responses to warming.

How to cite: Jones, H. L., Niederbockstruck, B., Kulhanek, D. K., and Röhl, U.: High-latitude paleoecological response to early Eocene warming events, EGU General Assembly 2025, Vienna, Austria, 27 Apr–2 May 2025, EGU25-21237, https://doi.org/10.5194/egusphere-egu25-21237, 2025.

EGU25-229 | ECS | Posters on site | GM6.2

High-resolution mineralogical record of soil genesis and dust influx in a relict palaeosol 

Omid Bayat, Michael Plötze, Alireza Karimi, and Markus Egli

Evidence of profound climatic changes and wetter conditions during the late Quaternary are mentioned by several authors for the deserts of central Iran (e.g. Khademi and Mermut, 1999; Jalilian et al., 2022). The region today is strongly influenced by aeolian and desertification processes which are mainly attributed to human activities. To examine the role of chemical weathering (under moist conditions) and long-term dust influx (under dry conditions) on soil genesis, we studied the mineralogical composition of soil materials in a relict paleosol of an arid region of eastern Isfahan, central Iran. A high-resolution sampling strategy (10 cm interval) and qualitative and quantitative X-ray diffraction method were applied. The paleosol is located on an upper terrace with a flat surface having a gravelly structure and neither groundwater influence nor input of materials from adjust landforms. The results showed that quartz, calcite, Na-plagioclase and chlorite are dominant minerals in the clast fraction of the paleosol. The comparison of the mineralogical composition of soil materials and gravels revealed that K-feldspar, gypsum, smectite and palygorskite in the soil matrix were not inherited from the gravels but were provided by dust influx and/or pedogenesis processes. K-feldspar was absent in the gravels and was added by dust influx as its neoformation in the soil environment is unlikely. This hypothesis is supported by the exponential increase of its amount towards the soil surface and the maximum accumulation of the mineral in the surface dust-derived (vesicular) horizon. Smectite is also absent in both the clast fraction and the vesicular horizon and showed a maximum abundance in the middle and lower parts of the pedon where pedogenic calcite deposition occurred ~29 ka, suggesting a pedogenic origin of the mineral under the semiarid and seasonal climate. Palygorskite is absent in gravels but occur in the surface vesicular horizon and was relatively uniformly distributed throughout the pedon. It seems that palygorskite has both exogenic (from dust) and endogenic (by pedogenic processes) sources in the paleosol. Scanning electron microscopy (SEM) images support this postulation. SEM images exhibited dense fibers of palygorskite in the soil matrix and broken and small pieces of palygorskite in the dust-derived horizon. The investigated paleosol provided evidence of environmental changes from a semi-arid and seasonal climate during the time of smectite pedogenesis to an arid and dust deposition environment. Consequently, the palaeosol exhibited a mostly natural trend of aridification and desertification in this region during the late Quaternary.

Jalilian, T., Lak, R., Taghian A. and J. Darvishi Khatooni, 2022, Evolution of sedimentary environments and geography of the Gavkhouni Playa during the Late Quaternary, International Journal of Environmental Science and Technology, 19, 1555–1572.

Khademi, H. and A. R. Mermut, 1999, Submicroscopy and stable isotope geochemistry of carbonates and associated palygorskite in Iranian Aridisols, European Journal of Soil Science, 50 (2), 207-216.


How to cite: Bayat, O., Plötze, M., Karimi, A., and Egli, M.: High-resolution mineralogical record of soil genesis and dust influx in a relict palaeosol, EGU General Assembly 2025, Vienna, Austria, 27 Apr–2 May 2025, EGU25-229, https://doi.org/10.5194/egusphere-egu25-229, 2025.

EGU25-506 | ECS | Orals | GM6.2 | Highlight

Hydrological fluctuations in the Tarim Basin, northwest China, over the past millennium 

Kangkang Li, Xiaoguang Qin, Gill Plunkett, and David Brown

Reconstruction of hydrological fluctuations in arid regions has proven challenging due to a lack of reliable chronologic constraints on sparse geological archives. The aim of this study was to establish an independent record of hydrologic changes in the hyper-arid Tarim Basin, northwest China, with high spatiotemporal resolution. This paper presents comprehensive radiocarbon and tree-ring data sets of subfossilized medieval forest in the Tarim Basin compiled from geomorphological investigations of the palaeochannels of the Tarim River, the longest endorheic river in China, crossing the world’s second-largest shifting sand desert. This study describes the centennial-scale dynamics in the Tarim River flow over the past millennium, offering a robust long-term context for hydrological assessment in the extensive drylands of the Asian interior. Subsequently, we consider the role of the river-based hydrological fluctuations in connectivity of the ancient continental Silk Road networks.

How to cite: Li, K., Qin, X., Plunkett, G., and Brown, D.: Hydrological fluctuations in the Tarim Basin, northwest China, over the past millennium, EGU General Assembly 2025, Vienna, Austria, 27 Apr–2 May 2025, EGU25-506, https://doi.org/10.5194/egusphere-egu25-506, 2025.

EGU25-754 | ECS | Posters on site | GM6.2

Quantifying input volumes in Australia’s largest playa lake using SWOT data 

Atul Kumar Rai, Timothy J. Cohen, Moshe Armon, and Samuel K. Marx

Australia's drylands, covering nearly 70% of the continent exhibit the most variable precipitation and streamflow regimes globally. The endorheic Lake Eyre Basin (LEB) terminates at Kati Thanda-Lake Eyre (KT–LE), Australia’s largest lake and drains 1.14 M km2. This basin experiences remarkable ecological fluctuations with spectacular boom and bust cycles during extreme flooding events. This vast unregulated river basin, despite its ecological significance, has limited stream gauges and no lake monitoring, making the lake's water balance a real challenge due to its vast size, remote location and complex lake geometry. Recent observations reveal significant water loss in endorheic basins worldwide, emphasizing the urgency for improved freshwater monitoring solutions for KT – LE and its basin. Therefore, in this study, we present a space-based monitoring solution to estimate the storage volume of the KT–LE as an alternative to in situ measurements.  To do so, we utilized the data from the Surface Water and Ocean Topography (SWOT) satellite, launched in December 2022, to monitor the 2024 KT-LE filling event. The duration of this event was between March and October 2024. The predicted maximum lake storage volume (recorded on 1st May) reached 0.82 Km3 with a predicted average depth of -14.2 metres AHD (Australian Height Datum). We cross-compared the volume estimates from three bathymetry digital elevation models to evaluate the derived estimates in the absence of in situ data. We achieved the accuracy of the derived water surface elevation estimates with a root mean square error (RMSE) of <0.6 meters. This research highlights the potential of SWOT data for addressing critical data gaps in hydrological monitoring and advancing water balance assessments in arid and semi-arid regions and in large wide and shallow playa lakes.

How to cite: Rai, A. K., Cohen, T. J., Armon, M., and Marx, S. K.: Quantifying input volumes in Australia’s largest playa lake using SWOT data, EGU General Assembly 2025, Vienna, Austria, 27 Apr–2 May 2025, EGU25-754, https://doi.org/10.5194/egusphere-egu25-754, 2025.

Effective water resource management in arid and data-scarce regions necessitates innovative approaches that incorporate advanced hydrological modeling and remote sensing technologies. This study focuses on developing nature-based solutions for groundwater recharge, specifically identifying aquifer recharge zones to combat water scarcity in areas characterized by low precipitation and limited streamflow data.

Utilizing the Soil and Water Assessment Tool Plus (SWAT+), this research integrates remote sensing datasets with observed hydrological data for model calibration, aiming to estimate water availability and optimize storage potential. A comprehensive water balance approach is employed to evaluate precipitation, evapotranspiration, runoff, and infiltration dynamics, which enables precise estimation of water availability for recharge efforts.

By coupling SWAT+ with a groundwater module, the study analyzes infiltration capacity at a grid scale, facilitating the identification of high-potential groundwater recharge zones. The integration of remote sensing-derived parameters, including land use, soil type, and topography, enhances the model's ability to simulate water flow dynamics across watersheds.

This methodology is applied to Balochistan, Pakistan’s most vulnerable province to floods and droughts, where groundwater overexploitation and insufficient infrastructure exacerbate water challenges. The study’s findings provide insights into sustainable aquifer recharge strategies, supported by spatial analyses and thematic maps. These results inform the development of targeted interventions for water conservation, flood mitigation, and drought resilience in one of the world’s most water-stressed regions. This approach highlights the transformative potential of combining nature-based solutions with advanced hydrological modeling to secure water resources in arid regions.

How to cite: Naseer, A., Hafeez, M., Arshad, M., and Faizi, F.: Developing Nature-Based Solutions for Sustainable Groundwater Recharge through Advanced Hydrological Modelling and Water Availability Assessment in Arid Regions, EGU General Assembly 2025, Vienna, Austria, 27 Apr–2 May 2025, EGU25-1434, https://doi.org/10.5194/egusphere-egu25-1434, 2025.

Several studies demonstrated that >~100 absolute ages of sand at certain spatial/vertical resolutions are required for constructing a reliable chronological framework for palaeoenvironmental and palaeoclimatic interpretations of dunefield construction (Telfer and Hesse, 2013). As acquiring abundant absolute ages demands significant field and lab resources, several methodological approaches, such as port-OSL-OSL age estimates, have attempted to partly overcome this necessity (Stone et al., 2019).

Arid-zone encroaching dunes in the past and present, often dam drainage systems and generate proximal upstream, dune-dammed waterbodies that when dry, form playas. These waterbodies that are often seasonal, deposit distinct, low-energy, fluvial, fine-grained sediments (LFFDs), often as couplets. This recurring aeolian-dominated aeolian-fluvial (AF) process gradually leads to amplified LFFD accumulation, and partly configures dunefield, and particularly dunefield margin landscape evolution.

The INQUA DuneAtlas of global dunefield chronological data includes some dated samples that are non-dune sediments such as interdune and LFFD samples. However, the complementary contribution of such sediments to interpreting dunefield chronologies has not been fully assessed (Lancaster et al., 2016). Furthermore, and surprisingly, DuneAtlas dune sand samples that date to the LGM are sparse. We demonstrate that OSL ages, partly supported by port-OSL profiling, mainly of sandy units within LFFDs, improves the resolution and reliability of dating dunefield construction events and morphological maintenance of existing dunes, and in some cases even reveals periods of dune mobilization that are absent in dated dune cores.

Spatially dense, OSL-dated dune cores and sections of the ~103 km2 sized northwestern Negev dunefield (Israel) study area, revealed that the dunefield was constructed in two main sand incursion and vegetated linear dune (VLD) buildup/extension periods during the Heinrich 1 (H1) and Younger Dryas (YD) (Roskin et al., 2011; Thomas and Bailey, 2019). In this study, exposed, OSL-dated LFFD sections along the dunefield margins revealed that dune-dammed waterbodies destroyed earlier dunefield-margin dunes, partly erode others, but also preserve remains of eroded dunes between LFFD units. The LFFD sections revealed for the 1st time, significant and initial dune incursion and damming during the LGM, and also LFFD deposition thru the early Holocene (Robins et. al., 2022, 2023). The extent and relative thickness of H1-dated LFFDs suggest that dune encroachment then was greater than during the YD of the climate may have been slightly wetter. Early Holocene sediments may imply partial dune buildup or equilibrium-like dune maintenance in the early Holocene and, or also, a lag between YD dune-damming and later fluvial dune-breaching - when LFFD stratigraphic buildup gradually neared dune crest elevation leading to an outburst flood.

Altogether, studying and dating dune-dammed LFFDs are proposed to not only be a complementary, but rather a primary approach to date dunefield evolution and interpret past forcing drivers of sand mobilization and stabilization, and palaeohydrology.


References

Lancaster, N., et al., 2016. QI 

Robins, L., et al., 2022. QSR 

Robins, L., et al., 2023. QSR

Roskin, J., et al., 2011. QSR 

Stone, A. et al. 2019. QG 

Telfer, M.W. and Hesse, P.P., 2013. QSR 

Thomas, D.S. and Bailey, R.M., 2019. AR 

How to cite: Roskin, J., Robins, L., and Greenbaum, N.: OSL-dated, dune-dammed waterbody sediments along dunefield fringes improves resolution and reliability of dunefield evolution chronologies, EGU General Assembly 2025, Vienna, Austria, 27 Apr–2 May 2025, EGU25-2344, https://doi.org/10.5194/egusphere-egu25-2344, 2025.

EGU25-3123 | Orals | GM6.2

Paleoclimate and landscape evolution in an extreme continental interior – Interplay between aeolian, fluvial, and lacustrine systems in the Basin of the Great Lakes, Western Mongolia 

Frank Lehmkuhl, Dennis Wolf, Manfred Frechen, Neda Rahimzadeh, Sumiko Tskamato, Ochirbat Batkhishig, Lewis A. Owen, and Karl Wegmann

Neogene tectonics, geomorphological processes, and Quaternary climate change control landscape evolution in the internally drained basins of the Basin of Great Lakes (BGL), western Mongolia. The interplay of aeolian, fluvial, and lacustrine processes has resulted in a variety of landforms, such as large dune fields, beach bars, and alluvial fans. Their associated sedimentary archives and sediment transport pathways reflect mid-to-late Quaternary landscape evolution. The ongoing project analyzes geomorphological processes and sedimentary records. Different dating methods constrain the timing of landforms and deposits.

(1) Aeolian and fluvial dynamics: Mongolia's three largest dune fields, resulting from a long-term Quaternary sediment cycle, are located in the BGL. Rivers transport sediment into endorheic lakes. During lake-level low stands, winds transport the sand eastwards along the dune fields. The lakes exhibit different paleolake levels, and sandy plains with mobilized sand at their eastern ends exist. Three climatic and paleoclimatic implications are derived from a mapping approach1. (i) The fundamental west-east orientation of the dune fields is a result of the westerly winds that prevailed during the arid periods of the Quaternary. (ii) The highest lake levels occurred during pluvial phases caused by increased moisture supply. (iii) In the modern semi-arid climate, wind systems from north to northwest predominate, while in the southernmost dune field, minor winds from the southeast occur. Preliminary dating results give mid-Pleistocene dates for the core of the dune fields and Holocene dates for the youngest and smaller dunes.

(2) Lake level fluctuations: The first comprehensive late Quaternary chronology of lake level variations for the Khyargas Lake in the BGL is presented. The data is based on a geomorphological approach supported by luminescence dating. The lake is the ultimate sink of a sequential water and sediment cascade from the adjacent Mongolian Altai and Khangai Mountains. Several intercalated lakes repeatedly merged to form a large paleolake, as evidenced by various shoreline features. Twelve paleolake levels between +7m and +188m above the modern lake level (a.m.l.) are identified from well-preserved paleoshoreline sequences. Calculations of paleolake extent and water volumes emphasize times of enhanced inflow and gradual capture and subsequent reduced inflow and abandonment of upstream-located lakes. Three distinct phases of lake level dynamics can be differentiated: (i) A transgression to a maximum level of +129m (a.m.l.) during Marine Isotope Stage 5c primarily controlled by enhanced atmospheric moisture supply. (ii) A post-Last Glacial Maximum lake expansion to a level of +118m (a.m.l.) around 14 ka, ultimately controlled by glacial meltwater pulses. This period was followed by a rapid lake level drop during the Late Glacial–Holocene transition in response to decreasing meltwater supply and a drier climate. (iii) Small-scale lake level fluctuations throughout the Late Holocene reflect a hydro-climatically controlled equilibrium between ~ 2.6 and 0.7 ka.

The final project phase will obtain TCN dating of paleoshorelines and alluvial fan activity.

1 Lehmkuhl, F. et al. Aeolian sediments in western Mongolia: Distribution and (paleo)climatic implications. Geomorphology 465, 109407 (2024).

How to cite: Lehmkuhl, F., Wolf, D., Frechen, M., Rahimzadeh, N., Tskamato, S., Batkhishig, O., Owen, L. A., and Wegmann, K.: Paleoclimate and landscape evolution in an extreme continental interior – Interplay between aeolian, fluvial, and lacustrine systems in the Basin of the Great Lakes, Western Mongolia, EGU General Assembly 2025, Vienna, Austria, 27 Apr–2 May 2025, EGU25-3123, https://doi.org/10.5194/egusphere-egu25-3123, 2025.

EGU25-4036 | ECS | Posters on site | GM6.2

Activity and stability of surfaces and soils in the Atacama Desert, Chile 

Linda Maßon, Simon Matthias May, Svenja Riedesel, Marijn van der Meij, Johanna Steiner, Stephan Opitz, and Tony Reimann

The hyperarid conditions of the central Atacama, characterized by extremely low precipitation and high evaporation rates, create a unique environment where soil stability is generally thought to be exceptionally high due to the widespread gypsum and salt enrichment. Terrestrial cosmogenic nuclide-based surface exposure ages suggest that many surfaces underwent limited to no changes since the Neogene or early Pleistocene. However, a number of recent studies also underline the younger landscape-scale geomorphodynamic activity, as evidenced by e.g., the incision of the Rio Loa canyon during the late Pleistocene, or by growth of calcium-sulphate wedges and associated patterned grounds in the Central Depression at the onset of the Holocene. Despite this discrepancy, there is a limited understanding of past and present soil dynamics under this extreme hyperaridity, including subsurface turbation processes driven by both biological and salt dynamics (bioturbation, haloturbation). So far, no geochronological framework exists for these important subsurface soil processes, and the factors controlling these processes are still unknown.

Our study aims at providing new insights into the dynamics of subsurface soil processes in the hyperarid Atacama Desert. We use feldspar single grain luminescence dating techniques combined with sedimentological and geochemical analyses to decipher the activity or inactivity of soil material conveyance processes. We present results from investigations of four soil profiles. All profiles are situated in alluvial (fan) deposits along a west-to-east climatic transect stretching from the fog-affected western slopes of the Coastal Cordillera near sea level to the hyperarid core of the Atacama Desert at approximately 2000 m above sea level. Even though all studied profiles are situated in alluvial (fan) deposits, the geomorphic setting and thus the (sub)recent sedimentation dynamics differed considerably between the profiles. Soil dynamics in the form of vertical grain transport as well as material exchange and mixing were only detected in the coastal profiles where sufficient moisture supply supports the presence of vegetation and associated soil fauna. In these lower elevations, alluvial (fan) surfaces appear geomorphologically stable since their deposition, but our profiles exhibit evidence of significant post-depositional soil material reworking. In the hyperarid region above fog occurrence, that is only affected by rare episodic rain, post-depositional turbation processes seem to be absent or restricted to the surface layer. However, in these hyperarid regions, sediment (re)deposition seems to have taken place on relatively recent time scales, thereby adding more data on late Pleistocene to Holocene surface activity in the driest non-polar desert on Earth, that are likely driven by aeolian dust and/or episodic alluvial processes.

How to cite: Maßon, L., May, S. M., Riedesel, S., van der Meij, M., Steiner, J., Opitz, S., and Reimann, T.: Activity and stability of surfaces and soils in the Atacama Desert, Chile, EGU General Assembly 2025, Vienna, Austria, 27 Apr–2 May 2025, EGU25-4036, https://doi.org/10.5194/egusphere-egu25-4036, 2025.

Last major fluvial modification along the hyperarid coast of the Atacama Desert is relatively young. It has been found that the coastal alluvial fans (CAFs) were formed during the Late Pleistocene and Holocene. No remnants older than the last interglacial period could be constrained as yet. However, robust geochronological frameworks by numerical dating using radiocarbon dating, trapped charge dating techniques, and in situ terrestrial cosmogenic nuclides are restricted to few sites. This is related to both the geomorphic and stratigraphic complexity of the multi-stage CAFs as well as the high costs of those numerical dating methods. Consequently, it has remained unclear so far to what extent fan aggradation and progradation is controlled by large-scale allogenic versus individual autogenic forcing.

As a first study, an application of the cost-effective Schmidt hammer exposure-age dating (SHD) technique was explored for constraining the age of terminal aggradation of the CAF generations along the south-central coast of the Atacama Desert (24°15’S–25°15°S) using an 10Be exposure-dated telescopic alluvial fan featuring four control surfaces (after Walk et al., 2023) for age calibration. Apart from the calibration site, SHD was applied on, in total, 19 depositional lobes from 11 CAFs featuring at least one phase of progradation following main channel incision. Morphostratigraphies are primarily based on in-field mapping. Rebound (R) values were systematically assessed using an electronic N-type Schmidt hammer for each abandoned fan generation (Q1–Q3) by randomly sampling 50 surface boulders of comparable lithology. For calibration with recent deposits (Q4), multiple impacts were exerted on a careful selection of few boulders. Linear age calibration and error propagation follows the two-point solution by Matthews and Winkler (2022), adapted to a segmented approach for four control surfaces and complemented by Deming regression.

Calibration results in a negative and significant linear relationship between 10Be exposure ages and R values, presenting a robust regional calibration model for SHD of fan boulders exposed at least since the last interglacial period. SHD of the 19 fan surface generations yield ages of terminal aggradation ranging between the mid MIS 4 (late MIS 3) and early to mid MIS 5. The age range exceeds the usual dating range reported for SHD applied in (sub)humid regions by up to one order of magnitude, which can be explained by the comparatively low weathering rates at the arid-hyperarid transition. The relative age uncertainties amount to 3–20% (10–24%) and allow to deduce a spatial heterogeneity in the Late Quaternary fan morphodynamics. While the CAFs south of 24°53’S show a systematic response probably related to palaeoclimatic changes of the SE Pacific, those to the north are decoupled – indicating a potential control by individual autogenic forcing.

References
Matthews, J.A., Winkler, S. (2022): Schmidt-hammer exposure-age dating: a review of principles and practice. Earth-Science Reviews 230, 104038. DOI:10.1016/j.earscirev.2022.104038

Walk, J., Schulte, P., Bartz, M., Binnie, A., Kehl, M., Mörchen, R., … Lehmkuhl, F. (2023): Pedogenesis at the coastal arid-hyperarid transition deduced from a Late Quaternary chronosequence at Paposo, Atacama Desert. Catena 228, 107171. DOI: 10.1016/j.catena.2023.107171

How to cite: Walk, J.: Expansion of the Late Quaternary morphochronology of Atacama’s coastal alluvial fans (northern Chile) by Schmidt hammer exposure-age dating, EGU General Assembly 2025, Vienna, Austria, 27 Apr–2 May 2025, EGU25-4535, https://doi.org/10.5194/egusphere-egu25-4535, 2025.

EGU25-4557 | ECS | Orals | GM6.2

Linking structural and functional connectivity in drylands under varying rainfall and soil conditions 

Octavia Crompton, Gabriel Katul, and Sally Thompson

On dryland hillslopes, vegetation water availability is often subsidized by the redistribution of rainfall runoff from bare soil (sources) to vegetation patches (sinks). In regions where rainfall volumes are too low to support spatially continuous plant growth, such functional connectivity between bare soil and vegetated areas enables the establishment and persistence of dryland ecosystems. Increasing the connectivity within bare soil areas can intensify runoff and increase water losses from hillslopes, disrupting this redistribution and reducing the water available to sustain ecosystem function. Inferring functional connectivity (from bare to vegetated, or within bare areas) from structural landscape features is an attractive approach to enable rapid, scalable characterization of dryland ecosystem function from remote observations. Such inference, however, would rely on metrics of structural connectivity, which describe the contiguity of bare soil areas. Unfortunately, several studies have observed non-stationarity in the relations between functional and structural connectivity metrics as rainfall conditions vary. Consequently, the suitability of using structural connectivity to provide a reliable proxy for functional connectivity remains uncertain.

Here rainfall runoff simulations across a large range of dryland hillslopes, under varying soil and rainfall conditions are used to establish relations between structural and functional connectivity metrics. The results identify that the relations very between two hydrologic limits -- a 'local' limit, in which functional connectivity is related to structural connectivity, and a 'global' limit, in which functional connectivity is most related to the hillslope vegetation fraction, regardless of the structural connectivity of bare soil areas. The transition between these limits within the simulations depends on rainfall intensity and duration, and soil permeability. While the local limit may strengthen positive feedbacks between vegetation and water availability, the implications of these limits for dryland functioning need further exploration, particularly considering the timescale separation between storm runoff production and vegetation growth.

How to cite: Crompton, O., Katul, G., and Thompson, S.: Linking structural and functional connectivity in drylands under varying rainfall and soil conditions, EGU General Assembly 2025, Vienna, Austria, 27 Apr–2 May 2025, EGU25-4557, https://doi.org/10.5194/egusphere-egu25-4557, 2025.

EGU25-4741 | ECS | Posters on site | GM6.2

Geomorphic diversity of dryland rivers and their controls in the semi-arid region, Western India 

Anukritika Raj and Vikrant Jain

Drylands cover approximately 41% of the global land area and support diverse fluvial systems. Identifying the geomorphic diversity of dryland rivers and their maintenance is essential for sustaining ecosystems in arid and semi-arid regions. Furthermore, amidst climate change and the anticipated expansion of dryland areas, gaining insights into this diversity is crucial for developing adaptive and effective management strategies for dryland rivers.  However, dryland rivers are often generalized, with studies focusing more on their distinct characteristics than the inherent geomorphic diversity that shapes river character and behaviour. A comprehensive understanding of the occurrence, spatial distribution, and major controls on channel morphological diversity of dryland rivers is still lacking. To address this gap, we have examined the geomorphic diversity within and across two semi-arid dryland river basins in western India: the Mahi River Basin (MRB) and the West Banas River Basin (WBRB). We employed River Styles classification for geomorphic characterization, combined with hydrological analysis, total stream power and specific stream power assessment for a more comprehensive evaluation. Hydrological analysis indicates that MRB and WBRB are monsoon-dominated rivers. MRB is a perennial dryland river with high flow permanence downstream, whereas WBRB is intermittent, with discharge decreasing downstream. Geomorphic characterization shows that MRB predominantly exhibits a confined, terrace margin controlled, meandering, gravel bed River Style. Only a small section of the estuarine zone exhibits a partly confined, terrace margin controlled, fine-grained bed River Style. Terraces impose antecedent confinement on the contemporary river processes in the MRB, limiting floodplain development. On the contrary, WBRB predominantly features laterally unconfined, continuous channel, low sinuosity, gravel-to-sand bed River Style with extensive floodplain development. The midstream section shows a partly confined, terrace margin controlled, gravel bed River Style in the pediment zone. Stream power analysis showed high stream power even in the mid-to-downstream pediment zone of both basins, primarily driven by site-specific structural controls influencing current channel processes. Field investigations indicated that erosion processes, notably plucking, predominantly shape the reaches with higher stream power. The maximum specific stream power in the pediment zone is 98 W/m² and 255 W/m² in the WBRB and MRB, respectively. Geomorphic diversity within the basin is primarily shaped by geological control in the rocky uplands, while the pediment and alluvial zones reflect a combination of geological controls and Holocene climatic imprints. Although both basins are in semi-arid regions, the observed geomorphic diversity across the basin is governed by stream power distribution patterns with underlying geological controls and valley evolution at the millennial time scale. Insights from this study can enhance ground-level river management practices by incorporating the diversity of dryland rivers and contributing to the global inventory, thereby enriching our understanding of dryland river systems.

How to cite: Raj, A. and Jain, V.: Geomorphic diversity of dryland rivers and their controls in the semi-arid region, Western India, EGU General Assembly 2025, Vienna, Austria, 27 Apr–2 May 2025, EGU25-4741, https://doi.org/10.5194/egusphere-egu25-4741, 2025.

EGU25-7661 | Posters on site | GM6.2

Spatial variations in the provenance of eolian deposits on the Mu Us desert and the Chinese Loess Plateau 

Mei Sheng, Xisheng Wang, and Shuanhong Zhang

Whether the provenance of eolian deposits on the extensive Chinese Loess Plateau (CLP) is spatiotemporally heterogeneous/homogeneous is highly controversial. Here we present detrital zircon U-Pb ages for the eolian dust from the central-eastern Mu Us desert, its underlying Cretaceous sandstones, and the loess from the northeastern CLP. The comparable detrital zircon U-Pb age signatures between the eolian deposits from eastern Mu Us and Cretaceous sandstones suggests that eolian deposits in the eastern Mu Us are largely the product of weathering and recycling of regional bedrock. Typical loess on the northeastern CLP show relatively consistent zircon age spectra with those from the eastern Mu Us, indicating significant contributions of the western North China Craton (NCC) to the loess on the northeastern CLP. Temporal consistencies of U-Pb age spectra for a 13.6 m-thick eolian sand-loess sequence in the eastern Mu Us desert reveals that there is no apparent provenance shift at least since the last interglacial. Comparison of detrital zircon U-Pb age spectra of Late Pleistocene loess developed on the northeastern, eastern, and west-central CLP demonstrates that the contributions from the western NCC increase significantly for the loess on the eastern-northeastern CLP, while the west-central CLP received more eolian dust from the northeastern Tibetan Plateau (NTP) and the Central Asian Orogenic Belt (CAOB). The contribution of detritus from the NTP decreases, and the contribution from the western NCC outweighs that from the NTP on the eastern-northeastern CLP. Our new detrital zircon data provide robust evidence for the spatial heterogeneity of provenance across the CLP, regardless of the general characteristics of multiple recycling and thorough mixing of Chinese loess.

How to cite: Sheng, M., Wang, X., and Zhang, S.: Spatial variations in the provenance of eolian deposits on the Mu Us desert and the Chinese Loess Plateau, EGU General Assembly 2025, Vienna, Austria, 27 Apr–2 May 2025, EGU25-7661, https://doi.org/10.5194/egusphere-egu25-7661, 2025.

The high-accumulation-rate eolian deposits in the eastern Hexi Corridor retain invaluable archives of rapid climatic fluctuations in the transitional zone of the northwestern Chinese Loess Plateau, the Tengger Desert, and the northern foothills of the Qilian Mountains. High-resolution mineral magnetic and bulk grain size analyses for the Shagou loess–paleosol sequences since the last interglacial reveal that loess accumulation in northwestern limit of the East Asian summer monsoon is essentially continuous at multi-centennial scales, and variations in magnetic granulometry of the last glacial loess are predominated by the intensity of the East Asian winter monsoon (EAWM). Based on Greenland Ice Core Chronology, the complete recording of all Dansgaard–Oeschger (D–O) cycles and Heinrich events substantiates a rapid response of the EAWM to the northern high-latitude abrupt climatic changes, regulated by the strength of the Atlantic Meridional Overturning Circulation (AMOC) and Arctic sea-ice extent. A synthesis of various high-resolution paleo-proxy records from the Northern Hemisphere further suggests the generally identical phasing of stadial–interstadial oscillations and tight coupling of the atmosphere-ice-ocean system. We propose that the relatively stronger D–O signals in low-latitude tropical marine sequences compared with middle-latitude land-based paleo-records may be accounted for by northward transport of heat and moisture originated from the warmest tropical oceans during interstadials, and the more significant influence of oceanic processes than that of atmospheric processes in propagating the northern high-latitude climatic signals during stadials. This study highlights the pivotal role of AMOC in modulating millennial-scale regional and global climate.

How to cite: Wang, X., Sheng, M., and Yi, S.: Links of abrupt climate events in the eastern Hexi Corridor to Atlantic meridional overturning circulation changes during the last glacial:magnetoclimatological evidence of the Shagou loess record, EGU General Assembly 2025, Vienna, Austria, 27 Apr–2 May 2025, EGU25-7789, https://doi.org/10.5194/egusphere-egu25-7789, 2025.

Identifying reliable indicators of environmental changes is crucial for effective ecosystem management, particularly in drylands which are prone to climate change impacts. Here, we report on how we are integrating time-series remote sensing, advanced data science techniques, and ground-based observations to identify, map, and assess the sensitivity of a diverse suite of wetlands in drylands to environmental perturbations.  We are particularly interested in potential ‘sentinel wetlands’: natural features that are highly sensitive to subtle climatic changes. These wetlands may act as early warning systems, reflecting the cumulative effects of various climate stressors on their hydrodynamic state.

We have developed a method to automatically map different surface waterbodies (including a range of low- and high-altitude wetlands) and characterise their wetness dynamics at pixel-scale using time-series multispectral satellite data. We have applied the method to drylands spanning three different continents (western and northern India, southwest Spain, Argentinian Patagonia) and validated the mapped wetness dynamics of key features such as floodplain and valley-bottom wetlands, interdunal depressions, playas and pans through extensive field visits (~10 000 km of road trip).

From our field visits, we conclude that not all wetlands are good candidates for serving as sentinel wetlands. The best candidates are those wetlands which are devoid of direct human interventions, sit within endorheic catchments, and are relatively small in size (<10 km2). Each dryland visited hosts several such candidates. We classify these candidates in two categories: controls and targets. Controls are sentinel wetlands with in-situ hydrometeorological data logging stations (e.g. interdunal wetlands in Doñana National Park, Southwest Spain), while targets are the remaining sentinel wetlands that we plan to use as a distributed sensor array. Our field visits reveal that in some wetlands, there has been an increase in wetness frequency in recent years.  In the case of low-altitude wetlands, it is almost exclusively because of human interventions (i.e. these are non-sentinel wetlands) and in the high-altitude wetlands, it is because of increased glacier meltwater supply (i.e. these are sentinel wetlands).  By contrast, most sentinel wetlands in low-altitude regions are exhibiting reduced wetness frequency, in some cases dramatically. The next steps are to monitor and evaluate a wider set of hydrodynamic responses to stressors, including by tracking subtle changes at pixel scale and correlating these changes with local to regional climate.  The results will help further demonstrate how wetlands in drylands can act as robust indicators of climate change.

Knowing the wetness dynamics of sentinel and non-sentinel wetlands will help us to identify and separate the various climate and direct human stressors that might impact future water availability and hence water security in the world’s diverse drylands. This separation is crucial for developing targeted management strategies. By further characterising the sensitivity of sentinel wetlands, our research will enhance predictive models of waterbody responses to climate change and provide actionable insights for sustaining water resources amidst ongoing climate changes.

How to cite: Singh, M. and Tooth, S.: Time-series remote sensing and multi-continental field work reveals that wetlands in drylands can be robust indicators of climate change, EGU General Assembly 2025, Vienna, Austria, 27 Apr–2 May 2025, EGU25-11577, https://doi.org/10.5194/egusphere-egu25-11577, 2025.

EGU25-12167 | Orals | GM6.2

Isochronous provenance variability during the last glacial maximum revealed by heavy mineral analysis of loess deposits 

Nils Keno Lünsdorf, Marie-Christin Speck, Olivier Moine, Pierre Antoine, Markus Fuchs, and Frank Lehmkuhl

Loess-Paleosol-Sequences (LPS) are important sedimentary archives that enable to infer climatological parameters during the Quaternary at high temporal resolution. Three isochronous, central European LPS sites (Nussloch, Münzenberg, Hecklingen) were accessed at high temporal resolution by means of heavy mineral, single-grain sedimentary provenance analysis (SPA) using a highly automated, correlative workflow guided by machine learning (Lünsdorf et al., 2023). The goals of this study are (1) to investigate if regional differences exists between the LPS in terms of heavy mineral composition (i.e. Alpine vs. Fennoscandinavian provenance) and (2) if short lived processes that affected the source-to-sink system can be detected.

The studied LPS compose a transect from SW to NE Germany and synchronicity of the archives was controlled by presence of the Eltville tephra (ET; ca. 23.2 – 25.6 ka, Zens et al. 2017) and/or precise OSL age modeling. Thus, the LPS recorded sedimentation during the last glacial maximum. From each LPS 1 m of sediment was continuously sampled in 5 cm intervals, whenever possible centered on the ET. 120 heavy mineral aliquots of the grain size fractions 10 – 30 µm and 30 – 62 µm were analyzed by optical microscopy, Raman spectroscopy and electron probe micro analysis (EPMA) at the single grain level. Resulting in a correlated dataset of optically derived grain parameters (size, shape, roundness, color, etc.), mineralogy and chemical composition for each individual grain analyzed.

First preliminary results suggest that the three LPS are readily differentiated based on heavy mineral composition, supporting a Southern, Alpine and Northern, Fennoscandinavian loess provenance. While heavy mineral ratios and garnet chemical composition reveal abrupt changes in the Southern (Nussloch) and Northern (Hecklingen) LPS. It is assumed that the abrupt changes at the Nussloch site are related to variation in storm intensity with periods of high storm activity reflecting a distal source and periods of low storm activity a more local source. A reasonable explanation for the abrupt change in provenance indicators at the Hecklingen site is the advancement of the Scandinavian Ice Sheet, potentially changing the fluvial drainage pattern and introducing more moraine material to the deflation area.

How to cite: Lünsdorf, N. K., Speck, M.-C., Moine, O., Antoine, P., Fuchs, M., and Lehmkuhl, F.: Isochronous provenance variability during the last glacial maximum revealed by heavy mineral analysis of loess deposits, EGU General Assembly 2025, Vienna, Austria, 27 Apr–2 May 2025, EGU25-12167, https://doi.org/10.5194/egusphere-egu25-12167, 2025.

EGU25-14669 | ECS | Orals | GM6.2

Unraveling the Link between Rainfall and Groundwater: A Regional Approach 

Zafira Feroz and Madan Kumar Jha

Groundwater serves as an unsung hero in the worldwide freshwater crisis, supporting agriculture, sustaining communities, and mitigating the effects of climate variability. India leads the world in groundwater consumption. It extracts approximately 250 km³  annually, surpassing the combined withdrawals of China and the United States. Groundwater extraction is expected to escalate in the coming future due to agricultural demands, thereby stressing the already over-exploited groundwater reserves. These findings emphasize the critical need for in-depth research on groundwater systems. The present study focuses on the agro-ecological zones (AEZs) of India, as classified by the National Bureau of Soil Survey and Land Use Planning (NBSS&LUP). AEZs are characterized by unique climatic, soil, and hydrological properties, providing an ideal framework for analyzing groundwater trends at a regional scale. The intricate relationship between rainfall and groundwater levels across different agro-ecological zones was analyzed. The Mann-Whitney U test results reveal significant (p < 0.05) differences in groundwater-levels between normal and dry (deficient rainfall) years in Zones 3, 10, 16, and 19, as well as between normal and wet (excess rainfall) years in Zones 3, 10, 11, 15, 16, and 17, highlighting the pronounced impact of rainfall variability on groundwater availability in these regions. A decline in water table over the two decades (1996-2016) is observed in 57.42% of the total geographical area. Furthermore, regression analysis demonstrated strong correlations (r > 0.7) between annual rainfall and post-monsoon groundwater levels in ten out of the eighteen AEZs considered for the analysis. In addition, Zone 11 ‘Central Highlands’ and Zone 16 ‘Deccan Plateau (Karnataka)’ exhibited stronger correlations at a lag of 1 month, highlighting the delayed response of groundwater to rainfall in these regions. It was also observed that the total area where groundwater extraction during monsoon exceeds recharge, expands from 0.68% in 1996, to 1.21% in 2006, and to 3.89% in 2016. The findings of this study emphasize the need for adaptive, zone-specific strategies to ensure sustainable groundwater management under the changing climate and socio-economic conditions.


How to cite: Feroz, Z. and Jha, M. K.: Unraveling the Link between Rainfall and Groundwater: A Regional Approach, EGU General Assembly 2025, Vienna, Austria, 27 Apr–2 May 2025, EGU25-14669, https://doi.org/10.5194/egusphere-egu25-14669, 2025.

EGU25-15509 | ECS | Posters on site | GM6.2

Alluvial Fan Retreat: Tank Experiments 

Haein Shin and Wonsuck Kim

Conventional interpretations of alluvial fan margins attribute their changes to environmental factors such as tectonic activity or climate variations. Under steady dynamic conditions, fan margin (s) is expected to grow continuously, following the time (t) dependence of s~t(1/3), based on the mass conservation. However, this study aims to propose a new concept that challenges this conventional understanding. A key finding of this research is that the alluvial fan margin can retreat even under constant upstream boundary conditions, a phenomenon significantly influenced by ‘groundwater infiltration’. This study focuses on investigating the role of infiltration process in alluvial fan evolution. Seven tank experiments with varying sediment and water discharge rates were conducted, enabling analysis of fan retreat under constant upstream boundary conditions. Fans typically exhibited continuous progradation, but a critical point was observed where runoff water no longer reached the fan margin, resulting in fan retreat. At this stage, all runoff water infiltrated into the sediment deposit. Applying Darcy’s Law, we found a strong correlation between deposit thickness (dh) and infiltration rate, assuming constant hydraulic conductivity (Ks). Based on these experimental results, a computational model was developed to simulate the alluvial fan trajectories under similar conditions. The findings provide insights into field-scale applications by accounting for infiltration processes on alluvial fans.

How to cite: Shin, H. and Kim, W.: Alluvial Fan Retreat: Tank Experiments, EGU General Assembly 2025, Vienna, Austria, 27 Apr–2 May 2025, EGU25-15509, https://doi.org/10.5194/egusphere-egu25-15509, 2025.

EGU25-17392 | ECS | Posters on site | GM6.2

Evaluating Aquifer Recharge in Volcanic Islands: A Case Study of Maspalomas, Gran Canaria 

Rodrigo Sariago, Miguel Ángel Marazuela, Jorge Martínez-León, Jon Jimenez, Carlos Baquedano, Samanta Gasco, Gerardo Meixueiro Rios, Juan Carlos Santamarta García-Gil, and Alejandro García-Gil

In recent decades, the need to quantify and understand water resources in drylands, such as insular volcanic systems, has grown, along with the obligation to assess how climate change might impact them in the future. These resources are constrained not only by climatic, geographic, and geological factors, but also by increasing demand from agronomic, urban, and tourism areas. This, is mostly relevant in the Canary Islands, especially in the coastal region of Maspalomas located in the southern part of Gran Canaria, where an exponential increase in freshwater demand has been observed from 1960 to the present.

Within the framework of the NATALIE project a hydrological model was developed using the Soil and Water Assessment Tool (SWAT) software to estimate the infiltration and recharge rate of Maspalomas aquifers. The water balance results show an average annual precipitation of 272 mm, of which 68% evapotranspires (181 mm/yr). The infiltration rate is estimated at 19% of the precipitation (50.65 mm/yr), equivalent to an annual aquifer recharge of 8.2 hm³.

Gran Canaria faces a unique challenge in water resource management due to strong anthropogenic pressure and the impact of climate change on reserves and available resources. Climate projections towards 2100 suggest a drop of 22.2% in annual precipitation, which would represent a reduction of 34.63 mm/yr in infiltration, i.e., a decrease of 2.59 hm³/yr in groundwater reserves. These results will be key to both prevent scarcity and improve fresh water resource management in volcanic islands.

Keywords: Water resources, Maspalomas, SWAT, recharge rate, climate projection


How to cite: Sariago, R., Marazuela, M. Á., Martínez-León, J., Jimenez, J., Baquedano, C., Gasco, S., Meixueiro Rios, G., Santamarta García-Gil, J. C., and García-Gil, A.: Evaluating Aquifer Recharge in Volcanic Islands: A Case Study of Maspalomas, Gran Canaria, EGU General Assembly 2025, Vienna, Austria, 27 Apr–2 May 2025, EGU25-17392, https://doi.org/10.5194/egusphere-egu25-17392, 2025.

We geochemically-fingerprinted a large set of sediments collected from potential source areas (PSAs) in southeastern and southcentral Australia and to compare these data with the record obtained from X-ray Fluorescence (XRF) scanning on a long deep-sea sediment core MD03-2607 obtained offshore Kangaroo Island, South Australia. The entire data set of samples collected on land as well as the downcore measurements were unmixed using the numerical end-member method AnalySize. In this approach, we successfully use the elements Al, Fe, K, Mn, S, Sr and Y to define end members. In addition, the on-land occurrences of the chemical ratios of Zr/Zn, Ti/Rb, Ti/Y and Zr/Rb are used to support the provenance of the chemical end-members. Three main PSA’s are defined: Murray River Basin (MRB), Darling River Basin (DRB) and Kati Thanda – Lake Eyre District (LED), of which the MRB is represented in two different chemical end members. The downcore contributions of these end members in the sediment core are consequently interpreted in terms of fluvial (MRB and DRB) versus aeolian (LED) input.  Consequently, the downcore dominance of sediment-transport modes are interpreted in terms of river runoff versus aeolian input over the last 125 kyr. The downcore palaeoclimate proxies show a dominance of MRB during the interglacial intervals versus a dominance of both LED (dust) and DRB input during the glacial ones, suggesting increased seasonal contrasts during glacial austral winter. See: www.nioz.nl/dust

How to cite: Stuut, J.-B., De Deckker, P., and Hennekam, R.: Provenancing dryland sediments recovered from the marine realm to reconstruct Late Quaternary Australian climate variability  , EGU General Assembly 2025, Vienna, Austria, 27 Apr–2 May 2025, EGU25-17564, https://doi.org/10.5194/egusphere-egu25-17564, 2025.

In semi-arid regions, the growing demand for water, particularly for irrigation, accelerates the overexploitation of water resources, often leading to severe scarcity that constrains sustainable economic development. This issue is particularly acute in the Merguellil watershed in central Tunisia, where the impacts of climate change exacerbate the challenges. This study employs the Water Evaluation and Planning (WEAP) system model to analyze current and future trends in surface and groundwater resources in the Merguellil watershed, assessing the combined effects of climate change and human activities on these resources. The primary objective is to identify critical thresholds, evaluate sustainable solutions and guide adaptive water management strategies. An essential element of the study is estimating the demand for irrigation water in the Kairouan plain using high-resolution Landsat 8 imagery to calculate crop evapotranspiration (ETC). Once the required input data from 2000 to 2020 are introduced in the WEAP model, the impact of different scenarios (Climatic and anthropogenic) for the actual and future water balance were evaluated until 2050. The simulation results under the RCP 4.5 climate scenario indicate a significant decline in aquifer levels across the basin; the Kairouan aquifers being particularly impacted. Additionally, scenarios involving the expansion of irrigated areas show a substantial increase in agricultural water requirements. To address these pressing challenges, this study explores multiple management strategies, including improving the efficiency and satisfaction levels of public irrigation systems, optimizing reservoir management during drought periods, and interconnecting existing water infrastructures. Notably, the findings highlight the importance of gradually increasing water transfers to the El Haouareb Dam to meet irrigation demands effectively. Finally, we conclude by emphasizing the importance of proactive and adaptive measures in order to mitigate the adverse impacts of climate change and human activities on water resources in this area. This study highlights the need for integrated, resilient, and sustainable water management practices to ensure the long-term viability of water resources in this vulnerable region.

How to cite: Ataallah, H., Oueslati, I., Le Page, M., and Lili Chabaane, Z.: Sustainable Water Resource Management in the Merguellil Watershed (Tunisia): Assessing the Impacts of Climate Change and Human Activities Using the WEAP Model, EGU General Assembly 2025, Vienna, Austria, 27 Apr–2 May 2025, EGU25-19705, https://doi.org/10.5194/egusphere-egu25-19705, 2025.

EGU25-806 | ECS | Orals | GM3.8

Beached above Cape Town: well-worn cobbles talk 

Tugce Akkas and Emese Bordy

To understand syn-sedimentary wave-energy conditions, past coastal dynamics, and sea-level changes, this field-based study examines high-energy marine sediments of presumed Pliocene age around Cape Town, South Africa. Although these deposits were mapped over a century ago, they have not undergone modern sedimentological analysis. The deposits consist of rounded, moderately well-sorted orthoquartzite clasts ranging from cobble to boulder size (>3 m in diameter). The presence of percussion marks indicates significant sediment reworking by intense waves. Clast characteristics—size, sorting, roundness, and composition—across four locations also reflect devastatingly intense waves in powerful, multi-event storms rather than single catastrophic events like tsunamis. This interpretation aligns with evidence that southwestern Africa’s passive continental margins have been storm-dominated in post-Miocene. These insights into Cape Town's coastal dynamics, which suggest erosion of local rocky shores during "super storms," are consistent with global high-energy beach processes in the Pliocene—a period characterized by elevated global temperatures, frequent intense storms, and high sea levels. The findings refine our understanding of how past high-energy marine events shaped shorelines and provide an analogue for the impact modern sea-level rise. Accurate age dating is essential for reliably correlating these sediments with global Pliocene deposits and for reconstructing the post-Miocene shoreline history. Regardless of their exact age, the sedimentological properties and stratigraphic position of Cape Town's fossil beaches indicate that during their formation, the local sea level was up to 30 m higher than today, with the deposits having been reworked and transported in powerful marine events, which are often linked to increasing global temperatures that trigger glacio-eustatic sea level rise.

How to cite: Akkas, T. and Bordy, E.: Beached above Cape Town: well-worn cobbles talk, EGU General Assembly 2025, Vienna, Austria, 27 Apr–2 May 2025, EGU25-806, https://doi.org/10.5194/egusphere-egu25-806, 2025.

EGU25-1701 | ECS | Orals | GM3.8

RoSETTA: Inverting coastal landforms towards past sea-levels, tectonics, and coral reef dynamics 

Yannick Boucharat, Gino de Gelder, Laurent Husson, Christine Authemayou, Thomas Bodin, Sri Yuda Cahyarini, Denovan Chauveau, Joseph Martinod, Anne-Morwenn Pastier, Kevin Pedoja, and Tubagus Solihuddin

Coastal landforms constitute a worldwide archive that intricately records past sea-level, morphotectonics and (bio-)morphogenesis. Although forward landscape evolution modelling has shown its potential in deciphering, independently, either sea-level, tectonics, or morphogenesis, this strategy rests upon a wealth of hypotheses regarding the other 2 aspects. We circumvent this limitation by inverting coral reef terraces geometries using a Monte-Carlo Markov Chain sampling in a Bayesian framework with the code RoSETTA (Resolving Sea-level, Ecosystems and Tectonics from Terrace Analysis). Probabilistic solutions of past sea-level, as well as vertical motion, erosion and reef growth rates are simultaneously obtained from reconstructions of stacks of coastal landforms. We first benchmark RoSETTA on synthetic sequences of marine terraces and then on the canonical landforms of Sumba island, Indonesia. Beyond successful reconstructions, our probablistic approach allows to highlight periods of time and sea level that can confidently be resolved from a given stack of marine terraces. Additionally, we can also point out periods for which the archive is insufficient to be conclusive, an overlooked aspect of earlier attempts to decipher coastal landscapes. A successful remedy is to use joint inversions of multiple profiles using RoSETTA, improving the confidence of the results.

How to cite: Boucharat, Y., de Gelder, G., Husson, L., Authemayou, C., Bodin, T., Cahyarini, S. Y., Chauveau, D., Martinod, J., Pastier, A.-M., Pedoja, K., and Solihuddin, T.: RoSETTA: Inverting coastal landforms towards past sea-levels, tectonics, and coral reef dynamics, EGU General Assembly 2025, Vienna, Austria, 27 Apr–2 May 2025, EGU25-1701, https://doi.org/10.5194/egusphere-egu25-1701, 2025.

Sequence stratigraphy has predominantly been used on seismic data to interpret basin stratigraphic architectures, especially offshore, but its application to onshore outcrops, and more specifically to the stratigraphic records of the last interglacial periods, remains comparatively rare. The preservation of marine terraces on the southern coast of the Gulf of Corinth (Greece) enables high-resolution study of exposed stratigraphic architectures within terrace deposits.  Fourteen marine terraces corresponding to the last 400 ka are visible in outcrop. This study focuses on the detailed analysis of outcrop sequences in the marine terraces of the Gulf of Corinth, aiming to document multiple regression cycles recorded during past interglacials.

The outcrops are roughly organised in km-large, including hundreds of meters-high Gilbert-type deltas. We identify clinoforms and facies associations thanks to panoramas and stratigraphic logs interpretations and then, we determine the different systems tracts: LST, TST, HST and FSST and the offlap break for the consecutive marine terraces. This enables us to illustrate the processes involved in the formation of marine terraces in relation to eustatic variations. The restored stratigraphic architecture captures an entire record of several cycles organised in an overall forced regression, from the most proximal facies to the most distal ones. This record encompasses the last 400 ka. On this record, we identify almost every HST and some considerable LST and narrow TST in discontinuity with the basement by interpreting topsets, foresets, bottomsets and discontinuities.

We determine how coastline has migrated through time by establishing the trajectory path of the land-sea interface during the last 400 ka. We finally correlate the coastline migration rates with sediment flux dynamics to discuss the relationship between erosion processes and sea-level changes along the coastline.  For example, we illustrate that deposition of sediments in the offshore is more important during low sea levels.

The Gulf of Corinth outcrop sequences could serve as a natural laboratory for testing proxies and understanding the interplay between tectonics, climate, and sea-level changes for the past interglacials.

How to cite: Deiss, N., Rohais, S., and Regard, V.: Sequence stratigraphy on outcrops in the Gulf of Corinth (Greece): world-class record of multiple regression cycles from the past interglacials, EGU General Assembly 2025, Vienna, Austria, 27 Apr–2 May 2025, EGU25-3041, https://doi.org/10.5194/egusphere-egu25-3041, 2025.

EGU25-5219 | ECS | Posters on site | GM3.8

Reviewing Last interglacial (MIS 5e, 125 ka) sea-level indicators from South Asia and the South China Sea 

Mubashir Ali and Alessio Rovere

The World Atlas of Last Interglacial Shorelines (WALIS) is a comprehensive, community-driven, open-access database that compiles and holds the global records of sea-level proxies and associated dated samples from the Last Interglacial period (LIG, Marine Isotope Stage MIS 5e, ~125,000 years ago). Despite its extensive and comprehensive coverage, the available knowledge and understanding of sea level fluctuations during LIG in South Asia, the Persian Gulf, the Gulf of Oman, and the South China Sea remain unavailable on the WALIS dataset. These regions are critical for understanding relative sea-level changes due to their unique geological, tectonic, and climatic settings, such as the active tectonics of the Makran coast, the tropical environments of Sri Lanka and Bangladesh, and the sediment-rich deltas of South Asia. This work aims to update WALIS by integrating available literature with detailed work on sea level indicators from these areas, focusing on marine terraces, raised shorelines, sedimentary records, and geochemical proxies. Including South Asian and Persian Gulf, the Gulf of Oman, and the South China Sea LIG data to WALIS will significantly enhance the database's regional and global utility, offering new insights into glacial-isostatic adjustments, monsoon-driven sedimentation, and the interplay of climatic and tectonic forces during the Last Interglacial. This new standardized regional database will be useful for both local and global paleoclimate studies, improving our understanding of past and future sea-level dynamics and coastal geomorphology.

This presentation is a contribution to the WARMCOASTS project, which has received funding from the European Research Council under the European Union's Horizon 2020 research and innovation programme (grant agreement n. 802414)

How to cite: Ali, M. and Rovere, A.: Reviewing Last interglacial (MIS 5e, 125 ka) sea-level indicators from South Asia and the South China Sea, EGU General Assembly 2025, Vienna, Austria, 27 Apr–2 May 2025, EGU25-5219, https://doi.org/10.5194/egusphere-egu25-5219, 2025.

EGU25-7181 | Orals | GM3.8

Reconstructing the relative sea level of the Black Sea during the last glacial period  

Eren Şahiner, Mehmet Korhan Erturaç, Raif Kandemir, Konstantin Kostov, Altuğ Hasözbek, Sevinç Kapan Ürün, Hilal Okur, İrem Salman, Fernando Jiménez Barredo, Radoslav Nakov, and Nizamettin Kazancı

The Black Sea is currently a nearly enclosed basin connected to the Mediterranean via the Bosphorus Strait (sill depth at 35 m bsl), the Marmara Sea, and the Dardanelles (65 m bsl). During the last glacial period, this connection was severed due to global sea level drop, falling lower than the sill depths. While the early Holocene reconnection of the Black Sea to the Mediterranean has been extensively studied and debated, our understanding of the Black Sea’s Sea level curve during the last glacial period remains largely rooted in foundational research. Notably, mid-to-late 20th-century studies by geoscientists such as Panin, Tchepalyga, and Scheglov utilized U-series dating of coastal terraces to construct early reconstructions. These studies suggested several high-stands, incompatible with the global sea level curve. 
Recent research focusing on (1) the evolution of the Caspian Sea to date the timing and extend of the transgressions where some are claimed to have reached to the Black Sea basin via Manych strait (50 m asl) , (2) the late-Pleistocene variations on the extend of the Fenno-Scandinavian ice sheet and (3) detailed analyses of deep-sea cores and stalagmite records, have significantly enhanced our understanding of the region's last glacial evolution, providing high-resolution data extending back beyond MIS 6. 
A multiyear bi-lateral program, namely BlackSea-Rise has been carried on along the Black Sea Coastal Zone supported by the TUBITAK and BAS (220N053). The goal of the project is to investigate the late Pleistocene coastal record to reveal the past-sea level, environmental changes and determine the differential uplift along the 1200 km coastline between Sinop (Türkiye) and Varna (Bulgaria). After 3 years of intense field and laboratory work, the BlackSea-Rise program enabled us to thoroughly inspect the nature of exposed uplifted coastal record (fossil beach and dune) and produced over 100 absolute age determinations (luminescence, radiocarbon and U series), grain size characterization of sediments, identification of mollusc fauna and stable-radiogenic isotopes at 16 distinct focus sites. This space-time dataset is used to reconstruct the relative sea-level curve of the Black Sea and the explore the dynamics of the five past transgressions for the last 120 thousand years.

How to cite: Şahiner, E., Erturaç, M. K., Kandemir, R., Kostov, K., Hasözbek, A., Kapan Ürün, S., Okur, H., Salman, İ., Jiménez Barredo, F., Nakov, R., and Kazancı, N.: Reconstructing the relative sea level of the Black Sea during the last glacial period , EGU General Assembly 2025, Vienna, Austria, 27 Apr–2 May 2025, EGU25-7181, https://doi.org/10.5194/egusphere-egu25-7181, 2025.

EGU25-7310 | ECS | Posters on site | GM3.8

Past wave climate reconstruction through paleo shoreline analysis and implications under future climate scenarios 

Jacob Melly, Tobia Lahbi, Sebastián Richiano, Ian Goodwin, Patricio Ruiz, Alejandro Montes, and Alessio Rovere

Strandplain formations along the world’s coastlines provide a unique record of paleo sea level and wave climate. Here, sequentially formed beach deposits preserve the direction of dominant wave energy flux over decadal to centennial scales. This is especially true in sheltered embayments that minimize factors such as longshore transport, extreme waves, and eolian reworking. Beach profile and planform reflect the prevailing local wave conditions and numerical models provide the link between nearshore waves and their deep-water genesis, allowing the description of regional wave climate and its interpretation in the context of global atmospheric patterns. Still, opportunities exist to extend the range of past wave climate studies in order to disentangle the signal of climatic forcing from that of other processes such as changes in sediment budget, Glacial Isostatic Adjustment, and tombolo evolution. We focus on the understudied South Atlantic Ocean due its unique wave climate and atmospheric circulation patterns with relevance to global teleconnections. Specifically, sites along the Brazilian coast evidence past changes in sediment supply and shifts in estuarine inlets or fluvial deltas. Meanwhile, sites along the coast of Argentina reflect onshore reworking of sediments and tombolo evolution. Both scenarios lend themselves to the study of climatic versus non-climatic forcing and we seek to determine if past wave climate reconstruction is possible from paleo shorelines along South Atlantic coasts.

This presentation is a contribution to the WARMCOASTS project, which has received funding from the European Research Council under the European Union's Horizon 2020 research and innovation programme (grant agreement n. 802414)

How to cite: Melly, J., Lahbi, T., Richiano, S., Goodwin, I., Ruiz, P., Montes, A., and Rovere, A.: Past wave climate reconstruction through paleo shoreline analysis and implications under future climate scenarios, EGU General Assembly 2025, Vienna, Austria, 27 Apr–2 May 2025, EGU25-7310, https://doi.org/10.5194/egusphere-egu25-7310, 2025.

EGU25-10700 | Orals | GM3.8

Addressing Overprinting and Reoccupation of Middle-Late Pleistocene Palaeoshorelines in Southern Italy 

Giovanni Scicchitano, Vincenzo De Santis, Massimo Caldara, Giovanni Scardino, and Marco Meschis

The reconstruction of Late Quaternary sea-level changes in tectonically stable regions presents significant challenges, particularly in areas where younger sea-level highstands have modified or overprinted older palaeoshorelines. In this context, the synchronous correlation method has emerged as a critical tool for accurately constraining uplift rates and resolving the complexities of relative sea-level indicators (RSLi). This method integrates field observations, high-resolution topographic profiles, and global sea-level curves, iteratively aligning predicted and observed elevations to provide robust chronological frameworks for undated or ambiguous features. This study applies the synchronous correlation method alongside advanced dating techniques (U-series, AAR) to investigate reoccupation phenomena in the Apulian foreland and Cilento regions of Southern Italy. These areas, characterized by slow uplift rates, provide an ideal setting to explore the overprinting of palaeoshorelines. In Cilento, uplift rates of 0.009 mm/yr were calculated, revealing reoccupation between MIS 9c and MIS 5e. Similarly, in Puglia, the reoccupation of MIS 7.3 by MIS 5.5 demonstrates the complexities of palaeoshoreline preservation under low uplift conditions. By addressing the "overprinting problem," the synchronous correlation method enables precise age assignments and enhances understanding of the interplay between tectonics and eustatic processes. These findings refine interpretations of Mediterranean Quaternary coastal evolution and offer insights into palaeoclimate reconstructions, providing a foundation for assessing future coastal risks in tectonically stable regions. The integration of this methodology with multidisciplinary tools underscores its significance for advancing palaeoenvironmental studies.

How to cite: Scicchitano, G., De Santis, V., Caldara, M., Scardino, G., and Meschis, M.: Addressing Overprinting and Reoccupation of Middle-Late Pleistocene Palaeoshorelines in Southern Italy, EGU General Assembly 2025, Vienna, Austria, 27 Apr–2 May 2025, EGU25-10700, https://doi.org/10.5194/egusphere-egu25-10700, 2025.

EGU25-10974 | ECS | Posters on site | GM3.8

Using modern associations of microfauna to improve local relative sea-level reconstructions – a local transfer function for the Shetland Islands (UK) 

Juliane Scheder, Sue Dawson, Thomas Goovaerts, Max Engel, Pedro Costa, Maarten Van Daele, Rikza Nahar, Marc De Batist, and Vanessa M.A. Heyvaert

High-resolution relative sea-level (RSL) reconstructions are important for managing coastal-protection challenges and for a complete hazard assessment. For the determination of palaeo-tsunami run-up heights in the Shetland Islands, United Kingdom, within the NORSEAT Project (Storegga and beyond – North Sea tsunami deposits offshore Shetland Islands), reconstructions of the RSL far beyond existing data are crucial. Existing RSL data are limited to two time periods (ca. 7900–5990 cal BP and around 3500 cal BP) and extrapolation of these data leads to a large vertical error (±8 m around the time of the Storegga tsunami). More detailed Holocene RSL reconstructions shall be enabled by a combined modern training set of foraminifers and ostracods from three different voes of Shetlands largest island, Mainland. A RSL transfer function, which relates the elevation, hence the duration of water coverage, of surface samples to the modern microfaunal associations, will be derived from the training set. This transfer function will be a valuable tool for high-resolution RSL reconstructions from the Holocene stratigraphic record around the Shetland Islands.

44 surface samples were collected from three salt marshes and adjacent tidal flats (southern Dales Voe, Dury Voe and northern Dales Voe). Most salt-marsh samples contain exclusively agglutinated foraminifers, with lower occurrences in the upper marsh, whereas in a small pond with permanent water coverage (Dury Voe), also calcareous foraminifers and living ostracods where found. Abundances decrease in most tidal-flat samples, with coarser areas almost void of microfauna, and increase again towards the low-tide and subtidal level. Aside from the investigation of the microfaunal distribution, analyses of environmental parameters like the grain-size distribution and the carbonate and organic matter content are still in progress. Multivariate statistics will determine the main influencing factor of the microfauna distribution between these environmental proxies and the elevation relative to mean sea level.

The final transfer function will be applied to Holocene deposits from offshore cores around Shetland that were conducted within the NORSEAT Project. The resulting new RSL reconstructions will enable a more accurate determination of run ups of the currently identified palaeo-tsunamis (Storegga and two younger events).

How to cite: Scheder, J., Dawson, S., Goovaerts, T., Engel, M., Costa, P., Van Daele, M., Nahar, R., De Batist, M., and Heyvaert, V. M. A.: Using modern associations of microfauna to improve local relative sea-level reconstructions – a local transfer function for the Shetland Islands (UK), EGU General Assembly 2025, Vienna, Austria, 27 Apr–2 May 2025, EGU25-10974, https://doi.org/10.5194/egusphere-egu25-10974, 2025.

EGU25-12706 | ECS | Posters on site | GM3.8

Multiproxy study of borehole data from the Ionian coastal belt: new suggestion on the Late Quaternary coastal evolution of the Basilicata segment 

Giuseppe Corrado, Dario Gioia, Antonio Minervino Amodio, and Marcello Schiattarella

In this work we have adopted a multidisciplinary approach to define the Quaternary stratigraphic pattern of the segment of the Ionian alluvial-coastal plain located in Basilicata (southern Italy). This can be useful for a comparison with sequences of morpho-evolutionary stages of other coastal plains of the Italian peninsula in the same geodynamic context. Several analyses have been performed on samples from two cores drilled in the northern portion of the Metaponto Plain. Such data were used to calibrate other core logs collected by public institutions and in previous papers.

 The drilling survey and the location of the boreholes were planned based on the geomorphic study of the coastal strip in the part of the present plain. The geomorphological setting and the sedimentological features of the Metaponto Plain were previously investigated by other authors, but some issues about its Late Quaternary evolution are still open. Our efforts aim to reconstruct in detail the environmental conditions of the study area, with particular emphasis on morphotectonics and sea-level changes that influenced the evolution of the plain during the upper part of the Pleistocene and the Holocene. All these data revealed strong variations inside the plain depositional setting, as inferred by the presence of marine, transitional, and continental deposits, and suggest an anomalous position of sea-level reference points.

How to cite: Corrado, G., Gioia, D., Minervino Amodio, A., and Schiattarella, M.: Multiproxy study of borehole data from the Ionian coastal belt: new suggestion on the Late Quaternary coastal evolution of the Basilicata segment, EGU General Assembly 2025, Vienna, Austria, 27 Apr–2 May 2025, EGU25-12706, https://doi.org/10.5194/egusphere-egu25-12706, 2025.

EGU25-13778 | ECS | Posters on site | GM3.8

Last Interglacial (Mis 5e) Sea-Level Index Points and Beach Ridge Reconstructions from South Carolina And Florida 

Silas Dean, Nikos Georgiou, Alexander Simms, Robert Poirier, William R. Doar III, Dominik Brill, Jacqueline Austermann, and Alessio Rovere

The Last Interglacial (Marine Isotope Stage (MIS) 5e; ~125,000 Before Present) is a potential analog for modern and future sea-level rise. The East and Gulf Coasts of the United States are useful regions for MIS 5e sea-level reconstructions because they rest on a trailing-edge margin where the tectonic contribution to relative sea level during the late Pleistocene is minimal, and post-glacial isostatic subsidence is a factor due to forebulge collapse. Here we present results from two field investigations conducted for the WARMCOASTS project. The first is a campaign to collect luminescence dating from the Myrtle Beach sector of South Carolina, where we identified several points for which past sea level can be identified at a precise elevation with strong chronology. (sea-level index points). In this area the landscape is defined by a series of sequential beach ridges from the Pliocene and later. Our sampling and dating confirmed the MIS 5e identification of one of these ridges, which we documented with centimeter-scale precision using differential GPS and photogrammetry. These sea-level index points are presented and interpreted together with glacio-hydro-isostatic adjustment model outputs. The second campaign took place in the Florida Panhandle at Port St. Joe and consisted of differential GPS-corrected ground penetrating radar surveys of the extant ridge and swale topography in the area. This study reconstructed the sequence of beach ridge formation during different phases and provides insight into changing conditions based on morphological characteristics of the beach ridge reflectors. Both these sets of data can also be used to discuss the timing and magnitude of glacio-hydro-isostatic adjustment’s contribution to relative sea level, since our research shows conditions during the Last Interglacial at different distances from the ice sheets. This presentation is a contribution to the WARMCOASTS project, which has received funding from the European Research Council (ERC) under the European Union's Horizon 2020 research and innovation programme (grant agreement n. 802414)

How to cite: Dean, S., Georgiou, N., Simms, A., Poirier, R., Doar III, W. R., Brill, D., Austermann, J., and Rovere, A.: Last Interglacial (Mis 5e) Sea-Level Index Points and Beach Ridge Reconstructions from South Carolina And Florida, EGU General Assembly 2025, Vienna, Austria, 27 Apr–2 May 2025, EGU25-13778, https://doi.org/10.5194/egusphere-egu25-13778, 2025.

Our recent investigations along the Coastal Cordillera in Central-South Chile have identified up to three marine terrace levels in areas including Vegas del Itata, Purema, Coliumo, Punta de Parra, Talcahuano, and Coronel. These terraces appear to correlate with those previously mapped to the north between Pelluhue and Pichilemu, and to the south between Coronel and the Arauco Peninsula. Prior studies in the region have reported uplift rates ranging from 0.3 to 1.1 m/ka between Pelluhue and Pichilemu, and 1.8 ± 0.2 m/ka for the ~125-ka-old marine terrace on the Arauco Peninsula. Notably, areas with recognized faults exhibit higher uplift rates, while regions between these faults tend to have lower rates. The identified marine terrace levels have been associated with Marine Isotope Stages (MIS) 5, 7, and 9. Through a comprehensive analysis of the newly mapped terraces' shoreline angles, we anticipate deriving similar uplift rates for this area.

How to cite: Vergara, P. and Marquardt, C.: Quaternary coastal uplift along the Coastal Cordillera along Central-South Chile: preliminary results from new marine terraces mapping , EGU General Assembly 2025, Vienna, Austria, 27 Apr–2 May 2025, EGU25-14153, https://doi.org/10.5194/egusphere-egu25-14153, 2025.

EGU25-14872 | ECS | Posters on site | GM3.8

Late Pleistocene-Holocene Sedimentation and Sea Level Changes in the Gulf of Kuşadası: Evidence from High-Resolution Seismic and Sediment Core Data 

Yeliz Mert, Kürşad Kadir Eriş, Denizhan Vardar, Gülsen Uçarkuş, and Derman Dondurur

The Late Quaternary sedimentary succession and sea-level changes in the Gulf of Kuşadası, located in the Aegean Sea, have been comprehensively examined using high-resolution seismic reflection profiles and sediment cores collected by R/V TUBITAK Marmara in 2022. The seismic stratigraphy reveals four main depositional units, each bounded by distinct reflection surfaces that reflect significant sea-level fluctuations since the Last Glacial Maximum (LGM). Correlation of the seismic profiles with the 14C-dated sediment cores provides the robust chronology of seismic stratigraphic units, seismic boundaries, paleo wave-abraded platforms, and marine terraces. The depths of the paleoshorelines observed in the seismic profiles were compared with the global sea-level curve to more accurately determine the timing of sea-level changes in the gulf. The deepest wave-abraded platform observed in the seismic profiles is at a depth of -172 m. According to chronology of the depositional units in the seismics adjusted with 14C-datings from the cores, the deepest wave-abraded platform at -172 m in the seismic profile conforms with the sea-level lowstand (-135 m) at ca. 21.5 cal ka BP during the LGM based on the global sea-level curve. Such comparison reveals the subsidence of the submerged seafloor due to vertical displacement along active normal faults in the Gulf of Kuşadası since the LGM. Subsequent sea-level rise triggered by post-glacial warming led to the deposition of transgressive units characterized by coastal onlaps and localized channel fills. Brief sea-level stillstands disrupted this transgressive phase at approximately 17 cal ka BP and 14.6 cal ka BP, forming younger wave-abraded platforms at -135 m and -112.5 m, respectively. The depths of these platforms, compared with the global sea-level curve, suggest ongoing subsidence at a slower rate, indicating a complex interplay between sea-level changes and tectonic activity in the Gulf. The subsidence is likely attributed to tectonic movements along the seafloor rather than hydrostatic loading.

The acoustic reflection characteristics, together with the geometry and spatial extents of the seismic stratigraphic units, also provide important insights into the depositional processes during the changing sea-level. The most prominent depositional facies can be presented in the seismic profiles as two amalgamated deltaic sequences of the paleo-Küçük Menderes River. Their depositional periods can be confidently deduced from the correlation of the seismic stratigraphic units with the chronostratigraphic units in the cores. The topset/foreset transitions of these deltaic sequences, located at depths of -37.5 m and -112.5 m in the seismic profiles, correspond to estimated ages of 9.3 cal ka BP and 14.6 cal ka BP, respectively.

How to cite: Mert, Y., Eriş, K. K., Vardar, D., Uçarkuş, G., and Dondurur, D.: Late Pleistocene-Holocene Sedimentation and Sea Level Changes in the Gulf of Kuşadası: Evidence from High-Resolution Seismic and Sediment Core Data, EGU General Assembly 2025, Vienna, Austria, 27 Apr–2 May 2025, EGU25-14872, https://doi.org/10.5194/egusphere-egu25-14872, 2025.

EGU25-15459 | Orals | GM3.8

Holocene coastal landforms and Quaternary sea level flucutations 

Anne-Morwenn Pastier, Laurent Husson, Luca Malatesta, Kim Huppert, Gino De Gelder, and Boucharat Yannick

Coastal landforms are routinely used as “Sea Level Index Points” (SLIP). Among those, owing to their outstanding morphologies, stacks of Quaternary coral reefs are most noticeable. Yet, on top of sea level fluctuations, their morphogenesis is indiscriminately affected by vertical land motion and biological factors. Deciphering their respective influence requires understanding the morphogenesis of individual landforms within their sequences. Here we numerically model the morphogenesis of Quaternary coastal landforms to explore the sensitivity of the morphology of individual terraces to earlier sea-level fluctuations, but also tectonics and biological factors. We focus on Holocene terraces, show that their morphologies depend at first order on vertical land motion, and identify a series of regimes that depend on the morphogenesis of earlier reef units. Biological properties of reef growth mostly modulate the general pattern, albeit occasionally triggering alternative morphogenetic behaviors. Regarding the potential use of landforms as “SLIP”, predictions with different sea level curves reveal that Holocene landforms are sensitive to sea level fluctuations to a lesser extent than to vertical land motion. Last, we extrude our analysis to earlier interglacials, revealing how the morphologies of earlier coral reefs may differ from their modern/Holocene analogues.

How to cite: Pastier, A.-M., Husson, L., Malatesta, L., Huppert, K., De Gelder, G., and Yannick, B.: Holocene coastal landforms and Quaternary sea level flucutations, EGU General Assembly 2025, Vienna, Austria, 27 Apr–2 May 2025, EGU25-15459, https://doi.org/10.5194/egusphere-egu25-15459, 2025.

EGU25-20799 | Orals | GM3.8

New constraints on sea levels since the Last Glacial Maximum derived from the Atlantic coast of Africa and Southeast Asia 

Benjamin Horton, Tanghua Li, Timothy A. Shaw, and Matteo Vacchi

Reconstructions of relative sea-level (RSL) change from far-field regions (i.e., located far from extinct ice sheets) since the Last Glacial Maximum (LGM) provide fundamental constraints to global ice volumes. Most published sea-level records are temporally restricted to the Holocene (last ~11.7 ka BP) with very few extending to the LGM. Here, we present two new databases that quantify the magnitudes and rates of sea-level changes along the Atlantic coast of Africa and Southeast Asia from the LGM to present.

  •  (1) Along the Atlantic coast of Africa, we compiled a database of 341 sea-level index points. During the LGM, RSL progressively dropped from -99.4 ± 2 m at 26.7 ± 0.5 ka BP to -103.0 ± 0.8 m at 19.9 ± 0.8 ka BP with average rates by -1 mm/yr. From ~15 to ~7.5 ka, RSL show phases of major accelerations with rates up to ~25 mm/yr, the timing of which is non-coincident with the Meltwater Pulse 1B and a major deceleration triggered by the ~8.2 ka cooling event. In the mid to late Holocene, data indicate the emergence of a sea-level highstand, which varied in magnitude (0.8 ± 0.8 to 4.0 ± 2.4 m above present mean sea level) and timing (5.0 ± 1.0 to 1.7 ± 1.0 ka BP).
  • In Southeast Asia we compiled a database of 113 sea-level index points from the Sunda Shelf and Singapore. RSL rose from a lowstand of −121.1 m at 20.7 ka BP to −112.3 m at ~19 ka BP at rates of RSL rise up to ~7 mm/yr. Between ~16 ka and ~13 ka BP, RSL rose to −70 m with a cluster of SLIPs associated with the Meltwater Pulse 1A. The average rate of RSL rise reached ~15 mm/yr. In the Holocene RSL rose from −20.6 m at 9.4 ka BP to −0.25 m at ~7 ka BP at a maximum rate of 15 mm/yr. The rate of RSL rise subsequently slowed as RSL continued to rise and reached a mid-Holocene highstand of ~4.6 m at 5.2 ka BP. SLIPs constraining the mid- to late-Holocene transition suggest RSL fell below present level to −2.2 m between ~2.5 and ~0.25 ka BP at a rate of −1 mm/yr.

How to cite: Horton, B., Li, T., Shaw, T. A., and Vacchi, M.: New constraints on sea levels since the Last Glacial Maximum derived from the Atlantic coast of Africa and Southeast Asia, EGU General Assembly 2025, Vienna, Austria, 27 Apr–2 May 2025, EGU25-20799, https://doi.org/10.5194/egusphere-egu25-20799, 2025.

EGU25-21376 | Orals | GM3.8 | Highlight

Tropical beach ridge stratigraphy as a proxy for reconstructing late-Holocene regional sea-level histories in southeast Asia. 

Adam Switzer, Rahul Kumar, Yu Ting Yan, Wanxin Huang, Jędrzej Majewski, and Abang Mansyursyah Surya Nugraha

Sea-level histories spanning the Common Era are crucial for linking sea-level change to climate change, yet they have not been widely studied in Southeast Asia. This link is proxy dependant, and most proxies only provide decadal to centennial scale resolution of both sea level and climate. Here, we examine topographically corrected Ground Penetrating Radar (GPR) profiles along with Optically Stimulated Luminescence (OSL) ages for geochronology.  The efficiency of using this method to examine beach ridge stratigraphy as a proxy for reconstructing regional sea-level histories in the tropics has recently been demonstrated by Kumar et al., (2024).  This approach can be a highly efficient and effective means for reconstructing regional sea-level trends in beach ridges settings. Here, we present common er sea level histories from beach ridges in Indonesia and Thailand that were reconstructed by identifying downlap points that mark the boundary between the foreshore and shoreface and use this as a past low-tide marker. The datasets allow us to compare and contrast the Common Era sea level history of the two coasts and link the evolution to late Holocene sea level and climate variability.

Kumar, R., Switzer, A.D., Gouramanis, C., Bristow, C.S., Shaw, T.A., Jankaew, K., Li, T. and Brill, D., 2024. Late-Holocene sea-level markers preserved in a beach ridge system on Phra Thong Island, Thailand. Geomorphology, 465, p.109405.

How to cite: Switzer, A., Kumar, R., Yan, Y. T., Huang, W., Majewski, J., and Nugraha, A. M. S.: Tropical beach ridge stratigraphy as a proxy for reconstructing late-Holocene regional sea-level histories in southeast Asia., EGU General Assembly 2025, Vienna, Austria, 27 Apr–2 May 2025, EGU25-21376, https://doi.org/10.5194/egusphere-egu25-21376, 2025.

EGU25-21691 | Posters on site | GM3.8

Coral reefs of the Leeward Antilles (SouthernCaribbean) steered into unchartered waters byhuman impacts 

Paolo Stocchi, Patrick T. Boyden, Alessio Rovere, Andreas F. Haas, Yusuf C. El-Khaled, Sonia Bejarano, Christian Wild, Eric Mijts, Giovanni Scicchitano, and Mark Vermeij

Over the past 50 years, coral reefs have experienced a global decline due to the combined effects of human activities and climate change. Historical data on reef communities prior to significant human impacts in tropical regions is scarce, with only a few locations benefiting from long-term monitoring efforts. Pleistocene coral reefs, where preserved, provide valuable baselines for understanding the evolution of modern reef ecosystems. In this study, we compare the evolution of coral reef communities on the island of Curaçao (Leeward Antilles, Caribbean) between 1973 and 2023 with the dynamics of reef communities in Last Interglacial fossil reefs on the islands of Aruba, Curaçao, and Bonaire. Our findings reveal that modern reefs in the ABC islands, under increasing pressures from overpopulation, overfishing, coastal pollution, and invasive species, are being driven into uncharted territory, exhibiting conditions unmatched even by their fossil counterparts from the Last Interglacial period.

How to cite: Stocchi, P., Boyden, P. T., Rovere, A., Haas, A. F., El-Khaled, Y. C., Bejarano, S., Wild, C., Mijts, E., Scicchitano, G., and Vermeij, M.: Coral reefs of the Leeward Antilles (SouthernCaribbean) steered into unchartered waters byhuman impacts, EGU General Assembly 2025, Vienna, Austria, 27 Apr–2 May 2025, EGU25-21691, https://doi.org/10.5194/egusphere-egu25-21691, 2025.

CL2 – Present Climate – Historical and Direct Observations

Wild (2020), and Wild and Bosilovich (2024) provide estimates of global mean energy balance components as represented in climate models and reanalyses, with reference estimates from Loeb et al. (2018), Wild et al. (2015, 2019), L’Ecuyer et al. (2015) and Kato et al. (2018). Here we add a theoretical reference estimate (TRE) based on four radiative transfer equations and geometric considerations as detailed in Zagoni (2025). The equations do not refer to the atmospheric gaseous composition or the reflective properties of the surface or clouds. The first equation is a clear-sky constraint relationship on the net radiation at the surface (RN), following from the two-stream approximation of Schwarzschild’s (1906-Eq.11) radiative transfer equation as given in standard university textbooks on atmospheric physics and radiation (Goody, Oxford, 1964_Eq.2.115; Houghton, Cambridge, 1977_Eq.2.13; Hartmann, Academic Press 1994, Eqs. 3.51-3.54;  Ambaum, RoyalMetSoc, 2021_Eq.10.56), and in university lecture notes (Stephens 2003): RN=OLR/2. The second equation is a clear-sky constraint relationship on the total radiation at the surface (RT), following from the simplest greenhouse geometry (Hartmann 1994, Fig.2.3): RT=2OLR. The third and fourth equations are all-sky versions of the first pair: RN(all-sky)= (OLR–LWCRE)/2, and RT(all-sky)=2OLR+LWCRE. Two decades of CERES observations (EBAF Ed4.1 April 2000–March 2022) give –2.33, –2.82, 2.71 and 2.44 [Wm-2] deviations for the four equations, respectively, with a mean difference of 0.00. The all-sky equations are justified by an independent estimate of GEWEX within 0.1 Wm-2 (Zagoni 2024). The solution can be given in small integer ratios relative to LWCRE as the unit flux; the best fit is 1 unit = 26.68 Wm-2, see Table1 (highres figures and other info about TRE available at TABLELINK). Some of the most remarkable precisions are in TOA SW up all-sky (=100) and clear-sky (=53). — Li, Li, Wild and Jones (2024) provide a global radiation budget from a surface perspective from 34 CMIP6 models for 2000-2022, with differences from the TRE integer positions less than 1 Wm-2 in SW down radiation, Thermal down Surface and the convective flux (Sensible heat + Latent heat); less than 2 Wm-2 in Thermal up Surface; and less than 3 Wm-2 in Reflect by surface; each within the noted ranges of uncertainty. Stackhouse et al. (2024) give Earth radiation budget at top-of-atmosphere; TRE differ from 2001-22 Climatological Mean in OLR, TSI and RSW by 0.23, 0.03 and 1.05 [Wm-2], see details in TABLELINK in References.


References

Li, X., Li, Q., Wild, M. and Jones, P. (2024) An intensification of surface EEI. NatureCommE&E, https://www.nature.com/articles/s43247-024-01802-z

Stackhouse, P., et al. (2024) State of the Climate 2023, Bull. Am. Met. Soc. 105:8, https://journals.ametsoc.org/view/journals/bams/105/8/2024BAMSStateoftheClimate.1.xml

Stephens, G. (2003) Colorado_State_University_AT622_Section 6_Eqs. (6.10a)-(6.10b), Example 6.3, Fig. 6.3a, https://reef.atmos.colostate.edu/~odell/AT622/stephens_notes/AT622_section06.pdf

Wild, M. (2020) The global energy balance as represented in CMIP6 climate models. Climate Dynamics 55:553–577, https://doi.org/10.1007/s00382-020-05282-7

Wild, M., Bosilovich, M. (2024) The global energy balance as represented in reanalyses. Surv Geophys, https://link.springer.com/article/10.1007/s10712-024-09861-9

Zagoni, M. (2024) Modeling and Observing Global Energy and Water Cycles by GEWEX. AGU Fall Meeting, https://agu.confex.com/agu/agu24/meetingapp.cgi/Paper/1535956

Zagoni, M. (2025) Trenberth’s Greenhouse Geometry. AMS Annual Meeting, https://ams.confex.com/ams/105ANNUAL/meetingapp.cgi/Paper/445222  see also the updated Supplementary Material video: https://www.earthenergyflows.com/Zagoni-EGU2024-Trenberths-Greenhouse-Geometry_Full-v03-480.mp4

TABLELINK: https://earthenergyflows.com/TRE20.pdf

How to cite: Zagoni, M.: Theoretical reference estimate for the components of the global energy balance, EGU General Assembly 2025, Vienna, Austria, 27 Apr–2 May 2025, EGU25-1, https://doi.org/10.5194/egusphere-egu25-1, 2025.

EGU25-27 | Orals | CL2.1

Observational evidence of strong aerosol fingerprints on clouds and effect on radiative forcing 

Ying Chen, Jim Haywood, Yu Wang, Florent Malavelle, George Jordan, Amy Peace, Daniel Partridge, Nayeong Cho, Lazaros Oreopoulos, Daniel Grosvenor, Paul Field, Richard Allan, and Ulrike Lohmann

Aerosol-cloud-interactions (ACI) is a leading uncertainty in estimates of their radiative forcing and hence for climate projection. The aerosol radiative forcing obtained from climate models is poorly constrained by observations, because the ACI signal is frequently entangled with noise of meteorological co-variability.

       The Iceland-Holuhraun volcanic eruption in Iceland in 2014 provided an unprecedented opportunity to examine ACI of marine low-level clouds and how well they are represented in climate models. Malavelle et al. (2017) used Collection 5 data from the MODIS Aqua satellite and provided an assessment of the impact of the large release of sulfur dioxide on cloud effective radius (reff) and cloud liquid water path (LWP), finding a considerable impact on the former, but no impact on the latter. We revisit this eruption with a considerably extended satellite record which includes new Collection 6 data from the Terra and Aqua satellite and additional years of data from 2015-2020. This tripling of satellite data allows using novel data-science approach for a more rigorous assessment of ACI, including the impacts not just on cloud micro-physical properties (reff and LWP), but also on the macro property cloud coverage (Chen et al., 2022).

These results show that cloud fraction is significantly increased by 10% and appears to surpass cloud brightening and to be the dominant factor in aerosol indirect radiative cooling. The ACI cooling effect via increasing of cloud cover is even more remarkable in tropics (Fig.1, upto 50%), as demonstrated by our recent study of Hawaii volcanic natural experiments (Chen et al., 2024). Climate models are unable to replicate such strong impacts on cloud cover. These results show that the ongoing debate about the cooling impact of aerosols is far from over while climate models continue to inadequately represent the complex macro- and micro-physical impacts of ACI. These researches point towards a direction and provide new constraints for improving model representation of ACI.

Figure 1. Aerosol-induced changes in cloud cover from volcano natural experiments. Source: Chen et al., (2024)


References:

Chen, Y., Haywood, J., Wang, Y., Malavelle, F., Jordan, G., Partridge, D., Fieldsend, J., De Leeuw, J., Schmidt, A., Cho, N., Oreopoulos, L., Platnick, S., Grosvenor, D., Field, P., and Lohmann, U.: Machine learning reveals climate forcing from aerosols is dominated by increased cloud cover, Nature Geoscience, 10.1038/s41561-022-00991-6, 2022.

Chen, Y., Haywood, J., Wang, Y., Malavelle, F., Jordan, G., Peace, A., Partridge, D. G., Cho, N., Oreopoulos, L., Grosvenor, D., Field, P., Allan, R., and Lohmann, U.: Substantial cooling effect from aerosol-induced increase in tropical marine cloud cover, Nature Geoscience, https://doi.org/10.1038/s41561-024-01427-z, 2024.

Malavelle, F., Haywood, J., Jones, A. et al. Strong constraints on aerosol–cloud interactions from volcanic eruptions. Nature 546, 485–491 (2017). https://doi.org/10.1038/nature22974


How to cite: Chen, Y., Haywood, J., Wang, Y., Malavelle, F., Jordan, G., Peace, A., Partridge, D., Cho, N., Oreopoulos, L., Grosvenor, D., Field, P., Allan, R., and Lohmann, U.: Observational evidence of strong aerosol fingerprints on clouds and effect on radiative forcing, EGU General Assembly 2025, Vienna, Austria, 27 Apr–2 May 2025, EGU25-27, https://doi.org/10.5194/egusphere-egu25-27, 2025.

EGU25-601 | ECS | Orals | CL2.1

Impact of Aerosol Optical Properties on Surface reaching Shortwave Radiation over Delhi in WRF-Chem 

Sumit Kumar, Gaurav Govardhan, and Sachin Ghude

The Earth's radiation budget is a fundamental determinant of climate dynamics, serving as the primary energy source for the planet and influencing its climate system's evolution. Aerosols, as a climate forcer, modify the distribution of solar radiation in the atmosphere and reduce the radiation reaching the Earth's surface. 

The Weather Research and Forecasting model coupled with Chemistry (WRF-Chem) is actively used in operational air quality forecasting systems across the globe. Previous studies have shown that the model has limited success in predicting the air quality over the Indian national capital, New Delhi, especially when the Air Quality Index is in ‘Severe’ conditions during the winter months. It has been reported that the model depicts a mean bias of ~ 34 Wm-2 in downward shortwave radiation (SWDOWN) flux reaching the surface which may have led to overestimated near-surface temperature (~3.18 ⁰C). This warm bias in temperature might lead to a greater vertical dispersion of the near-surface pollutants, leading to an underestimation of air quality close to the surface. Such biases in the SWDOWN can be due to inadequate information of optical properties of aerosols in the model.  

This study aims to address this gap by incorporating realistic complex refractive indices of aerosol species into WRF-Chem simulations over the ambient environment of Delhi. Five sensitivity experiments (EXP) were conducted, focusing on the impact of aerosol optical properties on the radiative fluxes during the winter season of 2023-24. The results demonstrate that altering a single aerosol optical parameter leads to a reduction in surface shortwave radiation flux by 28–30 Wm⁻² during October and November, and 25 Wm⁻² during December and January, relative to control simulations. Model outputs, validated against observational data, indicate a reduction in the mean bias of SWDOWN by 12.99 Wm⁻² and 17.24 Wm⁻² in December and January, respectively. These results underscore the significant role of aerosol optical properties in modulating radiative fluxes and their implications for the surface energy budget. 

The study also examines the impacts of modified radiation parameterization on the model-simulated aerosol fields like the near-surface PM2.5 concentration using ground-based measurements and the Aerosol Optical Depth (AOD) over the region as space-based measurements from instruments like MODerate resolution and Imaging Spectroradiometer (MODIS) onboard the TERRA and AQUA satellites. Preliminary findings, revealing the impact of radiation bias on the simulation of meteorological variables and subsequent weather events, will be presented during the session of EGU 2025.

How to cite: Kumar, S., Govardhan, G., and Ghude, S.: Impact of Aerosol Optical Properties on Surface reaching Shortwave Radiation over Delhi in WRF-Chem, EGU General Assembly 2025, Vienna, Austria, 27 Apr–2 May 2025, EGU25-601, https://doi.org/10.5194/egusphere-egu25-601, 2025.

EGU25-633 | Orals | CL2.1

Atmospheric Radiation Laboratory (ARL) in Monsoon core zone: A unique research facility in Central India 

Burrala PadmaKumari, Anil Kumar Vasudevan, Udaya Kumar Sahoo, Jeni Victor, Yang Lian, Libin Tr, Mahesh Nikam, Sanket Kalgutkar, and Pandithurai Govindan

The Central India (CI), wherein synoptic-scale disturbances (monsoon lows and depressions) frequently pass through during the monsoon season, is identified as a monsoon core zone where detailed long-term atmospheric measurements of convection, clouds, precipitation, and radiation are overdue.

Considering the importance of observational and analytical research in this area, an Atmospheric Research Testbed in Central India (ART-CI) is established by the Ministry of Earth Sciences, Government of India. ART-CI is a huge permanent observational facility envisioned as a national research testbed with multiple laboratories (aerosol, radiation, cloud and precipitation measurements) and scientific user facilities similar to the international Atmospheric Radiation Measurement (ARM) site, USA.

Our climate system is largely determined by the Earth’s Radiation Budget, and is significantly influenced by drastic changes in clouds, aerosols, and greenhouse gases. Hence, to have long-term surface observations for monitoring the changes/trends in the Surface Radiation Budget, important for climate monitoring and prediction, Atmospheric Radiation Laboratory (ARL) is established in August 2023, as a part of the major research facility ART-CI. At ARL, a suite of radiation sensors was installed for continuous measurements of all components of solar and terrestrial radiation (such as total, direct and diffuse shortwave, long-wave, net and UV radiations) co-located with all other atmospheric data instrumentation.

Thus, this unique facility will have an extensive set of state-of-the-art observational systems that will provide continuous observations of land surface properties and surface energy budget. Site description, instrumentation and science plan of this new facility with initial results will be presented.

How to cite: PadmaKumari, B., Vasudevan, A. K., Sahoo, U. K., Victor, J., Lian, Y., Tr, L., Nikam, M., Kalgutkar, S., and Govindan, P.: Atmospheric Radiation Laboratory (ARL) in Monsoon core zone: A unique research facility in Central India, EGU General Assembly 2025, Vienna, Austria, 27 Apr–2 May 2025, EGU25-633, https://doi.org/10.5194/egusphere-egu25-633, 2025.

EGU25-849 | ECS | Posters on site | CL2.1

Upper Tropospheric Humidity and Cloud Radiative Forcing: A Tropical Perspective 

Devika Moovidathu Vasudevan, Ajil Kottayil, and Viju O John

Earth's energy budget defines the balance between the incoming radiant solar energy reaching Earth and the energy returning to outer space. Clouds play a significant role in Earth's energy budget. Cloud Radiative Forcing (CRF) is the difference between the radiative fluxes at the top of the atmosphere in clear-sky and all-sky conditions. Clouds introduce two contrasting effects on the Earth's energy balance: the albedo effect and the longwave effect. Clouds reflect a large amount of incoming shortwave radiation and cool the Earth, known as the Albedo effect. The energy associated with the albedo effect is known as shortwave cloud radiative forcing (SWCRF). The longwave effect or longwave cloud radiative forcing (LWCRF) denotes the warming of Earth by the cloud-trapped longwave radiation that would otherwise escape to space. Understanding the variability in the amount and distribution of clouds in a warming climate is essential as they modulate the shortwave and longwave cloud radiative feedbacks (Harrison et al., 1990; Bony, S. et al., 2006) and, thereby, the Net CRF. Upper Tropospheric Humidity (UTH) is a vital climate variable that impacts the amount of outgoing longwave radiation. In the tropics, UTH is mainly driven by deep convection. The present study analyzes the influence of UTH on the longwave cloud radiative forcing in the tropics from 2000 to 2021. This study uses the satellite microwave (MW) and infrared (IR) UTH measurements. Clouds affect IR UTH measurements, while MW measurements provide UTH under all sky conditions. Clouds and the Earth's Radiant Energy System (CERES) satellite datasets are used to calculate cloud radiative forcing. This study quantifies the UTH-LWCRF relationship and shows that UTH can explain LWCRF variability in the tropics to a large extent. The joint distribution analysis shows that UTH has a significant impact on the variability of LWCRF over land, whereas over ocean regions, sea surface temperature plays a role in modulating the UTH-LWCRF relationship. Also, the UTH-LWCRF relationship is better represented with MW UTH than IR UTH, which can be attributed to the more comprehensive and accurate MW measurements even in cloudy conditions.

How to cite: Moovidathu Vasudevan, D., Kottayil, A., and O John, V.: Upper Tropospheric Humidity and Cloud Radiative Forcing: A Tropical Perspective, EGU General Assembly 2025, Vienna, Austria, 27 Apr–2 May 2025, EGU25-849, https://doi.org/10.5194/egusphere-egu25-849, 2025.

EGU25-1626 | Orals | CL2.1

Investigation of Dust‐Induced Direct Radiative Forcing Over the Arabian Peninsula Based on High‐Resolution WRF‐Chem Simulations 

Rama Krishna Karumuri, Hari Prasad Dasari, Harikishan Gandham, Ravi Kumar Kunchala, Raju Attada, Ashok Karumuri, and Ibrahim Hoteit

This study investigates the impact of dust on radiation over the Arabian Peninsula (AP) during the reported high, low, and normal dust seasons (March-August) of 2012, 2014, and 2015, respectively. Simulations were performed using the Weather Research and Forecasting model coupled to a Chemistry module (WRF‐Chem). The simulated seasonal horizontal and vertical dust concentrations, and their interannual distinctions, match well with those from two ground‐based AERONET observations, and measurements from MODIS and CALIOP satellites. The maximum dust concentrations over the dust‐source regions in the southern AP reach vertically up to 700 hPa during the high dust season, but only up to 900– 950 hPa during the low/normal dust seasons. Stronger incoming low‐level winds along the southern Red Sea and those from Iraq bring in higher‐than‐normal dust during the high-dust summers. We conducted a sensitivity experiment by switching off the dust module to assess the radiative perturbations due to dust. The results suggest that active dust‐module improved the fidelity of simulated radiation fluxes distributions at the surface and top of the atmosphere vis‐à‐vis Clouds and the Earth's Radiant Energy System (CERES) measurements. Dust results in a 26 Wm− 2 short‐wave (SW) radiative forcing in the tropospheric column over the AP. The SW radiative forcing increases by another 6–8 Wm− 2 during the high dust season due to the increased number of extreme dust days, which also amplifies atmospheric heating. During extreme dust days, the heating rate exhibits a dipolar structure, with cooling over the Iraq region and warming of 40%–60% over the southern‐AP.

How to cite: Karumuri, R. K., Dasari, H. P., Gandham, H., Kunchala, R. K., Attada, R., Karumuri, A., and Hoteit, I.: Investigation of Dust‐Induced Direct Radiative Forcing Over the Arabian Peninsula Based on High‐Resolution WRF‐Chem Simulations, EGU General Assembly 2025, Vienna, Austria, 27 Apr–2 May 2025, EGU25-1626, https://doi.org/10.5194/egusphere-egu25-1626, 2025.

Climatic impacts of historical volcanism are principally tied to the eruption size, while observation versus model discrepancies have been commonly attributed to the uncertainties in paleo‐ reconstruction or malpresentation of volcanic aerosols in models. Here we present convergent evidence for
significant compensation effect of ocean latent heat (LH) in balancing the tropical volcanic‐induced heat loss, by introducing an effective perturbation ratio which is found to decrease with increasing eruption magnitude. Four LH compensation hot spots overlapping with the trade wind regions are identified, together with three western boundary currents regions with intensified LH loss. Comparison between the 1258 Samalas and 1452 Unidentified eruptions suggests considerable modulation of the concurring El Nino‐Southern Oscillation on LH anomaly, which is further verified by CESM large ensemble sensitivity experiments. This study depicts how the interplay between the ocean and the atmosphere could contribute to the overall resilience of the climate system in the face of volcanic disturbances.

How to cite: Gao, C. and Gao, Y.: Dwindling Effective Radiative Forcing of Large Volcanic Eruption: The Compensation Role of Ocean Latent Heat Flux, EGU General Assembly 2025, Vienna, Austria, 27 Apr–2 May 2025, EGU25-1674, https://doi.org/10.5194/egusphere-egu25-1674, 2025.

EGU25-2516 | Posters on site | CL2.1

The Global Energy Balance as represented in Atmospheric Reanalyses 

Martin Wild and Michael Bosilovich

The representation of the global mean energy balance components in 10 atmospheric reanalyses is assessed and compared with recent reference estimates as well as the ones simulated by the latest generation of climate models from the 6th phase of the coupled model intercomparison project (CMIP6). Despite the assimilation of comprehensive observational data in reanalyses, the spread amongst the magnitudes of their global energy balance components generally remains substantial, up to more than 20 Wm-2 in some quantities, and their consistency is typically not higher than amongst the much less observationally constrained CMIP6 models. Relative spreads are particularly large in the reanalysis global mean latent heat fluxes (exceeding 20%) and associated representation of the intensity of the global water cycle, as well as in the energy imbalances at the Top-of-Atmosphere and surface. A comparison of reanalysis runs in full assimilation mode with corresponding runs constrained only by sea surface temperatures reveals marginal differences in their global mean energy balance components. This indicates that discrepancies in the global energy balance components caused by the different model formulations amongst the reanalyses are hardly alleviated by the imposed observational constraints from the assimilation process. Similar to climate models, reanalyses overestimate the global mean surface downward shortwave radiation and underestimate the surface downward longwave radiation by 3 - 7 Wm-2. While reanalyses are of tremendous value as references for many atmospheric parameters, they currently may not be suited to serve as references for the magnitudes of the global mean energy balance components.


Published as:

Wild, M., and  Bosilovich, M., 2024: The Global Energy Balance as Represented in Atmospheric Reanalyses, Surveys in Geophysics,  45, 1799–1825. https://doi.org/10.1007/s10712-024-09861-9

How to cite: Wild, M. and Bosilovich, M.: The Global Energy Balance as represented in Atmospheric Reanalyses, EGU General Assembly 2025, Vienna, Austria, 27 Apr–2 May 2025, EGU25-2516, https://doi.org/10.5194/egusphere-egu25-2516, 2025.

Defined as the proportion of solar radiation transmitted through the atmosphere to the Earth's surface, the clearness index (CI) is a vital parameter widely applied in characterizing atmospheric transmittance and sky conditions. However, its application accuracy remains inadequately investigated. This study enhances the understanding and application of CI through three key advancements:

  • Establishing CI Thresholds for Sky Conditions: Standardized CI thresholds for clear-sky (>0.7) and overcast-sky (<0.2) conditions are proposed using synoptic total cloud cover, refining the previously broad ranges. Their logarithmic relationship with solar elevation angles enables accurate identification of sky conditions throughout the day.
  • Advancing Physical Threshold Testing: A CI-DF polynomial envelope, combining CI and diffuse fraction (DF), is introduced to enhance the physical threshold testing procedure. This innovation automatically and effectively filters out outliers, particularly the often-overlooked abnormally low values, thus improving the quality control of surface observations.
  • Developing a Radiation Decomposition Model: A model is established to accurately estimate direct radiation at daily and hourly scales, leveraging the logistic growth relationship between CI and the direct clearness index. This supports the growing global transition to renewable energy applications.

These findings highlight the importance of more accurate applications of CI in atmospheric radiation and energy meteorology studies.

How to cite: Wang, Y.: Enhancing the Understanding and Application of the Clearness Index, EGU General Assembly 2025, Vienna, Austria, 27 Apr–2 May 2025, EGU25-3081, https://doi.org/10.5194/egusphere-egu25-3081, 2025.

EGU25-4221 | ECS | Orals | CL2.1

Investigating trends, variability in observed and simulated upper tropospheric humidity and outgoing longwave radiation 

Thea Stevens, Richard Allan, Michaela Hegglin, Alejandro Bodas-Salcedo, and Viju John

Upper tropospheric humidity (UTH) is a diagnostic of the atmospheric water cycle and strongly contributes to climate sensitivity. Therefore, it is important to understand UTH variability and how this is represented by global climate models. Here, infrared and microwave brightness temperature observations and satellite simulations based on ECMWF Reanalysis v5 (ERA5) and the Hadley Centre Global Environment Model version 3 (HadGEM3) Atmospheric Model Intercomparison Project (AMIP) data are used to evaluate and characterise UTH variability since 1979. UTH satellite observations have been simulated using a radiative transfer code (RTTOV) from ERA5 and HadGEM3 to provide a more direct comparison of the model and reanalysis to observations.

We present results on the sensitivities of water vapour brightness temperatures. There are competing influences of temperature and specific humidity on the brightness temperatures. The effect of these is such that fluctuations can be considered as a proxy for relative humidity. Despite this, a spurious increase in UTH of up to 1% is identified for a 1K increase in profile temperature when relative humidity remains constant.

We also investigate trends and variability of UTH. Using Principal Component Analysis, we explore the spatial and temporal impact of El Niño Southern Oscillation (ENSO) on UTH distribution and link this to changes in outgoing longwave radiation (OLR). Trends show increased UTH over the Indian Ocean and decreases over the western Pacific. This mirrors large-scale dynamic changes in the Walker Circulation, which shows a weakening of the circulation over the same period.

How to cite: Stevens, T., Allan, R., Hegglin, M., Bodas-Salcedo, A., and John, V.: Investigating trends, variability in observed and simulated upper tropospheric humidity and outgoing longwave radiation, EGU General Assembly 2025, Vienna, Austria, 27 Apr–2 May 2025, EGU25-4221, https://doi.org/10.5194/egusphere-egu25-4221, 2025.

EGU25-4577 | Orals | CL2.1

Multi-Decadal Trends of Solar Radiation Reaching the Surface Determined by Aerosol-Cloud-Radiation Interactions, Climate Change, and Anthropogenic Emissions 

Mian Chin, Huisheng Bian, Martin Wild, Donifan Barahona, Hongbin Yu, Yun Qian, Anton Darmenov, Paul Stackhouse, Norman Loeb, Rachel Pinker, and Yuanchong Zhang

Incoming solar radiation drives the Earth’s climate system. Long-term surface observations of solar radiation reaching the surface have shown decreasing or increasing trends in different regions of the world in the past several decades, indicating the change of atmospheric components that reflect and/or absorb the solar radiation. This study investigates the roles of aerosols and climate change in determining the surface radiation trends through the change of anthropogenic emission, aerosol-radiation interaction, and aerosol-cloud interactions. With a series of model simulations and analysis of ground-based observations and satellite-derived data products, we will 1) estimate the relative importance of aerosols, clouds, and other radiatively active atmospheric trace gases on the surface radiation budget, 2) compare the relative magnitudes of effects from atmospheric components (aerosols, clouds, and trace gases) and atmospheric processes (aerosol-radiation interactions and aerosol-cloud interactions) in determining the surface radiation trends, and 3) assess the consequences of climate change and anthropogenic emission trends in the change of surface radiation in different regions of the world.

How to cite: Chin, M., Bian, H., Wild, M., Barahona, D., Yu, H., Qian, Y., Darmenov, A., Stackhouse, P., Loeb, N., Pinker, R., and Zhang, Y.: Multi-Decadal Trends of Solar Radiation Reaching the Surface Determined by Aerosol-Cloud-Radiation Interactions, Climate Change, and Anthropogenic Emissions, EGU General Assembly 2025, Vienna, Austria, 27 Apr–2 May 2025, EGU25-4577, https://doi.org/10.5194/egusphere-egu25-4577, 2025.

EGU25-4868 | ECS | Orals | CL2.1

Investigating Bjerknes Compensation under the abrupt-4xCO2 CMIP6 experiment 

Christine Kappatou, Joseph Henry LaCasce, Camille Li, and Ada Gjermundsen
In 1964 J. Bjerknes postulated that, when an anomaly occurs in ocean heat transport (OHT), the atmosphere heat transport (AHT) exhibits an anomaly of opposite sign so that the top of the atmosphere (TOA) transport is approximately preserved. This phenomenon is now known as Bjerknes Compensation (BJC) and has been the object of many studies in the context of steady state climate simulations, on decadal and centennial time scales. Here, we examine BJC under extreme climate forcing, specifically under the quadrupling of atmospheric CO2 in the Coupled Model Intercomparison Project Phase 6 (CMIP6). The models exhibit a pronounced decline in the Atlantic Meridional Overturning Circulation (AMOC), to varying degrees, in response to melting sea ice and increased freshwater runoff. The OHT is reduced accordingly, and this can trigger an increase in AHT, particularly in the Northern Hemisphere. We examine the degree of BJC, in the context of model climate sensitivity. We also examine how changes in overturning in the Southern Hemisphere impact AHT there. The issue is significant, as increased AHT partially compensates for the cooling implied by reduced OHT. 

How to cite: Kappatou, C., LaCasce, J. H., Li, C., and Gjermundsen, A.: Investigating Bjerknes Compensation under the abrupt-4xCO2 CMIP6 experiment, EGU General Assembly 2025, Vienna, Austria, 27 Apr–2 May 2025, EGU25-4868, https://doi.org/10.5194/egusphere-egu25-4868, 2025.

Comparing with observations, the abnormally smaller cloud absorption (to solar radiation) given by climate models (namely alleged cloud absorption anomaly) ever raised widespread concerns in the mid-1990s and early 2000s but was seldom mentioned thereafter. Based on three state-of-the-art modeled products, NCEP CFSv2, ECMWF ERA5 and NASA MERRA2, and the newest collocated satellite-surface observation in the last 12 years (2012–2023), we reinvestigate this controversial issue. Our results demonstrate the observed cloud absorption of solar radiation still significantly exceeds the modeled (regardless of modeled products), but their systematic discrepancy has dropped a lot, especially for NCEP CFSv2. NCEP CFSv2 has the lowest bias with the observation, followed by ECMWF ERA5, and the bias of NASA MERRA2 is largest. This implies that cloud absorption anomaly fluctuates with not only sites (as reported by previous studies) but also models. Models’ radiation schemes that introduce the Monte Carlo Independent Column Approximation (McICA) may mitigate the systematic discrepancy between observation and modeling essentially. Additionally, it is noteworthy that there is not a perfect approach to obtaining the observed cloud absorption and particularly the water vapor difference between clear and cloudy skies often would result in its unrealistic overestimation. If the influence from the water vapor difference is neglected, NCEP CFSv2, ECMWF ERA5 and NASA MERRA2 underestimate globally-mean cloud absorption by approximately 10.07 W/m2, 16.65 W/m2 and 18.67 W/m2, respectively; and if it is corrected, the underestimations will be reduced to 7.75 W/m2, 14.33 W/m2 and 16.35 W/m2, respectively.

How to cite: Huang, G.: Is the cloud absorption of solar radiation still underestimated significantly by current climate models?, EGU General Assembly 2025, Vienna, Austria, 27 Apr–2 May 2025, EGU25-5356, https://doi.org/10.5194/egusphere-egu25-5356, 2025.

EGU25-5791 | ECS | Posters on site | CL2.1

Asian Summer Monsoon Exacerbates the transport efficiency of Stratospheric Aerosol Injection 

Ye Lu, Jianchun Bian, and Dan Li

Efficiently delivering large quantities of climate intervention material (CIM) to the stratosphere remains a technical challenge in stratospheric aerosol injection (SAI). A novel approach, solar-powered lofting (SPL), mimics the natural ascent of wildfire smoke, using small amounts of black carbon (BC) to transport SO2 from the troposphere to the stratosphere. The Asian Summer Monsoon(ASM) anticyclone over the Tibetan Plateau can also transport aerosols into the stratosphere, acting as a “chimney”. In this study, we investigate whether these two effcts, i.e.  SPL effect and ASM “chimney effect”, combined together to deploy SAI will have better effect, by using a fully coupled Earth System Model.We select the Tibetan Plateau as the injection site for the Northern Hemisphere mid-latitudes, instead of the traditional Pacific location, and compare the differences in sulfate aerosol transport efficiency, distribution, and climate impacts. From 2040 to 2047 under the SSP5-85 emission scenario, ASM’s injection results in 20% more sulfur transported to the stratosphere and a 20% reduction in radiative forcing imbalance at mid-latitudes. Additionally, they lead to a 25% increase in both global annual average surface cooling and September Arcitc sea ice recovery.

How to cite: Lu, Y., Bian, J., and Li, D.: Asian Summer Monsoon Exacerbates the transport efficiency of Stratospheric Aerosol Injection, EGU General Assembly 2025, Vienna, Austria, 27 Apr–2 May 2025, EGU25-5791, https://doi.org/10.5194/egusphere-egu25-5791, 2025.

Accurate solar irradiance measurements are critical for optimising solar energy systems, understanding atmospheric processes, and advancing climate research. Pyrheliometers, which provide Direct Normal Irradiance (DNI) measurements over a broad spectral range, are widely used due to their simplicity, cost-effectiveness, and ease of deployment. However, they cannot provide detailed spectral information, which limits their application in advanced studies requiring wavelength-specific insights. In contrast, the Bi-Tec Sensor (BTS) spectroradiometer system measures spectral solar irradiance from 300 nm to 2150 nm with high spectral resolution, covering almost ~96.5% of the solar spectrum, and is traceable to the International System of Units (SI). This detailed spectral data enables in-depth studies of solar energy distribution across different wavelengths but excludes approximately 3.5% of the total solar spectrum in the infrared region (2150–5000 nm).

To overcome this limitation and enable full-spectrum comparisons, this study utilized libradtran, an atmospheric radiative transfer model, to extend the BTS spectral range, whereas due to the requirement of computational resources and expertise, A comparatively simpler functional model was developed based on libradtran simulations, focusing on critical parameters such as solar zenith angle, water vapor, and aerosol properties. This function closely matched the results from libradtran and achieved high precision with a mean value of 96.52% and a standard deviation of  0.20% that can be used to accurately extend the BTS measurements to cover the full spectrum. The comparison between pyrheliometer and BTS spectroradiometer yields a mean ratio of 0.9897 with a standard deviation of 0.0149, achieving a good correlation with pyrheliometer data while maintaining precise spectral details.

The results confirm that BTS spectroradiometers, combined with the spectral extension model, provide an effective and detailed alternative for solar irradiance monitoring. Unlike pyrheliometers, BTS instruments deliver wavelength-specific data crucial for advanced solar energy studies and atmospheric research. Moreover, integrating the extension model into BTS systems simplifies data processing, making high-quality measurements accessible for non-expert users and resource-limited regions.

This approach bridges the gap between the spectral detail of BTS systems and the broad range of pyrheliometers, offering a reliable solution for comprehensive solar irradiance measurements. These findings mark a step forward in solar energy research and environmental monitoring, with the potential to address global data gaps in cost-effective and scalable ways.

How to cite: Jaine, D. and Gröbner, J.: Comparison of solar spectral irradiance measurements with pyrheliometer total solar irradiance data., EGU General Assembly 2025, Vienna, Austria, 27 Apr–2 May 2025, EGU25-6703, https://doi.org/10.5194/egusphere-egu25-6703, 2025.

EGU25-8237 | Posters on site | CL2.1

Changes in global water vapor from observations and reanalysis products 

Olivier Bock, Carl Mears, Shu-Peng Ho, and Xi Shao

Understanding the long-term changes in the global water vapor content is critical for assessing natural vs. human-caused climate change. Despite the strong thermodynamical relationship between temperature and water vapor changes, substantial discrepancies still exist between observations, reanalysis products, and climate model simulations.

In this work, we assess the consistencies and discrepancies of total column water vapor (TCWV) estimates between three observational techniques and three reanalysis products. The observations include satellite-borne microwave radiometers (MWR) over the oceans, GPS–Radio Occultation (GPS-RO) observations from low-orbiting satellites over both ocean and land, and ground-based GNSS receivers over land and on islands. The three reanalyses are ERA5, MERRA-2, and JRA-55. They all assimilate radiances from the satellite microwave radiometers and bending angles produced from GPS-RO measurements. Ground-based GNSS measurements are not assimilated and serve as a fully independent validating data set.

We examine the overall agreement in global TCWV trends in the different data sets over the period from 1980 to the present. We highlight strong features of global climate variability such as the El-Niño Southern Oscillation (ENSO). We focus on the past few years which were characterized by a persistent strong La Niña period (2020-2022), followed by a strong El Niño event (2023/2024). Both ENSO phases had a tremendous impact on regional climate extremes, leading to extended heat waves and wildfires or heavy precipitation and flooding in many places around the world.

How to cite: Bock, O., Mears, C., Ho, S.-P., and Shao, X.: Changes in global water vapor from observations and reanalysis products, EGU General Assembly 2025, Vienna, Austria, 27 Apr–2 May 2025, EGU25-8237, https://doi.org/10.5194/egusphere-egu25-8237, 2025.

Land-use change (LUC) is ranked as the second anthropogenic source of climate change after fossil fuel burning and yields negative albedo-induced radiative forcing (ARF). This cooling effect has been assessed using low spatiotemporally resolved LUC datasets derived from historical statistical data with large uncertainties. Herein, we implement a satellite remote sensing derived highly resolved LUC dataset into a compact earth system model and reassess the global and regional surface ARF by LUC from 1983 to 2010 relative to 1750. We find that the magnitude of negative ARF obtained from the present study is lower by 20% than that estimated by the Intergovernmental Panel on Climate Change, implying a weaker cooling effect. The result reveals that the global LUC-induced surface albedo change may not significantly slow down global warming as was previously anticipated. Sub-Saharan Africa made the largest net proportion to the magnitude of global ARF (39.2%), due to substantial land use conversions, typically the conversion from forest to other vegetation lands, which accompany with higher surface albedos. The most remarkable land cover changes occurred in East and Southeast Asia, which dominated the changes in global ARF in recent decades. Based on major land cover types in these two regions, we infer that vegetation lands exert a most vital effect on global ARF variation.

How to cite: Zhang, X.: Highly-resolved satellite remote sensing based land-use change inventory yields weaker surface albedo-induced global cooling, EGU General Assembly 2025, Vienna, Austria, 27 Apr–2 May 2025, EGU25-8463, https://doi.org/10.5194/egusphere-egu25-8463, 2025.

Significant uncertainties remain in the estimate of radiative forcing (RF) induced by land-use change (LUC), partially attributable to the lack of reliable LUC data with a high spatiotemporal resolution. We implemented a high spatiotemporally resolved LUC data set in an earth system model (OSCAR) to examine the response of RF to LUC from 1982 to 2010 in China. Results were compared with the RF estimated using a low spatiotemporally resolved LUC inventory employed previously. The updated LUC data set reduces negative RF by −3.8% from 2000 to 2010 due to the changes in surface albedo subject to LU transition. The simulated mean RF driven by CO2 associated with LUC from 1982 to 2010 using a high spatiotemporally resolved LUC data set reached 0.074 W m−2, considerably higher than 0.022 W m−2 of mean RF derived from the low spatiotemporally resolved LUC inventory, implying increasing net RF and more substantial LUC induced warming.

How to cite: Jian, X.: The response of radiative forcing to high spatiotemporally resolved land-use change and transition from 1982 to 2010 in China, EGU General Assembly 2025, Vienna, Austria, 27 Apr–2 May 2025, EGU25-8471, https://doi.org/10.5194/egusphere-egu25-8471, 2025.

EGU25-10498 | Posters on site | CL2.1

External radiative forcing partly explains the Europe winter cooling in 1998-2012 

Lingling Suo, Ingo Bethke, Noel Keenlyside, and Francois Counillon

The Eurasia continent underwent significant winter cooling from 1998 to 2012, occurring within the context of global warming. This phenomenon has primarily been linked to internal variability, as previous research indicates; however, discussions regarding its underlying causes continue. Based on the simulations with both combined and individual external forcing, this study suggests that combined external radiative forcing accounts for approximately a quarter of the observed winter cooling in Europe from 1998 to 2012 by contributing to a negative North Atlantic oscillation. Among all individual external forcings, the influence of ozone, which includes the effects of solar cycle 23 from maximum to minimum, is most prominent.

How to cite: Suo, L., Bethke, I., Keenlyside, N., and Counillon, F.: External radiative forcing partly explains the Europe winter cooling in 1998-2012, EGU General Assembly 2025, Vienna, Austria, 27 Apr–2 May 2025, EGU25-10498, https://doi.org/10.5194/egusphere-egu25-10498, 2025.

EGU25-10896 | Posters on site | CL2.1

Assessing the direct aerosol impact on surface irradiance using satellite-based and surface reference data 

Jörg Trentmann, Uwe Pfeifroth, and Martin Wild

The incoming surface solar radiation is an essential climate variable as defined by GCOS. Long term monitoring of this part of the earth’s energy budget is required to gain insights on the state and variability of the climate system. In addition, climate data sets of surface solar radiation have received increased attention over the recent years as an important source of information for solar energy assessments, for crop modeling, and for the validation of climate and weather models; all requiring high-quality and temporally-consistent data records.

It has been established in recent years, based on surface- and remote sensing-based data records, that surface irradiance has increased in many regions worldwide since the mid-1980, the so-called ‘global brightening’. The mechanisms behind this brightening, however, is not yet fully understood. It appears likely that changes in the atmospheric composition, mainly the aerosol loading, and possibly also atmospheric circulation have both been contributing to the global brightening.

Here we will use satellite-based data records from the CM SAF, SARAH and CLARA, which do not include an explicit treatment of the direct aerosol effect on clears-sky radiation to investigate the possible role of the aerosol on surface irradiance. Daily and monthly surface reference data (all-sky and clear-sky) are used to identify weaknesses in the satellite-based data records; aerosol information, e.g., from MERRA, are used to possibly explain these shortcomings, hence allowing to identify and to quantify the possible aerosol effect on surface irradiance.

How to cite: Trentmann, J., Pfeifroth, U., and Wild, M.: Assessing the direct aerosol impact on surface irradiance using satellite-based and surface reference data, EGU General Assembly 2025, Vienna, Austria, 27 Apr–2 May 2025, EGU25-10896, https://doi.org/10.5194/egusphere-egu25-10896, 2025.

EGU25-11349 | Orals | CL2.1

Comparing radiative forcing measures for ozone 

William Collins, Fiona O'Connor, Rachael Byrom, Øivind Hodnebrog, Patrick Jöckel, Mariano Mertens, Gunnar Myhre, Matthias Nützel, Dirk Olivié, Ragnhild Skeie, Laura Stecher, Larry Horowitz, Vaishali Naik, and Lee Murray

Ozone is the third most important greenhouse gas, contributing a forcing of 0.47 W/m2 over the historical period. All assessments of ozone forcing so far have used the stratospheric-temperature adjusted radiative forcing (SARF) calculated by offline radiative transfer models. The two most recent IPCC reports have recommended the use of effective radiative forcing (ERF) as the preferred measure of forcing, but no calculations have been available.

For the first time we calculate the future ozone online ERF from six Earth system models and compare this to the SARF calculations. The future ozone calculations are for the SSP3-7.0 scenario for the year 2050. Only the ozone changes (and any consequent impacts on meteorology) are included in the radiative forcing calculations. We find an ERF of 0.27+/- 0.09 Wm-2  and an ozone column increase of 12 DU. Approximately half of the forcing change comes from ozone recovery following the decline in halocarbons.

By decomposing the radiative forcing into instantaneous (IRF), stratospheric-temperature adjusted (SARF) and effective (ERF) radiative forcing we gain insights into the adjustment processes causing the differences between the radiative forcing measures. The ERF is typically larger than the SARF. This is mostly due to positive non-cloud adjustments through increased water vapour (particularly in the stratosphere) and decreased surface albedo. Reductions in high and mid-level cloud increase the short-wave forcing, but decrease the long-wave forcing. The adjustments to the forcing depend on the altitude of the ozone change, with adjustments to ozone changes following reductions in ozone-depleting substances being more strongly positive than those following increases in ozone precursors.

How to cite: Collins, W., O'Connor, F., Byrom, R., Hodnebrog, Ø., Jöckel, P., Mertens, M., Myhre, G., Nützel, M., Olivié, D., Skeie, R., Stecher, L., Horowitz, L., Naik, V., and Murray, L.: Comparing radiative forcing measures for ozone, EGU General Assembly 2025, Vienna, Austria, 27 Apr–2 May 2025, EGU25-11349, https://doi.org/10.5194/egusphere-egu25-11349, 2025.

EGU25-11477 | Orals | CL2.1

Understanding altitudinal temperature variations using a surface energy balance approach  

Saurabh Shukla, Axel Kleidon, Sarosh Alam Ghausi, and Tejasvi Ashish Chauhan
 

High-altitude regions are argued to react more strongly to global warming compared to low-altitude regions. However, due to a combination of feedback mechanisms, micro-climatic trends, and lack of long-term observational data, elevation-dependent warming has been difficult to understand and quantify. We address this question using a surface energy balance approach where 2m air temperature variations along altitudes are quantified following changes in surface radiation and turbulent fluxes.  The turbulent fluxes in the energy balance are constrained using the thermodynamic limit of maximum power. The downwelling longwave radiation is parameterized using the semi-emperical equation by Brutsaert (1975). We used BSRN (Baseline Surface Radiation Network) and FLUXNET dataset to test our approach and found that daily variations in 2m air temperatures reasonably well (with R2 value of 0.75) along the altitude gradient. We find that for high altitudes, the downwelling longwave radiation is lesser compared to stations at low altitudes at similar latitudes for both all sky conditions and clear sky conditions. We attribute it to less absorptive mass above the high altitudinal setting, leading to lower atmospheric emissivity and changes in lower atmospheric heat storage. On the other hand, absorbed solar radiation when normalized by potential solar radiation, shows strong seasonality, which is influenced by albedo changes and water vapor content in the atmosphere.  Future work entails extending this framework to get a physically based estimate of elevation-dependent warming using the sensitivity of temperature to components in the energy balance. This understanding is crucial for anticipating the impacts of warming on water resources and ecosystems in these regions and, consequently, for developing effective adaptation and mitigation strategies.


How to cite: Shukla, S., Kleidon, A., Ghausi, S. A., and Chauhan, T. A.: Understanding altitudinal temperature variations using a surface energy balance approach , EGU General Assembly 2025, Vienna, Austria, 27 Apr–2 May 2025, EGU25-11477, https://doi.org/10.5194/egusphere-egu25-11477, 2025.

EGU25-12299 | Orals | CL2.1

Contributions of Driving Factors to Variations in Global Surface Solar Radiation 

Hejing Xiao, Yi Huang, Qiurun Yu, and Yiran Peng

Observations have recorded significant decadal changes in the global surface solar radiation (SSR) over the past, a phenomenon known as the ‘global dimming’ and ‘brightening’. Many studies suggest that changes of SSR are dominated by aerosols, clouds, and other influences at the atmosphere. However, due to the lack of suitable data and methodology, there are few global evaluations and quantitative work that reveal the relative importance of impacting factors on the SSR trends. In this study, a linear regression method is used to investigate the driving factors of global SSR and to quantify their contributions to the long-term change and distribution of SSR. Based on a reanalysis dataset, from 2000 to 2023, the distributions and trends of SSR can be well explained by the linear regression model, with crucial variables such as aerosol optical depth (AOD), cloud radiative effect and water vapor as predictors. The model performs particularly well at low and middle latitudes. We find that under all sky condition, cloud radiative effect causes approximately 70% of the variation in SSR, which has the strongest influence on SSR among the other predictors. In addition, all-sky SSR also shows very high sensitivity to water vapor and AOD.

How to cite: Xiao, H., Huang, Y., Yu, Q., and Peng, Y.: Contributions of Driving Factors to Variations in Global Surface Solar Radiation, EGU General Assembly 2025, Vienna, Austria, 27 Apr–2 May 2025, EGU25-12299, https://doi.org/10.5194/egusphere-egu25-12299, 2025.

EGU25-12571 | ECS | Orals | CL2.1

Long-Term Integrated Water Vapour (IWV) analysis in Southern Spain using remote sensing techniques and reanalysis models 

Victor Manuel Naval Hernández, Ana del Águila Pérez, Arlett Díaz Zurita, Onel Rodríguez Navarro, Jorge Muñiz Rosado, Daniel Pérez Ramírez, David Neil Whiteman, Lucas Alados Arboledas, and Francisco Navas Guzmán

Water vapour (WV) is one of the most significant greenhouse gases and plays a critical role in the majority of the thermodynamic processes that occur within the atmosphere. Thus, it significantly influences the radiative budget and cloud formation mechanisms, being of paramount importance in weather forecasting. Therefore, accurate and detailed characterisation of its spatial and temporal distribution is of undoubtedly great interest. However, measurement techniques often struggle with its variability both in space and time, making it challenging to obtain regular and reliable measurements. 

Although high resolution height-resolved profiles of water vapour mixing ratio are currently being acquired by lidar systems and providing powerful information, such instruments usually suffer from overlap issues in the lower hundred meters, precisely where greater concentrations of water vapour appear. This issue, together with the reduced global representativity due to the scarce number of operative lidar systems, hinders the use of this technique for continuous monitoring of water vapour near the ground. In contrast, other passive and active remote sensing techniques like Microwave Radiometers (MWR), Sun Photometers (SP) or Global Navigation Satellite System (GNSS) are well established and have been globally proven as a feasible and trustworthy alternative for continuous measurements of the total vertical column water vapour concentration (IWV). 

This study addresses the characterisation of IWV over Granada, a city in southern Spain, using remote sensing techniques (MWR, SP and GNSS). These techniques are first validated against in situ data collected from over 70 radiosondes (RS). The study then investigates the IWV evolution over Granada for a 14-year period. The daily, seasonal and annual cycles are described together with the statistical behaviour of the data series in search of tendency changes.

Reanalysis data from Numerical Weather Prediction (NWP) models such as MERRA-2 (Modern-Era Retrospective Analysis for Research and Applications, version 2) and ERA5 (fifth generation of European Centre for Medium-Range Weather Forecasts reanalysis) are also validated against remote sensing measurements and then considered to expand the study period to more than 40 years, allowing the climatological study of water vapour in the area. Seasonal decomposition and a Mann-Kendall statistical test discovered an increasing tendency in IWV. Analogous analysis for the temperature in the region also found a positive increase, accentuated since the beginning of the 21st century and reinforcing the results of climate change studies. The relationship between both magnitudes indicates a possible contribution of increased water vapour concentrations to the observed increased temperatures.

How to cite: Naval Hernández, V. M., del Águila Pérez, A., Díaz Zurita, A., Rodríguez Navarro, O., Muñiz Rosado, J., Pérez Ramírez, D., Neil Whiteman, D., Alados Arboledas, L., and Navas Guzmán, F.: Long-Term Integrated Water Vapour (IWV) analysis in Southern Spain using remote sensing techniques and reanalysis models, EGU General Assembly 2025, Vienna, Austria, 27 Apr–2 May 2025, EGU25-12571, https://doi.org/10.5194/egusphere-egu25-12571, 2025.

EGU25-12847 | Orals | CL2.1

The Earth Climate Observatory space mission concept for the monitoring of the Earth Energy Imbalance. 

Steven Dewitte, Thorsten Mauritsen, Benoit Meyssignac, Thomas August, Luca Schifano, Lien Smeesters, Rémy Roca, Helen Brindley, Jacqueline Russell, Nicolas Clerbaux, Rainer Hollmann, Linda Megner, Margit Haberreiter, Joerg Gumbel, Jochem Marotzke, Jérôme Riedi, Aku Riihela, Tim Trent, and Manfred Wendisch

Monitoring the Earth Energy Imbalance (EEI) is of prime importance for a predictive understanding of climate change. Furthermore, monitoring of the EEI gives an early indication on how well mankind is doing in implementing the Paris Climate Agreement. EEI is defined as the small difference between the incoming energy the Earth receives from the Sun and the outgoing energy lost by Earth to space. The EEI is cumulated in the Earth climate system, particularly in the oceans, due to their substantial heat capacity, and results in global temperature rise. Currently the best estimates of the absolute value of the EEI, and of its long term variation are obtained from in situ observations, with a dominant contribution of the time derivative of the Ocean Heat Content (OHC). These in situ EEI observations can only be made over long time periods, typically a decade or longer. In contrast, with direct observations of the EEI from space, the EEI can be measured at the annual mean time scale. However, the EEI is currently poorly measured from space, due to two fundamental challenges. The first fundamental challenge is that the EEI is the difference between two opposing terms of nearly equal amplitude. Currently, the incoming solar radiation and outgoing terrestrial radiation are measured with separate instruments, which means that their calibration errors are added and overwhelm the signal to be measured. To make significant progress in this challenge, a differential measurement using identical intercalibrated instruments to measure both the incoming solar radiation and the outgoing terrestrial radiation is needed. The second fundamental challenge is that the outgoing terrestrial radiation has a systematic diurnal cycle. Currently, the outgoing terrestrial radiation is sampled from the so-called morning and afternoon Sun-synchronous orbits, complemented by narrow band geostationary imagers. Recently the sampling from the morning orbit was abandoned. The sampling of the diurnal cycle can be improved, for example, by using two orthogonal 90° inclined orbits which give both global coverage, and a statistical sampling of the full diurnal cycle at seasonal time scale. For understanding the radiative forcing – e.g. aerosol radiative forcing - and climate feedback – e.g. ice albedo feedback - mechanisms underlying changes in the EEI, and for climate model validation, it is necessary to separate the Total Outgoing Radiation (TOR) spectrally into the two components of the Earth Radiation Budget (ERB), namely the Reflected Solar radiation (RSR) and Outgoing Longwave Radiation (OLR) and to map them at relatively high spatial resolution. The Earth Climate Observatory (ECO) mission concept was recently selected by the European Space Agency as one of the 4 candidate Earth Explorer 12 missions, that will be further studied in Phase 0 until mid 2026. The current paper provides a broad overview of the ECO mission objectives, the mission requirements, and the key elements of a baseline mission concept. During Phase 0, the ECO mission concept will be further elaborated in two parallel industrial studies, which may or may not adopt or refine the elements of the baseline concept.

How to cite: Dewitte, S., Mauritsen, T., Meyssignac, B., August, T., Schifano, L., Smeesters, L., Roca, R., Brindley, H., Russell, J., Clerbaux, N., Hollmann, R., Megner, L., Haberreiter, M., Gumbel, J., Marotzke, J., Riedi, J., Riihela, A., Trent, T., and Wendisch, M.: The Earth Climate Observatory space mission concept for the monitoring of the Earth Energy Imbalance., EGU General Assembly 2025, Vienna, Austria, 27 Apr–2 May 2025, EGU25-12847, https://doi.org/10.5194/egusphere-egu25-12847, 2025.

EGU25-13806 | ECS | Orals | CL2.1

An insufficient subsurface depth biases the long-term surface energy balance in Land Surface Models  

Félix García-Pereira, Jesús Fidel González-Rouco, Nagore Meabe-Yanguas, Johann Jungclaus, Philipp de Vrese, and Stephan Lorenz

The land subsurface stored around a 6 % of the Earth’s energy imbalance in the last decades, being the second contributor to the partitioning after the ocean (90 %). Previous studies have shown that state-of-the-art Earth System Models (ESMs) remarkably underestimate the observational land heat uptake values. This underestimation stems from Land Surface Models (LSMs) within ESMs imposing too shallow zero-flux bottom boundary conditions to correctly represent the conductive propagation and land heat uptake with depth. However, non-significant temperature variability differences at the ground surface have been detected when these boundary conditions are prescribed deeper, so the physical process limiting land heat uptake was not yet identified. This study reveals that the underlying mechanism is the reduced incoming ground heat flux (GHF). To conclude this, GHF values coming from an ensemble of eight historical and RCP8.5 land-only simulations with different subsurface depths conducted with the LSM of the Max Planck Institute for Meteorology ESM (MPI-ESM), JSBACH, have been compared to GHF estimates yielded by a one-dimensional heat conduction forward model. Results show that GHF doubles when deepening the LSM from 10 to 25 m, saturating at a factor of 5 when the boundary condition is placed at approx. 100 m. The increase in the incoming GHF is mainly compensated by a global increase in the outgoing sensible heat flux (SHF), a small increase of the latent heat flux (LHF) in wet regions, and an increase in the surface net radiation in arid and semi-arid regions.

How to cite: García-Pereira, F., González-Rouco, J. F., Meabe-Yanguas, N., Jungclaus, J., de Vrese, P., and Lorenz, S.: An insufficient subsurface depth biases the long-term surface energy balance in Land Surface Models , EGU General Assembly 2025, Vienna, Austria, 27 Apr–2 May 2025, EGU25-13806, https://doi.org/10.5194/egusphere-egu25-13806, 2025.

EGU25-13923 | Orals | CL2.1

Examining fast radiative feedbacks using machine-learning-based emulators of weather 

William Collins and Ankur Mahesh

The response of the Earth system to radiative perturbations is governed by a combination of fast and slow feedbacks.  Slow feedbacks are typically activated in response to changes in ocean temperatures on decadal timescales and often manifest as changes in Earth-system state with no recent analogue.  On the other hand, fast feedbacks can be activated in response to rapid atmospheric physical processes on timescales of weeks and are already operative in the present-day weather system. This distinction implies that the physics of fast radiative feedbacks is present in the historical reanalyses that have served as the training data for many of the most successful recent machine-learning-based emulators of weather.  In addition, these feedbacks are functional under the historical boundary conditions pertaining to the top-of-atmosphere radiative balance and sea-surface temperatures.    We discuss our work using historically trained weather emulators to characterize and quantify fast radiative feedbacks without the need to retrain for prospective Earth system  conditions.

How to cite: Collins, W. and Mahesh, A.: Examining fast radiative feedbacks using machine-learning-based emulators of weather, EGU General Assembly 2025, Vienna, Austria, 27 Apr–2 May 2025, EGU25-13923, https://doi.org/10.5194/egusphere-egu25-13923, 2025.

EGU25-14211 | Orals | CL2.1

Homogenized daily sunshine duration over China from 1961 to 2022 

Yanyi He, Kaicun Wang, Kun Yang, Chunlüe Zhou, Changkun Shao, and Changjian Yin

Inhomogeneities in the sunshine duration (SSD) observational series, caused by non-climatic factors like China’s widespread transition from manual to automatic SSD recorders in 2019 or station relocations, have hindered accurate estimate of near-surface solar radiation for the analysis of global dimming and brightening as well as related applications, such as solar energy planning and agriculture management. This study compiled raw SSD observational data from 1961 to 2022 at more than 2,200 stations in China and clearly found that the improved precision from 0.1 hour to 1 minute following the instrument update in 2019 led to a sudden reduction in the frequency of zero SSD from 2019 onwards, referred to as the day0-type discontinuity. For the first time, we systematically corrected this known day0-type discontinuity at 378 stations (17%) in China, resulting in an SSD series with comparable frequencies of zero value before and after 2019. On this base, we constructed a homogenization procedure to detect and adjust discontinuities in both the variance and mean of daily SSD from 1961 to 2022. Results show that a total of 1,363 (60%) stations experienced breakpoints in SSD, of which ~65% were confirmed by station relocations and instrument replacements. Compared to the raw SSD, the homogenized SSD was more continuous to the naked eye for various periods, and presented weakened dimming across China from 1961 to 1990 but a non-significant positive trend by a reduction of 60% in the Tibetan Plateau, suggesting that the homogenized SSD tends to better capture the dimming phenomenon. The northern regions continued dimming from 1991 to 2022 but the southern regions of China brightened slightly. The implementation of the Action Plan for Air Pollution Prevention and Control since 2013 contributed to a reversal of SSD trend thereafter, which was better reflected in the homogenized SSD with a trend shift from -0.02 to 0.07 hours·day-1/decade from 2013 to 2022 in China, especially in heavily polluted regions. Besides, the relationships of cloud cover fraction and aerosol optical depth with SSD were intensified in the homogenized dataset. These results highlight the importance of the homogenized SSD in accurately understanding the dimming and brightening phenomena. The homogenized SSD dataset is publicly available for community use at https://yanyihe-rad.github.io/files/homog-daily-ssd-China-v1.0.mat.

How to cite: He, Y., Wang, K., Yang, K., Zhou, C., Shao, C., and Yin, C.: Homogenized daily sunshine duration over China from 1961 to 2022, EGU General Assembly 2025, Vienna, Austria, 27 Apr–2 May 2025, EGU25-14211, https://doi.org/10.5194/egusphere-egu25-14211, 2025.

Almost all solar resource assessment and forecasting endeavors require gridded surface irradiance retrieved from geostationary satellites. China’s solar industry has hitherto been relying upon Himawari and Meteosat-derived surface irradiance products. Despite the maturity of those products, none provides a complete coverage of China, which implies a series of data issues, such as the inconsistency at product boundaries or limited resolution towards the edge of the field-of-view disks. However, data issues are but secondary, and the lack of autonomous capability of performing solar resourcing is what truly troubles those concerned. China’s latest geostationary weather satellite series, Fengyun-4 (FY-4), has the most advanced technology, but its service commenced only fairly recently in 2017. Hence, to meet China’s immediate needs for solar resources under its radical decarbonization target, which cannot afford to wait for FY-4 data to pile with time, soliciting information from its predecessor series, namely, FY-2, is thought to be apt. In this work, a high-resolution (1.25 km) satellite-derived surface irradiance product over a twelve-year period (2011–2022) is developed, based on the scanning radiometers onboard FY-2E, -2F, and -2G satellites. A series of analysis as to quantifying the interannual and spatial variability of solar irradiance in China, which has rarely been done before, confirm that the current product can suffice most solar resourcing applications. 

How to cite: Shi, H.: China's autonomous solar energy products with the application of Fengyun satellites, EGU General Assembly 2025, Vienna, Austria, 27 Apr–2 May 2025, EGU25-14827, https://doi.org/10.5194/egusphere-egu25-14827, 2025.

EGU25-15920 | Orals | CL2.1 | Highlight

Recent global temperature surge intensified by record-low planetary albedo 

Helge Goessling, Thomas Rackow, and Thomas Jung

In 2023, the global mean temperature soared to almost 1.5°C above the preindustrial level, surpassing the previous record by about 0.17°C. Previous best-guess estimates of known drivers, including anthropogenic warming and the El Niño onset, fall short by about 0.2°C in explaining the temperature rise. This gap persisted in 2024, during which the stronger El Niño contribution resulted in an even higher global annual-mean temperature, exceeding the symbolic 1.5°C threshold. Using satellite and reanalysis data, we identified a record-low planetary albedo as the primary factor bridging this gap. The decline is apparently caused largely by a reduced low-cloud cover in the northern mid-latitudes and tropics, in continuation of a multiannual trend. Further exploring the low-cloud trend and understanding how much of it is due to internal variability, reduced aerosol concentrations, or a possibly emerging low-cloud feedback will be crucial for assessing the present and expected future warming.

How to cite: Goessling, H., Rackow, T., and Jung, T.: Recent global temperature surge intensified by record-low planetary albedo, EGU General Assembly 2025, Vienna, Austria, 27 Apr–2 May 2025, EGU25-15920, https://doi.org/10.5194/egusphere-egu25-15920, 2025.

EGU25-16594 | Orals | CL2.1

Using line-by-line Monte Carlo to compute the Earth’s outgoing longwave radiation and CO2’s radiative forcing 

Dufresne Jean-Louis, Lebrun Raphaël, Nyffenegger-Pere Yaniss, Fournier Richard, and Blanco Stéphane

The Earth’s radiation budget is a crucial part of climate and its evolution. Being part of this budget, the outgoing longwave radiation (OLR) has been extensively studied, especially in the context of climate-change and anthropogenic greenhouse gases emissions modifying the Earth’s radiative equilibrium.

In this study we present a new line-by-line radiative code RadForcE, we have developed to compute the global OLR and radiative forcing over a 10-year period. Based on a backward longwave Monte Carlo method, RadForcE uses line-by-line spectroscopic data for several molecular gases (CO2, H2O, CH4 and O3) from high-resolution databases GEISA and HITRAN, as well as different continua. The clouds’ vertical distributions are taken into account with a vertical overlap subgrid parameterization that is sampled "on the fly" for each optical path along vertical atmospheric profiles. Those profiles are sampled over a 10-year period all over the globe, either from GCM outputs or from ERA5 reanalysis, to compute the unbiased global OLR at a very small computational cost (~10 minutes on a laptop).

We this new method we are also able to directly compute any greenhouse gas radiative forcing, and present estimates of the radiative forcing for a doubling of CO2. The Monte Carlo approach allows us to identify, for each outgoing optical path at the top of the atmosphere, the emitting species as well as the altitude of emission. By doing so, we can visualize the profile of altitude of emission for each species, as well as how some gases can screen other species’ emission or the surface’s emission. We can also visualize, for a doubling of CO2, the increase of stratospheric emission by CO2, and its screening of the surface’s emission and water vapor tropospheric emission.

How to cite: Jean-Louis, D., Raphaël, L., Yaniss, N.-P., Richard, F., and Stéphane, B.: Using line-by-line Monte Carlo to compute the Earth’s outgoing longwave radiation and CO2’s radiative forcing, EGU General Assembly 2025, Vienna, Austria, 27 Apr–2 May 2025, EGU25-16594, https://doi.org/10.5194/egusphere-egu25-16594, 2025.

EGU25-17123 | ECS | Orals | CL2.1

Measurements of land surface albedo at the Thule High Arctic Atmospheric Observatory (THAAO) in Pituffik, Greenland and comparison with MODIS data. 

Monica Tosco, Daniela Meloni, Filippo Calì Quaglia, Giovanni Muscari, Tatiana Di Iorio, Giandomenico Pace, Virginia Ciardini, and Alcide Giorgio di Sarra

The land surface albedo is one of the key parameters of the global radiation budget, since it regulates the shortwave radiation absorbed by the Earth’s surface. The polar regions, in particular, a decrease in snow and ice cover results in a decrease of surface albedo and in the intensification of solar heating further reducing the snow and ice areas (ice-albedo feedback). In remote areas, where in-situ instruments are absent, satellites are crucial to measure surface albedo changes.

In this work, a comparison of satellite and in-situ measurements of broadband shortwave surface albedo is conducted. The area of interest selected is around the Thule High Arctic Atmospheric Observatory (THAAO) on the North-western coast of Greenland (76.5°N, 68.8°W), where the measurements of down-welling and up-welling shortwave irradiance have been started in 2009 and 2016, respectively (https://www.thuleatmos-it.it/).

Albedo determinations based on MODIS observations from both Terra and Aqua (MODIS MCD43A3 dataset), consisting of daily values with a spatial resolution of 500 m, have been compared with the ground-based measurements.

The analysis has been conducted for all-sky and clear-sky conditions with a focus on some events to better understand the behavior of MODIS data with respect to ground-based measurements, taking advantage of the additional information (meteorological parameters, cloudiness, precipitation) available at THAAO.

The results for the period 2016-2024 show an underestimation of the albedo measurements from satellite compared to the ground-based measurements at the THAAO over a large part of the period considered. The best agreement is found in the summer when there is no snow around the Observatory, and the mean measured albedo value is 0.1633 for cloud-free conditions and 0.1903 for all-sky conditions. The mean bias during this season is around -0.0074 for cloud-free conditions and 0.0067 for all sky conditions. In spring, when the in-situ albedo values are highly variable, between 0.350 and 1, the mean bias is around -0.0645 for cloud-free conditions and -0.0159 for all sky conditions.

The fast changes in surface albedo occurring after short snow precipitation or removal events are seldom captured by satellite observations.

How to cite: Tosco, M., Meloni, D., Calì Quaglia, F., Muscari, G., Di Iorio, T., Pace, G., Ciardini, V., and di Sarra, A. G.: Measurements of land surface albedo at the Thule High Arctic Atmospheric Observatory (THAAO) in Pituffik, Greenland and comparison with MODIS data., EGU General Assembly 2025, Vienna, Austria, 27 Apr–2 May 2025, EGU25-17123, https://doi.org/10.5194/egusphere-egu25-17123, 2025.

EGU25-17633 | ECS | Orals | CL2.1

Evaluation of surface shortwave spectral fluxes at Uccle produced by the ECMWF ecRad radiation scheme (v1.5.0) embedded in the MAR regional model (v3.14) and prediction of UV indices 

Jean-François Grailet, Robin J. Hogan, Nicolas Ghilain, David Bolsée, Xavier Fettweis, and Marilaure Grégoire

The ecRad scheme is the latest radiative transfer scheme provided by the European Centre for Medium-range Weather Forecast (ECMWF), and is notably operational in the ECMWF’s Integrated Forecasting System (IFS) since 2017. Recent developments of ecRad enable it both to run using ecCKD high resolution gas-optics models and to produce surface shortwave spectral fluxes. The combination of both features allow ecRad to produce fine surface shortwave spectral fluxes, e.g., over a 310–315 nm spectral band.

We assessed this capability after embedding ecRad (v1.5.0) in the MAR (Modèle Atmosphérique Régional) regional climate model (v3.14). For this purpose, we used ground-based spectral observations captured by the Royal Belgian Institute for Space Aeronomy at Uccle (Belgium; 50.797° N, 4.357° E) from 2017 to 2020, in the 280–500 nm range and with a precision of 0.5 nm. After carefully tuning both MAR and ecRad and configuring fine spectral bands over the 280–500 nm range, we ran a MAR simulation over Belgium for the same period as the Uccle spectral observations.

After integrating the spectral observations on the same bands as configured in our MAR/ecRad simulation, we compared both time series of spectral fluxes at Uccle. Our evaluation yielded correlation coefficients ranging from 0.9 to 0.93 for all bands above 295 nm and low biases for all bands. As our spectral fluxes cover the ultraviolet (UV) range, we tried to predict UV indices with MAR/ecRad spectral fluxes. The UV index is a metric used to inform the public about how much harmful ultraviolet radiation reaches the Earth’s surface at a given time, and consists of a weighted integral of spectral fluxes over the UV range. Our model-based and observations-based UV indices are in very good agreement, though the former falls short of finding the highest UV indices of the latter, due to the ozone mixing ratios in MAR not varying on a daily basis.

Author's note: this research work is detailed in the paper "Inclusion of the ECMWF ecRad radiation scheme (v1.5.0) in the MAR model (v3.14), regional evaluation for Belgium and assessment of surface shortwave spectral fluxes at Uccle" currently available on EGUsphere in preprint (awaiting topic editor decision after referee comments and subsequent revision).

How to cite: Grailet, J.-F., Hogan, R. J., Ghilain, N., Bolsée, D., Fettweis, X., and Grégoire, M.: Evaluation of surface shortwave spectral fluxes at Uccle produced by the ECMWF ecRad radiation scheme (v1.5.0) embedded in the MAR regional model (v3.14) and prediction of UV indices, EGU General Assembly 2025, Vienna, Austria, 27 Apr–2 May 2025, EGU25-17633, https://doi.org/10.5194/egusphere-egu25-17633, 2025.

EGU25-18785 | Orals | CL2.1

Modification of the shortwave radiation budget of the Mediterranean Basin during intense dust episodes (2005-2018) 

Nikos Hatzianastassiou, Maria Gavrouzou, Marios-Bruno Korras-Carraca, Michalis Stamatis, Christos Lolis, Nikos Mihalopoulos, Christos Matsoukas, and Ilias Vardavas

Dust aerosols significantly affect the shortwave (SW) radiation budget from global to regional scales. This effect strengthens during intense dust outbreaks taking place with variable frequency and features over and near to the great world deserts. The greater Mediterranean Basin is such a region, frequently undergoing dust episodes originating from the nearby Sahara Desert. In the present study, a climatological assessment of the direct SW radiative effects (DREs) of intense Mediterranean dust episodes is made for the first time. Specifically, the modification of the top-of-atmosphere (TOA), atmospheric and surface SW radiative fluxes caused by 162 spatially extended intense dust episodes that took place from 2005 to 2018 is estimated using the FORTH spectral radiative transfer model (RTM). Also, the consequent modification of the regional atmospheric thermal structure and dynamics due to these DREs is computed, aiming to shed light on the role of dust aerosols on regional climate. The RTM computations are driven by a synergy of contemporary satellite (ISCCP-H) and reanalysis (MERRA-2) climatological data.

The reliability of the dust DREs (DDREs) is ensured by comparisons of the model outputs with reference fluxes at the region’s surface (BSRN stations) and TOA (CERES). The results are satisfactory indicating a nice correlation with BSRN and CERES (R values equal to 0.95 and 0.98, respectively) and a slight underestimation (5.4%) at surface and overestimation at TOA (2.7%). During the 162 intense dust episodes the surface of the Mediterranean Basin is cooled by up to -72 W/m2 on average, while the atmosphere is correspondingly heated by up to 75 W/m2. At TOA opposite effects are induced, namely a planetary heating (up to 26 W/m2) over Africa and a cooling (as much as -20 W/m2) over the Mediterranean Sea. These values are larger (up to 100 W/m2) on a seasonal basis and even stronger on a daily or hourly basis. Besides, the DDREs induce an atmospheric heating up to about 0.4 K/3-hours on average, while this heating is as strong as 2.5 K during the time interval 12:00-15:00 of the dust episode days, creating a significant positive buoyancy over the dust affected areas.

How to cite: Hatzianastassiou, N., Gavrouzou, M., Korras-Carraca, M.-B., Stamatis, M., Lolis, C., Mihalopoulos, N., Matsoukas, C., and Vardavas, I.: Modification of the shortwave radiation budget of the Mediterranean Basin during intense dust episodes (2005-2018), EGU General Assembly 2025, Vienna, Austria, 27 Apr–2 May 2025, EGU25-18785, https://doi.org/10.5194/egusphere-egu25-18785, 2025.

EGU25-19022 | ECS | Orals | CL2.1

The important role of feedback processes for contrail cirrus climate impact 

Marius Bickel, Michael Ponater, Ulrike Burkhardt, Mattia Righi, Johannes Hendricks, and Patrick Jöckel

Contrail cirrus is regarded to be the largest contributor to aviation induced global warming based on classical radiative forcing and exceeds the corresponding climate impact of accumulated air traffic CO2 emissions. However, recent studies indicate that the leading role of contrail cirrus declines when using more advanced climate metrics, such as the effective radiative forcing, or even disappears when considering the induced surface temperature change. 

Here we present results from climate model simulations to derive a fully self-consistent set of classical radiative forcings, effective radiative forcings and corresponding surface temperature changes for a contrail cirrus and CO2 perturbation. The simulations were extensively evaluated by feedback analysis in order to determine the origin of the reduced efficacy of contrail cirrus to warm Earth’s surface. When switching from classical radiative forcing to effective radiative forcing the impact of contrail cirrus decreases by 45% relative to CO2. Feedback analysis revealed a reduced formation of natural cirrus as the major reason, as contrail cirrus formation removes large parts of available ambient humidity. When looking at surface temperature change, the efficacy of contrail cirrus turned out to be reduced, even more, by 79% relative to CO2. Again, cloud feedbacks were found to be the major reason for the different behavior between the contrail cirrus and CO2 perturbation, however, in this case mainly triggered by decreasing low- and mid-level clouds in the CO2 simulation. The efficacy reduction is also supported by a larger negative lapse rate feedback (change of the vertical temperature slope) which is the result of a temperature dipole formed by contrail cirrus, with strongest warming rates directly below the contrail cirrus cloud base and decreasing strength towards surface.

How to cite: Bickel, M., Ponater, M., Burkhardt, U., Righi, M., Hendricks, J., and Jöckel, P.: The important role of feedback processes for contrail cirrus climate impact, EGU General Assembly 2025, Vienna, Austria, 27 Apr–2 May 2025, EGU25-19022, https://doi.org/10.5194/egusphere-egu25-19022, 2025.

EGU25-19629 | ECS | Orals | CL2.1

Phenology's Net Cooling Effect as Feedback to Global Warming 

Alexander J. Winkler and the PhenoFeedBacks Team

Recent decades have seen significant changes in land surface phenology, with earlier leaf development in northern ecosystems and diverse changes in autumn senescence, primarily attributed to climate change. These phenological changes feed back to Earth’s climate system by altering biogeochemical and biogeophysical processes at the land surface. However, little is known about the strength of these diverse effects on the Earth's energy balance, and whether their combination results in a net positive (warming) or negative (cooling) feedback to global warming.

Using a fully-coupled Earth system model (ESM) with an interactive global carbon cycle, we investigate the effects of land phenological changes on the Earth's energy balance and the subsequent biogeophysical and biogeochemical feedbacks. We prescribe transient shifts in leaf area index (LAI) in the ESM based on remote sensing estimates of phenological spring advancement (2.1 days per decade) and autumn delay (1.8 days per decade). Note these shifts are only prescribed for extratropical northern ecosystems, where robust phenological changes have been observed, however, the effect in the ESM is global including local and non-local effects. Our results provide a first quantification of the impact of these phenological changes on the processes affecting the Earth’s energy balance, namely, shortwave radiation through changes in surface albedo, surface sensible and latent heat fluxes, longwave surface emissions, ground heat flux, longwave radiation balance through greenhouse gases, and the overall radiative fluxes through cloud properties and planetary albedo.

We find that autumn LAI shifts have a stronger net effect than spring LAI shifts on the Earth's energy balance, and that these effects can compensate each other when they co-occur in the same year. Our simulations also reveal compensating effects between outgoing longwave and outgoing shortwave radiation at the top of the atmosphere, where the former points to a positive and the latter to a negative radiative forcing. Altogether, we report an average negative radiative forcing of 0.17 ± 0.1 W m-2 for a 10-day lengthening of the growing season, resulting in a global mean surface temperature cooling of 0.1 ± 0.03 °C. The effect is more pronounced in simulations when spring advancement and delay in senescence are prescribed separately in the ESM, amounting to a negative radiative forcing of 0.24 ± 0.21 W m-2 and 0.32 ± 0.25 W m-2 for a 10-day lengthening of the growing season, respectively. These simulations suggest that phenological changes triggered by global warming result in a net negative feedback to global warming. Future research is needed to confirm this first quantification and to investigate the saturation of phenological responses to global warming, which could weaken this cooling feedback effect in the future.

How to cite: Winkler, A. J. and the PhenoFeedBacks Team: Phenology's Net Cooling Effect as Feedback to Global Warming, EGU General Assembly 2025, Vienna, Austria, 27 Apr–2 May 2025, EGU25-19629, https://doi.org/10.5194/egusphere-egu25-19629, 2025.

EGU25-19921 | ECS | Orals | CL2.1

Radiative forcing of anthropogenic Brown Carbon in EC-Earth3 

Akash Deshmukh, Anton Laakso, Tero Mielonen, Angelos Gkouvousis, Antti Arola, Harri Kokkola, and Tommi Bergman

Brown carbon (BrC) influences atmospheric radiative forcing through its unique light-absorption characteristics. The role of  BrC as a significant absorbing component of organic aerosols (OA) has profound implications for understanding its impact on climate systems. However, the complex processes forming BrC, along with the chemical and optical properties that determine its behavior are not yet fully understood. These challenges are compounded by the fact that BrC's sources, formation processes, and interactions with other atmospheric components remain partially unknown. 

Existing approaches to represent BrC in climate models range from intermediate schemes that explicitly account for its emission and aging to simplified methods that assume constant weak absorbing properties in OA. Furthermore, studies indicate that BrC may impose a radiative burden comparable to black carbon (BC), potentially amplifying the overall forcing exerted by carbonaceous aerosols. 

However, it is not entirely clear how brown carbon contributes to atmospheric radiation and what role it plays in climate. Previous studies have offered varying estimates of BrC  direct radiative effect (DRE), underscoring the need for refined modeling and observational data to understand BrC's role in atmospheric dynamics and its contribution to global warming.  Here, we examined the global radiative impacts of anthropogenic BrC emissions using the EC-Earth3 Earth System Model. This study aims to address the significant uncertainties in climate modeling by enhancing the representation of BrC in models. This includes incorporating additional sources to provide more accurate estimations of its radiative effects.  Furthermore, the study will assess the role of BrC in driving regional climate variations and their potential contributions to global climate forcing. For the BrC emissions, we used the ECLIPSE (Evaluating the Climate and Air Quality Impacts of Short-lived Pollutants) dataset, developed by the Finnish Environment Institute. Also, we used the Organic Carbon (OC) and BC emissions from the ECLIPSE emission dataset. EC-Earth3 simulations were conducted across different years to represent both historical and future scenarios. Each simulation was run for six years, including a one-year spin-up period.  

Our preliminary results from historical simulations for the year 2010 indicate that the global mean direct radiative forcing of anthropogenic BrC emissions is negligible. However, regional effects are significantly more pronounced, which need to be studied further. 

How to cite: Deshmukh, A., Laakso, A., Mielonen, T., Gkouvousis, A., Arola, A., Kokkola, H., and Bergman, T.: Radiative forcing of anthropogenic Brown Carbon in EC-Earth3, EGU General Assembly 2025, Vienna, Austria, 27 Apr–2 May 2025, EGU25-19921, https://doi.org/10.5194/egusphere-egu25-19921, 2025.

The burning of solid biomass fuel in traditional cooking stoves is still a major source of air pollution in India’s rural areas. Thereby estimates of source emissions becomes extremely important considering its effect on health and environment. The present study aims to measure and characterize aerosol emissions from the use of various single and mix-solid biomass fuels (fuelwood, dung cake, crop-residue) for cooking in traditional cookstoves. A portable versatile source sampling system (VS3) having PM2.5 samplers along with aethalometer (AE33) were taken on-field in Bihar and Haryana to capture real time emission measurement during cooking activity. A total of 84 experiments were conducted during both morning and evening cooking and the data was analysed to understand the impact of various fuel types, cooking processes and emission characteristics on black carbon (BC) @880nm. The burn rates in case of single fuel use like fuelwood, dung cake, and crop residue were found 1.6 ± 0.8, 1.56 ± 0.5, and 1.83 ± 0.9 kgh-1 respectively, however, in case of mix-fuel usage like firewood with dung cake and crop-residue was 2.4 ± 1.3 kgh-1. The relationship between combustion temperature and BC was investigated using the Pearson correlation test. The results revealed a weak (R2 = 0.124) but significant association, suggesting that while combustion temperature influences BC levels, other factors also play important roles. ANOVA tests were conducted to ascertain the statistical significance of the variations in BC emissions across different fuel types and cooking techniques. The tests revealed that both fuel types and cooking processes significantly affect BC concentrations (P-value~0). To delve deeper, regression analyses were performed, revealing that these factors account for approximately 10.3% of the variability in BC. The models highlighted the influence of specific fuel types and cooking processes, underscoring the complexity of factors impacting BC emissions. This multifaceted approach not only enhances our understanding of how cooking and combustion practices influence BC emissions but also underscores the importance of considering a variety of factors when developing strategies to reduce air pollution and improve environmental health. Understanding BC emissions can guide policies to improve energy access and reduce socioeconomic disparities. The paper will focus on looking other combustion parameters like atmospheric temperature and relative humidity and the impact of single and mix-fuel use on the BC emissions.

How to cite: Kumari, J. and Habib, G.: Black Carbon Emissions and Their Relation to Emission Characteristics from Traditional Cookstoves in Rural India, EGU General Assembly 2025, Vienna, Austria, 27 Apr–2 May 2025, EGU25-20092, https://doi.org/10.5194/egusphere-egu25-20092, 2025.

EGU25-20374 | Posters on site | CL2.1

Using Decadal Variability of Surface and Satellite-based Measurements of Surface Solar Fluxes to Assess Current and Long-term Projected Changes from CMIP-6  

Paul Stackhouse, Neha Khadka, Bradley Hegyi, Stephen Cox, J. Colleen Mikovitz, and Taiping Zhang

NASA projects that provide estimates of solar irradiance in the context of meteorological conditions (i.e., clouds, aerosols and gaseous constituents, etc.) spanning from 1983 to near present (i.e., Surface Radiation Budget (GEWEX SRB), Clouds and Earth’s Radiance Energy System – CERES and Modern Era Reanalysis-assimilation for Research and Applications – MERRA2, etc.).  Those data products provide nearly 40 years of covariant information from global to regional scales.  These records provide the opportunity to assess the decadal variability of these fluxes with the capability to attribute changes to various cloud and/or aerosol processes.  Utilizing these observations, we assess the long-term projections of the surface solar fluxes from CMIP6 model runs utilizing NASA’s Earth Exchange Global Daily Downscaled Projections (NEX-GDDP) data set (Thrasher et al., 2023) for three socio-economic pathways utilized by Climate Modeling Intercomparison Project (CMIP6) that span from 1950 to 2100 and includes projections of temperature and solar irradiance with 7 other parameters.  Over the Continental United States, we find that the data products used to downscale this NEX-GDDP needs to be re-evaluated but that the long-term changes in surface solar fluxes show very little trend.  However, the 2-4 decade variability is larger by as much as a factor of 4.  This has implications in terms of surface energy flux exchange at the surface and even for assessing the solar availability for solar power resources

How to cite: Stackhouse, P., Khadka, N., Hegyi, B., Cox, S., Mikovitz, J. C., and Zhang, T.: Using Decadal Variability of Surface and Satellite-based Measurements of Surface Solar Fluxes to Assess Current and Long-term Projected Changes from CMIP-6 , EGU General Assembly 2025, Vienna, Austria, 27 Apr–2 May 2025, EGU25-20374, https://doi.org/10.5194/egusphere-egu25-20374, 2025.

EGU25-20539 | ECS | Posters on site | CL2.1

Atmospheric process, radiation forcing, and climate effects of short-chain perfluoroketones 

Zechen Yu, Jiayu Quan, and Jianjie Fu

Perfluoroketones are recently used as a new type of fire extinguishing material which could replace halon and fluoroalkane agents to reduce the ozone depletion effects.  In this study, a combination of quantum chemical calculation and flow-tube experiments was carried out to study the photolysis reaction and degradation mechanisms of perfluorohexanone that triggered by ·OH and ozone. The results showed that the photolysis rate of perfluorohexanone molecule was about 1.72×10⁻⁵-4.48×10⁻⁵s-1. In the reaction of ·OH, the reaction rate is about 2.3×10⁻¹² molec-1cm3s-1, and the F atom substitution reaction that occurs on the α-C atom is the main reaction pathway. The reaction rate of perfluorohexanone molecules with ozone is negligible. The degradation products were further analyzed by using a online GCMS and off-line LC-QTOF. The short-chain fluoroacetic acid, such as trifluoroacetic acid was observed. The radiation forcing of the precursor compounds as well as the degradation products were evaluated by using the radiative transfer model. The results of this study help to understand a series of reactions and conversion mechanisms of perfluorohexanone in the atmosphere, and provides the management strategy for using of volatile prefluoro compounds.

How to cite: Yu, Z., Quan, J., and Fu, J.: Atmospheric process, radiation forcing, and climate effects of short-chain perfluoroketones, EGU General Assembly 2025, Vienna, Austria, 27 Apr–2 May 2025, EGU25-20539, https://doi.org/10.5194/egusphere-egu25-20539, 2025.

EGU25-20646 | Orals | CL2.1

Updating the experimental absorption cross sections for HITRAN2024 

Robert Hargreaves, Iouli Gordon, Christian Hill, Roman Kochanov, and Laurence Rothman

Many trace gases throughout Earth’s atmosphere are known to have a large potential to impact the radiation budget. The HITRAN database provides spectroscopic parameters and supplementary data in the form of line-by-line lists, absorption cross sections, collision induced absorption, water vapor continuum, and aerosol properties that enable molecular absorption to be modeled, which allows the radiation budget and radiative forcing to be determined. For HITRAN2024, in addition to increasing the number of molecules with line-by-line lists to 61, the absorption cross sections are receiving a substantial update. The update of cross sections makes use of many newly available experimental data and results in the addition over 100 molecules to the large number of molecules already represented as absorption cross sections in HITRAN2020 (Gordon et al. 2022). The absorption cross section update will also expand the range of experimental conditions available (i.e., temperatures, pressures, broadening gases, and resolutions) for many molecules that are present in Earth’s atmosphere. The new cross-sections have been a subjected to a validation process prior to being added to the database. This talk will showcase the absorption cross sections in HITRAN, and will highlight major updates for the 2024 compilation.

Funding from NASA grant 80NSSC23K1596 is acknowledged.

Reference: Gordon, et al., JQSRT 277, 107949 (2022). https://doi.org/10.1016/j.jqsrt.2021.107949

How to cite: Hargreaves, R., Gordon, I., Hill, C., Kochanov, R., and Rothman, L.: Updating the experimental absorption cross sections for HITRAN2024, EGU General Assembly 2025, Vienna, Austria, 27 Apr–2 May 2025, EGU25-20646, https://doi.org/10.5194/egusphere-egu25-20646, 2025.

EGU25-651 | ECS | Posters on site | CL2.2

Influence of Tropical Ocean Basins on the Interannual Variability of Indian Summer Monsoon Rainfall during three recent epochs 

Tanu Sharma, Satyaban B. Ratna, Ingo Richter, and Damodara S. Pai

This study examines the relationship between Indian Summer Monsoon Rainfall (ISMR: June- September Season) and climate drivers across the three tropical basins, namely the Pacific Ocean, Indian Ocean, and Atlantic Ocean, using observation and reanalysis data for the period 1961-2023. Although Sea Surface temperature (SST) conditions over the tropical Pacific Ocean have a major influence on the interannual variability of ISMR, their interactions with the Indian Ocean and the Atlantic Ocean also play a role. The interannual relationship between El Nino Southern Oscillation (ENSO) and ISMR is well-established, but its epochal variations and impact across different homogeneous regions of India (the north-west, north-east, central, and south peninsular India) is not yet fully understood. To understand this epochal variation in the ENSO-ISMR relationship and the role of the tropical basin interaction, this study considered three different periods (P-I: 1961-1980, P-II: 1981-2000, P-III: 2001-2023). The lead-lag correlation analysis showed that the SST conditions over the north Indian Ocean (NIO) and the south tropical Atlantic Ocean (STAO) during the preceding winter (October-January) season has a significant role on ISMR. The analysis showed a significant (insignificant) negative simultaneous correlation between ENSO and ISMR for P-I and P-III (P-II). Regression analysis reveals that in P-I, the SST conditions over the NIO as well as STAO had insignificant influence on the ISMR. In P-II, the role of the NIO became significant, particularly over the south peninsular India. In P-III, the influence from the NIO has reduced (although still significant), at the same time the role of STAO became significant. The thermodynamical analysis is performed to understand the mechanism relating the role of NIO and STAO in modifying the ENSO-ISMR teleconnection in the three periods. This study highlights the importance of the changes in the large-scale patterns of the oceanic as well as atmospheric fields and the interactions between the tropical Indian-Pacific-Atlantic Oceans, to the performance of ISMR.

How to cite: Sharma, T., Ratna, S. B., Richter, I., and Pai, D. S.: Influence of Tropical Ocean Basins on the Interannual Variability of Indian Summer Monsoon Rainfall during three recent epochs, EGU General Assembly 2025, Vienna, Austria, 27 Apr–2 May 2025, EGU25-651, https://doi.org/10.5194/egusphere-egu25-651, 2025.

EGU25-1273 | Orals | CL2.2

ACCESS-ENSO-Recipes: A Flexible Workflow for ENSO and IOD Evaluation Using ESMValTool and Jupyter Notebooks 

Romain Beucher, Felicity Chun, Yann Planton, Arnold Sullivan, Christine Chung, Harun Rashid, Ghyslaine Boschat, and Nicola Maher

The El Niño-Southern Oscillation (ENSO) is the dominant mode of interannual variability, with global climate impacts that underscore the importance of its accurate representation in climate models. Building on the success of the CLIVAR ENSO metrics package, our work focuses on developing an advanced workflow for evaluating ENSO in the ACCESS family of models, extending its functionality to include diagnostics for the Indian Ocean Dipole (IOD).

Our approach leverages the IRIS-based pre-processors within ESMValTool, enabling a modular and flexible development of ENSO and IOD diagnostics. These are implemented as Python-based diagnostics that can seamlessly integrate into both exploratory Jupyter Notebooks and the traditional YAML-based ESMValTool recipes. The notebooks, part of the open-source ACCESS-ENSO-Recipes, are hosted on GitHub and serve as a powerful platform for designing diagnostics, visualisation, and interactive data exploration. Meanwhile, the YAML recipes facilitate the semi-automated evaluation of multi-model ensembles and large datasets, ensuring compatibility with established workflows for climate model evaluation.

Our current suite of diagnostics aims to reproduce the functionality of the CLIVAR ENSO metrics package, focusing on ENSO variability, teleconnections, and physical processes. By utilising notebooks, we create an agile environment for developing and refining diagnostic tools, enhancing collaboration between scientists and model developers. At the same time, the structured recipe format ensures reproducibility and scalability, enabling systematic analysis across models and ensembles.

We plan to extend this approach to evaluate broader oceanic and atmospheric processes in the ACCESS models, enabling more comprehensive assessments of model performance. The ACCESS-ENSO-Recipes and Python diagnostics will also be shared on the ESMValTool GitHub repository to encourage collaboration and wider use in the climate modelling community.

This workflow balances innovation and scalability by integrating flexible notebooks with structured legacy tools. Advancing ENSO and IOD evaluation will improve climate model accuracy and our understanding of their impacts on current and future climates.

How to cite: Beucher, R., Chun, F., Planton, Y., Sullivan, A., Chung, C., Rashid, H., Boschat, G., and Maher, N.: ACCESS-ENSO-Recipes: A Flexible Workflow for ENSO and IOD Evaluation Using ESMValTool and Jupyter Notebooks, EGU General Assembly 2025, Vienna, Austria, 27 Apr–2 May 2025, EGU25-1273, https://doi.org/10.5194/egusphere-egu25-1273, 2025.

EGU25-1871 | ECS | Posters on site | CL2.2

On the Slow Decay of El Niño in CMIP6 Models 

Yihua wei

The decay pace of El Niño can significantly modify its impacts on the Asian climate during the post-El Niño summer. Hence, accurately reproducing the observed decay pace in state-of-art coupled models is essential for realistic climate simulations. In the CMIP6 models, El Niño decays slower than observed. This slower decay can be attributed to weaker-than-observed air-sea coupling in the models that causes a weaker atmospheric convective response and smaller westerly anomalies along the equatorial Pacific during the El Niño life cycle. The smaller westerly anomalies result in a slower discharge of equatorial ocean heat, weaker negative/positive thermocline anomalies along/off the equator and thus a weaker meridional gradient of the thermocline anomalies. This weakens the easterly current anomalies, diminishes the zonal advection feedback, and ultimately slows the decay pace of El Niño in the models.

How to cite: wei, Y.: On the Slow Decay of El Niño in CMIP6 Models, EGU General Assembly 2025, Vienna, Austria, 27 Apr–2 May 2025, EGU25-1871, https://doi.org/10.5194/egusphere-egu25-1871, 2025.

EGU25-2370 | Posters on site | CL2.2

Why is tropical Pacific decadal variability predominantly observed in the Nino4 region? 

Yu-heng Tseng, Sieu-Cuong San, Ruiqiang Ding, and Emanuele Di Lorenzo

This study investigates why observed decadal‐scale climate variability is predominantly pronounced in the Niño4 region compared to other equatorial Pacific areas using both observation and model sensitivity experiments. The initial shift to the negative phase of Tropical Pacific Decadal Variability (TPDV) is primarily driven by the upward and eastward migration of isopycnal negative temperature anomalies along the equator. Subsequently, the wind fields associated with the negative phase of the Pacific Meridional Mode (PMM) induce anomalous vertical currents in the equatorial Pacific. This leads to anomalous upwelling and downwelling of mean temperature in the Niño4 and Niño3 regions, respectively, thereby strengthening and weakening the corresponding subsurface‐produced sea surface temperature anomalies. Our findings clarify the roles of subsurface temperature anomalies in the phase reversal of TPDV and PMM in amplifying decadal variance, specifically in the equatorial central Pacific. Plain Language Summary: Observations have consistently highlighted prominent decadal climate variability in the Niño4 region, yet the underlying cause of this distinct pattern remains largely elusive. In this study, we use composite analysis during the phase transition of Tropical Pacific Decadal Variability (TPDV) and modeling experiments to elucidate the mechanisms governing the observed decadal climate variability in the Niño4 region compared to other equatorial areas. Our findings reveal that the eastward and upward propagation of negative subsurface temperature anomalies primarily drives the phase reversal of TPDV. Following this transition from positive to negative phase, the Pacific Meridional Mode (PMM) plays a crucial role. Specifically, PMM‐associated wind forcing induces anomalous upwelling and downwelling in the Niño4 and Niño3 regions, respectively. This results in anomalous vertical advection of mean temperature, contributing to the strengthening and weakening of decadal variances in these regions. Key Points: Subsurface temperature anomalies initiate the phase reversal of TPDV while PMM plays a key role in equatorial SSTAs post‐transitionVertical heat advection is crucial in reinforcing/weakening decadal variance in the Niño4/Niño3 regionPMM‐associated wind fields induce anomalous vertical advection after the TPDV phase transition

How to cite: Tseng, Y., San, S.-C., Ding, R., and Di Lorenzo, E.: Why is tropical Pacific decadal variability predominantly observed in the Nino4 region?, EGU General Assembly 2025, Vienna, Austria, 27 Apr–2 May 2025, EGU25-2370, https://doi.org/10.5194/egusphere-egu25-2370, 2025.

EGU25-2895 | ECS | Posters on site | CL2.2 | Highlight

Isolated tropical Indo-Pacific SSTA Impacts on ISMR Variability in Observations and CMIP6 Historical Simulations 

Erin Guderian and Weiqing Han

Year-to-year variability in Indian summer monsoon rainfall (ISMR) can greatly impact the densely populated Indian subcontinent. While it has been demonstrated previously that tropical Pacific and Indian Ocean SSTAs can influence ISMR variability, the relative contribution from each basin has been difficult to determine due to the complicated inter-basin interactions. Using observational data and the historical simulations (1950-2014) from seven CMIP6 models with large ensemble sizes, we apply a cyclo-stationary linear inverse model (CS-LIM) to assess the isolated contributions from tropical Pacific SSTAs, Indian Ocean SSTAs, and their interaction to ISMR interannual variability. Observational results indicate that Pacific SSTAs enhance precipitation variability over northeastern and southern India, while Indian Ocean SSTAs and the Indo-Pacific interaction reduce the variability, with the Indo-Pacific interaction strongly damping the precipitation variability over central India. In CMIP6 models, Pacific SSTAs typically increase ISMR variability, but their spatial patterns largely differ from observations. For the impacts from Indian Ocean SSTA and the Indo-Pacific interaction, all models capture the observed reduction in precipitation variability, but the magnitude and spatial patterns vary considerably, with most models failing to simulate the stronger damping effect due to the Indo-Pacific interaction.

How to cite: Guderian, E. and Han, W.: Isolated tropical Indo-Pacific SSTA Impacts on ISMR Variability in Observations and CMIP6 Historical Simulations, EGU General Assembly 2025, Vienna, Austria, 27 Apr–2 May 2025, EGU25-2895, https://doi.org/10.5194/egusphere-egu25-2895, 2025.

EGU25-3054 | Orals | CL2.2

Extreme El Niño events versus ENSO diversity 

Jérôme Vialard, Margot Beniche, Fangyu Liu, Matthieu Lengaigne, Eric Guilyardi, and Alexey Fedorov

Over the past two decades, significant attention has been given to ENSO (El Niño Southern Oscillation) diversity, categorizing El Niño events as either central Pacific (CP) or eastern Pacific (EP) based on their dynamics, sea surface temperature (SST) and rainfall patterns, and global teleconnections. EP events include both moderate events and rare extreme events, such as those that peaked in December 1972, 1982, 1997, and 2015. Here, we will demonstrate that CP El Niño and moderate EP El Niño events are not clearly distinguishable in terms of SST, rainfall pattern, teleconnection, and driving mechanisms. In contrast, extreme EP events exhibit fundamentally different dynamics, driven by a massive reorganization of atmospheric convection across the Pacific. Drawing on our recent findings and the broader literature, we will highlight the distinctive attributes of extreme El Niño events. These events are expected to increase in frequency under global warming. They are linked to eastward-shifted teleconnection patterns, leading to specific and predictable impacts over North America. They also induce a much stronger and longer-lasting oceanic memory, resulting in a predictable transition to a two-year La Niña. Atmospheric nonlinearities, particularly those associated with the threshold for deep atmospheric convection, play a critical role in establishing those extreme El Niño events distinguishing features. In summary, CP and moderate EP events share many characteristics, while extreme El Niño events stand apart. These insights challenge the current approach to ENSO diversity and suggest that categorizing ENSO states as La Niña, neutral, moderate El Niño, and extreme El Niño is more relevant.

How to cite: Vialard, J., Beniche, M., Liu, F., Lengaigne, M., Guilyardi, E., and Fedorov, A.: Extreme El Niño events versus ENSO diversity, EGU General Assembly 2025, Vienna, Austria, 27 Apr–2 May 2025, EGU25-3054, https://doi.org/10.5194/egusphere-egu25-3054, 2025.

EGU25-3508 | ECS | Posters on site | CL2.2

Future ENSO and IOD associated seasonal rainfall and temperature anomalies over Mainland Southeast Asia. 

Ubolya Wanthanaporn, Iwan Supit, Ronald Hutjes, and Winai Chaowiwat

This study examines the projected change in rainfall and temperature anomalies across Mainland Southeast Asia, focusing on the teleconnection of El Niño Southern Oscillation (ENSO) and Indian Ocean Dipole (IOD). Five GCM’s from the CMIP6 project (GFDL-ESM4, IPSL-CM6A-LR, MPI-ESM1-2-HR, MRI-ESM2-0, and UKESM1-0-LL) are used to investigate the historical (1985-2014) and future periods based on two Shared Socioeconomic Pathways (SSPs), SSP3-7.0 and SSP5-8.5, divided into three periods: near-future (2015-2044), mid-future (2041-2070), and far-future (2071-2100). The impact of ENSO and IOD on climate anomalies is analyzed using partial correlation coefficient (PCOR) calculated between Niño 3.4 and DMI index. PCOR allows us to examine the influence of ENSO while excluding the effect of IOD, and vice versa. We divided the study into three seasons: March-April-May (MAM), June-July-August-September (JJAS), and October-November-December (OND). Generally, ENSO and IOD show positive correlations with temperature, which means the positive phase of each results in higher temperature, whereas their correlations with rainfall can be positive as well as negative. Negative correlations between ENSO and rainfall predominate in most MSEA areas leading to drier conditions during El Niño events, except during June-July-August-September during which ambiguous patterns occur with both negative and positive influences from ENSO. Meanwhile, IOD presents significant positive influences on rainfall over large areas. Future correlations are generally higher than historic ones, suggesting a potential for better predictability of seasonal forecasts.

How to cite: Wanthanaporn, U., Supit, I., Hutjes, R., and Chaowiwat, W.: Future ENSO and IOD associated seasonal rainfall and temperature anomalies over Mainland Southeast Asia., EGU General Assembly 2025, Vienna, Austria, 27 Apr–2 May 2025, EGU25-3508, https://doi.org/10.5194/egusphere-egu25-3508, 2025.

EGU25-3902 | ECS | Orals | CL2.2

ENSO diversity in CMIP models within the recharge oscillator framework 

Priyamvada Priya and Dietmar Dommenget

This study is focused on analysing the phase space dynamics of the El Niño-Southern Oscillation (ENSO) for two different types of ENSO, Eastern Pacific (EP) and Central Pacific (CP) in the Coupled Model Intercomparison Project (CMIP) 5 and 6 model simulations. The phase space is defined by a 2-dimensional representation of the eastern equatorial sea surface temperature anomaly (T) and the thermocline depth anomaly (h). We find that the dynamics of h in CMIP models appear to be regionally shifted to the east (hshift). The results, when considering hshift, suggest that CMIP models successfully capture the key aspects of observed ENSO diversity, including the asymmetries in the mean phase space, the extremes, and the phase speed, with distinct differences between EP and CP. We find significantly weaker interaction between CP and h as compared to EP and h, suggesting that the EP mode is more dynamically coupled to h than the CP mode, as it is observed. CMIP models reproduce the faster phase transition speed for EP, whereas, for CP, they replicate the weaker and slower observed phase transitions. However, CMIP model ensembles have substantial limitations and reproduce most observed characteristics with much weaker intensities. There is a large spread within the model ensemble, with only a few CMIP models accurately simulating the observed asymmetry of the ENSO phase space for CP and EP. Further, we found no significant improvement from CMIP 5 to CMIP 6 models in simulating the observed phase space dynamics of ENSO diversity.

How to cite: Priya, P. and Dommenget, D.: ENSO diversity in CMIP models within the recharge oscillator framework, EGU General Assembly 2025, Vienna, Austria, 27 Apr–2 May 2025, EGU25-3902, https://doi.org/10.5194/egusphere-egu25-3902, 2025.

EGU25-3969 | Orals | CL2.2

Initial equatorial Pacific cooling due to CO2 forcing shaped by internal variability 

Eduardo Moreno-Chamarro, Dian Putrasahan, and Sarah M. Kang

In this contribution, we argue that other processes beyond the ocean dynamical thermostat mechanism can be key for initial equatorial Pacific cooling from a quadrupling of CO2 concentration, with those processes being influenced by internal climate variability. The thermostat mechanism, which is proposed to explain the cooling trend observed in recent decades, suggests that the cold upwelling in the eastern equatorial Pacific has delayed the warming of the equatorial Pacific from rising CO2. We run a large-ensemble of 250 simulations of an abrupt CO2 quadrupling with the Max Planck Institute - Earth System Model (MPI-ESM) climate model. While the ensemble mean shows weak initial warming in the equatorial Pacific in the first 2 years, compared to global changes, the individual ensemble members show a wide spread of responses, with 42 out of the 250 members simulating a cooling. We then separate between the 42 cooling members and the 46 members that warm the most and analyze the upper-ocean energy budget. The main driver distinguishing the two groups is the change in the meridional heat transport, with energy divergence driving cooling in the central-western Pacific and energy convergence driving warming in the eastern Pacific. This is mainly caused by the change in ocean meridional velocities and is amplified by the change in the meridional temperature gradient. Strengthened easterlies over the central and western Equatorial Pacific increase Ekman transport away from the Equator that drives cooling, while weakened easterlies decrease Ekman transport, warming the eastern equatorial Pacific. In contrast to the meridional heat transport, cooling due to the ocean dynamical thermostat mechanism from vertical heat transport is similar in all the cases and cannot explain the ensemble spread. Other contributions to the energy budget play a minor role, such as the shortwave surface radiation, or are a response to the temperature anomaly rather than a driver, such as the latent heat flux. Over longer, multidecadal timescales, both cooling and warming simulations converge to show amplified warming in the eastern equatorial Pacific, consistent with past studies. Our findings suggest that other mechanisms can be more important than the thermostat mechanisms for cooling the equatorial Pacific, with a large impact of internal variability. This highlights the need for large ensembles of simulations in studies of the initial response to increasing CO2.

How to cite: Moreno-Chamarro, E., Putrasahan, D., and M. Kang, S.: Initial equatorial Pacific cooling due to CO2 forcing shaped by internal variability, EGU General Assembly 2025, Vienna, Austria, 27 Apr–2 May 2025, EGU25-3969, https://doi.org/10.5194/egusphere-egu25-3969, 2025.

The simulation of teleconnections in climate models can be hindered by biases. This study investigates the impact of model systematic errors on the teleconnections between the El Niño-Southern Oscillation (ENSO) and the North Atlantic-European (NAE) region during early winter (December), using historical simulations from phases 5 and 6 of the Coupled Model Intercomparison Project (CMIP). Generally, a positive Indian Ocean Dipole (IOD) event concurs with the onset of an El Niño event. In December, a positive IOD can initiate a Rossby wave-train that propagates from the subtropical South Asian JET (SAJET) sector toward the NAE region, where it forces an atmospheric response that resembles the positive phase of the North Atlantic Oscillation (NAO). Models that fail to simulate the early-winter teleconnection projecting onto the NAO positive phase pattern consistently exhibit a weak Rossby wave source in the SAJET region. Additionally, these models simulate an overly strong subtropical Pacific jet stream, which favors meridionally bent Rossby wave-trains. This waveguide bias is likely due to a cold northwestern Pacific, a mean state bias common to many climate models. These findings suggest that an uncertainty factor regarding the ENSO teleconnection with the NAE may stem from both a degraded Indo-Pacific inter-basin coupling and an overly strong Pacific waveguide. 

How to cite: Sabatani, D. and Gualdi, S.: ENSO teleconnections with the NAE sector during boreal early-winter in CMIP5/CMIP6 models: impacts of the atmospheric mean state, EGU General Assembly 2025, Vienna, Austria, 27 Apr–2 May 2025, EGU25-4624, https://doi.org/10.5194/egusphere-egu25-4624, 2025.

EGU25-4946 | Orals | CL2.2

Strengthened Influence of Atlantic Niño on ENSO in a Warming Climate 

Lei Zhang, Chunzai Wang, Weiqing Han, Kristopher Karnauskas, Michael McPhaden, Aixue Hu, Wen Xing, Baiyang Chen, and Heng Liu

Atlantic Niño can influence ENSO by modulating the Pacific Walker circulation. This interbasin connection is dominated by central Atlantic Niño (CAN) events, which began to emerge around 2000. Our analysis of observational data and climate model simulations reveals that the influence of CAN on ENSO will strengthen in a warming climate due to an enhanced Pacific response. On one hand, increased variability of the eastern Pacific intertropical convergence zone leads to stronger subsidence anomalies induced by CAN; on the other hand, strengthened atmospheric variability over the North Indian Ocean enhances the region’s response to CAN-induced Kelvin waves, promoting easterly anomalies over the western tropical Pacific. These changes are further linked to the pronounced interhemispheric warming contrast projected by climate models. Our findings underscore the growing influence of Atlantic Niño on ENSO, with important implications for seasonal climate prediction and future climate change projections.

How to cite: Zhang, L., Wang, C., Han, W., Karnauskas, K., McPhaden, M., Hu, A., Xing, W., Chen, B., and Liu, H.: Strengthened Influence of Atlantic Niño on ENSO in a Warming Climate, EGU General Assembly 2025, Vienna, Austria, 27 Apr–2 May 2025, EGU25-4946, https://doi.org/10.5194/egusphere-egu25-4946, 2025.

EGU25-5143 | Orals | CL2.2

Investigating Tropical Basin Interactions: Insights from the TBIMIP Pacemaker Experiments 

Chunzai Wang, Hanjie Fan, and Sheng Chen

Large-scale interactions among the three tropical ocean basins—the Pacific, Atlantic, and Indian Oceans—can influence or modify climate variability. The international CLIVAR initiative on Tropical Basin Interactions (TBI) seeks to establish a unified understanding of the mechanisms driving these interactions and their role in climate predictability. This paper introduces the Tropical Basin Interaction Model Intercomparison Project (TBIMIP), which provides an experimental framework for investigating interactions among the tropical basins. Within the TBIMIP, a series of three-ocean "pacemaker" experiments were conducted using the CESM2 model, in line with the experimental protocol. Specifically, Tier 2 experiments, where sea surface temperatures (SSTs) were restored to observed full-field data, were carried out by the South China Sea Institute of Oceanology, Chinese Academy of Sciences. These experiments, by restoring both observed anomalies and climatological means, allow for the examination of how biases in the mean-state of one ocean might influence the mean state of others. Furthermore, they enable an exploration of how correcting these mean-state biases could affect the large-scale interactions between the three tropical ocean basins.

How to cite: Wang, C., Fan, H., and Chen, S.: Investigating Tropical Basin Interactions: Insights from the TBIMIP Pacemaker Experiments, EGU General Assembly 2025, Vienna, Austria, 27 Apr–2 May 2025, EGU25-5143, https://doi.org/10.5194/egusphere-egu25-5143, 2025.

A recent study of a series of simulations with idealised geometries of the tropical ocean basins and land found remarkable changes in ENSO and tropical basin interactions that suggest that atmospheric dynamics are largely controlling ENSO dynamics. Here we will discuss shallow water atmosphere (Gill-type) model results to explore how simplified atmospheric dynamics can control growth rate (Bjerknes feedback) and period of ENSO. We find that for single tropical ocean basins larger than the Pacific the Bjerknes feedback becomes weaker due to the zonal length of the SST forcing and at the same time the meridional winds become stronger. This result suggest that basins larger than the Pacific will have weaker ENSO variability due to the atmospheric dynamics controlling the wind stress. Interactions with heat sources in remote tropical ocean basins have the ability to strongly enhance the Bjerknes feedback leading to stronger control on ENDO dynamics than the basin size. The changes in the winds stress also affect the period of ENSO by altering the wind stress curl, which for larger ocean basins gets closer to the equator and thereby increasing the Rossby wave speed supporting the finding that larger basins have short ENSO periods.

How to cite: Dommenget, D. and Wang, J.: Atmospheric dynamics controlling ENSO growth rate and period in a series of idealised worlds simulations, EGU General Assembly 2025, Vienna, Austria, 27 Apr–2 May 2025, EGU25-5289, https://doi.org/10.5194/egusphere-egu25-5289, 2025.

EGU25-6468 | ECS | Posters on site | CL2.2

Towards an improved understanding of Pacific Decadal Variability using paleoclimate reanalysis 

Quentin Dalaiden, François Counillon, Lea Svendsen, Nerilie J. Abram, Anqi Lyu, Yiguo Wang, and Noel Keenlyside

The Pacific Decadal Variability (PDV) is the dominant mode of Earth System variability on multi-decadal timescales. Depending on the phase of the PDV, it can either accelerate or mitigate the global warming trend. Additionally, PDV has significant societal impacts. It influences hazards across the Pacific region, including floods, droughts, and bushfires, as well as the two main ice sheets, resulting in substantial coastal impacts. Most studies investigating the drivers of PDV have focused on the instrumental period, concluding that PDV is primarily driven by atmospheric processes, with a relatively minor contribution from oceanic processes. However, the instrumental period may be too short to fully capture the low-frequency climate variability in the Pacific, particularly its associated oceanic processes. Moreover, this period is marked by large changes in external forcings, especially those resulting from anthropogenic greenhouse gas and aerosol concentrations. Here we present a novel, fully coupled paleoclimate reanalysis spanning the past 400 years. This reanalysis utilizes the Norwegian Climate Prediction Model (NorCPM), equipped with an Ensemble Kalman Filter data assimilation method. Originally developed for producing oceanic reanalysis with skills comparable to top-performing ocean reanalysis systems, we adapted NorCPM to incorporate hundreds of paleoclimate records, including coral, tree-ring, and ice-core observations, extending back four centuries. When compared with state-of-the-art atmospheric reanalyses and surface oceanic observations, our reanalysis demonstrates high skill across the Pacific domain. As a coupled model, it enables a detailed quantification of multi-decadal, two-way interactions between the ocean and atmosphere that drive the PDV. By comparing this fully coupled reanalysis with standalone simulations (i.e., those without ocean-atmosphere coupling), we quantify the contribution of these coupled interactions to the PDV. Finally, we present the impacts of long-lasting extreme PDV states on hydroclimate variability across the Pacific basin, providing new insights into the effects of PDV at regional and global scales.

How to cite: Dalaiden, Q., Counillon, F., Svendsen, L., Abram, N. J., Lyu, A., Wang, Y., and Keenlyside, N.: Towards an improved understanding of Pacific Decadal Variability using paleoclimate reanalysis, EGU General Assembly 2025, Vienna, Austria, 27 Apr–2 May 2025, EGU25-6468, https://doi.org/10.5194/egusphere-egu25-6468, 2025.

EGU25-7450 * | Orals | CL2.2 | Highlight

El Niño and Record Warm SSTs Boost Global Mean Surface Temperatures 

Michael McPhaden

According to the World Meteorological Organization, 2024 is the warmest year on record and the first year of the modern era that global mean surface temperatures have likely exceeded pre-industrial levels by 1.5°C.  Temperatures in 2024 surpassed the record set in 2023, which is now the second warmest year of the modern era. The record warmth in 2023-2024 was accompanied by extraordinary weather and climate extremes around the globe including historic droughts and floods, widespread wild fires, and intense and prolonged marine heatwaves. Human-caused increases in heat trapping greenhouse gas concentrations are the fundamental underlying cause for these record high global mean surface temperatures, with atmospheric carbon dioxide levels reaching new highs in 2023 and 2024.  Coincidentally, after nearly a decade of near-neutral or unusually cold conditions in the tropical Pacific, an El Niño that ranked among the strongest of the past 75 years emerged in the boreal spring of 2023 and peaked at the end of the year before decaying in the spring of 2024. This presentation will show that heat loss from the ocean to the atmosphere during the El Niño was primarily responsible for boosting global mean surface temperatures into record territory in 2023 and 2024, though elevated sea surface temperatures in other parts of the world ocean contributed to these global temperature extremes.

How to cite: McPhaden, M.: El Niño and Record Warm SSTs Boost Global Mean Surface Temperatures, EGU General Assembly 2025, Vienna, Austria, 27 Apr–2 May 2025, EGU25-7450, https://doi.org/10.5194/egusphere-egu25-7450, 2025.

EGU25-7893 | ECS | Orals | CL2.2

Improving ENSO Simulation through Optimization of Atmospheric Parameterizations in the ICON XPP Earth System Model 

Dakuan Yu, Dietmar Dommenget, Holger Pohlmann, and Wolfgang Müller

The El Niño/Southern Oscillation (ENSO) is a dominant mode of interannual climate variability, profoundly influencing global weather and climate systems. However, accurately simulating ENSO in climate models remains a major scientific challenge due to the complex coupled ocean-atmosphere interactions involved. Utilizing the ENSO Metrics Package, which evaluates tropical climatology, ENSO performance, and feedback biases, twenty-one atmospheric parameters related to cloud physics, microphysics, and turbulence schemes were tuned for ENSO simulations in the next-generation Max-Planck-Institute for Meteorology Earth System model, ICON XPP. Initial parameter perturbations were performed in AMIP simulations to estimate model sensitivities to each parameter. The optimal parameter combination for ENSO simulations was estimated based on the Nelder-Mead optimization scheme using the linear superposition of the parameter sensitivities. This approach effectively reduced the ENSO metrics cost function by 40% in the optimized run within AMIP experiments, including very good simulations of the Bjerknes and atmospheric net heat flux feedbacks. However, applying the optimized parameter sets to fully coupled ocean-atmosphere simulations resulted in very different parameter sensitivities and much less improved ENSO simulations. This discrepancy in the coupled model is largely related to very strong mean state changes in the Sea Surface Temperatures (SST) in the tropical. Direct tuning of parameters in coupled ICON XPP simulations will be explored in subsequent studies.

How to cite: Yu, D., Dommenget, D., Pohlmann, H., and Müller, W.: Improving ENSO Simulation through Optimization of Atmospheric Parameterizations in the ICON XPP Earth System Model, EGU General Assembly 2025, Vienna, Austria, 27 Apr–2 May 2025, EGU25-7893, https://doi.org/10.5194/egusphere-egu25-7893, 2025.

EGU25-8475 | ECS | Posters on site | CL2.2

Future changes of ENSO precipitation and temperature teleconnections over tropics and subtropics. 

Dhruba Jyoti Goswami, Dr Robin Chadwick, Prof Matthew Collins, Mr Jozef Syktus, Dr Ralph Trancoso, and Sarah ineson

The El-Niño Southern Oscillation (ENSO) is the dominant mode of inter-annual climate variability, driven by ocean-atmosphere interactions in the tropical Pacific that alternate between the warm (El-Niño) and cold (La-Niña) phases over a 3-7 year cycle. With increasing greenhouse gases ENSO teleconnections are projected to change in future global warming scenarios. Land surface temperature and precipitation teleconnections are projected to change over more than 50% of global land regions by the end of the 21st century.Most land regions show a significant amplification of the teleconnection. This presentation will examine how the teleconnections are projected to change over the tropics and subtropics and how dynamic and thermodynamic components contribute to these changes.

This will lead into future work using a linear baroclinic model to improve the understanding of changes in dynamical ENSO teleconnection processes over the tropics and subtropics. For example, how does the projected eastward shift of the equatorial Pacific ENSO precipitation anomalies influence the changes in precipitation and temperature teleconnections over tropical and sub-tropical land regions?

How to cite: Goswami, D. J., Chadwick, D. R., Collins, P. M., Syktus, M. J., Trancoso, D. R., and ineson, S.: Future changes of ENSO precipitation and temperature teleconnections over tropics and subtropics., EGU General Assembly 2025, Vienna, Austria, 27 Apr–2 May 2025, EGU25-8475, https://doi.org/10.5194/egusphere-egu25-8475, 2025.

EGU25-9135 | ECS | Orals | CL2.2

Rectified Effects of Regional Current Feedback on Large-Scale Air-Sea Interactions and ENSO 

Carlos Conejero, Julien Boucharel, Lionel Renault, and Christophe Menkes

Recent observational and modeling studies have shown that coupled atmospheric and oceanic mesoscale processes exert a significant influence on ENSO dynamics. However, the spatial resolution of the latest generation of climate models is still insufficient to fully resolve mesoscale air-sea interactions. Furthermore, climate models exhibit significant biases in the simulation of the tropical Pacific mean state, which can affect the ability of the model to accurately reproduce ENSO variability. In particular, the Current Feedback to the Atmosphere (CFB) slows the large-scale mean circulation by reducing the mean energy input from the atmosphere to the ocean, while at the mesoscale it causes the "eddy killing" mechanism: a damping of eddies by ~30%, caused mainly by the transfer of energy from ocean currents to the atmosphere.

In this study, we perform a set of regional high-resolution oceanic (1/12°) and atmospheric (1/4°) coupled simulations, in which the CFB is considered (CTRL) or not (NOCFB), to quantify the impact of mesoscale air-sea interactions on the Pacific mean state and ENSO. The coupled simulations cover the entire Pacific basin (90°E-70°W) and the tropics (30°S-30°N) for the period 1980-2020. The impact of CFB on the oceanic mean state and ENSO is then assessed by comparing the two simulations. The CTRL simulation effectively reproduces the mean state and seasonal cycle of the tropical climate, specially the sea surface temperature (SST) pattern with an accurate representation of the warm pool and cold tongue extension. Additionally, the model properly simulates the equatorial current system, the equatorial thermocline, and key atmospheric characteristics of the tropics (e.g., ITCZ-SPCZ). These features enable the model to successfully represent the ENSO seasonal phase, including the onset, development, and termination of the most intense El Niño events (e.g., 1982/83 and 1997/98).

We show that, in addition to the slowdown of the equatorial current system from the surface to ~100 m depth and the reduction of equatorial eddy kinetic energy through decreased barotropic and baroclinic energy conversion, CFB enhances the equatorial zonal SST gradient by warming the western Pacific by up to 0.3°C and cooling the eastern Pacific by about 0.4°C. These effects directly impact the mean state of precipitation and net heat flux across the warm pool and cold tongue. Consequently, the ENSO asymmetry and nonlinearity are reduced by approximately 10% in the NOCFB simulation, thereby underscoring the rectifying effects of the CFB on large-scale SST patterns in the tropical Pacific basin.

How to cite: Conejero, C., Boucharel, J., Renault, L., and Menkes, C.: Rectified Effects of Regional Current Feedback on Large-Scale Air-Sea Interactions and ENSO, EGU General Assembly 2025, Vienna, Austria, 27 Apr–2 May 2025, EGU25-9135, https://doi.org/10.5194/egusphere-egu25-9135, 2025.

EGU25-10983 | ECS | Orals | CL2.2

Revealing Ocean Dynamics Driving ENSO Phase Transitions 

Fangyu Liu, Jérôme Vialard, Christian Ethé, Renaud Person, Alexey Fedorov, Eric Guilyardi, and Matthieu Lengaigne

ENSO predictability relies largely on deterministic equatorial ocean dynamics, where wind variations during one phase trigger oceanic responses that favor a shift to the opposite phase. However, in observations, this deterministic response is obscured by air-sea coupled variations and stochastic Westerly Wind Bursts. Here, we present a method to isolate the ocean dynamics underpinning ENSO phase transitions using forced experiments with an Ocean General Circulation Model (OGCM). The control experiment is forced by interannually varying wind stresses, with thermal damping from air-sea heat fluxes computed interactively as relaxation to climatological Sea Surface Temperature (SST). This setup reproduces observed equatorial Pacific SST and heat content variations with high fidelity. To assess the role of ocean initial conditions, "memory" experiments branch from the control simulation every January 1st, replacing wind stresses with climatological values (i.e., no interannual wind anomalies). In these experiments, interannual anomalies arise solely from the evolution of equatorial planetary waves in the initial conditions. The ocean memory index (OMI) derived from these experiments demonstrates hindcast skill for 1-year lagged ENSO peaks comparable to or exceeding traditional precursors like Warm Water Volume or western Pacific heat content. This highlights the effectiveness of our methodology in isolating the ocean dynamics driving ENSO phase transitions. Our findings emphasize the central role of low-order equatorial Rossby waves (meridional modes 1-3) in ENSO's oceanic memory via reflections at the Pacific western boundary and indicate that widely used indices such as Warm Water Volume orwestern Pacific heat content do not optimally capture these processes.

How to cite: Liu, F., Vialard, J., Ethé, C., Person, R., Fedorov, A., Guilyardi, E., and Lengaigne, M.: Revealing Ocean Dynamics Driving ENSO Phase Transitions, EGU General Assembly 2025, Vienna, Austria, 27 Apr–2 May 2025, EGU25-10983, https://doi.org/10.5194/egusphere-egu25-10983, 2025.

EGU25-11263 | Orals | CL2.2

Inter-model variability in the influence of El Niño-Southern Oscillation over the precipitation in South America 

Vanesa C. Pantano, M. Florencia Iacovone, and Olga C. Penalba

Global Climate Models (GCMs) are projecting future changes in different modes of variability influencing precipitation over South America (SA). Among them, El Niño-Southern Oscillation (ENSO) is the most important mode of inter-annual variability. However, the GCMs still present high inter-model variability. Therefore, it is still necessary to advance in the assessment of simulated ENSO impact before asserting future consequences. The aim of this study is to analyse inter-model variability in ENSO signal on precipitation simulated by GCM-CMIP6 over SA.

Daily precipitation and monthly sea surface temperature (SST) were obtained from 15 GCMs selected from CMIP6 and compared to ERA5 reanalysis, for the period 1981-2010. The ENSO was characterised through the Oceanic Niño Index (ONI) which was calculated based on SST anomalies over the Niño3.4 region. Total accumulated rainfall (PRCPTOT) was calculated in two trimesters October-December (OND) and December-February (DJF). These seasons were chosen because of the incidence of ENSO signal over SA.

Firstly, inter-model variability in the ONI values was assessed comparing the distributions with the index obtained from ERA5 and quantifying the number of cases under each ENSO phase: El Niño, La Niña and Neutral. The inter-quartil range is underestimated by 53% of the models and overestimated by one model, for both seasons. The rest of the models present similar distribution to ERA5. Consequently, the models that underestimate the inter-quartil range, overestimate the number of Neutral cases. Additionally, the extreme values of El Niño phase are more overestimated than the values of La Niña phase.

Secondly, the simulation of ENSO signal on PRCPTOT was assessed through Spearman correlation (5% significance level) and composite patterns. The analysis was focused on two main regions where ONI signal is stronger: Northern South America (NSA) and Southeastern of South America (SESA).

In general terms, for OND, the models are able to capture spatial patterns, in particular, with positive correlations over SESA and negative ones over NSA with 70% inter-model agreement. The rest of the models present higher spatial variability. The ensemble of the models also captures the spatial pattern correctly in almost all South America.

The ENSO signal in PRCPTOT for DJF is weaker, according to ERA5. The ensemble of the models captures the sign of the signal over the regions of interest, but fails over central Brazil, located among SESA and NSA. The level of agreement between the models is similar to OND over the regions with strong ENSO signal but, over transitional regions, the inter-model variability is higher.

Based on these results, composite analysis was carried out for the ensemble of the models. In general terms, the signal simulated by the GCMs is weaker than ERA5, but they adequately identify the regions and the sign of the signal.

The main result of this research is that ENSO signal on South America precipitation is well simulated by GCMs particularly over the regions where this signal is stronger. This study is a first step for a subsequent analysis of the future projections of the ensemble of the GCMs, considering other precipitation indices. 

How to cite: Pantano, V. C., Iacovone, M. F., and Penalba, O. C.: Inter-model variability in the influence of El Niño-Southern Oscillation over the precipitation in South America, EGU General Assembly 2025, Vienna, Austria, 27 Apr–2 May 2025, EGU25-11263, https://doi.org/10.5194/egusphere-egu25-11263, 2025.

EGU25-12537 | ECS | Posters on site | CL2.2

Tropical Pacific climate variability and Atlantic–Pacific teleconnections under Holocene and Last Interglacial forcings 

Donghao Li, Matthias Prange, Michael Schulz, Thomas Felis, and Ute Merkel

The tropics are a pivotal amplifier of global climate variability and change, largely through interannual phenomena such as the El Niño-Southern Oscillation (ENSO) and other tropical basin interactions, which underscores the importance of accurately modeling their behavior under changing climate forcings. Here, we investigate how mean state, seasonality, and interannual variability of the tropical Pacific respond to altered boundary conditions in past warm climates. We also examine how these changes affect teleconnections with the tropical Atlantic, specifically the Caribbean Sea.

Motivated by past warm climate time-windows covered by monthly-resolved proxy records of sea-surface temperature (SST) and hydrology derived from fossil corals, we use the fully coupled water and carbon isotope-enabled Community Earth System Model (iCESM) to perform time-slice simulations for three key climate intervals: Pre-Industrial (PI), Mid-Holocene (6 ka), and Last Interglacial (124 ka) at a nominal horizontal resolution of 1° in the atmosphere, land, ocean and sea-ice components. Mid-Holocene coral records from the Line Islands (central tropical Pacific) and Bonaire (southern Caribbean), as well as Last Interglacial coral records from Bonaire, are used for model–data comparisons.

In response to the changes in orbital and greenhouse-gas boundary conditions, both 6 ka and 124 ka simulations show distinct climate anomalies. The tropical eastern Pacific exhibits La Niña-like conditions in SST with a cooling by 0.4°C and 0.5°C during boreal winter for 6 ka and 124 ka, respectively, which is also evident from an increased zonal sea-level pressure gradient as compared to PI. Contrasting anomalies north and south of the equator over the tropical Pacific result in a statistically significant increase of the meridional SST asymmetry by 0.3°C for 6 ka and 0.6°C for 124 ka as compared to PI. These point to a reorganization of the tropical Pacific mean state. Concurrently, both of our simulations reveal a significant reduction in the interannual variability of SST in the Central Pacific and a significant increase in the Eastern Pacific, with 124 ka showing larger amplitudes of the anomalies by up to 20% relative to PI. Taken together, these patterns indicate a response of the tropical Pacific to warmer boundary conditions, altering large-scale atmospheric circulation and affecting teleconnections into neighboring basins.

Moreover, previous research points to relationships between Pacific SST interannual variability and southern Caribbean SST seasonality under modern climate conditions. Both our 6 ka and 124 ka simulations show increased SST seasonality in the southern Caribbean, which is consistent with evidence from coral records. In an ongoing analysis combining our simulations and available coral records from the Atlantic and Pacific, we further explore the characteristics of potential connections between seasonality and variability during past warm intervals in order to get deeper insights into Atlantic–Pacific climate dynamics and teleconnections under warm climates.

How to cite: Li, D., Prange, M., Schulz, M., Felis, T., and Merkel, U.: Tropical Pacific climate variability and Atlantic–Pacific teleconnections under Holocene and Last Interglacial forcings, EGU General Assembly 2025, Vienna, Austria, 27 Apr–2 May 2025, EGU25-12537, https://doi.org/10.5194/egusphere-egu25-12537, 2025.

EGU25-12670 | ECS | Orals | CL2.2

Is ENSO a self-sustained or a damped oscillation?  

Elle Weeks and Eli Tziperman

The recharge oscillator (RO) model has been used to describe and understand different aspects of the El Niño Southern Oscillation (ENSO). One application involves fitting the RO model to observations or model output to identify if ENSO is a self-sustained or a damped oscillation driven by external weather noise such as westerly wind bursts. Fitting the linear recharge oscillator to observations and climate model simulations consistently yields an asymptotically stable system. This suggests that ENSO can be represented by a damped oscillator whose variability is sustained and made irregular by external stochastic forcing. We investigate the accuracy of methods that have been used to estimate the recharge oscillator parameters and their implied period and growth rate for ENSO using simulations of both linear and nonlinear recharge oscillators. Ultimately, we find that fitting the RO does not allow for robustly differentiating between a damped or a self-sustained regime. Specifically, we find that fitting a linear RO leads to parameters that imply a damped oscillator even when the fitted data were produced by a model that is self-sustained. As such, it seems challenging  to conclude whether ENSO is a damped or a self-sustained system by fitting the recharge oscillator model to observations. It is therefore possible that ENSO could be described instead by a self-sustained oscillator.


How to cite: Weeks, E. and Tziperman, E.: Is ENSO a self-sustained or a damped oscillation? , EGU General Assembly 2025, Vienna, Austria, 27 Apr–2 May 2025, EGU25-12670, https://doi.org/10.5194/egusphere-egu25-12670, 2025.

EGU25-13860 | ECS | Posters on site | CL2.2

Interannual Variability in the Northern Humboldt Current System: Insights from various Upwelling Indices 

Daniel Lizarbe, Tianfei Xue, Stephan Juricke, and Mathias Zeller

Coastal upwelling, driven by alongshore wind that pushes surface waters away from the shore, brings nutrient-rich, cold, deep waters to the surface, fueling productivity and biodiversity in marine ecosystems. The Northern Humboldt Current System, as one of the most productive coastal upwelling systems, is renowned for its high fish catches due to persistent upwelling. Since upwelling cannot be directly measured, scientists rely on indices to estimate it through upward velocity, the Ekman transport, and temperature gradients. These indices are derived from winds data, nitrogen concentrations, and sea surface temperature. To identify which indices best correlate with upward velocity and local biogeochemistry in the system, we used a high-resolution regional model: CROCO-BioEBUS. Our results show that wind-based and nitrogen-based indices better correlate with the upward velocity and biogeochemical factors like nitrogen and chlorophyll concentrations.  In contrast, temperature-based indices display different response compared to the wind- and nitrogen-based indices, particularly during extreme events like El Nino. During El Nino, the upwelling intensity increases at the base of the mixed layer depth. Nevertheless, this upwelling intensification did not lead to a major transport of nutrients, as the overall upwelled nitrogen decreased. Discrepancies between the sea-surface temperature-based and wind-based upwelling indices are highlighted during El Nino, suggesting the need to reconsider how upwelling is defined and measured in the Northern Humboldt Current System.

Key words: Upwelling Indices, Northern Humboldt Current System, El Niño

How to cite: Lizarbe, D., Xue, T., Juricke, S., and Zeller, M.: Interannual Variability in the Northern Humboldt Current System: Insights from various Upwelling Indices, EGU General Assembly 2025, Vienna, Austria, 27 Apr–2 May 2025, EGU25-13860, https://doi.org/10.5194/egusphere-egu25-13860, 2025.

EGU25-14760 | ECS | Orals | CL2.2

Diversity of La Niña Onset 

Xiao Pan and Tim Li

The mechanisms of La Niña onset diversity remain unclear. Here we identified three La Niña onset types using the K-means cluster analysis of equatorial SSTA evolutions from the preceding summer to the developing winter. The first onset type is characterized by a transition from a neutral year to La Niña (N2L). The second type is a transition from a central Pacific (CP) El Niño to La Niña (CE2L). The third type is a transition from a super El Niño to La Niña (SE2L). A key preceding signal for N2L is the warming in the tropical North Atlantic (TNA). During the autumn prior to N2L onset, positive SST and precipitation anomalies occurred in the TNA, and they induced anomalous easterlies in the equatorial western Pacific, which further triggered upwelling oceanic Kelvin waves, shallower equatorial thermocline and anomalous westward zonal currents, initiating a cooling at the equator through the zonal advective feedback. The onset of CE2L was caused by preceding anomalous easterlies in the equatorial eastern Pacific (EP), a direct response to the central Pacific heating associated with CP El Niño. The anomalous easterlies strengthened local surface latent heat flux and anomalous upwelling, leading to a cooling in EP. The SE2L onset was primarily attributed to a substantially shoaling of ocean thermocline associated with the discharge of the preceding super El Niño.

How to cite: Pan, X. and Li, T.: Diversity of La Niña Onset, EGU General Assembly 2025, Vienna, Austria, 27 Apr–2 May 2025, EGU25-14760, https://doi.org/10.5194/egusphere-egu25-14760, 2025.

EGU25-16024 | Posters on site | CL2.2

Influence of tropical Atlantic SST on the El Nino region 

Ping-Gin Chiu and Noel Keenlyside

The ENSO event is partially affected by tropical Atlantic El Nino, according to past studies. In this study, pacemaker experiments are conducted with NorESM in four configurations, totaling 20 members, in total during 1980-2020. The results show there is a correlation between tropical JJA ATL3 and the later DJF NINO3.4. This connection is strong before 2000, and disappears afterward. Which is consistant with observation. Zonal wind correlation indicated the path of this connection. 
    However, it was also found that the SST west of ATL3 has a stronger relationship to NINO3.4 in both periods. This implies that ATL3 is useful for detecting Atlantic ENSO, but the interaction is more robust in the closer region.

How to cite: Chiu, P.-G. and Keenlyside, N.: Influence of tropical Atlantic SST on the El Nino region, EGU General Assembly 2025, Vienna, Austria, 27 Apr–2 May 2025, EGU25-16024, https://doi.org/10.5194/egusphere-egu25-16024, 2025.

EGU25-16417 | Orals | CL2.2 | Highlight

How extreme El Niño teleconnections change in warmer climates 

Margot Beniche, Jérôme Vialard, and Matthieu Lengaigne

Recent studies have highlighted that extreme El Niño have distinct atmospheric winter teleconnections from those associated with other ENSO phases. While moderate El Niño and CP El Niño events display Pacific-North American (PNA)-like patterns opposite to La Niña teleconnections, only extreme El Niño events show a unique Tropical-Northern Hemisphere (TNH) pattern, driving warm anomalies over North America and increased rainfall in regions like California and Florida. However, despite projections of their increased frequency in warmer climates, future teleconnection changes for extreme El Niño remain under-explored. Using an extensive CMIP6 dataset spanning multiple Shared Socio-economic Pathways (SSPs) scenarios, models, and ensemble members, we perform a warming-level analysis of future changes in extreme El Niño winter teleconnections. Above +3°C warming, their specific TNH-like pattern weaken, and a signature similar to a negative North Atlantic Oscillation (NAO) pattern emerges. Wet anomalies over California and Florida weaken, dry anomalies over Northeast Brazil diminish, while dry anomalies over the Maritime Continent intensify during extreme El Niño. These changes appear to stem both from the eastward shift of tropical precipitation sources and changes in extratropical background circulation. Finally, we explore how changes in frequency of extreme El Niño and their associated teleconnection patterns drive changes in the broader ENSO teleconnection pattern.

How to cite: Beniche, M., Vialard, J., and Lengaigne, M.: How extreme El Niño teleconnections change in warmer climates, EGU General Assembly 2025, Vienna, Austria, 27 Apr–2 May 2025, EGU25-16417, https://doi.org/10.5194/egusphere-egu25-16417, 2025.

Climate-model mean-state biases such as the double-Intertropical Convergence Zone (ITCZ) bias and cold-tongue bias are long known, but a definitive solution to them has remained elusive due to the highly coupled nature of the climate system, and they remain a problem in the current generation of climate models (Tian & Dong 2020). Recently, as anthropogenically forced trends have more clearly emerged from the noise of internal variability, systematic biases in simulated trends compared to observations have also been demonstrated (e.g., Wills et al. 2022), notably in the tropical Pacific sea-surface temperature (SST) pattern and Walker circulation strength. This has raised interest in understanding the influence of mean-state biases on climate trends. Here we show that there are a handful of CMIP6 models with a much-reduced double-ITCZ bias in the East Pacific, a region that plays an important role in two-way teleconnections between the tropical Pacific and Southern Ocean (Dong et al. 2022). These low-ITCZ-bias models show tropical Pacific SST trend patterns that are more like observations, with bands of relatively little warming extending from the southeastern subtropical Pacific to the equator. Moreover, these models show much larger amplitude decadal SST variability throughout the Indo-Pacific, which is more in line with observations. We provide evidence that the more patterned forced SST trends and larger decadal SST variability both arise from a stronger propagation of southeast subtropical Pacific SST anomalies towards the equator when this propagation is not blocked by a double ITCZ. Our findings suggest that reducing the double-ITCZ bias in climate models has the potential to substantially improve climate projections.

Tian, B. & Dong, X. The double-ITCZ bias in CMIP3, CMIP5, and CMIP6 models based on annual mean precipitation. Geophysical Research Letters 47, e2020GL087232 (2020).

Wills, R. C., Dong, Y., Proistosecu, C., Armour, K. C. & Battisti, D. S. Systematic climate model biases in the large-scale patterns of recent sea-surface temperature and sea-level pressure change. Geophysical Research Letters 49, e2022GL100011 (2022).

Dong, Y., Armour, K. C., Battisti, D. S. & Blanchard-Wrigglesworth, E. Two-way teleconnections between the Southern Ocean and the tropical Pacific via a dynamic feedback. Journal of Climate 35, 6267–6282 (2022).

How to cite: Jnglin Wills, R. and DiNezio, P.: Climate models without an East Pacific Double ITCZ better simulate tropical Pacific climate variability and change, EGU General Assembly 2025, Vienna, Austria, 27 Apr–2 May 2025, EGU25-17292, https://doi.org/10.5194/egusphere-egu25-17292, 2025.

EGU25-18652 | ECS | Posters on site | CL2.2 | Highlight

Global Warming Enhances the impact of ENSO on Northern Hemisphere Tropospheric Ozone 

Semin Yun, Jiwon Jeong, and Byung-Kwon Moon

The El Niño-Southern Oscillation (ENSO) is a dominant mode of climate variability, influencing not only the global climate but also atmospheric chemistry. The impact of ENSO on tropospheric ozone has been investigated in previous research, yet its influence on tropospheric ozone in a warmer world remains unclear. Here, we investigate changes in the impact of ENSO on tropospheric ozone in the Northern Hemisphere using Coupled Model Intercomparison Project Phase 6 (CMIP6) data under the SSP3-7.0 scenario. The results of linear regression indicate that the response of ozone to ENSO strengthens, with coefficients increasing significantly from the near future to the distant future. This enhancement might be associated with changes in atmospheric circulation. This study suggests that ENSO should be considered when predicting changes in Northern Hemisphere tropospheric ozone under accelerating global warming.

※ This work was supported by the Korea Environment Industry & Technology Institute (KEITI) through the “Climate Change R&D Project for New Climate Regime” funded by the Korea Ministry of Environment (MOE) (2022003560001), and by the National Research Foundation of Korea (NRF) grant funded by the Korea government (MSIT) (No.2022R1A2C1008858).

How to cite: Yun, S., Jeong, J., and Moon, B.-K.: Global Warming Enhances the impact of ENSO on Northern Hemisphere Tropospheric Ozone, EGU General Assembly 2025, Vienna, Austria, 27 Apr–2 May 2025, EGU25-18652, https://doi.org/10.5194/egusphere-egu25-18652, 2025.

EGU25-19093 | Posters on site | CL2.2

ENSO Variability Changes in a Warming World 

Yann Planton, Jiwoo Lee, Andrew Wittenberg, Peter Gleckler, Éric Guilyardi, Shayne McGregor, and Michael McPhaden

Earth’s climate naturally fluctuates on timescales ranging from intraseasonal to centennial, even in the absence of changes in external forcings such as greenhouse gases or volcanic eruptions. The El Niño–Southern Oscillation (ENSO) exemplifies this internal (or unforced) variability within the climate system. Climate model simulations also exhibit this internal variability, as demonstrated by the diverse climate conditions observed in "initial-condition large ensembles" (LEs). These LEs enable to isolate the influence of internal variability and detect trends associated with climate change.

By examining the evolution of ENSO in LEs from the 6th Coupled Model Intercomparison Project (CMIP6), we find that ENSO variability has significantly increased during the historical period and is projected to continue increasing under future global warming in most models. This enhanced variability is often linked to changes in equatorial Pacific zonal or vertical temperature gradients. However, our analysis reveals complex, nonlinear relationships between ENSO characteristics and shifts in the mean climate state.

How to cite: Planton, Y., Lee, J., Wittenberg, A., Gleckler, P., Guilyardi, É., McGregor, S., and McPhaden, M.: ENSO Variability Changes in a Warming World, EGU General Assembly 2025, Vienna, Austria, 27 Apr–2 May 2025, EGU25-19093, https://doi.org/10.5194/egusphere-egu25-19093, 2025.

EGU25-19689 | ECS | Orals | CL2.2

The South American Monsoon as an Atlantic-Pacific Bridge: Causal Pathways to ENSO Diversity 

Fabio Bellacanzone and Simona Bordoni

Predicting ENSO diversity remains a fundamental challenge in seasonal-to-interannual climate forecasting, with Eastern (EP) and Central Pacific (CP) events arising from complex ocean-atmosphere interactions and remote forcing. This study highlights the significant role of the South American Monsoon System (SAMS) in modulating ENSO diversity.

Analysis of ERA5 reanalysis data (1940-2024) reveals distinct ENSO precursors during the monsoon onset phase in September-November (SON), five seasons before peak ENSO conditions. Enhanced SAMS precipitation, coupled with cold subtropical Southwestern Atlantic SST anomalies, precedes EP events. Conversely, an anomalous upper-level vortex over subtropical South America (VOSA) combined with positive sea-level pressure anomalies across the subequatorial and subtropical South Atlantic is more closely linked to CP events. These precursor patterns generate a stationary Rossby wave that initiates a cascade of processes in the South Eastern Tropical Pacific, including anomalous vertical motion, weaker trade winds, wind-evaporation-SST feedback, and Ekman coastal dynamics, culminating in ENSO development 12-15 months later.

To rigorously establish causation among these ENSO precursors and other known tropical Atlantic-Pacific basin interaction mechanisms, the Peter and Clark Momentary Conditional Independence (PCMCI+) algorithm was applied. The resulting causal networks largely validate the hypothesized physical mechanisms, also identifying key boreal spring mediators, such as SAMS precipitation, VOSA, and the South Pacific Oscillation. Sliding window analyses reveal a post-1980 intensification of the SAMS precipitation pathway, coinciding with shifts in the Atlantic-Pacific background state and satellite-based observational coverage. The PCMCI+ results challenge the causal significance of conventional precursors such as the Atlantic Niño and South Atlantic Subtropical Dipole, while emphasizing the atmospheric bridge connecting the subtropical South Atlantic and the tropical Pacific through monsoonal precipitation over South America.

Parallel analyses conducted on 20 historical-period simulations from the CESM2 Large Ensemble test these relationships under internal climate variability. Each member was subjected separately to the same method sequence applied to ERA5. While some members corroborate key findings—particularly the role of VOSA—the magnitude and exact timing of some causal links differ from reanalysis results. These discrepancies reflect both internal climate variability and model biases in representing tropical climate modes, including insufficient ENSO diversity, misrepresented teleconnections (e.g., an overemphasized role of the North Pacific Oscillation), and low SAMS variability.

These findings demonstrate that ENSO variability originates partly from cross‐basin processes initiated before the spring predictability barrier, highlighting the potential for enhanced early-season forecasts through incorporation of SAMS transition phase intensity. Despite remaining uncertainties regarding connection strength and multidecadal variability, this study establishes land-atmosphere interactions as significant contributors to pantropical climate interactions, warranting broader investigation of monsoon-ENSO pathways. Furthermore, it advocates for continued efforts to ensure that climate models accurately capture observed patterns and their underlying causal relationships.

How to cite: Bellacanzone, F. and Bordoni, S.: The South American Monsoon as an Atlantic-Pacific Bridge: Causal Pathways to ENSO Diversity, EGU General Assembly 2025, Vienna, Austria, 27 Apr–2 May 2025, EGU25-19689, https://doi.org/10.5194/egusphere-egu25-19689, 2025.

EGU25-21795 | Orals | CL2.2

Oceanic Role in the Teleconnection from Southern Ocean to Tropical Pacific 

Doseok Lee, Yechul Shin, Hanjun Kim, and Sarah Kang

Delayed warming of the Southern Ocean is one of the most robust features of CO2-driven climate response. This relative initial cooling in the Southern Ocean has recently been shown to have far-reaching impacts into the equatorial Pacific. The Southern Ocean-driven teleconnection mechanism has been examined in the atmospheric perspective, hence little is known about the role of ocean dynamics. In this study, we investigate the oceanic role in the teleconnection from the Southern Ocean to the tropical Pacific by applying a time-invariant zonally uniform surface heating between 40°S and 60°S, mimicking the effect of delayed warming of the Southern Ocean, using Community Earth System Model 1.2.2 (CESM1-CAM4). To better understand the oceanic role, we separate the contributions from buoyancy-driven and wind-driven ocean circulation by conducting two additional experiments in which the wind stress is prescribed to a repeating daily climatology, applied globally in one case and outside the tropical band between 10ºS and 10ºN in the other.
Consistent with previous studies, prescribed Southern Ocean warming leads to a weakening of the southern Hadley cell, inducing anomalous low pressure centered at 40°S and anomalous westerly wind from 20°S to 40°S. Anomalous westerly wind in the fully coupled experiment can cool the southwest Pacific by inducing northward Ekman transport, while both wind-stress prescribed cases do not experience anomalous Ekman transport and cooling effect. On the other hand, the southeast Pacific experiences more warming in the fully coupled experiment compared to other two cases, due to reduced coastal upwelling along the west coast of South America and weaker trade winds. In all experiments, reduced trade winds over the equator warm up the eastern Pacific, and smaller equatorial zonal temperature gradient induces weaker Walker circulation in fully coupled and tropical band coupled experiments, inducing further warming at the equatorial Pacific by reducing the Bjerknes feedback. However, even the global wind stress prescribed experiment experiences anomalous ocean heat release and warming, especially over the eastern equatorial Pacific, due to the shallow mean thermocline position and anomalously warmer thermocline. Ocean buoyancy change in the southern Pacific mid-latitudes can induce anomalous subtropical cell change in larger magnitude compared to the northern hemisphere, and this subtropical cell change interhemispheric asymmetry can induce heat convergence and warming of the equatorial thermocline.
These experiments reveal that a weakening of the equatorial upwelling motion is primarily driven by surface wind stress changes at low latitudes, while the equatorial sub-surface ocean heat convergence arises from the hemispherically asymmetric ocean subtropical cell changes driven by buoyancy changes. Not only the wind stress changes coupled to the southward ITCZ shift but also the buoyancy reduction in the southern Pacific mid-latitudes can contribute to the change in ocean circulation, contributing to the extratropics to tropics teleconnection effect. In conclusion, this research parsed out the importance of the buoyancy driven ocean circulation change for the extra-tropics to tropics teleconnection mechanism in the southern hemisphere.

How to cite: Lee, D., Shin, Y., Kim, H., and Kang, S.: Oceanic Role in the Teleconnection from Southern Ocean to Tropical Pacific, EGU General Assembly 2025, Vienna, Austria, 27 Apr–2 May 2025, EGU25-21795, https://doi.org/10.5194/egusphere-egu25-21795, 2025.

With approximately fifty percent of the world's population currently living in towns, urbanisation seems to be the distinct consequence across nations. The most prominent effects of Urbanization are the land use and land cover change from a natural landscape into a built-up landscape. Vegetation and open land are generally replaced with increasing impervious surfaces, which increases the Land Surface Temperature (LST), especially in dense urban areas like Varanasi.

Land surface temperature is an important parameter in understanding the Urban Heat Island (UHI) effect, which is the occurrence of warmer temperatures in urban areas compared to neighbouring suburban and rural areas. LST provides information on the physical features, such as climate and soil surface, as well as modifications in land use and human activities that impact the climate. While the presence of water-permeable surfaces and a surplus of vegetation lowers the level of land surface temperature (LST), human-induced heat discharges brought on by energy consumption and the expansion of land surface coverage by materials with high heat conductivity and capacities are the primary root causes of an increase in LST. Warmer temperatures produce greater transpiration and the reduction in soil moisture. It is therefore crucial for micro-climatic change studies to monitor and understand the spatial distribution of LSTs for comprehending LST landscape patterns across the globe.

The major components of studies in LST include Land cover, the Normalized Difference Vegetation Index (NDVI) and the Normalized Difference Built-up index (NDBI). The correlation between the impacts of changes in vegetation and built-up on LST has been examined in this study by applying GIS statistical techniques on LANDSAT satellite data on a spatio-temporal scale. The study reveals that LST exhibits a positive correlation with built-up but a negative correlation with vegetation, and this relationship varies with variations in the nature of built-up and vegetation in the study area.

Keywords: Urbansiation, Land Surface Temperature (LST), Urban Heat Island (UHI), NDVI, NDBI, LULC, Climate, Micro-climate.

How to cite: Rawat, R.: Investigating the impact of vegetation and built-up as determinants of land surface temperature change in the Varanasi Metropolitan Area of India, EGU General Assembly 2025, Vienna, Austria, 27 Apr–2 May 2025, EGU25-558, https://doi.org/10.5194/egusphere-egu25-558, 2025.

EGU25-850 | ECS | Posters on site | CL2.3

Assessing Urban Tree Responses to Climate and Pollution: Implications for Environmental Monitoring and Management 

Lucia Mondanelli, Paolo Cherubini, Fabio Salbitano, Matthias Saurer, Lukas Wacker, and Claudia Cocozza

In the context of climate change, trees are increasingly used as tools to create healthier and more comfortable urban environments. However, the extent of their impact on urban settings is intricately tied to their physiological health, growth, and vitality. This study evaluates urban trees' physiological response to the urban climate's primary stressors, high temperatures, low precipitations, traffic emissions and environmental pollutants. We investigated tree growth and δ13C, δ18O, δ15N, radiocarbon (F14C) levels and heavy metals in tree rings by comparing periurban parks, urban parks, busy streets, and airport zones in two Italian cities, Firenze and Pisa with a focus on Pinus pinea.

Our preliminary findings indicate that climatic conditions did not directly affect tree growth in urban parks. However, high temperatures and reduced precipitations influenced tree physiology more than pollution. In detail, carbon (δ13C) and oxygen (δ18O) stable isotopes revealed sensitivity to high temperatures and drought in urban parks, whereas the indicators of pollution investigated in this study (δ15N and F14C) did not exhibit pronounced differences between urban and periurban parks.

The general hypothesis is that the other urban sites (busy streets and airport zones), characterized by environmental constraints such as water deficit and high temperatures, show a higher δ13C and a lower δ18O than the periurban area. Regarding the characterization of the 15N and 14C and environmental pollutant concentrations in the tree rings, we assume they are more evident in the urban neighbours than in periurban contexts.

These findings underscore the importance of selecting tree species adapted to urban conditions to maximise the ecosystem services provided by trees. In addition, it is essential to study the effects of the urban environment on plant growth and physiology, as the urban environment—characterized by higher temperatures and lower precipitations—represents a model of future climate conditions. This setting provides an opportunity to investigate tree responses to climate change, offering insights that may inform urban forestry and resilience strategies. Ultimately, our data demonstrate the utility of tree rings as an effective tool for assessing air and environmental quality in urban compared to periurban sites. 

How to cite: Mondanelli, L., Cherubini, P., Salbitano, F., Saurer, M., Wacker, L., and Cocozza, C.: Assessing Urban Tree Responses to Climate and Pollution: Implications for Environmental Monitoring and Management, EGU General Assembly 2025, Vienna, Austria, 27 Apr–2 May 2025, EGU25-850, https://doi.org/10.5194/egusphere-egu25-850, 2025.

Urban areas modify natural land surfaces through the artificialization and sealing of surfaces, which has an impact on their exchanges of energy, water and momentum with the atmosphere. These modifications create specific meteorological conditions in cities, generally referred to as “urban climate”. The most notable – and most studied – climate effect of urbanisation is the increase in nighttime near surface air temperature, known as the Urban Heat Island (UHI).

Future climate change projections are most often derived from Global Climate Models (GCMs), which are downscaled to the regional scale using statistical tools, or by limited-area regional climate models (RCMs). Because of their horizontal resolution, which often remains too coarse, RCMs cannot represent most urban areas adequately and, as a result, little is known about projected changes in UHIs in the future. A few studies have examined the projected evolution of UHIs in the context of climate change using different approaches ranging from GCMs and RCMs to high-resolution land surface models, but with little agreement between studies and great sensitivity to the city analyzed, its climate and, more particularly, the downscaling approach used.

The latest generation of RCMs, known as Convection Permitting Regional Climate Models (CPMs), now reach horizontal resolutions of the order of a few kilometers, and can be coupled with various urban parameterizations to improve the representation of the urban climate in climate change projections.

Here we use transient (i.e. GCM-driven) climate simulations from the EURO-CORDEX initiative (12.5 km RCM) and the CORDEX Flagship Pilot Study on Convection (3 km CPM). We study the future UHIs of several European cities at the end of the century (2090-2099) under a scenario of very high greenhouse gas emissions (RCP8.5) and in which the cities are fixed in their historical states.

In particular, our analysis focuses on:

  • The concordance between the previous generation of climate projections from RCMs and the most recent one using CPMs
  • The potential differences due to the multiple urban parameterizations used between RCMs and CPMs, and within the CPM ensemble

  • The expected changes in UHIs under projected regional climate conditions at the end of the 21st century, and their potential effects on certain impact indicators

  • The possibility of highlighting the physical drivers of potential future UHI changes

Acknowledgment: This work was conducted in the CIRCE project (City-oriented Impacts of Regional Climate for Europe) funded by the European Commission under the Marie Skłodowska-Curie Actions (MSCA) (Grant agreement ID: 101067769).

How to cite: Le Roy, B. and Rechid, D.: Investigating the future urban climates of European cities using an ensemble of convection permitting regional climate models, EGU General Assembly 2025, Vienna, Austria, 27 Apr–2 May 2025, EGU25-1307, https://doi.org/10.5194/egusphere-egu25-1307, 2025.

This study presents a comparison of two leading urban climate models - the Single Layer Urban Canopy Model (SLUCM) and ENVI-met - across six Local Climate Zones (LCZs) in Hong Kong. While previous validations have focused primarily on individual LCZ types, this research evaluates model performance across diverse urban morphologies, incorporating seasonal variations and vegetation effects. The study analyzed model performance using high-resolution pedestrian-level observational data.

Both models demonstrated comparable accuracy in simulating air temperature (Ta) and relative humidity (RH), with SLUCM showing slightly superior performance. The largest Ta prediction errors were observed in the most and least dense LCZ types, while the presence of vegetation increased RH prediction errors. The impact of SLUCM's Building Energy Model (BEM) had a significant impact on summer simulations, particularly affecting waste heat predictions and thermal comfort calculations.

Seasonal analysis revealed an average Ta decrease of 11.94°C and RH reduction of 7.94% between summer and winter conditions across sites. All studied locations exhibited strong heat stress according to both Universal Thermal Climate Index (UTCI) and Physiological Equivalent Temperature (PET) metrics during summer months, with the compact high-rise zone (LCZ 1) showing the highest thermal stress levels. This suggests the need for city-wide heat mitigation strategies rather than targeted localized interventions.

The research highlights how methodological choices in urban climate modeling influence the interpretation of results. While ENVI-met's computational fluid dynamics (CFD) approach produced warmer, more homogeneous conditions due to resolved flow fields, SLUCM's surface energy balance method resulted in cooler, more stratified conditions owing to its simplified treatment of turbulent mixing. The study recommends incorporating HVAC calculations into ENVI-met simulations and using both PET and UTCI indices for a more balanced assessment of thermal comfort conditions.

These findings contribute to our understanding of urban microclimate modeling capabilities and limitations, providing valuable insights for researchers and urban planners in subtropical climates. The research emphasizes the importance of considering model selection, seasonal variations, and multiple thermal comfort indices in urban climate analysis and design decision-making.

How to cite: Lieber, J. and Yang, J.: Assessing Urban Microclimate Modelling Variability: A Comparative Analysis Of ENVI-met And SLUCM Across Multiple LCZs In Hong Kong, EGU General Assembly 2025, Vienna, Austria, 27 Apr–2 May 2025, EGU25-2363, https://doi.org/10.5194/egusphere-egu25-2363, 2025.

In areas with a long summer season, especially where heat stress prevails throughout the day, such as Mediterranean coastal cities, Urban Heat Island (UHI) causes further thermal discomfort and an increase in energy consumption for air conditioning. The intense warming of the area, which is greater at night compared to the day, significantly enhances energy consumption from air conditioning during these hours. Previous studies have indicated a pronounced UHI in stable winter nights, whereas most studies on the UHI in the warm season have focused on individual case studies rather than examining hot days and the warm season.

The study identifies the summer UHI characteristics of Tel Aviv under different weather conditions and develops a statistical downscaling model that predicts the UHI intensity, based on synoptic- and meso-scale variables. It focuses on extreme summer nights, exhibiting elevated temperatures and heat stress. Meteorological data was collected over five summer seasons (2020-2024). Detailed (10-minute) urban and rural meteorological measurements for the mid summer months (July and August), including temperature, relative humidity and wind velocity, together with radiosonde data from a nearby rural station.

We show that the Tel Aviv nocturnal UHI is quite variable during summer days, depending on meso-scale variations under the semi-permanent synoptic seasonal conditions. During daylight hours, the UHI is weak (under 2°C) and occasionally negative, i.e., temperatures at the urban stations are lower than at the rural location. The nighttime UHI ranges from negligible (below 1°C) to extreme (9°C), and is typically between 4-7°C.

Our study shows that the intensity of the UHI is significantly dependent on the westerly wind component (the sea breeze, enhanced by the synoptic-scale Etesian winds), the height of the persistent seasonal marine inversion and the existence and intensity of a surface inversion, observed near the city. A prediction equation for the UHI, based on these predictors, yields 0.85 correlation with the observed values. A surprising finding is an inverse relationship between the nocturnal temperature and the UHI intensity.

To investigate the finding mentioned above, several cases of excessive nocturnal heat events, with minimum temperatures exceeding 26°C, with high humidity were examined. In some of them the nocturnal UHI disappeared or remained very weak (0-2⁰C), whereas during others it was distinct and occasionally extreme (5-9⁰C). We found that extreme hot nights with minimal UHI are often characterized by the absence of the night land breeze and increased nocturnal westerly winds from the warm Mediterranean Sea. These events are characterized by a relatively high base of the marine inversion accompanied by clouds. Conversely, clearer nights with light land breeze and a pronounced surface inversion, or a low marine inversion base, result in a distinct and strong UHI.

How to cite: Zohar, M., Ziv, B., and Saaroni, H.: Contrasting meteorological factors affecting the summer urban heat island - the case of the Mediterranean coastal city of Tel Aviv, Israel, EGU General Assembly 2025, Vienna, Austria, 27 Apr–2 May 2025, EGU25-2902, https://doi.org/10.5194/egusphere-egu25-2902, 2025.

EGU25-3053 | ECS | Orals | CL2.3

Objectifying Urban Climate Mapping: A Scalable Approach to Enhancing Climate-Resilient Spatial Planning 

Martin Schneider, Susanne Formanek, Andrea Hochebner, Stefanie Pfattner, Florian Reinwald, Sophie Thiel, Tanja Tötzer, and Jana Wentz

Cities and municipalities are particularly affected by climate change and its impacts. Considering climate mainstreaming, the planning sector is called upon to provide appropriate adaptation services. Many German and Austrian cities have already prepared urban climatic maps (UCM) and are partially integrating them in their spatial planning policies. These UCM usually contain two components: an urban climatic analysis map (UC-AnMap) and an urban climatic planning recommendation map (UC-ReMap). In German speaking countries the compilation is often based on the VDI (Association of German Engineers) directive 3787 (Climate and Pollution Maps for Cities and Regions), which provides a conceptual guideline, but is open to design and interpretation and leaves the actual implementation to engineering firms and consulting agencies.

The research project “OSCAR - Objectifying and Standardizing Urban Climate Analyses for Climate-Resilient Urban Planning” (funded by the Climate and Energy Fund and carried out under the program "Austrian Climate Research Programme (ACRP)") identified three major shortcomings in the development process of UCM: (1) Lack of standards and comparability, (2) high development costs, as the methods and recommendations must be developed and elaborated individually in each case, and (3) insufficient trust in provided data and maps for planning decisions due to poor documentation or missing understanding to applied methodologies and results.

OSCAR aims to provide solutions to close identified gaps by preparing the basis for a good practice and objectification opportunities. A comprehensive literature review and stakeholder-engagement process based on expert interviews and workshops with urban climate modeling experts, consulting agencies and city representatives provides the theoretical and practical groundwork for the research and methodological advancements. Within the project, one central objective is the development of an objectified and reproducible model for UC-AnMaps, based on the VDI directive to (i) accelerate the assessment of urban climate conditions, (ii) provide a basis and method to make climate adaptation measures numerically and rapidly tangible on a city scale level, (iii) enable comparability of urban climate conditions of a city over time and (iv) provide secured planning recommendations through reproducible and well documented methods. Aligning with the recently update draft of the “Climate and Planning” guideline (VDI 11/2024) to develop UC-AnMaps, a reproducible calculation method for spatial designation of climatopes (areas of similar climatic characteristics), and partial integration of specific climate phenomena is under ongoing development. To use the developed method without data constraints, publicly available data and open-source software is a prerequisite.

The envisioned approach is based on weighting of static input data (e.g. imperviousness density), a rudimentary cold air flow algorithm, logical combinations of spatial data sources, and presupposing factors (e.g. area sizes) to define climatopes. In-depth documentation, strengths and limitations of the suggested method, along with a conceptual model and case studies provide promising results for scaling and accelerating the development of UC-AnMaps. Regarding derived planning recommendations, findings of the stakeholder-engagement formats suggest, that a close exchange with urban stakeholders for developing the UC-ReMaps is crucial and shall not be replaced by a reproducible and quantified information provision about urban climate conditions.

How to cite: Schneider, M., Formanek, S., Hochebner, A., Pfattner, S., Reinwald, F., Thiel, S., Tötzer, T., and Wentz, J.: Objectifying Urban Climate Mapping: A Scalable Approach to Enhancing Climate-Resilient Spatial Planning, EGU General Assembly 2025, Vienna, Austria, 27 Apr–2 May 2025, EGU25-3053, https://doi.org/10.5194/egusphere-egu25-3053, 2025.

EGU25-3156 | ECS | Posters on site | CL2.3

Past, present and future (urban) climates of Bern, Switzerland 

Moritz Burger, Anna Senoner, and Stefan Brönnimann

In the city of Bern, Switzerland, two urban measurement campaigns were operated by the University of Bern in the periods 1972 to 1974 and 2018 to 2024. In the first campaign, air temperature was measured at six locations with a resolution of two hours, in the second campaign at 55 locations with a resolution of 10 minutes. The summer (June to August) air temperature data of both measurement campaigns was homogenized and corrected for three variables: daily minimum temperature (Tmin), daily mean temperature (Tmean), and daily maximum temperature (Tmax). The data from the second measurement campaign was subsequently used to simulate urban temperatures in Bern during the currently used reference period (1991 to 2020) and for three global warming scenarios (Global warming level (GWL) 1.5 °C, 2.0 °C and 3.0 °C). To do so, a two-step quantile mapping approach (which includes a transfer function from rural to urban stations) was applied, since the original urban dataset is too short for a direct quantile mapping. Finally, a dataset of three temperature variables for six to 55 locations in and around the city of Bern during six different periods was created.

In this poster, we illustrate the calculation of this dataset and highlight the results regarding calculated heat indices (tropical nights and official heat warning levels). We show that the heat warning thresholds, which were never hit in the first measurement campaign, are reached at almost all locations in the second campaign. We furthermore discuss the differences between the GWL scenarios and the importance of the urban heat island effect during past, present and future (urban) climates of Bern.

How to cite: Burger, M., Senoner, A., and Brönnimann, S.: Past, present and future (urban) climates of Bern, Switzerland, EGU General Assembly 2025, Vienna, Austria, 27 Apr–2 May 2025, EGU25-3156, https://doi.org/10.5194/egusphere-egu25-3156, 2025.

In a warming climate, heatwaves are becoming more intense and more frequent.  Their effects have already proven to be one of the highest contributors to climate hazard related mortality. Additionally, due to the urban heat island (UHI) effect, heat is intensified in the most densely populated areas and since urbanization is expected to continue increasing, more and more people are facing enhanced risks.

In this project, we investigate the severity of hot spells in cities with the help of health-relevant heat indices, namely wet bulb temperature, the universal thermal climate index (UTCI) and the amount of tropical nights, among others. We process reanalysis data from ERA5-Land from 1950 onwards and simulation data from the downscaled EURO-CORDEX simulations for various climate scenarios until 2100 to generate these indicators for Europe at a resolution of 0.1°. After this step, we plan to train a shallow machine learning model (XGBoost) to downscale reanalysis and simulation data to the city level at a resolution of 100m for selected European cities. For model validation, temperature series from 12 European cities’ urban measurement networks will be used. Finally, the indicators will be applied to four pilot cities (Oslo, Bern, Lyon and Naples), as part of the EU project healthRiskADAPT under the framework of Horizon Europe. In a subsequent phase, advanced modeling techniques such as Weather Research and Forecasting (WRF) models or computational fluid dynamics (CFD) may be applied to better understand the compound effects of heat and pollution in cities.

How to cite: Pierce, C.: Health-relevant Heat Indices for Urban Areas: A Machine Learning Approach with Downscaled Climate Data and City Measurement Networks, EGU General Assembly 2025, Vienna, Austria, 27 Apr–2 May 2025, EGU25-3184, https://doi.org/10.5194/egusphere-egu25-3184, 2025.

EGU25-3539 | Posters on site | CL2.3

Overcoming challenges in urban hydro-meteorological simulation: Where is our first step? 

Xuan Chen, Job Augustijn van der Werf, Arjan Droste, Miriam Coenders-Gerrits, and Remko Uijlenhoet

Urban areas, with their dense populations and numerous socio-economic activities, are increasingly vulnerable to floods, droughts, and heat stress due to land use changes and climate change. Traditionally, the urban thermal environment and water resources management have been studied separately using urban land surface models (ULSMs) and urban hydrological models (UHMs). However, as our understanding deepens and the urgency to address future climate disasters grows, it becomes evident that hydroclimatological disasters—such as floods, droughts, severe urban thermal environments, and more frequent heat waves—are not isolated events but compound events. This highlights the close interaction between the water cycle and the energy balance. Consequently, the existing separation between ULSMs and UHMs creates significant obstacles in better understanding urban hydrological and meteorological processes, which is crucial for addressing the high risks posed by climate change. Defining the future direction of process-based models for hydro-meteorological predictions and assessments is essential for better managing climate disasters and evaluating response measures in densely populated urban areas. Our review focuses on three critical aspects of urban hydro-meteorological simulation: similarities, differences, and gaps among different models; existing gaps in physical process implementations; and efforts, challenges, and potential for model coupling and integration. We find that ULSMs inadequately represent water surfaces and hydraulic systems, while UHMs lack explicit surface energy balance solutions and detailed building representations. Coupled models show potential for simulating urban hydro-meteorological environments but face challenges at regional and neighborhood scales. Our review highlights the need for interdisciplinary communication between the urban climatology and urban water management communities to enhance urban hydro-meteorological simulation models.

How to cite: Chen, X., van der Werf, J. A., Droste, A., Coenders-Gerrits, M., and Uijlenhoet, R.: Overcoming challenges in urban hydro-meteorological simulation: Where is our first step?, EGU General Assembly 2025, Vienna, Austria, 27 Apr–2 May 2025, EGU25-3539, https://doi.org/10.5194/egusphere-egu25-3539, 2025.

Since September 2022, South Korea has mandated climate change impact assessments (CCIA) for urban development projects exceeding 1 million square meters. To achieve its 2050 carbon neutrality goal, the government encourages these projects to establish concrete greenhouse gas (GHG) reduction measures through CCIA. This study examines the evaluation and reduction strategies for GHG emissions in urban development projects using case analyses and reviews of the latest technologies, proposing effective approaches to enhance their feasibility. First, minimizing GHG emissions during the urban development planning stage is crucial. This involves strategic land use planning, such as securing green spaces and optimizing park locations. Second, promoting energy-efficient building designs and the use of renewable energy technologies, such as solar power and geothermal systems, is essential. This applies not only to public buildings but also to residential and commercial structures. Third, establishing a systematic framework to monitor and verify the implementation of GHG reduction measures proposed during CCIA is necessary. This study contributes to the development of effective GHG reduction strategies for large-scale urban projects and provides actionable frameworks to strengthen climate change mitigation efforts during urban development processes.

How to cite: Kim, Y., Cho, H., Cho, Y., and Heo, N.: Implementation Strategies for Greenhouse Gas Reduction in Urban Development Projects through Climate Change Impact Assessment, EGU General Assembly 2025, Vienna, Austria, 27 Apr–2 May 2025, EGU25-4031, https://doi.org/10.5194/egusphere-egu25-4031, 2025.

The increasing frequency of extreme heat events due to climate change calls for a deeper understanding of the factors contributing to heat stress-related morbidity and mortality. Urban areas, with their high population densities, are especially vulnerable due to the urban heat island (UHI) effect, which intensifies temperatures compared to rural surroundings. Traditional heat stress assessments often focus solely on air temperature (Ta), overlooking other factors such as humidity, wind speed, and solar radiation important for the thermal comfort. Spatial data on heat stress is often lacking at fine spatial resolutions, making the use of LST a common. However the relationship between Ta, LST and thermal comfort metrics such as Universal Thermal Climate Index (UTCI) or Humidex are not yet well understood.  
To address this gap, we conducted a spatio-temporal assessment of thermal comfort metrics, LST and Ta across Hesse, Germany, using 1 km scale data. By examining temperature anomalies (ΔT), the difference between local and comparable rural background temperatures, we quantify the urban impact on heat stress while minimizing broader climatic influences. Diurnal and spatial patterns of temperature variations and thermal conditions are examined across different land use types and urban forms. Satellite-derived parameters were also incorporated to assess regional heat risk in areas lacking local measurement data.  
Our findings reveal a stronger UHI effect in ΔHumidex (max. 4.3°C) compared to ΔTa (max. 2.9°C) and ΔLST (max. 3.4°C), indicating that reliance on LST or Ta alone might underestimates the full extent of heat stress of the urban population. This is particularly significant as nearly one-third of the population in Hesse (30.4% for Ta, 25.6% for Humidex, and 34.7% for LST) lives in areas where temperatures exceed baseline levels both during the day and at night. The duration of temperature exceedance is consistently longer in urban areas, with average values of 3.8 hours and 2.8 hours of the diurnal cycle for ΔHumidex and ΔTa, respectively, compared to 0.7 hours and 0.4 hours in rural areas. Densely built areas, where nighttime cooling deficits persist longer, are particularly vulnerable, while inhabitants of open urban areas experience more moderate heat stress. These results emphasize the need to incorporate thermal comfort metrics that account for multiple parameters when evaluating the UHI effect. Although LST is commonly used as a substitute in UHI studies, its correlation with Ta and Humidex varies both spatially and temporally, warranting cautious application.

How to cite: Krikau, S. and Benz, S.: Spatial-temporal insights into heat stress metrics for regional heat hazard and comfort assessment  , EGU General Assembly 2025, Vienna, Austria, 27 Apr–2 May 2025, EGU25-4411, https://doi.org/10.5194/egusphere-egu25-4411, 2025.

EGU25-4515 | Posters on site | CL2.3

City network of Berlin under the aspect of temperature measurements in different Local Climate zone's 

Ines langer, Henning Rust, and Uwe Ulbrich

In the city of Berlin, the Institute for Meteorology (Freie Universiät Berlin) operates a citywide meteorological network for measurements of temperature and other meteorological variables. 

During the project Urban climate under Chance (BMBF funded), additional stations were installed in the city, shortly after the project start in 2016, even to evaluate the urban model PALM-4U (Maronga et al. 2020). The model evaluation shows that there are uncertainties in the daily fluctuations: The model is too cold at midday, while it is too warm at night. The city stations measure 2m-temperature and humidity and are still in operation.  The locations of the stations were chosen such that various local climate zones (LCZ, Steward & Oke 2012) of Berlin were covered. Eight LCZs exist in the city, these are the LCZs 2 (compact midrise), 4 (open highise), 6 (open lowrise), 8 (large lowrise), A (dense trees), B (scattered trees), D (low plants) and G (water). On average 3 Stations exist in each LCZ, except in LCZ 4, where there exists only one station, with an availability of 85% of measured data. 

With this network, we are now in a position to carry out an analysis of urban climate with a focus on these existing eight LCZs. 

The results between the different LCZs during the summer months show us the urban heat island effect, which is about 4 K (LCZ 2 minus LCZ A), as well as the different timing of the occurrence of maximum and minimum temperatures. This analysis could help both stakeholders and landscape planners to redesign districts in such a way that residents benefit from a better urban climate. All station data are available in the Refubium of the Freie Universität Berlin under the keywords MEVIS and FUMINET and can be downloaded.

Maronga, B. et al. (202): Overview of the PALM model system 6.0. Geosci. Model Dev., 13, 1335–1372, 2020
https://doi.org/10.5194/gmd-13-1335-2020

How to cite: langer, I., Rust, H., and Ulbrich, U.: City network of Berlin under the aspect of temperature measurements in different Local Climate zone's, EGU General Assembly 2025, Vienna, Austria, 27 Apr–2 May 2025, EGU25-4515, https://doi.org/10.5194/egusphere-egu25-4515, 2025.

EGU25-4539 | Posters on site | CL2.3

Mobile Microclimate Monitoring: Enhancing Climate Change Mitigation and Adaptation in Temperate Cities 

Stevan Savić, Ivana Bajšanski, Jelena Dunjić, Milica Vasić, and Dragan Milošević

Densely built urban areas often experience overheating, contributing to the urban heat island effect and increasing heat-related risks. These phenomena directly impact various aspects of city life, including public health, biodiversity, urbanization, traffic, and green spaces. They are also the focus of numerous scientific disciplines and local/regional institutions. Despite this attention, many questions remain regarding the causes, timing, and locations of heat-related risks within urban environments.

To address these questions and support interdisciplinary collaboration, detailed spatial and temporal meteorological data are essential. The creation and collection of micrometeorological measurements and datasets can enhance interdisciplinary research, facilitate comprehensive assessments, and inform climate change adaptation strategies.

The experience of the Novi Sad Urban Climate Lab (NSUCL) at the University of Novi Sad, Faculty of Sciences (Serbia), has shown that an interdisciplinary research approach yields valuable outcomes for mitigating heat-related and urbanization challenges. Collaborative research with architecture experts has revealed that strategically planting additional trees can effectively mitigate the urban heat island effect and improve outdoor thermal comfort (OTC) in densely built-up areas. For example, the placement of additional trees has been shown to reduce OTC values at specific manikin locations by up to 6.11°C (UTCI), highlighting the importance of carefully determining their locations to enhance thermal comfort during hot summer days.

These findings are based on micrometeorological monitoring conducted in the field during the summers of 2022 and 2023, utilizing Mobile Micrometeorological Carts (MMCs) developed by the NSUCL. The impact of additional trees on OTC conditions was assessed at three selected locations: Catholic Porta Square, Gymnasium Street (with a north-south orientation), and Laze Teleckog Street (with a southeast-northwest orientation). These locations represent densely built urban morphologies characterized as intensive pedestrian zones in downtown Novi Sad.

Acknowledgement: The research was supported by the project no. 003026234 2024 09418 003 000 000 001, funded by the Autonomous Province of Vojvodina (regional government).

How to cite: Savić, S., Bajšanski, I., Dunjić, J., Vasić, M., and Milošević, D.: Mobile Microclimate Monitoring: Enhancing Climate Change Mitigation and Adaptation in Temperate Cities, EGU General Assembly 2025, Vienna, Austria, 27 Apr–2 May 2025, EGU25-4539, https://doi.org/10.5194/egusphere-egu25-4539, 2025.

EGU25-4597 | Orals | CL2.3

Quantifying the City-Scale Benefits of Urban Vegetation and Green Infrastructure using Novel Land-Atmosphere Simulations  

Aaron Alexander, Daniel Wright, Carolyn Voter, and Steven Loheide

Urbanization substantially modifies surface water and energy cycles. Compared to natural vegetation, paved urban surfaces produce more runoff, trap more heat, and lower evapotranspiration. At the same time, increased heatwaves and rainfall due to climate change are amplified in urban areas due to feedbacks between cities and meteorological processes. Land surface models, the part of atmospheric models tasked with modeling the earth’s surface and hydrology, lack the fine-scale, ecohydrologic process representation in cities to capture important feedbacks between urbanization, hydrology, and near surface energy partitioning. For example, tree cover that shades pavement and enhances evapotranspiration is ubiquitous amongst many cities worldwide, but contemporary land surface models cannot allow for tree canopy to extend over pavements. Further, lateral transfers of surface water from impervious to permeable surfaces are critical for runoff reduction, like routing of rainfall to natural vegetation, but are similarly not represented. Lack of ecohydrologic processes is problematic because we are unable to predict the impact of increasingly common greening initiatives that feature both nature-based solutions, like increased tree cover, and green infrastructure practices, like permeable pavements and green roofs. These practices are targeted to reduce runoff and urban heat, but will likely modify other urban atmospheric processes like rainfall in unknown ways. Unfortunately, potential connections between urban greening initiatives and resulting changes to the urban climate have not been explored rigorously at city scale.


In this project, we use Noah-MP for Heterogenous Urban Environments (HUE), a new land surface model capable of resolving fine-scale ecohydrologic processes like urban tree cover shading pavements and routing of surface water to permeable surfaces with multiple landcover types per grid cell (e.g. a mosaicking scheme) in urban spaces. We use HUE to examine the impact of widespread climate adaptation policy in multi-year WRF regional climate simulations centered on the coastal city of Milwaukee, Wisconsin, USA at convective permitting scales. Different landcover configurations that represent cases of city-wide greening are interpreted from an ambitious real-world regional urban greening “master plan.” We show that more greening leads to a reduction of runoff throughout the warm season, although partitioning of runoff reduction between evapotranspiration and deep drainage varies year to year. We also examine how changes in sensible and latent heat fluxes affect near surface meteorology within the city, generally increasing humidity and decreasing air temperatures. These differences are especially apparent during days of strong lake-breeze coupling between Milwaukee and nearby Lake Michigan. We further show that urban greening leads changes in rainfall event totals, peak intensities, and seasonal averages. While only for a single city, our results highlight that widespread urban greening changes not only urban hydrology but also urban hydrometeorology. This highlights that the evaluation of urban greening initiatives worldwide is critical for climate change adaptation and mitigation.

How to cite: Alexander, A., Wright, D., Voter, C., and Loheide, S.: Quantifying the City-Scale Benefits of Urban Vegetation and Green Infrastructure using Novel Land-Atmosphere Simulations , EGU General Assembly 2025, Vienna, Austria, 27 Apr–2 May 2025, EGU25-4597, https://doi.org/10.5194/egusphere-egu25-4597, 2025.

EGU25-4872 | ECS | Posters on site | CL2.3

Assessing Urban Heat Island Effect and its Correlation with Topography and Surface Vegetation Characteristics in Mashhad City (NE Iran): Case Study on a Local Climate Change 

Keristineh Jananeh, Mohammad Samadi, Fereshteh Avatefi Akmaland, and Keyvan Mohammadzadeh Alajujeh

Development of cities and reduction of green spaces is one of the important and influential factors in the formation of heat islands, a phenomenon that has become one of the important problems in cities. The urban heat island (UHI) is a concept that refers to the increase in temperature in urban areas compared to rural areas or urban outskirts. This temperature increase is due to the abundance of buildings, roads, parking lots, and other human structures in cities, as well as the reduction of green spaces and water, and also the increase in human activities such as traffic and industries. This study conducts an analysis on the complex relationships between topography, surface biophysical properties, and the UHI effect in Mashhad city (NE Iran), serving as a local case study for understanding climate change impacts. For this purpose, land use was extracted from Sentinel 2A images using the object-oriented processing method of satellite images. In the next step, using the thermal bands of Landsat 9 images and the MODIS sensor, urban heat islands were calculated for the city of Mashhad during the day and night. Finally, the correlation between temperature distribution during the day and night with land use, topography, vegetation, etc. was calculated. According to the obtained results, the significant loss of vegetation within and around the city has contributed to notable changes in surface characteristics. The transition from a relatively cool temperature layer (25-29 °C) to an average temperature class (33-37 °C) indicates the impact of vegetation loss on local dynamics. Moreover, the manipulation of slopes around the city has led to temperature increase, resulting in the emergence of hot (41-44 °C) and very hot (45-47 °C) temperature classes. The redistribution of surface clusters, particularly in the northwest, south, and southwest of Mashhad, is linked to specific land use changes. Additionally, the temporal variability of surface temperatures was examined, revealing the highest temperatures in July and August and the lowest in Azar. The spatial range of surface temperature exhibited seasonal variations, with the highest range observed in April and spring and the lowest in October and autumn. Moreover, the observed changes in surface temperature patterns highlight the significant impact of anthropogenic land use modifications on local climate dynamics. The expansion of the urban heat island phenomenon in Mashhad is evident through the overall increase in surface temperature and the reduction in temperature differentials between urban areas and their surroundings. Overall, this research provides important insights into the complex interplay between topography, land use changes, and surface dynamics in Mashhad, emphasizing the critical role of land use changes in shaping local climate patterns. It underscores the need to consider environmental impacts, urban development decisions, and land use planning to address the challenges posed by the expanding UHI effect and promote sustainable and climate-conscious development.

Keywords: Urban Heat Island, Surface temperature, Land use changes, Topography, Mashhad, Environmental management, Urban planning, Spatial analysis.

How to cite: Jananeh, K., Samadi, M., Avatefi Akmaland, F., and Mohammadzadeh Alajujeh, K.: Assessing Urban Heat Island Effect and its Correlation with Topography and Surface Vegetation Characteristics in Mashhad City (NE Iran): Case Study on a Local Climate Change, EGU General Assembly 2025, Vienna, Austria, 27 Apr–2 May 2025, EGU25-4872, https://doi.org/10.5194/egusphere-egu25-4872, 2025.

Outdoor shade, as a vital environmental asset of heat stress reduction, has long been evading systematic treatment in theory and practice. Yet, to become an effective climatic tool to address urban heat, outdoor shade has to be systematically quantified, mapped, and managed. The spatial Shade Index (SI) we have developed in the past allows us to describe on a simple scale from 0 to 1 the extent to which the cumulative effect of solar radiation at ground level is blocked during a typical spring or summer day. By calculating an average SI for each street segment, open space, or any other spatial unit of interest in a city, it is possible to produce maps that present the shade hierarchy of the city’s main pedestrian spaces, allowing for a quick and easy comparison of their shading quality.


Recently, we have managed to develop a computationally efficient method for producing high-resolution urban shade maps in a relatively short time by processing digital surface models, tree canopy contour maps, and official spatial land use layers. With experience gained from generating shade maps for 15 cities, it is now possible to conclude that shade mapping can only be the first step in a more complex procedure of prioritising shading actions across a city. In each of the mapped cities, the high number of street segments or open spaces with poor shading conditions made it impossible to allocate enough municipal resources to bring each and every one of them to a reasonable level of spatial shading. A shade map and the SI it assigns to each spatial unit thus become only the starting point of evidence-based policy negotiations that bring to the table other climate-related considerations, including public health, social equity, promotion of public transport travel, and increasing the appeal of commercial streets.


The presentation will provide examples of the application of shade maps in real-life planning tasks in different cities, including as the basis for developing strategic urban forestry plans. It will also expand on the underlying differences and discrepancies in historical urban planning concepts and resource allocation preferences that shade maps expose, given that outdoor shade in its entirety is always, even inadvertently, the product of urban planning and design decisions.

How to cite: Aleksandrowicz, O.: Shade maps, theory and practice: the basis of efficient and effective heat adaptation actions in cities, EGU General Assembly 2025, Vienna, Austria, 27 Apr–2 May 2025, EGU25-5187, https://doi.org/10.5194/egusphere-egu25-5187, 2025.

Urban trees contribute to summer cooling by offering solar shading and evapotranspiration. But their relative significance is still unclear due to the challenges in directly measuring tree evapotranspiration rate or latent heat flux (QE) in actual urban environment. Concurrently, high-quality experimental data are still required for validation of urban canopy model simulations. For this purpose and as a novelty, this study directly measures tree evapotranspiration (or QE) and shading effects in street canyons (building height/street width, H/W=1 or 2, H=1.2m), using scaled outdoor experiment in subtropical region, i.e. suburban Guangzhou, China, from August to October 2022. Results show that urban trees (leaf area index: 3.5) can effectively deliver surface temperature reductions beneath tree canopies up to 5.1℃ as H/W=1 and 8.2℃ as H/W=2, while slightly raise air temperature by less than 2.0℃ above tree canopies. Energy flux comparison indicates tree shading as the primary cooling mechanism, with up to 97% of incoming solar radiation (800Wm-2) intercepted, while evapotranspiration, with a rate of less than 1.6g/min and a latent heat flux below 90Wm-2, plays a secondary role. Additionally, trees decrease street air velocity by up to 63.6%, and increase of water vapor pressure by up to 2.77hPa.

How to cite: Wu, Z., Shi, Y., Ren, L., and Hang, J.: Scaled outdoor experiments to assess impacts of tree evapotranspiration and shading on microclimates and energy fluxes in 2D street canyons , EGU General Assembly 2025, Vienna, Austria, 27 Apr–2 May 2025, EGU25-5456, https://doi.org/10.5194/egusphere-egu25-5456, 2025.

EGU25-5839 | ECS | Posters on site | CL2.3

Inequalities in exposure to summer urban heat extremes in Germany 

Philipp Keller and Susanne A. Benz

Temperature patterns in urban environments are shaped by the complex pattern of urban design. Accordingly, urban temperature extremes are not distributed homogenously over entire cities, but rather shaped by local land use. Resulting disparities in heat exposure can have severe consequences for the health and general well-being of individuals.

This study examines the relationship between urban heat and demographic patterns for each district in Germany. Population subgroups, such as foreigners and elderly residents, are analysed to determine whether certain groups are disproportionately affected by summertime urban heat. The analysis is conducted in a 1 km grid focusing on daytime and night-time separately. Demographic data is derived from the 2011 Population and Housing Census.

Instead of absolute temperatures, we focus on urban temperature anomalies, which are defined as temperature differences between urban pixels and their rural surroundings. This approach allows us to focus on the aspects of climate that are shaped by urban planning decisions, while disregarding large scale climate-patterns.

First results focusing on satellite derived LST reveal significant disparities. E.g., in over 66 % of German districts, foreign residents experience substantially higher heat exposure compared to nonforeigners. This analysis highlights the unequal distribution of urban heat stress within Germany and suggests avenues for further research. We now focus on disparities in air temperature and simple heat stress indices like the Humidex to provide insights into the perceived heat stress experienced by residents. Furthermore, the recent release of the 2022 Housing and Population Census offers more expanded demographic information for more detailed analysis.

How to cite: Keller, P. and Benz, S. A.: Inequalities in exposure to summer urban heat extremes in Germany, EGU General Assembly 2025, Vienna, Austria, 27 Apr–2 May 2025, EGU25-5839, https://doi.org/10.5194/egusphere-egu25-5839, 2025.

EGU25-6247 | ECS | Posters on site | CL2.3

Using the Urban Tethys-Chloris (UT&C) model to estimate the surface energy balance of different garden materials and configurations 

Megan Sherlock, Anne Verhoef, and Tijana Blanusa

Domestic gardens comprise up to 30% of urban area in the UK, providing many ecosystem services (ES), such as flood risk mitigation and temperature regulation, through vegetation present. Current estimates of ES provisioning using urban land surface models often focus on green space in an entire town/city, rather than specific greenspace types (Zawadzka et al., 2021), and often omit domestic gardens entirely, which may lead to unreliable recommendations. We chose the Urban Tethys-Chloris model (UT&C; Meili et al., 2020) to estimate ES delivery by domestic gardens because it considers both the energy and water balance, at the local scale, and allows for configuration and simulation of both vegetated and man-made surfaces. UT&C is a fully coupled energy and water balance model, that calculates 2m air temperature and skin temperatures of urban areas, accounting for biophysical and ecophysiological characteristics of ground vegetation and urban trees. Input meteorological data over the course of 2024 was obtained from the University of Reading Atmospheric Observatory (Reading, UK). Model garden plant species were specified as Lolium perenne (Perennial ryegrass; for ground vegetation) and Pyrus calleryana (Callery pear; for urban trees), and urban geometry values (such as house height and width) were specified as UK averages. We have found that UT&C realistically estimates seasonal and diurnal urban surface energy fluxes within a typical UK garden. Specifically, in summer, a garden made up of 100% vegetation (short lawn and 2 trees) had a peak surface temperature 13°C cooler, and a 2m air temperature 1°C cooler, than a garden made entirely of concrete. This is largely because vegetated ground loses heat through latent heat flux throughout the growing period, while impermeable surfaces can only do so after heavy rainfall (when water ponds on the surface). Gardens with 100% granite, concrete and slate surfaces had a surface temperature up to 6°C lower and a 2m air temperature 0.5°C lower than asphalt and wood decking as a result of their high thermal conductivity and heat capacity, suggesting these materials would be marginally better at maintaining a lower air temperature within an entirely impermeable garden, particularly in urban summers. Air and surface temperatures over semi-permeable materials, such as artificial turf and wood chips, were often higher than those found for impermeable surfaces, suggesting that they may not be an appropriate method of reducing air temperatures in gardens. Further work will focus on modelling the role of vegetation and garden surface choices on the surface water balance, and on translating the mechanistic model outputs into human comfort and flood mitigation indices. Additional models, such as SUEWS (Järvi et al., 2011), will also be used to estimate ES delivery, and to allow for model intercomparison. Following these simulations, we hope to provide recommendations to UK gardeners about the best hard landscaping materials, plant species, and garden configuration (e.g. proportion of trees versus lawn and bedding plants) to help reduce air temperatures and flooding within their neighbourhoods.

How to cite: Sherlock, M., Verhoef, A., and Blanusa, T.: Using the Urban Tethys-Chloris (UT&C) model to estimate the surface energy balance of different garden materials and configurations, EGU General Assembly 2025, Vienna, Austria, 27 Apr–2 May 2025, EGU25-6247, https://doi.org/10.5194/egusphere-egu25-6247, 2025.

EGU25-6286 | ECS | Posters on site | CL2.3

Towards sustainable cities: A human-centric approach to evaluating urban heat island intensity responses 

Zhiwei Yang, Jian Peng, Song Jiang, Xiaoyu Yu, Jianquan Dong, and Jonathan Corcoran

Urban heat island intensity (UHII) is a critical metric for assessing urban thermal environments, yet traditional approaches often lack a human-centric perspective, resulting in limited insights into human thermal stress and global variability in UHII responses to influencing factors. Addressing this gap is critical for mitigating UHII through factor regulation (regulating the scale of factors influencing UHII), thereby contributing to the development of sustainable and livable cities. In this study, we employ the Universal Thermal Climate Index (UTCI) to calculate UHII (UHII-UTCI) based on a human-centric delineation of urban and rural areas. We further evaluate UHII-UTCI responses to changes in influencing factors at a fine spatial scale. The differences in these responses are captured through three key elements: (1) dominant influencing factors, (2) response patterns—classified as monotonic increasing (Type-I), monotonic decreasing (Type-D), and downward parabola (Type-P)—and (3) regulation thresholds of the response patterns. Additionally, the spatial heterogeneity of these key elements is notable, with distinct clusters observed in eastern North America, East Asia, and Europe. These findings emphasize the urgency of adopting human-centric approach to address the growing threat of urban heat, and underscores the necessity of tailored, context-sensitive strategies to mitigate UHII in diverse global settings.

How to cite: Yang, Z., Peng, J., Jiang, S., Yu, X., Dong, J., and Corcoran, J.: Towards sustainable cities: A human-centric approach to evaluating urban heat island intensity responses, EGU General Assembly 2025, Vienna, Austria, 27 Apr–2 May 2025, EGU25-6286, https://doi.org/10.5194/egusphere-egu25-6286, 2025.

EGU25-6626 | ECS | Orals | CL2.3

How Critical Are Urban Canopy Parameters in a State-of-the-Art Coupled Bulk Urban Canopy Model? 

Kutay Dönmez, Lukas Emmenegger, and Dominik Brunner

In a warming world, accurately modeling urban climate is essential for sustainable urban planning. Bulk urban canopy models, such as TERRA_URB coupled to the icosahedral non-hydrostatic weather and climate model (ICON), rely on urban canopy parameters (UCPs) to capture the surface–atmosphere interaction in cities. Consequently, model performance strongly depends on the quality of these UCP inputs to realistically represent urban boundary layer processes - such as boundary layer height, wind drag, heat island effects, and greenhouse gas concentrations. UCPs can be prescribed uniformly across all urban grid cells or vary according to local climate zone (LCZ) classification or real-world datasets. While LCZ-based approaches provide a globally consistent categorization of urban environments, they may overlook the fine-scale heterogeneity within individual cities. In this study, we examine whether using high-resolution urban characteristics, derived from 3D building geometries, satellite data, and other local information, improves urban climate simulations in the state-of-the-art ICON TERRA_URB model compared to LCZ-based UCPs. Focusing on the Swiss cities of Zurich and Basel, we refine UCPs by incorporating local datasets that capture actual building heights, densities, and solar-thermal properties, then compare simulations from the summer of 2023 against observational data. Our results highlight that activating TERRA_URB significantly enhances model accuracy for nighttime temperatures in regions characterized by high artificial surface fractions (ASF). Among the tested configurations, employing realistic UCP data provides a slight advantage over uniform and LCZ-based alternatives. However, these benefits observed in temperature do not extend to wind speed, where no single scenario demonstrates a clear overall advantage. Moreover, neither LCZ-based TERRA_URB nor realistic TERRA_URB proves sufficient in less densely urbanized contexts (low ASF), suggesting that disabling TERRA_URB - or opting for simpler model approaches - may be more suitable where urban influences are small. 

How to cite: Dönmez, K., Emmenegger, L., and Brunner, D.: How Critical Are Urban Canopy Parameters in a State-of-the-Art Coupled Bulk Urban Canopy Model?, EGU General Assembly 2025, Vienna, Austria, 27 Apr–2 May 2025, EGU25-6626, https://doi.org/10.5194/egusphere-egu25-6626, 2025.

EGU25-6944 | Posters on site | CL2.3

Towards a statistical description of intra-urban climate variations 

Gabriele Manoli, Marc Duran Sala, and Martin Hendrick

Urban-induced changes in local microclimate, such as the urban heat island effect and air pollution, are known to vary with city size,  leading to power law or logarithmic relations between average climate variables and city-scale quantities (e.g., total population or area). However, these approaches suffer from biases related to the choice of city boundaries and they neglect intra-urban variations of city properties. In this study we use high-resolution data of urban temperatures and annual concentrations of particulate matter together with population density and street network properties and show that their marginal and joint probability distributions follow universal finite-size scaling functions. These results extend previous findings on city-scale relations, offering a novel description of intra-urban fluctuations of climate characteristics.

How to cite: Manoli, G., Duran Sala, M., and Hendrick, M.: Towards a statistical description of intra-urban climate variations, EGU General Assembly 2025, Vienna, Austria, 27 Apr–2 May 2025, EGU25-6944, https://doi.org/10.5194/egusphere-egu25-6944, 2025.

EGU25-7856 | Posters on site | CL2.3

Exploring Urban Heat Islands with a simple thermodynamic model 

Mijeong Jeon and Woosok Moon

The Urban Heat Island (UHI) effect, where urban areas experience higher temperatures than surrounding rural regions, presents a significant challenge in urban climatology due to global warming and rapid urbanization. This study investigated the fundamental mechanisms of UHI by combining theoretical modeling with observational data from South Korea, focusing on urban heat storage, anthropogenic heat, and climatic factors. Using a simple day-night model based on the Surface Energy Flux Balance (SEFB) framework, we demonstrated that UHI primarily results from two mechanisms: reduced diurnal temperature range (DTR) due to high heat capacity of urban materials, and increased mean temperature from additional energy fluxes like anthropogenic heat. These findings emphasize stronger UHI intensity during nighttime compared to daytime. Validation using observational data showed qualitative agreement between theoretical predictions and actual phenomena. Comparison between Seoul (urban) and Boeun (rural) revealed higher nighttime temperatures in Seoul despite its higher latitude, highlighting the role of urban heat storage. Analysis of metropolitan and new cities showed strengthening UHI effects with population growth, consistent with model predictions of decreased DTR and increased mean temperature. This research provides foundational data for understanding urbanization's impact on climate change and sustainable urban planning.

How to cite: Jeon, M. and Moon, W.: Exploring Urban Heat Islands with a simple thermodynamic model, EGU General Assembly 2025, Vienna, Austria, 27 Apr–2 May 2025, EGU25-7856, https://doi.org/10.5194/egusphere-egu25-7856, 2025.

EGU25-8012 | ECS | Orals | CL2.3

Urban dynamic and thermodynamic influences on short-duration heavy rainfall across different urban structures 

Herminia Torelló-Sentelles, Gabriele Villarini, Marika Koukoula, and Nadav Peleg

With over half of the world's population living in cities and urbanization expected to increase, understanding how urban environments affect heavy rainfall is crucial due to its implications for flood risk. Urban areas have been shown to intensify convective heavy rainfall; however, the extent of this effect varies across cities worldwide, and the specific influence of urban form on rainfall modification remains unclear. We use the Weather Research and Forecasting (WRF) model to simulate 11 convective events that cross the city of Indianapolis, Indiana. The land cover of Indianapolis is then replaced with that of eight other cities to assess how different urban forms affect rainfall. We find differences in rainfall intensity when comparing simulations with and without a city present, and these differences are related to the size and structure of the city, specifically the proportion of buildings arranged in an open configuration. Half of the simulated rainfall events intensified over the urban areas. In these cases, convection was enhanced due to low background wind speeds and a strong urban heat island effect. The latter half of the storms were suppressed over the cities, when background wind speeds were high, and the urban heat island effect was weak. Here, convection was inhibited due to reduced boundary layer moisture and strong deceleration effects at the surface caused by increased urban surface roughness. Given the expected growth of cities, our results point towards further enhancements in rainfall implying that future flood risk may increase in growing cities.

How to cite: Torelló-Sentelles, H., Villarini, G., Koukoula, M., and Peleg, N.: Urban dynamic and thermodynamic influences on short-duration heavy rainfall across different urban structures, EGU General Assembly 2025, Vienna, Austria, 27 Apr–2 May 2025, EGU25-8012, https://doi.org/10.5194/egusphere-egu25-8012, 2025.

As the intensity and duration of heat waves increase with climate change, the importance of the cooling effect of cold air drainages from surrounding elevated terrain on the urban heat island increases. In the urban boundary layer, air temperatures throughout the diel cycle are commonly higher than in rural areas due to modifications in the radiation and energy transfers which depend on the microscale urban surface structure. This well-known urban heat island phenomenon also applies to mid-sized (< 100 000 citizens) cities, but has received less attention. Spatial variability of nighttime air temperatures showed that flow obstacles including dams can impede the nocturnal cold air drainage in urban areas. During the daylight period, parks can form cool islands in the heated city body because of evapotranspirational cooling from leaf surfaces and interception of a significant fraction of the sunlight leading to lower surface air temperatures. The aim of this study was to quantify the impacts of flow obstacles on nocturnal cold air drainages and of heterogeneity in the urban surface structure including city parks on the daytime thermal variability in a mid-sized city (Bayreuth, Germany, about 75 000 inhabitants) in Southern Germany, Europe. Observations were collected using a city-wide meteorological microclimate station network and mobile fast-response air temperature measurements by bicycle during 6 cloud-free nights and days in August 2023. The results showed that an 8 to 10 m high dam blocked the cold air drainage originating from surrounding topography elevated by about 150 m approaching the obstacle at an average wind gust speed of 0.9 m s-1 and depth of several meters. The blocking resulted in the formation of a cold air pool on the upwind side and a distinct microclimatic difference on both sides. While the direct cold-air drainage was blocked, some cold-air drainage was able to circumflow the dam mostly alleviating the air temperature difference between both sides. On average, the nocturnal cold air drainages reduce the ground-level air temperatures on the urban surrounding of a medium-sized city on average by 1.5 K, while instantaneous cooling effects were quantified up to 3.2 K. Additionally, areas with a high proportion of vegetation had a cooling effect on the surroundings in the afternoon, but also at night, as less energy was stored in the ground. The research highlights the importance of considering cold air flow drainage paths in urban planning. The reconstruction of barriers can contribute to the reduction of urban heat island at night.

How to cite: Schappacher, O. and Thomas, C. K.: Quantifying the effects of microscale heterogeneity in urban surface structure on the urban heat and park cool islands in a mid-sized city in Central Europe, EGU General Assembly 2025, Vienna, Austria, 27 Apr–2 May 2025, EGU25-8686, https://doi.org/10.5194/egusphere-egu25-8686, 2025.

EGU25-8844 | ECS | Orals | CL2.3

Exploring Thermal Regimes in Urban Heating using DUCT City-scale Modeling 

Jerin Benny Chalakkal, Minn Lin Wong, Ander Zozaya, and Kristina Orehounig

This study examines the heat and stability patterns of the urban boundary layer in cities. It emphasises the impact of urbanisation and anthropogenic activities on atmospheric characteristics and provides insights into stability implications for the urban environment. Using a high-resolution, sub-kilometre scale city-wide numerical modelling framework, part of the Digital Urban Climate Twin (DUCT), examines the variability of thermal regimes within the boundary layer. The findings reveal distinct thermal regimes influenced by diurnal local circulations, urban heat island effects, and moisture availability. During the daytime, convective turbulence dominates due to strong surface heating, while at night, stable stratification may develop, but local heating sources (e.g., anthropogenic heat) disrupt stability. The study highlights that stability profiles are crucial in determining outdoor comfort and air ventilation under the influence of the transilient nature of wind and thermo-moisture fields at a city scale. These findings are essential for urban climate adaptation strategies and for improving local weather forecasting. 

How to cite: Benny Chalakkal, J., Wong, M. L., Zozaya, A., and Orehounig, K.: Exploring Thermal Regimes in Urban Heating using DUCT City-scale Modeling, EGU General Assembly 2025, Vienna, Austria, 27 Apr–2 May 2025, EGU25-8844, https://doi.org/10.5194/egusphere-egu25-8844, 2025.

EGU25-9245 | ECS | Posters on site | CL2.3

Investigating the Urban Thermal Environment of a Climate Change Hotspot through High-Resolution Modelling: Case Study for Nicosia, Cyprus 

Konstantina Koutroumanou-Kontosi, Constantinos Cartalis, Panos Hadjinicolaou, Katiana Constantinidou, and Ilias Agathangelidis

The Eastern Mediterranean and Middle East (EMME) region is a recognized as a climate change hotspot, characterized by rising temperatures, declining precipitation, and increasing extreme weather events. These challenges are particularly pronounced in urban areas, highlighting the need for high-resolution data to capture localized climate impacts and support effective mitigation strategies. This study employs the Weather Research and Forecasting (WRF) model, coupled with the Single-Layer Urban Canopy Model (SLUCM), to investigate the urban thermal environment of Nicosia, Cyprus, at a 1 km spatial resolution for the period 2008–2012. To analyze intra-urban variability, the study utilizes the CGLC-MODIS-LCZ dataset, which integrates the Copernicus Global Land Service Land Cover (CGLC) product, resampled to MODIS IGBP classes (CGLC-MODIS), and combined with Local Climate Zones (LCZ). A comprehensive evaluation is conducted across different LCZs for key variables, including 2-m air temperature (T2), 2-m relative humidity (RH), and land surface temperature (LST). Model output is evaluated against station-based observations for T2 and RH, while LST is evaluated using data from the MODIS Terra and MODIS Aqua satellites, with assessments performed at diurnal, monthly, seasonal, and annual scales. Results demonstrate the variability of T2, RH and LST amongst the LCZs and highlight the importance of localized modelling in addressing climate change impacts in this city.

How to cite: Koutroumanou-Kontosi, K., Cartalis, C., Hadjinicolaou, P., Constantinidou, K., and Agathangelidis, I.: Investigating the Urban Thermal Environment of a Climate Change Hotspot through High-Resolution Modelling: Case Study for Nicosia, Cyprus, EGU General Assembly 2025, Vienna, Austria, 27 Apr–2 May 2025, EGU25-9245, https://doi.org/10.5194/egusphere-egu25-9245, 2025.

EGU25-9363 | ECS | Orals | CL2.3

Predicting the Geospatial Distribution of Urban Population Health Risks Based on Air Pollutants, Climate, and Health Facilities in African Cities 

Eric Kofi Doe, Djanna Koubodana Houteta, Millicent Afi Sitsofe Amekugbe, Lilian Namuma Sarah Kong’ani, Mudarshiru Bbuye, Sylvester Egyir, Phillipina Naa Oserwa Schandorf, Doreen Larkailey Lartey, Sampson Domwakuuro Diyuoh Puoyang Dordaa, Ebenezer Boahen, Benedicta Yayra Fosu-Mensah, Christopher Jack, and Christopher Gordon

Air pollution and inadequate or poorly equipped health infrastructure are drivers in determining the health risks of urban populations globally. The spatial impacts of these drivers on the health risks of densely populated areas remain unexplored, particularly in the global south. Air pollutants such as fine particulate matter (PM2.5), sulfur dioxide (SO2), carbon dioxide (CO2), carbon monoxide (CO), tropospheric ozone (O3), and nitrogen dioxide (NO2) vary spatially along gradients in maximum temperature (Tmax), relative humidity (RH), and wind speed (WS). The current study spatially predicts the combined impact of air pollutants within varying climatic conditions (Tmax, RH and WS) and the distribution of healthcare facilities on Ghana’s urban population health risk in the Greater Accra Metropolitan Area (GAMA). The study employed spatial correlation and regression kriging using district-level population density per km2 as the primary variate (dependent variable) with the air pollutants, climate, and distribution of health facilities as covariates (drivers) of the population health risk. Preliminary results revealed specific spots (areas) of high and low health risks to communities in GAMA. The Accra and Tema Metropolitan Areas and Ablekuma Central, Ablekuma North, Korle Klottey, and Ashaiman District Assemblies had high population health risk spots (>25,000 persons/km2) with a mean dry season PM2.5 of 75.0 µg m-3, five times higher than the World Health Organization (WHO) recommendation of 15 µg m-3, as the main significant driver. Other determining risk factors were monthly mean PM2.5 (36.5 µg m-3), NO (68.4 µg m-3), NO2 (70.5 µg m-3), O3 (16 ppb), SO2 (3 ppb), CO (327 ppb) and Tmax (26℃), HR (80%) and WS (9 km h-1). The concentration and spatial autocorrelation of the pollutants diminished towards peri-urban areas such as Kpone-Katamanso, Ga East, and Ga West. These results underscore the critical role of applying geospatial tools to monitoring, understanding and managing population health risks induced by air pollution and adverse climate of densely populated areas. The results highlight the need to manage and address the combined effects of air pollutants and the role of climate and inadequate health facilities in the health risks of the GAMA population with spatial precision and district-level policies. It also contributes to global efforts toward achieving spatial equity in universal healthcare coverage, aligning with the United Nations Sustainable Development Goal 3.8 and strengthening policy and practical relevance of geospatial approaches for sustainable interventions.

Keywords: Urban climate condition and informatics; Environment and social challenges; Spatial dependency; Urbanization; spatial regression

How to cite: Doe, E. K., Koubodana Houteta, D., Amekugbe, M. A. S., Kong’ani, L. N. S., Bbuye, M., Egyir, S., Schandorf, P. N. O., Lartey, D. L., Dordaa, S. D. D. P., Boahen, E., Fosu-Mensah, B. Y., Jack, C., and Gordon, C.: Predicting the Geospatial Distribution of Urban Population Health Risks Based on Air Pollutants, Climate, and Health Facilities in African Cities, EGU General Assembly 2025, Vienna, Austria, 27 Apr–2 May 2025, EGU25-9363, https://doi.org/10.5194/egusphere-egu25-9363, 2025.

EGU25-9395 | Orals | CL2.3

A Machine Learning application towards a better representation of Madrid’s urban future climate 

Angelina Bushenkova, Pedro M.M. Soares, Frederico Johannsen, and Daniela C.A. Lima

Cities are considered local “hotspots” of climate change. Urban areas concentrate a large fraction of global population, wealth, and emissions, exposing their inhabitants to climate change impacts. Therefore, the improvement of urban present climate description and future projections are paramount for designing adaptation and mitigation strategies. Global Climate Models are state-of-the-art tools for projecting future climate. However, most of the simulations have coarse resolutions and do not have physical urban parametrisations to adequately represent the physical properties and processes at the urban scale.

The advantage of applying a machine learning approach – Extreme Gradient Boosting (XGBoost) – is explored for better describing Madrid’s urban present and future climates, namely, the ability to reproduce the 2-m air temperature (Tmax, Tmin), land surface temperature (LST), urban heat island (UHI) and surface urban heat island (SUHI) effects. The XGBoost is evaluated at daily scales for local ground temperatures and, at both daily and hourly scales, to represent the spatial structure of LST w.r.t. remote sensing data. Firstly, for present climate, XGBoost is trained with a set of ERA5 predictors (at 0.25°), ground stations, and LST observations. Secondly, a number of sensitivity cases are performed to assess the results dependency to predictors and their resolution. Thirdly, the learned relationship between the set of predictors and predictands is applied to 4 Earth System Global Climate Models (ESGCM) predictors, providing historical and future climate projections for the 21st century under four emission scenarios.

Overall, XGBoost results reveal a good performance and significant added value against ERA5 and the ESGCMs. XGBoost greatly improves the reproduction of the present climate Tmax, Tmin, LST, and more importantly, the UHI (-0.5°C and +3°C for Tmax and Tmin, respectively), and the SUHI (+1°C and +2°C for Tmax and Tmin, respectively). For future climate, XGBoost significantly corrects the ESGCM UHI misrepresentation but seems to underestimate the expected Madrid’s local warming (3.5°C anomaly under the SSP5-8.5 scenario).

Acknowledgments:

This work is supported by the Portuguese Fundação para a Ciência e Tecnologia, FCT, I.P./MCTES through national funds (PIDDAC):
UID/50019/2025 and LA/P/0068/2020 https://doi.org/10.54499/LA/P/0068/2020).

DCAL are supported by the Portuguese Foundation for Science and Technology (FCT) financed by national funds from the MCTES through grant https://doi.org/10.54499/2022.03183.CEECIND/CP1715/CT0004.

How to cite: Bushenkova, A., M.M. Soares, P., Johannsen, F., and C.A. Lima, D.: A Machine Learning application towards a better representation of Madrid’s urban future climate, EGU General Assembly 2025, Vienna, Austria, 27 Apr–2 May 2025, EGU25-9395, https://doi.org/10.5194/egusphere-egu25-9395, 2025.

EGU25-9424 | ECS | Orals | CL2.3

Using Deep Learning to generate future projections of temperature extremes and the urban heat island in Paris 

Frederico Johannsen, Pedro M. M. Soares, and Gaby S. Langendijk

Understanding and modelling the urban climate and the impacts of climate change on the urban environment is essential to underpin the development of adequate adaptation and mitigation measures and policies. City-scale climate projections require very high-resolution physically-based models which are commonly time-intensive and computationally expensive to run. To overcome this problem, cost and time effective alternatives, such as Deep Learning, are often sought.

Here, we present an application of two lightweight 3-layer Convolutional Neural Network (CNN) architectures to downscale 7 Global Climate Models (GCMs) from the Coupled Model Intercomparison Project Phase 6, for the 2015-2100 period using four socioeconomic pathways (SSP1-2.5, 2-4.5, 3-7.0, 5-8.5), for the city of Paris, France. The CNNs generate projections of 2-meter temperature (T2m) at point-level (using data from 7 in-situ observational stations) and Land Surface Temperature (LST) at a spatial resolution of ~5 km. The resulting dataset is used to analyse the CNNs representation of air temperatures, LST, the urban heat island (UHI) and temperature extremes, including heatwave frequency, in future climate. The CNN downscaled projections replicate the Parisian UHI effect, described in previous studies and in the observational data used to train the CNNs. The GCMs, on the other hand, due to their coarse resolution, are unable to capture the UHI effect. Moreover, the CNNs projections are consistent with the GCMs overall warming mean trend for maximum and minimum T2m and LST, 90th percentile maximum T2m, and an increase in tropical nights throughout the 21st century (for the warmest scenarios). However, CNNs underestimate the increase in heatwave frequency present in the GCMs under the warmest scenarios. Although further research is required to understand the shortcomings in heatwave DL projections, this work supports the potential of DL as a downscaling method for urban climate studies.


Acknowledgements: This work is supported by the Portuguese Fundação para a Ciência e Tecnologia, FCT, I.P./MCTES through national funds (PIDDAC):

UID/50019/2025 and LA/P/0068/2020 (https://doi.org/10.54499/LA/P/0068/2020).

Frederico Johannsen was supported by FCT, I.P with the doctoral grant with the reference UI/BD/151498/2021 and DOI identifier 10.54499/UI/BD/151498/2021.

How to cite: Johannsen, F., M. M. Soares, P., and S. Langendijk, G.: Using Deep Learning to generate future projections of temperature extremes and the urban heat island in Paris, EGU General Assembly 2025, Vienna, Austria, 27 Apr–2 May 2025, EGU25-9424, https://doi.org/10.5194/egusphere-egu25-9424, 2025.

Cities globally are at the epicenter of socioeconomic and technological advances but are also disproportionately impacted by weather extremes. Interestingly, while cities are affected by the large-scale weather patterns, cities themselves create thermodynamical feedback which affects local and regional meteorology. The changes in temperature due to urban growth are likely most recognizable as 'urban heat islands' (UHIs). These UHIs are indicators of the systemic changes that are dynamically underway- with the temperature changes affecting the local humidity, local scale convergence, and potential for cloud-convection processes, and in some instances changes in the precipitation characteristics.  These changes in the meteorological parameters have now been well documented and a consistent signature and understanding emerging that emphatically highlights that cities change local weather and climate.  

Given this understanding of the state of the science, the next question that comes up is how can we then design cities that can create regionally "desired" weather and climate for the cities- or at the very least reduce the exposure to the climatic extremes and the vulnerability.  This invited presentation will discuss the evolution of the community's understanding of urban science and the efforts underway to translate this synthesis from being useful to usable and actionable for city operations, decision-making, and planning activities that can help build resilience.  The talk will also discuss how the information from upcoming assessments such as the IPCC Special Report on Cities and Climate and related activities will need to be leveraged by cities globally, through local municipal- academia - community colabs, urban digital twins, and community and consensus building regarding data governance, ethics, experimental testbed, and experiential outcomes that can be scaled, adapted, and engaged for cities globally. 

How to cite: Niyogi, D.: Urban Climate Science to Engineering Future Cities - Evolution of Understanding and Opportunities , EGU General Assembly 2025, Vienna, Austria, 27 Apr–2 May 2025, EGU25-11222, https://doi.org/10.5194/egusphere-egu25-11222, 2025.

EGU25-11496 | ECS | Orals | CL2.3

Scenarios of street green space to inform future heat adaptation in cities 

Steffen Lohrey and Giacomo Falchetta

Urban green has the potential to reduce urban heat stress, with shading and evapotranspiration being both important contributors. We here investigate street green space (SGS), which comprises street-level vegetation in the form of trees, bushes or green facades, i.e. that is “visible to a person in the street”. We measure SGS using the green view index (GVI).

We first analyze the relationship between climate zone, urban form and SGS. This is based on published research on current SGS in 181 global cities. We find that observed attainable GVI values vary by urban form, but more importantly, by climate zone at large. Cities in temperate and tropical climates showing much larger values than in dry climate zones. In the next step, we develop three scenarios of future street green space. These are based on the observed greenness from 2016-2023, and on a careful trend analysis. We extend the current values until 2050, using optimistic assumptions that we deem plausible and that have been informed by the trends. In two “optimistic outlook” scenarios, we assume positive trends that are however constrained by maximum observation. This is complemented by a more pessimistic “baseline scenario”, for which we assume current street green space conditions, but negatively impacted by climate change.

In a second step we translate these scenarios into a quantifiable perspective of future urban heat mitigation potential for 143 cities using high-resolution climate model data from the URBCLIM project. The cooling potential of SGS by urban form and climate zone has been determined using a random-effects regression analysis with place-specific confounding factors in a related project (EGU presentation EGU25-5169).

This work results in a dataset of urban cooling potential of  greening scenarios in 143 cities. The scenarios also take into account different climate change scenarios from the RCP-SSP framework.

How to cite: Lohrey, S. and Falchetta, G.: Scenarios of street green space to inform future heat adaptation in cities, EGU General Assembly 2025, Vienna, Austria, 27 Apr–2 May 2025, EGU25-11496, https://doi.org/10.5194/egusphere-egu25-11496, 2025.

EGU25-11758 | Posters on site | CL2.3

Assessing Urban Heat Island in the European Union capitals by means of MODIS and Landsat data 

Alexandra Gemitzi, Giorgos Chalkias, Stavros Stathopoulos, and Konstantinos Kourtidis

The present work aims at estimating the Urban Heat Island effect in the capital cities of European Union (EU) countries. The main objectives of the research were: a) the estimation of the magnitude of UHI in the EU capitals and b) the evaluation of possible relationships with latitude and / or population density. To address these objectives two independent datasets were used that provide Land Surface Temperature estimates over the past eleven years (2013 to 2024), namely the MODIS Terra Land Surface Temperature product and the Landsat 8 Surface Temperature. These two LST products have differences in their spatial and temporal resolution, but were selected due to small difference in daytime acquisition time. The methodology focused on the construction of surface temperature time series from the above data sources for three distinct land cover classes, i.e. urban, forest, and cropland areas, retrieved from the CORINE 2018 land cover dataset. The time series from both MODIS and Landsat 8 were evaluated for their difference in their mean values in the three land cover types. All examined EU capitals were found to have statistically significant higher surface temperatures compared to their surrounding forest and cropland areas. MODIS and Landsat yielded comparable results, whereas the spatial pattern of UHI of EU capitals and its correlation with population density were evaluated highlighting the characteristics of increasing temperatures in large EU cities.

How to cite: Gemitzi, A., Chalkias, G., Stathopoulos, S., and Kourtidis, K.: Assessing Urban Heat Island in the European Union capitals by means of MODIS and Landsat data, EGU General Assembly 2025, Vienna, Austria, 27 Apr–2 May 2025, EGU25-11758, https://doi.org/10.5194/egusphere-egu25-11758, 2025.

EGU25-11970 | ECS | Orals | CL2.3

Validation of an Offline One-Dimensional Multi-Layer Urban Canopy Model Using the BEP+BEM Scheme: A Case Study in Melbourne 

Gianluca Pappaccogli, Andrea Zonato, Alberto Martilli, Riccardo Buccolieri, and Piero Lionello

Rapid urbanization and climate change have intensified the need for accurate urban microclimate modelling tools to support sustainable urban planning and mitigate adverse environmental impacts. Models capable of simulating the complex interactions between urban surfaces, buildings, and vegetation are essential for assessing the effects of climate change, urban overheating, and energy consumption. The MLUCM BEP+BEM model introduces advancements in urban microclimate modelling by integrating enhanced turbulent diffusion schemes with the Building Effect Parameterization (BEP) and the Building Energy Model (BEM). The model incorporates updated turbulent length scales and eddy diffusivity coefficients that account for atmospheric stability, as well as a representation of urban vegetation, including green spaces and street trees. Designed for offline operation, it offers low computational cost, making it suitable for standalone use, coupling with climate projections, and conducting long-term simulations to assess the effects of different emission scenarios on urban environments. Validation against observational data from the Urban-PLUMBER project, conducted at a suburban site in Preston (Melbourne, Australia), demonstrates reliable performance in simulating upward shortwave (SWup) and longwave (LWup) radiation. Sensible heat flux (Qh) and momentum flux (Qtau) are also accurately reproduced, highlighting the model’s robustness in complex urban environments. An underestimation of latent heat flux (Qle) suggests that further investigation and refinement of the representation of moisture-related processes in the model would be beneficial. The adaptability of the MLUCM BEP+BEM model enables its application across various climatic contexts to evaluate the impacts of climate change on urban heat stress, energy demand, and the effectiveness of adaptation strategies. Potential applications include analysing green roofs, cool roofs, photovoltaic systems, and other mitigation measures to support sustainable urban development.


This work is supported by ICSC – Centro Nazionale di Ricerca in High Performance Computing, Big Data and Quantum Computing, funded by European Union – NextGenerationEU (CUP F83C22000740001).

How to cite: Pappaccogli, G., Zonato, A., Martilli, A., Buccolieri, R., and Lionello, P.: Validation of an Offline One-Dimensional Multi-Layer Urban Canopy Model Using the BEP+BEM Scheme: A Case Study in Melbourne, EGU General Assembly 2025, Vienna, Austria, 27 Apr–2 May 2025, EGU25-11970, https://doi.org/10.5194/egusphere-egu25-11970, 2025.

Heat extremes significantly impact human health, causing heat stroke, reduced productivity, and heat-related mortality. In Europe, the increasing frequency of intense heat waves results from a combination of natural climate variability and anthropogenic climate change. Urbanization exacerbates these extremes through the urban heat island (UHI) effect, intensifying warming in cities and their surroundings. Since the 2000s, France has experienced severe heat waves leading to substantial loss of life, with Lyon experiencing a significant mortality increase after Paris, as reported by the EM-DAT database.

Heat stress exhibits high spatiotemporal variability influenced by morphological and climatic conditions. While heat stress classifications based on climate and urban development provide a general overview of population impacts, they lack the detailed resolution needed to understand intra-urban temperature intensification.

This study investigates the complex dynamics of heat stress at a micro-scale by analyzing three heat stress indices over the Lyon region from 2000 to 2022 during summer (June-August): 1) a temperature-based heat index, 2) the Universal Thermal Climate Index (UTCI), and 3) UHI intensity. A comparative spatiotemporal analysis was conducted across these datasets.

Maximum and minimum air temperature and relative humidity data were obtained from Météo-France's ground observation network. Hourly data were converted to daily values for heat stress index (HSI) calculation. High-resolution (0.25° x 0.25°) daily UTCI data were extracted from the ERA5 reanalysis dataset. Landsat 5, 7, and 8 satellite images covering Lyon were acquired and processed using a single-channel method, including radiometric and geometric corrections, and NDVI-based emissivity corrections, to derive land surface temperature (LST). Image fusion techniques were applied to combine the multi-temporal satellite data into a single dataset.

Cubic interpolation was used to standardize the temporal resolution of the LST, ground observation, and reanalysis data and to address data gaps. The HSI was calculated using Steadman’s index, using daily air temperature and relative humidity. Spatial and temporal analysis of surface temperatures was performed over urban and rural areas of Lyon to calculate UHI intensity. Using the HSI derived from direct temperature data as a benchmark, bias correction, root mean square error, and correlation analyses were conducted to validate the UTCI and UHI. Spatial mapping of the derived HSI was performed using QGIS, and temporal analysis was conducted to compare seasonal, annual, and decadal HSI patterns.

Results revealed significant discrepancies between air temperature-based and thermal data-derived metrics, particularly in urbanized areas where land surface characteristics and anthropogenic activities enhance heat retention. Urban areas exhibited significantly higher temperatures and increased heat stress compared to rural areas due to the UHI effect. Remote sensing data provided more localized and detailed information on heat stress than traditional temperature-based indices. Despite some disparities, the datasets complemented each other by enabling necessary spatial and temporal adjustments. This research highlights the need for multi-dimensional approaches to heat stress assessment, integrating both meteorological and remotely sensed data. These findings have crucial implications for urban planning and climate adaptation strategies in Lyon and other European cities facing increasing heat stress risks.


How to cite: Geesupalli, P. D. and Pothier, C.: A Multi-Scale Comparison of Heat Stress Metrics in Lyon using meteorological, reanalysis and remote sensing datasets, EGU General Assembly 2025, Vienna, Austria, 27 Apr–2 May 2025, EGU25-12651, https://doi.org/10.5194/egusphere-egu25-12651, 2025.

EGU25-12805 | Orals | CL2.3

The potential for evaporative cooling from Vienna's green roofs 

Sabina Thaler, Josef Eitzinger, Christian Gützer, Stephan Hörbinger, Johann Peter Rauch, Heidelinde Trimmel, and Philipp Weihs

Increased vegetation and the removal of sealed surfaces have been major efforts to reduce urban heat. Nevertheless, a lot of green facades and roofs are not irrigated, which causes drought stress in the plants during future, longer, or more intense summer heat waves without precipitation, leading to lower actual evapotranspiration. As a result, the anticipated cooling effect may not be achieved by many non-irrigated green roofs.

In our study, four green roof sites in different local climate zones and elevations regarding average roof level (compact-midrise above rooftop, compact-midrise below rooftop, open mid-rise, and large low-rise) within Vienna, Austria were investigated, over a two-year period. The impact of microclimatic site conditions on typically applied extensive and intensive green roof set ups, respectively, on actual evapotranspiration were measured under rainfed conditions by mini-lysimeters combined with meteorological in-situ measurements. The extensive green-roof set-up represented a soil substrate with a depth of 10 cm covered with drought stress tolerant plant species, whereas the intensive set-up represented a soil substrate with a depth of 25 cm covered with plant species of higher biomass growth potential, but more sensitive to drought stress. The measured actual evapotranspiration rates on a daily base were further used to calibrate the FAO-approach (Allen et al., 1998) for calculating actual evapotranspiration for the applied green roof set-ups and applied for different scenarios (irrigation and climate scenarios).

The results revealed that the green roof site conditions (especially wind speed) as well as the type of substrate and vegetation influence the temporal dynamics of actual evapotranspiration significantly. Also, it was found that actual evapotranspiration rates (and related cooling potential) were strongly limited under rainfed conditions during hot and dry summer conditions. Support irrigation to enhance actual evapotranspiration and avoid plant damages during drought periods and heat waves may need considerable amounts of water over the city of Vienna, showing a need for effective irrigation systems and irrigation water management.


Reference: Allen R, Pereira L, Raes D, Smith M (1998) Crop Evapotranspiration – Guidelines for computing crop water requirements. Irrigation and Drainage Paper Nr. 56. Rome, Italy.

How to cite: Thaler, S., Eitzinger, J., Gützer, C., Hörbinger, S., Rauch, J. P., Trimmel, H., and Weihs, P.: The potential for evaporative cooling from Vienna's green roofs, EGU General Assembly 2025, Vienna, Austria, 27 Apr–2 May 2025, EGU25-12805, https://doi.org/10.5194/egusphere-egu25-12805, 2025.

EGU25-13280 | ECS | Posters on site | CL2.3

Urbanization and Climate Change Impacts on Rainfall: A Numerical Sensitivity Study over Milan 

Marika Koukoula, Herminia Torelló-Sentelles, and Nadav Peleg

Over the past decades, urbanization has surged globally, with more than 50% of the population now residing in cities. Projections indicate a continued increase in urban populations, accompanied by significant changes in land use and land cover. These alterations are expected to affect the temporal and spatial distribution of precipitation. Combined with the effects of climate change, which is likely to increase the frequency and intensity of short-duration heavy rainfall, the risk of flooding in urban environments is expected to rise. Understanding the combined impacts of urbanization and climate change on rainfall dynamics is therefore critical for effective flood risk management and urban planning. 
In this study, we investigate the influence of urbanization and climate change on short-duration rainfall events in Milan. We used the Weather Research and Forecasting (WRF) model to simulate 8 rainfall events in the current urban setup and climate, and to assess how these events will alter in different scenarios of urbanization and climate change. Results reveal that the impact of global warming on rainfall space-time characteristics is stronger than that of urbanization. However, urbanization significantly contributes to the urban heat island effect, which, when combined with global warming, amplifies its influence on rainfall patterns. These findings underscore the importance of accounting for the combined impacts of climate change and urbanization in studies of future rainfall patterns, particularly for flood risk assessments and urban resilience planning.

How to cite: Koukoula, M., Torelló-Sentelles, H., and Peleg, N.: Urbanization and Climate Change Impacts on Rainfall: A Numerical Sensitivity Study over Milan, EGU General Assembly 2025, Vienna, Austria, 27 Apr–2 May 2025, EGU25-13280, https://doi.org/10.5194/egusphere-egu25-13280, 2025.

EGU25-13872 | Posters on site | CL2.3

Assessment of forest microclimates in different urban forest structures in Augsburg, Germany 

Christoph Beck, Jonathan Simon, Elisabeth André, Samuel Brandl, Lisa-Marie Falkenrodt, Bhargavi Mahesh, Joachim Rathmann, Yekta Said Can, Max Stocker, and Pamina Zwolsky

The third-party-funded research project "Climate and Health Effects of Urban Forest Structures" (German Research Foundation under contract 471909988) aims to evaluate and compare different urban forest structures with regard to their microclimatic and health-related properties. In order to assess the microclimatic differentiations, extensive stationary and mobile measurements of various meteorological parameters have been carried out in the urban area of Augsburg since 2022. Thereby, four differently structured forest areas in the Augsburg “city forest,” an inner-city park, and an urban comparison area are taken into account.

In all areas, between 5 and 7 Onset HOBO MX2300 loggers were installed to continuously (four-minute measurement intervals) record air temperature and relative humidity. In addition, measurement and survey campaigns were carried out in the study areas in all seasons and under different weather conditions. The campaigns took place in the early afternoon over a period of about 30 minutes along predefined paths that touched different structure types within the study areas.

For mobile microclimate measurements Kestrel 5400 WBGT Heat Stress Trackers and optional additional sensors have been used. In addition, physiological data (heart rate, cortisol level) of study participants have been collected, and surveys on subjective well-being have been conducted.

The microclimate measurements reveal not only climatic differences between the urban comparison area and park and forest areas in general, but also between the different urban forest structures and as well within the structure types.

In addition to the microclimatic differentiation, further analysis of the measurement results will provide information on the health relevance of different urban forest structures. Based on this, recommendations for the use and development of urban forests will be derived.

How to cite: Beck, C., Simon, J., André, E., Brandl, S., Falkenrodt, L.-M., Mahesh, B., Rathmann, J., Said Can, Y., Stocker, M., and Zwolsky, P.: Assessment of forest microclimates in different urban forest structures in Augsburg, Germany, EGU General Assembly 2025, Vienna, Austria, 27 Apr–2 May 2025, EGU25-13872, https://doi.org/10.5194/egusphere-egu25-13872, 2025.

EGU25-14553 | ECS | Posters on site | CL2.3

The efficacy of roof mitigation strategies for urban heat island in various background climate 

Haobo Yin, Xinyi Zhao, Lei Wang, and Rui Wang

Urban heat island (UHI) is a significant anthropogenic climate impact in cities, with construction and human activities altering the radiative and thermodynamic properties of urban surfaces, leading to higher temperatures relative to rural areas. Mitigation strategies such as green roofs (GR) and cool roofs (CR) have been implemented to counteract UHI, reducing adverse effects like exacerbated heat waves and increased cooling energy demand. However, limited research has addressed the influence of background climate on the efficacy of these mitigation measures. Given that background climate factors—such as regional temperature, humidity, and precipitation—can significantly impact processes like evapotranspiration and albedo, it is crucial to assess how these factors interact with mitigation strategies.

This study uses the Weather Research and Forecasting (WRF) model to evaluate the mitigation effects of CR and GR across six populous mega-cities in China, which represent a range of background climates from temperate semi-arid to subtropical humid. To accurately simulate urban heat environments, various urban parameterization schemes (e.g., LCZ, UCP) and urban climate models (e.g., SLUCM, BEP, BEM+BEP) were tested, and the best combination was selected for simulation. Sensitivity tests were conducted across multiple scenarios, ranging from practical to idealized conditions, to assess the impact of background climate on mitigation effectiveness. The results indicate that background climate and regional weather patterns significantly influence the success of UHI mitigation strategies. These findings offer valuable insights for urban planning and the design of context-specific UHI mitigation measures.

How to cite: Yin, H., Zhao, X., Wang, L., and Wang, R.: The efficacy of roof mitigation strategies for urban heat island in various background climate, EGU General Assembly 2025, Vienna, Austria, 27 Apr–2 May 2025, EGU25-14553, https://doi.org/10.5194/egusphere-egu25-14553, 2025.

EGU25-15001 | ECS | Posters on site | CL2.3

CHETNA-Residential Sector: High-Resolution GHG Emissions Analysis for Indian Cities using Building-Level Climate-Energy Modelling 

Kounik De Sarkar, Ahana Sarkar, Chuanlong Zhou, Philippe Ciais, Harish Phuleria, and Arnab Jana

India's rapid economic growth and unprecedented urbanization have led to a significant rise in energy consumption and greenhouse gas (GHG) emissions from residential buildings. Currently, the residential sector accounts for approximately 20% of India's total GHG emissions, with a few major cities contributing up to 42.8% of total urban emissions. Projections indicate an 8-fold increase in energy demand by 2050, driven by rising urban expansion, household incomes, and greater ownership of energy-intensive appliances, such as air conditioners and refrigerators. With India’s urban population expected to reach 50.3% by 2050 and over 70% of the country’s building stock yet to be constructed, cumulative emissions from the buildings sector between 2020 and 2070 could surpass 90 gigatonnes of CO2e, exceeding the nation’s allocated carbon budget.

This study aims to create high-resolution CO2e emissions datasets for 100 Indian cities to address the lack of reliable data necessary for effective urban GHG mitigation planning. We employed a semi-supervised learning approach to classify building types and estimate heights using an XGBoost model trained on Microsoft Building Footprint data, satellite imagery, OpenStreetMap features, and other urban datasets. These outputs were then integrated into a building-climate-energy model, which combines household survey data, climate variables, and derived building features to estimate residential energy consumption. The household survey provides detailed insights into appliance usage, energy consumption patterns, and variations across income classes.

The building characteristic prediction model achieved good performance, with an average F1-macro score exceeding 0.8 for type and height predictions on the testing set. Similarly, the energy prediction model demonstrated robust accuracy, with an R2 > 0.6 on the testing set. Using explainable machine learning techniques, such as SHAP, we identified air humidity and income class as the most critical factors influencing residential energy consumption, highlighting the interconnected roles of climate and socioeconomic conditions in shaping residential energy demand. Finally, gridded emission map time series were developed for each city using the city population, building characteristics, and a simplified energy model that incorporates climate data and regional income classifications.

This work is part of the CHETNA project (City-wise High-resolution carbon Emissions Tracking and Nationwide Analysis), which leverages artificial intelligence and advanced datasets to provide high-resolution, near real-time CO2e and air pollutant emissions data for over 100 Indian cities. By integrating building-climate-energy modelling, this study delivers spatially and temporally granular emissions datasets for the residential sector. These results empower the CHETNA project to support localized mitigation strategies, promote energy-efficient building practices, and inform sustainable urban planning tailored to India’s unique urban landscape.

How to cite: De Sarkar, K., Sarkar, A., Zhou, C., Ciais, P., Phuleria, H., and Jana, A.: CHETNA-Residential Sector: High-Resolution GHG Emissions Analysis for Indian Cities using Building-Level Climate-Energy Modelling, EGU General Assembly 2025, Vienna, Austria, 27 Apr–2 May 2025, EGU25-15001, https://doi.org/10.5194/egusphere-egu25-15001, 2025.

EGU25-16253 | ECS | Posters on site | CL2.3

Multi-Source Observations and High-Resolution Modeling to Investigate the Urban Heat Island in the City of Bolzano (Italy) 

Gaspard Simonet, Alice Crespi, Massimiliano Pittore, Giovannini Lorenzo, and Claudio Zandonella Callegher

The ability to accurately describe urban climate and the role of urban environments in determining heat conditions and hotspots is key to informing risk assessment, planning climate change adaptation measures, and developing mitigation strategies for cities. However, the characterization of Urban Heat Islands (UHI) still presents unique challenges from both observational and modeling perspectives, especially in complex mountainous terrain. This is due to the different scales of the features involved in the redistribution of the temperature field and the significant amount of data required to correctly capture the local specificities of both the city and its valley environment.

This study presents a novel approach integrating multi-source meteorological information to investigate the UHI in Bolzano, a city located in the south-eastern Alps and one of the Italian cities most exposed to high temperatures during summer months, especially during heatwave episodes. Specifically, we combine an extensive mobile measurement network with fixed observations, remote-sensing data, and high-resolution climate modeling. A unique distributed mobile measurement network, consisting of up to 25 meteorological sensors (MeteoTracker) installed on public buses, provides continuous spatial and temporal coverage of meteorological parameters (temperature, humidity, and pressure) across the urban area. The buses' fixed routes, including transitions between urban and rural areas, enable systematic quantification of UHI intensity across different temporal scales. This mobile network is complemented by fixed observations from quality-controlled official weather stations managed by the provincial meteorological office and crowdsourced sensors (NetAtmo), with the latter undergoing strict quality assessment based on spatial consistency.

To bridge observational gaps and provide continuous spatial coverage, we employ two modeling approaches: (1) 200-m resolution urban climate simulations provided by the UrbClim model, resolving mesoscale features – such as thermally driven winds – for the recent period, the mid-term and the far future, and (2) weather predictions from the Weather Research and Forecasting (WRF) model at 1-km resolution covering the past 6 years. Temperature patterns described by the two model datasets, run over an extended area centered on the city, are compared and evaluated against observations, aggregated spatially and temporally to match model grid points.

In addition to in-situ observations and model simulations, the relationship between land surface temperature derived from remote sensing data and near-surface temperature is analyzed across different urban climate zones to further assess the effects of the urban environment on heating conditions and identify urban hotspots. The multi-source approach is first tested by considering recent heatwave episodes recorded in Bolzano, including the summers of 2022 and 2023. Preliminary results demonstrate the effectiveness of combining multiple observation types with high-resolution modeling to characterize UHI patterns in complex terrain.

The work is conducted within the framework of the RETURN Extended Partnership (European Union Next-Generation EU, National Recovery and Resilience Plan – NRRP, Mission 4, Component 2, Investment 1.3 – D.D. 1243 2/8/2022, PE0000005).

How to cite: Simonet, G., Crespi, A., Pittore, M., Lorenzo, G., and Zandonella Callegher, C.: Multi-Source Observations and High-Resolution Modeling to Investigate the Urban Heat Island in the City of Bolzano (Italy), EGU General Assembly 2025, Vienna, Austria, 27 Apr–2 May 2025, EGU25-16253, https://doi.org/10.5194/egusphere-egu25-16253, 2025.

EGU25-16861 | ECS | Posters on site | CL2.3

Enhancing Urban Heat Island Mapping in Turin During a Heat Wave: A Machine Learning Approach with Citizen Science Data 

Tanguy Houget, Valeria Garbero, Marco Piras, Emmanuel Dellandrea, and Pietro Salizzoni

Accurate prediction of ground-level air temperature is crucial for developing heat hazard maps that help anticipate the impacts of heat waves on vulnerable populations. Numerical weather prediction models typically operate at the mesoscale resolution (1-2 km) (Garbero et al., 2021), and their application at high spatial resolution within large urban areas faces significant challenges, such as the complexities of urban parameterization and the high computational costs. In this context, machine learning has emerged as a promising alternative or complementary approach to these traditional methods (Zumwald et al., 2021).

This study presents a machine learning-based model designed to reconstruct high-resolution temperature maps and predict hourly temperatures for the city of Turin during a heat wave in June 2022. The model leverages nine predictor variables related to urban morphology, including building density, building height, sky view factor, and vegetation density, combined with temperature data from citizen weather stations (CWS). The CWS data, sourced from the Netatmo meteorological network, support the model's potential for generalization to other cities. Furthermore, this study evaluates the impact of integrating the outputs of the COSMO meteorological model into the predictor set.

This study compares the performance of two modelling approaches, trained for each nighttime hour, to reconstruct temperature maps: (i) a baseline multi-linear regression (MLR) model and (ii) a convolutional neural network (CNN). The MLR model was trained at two spatial resolutions - 50 and 100 m. Results indicate that the 100 m resolution yields lower RMSE values, with a maximum error of 1.36°C (reduced to 1.23°C when COSMO outputs are included as additional predictors). This finding highlights the importance of averaging predictors over sufficiently large spatial areas around sensor locations. The CNN model outperforms the MLR, achieving a maximum RMSE of 1.21°C (further reduced to 1.17°C). Both models demonstrate substantial improvement over the COSMO model, which exhibits a notably higher RMSE exceeding 2.5°C when predicting Netatmo temperatures.

A sensitivity analysis highlights the slightly greater influence of specific predictors, such as the Sky View Factor or the altitude. However, the relatively low magnitude of sensitivity suggests an excessive number of predictors, leading to compensatory effects when individual predictors are excluded from the model.

This study demonstrates the effectiveness of machine learning techniques in reconstructing temperature maps in Turin. Future work should focus on reducing predictor redundancy, improving data cleaning processes to mitigate the impact of outliers, and assessing the generalizability of this methodology to other cities.


References :

Garbero, V., Milelli, M., Bucchignani, E., Mercogliano, P., Varentsov, M., Rozinkina, I., Rivin, G., Blinov, D., Wouters, H., Schulz, J.-P., Schättler, U., Bassani, F., Demuzere, M., Repola, F., 2021. Evaluating the Urban Canopy Scheme TERRA\_URB in the COSMO Model for Selected European Cities. Atmosphere 12, 237. https://doi.org/10.3390/atmos12020237

Zumwald, M., Knüsel, B., Bresch, D.N., Knutti, R., 2021. Mapping urban temperature using crowd-sensing data and machine learning. Urban Climate 35, 100739. https://doi.org/10.1016/j.uclim.2020.100739

How to cite: Houget, T., Garbero, V., Piras, M., Dellandrea, E., and Salizzoni, P.: Enhancing Urban Heat Island Mapping in Turin During a Heat Wave: A Machine Learning Approach with Citizen Science Data, EGU General Assembly 2025, Vienna, Austria, 27 Apr–2 May 2025, EGU25-16861, https://doi.org/10.5194/egusphere-egu25-16861, 2025.

EGU25-16910 | ECS | Posters on site | CL2.3

Urban-rural climate representation in convection-permitting regional climate model simulation in Europe 

Pia Freisen, Claas Teichmann, Joni-Pekka Pietikäinen, and Lars Buntemeyer

The representation of complex urban environments and their climates highlights a key advancement in present-day regional climate modeling. City climates differ from their surrounding regional climates in various ways, e.g., through increased temperatures and reduced evapotranspiration. The development of convection-permitting regional climate model (CPRCM) simulations allow us to resolve urban areas and their climatic phenomena, such as the urban heat island effect, in contrast to their rural surroundings more precisely. However, with increasing resolution, the complex terrain and characteristics of cities must be adequately represented.

The EU Horizon project Impetus4Change (https://impetus4change.eu) aims to improve the quality, accessibility and usability of near-term climate information and services at local to regional scales. The project utilises dynamically downscaled regional climate models (RCMs) to produce very high-resolution (3 km) simulations for urban areas across Europe. To achieve this, we integrate the Town Energy Balance model (TEB; Masson, 2000), a single-layer urban canopy model, into the RCM REMO to simulate urban climates and urban-rural interactions under transient climate change conditions.

Compared to a previously bulk urban form in REMO, TEB introduces distinctive urban features, such as an urban canyon with roofs, walls and roads. This allows for a more realistic representation of vertical radiative trapping and turbulent exchange. The double-nested CPRCM simulations performed include evaluation simulations driven by reanalysis (ERA5.1) for 2000-2009 and historical simulations driven by the general climate model MPI-ESM1-2-HR for 1995-2014, covering two large domains across Northern and Southern Europe. The output is compared to observations and existing 3 km and 12.5 km simulations of REMO without a sophisticated urban canyon scheme to assess the added value of more realistic urban climate representations in Europe.

*This project has received funding from the European Union’s Horizon Europe research and innovation programme under grant agreement No 101081555.

Reference
Masson, V. A Physically-Based Scheme For The Urban Energy Budget In Atmospheric Models. Boundary-Layer Meteorology 94, 357–397 (2000). https://doi.org/10.1023/A:1002463829265

How to cite: Freisen, P., Teichmann, C., Pietikäinen, J.-P., and Buntemeyer, L.: Urban-rural climate representation in convection-permitting regional climate model simulation in Europe, EGU General Assembly 2025, Vienna, Austria, 27 Apr–2 May 2025, EGU25-16910, https://doi.org/10.5194/egusphere-egu25-16910, 2025.

EGU25-17430 | ECS | Orals | CL2.3

Quantifying the impacts of urban adaptation measures to reduce heat stress in Belgium 

Fien Serras, Inne Vanderkelen, Oscar Brousse, Charles Simpson, Dirk Lauwaet, Claire Demoury, Nicole P.M. van Lipzig, and Clare Heaviside

Climate change is driving higher global temperatures and more frequent heatwaves. Urban populations are exposed to high temperatures and heat stress because of the urban heat island. For effective adaptation planning, quantifying the additional heat burden for urban populations during heat waves and finding possible heat mitigation strategies is key. Our study focusses on Brussels during the record-breaking heat wave of 2019 in Belgium, where temperatures approached 40°C.  We use high-resolution models to characterise spatial variations in heat exposure across the city, and quantify how certain adaptation strategies like urban greening can reduce heat exposure and related health impacts.

To quantify the influence of the urban presence as well as detect spatial differences in heat exposure, we compare urban and non-urban scenarios using three urban climate models: UrbClim at 100m, WRF with BEP/BEM at 1km and COSMO-CLM with TERRA_URB at 2.8km. Additionally, we link the temperature output from the simulations to mortality data for Brussels using existing temperature-health relationships to quantify the mortality attributable to the heatwave. For each of the models in the urban mini-ensemble, the same adaptation strategy is implemented at hotspot locations. Three different scenarios are tested: increasing the permeable surface, implementing cool roofs and a combination of both. The mini-ensemble allows for a better understanding of the uncertainties related to implementing such strategies, particularly the effects of different model parameterizations. These results help us understand the potential of mitigation measures to reduce impacts from heat stress, and thereby serve as an important basis for urban adaptation and planning policy.

How to cite: Serras, F., Vanderkelen, I., Brousse, O., Simpson, C., Lauwaet, D., Demoury, C., van Lipzig, N. P. M., and Heaviside, C.: Quantifying the impacts of urban adaptation measures to reduce heat stress in Belgium, EGU General Assembly 2025, Vienna, Austria, 27 Apr–2 May 2025, EGU25-17430, https://doi.org/10.5194/egusphere-egu25-17430, 2025.

EGU25-17620 | ECS | Orals | CL2.3

Using a fast urban climate model to simulate the effects of pavement watering on urban heat mitigation  

Jixuan Chen, Peter M. Bach, and João P. Leitão

Pavement watering has emerged as a potential strategy for mitigating urban heat and adapting cities to climate change. However, modelling tools to support the large-scale planning of such interventions remain limited. This study introduces the integration of pavement watering dynamics into an established fast urban climate model. The proposed new model was validated through comparisons with measurements and existing modelling data, demonstrating good agreement. To ensure robustness and reliability, the approach was tested using diverse input information, showing that wetting impervious pavements can reduce surface temperatures by up to 15 °C and air temperature by as much as 2 °C. The results also provide valuable insights into effective pavement watering practices for optimising surface and air temperature reductions. Additionally, a city-scale simulation illustrated the broader potential of expanding the application of pavement watering strategies. Our proposed model offers new approaches for advancing understanding the cooling effects and water resource needs for pavement watering practices, facilitating smarter planning of heat mitigation measures for more liveable urban environments.

How to cite: Chen, J., Bach, P. M., and Leitão, J. P.: Using a fast urban climate model to simulate the effects of pavement watering on urban heat mitigation , EGU General Assembly 2025, Vienna, Austria, 27 Apr–2 May 2025, EGU25-17620, https://doi.org/10.5194/egusphere-egu25-17620, 2025.

EGU25-17695 | ECS | Posters on site | CL2.3

Influence of urban green infrastructure on thermal stress for humans 

Jonathan Lukas Biehl, Astrid Ziemann, Ronald Queck, and Matthias Mauder

In urban climatology green infrastructure is considered as useful measure to mitigate extreme temperatures during hot summer days. The presented research investigates the effect of green infrastructure on the air temperature and on the thermal stress of humans, quantified as Universal Thermal Climate Index (UTCI). The main study site is within the premises of the Botanical Garden of the university in Dresden, Germany. It comprises a mix of different types of tall and low vegetation, and non-vegetated surfaces covered with gravel and buildings. The influence of green infrastructure on ambient meteorological conditions was measured using a mobile and a stationary system. The stationary system measured the energy balance based on the eddy-covariance method on a lawn area. An instrumented backpack measured global radiation, air temperature and humidity and the radiative surface temperature on a predefined route, which was sampled several times over the course of a cloudless day with high global radiation. The route crosses sections with different vegetation types and densities, impervious surfaces and shaded areas. Background data of urban and rural meteorological stations is used to assess the heat mitigation potential of the urban green infrastructure within the Botanical Garden. During the day (7:00 to 18:00 UTC) a mean UTCI of 26.6 °C is measured at the stationary system in the Botanical Garden. At the background stations, the mean UTCI is 3 °C lower for rural surroundings and 3.8 °C higher within the urban environment of Dresden. Inside the Botanical Garden, the low and medium-tall vegetation reduces the UTCI by in average 0.08 to 0.7 °C compared to the stationary measurements. This small reduction is probably due to the radiation emitted by the warm gravel path, which was heated by occasional patches of sunshine. The maximum heat mitigation is observed in the shade of dense and tall vegetation, where the UTCI is reduced by 9.8 °C. Based on the mobile measurements, data of the various green infrastructure arrangements with different micrometeorological characteristics are compared with standardized measurements of a meteorological station located along the measurement route. The comparison with background stations exemplifies the urban heat mitigation potential of parks such as the Botanical Garden in Dresden.

How to cite: Biehl, J. L., Ziemann, A., Queck, R., and Mauder, M.: Influence of urban green infrastructure on thermal stress for humans, EGU General Assembly 2025, Vienna, Austria, 27 Apr–2 May 2025, EGU25-17695, https://doi.org/10.5194/egusphere-egu25-17695, 2025.

EGU25-17996 | ECS | Orals | CL2.3

Exploring the Role of Urban Green Spaces in Microclimate Modeling: Insights from ENVI-met Simulations in Augsburg, Germany 

Jonathan Simon, Jacqueline Oster, and Christoph Beck

Microclimate modeling serves as an indispensable tool for fostering sustainable urban development by quantifying the benefits of green and blue infrastructures. Urban green spaces (UGS) are integral to urban sustainability, acting as ecological refuges and providing essential regulating and cultural ecosystem services. This study presents a novel methodology for microclimate modeling by integrating an extensive tree database of 4,264 public and private urban trees in Augsburg, Germany, into ENVI-met simulations. The database allowed for unprecedented accuracy in representing tree species, heights, and distributions. The research, funded by the German Research Foundation under contract 471909988, focused on an urban park and a nearby residential district to evaluate microclimatic conditions and human thermal comfort under varying scenarios.

A total of sixteen ENVI-met simulation scenarios were developed, incorporating variations in vegetation modeling techniques, forcing methods, topography, spatial resolution, and seasonality. The baseline scenario was validated against in-situ measurements of air temperature (T) and relative humidity (RH) collected at nine representative locations. For a hot summer day in August 2024, scenario performance was analyzed through time series of T and mean radiant temperature (MRT) and spatial distributions of the Universal Thermal Climate Index (UTCI) at the pedestrian level.

The analysis revealed a consistent overestimation of T (Bias: from +0.66°C to +1.85°C) and underestimation of RH (Bias: from -0.89% to -4.73%), especially during daytime hours. Daytime T differences between residential and park sites averaged 1.88°C in the reference data but were underestimated by the baseline scenario (1.21°C) and almost entirely overlooked in the "Simple Plants" approach (0.05°C). Scenarios incorporating finer spatial resolution (1.37°C) and a digital elevation model (1.27°C) provided better approximations of these gradients. Greater variability was observed in MRT and UTCI results, with tree height, species, and vegetation models exerting considerable influence. At 14:00 UTC+1, the largest UTCI reductions (median: -1.51°C) were achieved in the L-tree scenario, which includes only one tree species (Acer platanoides), while the "Simple Plants" approach (+0.91°C) offered minimal thermal comfort improvement compared to the "No Trees" scenario (+1.40°C). Despite domain-wide neutral UTCI effects (-0.05°C) in the medium-high L-tree scenario, areas with the tallest trees experienced significant overestimations exceeding +7°C.

This study highlights the complexities and challenges in simulating urban green infrastructure impacts on microclimates and thermal comfort. It underscores the critical importance of detailed, accurate tree data – including species, heights, and leaf-area density profiles – to produce reliable and actionable microclimate modeling outputs. The findings provide valuable insights not only for climate modellers, but also for urban planners seeking to enhance climate resilience through evidence-based UGS design and management.

How to cite: Simon, J., Oster, J., and Beck, C.: Exploring the Role of Urban Green Spaces in Microclimate Modeling: Insights from ENVI-met Simulations in Augsburg, Germany, EGU General Assembly 2025, Vienna, Austria, 27 Apr–2 May 2025, EGU25-17996, https://doi.org/10.5194/egusphere-egu25-17996, 2025.

EGU25-18008 | Orals | CL2.3

Impact of longer Drought Periods on Climate in Greater Vienna 

Philipp Weihs, Heidelinde Trimmel, Sabina Thaler, Josef Eitzinger, Stephan Hörbinger, Hans-Peter Rauch, Jürgen Preiss, David Wöss, Tobias Pröll, Herbert Formayer, Imran Nadeem, Max Wittkowsky, Robert Schoetter, Valéry Masson, Aurélien Mirebeau, and Aude Lemonsu

The Imp_DroP project deals with the effects of climate change-related dry periods on ground temperatures and water requirements for irrigation in Vienna. The focus of the study is to examine the effects of cooling on the climate of the following components:

  • a) Evaporative cooling by  irrigated agricultural regions
  • b) Evaporative cooling in urban Vienna (especially green roofs)
  • c) Anthropogenic heat reduction

To quantify the effects of these mitigation measures, part of the project consisted of experimental studies: evaporation and precipitation, runoff, growthrate were recorded for two seasons with 10 lysimeters on four green roofs with different urban climates. The in-situ measurement data served as input for the modeling tasks. In a second step, anthropogenic heat emissions were quantified. For this purpose, data from E-Control was used, the energy consumption was broken down in time and space for selected periods and the anthropogenic heat flow was calculated for various scenarios.

Based on all these results, SURFEXv9/TEB was used to examine the local effects of building envelopes, green roof construction, irrigation, tree shade and vegetation in the canyon, traffic heat reduction and other possible climate mitigation measures on indoor, roof and canyon thermal conditions. Anthropogenic heat can lead to local increases in air temperature of up to 2 °C. Reducing anthropogenic heat by reducing traffic, increasing the contribution of renewable local energy production and improving building insulation can reduce air temperature to this extent. Tree shade can reduce the thermal comfort index UTCI by 4 ° during noon. Full irrigated low vegetation can cool between 1-3 °UTCI throughout the day.

The coupled urban climate model WRF-TEB was used to simulate the current and future climate in the greater Vienna area. Climate scenarios suggest that climate change could lead to a temperature increase of around 3.8 °C by mid-century if no significant action is taken.  Remedial measures related to irrigation of the agricultural areas east of Vienna (Marchfeld) can lead to a reduction in the maximum temperature, especially close to the irrigated area. A maximum reduction of only 0.2 °C can be achieved for the entire city, while in the districts of Vienna closer to Marchfeld the reduction can even be up to 0.4 °C. However, if all possible cooling measures are implemented to the maximum, a maximum cooling of 1.5 °C can be achieved.  However, exhausting all adaptation measures cannot compensate for the warming induced by climate change while seriously challenging the water supply of Greater Vienna.

How to cite: Weihs, P., Trimmel, H., Thaler, S., Eitzinger, J., Hörbinger, S., Rauch, H.-P., Preiss, J., Wöss, D., Pröll, T., Formayer, H., Nadeem, I., Wittkowsky, M., Schoetter, R., Masson, V., Mirebeau, A., and Lemonsu, A.: Impact of longer Drought Periods on Climate in Greater Vienna, EGU General Assembly 2025, Vienna, Austria, 27 Apr–2 May 2025, EGU25-18008, https://doi.org/10.5194/egusphere-egu25-18008, 2025.

EGU25-18592 | Orals | CL2.3

A multi-scale approach combining MOLOCH and PALM-4U for simulating urban micro-meteorology in an italian neighborhood 

Tony Christian Landi, Luca Mortarini, Oxana Drofa, Edoardo Fiorillo, Daiane de Vargas Brondani, and Daniela Cava

City development has significantly transformed local climate conditions, modified wind patterns, and variations in altered air quality. These transformations have important consequences for human health, energy usage, and environmental sustainability. Improvements in Computational Fluid Dynamics (CFD) modeling have offered essential tools for examining the intricate nature of urban microscale processes. These allow researchers to replicate airflow around structures, winds at pedestrian levels, and the spread of pollutants with high spatial detail, considering turbulence movements. In the Large-eddy simulation (LES) model, the significant turbulent eddies are explicitly resolved and modeled. Since a proper definition of urban morphology has been recognized as vital to improve model efficiency, reliable numerical simulations at the local level necessitate a suitable fine-scale depiction of the urban fabric.

This study employs LES simulations to characterize the daily cycle of key micro-meteorological parameters at high spatio-temporal resolution over the Bolognina district during summertime under high-pressure conditions. Situated within the municipality of Bologna, Bolognina exemplifies many urbanisation features typical of Italian cities. For the first time, PALM-4U was implemented using off-line nesting within the GLOBO-BOLAM-MOLOCH modeling system. It is important to highlight that the MOLOCH meteorological model, specifically developed for the Italian peninsula, provides highly accurate mesoscale predictions compared to other state-of-the-art models such as COSMO and WRF. This accuracy is particularly critical when using MOLOCH as a meteorological driver for LES urban simulations, where precise mesoscale input as well as high-quality urban morphological data significantly influence the results.

To develop the static driver for Bolognina, diverse data sources—such as remote sensing, municipal datasets, and open-access data—were utilized. Additionally, a dedicated census was conducted for privately-owned trees. In total, over 5,000 trees, both public and private, were cataloged within a 1 km² area. 

The experiment was conducted over a three-day period, from August 23 to 25, 2023, under weather conditions characterized by clear skies, calm winds, and strong daytime insolation - ‘ideal’ for the development of the Urban Heat Island (UHI). This case study primarily serves to assess the numerical stability of the novel meteorological dynamic driver. Additionally, the impact of different pavement types on micrometeorological profiles and on the partitioning of available energy at the surface was analysed to investigate how materials with varying heat capacities and urban vegetation can enhance or mitigate the UHI effect and the thermal comfort.

How to cite: Landi, T. C., Mortarini, L., Drofa, O., Fiorillo, E., de Vargas Brondani, D., and Cava, D.: A multi-scale approach combining MOLOCH and PALM-4U for simulating urban micro-meteorology in an italian neighborhood, EGU General Assembly 2025, Vienna, Austria, 27 Apr–2 May 2025, EGU25-18592, https://doi.org/10.5194/egusphere-egu25-18592, 2025.

EGU25-19081 | Orals | CL2.3

Exploring indoor thermal comfort and CO₂ concentrations observations in Amsterdam 

Esther Peerlings and Gert-Jan Steeneveld

Climate change is projected to raise the frequency of heat events, triggering also enhanced indoor heat loads for urban dwellers. However, understanding of the climatology of indoor environments in existing residences remains limited. Establishing and maintaining long-term and systematic networks recording indoor temperatures is both challenging and costly, making such networks scarce. This study uses a unique dataset collected through weather stations that we placed in 93 residences in Amsterdam, the Netherlands, since 2022 as part of a citizen science project. We aim to observe and analyse indoor air temperature, humidity and CO2 concentrations through indoor placed Netatmo weather stations in bed and living rooms. From these observations, we also estimate the thermal comfort indices PMV (predicted mean vote) and the Dutch GTO (weighted temperature threshold exceedance hours). We report on the climatology, variability and exceedance of limit values for these observed and estimated variables during the summer seasons May-September of 2023 and 2024.

During a warm period from 1 to 15 September 2023, which included a regional heatwave, the median and 95th percentile (P95) of the daily maximum indoor air temperatures observed in both the bedrooms and living rooms within this professional network were 25.4 °C and 27.8 °C, respectively. For comparison, the WHO recommends a comfortable indoor air temperature range of 18-24 °C. The corresponding median and P95 of the daily maximum CO2 concentrations observed in the bedrooms were 882.9 ppm and 1223.6 ppm, respectively. Ideally, indoor CO2 concentrations should remain close to the outdoor CO2 concentration of 420 ppm. Regarding thermal comfort, the corresponding median and P95 of the estimated PMV in the living room were 1.10 and 1.30, respectively, indicating a slightly warm thermal sensation. Similarly, the corresponding median and P95 of the estimated GTO in the living room were 2.3 hours and 879.1 hours, respectively. That means that 5% of the residences exceeded the annual 900-hour threshold for GTO within just 2 weeks.

Additionally, we will also present preliminary findings on how house characteristics (e.g., energy label, window orientation, room volume, etc.) may explain indoor air temperature characteristics. This study contributes to understanding the health risks and cooling demands faced by residents of Amsterdam in their homes.

How to cite: Peerlings, E. and Steeneveld, G.-J.: Exploring indoor thermal comfort and CO₂ concentrations observations in Amsterdam, EGU General Assembly 2025, Vienna, Austria, 27 Apr–2 May 2025, EGU25-19081, https://doi.org/10.5194/egusphere-egu25-19081, 2025.

The thermal performance of vertical greenery systems (VGSs) in indoor/outdoor environments has been extensively studied; nevertheless, spatiotemporal observational experiments of VGSs at block-scale are scarce, with the evapotranspiration and cooling potential of VGSs in response to urban morphology remaining unclear. Therefore, scaled outdoor experiments were conducted to thoroughly investigate the effects of VGSs on the wind, radiation, and thermal parameters in urban blocks with plan area index (λp) of 11% and 25% in the temperate region of Xingtai, China. Additionally, the evapotranspiration effect of VGSs in urban blocks was further quantified. VGSs reduce wind speed in the crossroads by 26% in the block with λp=25%, but no significant effect for λp=11%. Compared with non-VGS cases, VGS cases absorb more shortwave radiation and emit less longwave radiation, resulting in more net radiation capture and lower albedo. VGS cases experience significant temperature reductions in wall (Tw), indoor, canyon air (Ta), and ground (Tg), as well as mean radiant temperature (Tmrt) and physiological equivalent temperature (PET). The south walls in blocks with λp=11% and 25% show the best cooling effect, with maximum reductions of 22.2 and 18.4 °C at 0.1 m height, respectively, while the north walls show weaker cooling. The east and south streets experience better air and ground cooing than the crossroads. In the south street of blocks with λp=11% and 25%, the maximum reductions of Ta are 1.5 and 3.9 °C, and of Tg being 7.4°C and 9.0 °C, respectively. VGSs in urban block with λp=11% have a greater evapotranspiration rate than that with λp=25%. Thus, block with λp=11% achieve more pronounced cooling effects on walls and indoor air, whereas block with λp=25% exhibit better air and ground cooling due to lower wind speed. Moreover, the reductions in Tmrt and PET in block with λp=25% are 36.7 and 20.2 °C, respectively, significantly higher than those with λp=11%.

Keywords: Vertical greenery systems; Scaled outdoor experiments; Plan area index; Cooling potential; Evapotranspiration rate

How to cite: Xiaona, Z. and Jian, H.: Effects of vertical greenery systems on microclimate in urban blocks with different plan area indices: Scaled outdoor experiments, EGU General Assembly 2025, Vienna, Austria, 27 Apr–2 May 2025, EGU25-19887, https://doi.org/10.5194/egusphere-egu25-19887, 2025.

EGU25-21872 | ECS | Posters on site | CL2.3

Design of a biometeorological observation network following environmental justice guidelines for urban spaces - a case study in Dortmund, Germany 

Charlotte Hüser, Vanessa Reinhart, Panagiotis Sismanidis, Luise Weickhmann, Jonas Kittner, and Benjamin Bechtel

Climate change presents significant challenges for urban areas, with heat waves posing a critical threat to urban resilience and liveability. Urban stakeholders must adopt data-driven approaches to ensure equitable transformation of urban spaces while addressing environmental justice challenges. This study examines the distribution and quality of green spaces in Dortmund, Germany, through the lens of environmental justice, focusing on their societal value, accessibility, and role in mitigating heat exposure for vulnerable populations.

The study further assesses the contribution of the Data2Resilience (D2R) biometeorological observation network, designed to provide high-resolution, near-surface climate data, to support equitable climate resilience efforts in Dortmund. Building on prior analyses of green space availability in Dortmund, we integrate demographic and vulnerability data to identify deficiencies in green space distribution and quality, where we include demand and supply criteria and quality characteristics, such as recreational features and noise pollution. The findings are synthesized into comprehensive maps, offering insights into environmental inequalities across Dortmund’s districts.

We found disparities in green space distribution and quality, with socioeconomically disadvantaged districts often underserved. The findings underscore the need for targeted interventions to enhance green space accessibility and functionality, emphasizing their role in fostering environmental justice and climate resilience. Further the D2R network’s spatial distribution contributes to the increased representation and visibility of vulnerable and undersupplied hot spots in Dortmund and therefore builds a foundation for the application of data-driven actions and measures towards an environmental just urban space.

How to cite: Hüser, C., Reinhart, V., Sismanidis, P., Weickhmann, L., Kittner, J., and Bechtel, B.: Design of a biometeorological observation network following environmental justice guidelines for urban spaces - a case study in Dortmund, Germany, EGU General Assembly 2025, Vienna, Austria, 27 Apr–2 May 2025, EGU25-21872, https://doi.org/10.5194/egusphere-egu25-21872, 2025.

EGU25-181 | ECS | Posters on site | CL2.4

Shifting Seasons, Rising Risks: Spring Frost Predictions for Pedunculate Oak in Hesse, Germany 

Bella Luca Smekal, Bernd Ahrends, Maximilian Axer, Johannes Sutmöller, and Henning Meesenburg

Advanced bud burst in deciduous trees extends the growing season to an earlier date, increasing their vulnerability to spring frost damage. Such frost events, though understudied in current research, can cause long-term damage by compromising the recovery capacity of trees and adding stress to their carbon and water balance. The resilience of pedunculate oak (Quercus robur L.) to the increasingly dry and warm climate positions them as crucial tree species in the planning of climate-adapted forests. Understanding the balance between drought resilience and frost vulnerability is essential for informed decisions about future forest management strategies. In this study, we used a dense monitoring network of phenological observations to i) highlight a significant increase in spring frost risk in recent years and ii) calibrate two phenological models and apply them to the output of seven coupled RCP8.5 climate projections. The models predict a mean advance in oak bud burst by 2-2.7 days per decade, consistent with a 2 days per decade advance observed historically. Despite the general warming trend, last spring frost events have not preponed to earlier dates in the observations. This is probably linked to stable high-pressure systems in spring with enhanced radiative cooling at the surface during the night. However, the projections fail to accurately capture the last frost, likely linked to a known weakness in blocking events. Consequently, we suggest that future frost risk may be underestimated in current projections.

How to cite: Smekal, B. L., Ahrends, B., Axer, M., Sutmöller, J., and Meesenburg, H.: Shifting Seasons, Rising Risks: Spring Frost Predictions for Pedunculate Oak in Hesse, Germany, EGU General Assembly 2025, Vienna, Austria, 27 Apr–2 May 2025, EGU25-181, https://doi.org/10.5194/egusphere-egu25-181, 2025.

Climate change is one of the greatest challenges facing the agricultural sector in the 21st century. In recent decades, extreme heat, uncharacteristic for Latvia, prolonged drought, particularly in spring, and extremely heavy rainfall in the second half of summer have significantly impacted the development of cereals. An example is May 2023, which was the driest May in the history of observations in Latvia. The aim of the study was to describe how uncharacteristic weather conditions caused by climate change impact the phenology and yield stability of summer barley (Hordeum vulgare L.) in two distinct locations, Priekuli (climate type—Dfb) and Stende (climate type—Cfb), from 2000 to 2023. Spring barley in Latvia is usually sown in late April or early May. The analysis of the data revealed a moderately close relationship between the average air temperature in April and the barley sowing time in both Priekuli and Stende. For the most part, in years when the average air temperature in April has been higher, sowing has begun earlier. Early varieties typically require a minimum of 90 days from sowing to full maturity, whereas late varieties usually need an average of 100 to 110 days. However, in certain years, both early and late varieties have experienced a significantly shorter growing season. Years where the average air temperature during the growing season exceeds the norm typically witness a shorter growing season. This was the case, for example, in 2010, 2018, and 2021, when none of the varieties in Priekuli exceeded 89 days between sowing and full maturity. The data from the study show that if the transition from the vegetative growth phases to the generative growth phases occurred very rapidly, the plants had a low tillering rate, there were few productive stems, and the plants were short; hence, the yields were also low. For instance, in 2021, the variety ‘Ansis’ in Priekuli yielded 2.72 t ha-1, approximately twice as low as in years when the weather was optimal for development. If drought and heat accelerate the development of cereals, then frequent precipitation and lower air temperature during the ripening period hinder the onset of full ripeness. Observing adverse weather conditions, such as heavy rainfall, during the full ripeness stage delays harvesting and deteriorates crop quality, as demonstrated in 2017. Based on the results obtained, it is possible to select varieties and breeding lines that, regardless of the influence of weather conditions on the length of the growing season, maintain relatively high yield stability and good yield quality. An analysis of the 24-year data series shows that the increasingly frequent uncharacteristic weather conditions affect the phenology of spring barley. Furthermore, the study results do not show regional differences, as the impact of extreme weather conditions is similar at both observation locations.

How to cite: Dzedule, L., Kalvane, G., and Legzdina, L.: Impact of uncharacteristic weather conditions on the phenology and yield stability of spring barley (Hordeum vulgare L.) in Latvia: a 24-year study (2000–2023), EGU General Assembly 2025, Vienna, Austria, 27 Apr–2 May 2025, EGU25-2233, https://doi.org/10.5194/egusphere-egu25-2233, 2025.

EGU25-4238 | ECS | Posters on site | CL2.4

Variability of autumn tropical Pacific yellowfin tuna tied to the spring North Atlantic Tripole  

Gongjun Zhang and Jianping Li

Climate change affects the spatial distribution and abundance of yellowfin tuna (Thunnus albacares, YFT) in the tropical Pacific, yet the mechanisms linking remote climate modes to YFT dynamics remain unclear. This study finds that the variability of autumn tropical Pacific YFT is tied to the spring sea surface temperature anomalies (SSTAs) of the North Atlantic Tripole (NAT), mediated by the Victoria Mode (VM), the second dominant mode of North Pacific SSTAs variability. The result shows that the spring NAT is significantly positive correlated with the subsequent autumn tropical Pacific YFT catch per unit effort (CPUE). The spring NAT triggers eastward-propagating Rossby waves, inducing VM-like SST anomalies (SSTAs) in the North Pacific. These anomalies modify YFT habitat conditions in the tropical Pacific through coupled oceanic-atmospheric bridge (COAB) mechanism, ultimately affecting autumn CPUE. This study unveils a teleconnection-driven mechanism influencing tropical Pacific YFT CPUE, with important implications for fisheries management and forecasting. 

How to cite: Zhang, G. and Li, J.: Variability of autumn tropical Pacific yellowfin tuna tied to the spring North Atlantic Tripole , EGU General Assembly 2025, Vienna, Austria, 27 Apr–2 May 2025, EGU25-4238, https://doi.org/10.5194/egusphere-egu25-4238, 2025.

EGU25-5103 | Posters on site | CL2.4

Exploring the control of diurnal cycles on chilling and forcing accumulation in tree bud dormancy release 

Yann Vitasse, Günter Hoch, Steeve Pepin, and Francesco Giardina

Cold temperatures (known as ‘chilling’) are perceived by tree buds in winter and are responsible for dormancy release after species-specific exposure times, which marks the start of the buds' sensitivity to warmer temperatures (known as ‘forcing’). Temperate trees are also sensitive to changing daylength, but it remains unresolved whether the accumulation of chilling and forcing is related to the diurnal cycle. This study explores whether trees "count" chilling based on night/day cycles rather than purely through temperature accumulation or exposition, and whether forcing temperatures are more effective during daylight.

We harvested twigs from four temperate tree species with contrasting chilling and forcing requirements for dormancy release in late November 2024 , i.e. before they would experience significant periods of cold. Twig cuttings were then placed into transparent boxes filled with water and kept in climate chambers at 2°C/4°C (night/day) under three diurnal cycles: 12h/12h, 6h/6h (2 cycles per day), and 4h/4h (3 cycles per day) for one month (short chilling) or two months (long chilling). After these six treatments, all cuttings were transferred to forcing conditions with 12h daylight under two temperature regimes: 10°C/25°C and 15°C/20°C, i.e. with the same mean temperature but warmer or colder temperature during daytime. The timing and success of bud break were visually monitored twice a week.The experiment is ongoing. We hypothesize that chilling accumulation is influenced by diurnal cycles, with faster dormancy release for twigs exposed to shorter diurnal cycles. Additionally, we anticipate that daytime temperatures play a more significant role in forcing accumulation, leading to faster budburst in the 10°C/25°C treatment compared to the 15°C/20°C, especially for species known to be photoperiodic sensitive such as European beech. 

Our study will provide insights into how trees perceive and respond to temperature in relation to daylight, which is crucial for understanding and predicting phenological responses accurately in the context of climate change.

How to cite: Vitasse, Y., Hoch, G., Pepin, S., and Giardina, F.: Exploring the control of diurnal cycles on chilling and forcing accumulation in tree bud dormancy release, EGU General Assembly 2025, Vienna, Austria, 27 Apr–2 May 2025, EGU25-5103, https://doi.org/10.5194/egusphere-egu25-5103, 2025.

EGU25-5852 | ECS | Orals | CL2.4

Spring Phenology Models for Temperate Apple Cultivars 

Thomas Ohnemus, Simon Paasch, and Hannes Mollenhauer

The annual dormancy cycle of apple trees is highly temperature dependent, with photoperiod deemed irrelevant for dormancy induction or breaking. In fall, cold days induce endodormancy. Endodormancy, in turn, is overcome by further accumulation of chill, when a cultivar-specific chill requirement is met. To further overcome ecodormancy, a cultivar-specific heat requirement must be met, allowing for bud break and subsequent phenology phases to occur. Thus, compared to species where photoperiod is relevant for the dormancy cycle, apple tree dormancy and spring phenology phases are especially susceptible to climate change.

Chill and heat requirements reported in the literature vary between cultivars, within cultivars with location and even for the same cultivar and location depending on the methodological approach. This is, inter alia, related to an imprecision regarding terminology. The minimum chill and heat to respectively overcome endodormancy and ecodormancy are referred to as chill requirement and heat requirement. Yet, studies often report a chill or heat accumulation that – if a phenological phase occurred – at least met the respective requirement. Thus, the existing literature can provide approximations of the actual chill and heat requirements. However, a large database of phenology observations might include instances at the limit for the occurrence of specific phenological phases. Thus, such a database may most accurately approach a cultivar’s actual chill requirement.

In this work we capitalize on a phenology database by the German Weather Service (DWD) that is openly available. This database entails over 50,000 observations for each bud break, bloom start and full bloom spanning the years 1996 to 2024. While there are data on over 60 apple cultivars, we deemed the data for 23 cultivars sufficient for model development. As source for temperature data, we used a temperature grid with 1x1 km spatial resolution developed by the DWD. As underlying modelling approach, we used the chill overlap model. This model is not merely fitting data statistically, but provides a biological meaningful framework.

This biological footing is crucial to extrapolate findings to different climatic conditions. Therefore, the spring phenology models developed in this work will allow to predict onset of spring phenology phases in a warmer future. Consequently, in the future the risk of late frost events or the risk of approaching climatic conditions that will hinder bud break can be investigated for each cultivar. Thus, a cultivar-specific risk assessment regarding likely future conditions can inform planting decisions.

How to cite: Ohnemus, T., Paasch, S., and Mollenhauer, H.: Spring Phenology Models for Temperate Apple Cultivars, EGU General Assembly 2025, Vienna, Austria, 27 Apr–2 May 2025, EGU25-5852, https://doi.org/10.5194/egusphere-egu25-5852, 2025.

EGU25-7960 * | Posters on site | CL2.4 | Highlight

PEP725: Celebrating 15 Years of this Phenological Research Infrastructure 

Hans Ressl, Markus Ungersböck, and Thomas Hübner

Phenology—the study of the timing of seasonal activities of animals and plants—provides a vital window into ecological responses to climate change (IPCC 2007). Since its inception 15 years ago, PEP725, the Pan-European Phenological Database, has developed into an essential resource for phenological research across Europe.

With support from ZAMG / now Geosphere Austria, the Austrian Ministry of Education, Science and Research, and EUMETNET, PEP725 has built an open-access database that now boasts over 13 million phenological records across many countries of Europe - all classified with a single scale. These records, which trace back to 1775, offer a unified and comprehensive view of phenological observations across Europe. The project continues to overcome challenges posed by disparate data sources and formats, enabling harmonized, large-scale studies and fostering international collaboration.

Throughout its evolution, PEP725 has faced and overcome many challenges, from the integration of different datasets to the creation of a focal point and collaboration platform for European phenological research. PEP725 enables large-scale studies and fostering international cooperation. Since its’s beginning user engagement has steadily increased, with registrations and data downloads reaching new highs, and the database has supported an impressive number of peer-reviewed publications, demonstrating its scientific impact.

In this presentation, we will present the current status of PEP725, including milestones achieved, lessons learnt and challenges encountered along the way. Moreover, we want to express our gratitude to all our indispensable project partners who have accompanied us along the way. We are also pleased to provide an insight into the development of our new website, which aims to improve usability and widen access to this invaluable resource.

How to cite: Ressl, H., Ungersböck, M., and Hübner, T.: PEP725: Celebrating 15 Years of this Phenological Research Infrastructure, EGU General Assembly 2025, Vienna, Austria, 27 Apr–2 May 2025, EGU25-7960, https://doi.org/10.5194/egusphere-egu25-7960, 2025.

EGU25-8123 | Posters on site | CL2.4

The phenological information in the Annual Bulletin of Climate Information of the Meteorological Service of Catalonia 

Montserrat Busto, Jordi Cunillera, Xavier de Yzaguirre, Marc Prohom, Antonio Barrera-Escoda, and Mònica Herrero

The Meteorological Service of Catalonia (SMC) publishes regularly the Annual Bulletin of Climate Indicators with the aim to communicate the state of the climate in Catalonia based on the climate series, the series of sea temperature and sea level, and the phenological series, all of them managed by this institution.

The Annual Bulletin of Climate Indicators (known by the acronym 'BAIC' according to its name in Catalan) has eight chapters: air temperature (data from 27 climate series), precipitation (data from 72 climate series), extreme climate indices (based on Expert Team on Climate Change Detection and Indices standards), synoptic patterns (surface and 500 hPa), phenology (information from the Phenological Network of Catalonia), insolation (data from 8 series), secular observatories (information from specific observatories in Catalonia with more than 100 years of daily data) and sea (one series of sea temperature at different depths, mean sea level and sea storms), apart from the introduction, the executive summary (key points of the bulletin) and the references.

The SMC created the Phenological Network of Catalonia (Fenocat) in 2013, a citizen science network where 79 observers monitor 25 plant species, 14 bird species and 6 butterflies. 37 of these observers have registered information from the very beginning of the Fenocat, and the results shown are based mostly on their information.

The phenology chapter of the Annual Bulletin of Climate Information describes the state of the phenological network, explains the most characteristic features of the phenological situation during the last year and shows the evolution of the onset of the main phenophases from 2013 to the present, as well as the intra-annual variability. Tables are also provided with the value of the trend and its statistical significance.

The main results of the latest BAIC will be shown, providing examples of graphics, charts and tables used to convey these results to the society, with the main goal of reporting the state of the climate to the society in the clearest and most rigorous way possible.

How to cite: Busto, M., Cunillera, J., de Yzaguirre, X., Prohom, M., Barrera-Escoda, A., and Herrero, M.: The phenological information in the Annual Bulletin of Climate Information of the Meteorological Service of Catalonia, EGU General Assembly 2025, Vienna, Austria, 27 Apr–2 May 2025, EGU25-8123, https://doi.org/10.5194/egusphere-egu25-8123, 2025.

EGU25-8512 | ECS | Orals | CL2.4

Dynamics in non-structural carbohydrates of trees might influence the variation of leaf phenology 

Yunpeng Luo, Constantin Zohner, Thomas W. Crowther, Günter Hoch, Andrew D. Richardson, Yann Vitasse, and Arthur Gessler

Plant phenology is a key driver of plant growth and ecosystem-climate interactions, influencing canopy structure, surface albedo, and carbon and water fluxes. While the effects of environmental factors on phenology are well-documented, less attention has been given to intrinsic plant physiological processes. Non-structural carbohydrates (NSC), including sugars and starch, are essential for growth, metabolism, and osmotic regulation, serving as indicators of carbon availability. They reflect the balance between photosynthetic carbon supply (source activity) and the demands of growth and respiration (sink activity), suggesting that NSCs may influence phenological stages such as spring leaf-out and autumn senescence. However, the relationship between NSC dynamics in various plant organs and leaf phenology remains poorly understood.

By synthesizing current knowledge on the interplay between NSCs and leaf phenology, we outline seasonal NSC variations in deciduous and evergreen species. We further propose hypotheses on their interactions with phenological stages, namely leaf-out and autumn leaf senescence, and assess their alignment with existing conceptual carbon allocation models. To address existing gaps, we advocate for integrating NSC dynamics into carbon allocation models by leveraging insights from manipulative experiments, multi-scale observational networks, and remote sensing. These approaches will enable a more comprehensive understanding of NSC-phenology relationships across spatial and temporal scales. This could help us improve the modelling of plant phenology responses and carbon dynamics in diverse ecosystems.

How to cite: Luo, Y., Zohner, C., W. Crowther, T., Hoch, G., D. Richardson, A., Vitasse, Y., and Gessler, A.: Dynamics in non-structural carbohydrates of trees might influence the variation of leaf phenology, EGU General Assembly 2025, Vienna, Austria, 27 Apr–2 May 2025, EGU25-8512, https://doi.org/10.5194/egusphere-egu25-8512, 2025.

EGU25-11008 | ECS | Orals | CL2.4

Premature leaf senescence in temperate trees is strongly driven by pre-solstice heat and drought while post-solstice effects disappeared over recent decades 

Dominic Rebindaine, Thomas W. Crowther, Lidong Mo, and Constantin M. Zohner

Over recent decades, autumn leaf senescence of temperate deciduous trees has generally been delayed. Whilst post-summer solstice warming slows the progression of senescence, pre-solstice warming has been shown to advance senescence onset by increasing developmental rates. Severe heat and drought events, which have been increasing in frequency and intensity, can also advance senescence through stress. Yet, it remains unclear whether premature senescence is primarily driven by faster development or by climatic stress, limiting accurate projections of future premature leaf senescence frequencies. We analysed leaf senescence observations for four dominant deciduous tree species (horse chestnut, silver birch, European beech, and English oak) across >3000 sites in central Europe from 1951–2023. For all species, the proportion of premature senescence events (occurrences within the earliest 5% percentile) has slightly decreased over time (trend: -0.11-0% yr-1). Pre-solstice climate variables had the largest effects on premature senescence likelihood, with post-solstice effects diminishing over time. Pre-solstice growing degree days were the most influential factor, associated with a 30-40% increase in premature senescence likelihood per standard deviation (sd) increase. Nighttime temperatures were as important as daytime temperatures. Leaf-out date was the next most significant factor (25% increase per sd). Water deficit had smaller effects (5-12% sd-1), aligning with our experimental results showing that drought conditions do not cause premature senescence when nutrient availability is high. These results suggest that pre-solstice developmental processes exert a larger effect on premature senescence than summer climatic stress. Nevertheless, ongoing early-season warming and the increasing frequency of heatwaves and droughts is likely to intensify premature leaf senescence in European trees. Such shifts could have key impacts on biogeochemical cycles and community interactions within forest ecosystems.

How to cite: Rebindaine, D., W. Crowther, T., Mo, L., and M. Zohner, C.: Premature leaf senescence in temperate trees is strongly driven by pre-solstice heat and drought while post-solstice effects disappeared over recent decades, EGU General Assembly 2025, Vienna, Austria, 27 Apr–2 May 2025, EGU25-11008, https://doi.org/10.5194/egusphere-egu25-11008, 2025.

EGU25-11953 | ECS | Posters on site | CL2.4

Spatial shifts of seasonal vegetation cycles in Europe over time 

Juliane Brügelmann, Josephin Kroll, and René Orth

Seasonal cycles of vegetation functioning are changing as a consequence of climate change. For example, a widespread greening of the northern hemisphere is observed, with an earlier start of the growing season and a later end of the growing season in some regions. However, in other regions, the growing season is actually ending earlier due to water limitations or more frequent extremes.

In this study, we focus on Europe and calculate seasonal cycles of vegetation indices at each grid cell during a past time period, and determine where most similar seasonal cycles are observed during a more recent time period. This way, we examine how the seasonal vegetation cycle at grid cells has shifted in space over the past decades by analyzing satellite-derived Leaf Area Index (LAI) data. The spatial shift is calculated for each grid cell as the difference between the locations with (i) most similar seasonal cycles during 2010-2018 and (ii) most similar seasonal cycles during 1982-1989. Similarity is assessed based on the RMSE between the seasonal cycles. First results show a widespread eastward and northward shift of seasonal cycles across Europe. The variability of determined shifts is high across regions. Calculations of spatial shifts using MODIS LAI data during more recent time periods are used to validate the long-term results. Finally, we compare the determined spatial shifts to respective trends in hydro-meteorological conditions. 

Our detection of large-scale shifts in seasonal vegetation cycles can help to better understand vegetation response and adaptation to global change, and thereby improve the prediction of future shifts.

How to cite: Brügelmann, J., Kroll, J., and Orth, R.: Spatial shifts of seasonal vegetation cycles in Europe over time, EGU General Assembly 2025, Vienna, Austria, 27 Apr–2 May 2025, EGU25-11953, https://doi.org/10.5194/egusphere-egu25-11953, 2025.

EGU25-12319 | Orals | CL2.4

 Late frosts weaken spring leaf onset carryover effect on autumn senescence  

Sofia Bajocco, Carlotta Ferrara, Lorenzo Crecco, Simone Bregaglio, and Marco Bascietto

Frosts occurring after spring leaf onset significantly jeopardize tree growth, forest productivity, and ecosystem functions. As the climate warms, earlier leaf onset has become increasingly common, exposing plants to heightened risks of frost damage. However, the impacts of spring frosts occurring after leaf onset on later senescence phenology in deciduous forests remain largely unexplored. Using 20 years of remotely sensed phenology data, we demonstrate that, in European beech forests, late spring frost events disrupt predictable patterns of leaf onset and senescence, weakening the carryover effect between the start and end of the growing season. Interestingly, the frequency and intensity of these frost events did not significantly exacerbate this disruption. In contrast, favorable summer conditions were found to partially restore the natural interdependency between leaf onset and senescence. Our findings reveal how plant phenology is profoundly affected by climate change not only as an emerging process but also in terms of its internal dynamics. We aspire for our study to lay the groundwork for highlighting the key role of biological start-end of season carryover effects in the phenology responses to climate change, advocating for their incorporation into the development of phenology models.

How to cite: Bajocco, S., Ferrara, C., Crecco, L., Bregaglio, S., and Bascietto, M.:  Late frosts weaken spring leaf onset carryover effect on autumn senescence , EGU General Assembly 2025, Vienna, Austria, 27 Apr–2 May 2025, EGU25-12319, https://doi.org/10.5194/egusphere-egu25-12319, 2025.

EGU25-12728 | ECS | Orals | CL2.4

Evaluation of high-resolution imagery for monitoring the flowering of holm oak trees 

Ana Calbet, Mª Pat Gonzalez-Dugo, M. Dolores Carbonero, Alma Mª García-Moreno, María J. Muñoz-Gómez, and Ana Andreu

The Mediterranean oak savanna is Europe's most extensive agroforestry system, with significant economic, social, and ecological relevance. Climate models indicate that the Mediterranean region is particularly vulnerable to the impacts of global warming, which include increased frequency and severity of droughts. Consequently, there is a pressing need for conservation measures to prevent the degradation of this ecosystem, reduce uncertainty about production, and ensure its sustainable development. One of the most valuable resources of this system is the acorn of holm oaks, which significantly contributes to the quality of extensive livestock products. The intensity of oak flowering is a key factor limiting maximum acorn production, and it is usually monitored by visual sampling in the field, a costly and time-consuming method. To address this challenge, this study aims to evaluate the potential of remote sensors onboard UAVs (unmanned aerial vehicles) and high-resolution satellite sensors for monitoring the flowering of holm oak trees. This approach aims to scale up the monitoring effort, simultaneously providing valuable information to many farmers.


Previous works have explored the use of digital cameras for monitoring phenology, particularly in combination with airborne data. Gómez-Giráldez et al. (2021) proposed an index designed to automatically quantify the male flowering intensity of holm oaks based on the closeness to pure yellow in RGB images captured by UAVs. This index showed sufficient accuracy in differentiating between various flowering intensity levels and providing intensity maps. However, the index requires further validation before it can be applied on a larger scale. 


This study extends the validation of the proposed index using UAV data and high-resolution satellite imagery. It was conducted on six plots located in southern Spain. During 2022 and 2024, 11 images were taken over the three previously studied plots and three additional plots to enhance the validation. The results indicated that trees with lower flowering intensity were concentrated in areas with higher yellow distances, which confirmed previous results. However, due to the high phenological variability among individuals, we observed the importance of synchronizing the image acquisition date with the peak flowering period. Two high-quality orthoimages with a resolution of 1.5 m were acquired from the SPOT 6 satellite in 2024 to extend the methodology to larger areas and provide intensity maps. 


The expanded evaluation and visual verification showed promising results. The index, which can be derived using just an RGB image, shows potential for future applications related to phenology and productivity. Furthermore, developing an automated tool for this task would be beneficial in covering large areas and improving the representativeness of the estimates.

How to cite: Calbet, A., Gonzalez-Dugo, M. P., Carbonero, M. D., García-Moreno, A. M., Muñoz-Gómez, M. J., and Andreu, A.: Evaluation of high-resolution imagery for monitoring the flowering of holm oak trees, EGU General Assembly 2025, Vienna, Austria, 27 Apr–2 May 2025, EGU25-12728, https://doi.org/10.5194/egusphere-egu25-12728, 2025.

In the Piedmont region, located in northwestern Italy, meteorological data are available from two regional databases: the stations belonging to the agrometeorological network (RAM) and those belonging to the regional meteorological service (ARPA). The former are located in areas of agricultural interest, and the latter everywhere. By combining the two series, and adopting interpolation procedures for missing or unmeasured data, it was possible to reconstruct a complete database of hourly observations in the period 2004-2024 relating to the following quantities: temperature, humidity and pressure at the screen level, precipitation, solar radiation, and wind speed in about fifty stations located in the most renowned wine-growing areas. These data were integrated with the soil texture values ​​available in the SoilGrids database, which is a system for digital soil mapping based on a global compilation of soil profile data and environmental layers. Although the period does not have the necessary temporal dimension (30 years) to be considered strictly climatic, its length is sufficient to be able to make some preliminary considerations in this sense. Using the above mentioned data, it was possible to perform twenty-year simulations on each station using the land surface model UTOPIA (University of TOrino land surface Process Interaction model in Atmosphere), in order to obtain the energy and mass fluxes in the vegetation layer, and the subsoil temperatures and humidity in the root layer. In turn, the inputs and outputs of the previous simulations were used to perform further simulations with the crop growth model IVINE (Italian Vineyard Integrated Numerical model for Estimating physiological values), in order to obtain the trend of the main pheno-physiological parameters for each station in the twenty-year period considered. During the presentation, the evolution over the period of some variables relevant to vineyard cultivation practices will be shown, such as some components of the energy and hydrological balances (such as heat fluxes and evaporation), temperatures and humidity of the subsoil, as well as the main phenological phases and some physiological values ​​(sugar content, mass, yield, ...) in a selection of stations showing the most significant results.

How to cite: Cassardo, C. and Andreoli, V.: Behavior of pheno-physiological parameters and surface-layer variables on vineyard environments in Piedmont (Italy) using numerical models, EGU General Assembly 2025, Vienna, Austria, 27 Apr–2 May 2025, EGU25-13031, https://doi.org/10.5194/egusphere-egu25-13031, 2025.

Vegetation spring phenology in arid mountain regions is undergoing profound changes as a result of recent climate anomalies. While shifts in the timing of growth onset have been widely attributed to temperature and precipitation, interacting effects of these two climate variables on phenology have not been explored. To better understand whether an interaction between temperature and precipitation may be present, and how it may affect phenology, we first determined the influence of preseason temperature and precipitation on the starting date of vegetation growing season (SOS), and then investigated the spatial pattern of climatic sensitivity of SOS and its relation to preseason temperature/precipitation. We used satellite-derived estimates of SOS for the Qilian Mountains (QLMs) in northwestern China. Our results revealed a significant interaction between temperature and precipitation, contributing up to 30% of total variability in predicted ecosystem-level SOS. This interacting effect was likely achieved through the influence on climatic sensitivity of SOS; we found a close relationship between temperature sensitivity and preseason cumulative precipitation, and a significant association between precipitation sensitivity and preseason temperatures. Spatially, SOS was more sensitive to variability in preseason temperature in wetter than in dryer areas; likewise, a spatial increase in thermal accumulation often corresponded to an enhancement in precipitation sensitivity of SOS. These findings highlight the importance of interacting effects of climatic variables in model projections of future spring phenology, and indicate that unexpected shifts in vegetation phenology in response to climatic extremes may occur under the influence of strong interactions of climatic factors.

How to cite: He, Z.: Interacting effects of temperature and precipitation on climatic sensitivity ofspring vegetation green-up in arid mountains of China, EGU General Assembly 2025, Vienna, Austria, 27 Apr–2 May 2025, EGU25-14181, https://doi.org/10.5194/egusphere-egu25-14181, 2025.

Climate change has caused asynchronous phenological shifts between most plants and their pollinators, resulting in an earlier or later appearance of peak flowering relative to peak pollinator abundance. The fitness impact of these two mismatch patterns may not be simply equivalent, but the information has so far been limited. To explore how differently plant fitness responds to the distinct mismatch patterns, we conducted a seed-setting comparative study at the individual level in an alpine grassland community in the Qilian Mountains of China. By monitoring flowering abundance and insect visits, we measured the phenological matching relationship between plants and their key pollinators, and evaluated the impact of mismatches on plant productivity. We found that the pattern of “pollinator peaks earlier” accounted for a relatively high proportion in the natural community, with a significantly stronger fitness impact on plants than that of the “flower peaks earlier” pattern. The asymmetry in the fitness impacts between phenological mismatch patterns is related to the length of flowering period. Specially, the shorter the flowering duration, the greater the difference in influence between the two patterns. Our results suggest that plants with shorter flowering periods may be confronted with more severe pollination limitations if climate warming cause insects to forage further ahead. Therefore, the asymmetric effects of phenological mismatch patterns should be considered in phenological models to improve the predictive performance of plant responses to climate change.

How to cite: Du, J.: Pollinator peaking earlier than flowering is more detrimental to plant fecundity, EGU General Assembly 2025, Vienna, Austria, 27 Apr–2 May 2025, EGU25-14304, https://doi.org/10.5194/egusphere-egu25-14304, 2025.

EGU25-16191 | ECS | Posters on site | CL2.4

Northern Phenology Under Climate Warming: Evaluating TRENDY Models Against Remote Sensing Data with the Plant Phenology Index 

Hanna Marsh, Hongxiao Jin, Zheng Duan, and Wenxin Zhang

Phenology, encompassing the timing of the start, end, and duration of the growing season, is influenced by climate warming in northern regions. Altered phenological patterns carry significant implications for the global carbon cycle by disrupting the seasonal balance between gross primary productivity (GPP) and ecosystem respiration and complicating vegetation reproductive cycles. However, many current Earth system models, including those used in the “Trends and drivers of the regional scale terrestrial sources and sinks of carbon dioxide” (TRENDY) project, may inadequately capture recent phenological trends in northern ecosystems (Sitch et al., 2024). In this study, we aim to present a comprehensive analysis of phenology patterns across northern latitudes (>45°N) over the past two decades, using outputs from twelve state-of-the-art vegetation models included in the TRENDY project. These outputs, along with the TRENDY model ensemble average, are intercompared with a remote sensing-based phenology dataset derived using the Plant Phenology Index (PPI) and MODIS data. Compared with the in-situ measurements, the PPI has demonstrated improved accuracy in capturing northern phenology, particularly for boreal evergreen forests, by reducing the confounding effects of snowmelt and soil background signals (Jin et al., 2017). Furthermore, the PPI has proven effective in estimating large-scale GPP across diverse northern ecosystems, providing a robust benchmark for evaluating the performance of vegetation models (Marsh et al., 2024). We further examine the primary climatic drivers of phenological shifts (air temperature, precipitation and radiation) and assess the extent to which TRENDY models capture these drivers and the associated phenological responses to climate warming. Our findings highlight the current gap between model projections and observed phenology, offering insights into the limitations of current carbon cycle models in representing northern ecosystem dynamics. Our study contributes to advancing our understanding of the roles of northern ecosystems in the global carbon cycle.

References

Jin, H., Jönsson, A. M., Bolmgren, K., Langvall, O., & Eklundh, L. (2017). Disentangling remotely-sensed plant phenology and snow seasonality at northern Europe using MODIS and the plant phenology index. Remote Sensing of Environment198, 203-212.

Marsh, H., Jin, H., Duan, Z., Holst, J., Eklundh, L., & Zhang, W. (2025). Plant Phenology Index leveraging over conventional vegetation indices to establish a new remote sensing benchmark of GPP for northern ecosystems. International Journal of Applied Earth Observation and Geoinformation136, 104289.

Sitch, S., O’sullivan, M., Robertson, E., Friedlingstein, P., Albergel, C., Anthoni, P., ... & Zaehle, S. (2024). Trends and drivers of terrestrial sources and sinks of carbon dioxide: An overview of the TRENDY project. Global Biogeochemical Cycles38(7), e2024GB008102.

How to cite: Marsh, H., Jin, H., Duan, Z., and Zhang, W.: Northern Phenology Under Climate Warming: Evaluating TRENDY Models Against Remote Sensing Data with the Plant Phenology Index, EGU General Assembly 2025, Vienna, Austria, 27 Apr–2 May 2025, EGU25-16191, https://doi.org/10.5194/egusphere-egu25-16191, 2025.

EGU25-16628 | Orals | CL2.4

Plant macrophenological dynamics - variations in plant group behaviour revealed by citizen science data 

Karin Mora, Michael Rzanny, Jana Wäldchen, Hannes Feilhauer, Claudia Guimarães-Steinicke, Teja Kattenborn, Guido Kraemer, Patrick Mäder, Daria Svidzinska, Sebastian Wieneke, Sophie Wolf, and Miguel D. Mahecha

Phenological changes are key indicators of climate change. While most studies focus on individual species, plant macrophenology examines large-scale patterns and processes in the timing of plant life cycle events, such as flowering, across extensive spatial and temporal scales. Traditional methods often struggle to capture the complexity of these patterns. To address this, we developed a pioneering methodological approach using nonlinear dimension reduction [1], which effectively extracts spatio-temporal patterns from large and diverse phenological datasets.

Our approach reveals ecological gradients that capture underlying structures and relationships missed by linear methods [1,2]. A primary objective is to quantify synchronised behaviour across thousands of plant species, offering insights into the collective responses of plant communities to climate variability and change. By identifying and analysing synchronisation patterns, we aim to detect shifts in plant phenology and understand their broader ecological impacts

We demonstrate the versatility of our approach by applying it to datasets collected by citizen scientists using mobile applications such as Flora Incognita [3], a plant identification app. Additionally, we explore phenological changes across annual cycles and propose linking these findings to large-scale measurements such as eddy covariance and satellite data.

Incorporating citizen science datasets enhances the resolution and accuracy of our analyses, enabling robust conclusions about the impact of climate variability on plant phenology. This framework advances plant macrophenology, providing researchers with practical tools to quantify and monitor climate change effects on plant life cycles.

[1] Mora et al. (2024) Methods Ecol Evol, http://doi.org/10.1111/2041-210X.14365
[2] Mahecha et al. (2021) Ecography, 44: 1131-1142 https://doi.org/10.1111/ecog.05492
[3] Mäder et al. (2021) Methods Ecol Evol, 12: 1335-1342 https://doi.org/10.1111/2041-210X.13611

How to cite: Mora, K., Rzanny, M., Wäldchen, J., Feilhauer, H., Guimarães-Steinicke, C., Kattenborn, T., Kraemer, G., Mäder, P., Svidzinska, D., Wieneke, S., Wolf, S., and Mahecha, M. D.: Plant macrophenological dynamics - variations in plant group behaviour revealed by citizen science data, EGU General Assembly 2025, Vienna, Austria, 27 Apr–2 May 2025, EGU25-16628, https://doi.org/10.5194/egusphere-egu25-16628, 2025.

EGU25-16936 | Posters on site | CL2.4

Predicting Climatic Niche Shifts and Future Range Dynamics of Antarctic Rock-Dwelling Lichens Under Climate Change Scenarios 

Anna Götz, Mikhail Andreev, Lea Maislinger, Leo Sancho, Wolfgang Trutschnig, and Ulrike Ruprecht

Saxicolous lecideoid lichens form a major part of the existing terrestrial vegetation in Antarctica. Lichens are formed by an association between a fungal (mycobiont) and a photosynthesizing (photobiont) symbiont. Adapted to extreme habitats, their distribution is primarily determined by macroclimatic conditions, with climate change presenting a significant challenge to these specialized organisms. In our study we assessed the current climatic niches of 9 circumantarctic mycobiont species and their associated photobiont OTUs and predicted the niche shifts of this species under two contrasting climate forcing scenarios (RCP2.6 and RCP8.5).

Our findings do not indicate a distinct climatic differentiation between the current niches of the symbiont pairs. However, the changes in potential niche areas suggest a general trend of niche expansion for all species under both climate scenarios (RCP2.6 andRCP8.5). For each species, the projected area gain is predicted to exceed the corresponding area losses due to climate warming. The niche expansion is primarily driven by the shift of niches inland, as new areas become suitable. While newly exposed rock surface due to snowmelt may contribute to the niche expansion for specific species on the Antarctic Peninsula, the overall impact on the continental Antarctic is insignificant. Our analysis indicates a general increase of niche overlap between species across all regions, except in the maritime Antarctic, where the complete loss of species niches was predicted. A broader pattern emerges in which regions with higher probable species richness are expected to shift inland, while coastal areas are likely to experience a decline in species numbers.

How to cite: Götz, A., Andreev, M., Maislinger, L., Sancho, L., Trutschnig, W., and Ruprecht, U.: Predicting Climatic Niche Shifts and Future Range Dynamics of Antarctic Rock-Dwelling Lichens Under Climate Change Scenarios, EGU General Assembly 2025, Vienna, Austria, 27 Apr–2 May 2025, EGU25-16936, https://doi.org/10.5194/egusphere-egu25-16936, 2025.

EGU25-17138 | ECS | Orals | CL2.4

Seasonal warming and global land surface phenology 

Jelle Lever, Luis Gilarranz, Petra D'Odorico, Achilleas Psomas, Christian Ginzler, Stefan Simis, Alexander Damm, Arthur Gessler, Daniel Odermatt, and Yann Vitasse

Emerging evidence suggests that temperature increases due to climate change not only differ strongly between regions but also across seasons. As a rule of thumb, one could argue that colder seasons (e.g., winter) tend to warm up faster than warmer seasons, although there are notable exceptions to this rule (e.g., due to changes in the polar vortex). The implications of such seasonal differences in warming trends for plant phenology, i.e., the timing of key events during the plant seasonal cycle, however remain poorly understood. A gap in knowledge that arises, in part, because we lack a global overview of the period(s) of the year during which changing temperatures impact on the phenological cycle of plants the most.

Here, we provide a global analysis of the interrelationships between seasonal temperature changes and global land surface phenology using satellite data from the period 2001-2019. More specifically, we determined the annual period of highest correlation between temperature fluctuations and the onset of different phenological stages within a 100km radius around 10.000 point locations. We found that, across most of the Northern Hemisphere’s mid and high latitudes, a wide range of these stages, i.e., from the onset of ‘greenup’ to ‘greendown’, correlate strongly with temperature fluctuations during roughly the same period of the year, i.e., up until a few weeks before or after the onset of greenup. We found that warming rates during this period were roughly 1.5-2.5 times faster than regional mean annual temperature increases, which, in turn, were roughly 1.5-2.0 times faster than the increase in global mean annual temperature (which includes air above the oceans).

When assessing the impact of global mean annual temperature changes on global land surface phenology, it is thus crucial to consider seasonal differences in warming. These differences are likely to affect not only plant phenology but also many other key processes related to plant growth and development.

How to cite: Lever, J., Gilarranz, L., D'Odorico, P., Psomas, A., Ginzler, C., Simis, S., Damm, A., Gessler, A., Odermatt, D., and Vitasse, Y.: Seasonal warming and global land surface phenology, EGU General Assembly 2025, Vienna, Austria, 27 Apr–2 May 2025, EGU25-17138, https://doi.org/10.5194/egusphere-egu25-17138, 2025.

EGU25-17199 | ECS | Orals | CL2.4

Accounting for overwintering life-histories in an online pest risk assessment tool 

Paul Brett, Tamara Hochstrasser, Klara Finkele, Padraig Flattery, Barry Coonan, Catriona Duffy, Deborah Hemming, Neil Kaye, Conor McGee, and Jon Yearsley

The OPRAM (Online Pest Risk Analysis Model) project is developing an open source web application, which will be used in guiding risk assessment and surveillance of high priority plant pests across Ireland. Current models predict the timing of adult emergence during the year using an accumulative growing degree day model, but overwintering is not typically included (for example : https://www.usanpn.org/vis-tool). The inclusion of overwintering is particularly important when predicting a plant pest’s end-of-year phenology and for making predictions across multiple years.

We developed template models for the three main overwintering life-histories for insects. Quiescence implies that an insect may be present all year round if temperatures are high enough;e.g.  Spodoptera frugiperda may not reach the required threshold.. In addition, the inclusion of the fractional number of generations per year is especially important as it indicates regions which maybe close to completing a generation based on the threshold rather than presenting a null value.

The inclusion of obligate and facultative diapause imply the season will end earlier due to the decrease in photoperiod or because of the combined effects of photoperiod and temperature for species like Leptinotarsa decemlineata and Oulema melanopus. This would impact the overall risk assessment depending on how many generations of a species may appear during the year and the mitigative measures undertaken. For instance, Ips typographus, has greater damage if a second generation were to emerge. If diapause were not ncluded in these models then this variation in year-to-year seasonal length may not be captured. 

We give examples for six template species: Agrilus anxius, Spodoptera frugiperda, Leptinotarsa decemlineata, Oulema melanopus, Ips typographus and Halyomorpha halys. We used mean temperature and photoperiod from the Republic of Ireland from 1961 until present. Future climate scenarios were incorporated using projections across three RCP scenarios (RCP 26, 45 & 85) across two future periods : 2021 – 2050 and 2041 – 2070. 

Future climate scenarios indicate that more generations will occur; where for instance, Agrilus anxius would increase from three generations to four generations as its season is solely temperature based. Whereas, other such as Leptinotarsa decemlineata that undergo obligative diapause may not have an increase in generations as a decrease in photoperiod serves as a limiting factor for their length of season. While for Halyomorpha halys, no generations would appear despite the warmer conditions. 

The goal of this project is to have an open access web application that could then be developed further in the future. This readily could serve as a template for initiatives in other countries. This online tool will provide the decision support to allow actions to be taken in the event of high risk of the modelled pest and can be expanded to if a new pests that may emerge over time in the Republic of Ireland. 


How to cite: Brett, P., Hochstrasser, T., Finkele, K., Flattery, P., Coonan, B., Duffy, C., Hemming, D., Kaye, N., McGee, C., and Yearsley, J.: Accounting for overwintering life-histories in an online pest risk assessment tool, EGU General Assembly 2025, Vienna, Austria, 27 Apr–2 May 2025, EGU25-17199, https://doi.org/10.5194/egusphere-egu25-17199, 2025.

EGU25-18180 | ECS | Posters on site | CL2.4

Exploring the relationships between ground observations and remotely sensed hazelnut spring phenology 

Mara Di Giulio, Sofia Bajocco, Mohamed Sallah Abdullah, and Simone Bregaglio

Crop phenology is very important in regular crop monitoring. Generally, phenology is monitored through field observation surveys or satellite data. The relationships between ground observations and remotely sensed derived phenological data can enable near-real-time monitoring over large areas, which has never been attempted on hazelnuts. In this study, we extracted phenological metrics derived from MODIS Enhanced Vegetation Index (EVI) in hazelnut production regions and compared them with the spring ground phenological data (BBCH scale) from orchards located in the same area of Turkey over the period from 2019 to 2022. We observed a specific temporal dynamic between remote sensing phenometrics and ground observations. The metrics Greenup, Upturning Date, and Threshold 20% metrics corresponded to the early of EVI growth and were synchronous with the female flowering of hazelnut and ending before bud break. The metrics Threshold 50% and Start of season were associated with the steepest portion of the EVI curve, i.e., canopy greening and thickening, and occurred between ovaries enlargement and leaves unfolding. The metrics Peak of Season, Stabilization Date, and Maturity corresponded to the end of spring vegetative growth. The main outcomes are that (i) female flowering occurred before 20% of vegetation development (BBCH 64P occurred about one month before Threshold 20%), (ii) phenometrics from satellite remote sensing (i.e., Upturning Date and Threshold 20%) well-reflected leaf emergence (rs = 0.30 and rs = 0.32, respectively; p < 0.05) and unfolding (rs = 0.35 and rs = 0.39, respectively; p < 0.05), and (iii) cluster appearance temporally aligned with the peak of the EVI curve (Stabilization Date and BBCH 71P differed by around 4 days). Our method is transferable to operational phenology monitoring, and future applications will consider the senescence season and the effect of environmental variability on the comprehension of vegetation dynamics.

How to cite: Di Giulio, M., Bajocco, S., Abdullah, M. S., and Bregaglio, S.: Exploring the relationships between ground observations and remotely sensed hazelnut spring phenology, EGU General Assembly 2025, Vienna, Austria, 27 Apr–2 May 2025, EGU25-18180, https://doi.org/10.5194/egusphere-egu25-18180, 2025.

EGU25-2289 | ECS | Posters on site | CL2.5

Can we take student-based data rescue to the next level by engaging secondary school students across Europe and the world? 

Kevin Healion, Simon Noone, and Peter Thorne

Over the past three years, tens of thousands of early African meteorological observations have been successfully digitised from the ACMAD collection. This is thanks to the Climate Data Rescue Africa Project (CliDaR-Africa) carried out by second year geography students as part of their Methods of Geographical Analysis module in Maynooth University. However, hundreds of millions of observations remain in image format from this collection, and billions more from numerous other archives around the world. To attain the quantum of rescue required the next logical step is to adapt the CliDaR-Africa Project for students at secondary level education across Europe and eventually the world. In this presentation we will outline what would be required to make this data rescue in the secondary school classroom a reality and some of the likely benefits for students. Students from Maynooth university who have already taken part in the CliDar-Africa Project have indicated that they have gained increased climate literacy and a range of useful skills from undertaking the activity. We are confident that, suitably tailored, it could benefit secondary level students in a similar way. Moreover, it is envisaged that the CliDar-Africa Project will directly make impactful social change by allowing young people to become involved in a real-world climate data project, allowing them to make a meaningful difference to others in less developed countries, while increasing their own knowledge on the challenges we face due to climate change. Novel participatory learning experiences should not be confined to the university sector alone. Suggestions and help in turning this from an ambition to a reality will be gratefully received.

How to cite: Healion, K., Noone, S., and Thorne, P.: Can we take student-based data rescue to the next level by engaging secondary school students across Europe and the world?, EGU General Assembly 2025, Vienna, Austria, 27 Apr–2 May 2025, EGU25-2289, https://doi.org/10.5194/egusphere-egu25-2289, 2025.

ROPEWALK, funded by the AP Møller Mærsk Fund, is a joint initiative of the Danish National Archive and the Danish Meteorological Institute, which aims at digitizing and transcribing all weather observations in Danish ship journals and logbooks stored in the Danish National Archive, consisting of more than 750 shelf metres beginning as early as the 1680s. With the exception of the Napoleonic wars and Danish state bankruptcy in 1814, the data is complete.

Ship journals over large parts of the Northern Hemisphere are kept in the archive, with two regions of particular interest, Greenland and the Øresund:

The Greenlandic Trade Company had a monopoly for commerce with the colony of Greenland for nearly 200 years, and foreign ships would not be allowed to call a port. The company conducted these "Greenland Voyages" to western Greenland several times per year, starting as early as 1721 and through the 1930s. Weather observations from these voyages often include detailed sea ice observations.

Every ship passing the sound or belts in Denmark had to pay for passage between 1426 and 1857. To ensure payment, Danish war ships were placed at strategic locations near Copenhagen, Helsingør and Nyborg. Weather observations on board of these ships go back to the end of the Little Ice Age. In several cases, observations were conducted every time the ship bell was struck, resulting in as many as 48 observations in the course of a single day. 

The scanning of the original logbooks and ship journals by the National Archive in highest possible resolution took 13 person-years, resulting in 2.1 million images covering more than 2.5 TB of data.  Up to roughly 1750, the data consists of diary-like daily note in free text. Starting in the 1710s, observations are recorded as numbers in preprinted tables. We have transcribed this latter dataset, constructed a data model, trained a machine learning algorithm and conducted quality control. Free text data will be considered later.

First results will be presented. All transcribed data will be made publicly available and can be used for future research or as input for reanalysis projects.

How to cite: Stendel, M., Kronegh, A. J., and Skov, E. H.: First results from ROPEWALK (Rescuing Old data with People's Efforts: Weather and climate Archives from LogbooK records) - the digitization project for three centuries of weather observations on board of Danish ships, EGU General Assembly 2025, Vienna, Austria, 27 Apr–2 May 2025, EGU25-2772, https://doi.org/10.5194/egusphere-egu25-2772, 2025.

EGU25-8786 | Posters on site | CL2.5

The ReData project: involving citizen scientists in the recovery and digitization of historical daily weather bulletins 

Alessandro Ceppi, Yuri Brugnara, Gabriele Buccheri, Goffredo Caruso, Luca Cerri, Maria Di Giovanni, Marco Giazzi, Ludovico Lapo Luperi, Veronica Manara, Luca Ronca, and Maurizio Maugeri

In recent decades, numerous climate data digitization projects have been initiated in many countries worldwide. These projects aim to preserve data recorded in paper documents, which are vulnerable to deterioration, and to make them accessible to the scientific community to improve the accuracy of climatological studies and historical reconstructions for specific events. In this context, global reanalysis data sets play a crucial role, as their accuracy directly depends on the homogeneity and spatial distribution of the historical observational data on which they are based.

This study aims to design a new framework for the ReData (Recovery of Data) project, launched by the Meteonetwork Association in 2017. The project leverages the potential of Citizen Science, and it was upgraded in 2024 on the online platform Zooniverse, which engages volunteers in scientific research activities.

The project’s objective is to digitize the meteorological data collected by the Italian Royal Central Meteorological Office (RCMO) from 1879 to 1940 for issuing its daily meteorological bulletin. The network used for this bulletin started with 11 meteorological stations and rapidly expanded to approximately 70 within a few decades. By utilizing telegraph technology, real-time observations were transmitted to the Central Office in Rome, enabling the publication of the Daily Meteorological Bulletin, which also included observations from foreign stations, representing one of the earliest steps toward international atmospheric monitoring.

Currently, the daily RCMO bulletins available to the project cover the period from December 1879 to December 1934, while the remaining years still require scanning. In total, 55 years of data are accessible, encompassing 20,120 daily bulletins. Since the bulletins were scanned page by page, over 84,000 scans have been performed. Considering the number of meteorological variables recorded in the bulletins—which increased over time—it is possible to estimate the amount of data that could potentially be digitized through ReData. The result is impressive: over 20 million data points.

Following an in-depth analysis of the evolution of these bulletins, both in terms of the monitoring stations considered and the meteorological variables observed, this study presents the design of the project’s website, structured to facilitate the digitization process for users. In addition, the potential applications of the digitized data are explored, presenting a case study for the year 1882 that has already been entirely digitized: a synoptic reconstruction of the flood event that affected the Polesine area in northeastern Italy in September 1882. This disaster, caused by persistent heavy rainfall, led to severe flooding in the Veneto region, particularly along the Po and Adige rivers. This latter overflowed in Verona, causing extensive damage, including the collapse of the Ponte Nuovo bridge. The bulletins provide valuable information about the event, revealing particularly rainy conditions that worsened mid-month.

Such reconstruction demonstrates how the project has significant cultural and scientific value, offering benefits to students, researchers, institutions, and weather services. It addresses the lack of a comprehensive historical observational network of synoptic stations in Italy, adding critical data to reanalysis models and advancing studies of past and present climate trends.

How to cite: Ceppi, A., Brugnara, Y., Buccheri, G., Caruso, G., Cerri, L., Di Giovanni, M., Giazzi, M., Lapo Luperi, L., Manara, V., Ronca, L., and Maugeri, M.: The ReData project: involving citizen scientists in the recovery and digitization of historical daily weather bulletins, EGU General Assembly 2025, Vienna, Austria, 27 Apr–2 May 2025, EGU25-8786, https://doi.org/10.5194/egusphere-egu25-8786, 2025.

EGU25-9581 | ECS | Posters on site | CL2.5

MeteoSaver: a new machine-learning based software for transcription of historical weather data 

Derrick Muheki, Bas Vercruysse, Krishna Kumar Thirukokaranam Chandrasekar, Christophe Verbruggen, Julie M. Birkholz, Koen Hufkens, Hans Verbeeck, Pascal Boeckx, Seppe Lampe, Ed Hawkins, Peter Thorne, Dominique Kankonde Ntumba, Olivier Kapalay Moulasa, and Wim Thiery

Archives of observed weather data present unique opportunities for scientists to obtain long time series of the historical climate for many regions of the world. Unfortunately, most of these observational records are to-date available only on paper, and thus require digitization and transcription to facilitate analysis of climatic trends. Here we present a new open-source software, MeteoSaver, that uses machine learning (ML) algorithms to transcribe handwritten records of historical weather data. MeteoSaver version 1.0 processes images of tabular sheets alongside user-defined configuration settings, performing transcription through five sequential steps: (i) image pre-processing, (ii) table and cell detection, (iii) transcription, (iv) quality assessment and quality control, and (v) data formatting and upload. As an illustration and evaluation of the software, we apply MeteoSaver to ten pictured sheets of handwritten temperature observations from the Democratic Republic of the Congo. The results show that 95-100% of the records can be transcribed, of which a median of 74.4% reached the highest internal quality flag and 74% matches with the manually transcribed record, yielding a median mean absolute error of 0.3°C. These results illustrate that MeteoSaver can be applied to a range of handwriting styles and varying tabular dimensions, paper sizes, and maintenance conditions, highlighting its potential for transcribing tabular meteorological observations from multiple regions, especially if the sheets have a consistent format. Overall, our open-source software can help address the challenges of limited available hydroclimatic data within many regions of the world, by helping to save millions of handwritten records of historical weather data presently stored in archives, and expedite research on the climate and environmental changes in data scarce regions.  

How to cite: Muheki, D., Vercruysse, B., Chandrasekar, K. K. T., Verbruggen, C., Birkholz, J. M., Hufkens, K., Verbeeck, H., Boeckx, P., Lampe, S., Hawkins, E., Thorne, P., Ntumba, D. K., Moulasa, O. K., and Thiery, W.: MeteoSaver: a new machine-learning based software for transcription of historical weather data, EGU General Assembly 2025, Vienna, Austria, 27 Apr–2 May 2025, EGU25-9581, https://doi.org/10.5194/egusphere-egu25-9581, 2025.

EGU25-10009 | Posters on site | CL2.5

The citizen-science project Cli-DaRe@School: engaging high school students in digitizing data from historical meteorological observations in Italy 

Veronica Manara, Michele Brunetti, Maria Carmen Beltrano, Giacomo Bertoldi, Yuri Brugnara, Daniele Cat Berro, Alessandro Ceppi, Alice Crespi, Federico Mattia Stefanini, Francesco Sudati, Dino Zardi, and Maurizio Maugeri

Cli-DaRe@School is a citizen science project with the main goal of digitizing ancient and unexploited Italian meteorological observations still available only on paper or as scanned images of original records or published yearbooks. Launched in spring 2022 as a long-term coordinated initiative of the Italian Association of Atmospheric Sciences and Meteorology (AISAM) engaging a variety of researchers, as well as their affiliation Institutions, and high-school students and teachers.

During the first year the project focused on the target of four comprehensive monographs published by the Italian Hydrographic Service including about 6000 records of monthly temperature and precipitation data for the Italian territory. The temperature data cover the timespan 1926-1955 while the precipitation data refer to the years before 1950. A team of 334 students from 10 high schools in Italy was engaged. Each school was assigned pdf files containing the scanned pages to digitize, along with spreadsheet templates for data entry, and related tutorials. The person-hours dedicated to data digitization were about 4000, making about 4000 scanned pages digitized. Students had also the opportunity to join a training program offered by the project consisting of seminars explicitly meant for them. The goal of the seminar was to allow students to delve into various aspects of climate change and meteorology, and specific activities aimed to make them aware of the potentialities of the recovered data. Cli-DaRe@School is a remarkable citizen-science initiative for two main reasons: on one side it demonstrates the potentialities of high school students in providing an enormous contribution to rescue past meteorological data and making the freely available on open-access repositories, and on the other side bears a great educational added value, offering young students an easy hands-on experience with climate data and making them more aware of how science investigates past climatic trends.

At the end of the first year, we submitted a questionnaire to both students and teachers to probe their satisfaction with the project activities and gather suggestions for the following years. The questionnaire highlighted a good level of satisfaction for the teachers and a higher satisfaction for the students who explicitly chose to participate in the project with respect to those who participated as a class group and the most critical point resulted the number of hours dedicated to the digitization.

The quality check of the digitized data is performed partially automatically by means of an R code and partially manually and it is almost finished for the period 1921-1950, whereas it is still in progress for the previous years. Station metadata turned out to be a frequent source of errors, while the digitized precipitation and temperature data exhibited a very low fraction of errors. Currently, the activities to include the newly rescued records by populating already existing databases of long-term Italian precipitation and temperature series are in progress, and we aim to release the digitized data as open source in the next months.

How to cite: Manara, V., Brunetti, M., Beltrano, M. C., Bertoldi, G., Brugnara, Y., Cat Berro, D., Ceppi, A., Crespi, A., Stefanini, F. M., Sudati, F., Zardi, D., and Maugeri, M.: The citizen-science project Cli-DaRe@School: engaging high school students in digitizing data from historical meteorological observations in Italy, EGU General Assembly 2025, Vienna, Austria, 27 Apr–2 May 2025, EGU25-10009, https://doi.org/10.5194/egusphere-egu25-10009, 2025.

EGU25-11077 | Posters on site | CL2.5

Dieci e Lode: Climate Data from Former Italian Colonies and their Digitalization 

Michele Brunetti, Marina Baldi, Maria Carmen Beltrano, Eva De Vecchis, Fabio Leali, Samuele Giampietro, Luigi Iafrate, Veronica Manara, Sergio Pisani, Federico Stefanini, Francesco Sudati, Dino Zardi, Alessia Tadiello, Maurizio Maugeri, and Alessandro Ceppi

Dieci e Lode is a cooperative project involving researchers from various affiliations under the umbrella of the Italian Association of Atmospheric Sciences and Meteorology (AISAM). The project aims to rescue and digitize data from meteorological observations made in former Italian colonies and territories. 

Indeed, in the history of meteorology, Italy had a pivotal role in the development of observations, from the invention of some of the most important instruments to the establishment of the first international network of observations. Therefore, a huge heritage of enormously valuable data has been accumulated in many Italian archives over the past three centuries; however, despite many projects that have contributed to rescuing a significant part of this heritage, a substantial number of data archives remains available only on paper, which unfortunately is exposed to deteriorating over time, risking the loss of data and information of inestimable value for scientific research as well as for a variety of applications in the field of meteorology and climate, including the assessment of climate change.

Among those still to be recovered, a very significant fraction is represented by data from former Italian colonies or territories ruled by Italy, in different periods, between the late 19th century and the early 20th century (such as Eritrea, Somalia, Ethiopia, Libya, Dodecanese, Albania, Dalmatia, and Istria).

Hence, the present project aims to conduct a detailed search of meteorological information available for these regions during the periods mentioned above.

The main source will be the National Meteorological Archive of the Council for Research in Agricultural Economy (CREA) in Rome, specifically the Historical Central Library of Italian Meteorology.

The project will also pursue an extensive photographic scanning aimed at publishing online images of the data sheets and volumes; the overall number of pages expected to be scanned is approximately 40,000.

The project represents a significant step towards understanding the climate of the past in those Regions that still lack a large archive of past meteorological data. In particular, these data are of great importance for meteorological offices currently monitoring these territories to place meteorological observations in a longer-term context and, therefore, of greater significance in the study of ongoing climate change.

The investigation will be complemented by case studies aimed at evaluating possible implementations of citizen science activities aimed at extracting numerical series from digitized data sheets available for climatological research, in line with other works led by AISAM (Italian Association of Atmospheric Science and Meteorology), such as the Cli-DaRe@School project, which involves the participation of many Italian schools and hundreds of students. A feasibility study will also be conducted to assess how these activities can be supported by the latest Optical Character Recognition (OCR) technology.

How to cite: Brunetti, M., Baldi, M., Beltrano, M. C., De Vecchis, E., Leali, F., Giampietro, S., Iafrate, L., Manara, V., Pisani, S., Stefanini, F., Sudati, F., Zardi, D., Tadiello, A., Maugeri, M., and Ceppi, A.: Dieci e Lode: Climate Data from Former Italian Colonies and their Digitalization, EGU General Assembly 2025, Vienna, Austria, 27 Apr–2 May 2025, EGU25-11077, https://doi.org/10.5194/egusphere-egu25-11077, 2025.

Scania is the most productive agricultural region in Sweden, located at the southernmost tip of the country, with a mild climate and including areas with very fertile soils. Historical research has shown how pre-industrial grain harvests in Scania benefitted from cooler and wetter summers, particularly during the months of June and July (Skoglund, 2022, 2024). This is in contrast to northern Sweden, where excessive dampness and, in particular, cold conditions during the growing season (April–September) have constituted the main agrometeorological constraints (Edvinsson et al. 2009; Skoglund, 2023).

The city of Lund, situated close to some of the most fertile plains of Scania, is also the location of some of the longest series of daily instrumental meteorological measurements (going back to 1748 for precipitation and 1753 for temperature). In addition, there is a relative abundance of digitized historical harvest data overlapping with the early instrumental period, c. 1750­–1860, when many parts of Sweden, including Scania, experienced what has been described as an ‘agricultural revolution’. However, the early instrumental records from Lund have only been partially digitized and homogenized. This presentation focuses on recent and ongoing research to estimate the impact of drought on agriculture and society in southernmost Sweden during the 18th and 19th centuries using the early instrumental meteorological data from Lund in combination with other historical documentary evidence pertaining to harvests and demographic indicators and tree-ring based hydroclimate reconstructions.


References

Edvinsson, R., Leijonhufvud, L., and Söderberg, J.: Väder, skördar och priser i Sverige, in: Agrarhistoria på många sätt: 28 studier om människan och jorden. Festskrift till Janken Myrdal på hans 60-årsdag, edited by Liljewall, B., Flygare, I. A., Lange, U., Ljunggren, L., and Söderberg, J., pp. 115–136, The Royal Swedish Academy of Agriculture and Forestry, Stockholm, 2009.

Skoglund, M. K.: Climate variability and grain production in Scania, 1702–1911, Climate of the Past, 18, 405–433, 2022.

Skoglund, M. K.: Farming at the margin: climatic impacts on harvest yields and agricultural practices in central Scandinavia, c. 1560–1920, Agricultural History Review, 71, 203–233, 2023.

Skoglund, M. K.: The impact of drought on northern European pre-industrial agriculture, The Holocene, 34, 120–135, 2024.

How to cite: Skoglund, M.: Droughts and their impacts on agriculture and society in southernmost Sweden during the 18th and 19th centuries, EGU General Assembly 2025, Vienna, Austria, 27 Apr–2 May 2025, EGU25-12823, https://doi.org/10.5194/egusphere-egu25-12823, 2025.

EGU25-13448 | Posters on site | CL2.5

Nineteenth century maritime weather data from historical New England whaling ship voyages (1820-1890) 

Caroline Ummenhofer, Neele Sander, Tessa Giacoppo, Finn Wimberly, Bastian Muench, and Timothy Walker

Maritime weather data contained in ship logbooks are used to assess historical changes in global surface wind and precipitation patterns since the early 19th century. We focus on unexploited caches of archival documentation, namely U.S. whaling logbooks of voyages spanning the period 1820 to 1890 from New England archives housed by the New Bedford Whaling Museum, Nantucket Historical Association, and Providence Public Library. The logbooks, often covering multi-year voyages around the globe, contain systematic weather observations (e.g., wind strength/direction, sea state, precipitation, cloudiness) at (sub-)daily temporal resolution. The qualitative, descriptive wind and precipitation recordings by the whalers are quantified and compared with reanalysis products where applicable.

Following extensive quality control, we find overall good agreement in wind strength and direction for the whaling logbook wind records with reanalysis products for mean and seasonal climatologies around the world. Interannual variations in North Atlantic wind fields associated with the North Atlantic Oscillation or changes in characteristics of the Azores High subtropical pressure system are also captured by the whaling ship recordings. Predominant precipitation patterns around the world oceans can be captured and variations across a range of timescales are assessed.

Our results demonstrate that the historical records provide an important long-term context for changing maritime wind and rainfall patterns in remote ocean regions lacking observational records during the 19th century. Challenges and opportunities for data rescue and digitization of maritime weather records in these under-utilized historical ship logbooks for climate purposes will be discussed.

How to cite: Ummenhofer, C., Sander, N., Giacoppo, T., Wimberly, F., Muench, B., and Walker, T.: Nineteenth century maritime weather data from historical New England whaling ship voyages (1820-1890), EGU General Assembly 2025, Vienna, Austria, 27 Apr–2 May 2025, EGU25-13448, https://doi.org/10.5194/egusphere-egu25-13448, 2025.

Extreme windstorms are associated with high wind speeds and are a major source of natural hazard risk with considerable socio-economic impacts. Reported socio-economic impacts include damage to infrastructure, agriculture, forestry, coastal areas, flooding, and loss of lives.  Due to the environmental and socio-economic impacts of extreme windstorms, there is broad interest in understanding the potential impact of climate change on extreme extratropical windstorm activity in the North Atlantic.

One of these severe extratropical windstorms with hurricane-force winds took place on 6 – 7 January 1839, known as ‘Night of the Big Wind’, and is one of the strongest in the instrumental record for Ireland.

Ireland and the UK have a rich heritage of historical documentary (e.g. newspapers, weather diaries) and instrumental meteorological observations, which allows a detailed reconstruction of the impacts of this severe extratropical windstorm. Additionally, a detailed analysis of the documentary sources are important to understand vulnerability, exposure and adaptation to severe extratropical windstorms.

It is crucial to understand how the consequences of this historical windstorm could have been different had it occurred in a warmer present-day and projected warmer climate.

Better knowledge and understanding of such severe historical extratropical windstorms will allow observed trends in windstorms to be put into a longer-term context and improve our understanding of the risks from such events today and in the future in the context of a warmer climate.

How to cite: Mateus, C. and Hawkins, E.: Documentary analysis of the impacts of the storm ‘Night of the Big Wind’ on the 6 – 7 January 1839 in Ireland and the UK, EGU General Assembly 2025, Vienna, Austria, 27 Apr–2 May 2025, EGU25-13736, https://doi.org/10.5194/egusphere-egu25-13736, 2025.

Before the establishment of a weather station network in Japan, European and U.S. naval ships sailed along the region’s coastal waters during the 18th and 19th centuries. Weather records observed using meteorological instruments onboard these ships provide valuable insights into the climate studies before the network’s establishment. These ship log weather records are stored in libraries and archives across various countries. In this study, we focus on the ship log weather records made on vessels sailing along Japan waters during this period. The earliest weather records in the vicinity of Japan were documented aboard the ship of Jame Cook’s third expedition in 1779. Historical tropical cyclone (TC) tracks for the 1850s and 1860s were also identified from these records. We focus on three tropical cyclone (TC) events in the vicinity of Japan during the period from 21 to 25 July 1853 observed by seven US Naval ship of Perry’s Japan Expedition fleet, on 23 and 24 September 1856 observed by Dutch Navy ship Medusa, and on 15 and 16 August 1863 during the bombardment of Kagoshima in Japan observed by eleven UK Navy ships. This research is part of the international data rescue efforts known as the Atmospheric Circulation Reconstructions over the Earth (ACRE) initiative. Data rescue activities in Asia are conducted under ACRE Japan, one of the regional branches of ACRE.

How to cite: Kubota, H., Tsukahara, T., and Matsumoto, J.: Data rescue of instrumental meteorological data records of European and US Naval ship logs sailing along Japan waters during the 1850s and 1860s, EGU General Assembly 2025, Vienna, Austria, 27 Apr–2 May 2025, EGU25-14354, https://doi.org/10.5194/egusphere-egu25-14354, 2025.

EGU25-18487 | ECS | Posters on site | CL2.5

Reconstructing Extreme Weather Events in the Southeastern Iberian Peninsula: Lessons from the Winter of 1944/45 

Amar Halifa-Marín, Carlos Calvo-Sancho, Marcos Gil-Guallar, Alejandro Royo-Aranda, Santiago Beguería, and Sergio M. Vicente-Serrano

This study analyzes temperature and precipitation observations recorded by the network of the Spanish Meteorological Agency (AEMET) in the Segura River Basin (DHS), located in the southeast of the Iberian Peninsula, during the winter of 1944/45. A torrential precipitation event between December 24 and 28 was followed by a snow and extreme cold event between January 11 and 14, with some stations recording over 250 mm during both episodes. Between these events, unusually cold temperature anomalies were observed. This accumulation of extreme weather phenomena had significant socioeconomic impacts, which we documented using regional press sources. These reports describe large areas isolated by snow for weeks, river overflows, disrupted communications, and substantial impacts on economic activities. Using the ERA5 reanalysis, we evaluated the uniqueness of these extreme events, identifying their analogs since 1940 based on surface pressure anomaly patterns, 500 mb geopotential height, and 850 mb temperature. The results show that warmer climatic conditions have reduced the frequency of these events, while intensifying winter precipitation extremes and decreasing the duration and magnitude of cold episodes in the region. This finding aligns with climate change projections for the region during the current century. Through this study, we characterize the dynamics of past extreme weather events in the Mediterranean, contributing to an improved understanding of present and future extreme events.

How to cite: Halifa-Marín, A., Calvo-Sancho, C., Gil-Guallar, M., Royo-Aranda, A., Beguería, S., and Vicente-Serrano, S. M.: Reconstructing Extreme Weather Events in the Southeastern Iberian Peninsula: Lessons from the Winter of 1944/45, EGU General Assembly 2025, Vienna, Austria, 27 Apr–2 May 2025, EGU25-18487, https://doi.org/10.5194/egusphere-egu25-18487, 2025.

There is growing evidence of worldwide increases in magnitude and frequency of large rainstorms driven by global warming-related rises in atmospheric temperature and moisture content and sea surface temperature – and with major consequences for flooding, landslides, soil erosion and sediment transport.  Assessments of the magnitude of recent change, however, are often constrained via comparisons with short periods of pre-1980 daily rainfall data that may not be representative of the pre-global warming era.   Assessment of change in tropical areas is particularly hampered not only by the short and patchy nature of daily records (in terms of continuity, quality and availability), but also by the localized nature of many tropical rainstorm events and the strong influence of locally variant factors (such as coastal and topographic aspect and associated, often diurnally variant, local wind circulations) on large event occurrence.  This paper focuses on methods used in the assembly and analysis of changes in magnitude-frequency, seasonality, areal extent and other characteristics of large ( >50 mm) daily rainstorms in Sabah, Malaysian Borneo, over the past 120 years.  Archival search, detection and transcription of daily data for 1906-1959, together with Malaysian Meteorological Department data since 1960, enabled continuous daily data series to be constructed for three stations of contrasting coastal aspect (Sandakan – N-facing; Kota Kinabalu - W-facing; and Tawau - S-facing). The only gap was during and immediately following the Japanese Occupation during WWII.  Shorter daily rainfall series at other Sabah stations – notably Labuan, Kudat and the inland stations of Danum Valley and Keningau - were also derived and used.  A previous paper (Walsh et al. 2013) analysed changes up to 2012 at individual stations using > 50mm and  >100 mm threshold daily rainfall series and extreme value analysis. The current paper uses novel approaches to refine and extend analysis in four ways.  First, combined data series of the three key stations are used to derive separate datasets of “local” and “multi-site/regional” events for assessment of changes in their frequencies. Second, it uses the N-facing Sandakan and Kudat records to identify (and assess changes in magnitude-frequency) of “Cold Wave” events - characterized by 4-10 successive days of very high rainfall in December or January  and affecting N/NE-facing coastal areas of Sabah and Peninsular Malaysia. The very recent December 2024 event had particularly severe flooding consequences. Third, changes in seasonality of large events are explored via (1) monthly frequency regimes for 1906-40, 1947-79, 1980-99 and 2000-24 and (2) running means of monthly frequencies.  Fourth, when exploring seasonal and annual changes in frequency, the focus is on change in frequencies of different size categories of rainstorm (50-74, 75-99, 100-124, 125-149, 150-174, 175-199 and >200 mm) rather than the hitherto cruder > 50 mm and 100 mm threshold data. Results demonstrate that rises in magnitude-frequency since 1980 are continuing, but where the magnitudes of change vary with season (NE Monsoon, SW Monsoon and Transition Phases}, between stations of different coastal and topographic aspect, between different storm-size categories, and between localized and regional storm types.   

How to cite: Walsh, R., Safjankova, A., Bidin, K., Los, S., and Nainar, A.: Novel approaches in assembling and analysing multi-archive datasets to assess changes in frequency, seasonality and areal extent of large rainstorms in Sabah, Malaysian Borneo 1906-2024 , EGU General Assembly 2025, Vienna, Austria, 27 Apr–2 May 2025, EGU25-19442, https://doi.org/10.5194/egusphere-egu25-19442, 2025.

EGU25-21784 | ECS | Posters on site | CL2.5 | Highlight

Roadmap to discover, transcribe, and analyse early 20th Century weather observations from Singapore, West Malaysia, and northern Sumatra 

Praveen Rao Teleti and Fiona Williamson

Global climate datasets portray an asymmetrical collection of historical observations, a selected few regions and time-periods contribute more than others. For example, observations from Western Europe and North America in the 20th Century are more numerous than all other regions of the globe combined over the same period. Estimation of return period (probability) of any extreme weather events depends on the observation of similar events in the past. Also, observations of past extreme weather events are necessary to understand the severity and scope of future extreme events. Regions newly liberated from colonisation since the end of World War II suffer from much sparser data collection. Here, we present a comprehensive plan to discover, transcribe, and analyse historical weather observations from Singapore, West Malaysia, and northern Sumatra from 1900 to 1960s.Our primary objective is to construct a long time-series of historical instrumental meteorological data and understand extreme climate-induced events, their impacts and associated societal responses in the region. To do so, we utilise varied and diverse sources of information such as weather journals-records, missionary documents and newspapers from the study period. We transform qualitative descriptions of extreme weather conditions into continuous quantitative ordinal-scale climate indices using novel transfer functions for historical climatological data. Finally, these indices will be used to assess resilience of society and local economy to the shocks of prolonged adverse weather events, helping policy makers calibrate policy interventions in the event of extreme weather induced disasters

How to cite: Teleti, P. R. and Williamson, F.: Roadmap to discover, transcribe, and analyse early 20th Century weather observations from Singapore, West Malaysia, and northern Sumatra, EGU General Assembly 2025, Vienna, Austria, 27 Apr–2 May 2025, EGU25-21784, https://doi.org/10.5194/egusphere-egu25-21784, 2025.

EGU25-1048 | ECS | Orals | CL2.6

Winter dense water formation and marine cold spells in the Northwestern Mediterranean: Multi-scale dynamics and implications for dense shelf water cascading 

Helena Fos, Suso Peña-Izquierdo, Sergi Corral, Xavier Durrieu de Madron, Víctor Estella-Pérez, Cristian Florindo-Lopez, Maxime Lagarde, Josep Pascual, Laia Romero, Anna Sanchez-Vidal, and David Amblas

Dense Shelf Water (DSW) cascading in the northwestern Mediterranean Sea is an important winter phenomenon for the ventilation of deep-water ecosystems and modulation of the physical and chemical properties of deep waters. This study combines reanalysis data and recent observations to explore the drivers of DSW formation and cascading, across multiple spatial and temporal scales.

At the subsynoptic scale, in the Gulf of Lion area, the action of cold and dry northern winds, named Tramuntana, and freshwater inputs from rainfall, rivers, and continental runoff regulate the shelf water density. At the synoptic scale, persistent winds and the intrusion of cold air masses from continental Europe can induce Marine Cold Spells (MCS), which are extreme events marked by sustained periods of below-average sea surface temperatures. Notably, MCS occurring around mid-February, when shelf water reaches peak density, are closely linked to DSW formation.

On a larger scale, variability in the East Atlantic (EA) climate mode influences the frequency, persistence, and intensity of cold Tramuntana winds, connecting regional ocean-atmosphere interactions to broader climatic oscillations. Additionally, the combined negative phases of EA and North Atlantic Oscillation climate modes contribute to the formation of denser shelf water.

Amid recent trends of reduced Tramuntana wind intensity, rising shelf water temperatures, and a decline in MCS frequency, an analysis of all the factors contributing to DSW formation and cascading is key to understanding its future. These insights, in turn, will help to anticipate its impact on deep-water circulation and ventilation, biodiversity and functioning of the deep ecosystems.

How to cite: Fos, H., Peña-Izquierdo, S., Corral, S., Durrieu de Madron, X., Estella-Pérez, V., Florindo-Lopez, C., Lagarde, M., Pascual, J., Romero, L., Sanchez-Vidal, A., and Amblas, D.: Winter dense water formation and marine cold spells in the Northwestern Mediterranean: Multi-scale dynamics and implications for dense shelf water cascading, EGU General Assembly 2025, Vienna, Austria, 27 Apr–2 May 2025, EGU25-1048, https://doi.org/10.5194/egusphere-egu25-1048, 2025.

Extreme high temperatures occur frequently over the densely populated Yangtze River basin (YRB) in China during summer, significantly impacting the local economic development and ecological system. However, accurate prediction of extreme high-temperature days in this region remains a challenge. Unfortunately, the Climate Forecast System Version 2 (CFSv2) exhibits poor performance in this regard. Thus, based on the interannual increment approach, we develop a hybrid seasonal prediction model over the YRB (HMYRB) to improve the prediction of extreme high-temperature days in summer.The HMYRB relies on the following four predictors: the observed preceding April–May snowmelt in north western Europe; the snow depth in March over the central Siberian Plateau; the CFSv2-forecasted concurrent summer sea surface temperatures around the Maritime Continent; and the 200-hPa geopotential height over the Tibetan Plateau. The HMYRB indicates good capabilities in predicting the interannual variability and trend of extreme high-temperature days, with a markable correlation coefficient of 0.58 and a percentage of the same sign (PSS) of 76% during 1983–2015 in the one-year-out cross-validation. Additionally, the HMYRB maintains high PSS skill (86%) and robustness in the independent prediction period (2016–2022). Furthermore, the HMYRB shows a good performance for years with high occurrence of extreme high-temperature days, with a hit ratio of 40%. These predictors used in HMYRB are beneficial in terms of the prediction skill for the average daily maximum temperature in summer over the YRB, albeit with biases existing in the magnitude. Our study provides promising insights into the prediction of 2022-like hot extremes over the YRB in China.

How to cite: Pan, S.: Seasonal prediction of extreme high-temperature days over the Yangtze River basin, EGU General Assembly 2025, Vienna, Austria, 27 Apr–2 May 2025, EGU25-1159, https://doi.org/10.5194/egusphere-egu25-1159, 2025.

Numerous studies have highlighted the simultaneous relationship between the Arctic Oscillation (AO) and weather/climate in Asia. However, the stability of the precursor signals in AO for Asian surface air temperature (SAT), which is important for short-term climate prediction, has received little attention. In this study, a strengthened relationship is identified between the late-winter AO and the early-spring SAT over North and Northeast Asia (NNA) around the 1990s. During 1990–2022, a positive (negative) phase of AO during late winter is generally followed by significant warming (cooling) anomalies in the NNA during early spring, whereas this relationship is insignificant during 1961–1987. Further result shows a good persistence of the late-winter AO to early spring after the 1990s. Accordingly, the AO exerts a strengthened impact on Mongolian anticyclone and Asian westerly anomalies through modulation of a Rossby wave train that propagates from the Arctic to the NNA in early spring, leading to significant SAT anomalies at NNA. Additionally, the AO-related temperature anomalies intensified in the stratosphere after the 1990s, linking AO and stratosphere polar vortex (SPV). The intensified (weakened) SPV following positive (negative) AO facilitates warming (cooling) anomalies at NNA via downward-propagating Eliassen-Palm fluxes at wave number 1 and circumpolar westerlies in middle and lower troposphere. The seasonal persistence of AO and the strengthened relationship between AO and SPV synergistically enhance the influence of late-winter AO on early-spring SAT in the NNA, which might be attributed to the interdecadal changes in background circulation over the Arctic.

How to cite: Han, T. and Zhou, X.: Enhanced Influence of Late-winter Arctic Oscillation on Early-spring Temperature in North and Northeast Asia, EGU General Assembly 2025, Vienna, Austria, 27 Apr–2 May 2025, EGU25-1243, https://doi.org/10.5194/egusphere-egu25-1243, 2025.

Subseasonal reversal of warm Arctic–cold Eurasia (SR‐WACE) pattern has significant impacts on transitions of weather and climate extremes in Eurasia. This study explored the performances of climate models to simulate the main features of SR‐WACE. For real‐time predictions, most of the state‐of‐the‐art climate models showed limited ability to accurately forecast SR‐WACE in advance. Furthermore, most of the historical simulations from Phase 6 of the Coupled Model Intercomparison Project (CMIP6) hadalso difficulties in well simulating the SR‐WACE. Further exploration showed that the simultaneous reversal of the Ural blocking high (UB) and Siberian high (SH) is the key atmospheric driver of the SR‐WACE occurrences, which were verified by both of the real‐time predictions and historical simulations. Our results implied that the simulation of SR‐WACE was a huge challenge and the critical solutions included improving simulation of subseasonal reversals of UB and SH in the atmosphere.

How to cite: Xu, T.:  Identification of Shortcomings in Simulating the Subseasonal Reversal of the Warm Arctic–Cold Eurasia Pattern, EGU General Assembly 2025, Vienna, Austria, 27 Apr–2 May 2025, EGU25-1496, https://doi.org/10.5194/egusphere-egu25-1496, 2025.

The Arctic climate is changing rapidly, along with intensified melting of sea ice, which has significant impacts on surface air temperature (SAT) in Eurasia. This study reveals that the subseasonal response of SAT to the autumn Kara–Laptev Sea ice (KLSIC) differs significantly between early and late winter. The response of SAT to KLSIC forms a warm Arctic–cold Eurasia pattern in early winter. Conversely, the negative anomaly response of SAT to KLSIC in late winter is only distributed in the band range of Eurasia, without significant positive SAT anomaly over the Arctic Ocean. After further examination of the separate physical mechanisms involved in early and late winter, it is found that a decrease in KLSIC in autumn can lead to a strengthened Ural high and Siberian high in the Arctic–Eurasia region, which is conducive to cold events in the mid-latitudes of Eurasia in early winter. For late winter, a westward shift in the response of atmospheric circulation to KLSIC leads to a negative anomaly feedback of North Sea surface temperature, which triggers the propagation of Rossby waves to the Sea of Japan through the wave activity flux. Meanwhile, the deep trough of East Asia is strengthened and extends to the southeast, guiding northern cold air to the western Pacific. Our results highlight that different subseasonal effects of sea ice should be considered in Eurasian climate prediction, rather than only consider the effects in winter mean.

How to cite: Guo, H.: Different responses of surface air temperature over Eurasia in early and late winter to the autumn Kara–Laptev Sea ice, EGU General Assembly 2025, Vienna, Austria, 27 Apr–2 May 2025, EGU25-1497, https://doi.org/10.5194/egusphere-egu25-1497, 2025.

The North Atlantic Oscillation (NAO) and North Atlantic tripole sea surface temperature (SST_tri) are important modes in the atmosphere and ocean over the North Atlantic, respectively. The link between the two is well-known. However, this link decreased significantly in 1980–2001 (P2), compared to 1959-1979 (P1) and 2002-2022 (P3). This is related to the significant interdecadal shift of the NAO south center. In late winter, the NAO south center experienced a significant "west-east-west" interdecadal shift, shifting eastward by up to 20° longitude during P2. The eastward shift of the NAO forced the region of strong air-sea interactions to shift, resulting in the collapse of NAO-related SST_tri during P2. In addition, the winter SAT reversal frequency in the mid-latitudes of Eurasia also experienced interdecadal changes. SAT reversal events in P1 and P3 are twice as frequent as those in P2, which is related to the interdecadal westward shift of the NAO south center in P1 and P3. When the NAO south center was westward in late winter, the North Atlantic jet stream retreated significantly from the early winter. The development of the Ural blocking caused the accumulation of cold air in Siberia, causing the reverse change of the Siberian High compared to the early winter, resulting in a SAT reversal in the mid-latitude of Eurasia.

How to cite: Song, X.: Interdecadal Shift of the NAO South Center in Late Winter and Its Climatic Impact, EGU General Assembly 2025, Vienna, Austria, 27 Apr–2 May 2025, EGU25-1611, https://doi.org/10.5194/egusphere-egu25-1611, 2025.

EGU25-1727 | Posters on site | CL2.6

Quantifying the influence of Barents-Kara Sea ice loss on Ural blocking 

Ernest Agyemang-Oko and Marlene Kretschmer

Arctic amplification has been linked to significant changes in mid-latitude weather patterns, including the increasing frequency of extreme weather events. Understanding the mechanisms behind these connections remains a critical challenge in climate science, particularly as the Arctic climate experiences rapid changes. This project investigates the causal pathways linking Arctic amplification to mid-latitude dynamics, with a specific focus on the two-way interactions between Barents-Kara Sea ice loss and winter blocking in the Ural Mountains region, and their link to cold extremes in Eurasia. For this we compute two types of blocking diagnostics (one anomaly based index, and one reversal index) and quantify their changes over time in association with sea ice loss in the Barents and Kara region. Given the limited sample size of the observational record and the large internal climate variability, we not only use reanalysis data but also large-ensemble climate model simulations. Moreover, to address these complex interactions in the presence of potential confounding factors such as ENSO, the project employs causal inference theory within a causal network framework. By disentangling and quantifying sea ice-blocking interactions, the study aims to elucidate critical knowledge gaps in understanding Arctic-midlatitude linkages and to enhance the predictability of future extreme weather events under a warming climate.

How to cite: Agyemang-Oko, E. and Kretschmer, M.: Quantifying the influence of Barents-Kara Sea ice loss on Ural blocking, EGU General Assembly 2025, Vienna, Austria, 27 Apr–2 May 2025, EGU25-1727, https://doi.org/10.5194/egusphere-egu25-1727, 2025.

EGU25-2087 | ECS | Orals | CL2.6

Causal Pathways connecting Indian summer monsoon to the Arctic sea ice decline 

Sujata kulkarni, Ankit Agarwal, and Marlene Kretschmer

The Indian Summer Monsoon (ISM) is one of the most energetic components of the Earth system observed during the boreal summer. As a crucial freshwater source and a lifeline for billions, the ISM has been extensively studied to understand its variability and improve its predictability. However, accurately predicting the ISM remains challenging due to the shifting dynamics of established drivers and the increased influence of emerging teleconnection patterns. In recent years, the Arctic region, a hotspot of climate change, has emerged as a driver of global climate, with its influence hypothesized to extend from the mid-latitudes to the tropics. The strength of the large-scale ISM circulation has been found to influence summer Arctic sea ice through the monsoon-desert mechanism. Understanding and quantifying the two-way interactions between Arctic and ISM systems is crucial, as these teleconnections may help improve the predictions of extreme weather events and seasonal forecasts. Although a few studies have focused on quantifying the association between Arctic sea ice and the Indian Summer Monsoon, the causal mechanisms are yet to be fully explored. Traditional statistical methods for analyzing climate variability have primarily relied on correlations and composite analysis, which have several limitations. This study quantifies the Arctic-ISM teleconnections using a causal inference approach. This technique allows us to evaluate the importance and magnitude of tropical and extratropical drivers of ISM circulation and seasonal variability while controlling for confounding mechanisms. Furthermore, we examine the role of state dependencies, such as the phase of ENSO in modulating the strength of these causal pathways.

How to cite: kulkarni, S., Agarwal, A., and Kretschmer, M.: Causal Pathways connecting Indian summer monsoon to the Arctic sea ice decline, EGU General Assembly 2025, Vienna, Austria, 27 Apr–2 May 2025, EGU25-2087, https://doi.org/10.5194/egusphere-egu25-2087, 2025.

EGU25-2627 | Posters on site | CL2.6

High-Quality Observation Data from the Ieodo Ocean Research Station: Management and Global Accessibility 

Kwang-Young Jeong, Gwang-Ho Seo, Hyun-Sik Ham, YoungKyung Kim, Jinyong Jeong, and Yongchim Min

The Ieodo Ocean Research Station (I-ORS), located southwest of Jeju Island, South Korea, is a remote offshore structure that has been monitoring  15 ocean and atmospheric parameters since 2003. Key parameters, including water temperature, salinity, air temperature, wind direction, wind speed, relative humidity, and atmospheric pressure, are measured at 10-minute intervals. These data are subjected to stringent quality control processes to ensure scientific validity and precision. The quality control process follows OOI (Ocean Observatories Initiative) protocols, employing automated checks such as physical limit verification, variability (standard deviation) analysis, spike detection, and constant value checks. These checks assign initial flags to identify potential anomalies. To further enhance data reliability, manual inspections are conducted, reviewing oceanographic conditions and maintenance reports of facilities and equipment. Flags are adjusted accordingly to refine the data's accuracy. The quality-controlled datasets, accompanied by metadata, are registered on international platforms such as OceanSITES and SEANOE. These platforms provide free access to the global scientific community, supporting diverse research areas such as oceanography, climate change studies, and atmospheric sciences. The Ieodo station's high-quality data contribute significantly to advancing scientific understanding of oceanic and atmospheric phenomena and fostering collaboration within international observation networks.

How to cite: Jeong, K.-Y., Seo, G.-H., Ham, H.-S., Kim, Y., Jeong, J., and Min, Y.: High-Quality Observation Data from the Ieodo Ocean Research Station: Management and Global Accessibility, EGU General Assembly 2025, Vienna, Austria, 27 Apr–2 May 2025, EGU25-2627, https://doi.org/10.5194/egusphere-egu25-2627, 2025.

More than twenty years of air-sea flux observations have been collected at both the WHOTS and Stratus Ocean Reference Stations (ORS).  Both are in trade wind regions, but WHOTS, just north of Oahu, Hawaii is rich in synoptic weather variability including storms, fronts, and cyclones, while Stratus, 1,500 km west of northern Chile and 1,900 km west of the Andes, has little synoptic weather variability.  Time series of surface meteorology at each site are used to prepare time series of the air-sea fluxes of heat, freshwater, and momentum.  Mean daily and annual cycles and the 365-day running mean low-passed times at each site are described and contrasted.  The low-passed time series quantify the interannual variability at the two sites.  After subtracting the long-term mean annual cycle from daily time series to create time series of anomalous interannual variability, the goal is to understand surface forcing contributes to periods of ocean warming and to periods of ocean cooling and to contrast the WHOTS regime's surface forcing by synoptic weather events with the Stratus regime's surface forcing absent synoptic weather variability.  Because one approach to extending this to look over the regions around the ORS might be to use atmospheric reanalyses to provide gridded surface forcing, model time series are extracted at the ORS sites and analyzed in a similar way.  Of interest is whether or not the ERA5, MERRA2, and NCEP2 reanalyses have realistic long-term means, daily and annual cycles, and interannual variability when compared to the ORS observations.

How to cite: Weller, R.: Contrasting how the ocean is forced by the atmosphere at the WHOTS and the Stratus Ocean Reference Stations, EGU General Assembly 2025, Vienna, Austria, 27 Apr–2 May 2025, EGU25-2939, https://doi.org/10.5194/egusphere-egu25-2939, 2025.

EGU25-3126 | ECS | Orals | CL2.6

Ocean gyres and surface buoyancy forcing 

Dhruv Bhagtani, Andy Hogg, Ryan Holmes, and Navid Constantinou

Large-scale ocean circulation modulates weather and climate patterns by distributing heat, nutrients, and carbon dioxide within and across ocean basins. The large-scale circulation is driven by processes at the ocean's surface (such as wind stress and heat/freshwater fluxes) and steered by processes in the ocean's interior (such as mesoscale eddies and flow-topography interactions).

Ocean gyres are generally thought to be driven by wind stress at the ocean's surface, however recent results have suggested that surface buoyancy fluxes may also contribute to, or at least modulate, the strength of the gyres. In this work, we present results from a series of ocean model simulations in which we independently estimate the effects of wind stress and surface buoyancy fluxes on gyre transport. We find that surface buoyancy fluxes control the near-surface density gradients, which in turn affect the gyre circulation. The relationship between surface heat flux gradients and the gyre circulation is linear for timescales shorter than a decade, after which the relationship becomes non-linear due to density advection by the circulation. The relative importance of wind and buoyancy forcing is different for subtropical and subpolar gyres, with the subpolar region exhibiting a more complex range of flow-topography interactions and stratification feedbacks.

Our work emphasizes the under-appreciated role of surface buoyancy fluxes in steering the circulation of large-scale oceanic gyres, with implications for how these gyres, and thus regional climate, may change in the future.

How to cite: Bhagtani, D., Hogg, A., Holmes, R., and Constantinou, N.: Ocean gyres and surface buoyancy forcing, EGU General Assembly 2025, Vienna, Austria, 27 Apr–2 May 2025, EGU25-3126, https://doi.org/10.5194/egusphere-egu25-3126, 2025.

The connection between the tropical and Arctic climates exerts an important impact on the climate in Northern Hemisphere. This study finds that the connection between sea surface temperature anomalies (SSTA) of the central tropical Pacific and semi-circumpolar jet have enhanced during summer after mid-1980s. Our results indicate that the internal variability of Atlantic Multidecadal Oscillation (AMO) has a major influence on the enhanced connection, while the anthropogenic greenhouse gases forcing and aerosol forcing play minor roles. During the period of positive AMO phase, the warm SSTA of central tropical Pacific elicit an enhanced anomalous cyclone in northwestern Pacific, which is favorable for reinforced poleward Rossby waves and enhanced polar vortex. The intensification of the polar vortex enhances the meridional pressure gradient, which amplifies the intensity of semi-circumpolar jet. Furthermore, the anthropogenic forcing amplifies the response of tropical lower tropospheric moisture anomalies induced by the SSTA in the tropical Pacific. These moisture anomalies generate a positive feedback loop of downward latent heat, which further intensifies the SSTA over tropical Pacific and consequently reinforces the response of the semi-circumpolar jet. The findings in this study demonstrate significant changes in Arctic-tropical connection of climates due to combined effect of internal variability and external forcings.

How to cite: Li, W. and Sun, B.: Enhanced impact of tropical Pacific on semi-circumpolar jet attributed to internal variability and anthropogenic forcing, EGU General Assembly 2025, Vienna, Austria, 27 Apr–2 May 2025, EGU25-4659, https://doi.org/10.5194/egusphere-egu25-4659, 2025.

EGU25-4665 | ECS | Orals | CL2.6

Characteristics and mechanism analysis of dipole precipitation in Northeast China 

Xin Ya Shu and Shan Shan Wang

This study examines the interannual variability of the summer precipitation dipole pattern over northern eastern China, utilizing precipitation data and atmospheric reanalysis data from 1961 to 2020, along with an analysis of its underlying influencing mechanisms. Results indicate that the second mode of empirical orthogonal function (EOF2) mode of summer (June–August) precipitation in Northeast China presents a dipole pattern with opposite trends in the north and south, and its time series (PC2) demonstrates signifcant interannual variations. The South-North dipole pattern in summer precipitation over Northeast China are signifcantly correlated with the tropical Pacific sea surface temperature, Arctic sea ice, and Eurasian snow cover in the preceding spring (March–May) on an interannual scale. In the preceding spring, the increase in sea surface temperatures in the eastern equatorial Pacific, coupled with a decrease in temperatures in the western equatorial Pacific, stimulated the East Asia-Pacific and Eurasian teleconnections by weakening the Walker circulation near the equator. This alteration positioned a cyclonic center over Northeast China, subsequently influencing the dipole pattern of precipitation in the region. Furthermore, the anomalies in European snow cover and Arctic sea ice can lead to an increase in albedo and a decrease in upward heat flux, causing the lower atmospheric temperature to drop and persist into the summer. This causes the atmospheric Rossby wave to propagate eastward in the middle and high latitudes, promoting precipitation in the northeast through the occurrence of negative potential height anomalies over the Far East.  These conditions influence the anomalies in the atmospheric circulation over the Eurasian continent, regulate moisture transport and vertical motion, and collectively contribute to the dipole pattern of summer precipitation in Northeast China over the past 60 years, with opposite trends in the north and south.

How to cite: Shu, X. Y. and Wang, S. S.: Characteristics and mechanism analysis of dipole precipitation in Northeast China, EGU General Assembly 2025, Vienna, Austria, 27 Apr–2 May 2025, EGU25-4665, https://doi.org/10.5194/egusphere-egu25-4665, 2025.

EGU25-6053 | Posters on site | CL2.6

Coupling Atmospheric Dynamics and Ocean with Winds from Satellites 

Stavroula Biri and Ad Stoffelen

An accurate description of air-sea interaction in atmospheric, ocean and coupled models remains problematic due to unresolved processes in atmospheric models. Systematic differences in winds occur (amongst others) due to undetermined geophysical dependencies. Systematic model errors in ocean winds found on large scale and atmospheric mesoscale propagate to the ocean circulation when used to force ocean models and affect coupled earth system dynamics. 
Geolocated scatterometer-based corrections of wind forcing products already successfully correct for local wind vector biases, but this correction method is highly dependent on sampling. The growing virtual scatterometer constellation is very promising to better capture the detailed forcing errors over the day.  Biases of the order of 0.5m/s in wind speed can introduce a large bias in wind stress, causing significant errors in ocean–atmosphere coupling and climate prediction.
Our focus is on unresolved processes in atmospheric Numerical Weather Prediction (NWP) models, namely systematic errors in boundary layer parameterizations such as lack of ocean currents and/or other biases that persist over time. An improved representation of surface turbulent fluxes relies on better estimates of: the roughness length, the stability function, the sea skin temperature, ocean currents and convective gustiness. 
The goal is to apply model bias reduction schemes with respect to scatterometer winds. Consistent scatterometer corrections will lead to an improved understanding of the coupled atmospheric and oceanic model dynamical processes in the evolving earth system. In addition, corrected model winds reduce errors in ocean forcing and will be helpful in scatterometer data assimilation.

How to cite: Biri, S. and Stoffelen, A.: Coupling Atmospheric Dynamics and Ocean with Winds from Satellites, EGU General Assembly 2025, Vienna, Austria, 27 Apr–2 May 2025, EGU25-6053, https://doi.org/10.5194/egusphere-egu25-6053, 2025.

EGU25-6884 | ECS | Posters on site | CL2.6

Incomplete Arctic sea-ice Recovery under CO2 Removal and its Effects on the Winter Atmospheric Circulation 

Hao Yu, James Screen, Mian Xu, Stephanie Hay, Weiteng Qiu, and Jennifer Catto
This study explores the response of Arctic sea ice to CO2 removal and its subsequent effects on the winter Northern Hemisphere atmospheric circulation. Using multimodel ensembles from the Carbon Dioxide Removal Model Intercomparison Project, we find that most models display incomplete Arctic sea-ice recovery when CO2 is stabilized back at preindustrial levels, with a deficit of sea-ice area of around 1 million km². This sea-ice deficit is associated with residual equatorward-shifted wintertime midlatitude jets. Sea-ice perturbation experiments from the Polar Amplification MIP provide evidence of a causal influence of residual sea-ice loss on the atmospheric circulation. Model uncertainty in the magnitude of the residual North Atlantic jet shift can be largely explained by the relative magnitudes of residual Arctic and tropical warming across the models. These findings suggest that Arctic sea-ice loss is not fully reversible after CDR, which leads to residual changes in the mid-latitude atmospheric circulation.

How to cite: Yu, H., Screen, J., Xu, M., Hay, S., Qiu, W., and Catto, J.: Incomplete Arctic sea-ice Recovery under CO2 Removal and its Effects on the Winter Atmospheric Circulation, EGU General Assembly 2025, Vienna, Austria, 27 Apr–2 May 2025, EGU25-6884, https://doi.org/10.5194/egusphere-egu25-6884, 2025.

EGU25-7623 | ECS | Posters on site | CL2.6

Spatial Distribution of 40-Day Period Deep Currents in the Ulleung Interplain Gap 

Gyeong-woo Go and Jae-Hyoung Park

The variability of deep currents flowing into the Ulleung Basin through the Ulleung Interplain Gap, located between Ulleungdo and Dokdo, is critical for understanding the meridional circulation of the East Sea and the changes in the deep waters of the Ulleung Basin. The deep currents in this region exhibit asymmetry due to the influence of the Dokdo Abyssal Current and are known to show variations with periods of 5–40 days, attributed to topographic Rossby waves. However, studies on the spatial distribution and causes of the 40-day period variability within the Ulleung Interplain Gap remain unknown. This study aims to address this gap. Deep currents were observed using five mooring lines (U1, U2, U3 or EC1, U4, U5) deployed across the Ulleung Interplain Gap from 2002 to 2004. In the upper layer (200 m), an increase in the 40-day period current variability was observed at U3 between October 2003 and March 2004. In the deep layer (from 1000 m to 2240 m), enhanced 40-day period variability of current occurred during the winter seasons (January–April 2003 and December 2003–March 2004) at four stations (U2, U3, U4, and U5), excluding U1. The first major fluctuation was observed at U3 and U5, while the second was observed at U2 and U4, showing increased amplitudes. This suggests that the cyclonic/anti-cyclonic deep currents within the Ulleung Interplain Gap are associated with changes in their radius or location. Furthermore, these cyclonic/anti-cyclonic deep currents exhibit characteristics distinct from the patterns reported in previous studies, which described deep currents flowing along the continental slope around the Ulleung Basin. This study aims to define the 40-day period deep current patterns and identify their causes by analyzing their relationship with variability in the upper layers.

How to cite: Go, G. and Park, J.-H.: Spatial Distribution of 40-Day Period Deep Currents in the Ulleung Interplain Gap, EGU General Assembly 2025, Vienna, Austria, 27 Apr–2 May 2025, EGU25-7623, https://doi.org/10.5194/egusphere-egu25-7623, 2025.

EGU25-7786 | Posters on site | CL2.6

Unexpected abrupt cooling in bottom water driven by Typhoon Kong-Rey (2018) in the East China Sea 

Jaeik Lee, Seung-Woo Lee, Jongmin Jeong, Jin-Yong Jeong, and Chanhyung Jeon

Typhoon interacts with the ocean by inducing vertical mixing, which alters the ocean’s internal temperature structure. Typically, after a typhoon passes, the surface water temperature decreases while the bottom water temperature increases due to this mixing. However, observations at 5, 20, 40 meter depths at the Ieodo Ocean Research Station (I-ORS) during Typhoon Kong-Rey (2018) revealed an unexpected abrupt cooling of the bottom water, different from the usual pattern. On October 6, 2018, at 00:00, Typhoon Kong-Rey (2018) passed ~86 km from I-ORS, causing the sharp decrease in bottom water temperature from 24.8℃ to 12.2℃, contrary to the typical warming observed in bottom waters. To explain this anomalous cooling, we analyzed temperature and current data from HYCOM. The HYCOM simulations indicated that the abrupt cooling of bottom water was driven by the southward movement of a subsurface cold water mass located north of I-ORS. The southward movement of the subsurface cold water mass can be partially attributed to Ekman currents and the southeastward tidal residual current. Our study provides a valuable example of short-term, anomalous bottom water temperature changes induced by a typhoon. It emphasizes the diverse oceanic responses to typhoons on the continental shelf of the East China Sea, underlining the complexity of typhoon-ocean interactions.

How to cite: Lee, J., Lee, S.-W., Jeong, J., Jeong, J.-Y., and Jeon, C.: Unexpected abrupt cooling in bottom water driven by Typhoon Kong-Rey (2018) in the East China Sea, EGU General Assembly 2025, Vienna, Austria, 27 Apr–2 May 2025, EGU25-7786, https://doi.org/10.5194/egusphere-egu25-7786, 2025.

EGU25-7831 | ECS | Orals | CL2.6

A multi-layer perceptron approach for missing data imputation in ocean research stations 

Nam-Hoon Kim, Sung-Hwan Park, Jin-Yong Jeong, Jin-Yong Choi, Yongchim Min, and Ki-Young Heo

Missing data in Korea Ocean Research Stations (KORS) poses significant challenges for accurate oceanographic modeling and analysis. Such data gaps frequently occur during summer typhoon seasons, often spanning extended periods due to severe weather conditions. This study introduces a multi-layer perceptron neural network (MLP-NN) for missing data imputation, using reanalysis data as inputs. Reanalysis data are utilized as reference data to provide context on potential ocean events during missing periods. The model is trained and validated on periods with available observations, learning to utilize reanalysis data as supplementary inputs while aligning with observational patterns. The trained network is then applied to missing periods, utilizing reanalysis data to impute gaps. The test results show that the proposed model performs exceptionally well in filling long-term data gaps, demonstrating its robustness and reliability. Notably, the predicted water temperature exhibits high accuracy in reproducing abrupt drops and subsequent recoveries, which are often observed during typhoon periods. By utilizing reanalysis data for gap imputation, the method achieves high accuracy in reconstructing missing values, significantly enhancing the completeness and utility of datasets from ocean research stations for scientific and operational purposes.

How to cite: Kim, N.-H., Park, S.-H., Jeong, J.-Y., Choi, J.-Y., Min, Y., and Heo, K.-Y.: A multi-layer perceptron approach for missing data imputation in ocean research stations, EGU General Assembly 2025, Vienna, Austria, 27 Apr–2 May 2025, EGU25-7831, https://doi.org/10.5194/egusphere-egu25-7831, 2025.

EGU25-7901 | ECS | Posters on site | CL2.6

Depth-dependent ocean warming and marine heatwaves through two decades at Ieodo Ocean Research Station in the East China Sea 

Seung-Woo Lee, Go-Un Kim, Yongchim Min, Hyoeun Oh, Jongmin Jeong, Jaeik Lee, Su-Chan Lee, Juhee Ok, In-Ki Min, and Jin-Yong Jeong

Recently, substantial effort has been made to understand the fundamental characteristics of warm ocean temperature trend (ocean warming) and extremes (marine heatwaves, MHWs). However, most research focused on surface signatures of these events, relying on satellite and reanalysis data. While surface ocean warming and MHWs can have dramatic impacts on climate change and marine ecosystems, these events along the seafloor can also significantly affect climate and ecosystems. Monitoring these changes requires long-term, fixed-point observations across multiple depth layers. In this study, we investigate long-term temperature trends and MHW characteristics by analyzing 20 years (2004–2023) of temperature data at three depths—surface (3 m), middle (20 m), and bottom (38 m)—collected at the Ieodo Ocean Research Station in the northern East China Sea near the Korean coast. We find that the air temperature increased by 0.70°C per decade. Correspondingly, ocean warming trends were 0.64°C/decade at the surface, 0.66°C/decade in the middle layer, and 0.88°C/decade at the bottom, with the greatest warming observed in the bottom layer. As MHW frequency and intensity increased across all three layers, bottom MHWs (BMHWs) were found to be more intense and persistent than surface MHWs (SMHWs). While BMHWs, middle MHWs, and SMHWs often co-occur, BMHWs can also exist independently of SMHWs. This study provides direct evidence of distinct warming trends and MHW characteristics across ocean layers based on long-term in situ observations, contributing a valuable dataset for understanding climate-driven changes in the marine environment and supporting efforts to predict and mitigate their ecological and environmental consequences.

How to cite: Lee, S.-W., Kim, G.-U., Min, Y., Oh, H., Jeong, J., Lee, J., Lee, S.-C., Ok, J., Min, I.-K., and Jeong, J.-Y.: Depth-dependent ocean warming and marine heatwaves through two decades at Ieodo Ocean Research Station in the East China Sea, EGU General Assembly 2025, Vienna, Austria, 27 Apr–2 May 2025, EGU25-7901, https://doi.org/10.5194/egusphere-egu25-7901, 2025.

EGU25-8543 | Orals | CL2.6

Ocean Boundary Pressures as an efficient means to measure the global ocean circulation. 

Chris Hughes, Saranraj Gururaj, and Rory Bingham

Most ocean observables are dominated by local variability, leading to the requirement of a dense observing array to calculate the integrated effects which are of broader scale relevance. Ocean bottom pressure (OBP), recently adopted as an Essential Ocean Variable, is an exception which shows coherent variations over extremely large length scales. In particular, we show that a model with realistic mesoscale variability demonstrates coherent OBP variability along the global continental slope with characteristic length scales of tens of thousands of kilometres. We show how these signals permit monitoring of the Meridional Overturning Circulation, and provide insights into the sources of that variability. We also show how boundary pressure measurements allow the global circulation of a realistic model to be understood in terms of classical idealised models, how they measure the integrated flow in boundary currents, and how they relate to global-scale dynamical sea level differences. Furthermore, we demonstrate an observational method that permits the clear separation of dynamical OBP changes from seismic changes and vertical land movement. We make the case that a small number of Eulerian observations could provide a disproportionately large amount of information about the global ocean circulation.

How to cite: Hughes, C., Gururaj, S., and Bingham, R.: Ocean Boundary Pressures as an efficient means to measure the global ocean circulation., EGU General Assembly 2025, Vienna, Austria, 27 Apr–2 May 2025, EGU25-8543, https://doi.org/10.5194/egusphere-egu25-8543, 2025.

Subseasonal reversals of extreme cold days (ECDs) over Northeast China during the winters of 1980-2022 are investigated in this study. Almost half of the years (18 of the 43) experienced subseasonal reversals between early winter (December 1 to January 15) and late winter (January 16 to February 28), characterized by either "more-to-fewer ECDs (ECD+−)" or "fewer-to-more ECDs (ECD−+)." Subseasonal shifts of the North Atlantic Oscillation, the Scandinavian-like pattern, and the stratospheric polar vortex are associated with ECD+−/−+ years. Previous autumn sea surface temperature anomalies and Siberian snow cover anomalies can excite significant atmospheric circulation anomalies or Rossby wave trains that contribute to the subseasonal reversal of ECDs. Statistical forecast models based on physical mechanisms skillfully predict the early/late winter ECD index, with temporal correlation coefficient skill of 0.74/0.46 during the cross-validation period of 1980-2002 and 0.54/0.54 during the independent hindcast period of 2003-2022; moreover, extreme values of the ECD index are also reasonably predicted. The findings of this study offer new insights regarding the mechanism and prediction of subseasonal ECDs over Northeast China.

How to cite: huang, Z.: Subseasonal Reversal of Extreme Cold Temperature Frequencies in Northeast China: Possible Mechanism and Prediction, EGU General Assembly 2025, Vienna, Austria, 27 Apr–2 May 2025, EGU25-8746, https://doi.org/10.5194/egusphere-egu25-8746, 2025.

EGU25-8797 | ECS | Posters on site | CL2.6

Reconstructing the long-term time series of ocean acidification data in the Gulf of Trieste: the importance of metadata for data harmonisation and standardisation 

Nydia Catalina Reyes Suarez, Marina Lipizer, Alessandro Altenburger, Elena Partescano, Sebastian Plehan, Alexia Cociancich, Andrea Corbo, Fabio Brunetti, and Alessandra Giorgetti

The ocean helps in mitigating climate change by absorbing a large part of the excess heat and atmospheric carbon dioxide (CO2) produced by human activities. A decrease in surface ocean pH, known as ocean acidification, is a consequence of an increase in ocean uptake of CO2 concentrations which presents a significant challenge to various marine organisms, particularly those that rely on calcium for their structures (Metzl et al., 2024; Petton et al., 2024).  More than ever, consistent long-term observations of acidification and carbon cycling variables such as pH, temperature, salinity and CO2 are crucial to provide a quantitative assessment of the vulnerability of an area under climate and anthropogenic stressors. However, up to now, there are only a limited number of coastal observation sites where these parameters are measured simultaneously and at high frequency.

In the framework of the ITINERIS project, financed by NextGenerationEU Programme (2022-2025), data on ocean acidification and carbon cycling parameters acquired by the meteo-oceanographic buoy MAMBO-1 (Monitoraggio AMBientale Operativo) were harmonized and standardized in order to obtain a consistent, up-to-date and FAIR (Findable, Accessible, Interoperable and Reusable) continuous time series (1999-2024). The MAMBO-1 buoy was the first meteorological-maritime coastal station to be installed in the northern Adriatic sea capable of recording meteorological and oceanographic parameters in near-real time (Partescano et al., 2014). The buoy is anchored at about 17 m in the seabed within the border of the Miramare Marine Protected Area in the Gulf of Trieste (45.6976667 °N and 13.7083333 °E) and has been operative since January 1999 (M. Lipizer et al., 2017). Over the years, the configuration and instrumentation of the site have changed several times, so it is difficult to obtain a continuous long-term time series from a data management perspective.

The importance of the availability of the long-term time series justifies the reconstruction effort for future studies aimed at obtaining a clearer picture of ocean acidification and carbon cycle processes in the northern Adriatic Sea.

References

Lipizer, M., Iungwirth, R., Arena, F., Brunetti, F., Bubbi, A., Comici, C., Deponte, D., Kuchler, S., Laterza, R., Mansutti, P., Medeot, N., Nair, R. (2017). Sistema di Monitoraggio AMBientale Operativo Boa MAMBO-1: revisione protocolli di acquisizione dati e registro tarature. https://doi.org/10.13120/7d9c292f-bc91-467d-a380-0483e814c000

Metzl, N., Lo Monaco, C., Leseurre, C., Ridame, C., Reverdin, G., Chau, T. T. T., Chevallier, F., & Gehlen, M. (2024). Anthropogenic CO 2 , air–sea CO 2 fluxes, and acidification in the Southern Ocean: Results from a time-series analysis at station OISO-KERFIX (51° S–68° E). Ocean Science, 20(3), 725–758. https://doi.org/10.5194/os-20-725-2024

Partescano, E., Giorgetti, A., Fanara, C., Crise, A., Oggioni, A., Brosich, A., & Carrara, P. (2014). A (Near) Real-time Validation and Standardization System Tested for MAMBO1 Meteo-marine Fixed Station. https://doi.org/10.13140/2.1.2788.4800

Petton, S., Pernet, F., Le Roy, V., Huber, M., Martin, S., Macé, É., Bozec, Y., Loisel, S., Rimmelin-Maury, P., Grossteffan, É., Repecaud, M., Quemener, L., Retho, M., Manach, S., Papin, M., Pineau, P., Lacoue-Labarthe, T., Deborde, J., Costes, L., … Gazeau, F. (2024). French coastal network for carbonate system monitoring: The CocoriCO2 dataset. Earth System Science Data, 16(4), 1667–1688. https://doi.org/10.5194/essd-16-1667-2024

How to cite: Reyes Suarez, N. C., Lipizer, M., Altenburger, A., Partescano, E., Plehan, S., Cociancich, A., Corbo, A., Brunetti, F., and Giorgetti, A.: Reconstructing the long-term time series of ocean acidification data in the Gulf of Trieste: the importance of metadata for data harmonisation and standardisation, EGU General Assembly 2025, Vienna, Austria, 27 Apr–2 May 2025, EGU25-8797, https://doi.org/10.5194/egusphere-egu25-8797, 2025.

EGU25-9037 | ECS | Orals | CL2.6 | Highlight

Decades of Change: Warming Trends and Variability of Atlantic Water as observed in the West Spitsbergen Current (1997–2024) 

Rebecca McPherson, Wilken von Appen, Laura de Steur, Torsten Kanzow, Agnieszka Beszczynska-Möller, and Angelika Renner

Fram Strait, located between Svalbard and Greenland, serves as a crucial gateway connecting the Arctic Ocean and the North Atlantic, facilitating the exchange of heat and freshwater between these regions. Warm and saline Atlantic Water (AW) is carried northwards by the West Spitsbergen Current (WSC), and constitutes the main source of oceanic heat and salt entering the Arctic Ocean. Variations in the AW inflow strongly influence both Arctic ocean and sea ice conditions. An array of moorings has been monitoring the year-round inflow of AW in the WSC, providing hydrographic and current data from 1997 – 2024. A robust, long-term AW warming trend of 0.20°C/decade is identified, leading to a total increase of 0.54°C over the 27-year record. Distinct multi-annual warm and cold anomalies are identified, lasting ~2 years, with two warm periods (2005–2007 and 2015–2017) and two cold periods (1997–1999 and 2019–2024), linked to distinct shifts in the AW temperature regime. Notably, the most recent cold anomaly persisted for over five years—more than twice the duration of previous events. The interannual variability in AW temperatures results from a combination of advection from upstream in the Nordic Seas and local atmospheric forcing. Temperature anomalies propagate northward into the Arctic Ocean along the AW inflow pathway to the north of Svalbard, with a 2-month lag relative to Fram Strait, thus the expected continued rise in AW temperatures and associated heat transport will have profound and lasting impacts on the future state of the Arctic Ocean.

How to cite: McPherson, R., von Appen, W., de Steur, L., Kanzow, T., Beszczynska-Möller, A., and Renner, A.: Decades of Change: Warming Trends and Variability of Atlantic Water as observed in the West Spitsbergen Current (1997–2024), EGU General Assembly 2025, Vienna, Austria, 27 Apr–2 May 2025, EGU25-9037, https://doi.org/10.5194/egusphere-egu25-9037, 2025.

EGU25-9985 | ECS | Posters on site | CL2.6

A merged Machine Learning model for seasonal climate prediction in China 

Danwei Qian

Improving the current level of skill in seasonal climate prediction is urgent for achieving sustainable socioeconomic development, and this is especially true in China where meteorological disasters are experienced frequently. In this study, based upon big climate data and traditional statistical prediction experiences, a merged machine learning model (Y-model) was developed to address this, as well as to further explore unknown potential predictors. In Y-model, empirical orthogonal function analysis was firstly applied to reduce the data dimensionality of the target predictand (temperature and precipitation in the four seasons over China). Image recognition techniques were used to automatically identify possible predictors from the big climate data. These predictors, associated with significant circulation anomalies, were recombined into a large ensemble according to different threshold settings for five factors determining the statistical forecast skill. Facebook Prophet was chosen to conduct the independent hindcasts for each season’s climate at a lead time of two months. During 2011~2022, the seasonal climate in China was skillfully predicted by Y-model, with an averaged pattern correlation coefficient skill of 0.60 for temperature and 0.24 for precipitation, outperforming CFSv2. Potential predictor analysis for recent extreme events suggested that prior signals from the Indian Ocean and the stratosphere were important for determining the super Mei-yu in 2020, while the prior sea surface temperature over the western Pacific and the soil temperature over West Asia may have contributed to the extreme high temperatures in 2022. Our study provides new insights for seasonal climate prediction in China.

How to cite: Qian, D.: A merged Machine Learning model for seasonal climate prediction in China, EGU General Assembly 2025, Vienna, Austria, 27 Apr–2 May 2025, EGU25-9985, https://doi.org/10.5194/egusphere-egu25-9985, 2025.

EGU25-10933 | Orals | CL2.6

 Have we been underestimating midlatitude air-sea interaction? 

Cristina González-Haro, Javier García-Serrano, Aina García-Espriu, and Antonio Turiel

Some traditional, climate-oriented sea surface temperature (SST) observational datasets do not generally include satellite data and are typically based on in-situ observations with a coarser spatial resolution (1 to 2 degrees), prominent examples being the Extended Reconstructed SST from NOAA (ERSST) and the Hadley Centre SST, version 3 (HadSST3). Other datasets combine both, in-situ and satellite observations, such as the Hadley Centre Sea Ice and Sea Surface Temperature dataset (HadISST).

The main objective of this work is twofold. First, we globally characterize and compare SST climatology and variability at grid-point level, considering seasonal averages (DJF, MAM, JJA, SON), between two standard, climate-oriented datasets, HadISST (1° resolution) and ERSST v5 (2° resolution), with the GHRSST product developed by the European Space Agency Climate Change Initiative (CCI) (0.05° resolution). Secondly, we assess the impact of temporal and spatial resolution in such SST characterization as well as on air-sea interaction, estimated by correlating SST with turbulent heat flux (THF; latent plus sensible). The study spans over 1982-2016 (35 years) that corresponds to the record of the satellite product (CCI).

Our results show that the coarser datasets (ERSST-HadISST) overall have a warmer mean-state, except in the more dynamically-active oceanic regions such as the western boundary currents where they yield a colder SST climatology. More interestingly, the high-resolution dataset (CCI) markedly displays larger SST variability in these dynamically-active oceanic regions, which is consistent along the seasonal cycle. Likewise, we also find higher correlations between SST and THF over the western boundary currents in CCI as compared to ERSST-HadISST, indicating a stronger ocean-atmosphere coupling. Our results suggest that the high temporal and spatial resolution provided by remote sensing is key to better resolve air-sea interaction.


How to cite: González-Haro, C., García-Serrano, J., García-Espriu, A., and Turiel, A.:  Have we been underestimating midlatitude air-sea interaction?, EGU General Assembly 2025, Vienna, Austria, 27 Apr–2 May 2025, EGU25-10933, https://doi.org/10.5194/egusphere-egu25-10933, 2025.

EGU25-11829 | ECS | Orals | CL2.6

Long High-Resolution Records of Mixed-Layer Carbon Budget Variability in the Southern California Current System 

Helena C. Frazão, Uwe Send, Adrienne J. Sutton, Mark D. Ohman, Todd R. Martz, Matthias Lankhorst, Jeffrey Sevadjian, and Terence O'Brien

Two moorings in the California Current Ecosystem (CCE) obtained long records of biogeochemical (O2, pCO2, pH, nutrients, Chl-a) and physical parameters (currents, temperature, salinity). Here, the data are used to investigate the seasonal variability of the mixed-layer carbon budget from 2008 to 2022. The moorings are located in the California Current offshore region (CCE1) and the upwelling region on the continental shelf (CCE2), recording high-resolution data at both the surface and the base of the mixed layer. On average, air-sea CO2 fluxes at the surface showed that the open ocean site acts as a sink for atmospheric CO2, with a net annual mean flux of -0.52 molC m-2 year-1, while the upwelling site is a carbon source, with a net outgassing of 0.56 molC m-2 year-1. At CCE1, sea surface temperature is the primary driver of seawater pCO2 and CO2 fluxes, whereas, at the upwelling site, dissolved inorganic carbon (DIC) associated with non-thermal processes acting on seawater pCO2 is the main driver of seasonal variability. To study which non-thermal processes, such as lateral advection, entrainment/detrainment, biological effects, and CO2 flux, affect the mixed layer DIC, we first quantify a climatological annual carbon budget via a mass balance at each site. Using this budget, we compute the anomalies that events such as La Niña, El Niño, and Marine Heatwaves create in relation to the observed mean conditions. Specifically, events such as Marine Heatwaves can reverse the mean surface CO2 flux at both sites, with the CCE1 site switching from a net CO2 sink to a net CO2 source and CCE2 from a CO2 source to a sink. The relevance of each driver during these events is explored with respect to the climatological annual carbon budget at each site. This study highlights the importance of long-term monitoring for accurately capturing the variability of marine carbon fluxes.

How to cite: Frazão, H. C., Send, U., Sutton, A. J., Ohman, M. D., Martz, T. R., Lankhorst, M., Sevadjian, J., and O'Brien, T.: Long High-Resolution Records of Mixed-Layer Carbon Budget Variability in the Southern California Current System, EGU General Assembly 2025, Vienna, Austria, 27 Apr–2 May 2025, EGU25-11829, https://doi.org/10.5194/egusphere-egu25-11829, 2025.

EGU25-12157 | Orals | CL2.6

Evolution of high latitude climate hazards with global warming in large climate model ensembles 

Marianne T. Lund, Nina Schuhen, and Bjørn H. Samset

The Arctic has warmed at more than twice the global mean rate in recent decades, resulting in rapid changes to the northern high latitude Earth system. This includes changes to essential climate variables and associated physical hazards, such as temperature, precipitation, storminess, and cryosphere conditions - in turn posing emerging impacts/risks for society and ecosystems. Here we use data from four large ensembles and perform a detailed and systematic characterization of the distribution and variability of key physical climate hazards across the high latitude and polar regions.

Climate change is known to manifest as shifts in the means and extremes of the variables but can also affect the shapes of their distributions. As highlighted in existing literature, comprehensive understanding of climate risk therefore involves quantification of the full, regional Probability Density Functions (PDFs), as these contain information on expected weather not apparent from the distribution mean or tails. Large initial condition ensembles of coupled climate model simulations have opened new opportunities for studying climate variability and how it evolves with warming, as well as diversity across models, in more detail. Building on methodology from Samset et al. (2019), we consistently quantify regionally (focusing on the northern hemisphere) and seasonally resolved PDFs of daily data for different scenarios and levels of global warming. The analysis also includes a reality check of model performance against reanalysis data for the recent past. Chosen hazards include core ETCCDI climate change indices, as well as specific indices identified of relevance to high latitude impacts through work in the EU Horizon 2020 project CRiceS.

Rapid warming and associated environmental changes are having increasingly significant socioeconomic consequences for high latitude settlements and populations. Our results provide a comprehensive picture of the projected evolution of high latitude climate impact drivers, providing knowledge of high relevance for further assessment of climate risk.  

How to cite: Lund, M. T., Schuhen, N., and Samset, B. H.: Evolution of high latitude climate hazards with global warming in large climate model ensembles, EGU General Assembly 2025, Vienna, Austria, 27 Apr–2 May 2025, EGU25-12157, https://doi.org/10.5194/egusphere-egu25-12157, 2025.

EGU25-13904 | Orals | CL2.6

Observed Seasonality of the South Pacific Meridional Mode: The Role of Oceanic Meridional Advective Feedback 

Juying Xu, Song Yang, Hanjie Fan, Yuhao Cai, Matthew Collins, and Weidong Yu

The South Pacific Meridional Mode (SPMM) is a dominant air-sea coupling mode in the subtropical southeastern Pacific and a key precursor of equatorial Pacific variability. However, the mechanisms responsible for its distinct seasonality remain inadequately understood. Using reanalysis datasets, we conducted an ocean mixed-layer heat budget analysis to quantify the contributions of dynamic and thermodynamic processes to SPMM seasonality. Results show that while net surface heat flux dominates the sea surface temperature warming associated with SPMM in both boreal summer and winter, this warming is significantly dampened by meridional advective feedback in summer (approximately 47%) but weakly in winter (approximately 14%). Further analysis reveals that the meridional advective feedback is primarily attributed to Ekman heat transport driven by anomalous zonal wind stress. These findings underscore the critical role of meridional advective feedback in modulating SPMM seasonality and provide valuable insights for improving climate predictions related to the SPMM.

How to cite: Xu, J., Yang, S., Fan, H., Cai, Y., Collins, M., and Yu, W.: Observed Seasonality of the South Pacific Meridional Mode: The Role of Oceanic Meridional Advective Feedback, EGU General Assembly 2025, Vienna, Austria, 27 Apr–2 May 2025, EGU25-13904, https://doi.org/10.5194/egusphere-egu25-13904, 2025.

The Ieodo Ocean Research Station (I-ORS) is an Eulerian ocean observing platform providing long-term time series data of essential oceanic and atmospheric variables. The northern East China Sea, where the I-ORS is located, is characterized by strong tidal dominance but is also affected by surface inertial motions of non-tidal origin. These surface motions can resonate with local diurnal winds, such as the sea-land breeze (SLB), at inertial frequency because of its proximity to the diurnal critical latitude (~30˚N). This study investigates the amplification and damping of diurnal-inertial oscillations in the northern East China Sea by analyzing time series observations at the I-ORS from 15 May to 26 July 2023 and satellite-tracked surface drifters stayed nearby from 6 to 26 July 2023. In addition to the permanent I-ORS CT sensors installed at depths of 3.0, 20.5, and 38.0 m, 32 temperature sensors (thermistor string) were installed on the mooring line; Initial 16 sensors attached within ±1.5 m of the sea surface at an interval of 0.2 m while the other 16 sensors were attached between 3 and 21 m depths at an interval of 1.2m. All the I-ORS sensors including the thermistor string recorded data every minute or 10-minute interval. The location data of surface drifters, initially recorded hourly, were interpolated to 10-minute interval data to calculate zonal and meridional currents, kinetic energy per unit volume, and wind work rate along with wind stress estimated using the I-ORS sea surface wind data (speed and direction). The I-ORS thermistor string observations occasionally show significant diurnal-inertial oscillations in the mixed layer depth and thermocline depth with typical amplitudes of 1.5 m and 2.0 m, respectively, from 10 to 15 July, when strong eastward wind stress reached up to 0.04 N/m2 with an enhanced wind work rate of 0.069 W/m2. The amplitudes of the diurnal-inertial oscillations in the mixed layer depth and thermocline depth decreased to 0.5m or less from 18 to 22 July, when the wind stress became weaker (< 0.01 N/m2). The surface drifter observations show clockwise-rotating, circular inertial currents with a speed of 35-43 cm/s, separated from the diurnal tidal currents with a comparable speed. The kinetic energy of intermittently amplified, diurnal-inertial surface motions peaked at up to 100 J/m3 on 15 July, which is explained by the peak in wind work rate of 0.069 W/m2 considering mixed layer depth of 10 m and duration of 4 h, i.e., 0.069 J/s/m2 x 4 h / 3600 s/h / 10 m = 100 J/m3. This study presents the intermittent amplification of wind-induced, resonant diurnal-inertial oscillations at the upper ocean near the diurnal critical latitude based on the Eulerian time-series observations along with surface drifters. Further work is needed to address the generation and decaying dynamics and long-term variability of diurnal-inertial oscillations in this and other regions near the diurnal critical latitude.

How to cite: Kim, J. and Nam, S.: Amplifications and Damping of Diurnal-Inertial Oscillations Observed in the Northern East China Sea from Ieodo Ocean Research Station and Surface Drifters, EGU General Assembly 2025, Vienna, Austria, 27 Apr–2 May 2025, EGU25-14541, https://doi.org/10.5194/egusphere-egu25-14541, 2025.

EGU25-15138 | Orals | CL2.6

Multidecadal Sea Level Time Series at the Ieodo Ocean Research Station: A New Approach for the Assessment of Sea Level Rise in the East China Sea 

Yong Sun Kim, Taek-Bum Jeong, Hyeonsoo Cha, Kwang-Young Jeong, Mi-Jin Jang, Jin-Yong Jeong, and Jae-Ho Lee

This study presents a ten-minute interval sea level height (SLH) time series observed from wave radar MIROS SM-140 equipped at the Ieodo Ocean Research Station (I-ORS), a steel framed tower-type multidisciplinary research platform, a unique in situ measurement in the open sea for over two decades. To assess the practicability of the observed SSH, we developed a tidal model-based QC procedure, which has two notable differences in characteristics from the typical ones: 1) a spatiotemporally optimized local range check based on the high-resolution tidal prediction model TPXO9 and 2) consideration of the occurrence rate of a stuck value over a specific period. Comprehensive comparisons with typical QC processes, satellite altimetry, and reanalysis products demonstrate that our approach could provide reliable SLH time series with few misclassifications. A budget analysis demonstrated that the barystatic effect primarily caused sea level rise around the I-ORS. As a representative of sea level fluctuations in the central East China Sea, this qualified SLH time series enables dynamic research, spanning from a few hours of nonlinear waves to a decadal trend with simultaneously observed environmental variables from the I-ORS’ air–sea monitoring system.

How to cite: Kim, Y. S., Jeong, T.-B., Cha, H., Jeong, K.-Y., Jang, M.-J., Jeong, J.-Y., and Lee, J.-H.: Multidecadal Sea Level Time Series at the Ieodo Ocean Research Station: A New Approach for the Assessment of Sea Level Rise in the East China Sea, EGU General Assembly 2025, Vienna, Austria, 27 Apr–2 May 2025, EGU25-15138, https://doi.org/10.5194/egusphere-egu25-15138, 2025.

EGU25-15880 | ECS | Orals | CL2.6

Unraveling ocean-atmosphere coupled variability with Transfer Entropy and Information Flow   

Chiara Zelco, Alberto Carrassi, Michael Ghil, Daniele Marinazzo, and Stéphane Vannitsem

Causal questions are fundamental to scientific exploration. The study of causality and its applications has followed a nonlinear trajectory, shaped by diverse methodological developments and debates about their interpretations. Here, we unravel the evolution of these approaches, from Judea Pearl’s formal framework of causal inference (Pearl, Causality, 2009) to methods based on reductions in informational surprise, multivariate probability, and dynamical systems (Kondrashov et al., Physica D, 2015). While principled causal inference ideally relies on Pearl’s framework, its application is often unfeasible. Instead, methods grounded in information theory, combined with prior knowledge of the system, are widely used to assist in the causal inference process. Recent advances include nonlinear, higher-order information-theoretic approaches (Stramaglia et al., Phys. Rev. Res., 2024).

These methods are increasingly applied in Earth and climate sciences to address questions such as the causes of extreme events and global warming, or to explore the mutual influences between the ocean and atmosphere in driving the climate system. A key unresolved question concerns the nature of this interaction: does atmospheric weather drive the ocean, does the ocean steer the atmosphere, or does a coupled mode of variability govern the system? 

In this context, we investigate the reciprocal influences of ocean and atmosphere using a low-order coupled ocean-atmosphere model that includes realistic thermal and mechanical coupling (Vannitsem et al. Physica D, 2015). By applying Transfer Entropy (Schreiber, Phys. Rev. Lett., 2000) and the Liang and Kleeman (Liang, Entropy, 2021) Information Flow, we analyze the dynamical directions within the coupled system. We uncover the directed dynamics of information exchange, adding insight on the emergence of low-frequency variability in the atmosphere. These results offer a new perspective on interannual and decadal-scale climate prediction. 

How to cite: Zelco, C., Carrassi, A., Ghil, M., Marinazzo, D., and Vannitsem, S.: Unraveling ocean-atmosphere coupled variability with Transfer Entropy and Information Flow  , EGU General Assembly 2025, Vienna, Austria, 27 Apr–2 May 2025, EGU25-15880, https://doi.org/10.5194/egusphere-egu25-15880, 2025.

EGU25-16316 | ECS | Orals | CL2.6

Long-Term Observations from Ieodo Ocean Research Station (I-ORS) for Monitoring Climate Change in the East China Sea 

Go-Un Kim, Yongchim Min, Seung-Woo Lee, Jongmin Jeong, Jaeik Lee, Su-Chan Lee, Eui Young Jeong, In-Ki Min, Juhee Ok, and Jin-Yong Jeong

The East China Sea is a climate-sensitive hotspot where rapid changes in oceanic and ecological conditions have been observed in recent years. Long-term and systematic observational data are essential for accurately assessing these changes. The Ieodo Ocean Research Station (I-ORS), established in June 2003, has been monitoring various oceanic and atmospheric variables in real time. As the first OceanSITES-registered continental shelf observation platform, I-ORS has accumulated valuable data over the past two decades. This long-term dataset is critical for understanding the impacts of large-scale climate change on coastal and shelf regions, revealing significant signals of climate variability in the East China Sea. Notably, I-ORS observations show a significant rise in sea surface temperature, increasing by 0.6°C per decade since 2004—approximately two times faster than the global average rate of 0.3°C. This rapid warming trend underscores the East China Sea's increased vulnerability to climate change, with I-ORS data providing key insights for predicting future changes and mitigating marine disasters.

How to cite: Kim, G.-U., Min, Y., Lee, S.-W., Jeong, J., Lee, J., Lee, S.-C., Jeong, E. Y., Min, I.-K., Ok, J., and Jeong, J.-Y.: Long-Term Observations from Ieodo Ocean Research Station (I-ORS) for Monitoring Climate Change in the East China Sea, EGU General Assembly 2025, Vienna, Austria, 27 Apr–2 May 2025, EGU25-16316, https://doi.org/10.5194/egusphere-egu25-16316, 2025.

EGU25-17502 | ECS | Orals | CL2.6

Water mass spiciness and thickness anomalies, and their propagation in the North Pacific Subtropical Mode Water 

Tong Wang, Toshio Suga, Shinya Kouketsu, Niklas Schneider, Bo Qiu, Kelvin Richards, and Satoshi Osafune

Water masses in the upper ocean play a critical role in modulating ocean stratification and circulation, serving as pathways for atmospheric signals to penetrate the ocean interior and influencing climate variability and marine ecosystems. The North Pacific Subtropical Mode Water (STMW) is a distinct water mass in the northwestern subtropical gyre of the North Pacific Ocean. Although previous studies have extensively highlighted the importance of investigating variations in STMW properties, they predominantly treated STMW as a homogeneous entity, overlooking differences across its different density ranges.

Building on this foundation, we examined spiciness anomalies (density-compensated salinity and temperature anomalies) and isopycnal thickness anomalies within STMW based on Argo observations from 2004 to 2018, with a focus on the comparisons between its lighter (L-STMW) and denser (D-STMW) portions.

Firstly, we investigated interannual to decadal variations in STMW properties across different density ranges. The isopycnal thickness anomalies exhibited a seesaw pattern between L-STMW and D-STMW, separated by a threshold at γ = 25.3 (Figure 1). The volume of D-STMW was primarily governed by decadal variability linked to the Kuroshio Extension, while L-STMW displayed weaker decadal variability with a different phase, as well as stronger interannual and seasonal variations. In contrast, STMW salinity and temperature showed consistent variations across different density ranges.

Secondly, the propagation patterns of thickness and potential vorticity (PV) anomalies differed markedly between L-STMW and D-STMW. For D-STMW, thickness and PV anomalies propagated steadily downstream from the southern edge of the outcrop area to the northern region of the southwestern corner of the gyre. In contrast, L-STMW experienced signal intrusions during certain years, likely caused by off-stream southward transport driven by mesoscale eddies, potentially influenced by topographic effects. However, spiciness anomalies in STMW displayed consistent downstream propagation on all the isopycnals, without significant difference between L-STMW and D-STMW.

These results provide insights into the seesaw structure of mode water variability and may offer broader implications for discovering similar processes in other ocean basins.

Fig. 1 Annual mean thickness anomalies of each 0.05 γ range, averaged in 20–30°N.

How to cite: Wang, T., Suga, T., Kouketsu, S., Schneider, N., Qiu, B., Richards, K., and Osafune, S.: Water mass spiciness and thickness anomalies, and their propagation in the North Pacific Subtropical Mode Water, EGU General Assembly 2025, Vienna, Austria, 27 Apr–2 May 2025, EGU25-17502, https://doi.org/10.5194/egusphere-egu25-17502, 2025.

EGU25-17617 | ECS | Posters on site | CL2.6

Impact of Atlantic and Pacific Decadal Sea Surface Temperature on precipitation extremes over the European and African continents 

Yingxue Liu, Joakim Kjellsson, Abhishek Savita, and Wonsun Park

We quantify the impact of interdecadal sea surface temperature (SST) variability on precipitation extremes over continental Europe and central Africa using the OpenIFS atmospheric general circulation model. We performed 45-member ensemble experiments in which we removed SST anomalies obtained from linear regression with either the Interdecadal Pacific Variability (IPV) or the Atlantic Multidecadal Variability (AMV) from the daily SST in the Pacific Ocean and the Atlantic Ocean over the period 1950–2013. We also used coupled model simulations, particularly the Component C of the Decadal Climate Prediction Project (DCPP-C) as part of the Coupled Model Intercomparison Phase 6 (CMIP6). We find that precipitation extremes amplify over western and central Africa during the positive phase of AMV and reduce there during the negative phase of AMV. The positive phase of IPV reduces the precipitation extremes over western and central Africa and amplifies them during the negative phase. However, AMV and IPV do not show a significant impact over Europe except in some parts of Eastern Europe, where AMV causes more extreme precipitation during the positive phases and the IPV causes more over the Turkish region. Results from the atmosphere model are mostly consistent with the coupled model simulations from DCPP-C.

We also compute time of emergence for climate change signals over the period 1950-2013 and estimate that it takes approximately 700 years for a significant change in European precipitation extremes changes to emerge from the natural climate noise. The time of emergence reduces somewhat when AMV and IPV are removed, but is still on the order of centuries. The preliminary results of this study suggest that the potential importance of the internal variability of the Pacific and Atlantic Oceans is more crucial for the African continents than for the European regions.

How to cite: Liu, Y., Kjellsson, J., Savita, A., and Park, W.: Impact of Atlantic and Pacific Decadal Sea Surface Temperature on precipitation extremes over the European and African continents, EGU General Assembly 2025, Vienna, Austria, 27 Apr–2 May 2025, EGU25-17617, https://doi.org/10.5194/egusphere-egu25-17617, 2025.

EGU25-17657 | Posters on site | CL2.6

Impact of Atmosphere-Ocean Coupled Model on Sea Fog Formation Mechanism Simulation: A Case Study of Sea Fog in the East/Japan Sea of Korea 

Jieun Choi, Baek-Min Kim, Hyun-Joon Sung, Hyo-Jun Bae, and Kwang-Hee Han

Sea fog is a type of fog occurring near marine surfaces, developing within the lower atmospheric boundary layer and influenced by atmospheric and oceanic conditions. The thermodynamic processes driven by the air-sea temperature difference (ASTD) are crucial factors determining sea fog formation mechanisms. Recent studies report a continuous increase in sea surface temperatures in the East/Japan Sea. These changes in the marine environment are likely to affect the frequency, intensity, and duration of sea fog, research on sea fog occurrences in the East Sea remains necessary. This study employs the Coupled Ocean-Atmosphere-Wave-Sediment Transport (COAWST) model to conduct numerical simulations of a sea fog event that occurred over the East Sea of Korea from August 18 to 19, 2020. Standalone atmospheric models cannot simulate the SST and, tend to underestimate the duration of sea fog events. The coupled model incorporates ocean-atmosphere interactions, enabling the Regional Ocean Modeling System (ROMS) to simulate spatiotemporal variations in sea surface temperature (SST). It allows for an analysis of how SST changes influence heat and moisture fluxes within the atmospheric boundary layer and the effects on sea fog formation and persistence. This research emphasizes the importance of ocean-atmosphere interactions and the role of SST modeling in sea fog prediction. The findings are expected to contribute to the improvement of sea fog forecasting systems in the East Sea.

How to cite: Choi, J., Kim, B.-M., Sung, H.-J., Bae, H.-J., and Han, K.-H.: Impact of Atmosphere-Ocean Coupled Model on Sea Fog Formation Mechanism Simulation: A Case Study of Sea Fog in the East/Japan Sea of Korea, EGU General Assembly 2025, Vienna, Austria, 27 Apr–2 May 2025, EGU25-17657, https://doi.org/10.5194/egusphere-egu25-17657, 2025.

The rapidly changing Arctic climate has far-reaching implications for global weather systems, particularly through teleconnections that link high-latitude processes to tropical regions. This study unravels the impact of Barents-Kara (B-K) region sea ice anomalies during the spring season (March-May) on the Indian Summer Monsoon Rainfall (ISMR) patterns from 1959 to 2021. By analyzing low- and high-sea-ice years, the study reveals contrasting atmospheric circulation patterns that drive monsoonal variability over India. During low-sea-ice years, weakened ice cover over the Arctic induces negative sea level pressure anomalies in summer over the Arctic region. This triggers cyclonic activity, which initiates southward-propagating Rossby wave trains. The wave train exhibits a distinct ridge-trough-ridge-trough pattern as it propagates from Europe to the Far East and towards the North Pacific. This atmospheric configuration shifts the subtropical westerly jet southward, enhancing subsidence and suppressing monsoonal convection over the Indo-Gangetic Plain, ultimately reducing the ISMR. Conversely, high-sea-ice years exhibit a reversed pattern, with negative geopotential height anomalies over the Arctic and a ridge over central Asia. This promotes upper-level divergence, enhancing convection and strengthening monsoonal rainfall over the Indo-Gangetic Plain. These findings reveal the critical role of springtime B-K sea ice in shaping summer atmospheric circulation and monsoonal rainfall patterns over India, highlighting the far-reaching impact of Arctic Sea ice variability on tropical weather systems. 

How to cite: Sardana, D. and Agarwal, A.: Impact of Spring Sea Ice Variability in the Barents-Kara Region on the  Indian Summer Monsoon Rainfall , EGU General Assembly 2025, Vienna, Austria, 27 Apr–2 May 2025, EGU25-18136, https://doi.org/10.5194/egusphere-egu25-18136, 2025.

EGU25-18194 | Orals | CL2.6

Comparison of net community and primary production estimates in the Bay of Biscay. 

Izaskun Merino-Sainz, Raquel Somavilla, Marina Navarro-Engesser, Amaia Viloria, and Laura Ibañez

Oceanic-dissolved gas concentrations in the upper ocean are governed by biological and physical processes. Biological activity comprises the oxygen (O2) production by phytoplankton during photosynthesis and consumption through respiration by the marine community. The balance between the two processes is the net community production (NCP). It can be estimated from a time series of oxygen measurements if the physical processes can be evaluated.

Among the physical, the air-sea gas exchange is the main one controlling oxygen concentrations in the ocean mixed layer, and the contribution of bubbles created by breaking waves is a first order event at moderate to high wind speeds (u10 > 7m/s), in young (wind) seas mainly.

In this work, we use different model of the role of bubbles in air‐sea gas exchange (different parameterizations calculated the contribution of bubbles in the air-sea exchange flux) to estimate the NCP in the North Atlantic. Biological contributions are calculated by subtracting the calculated physical changes from the measured dissolved oxygen and compared with primary production estimates based on chlorophyll algorithms.

For this aim, long-term oceanographic time series data from the ocean observatory SATS (Santander-Atlantic-Time-Series) have been employed. These data include measurements from the ocean-meteorological buoy (AGL) at its associated oceanographic station running since 2007 in the southern Bay of Biscay.

We find that the contribution of bubles is minor (5-10 %), thus we can assume that the estimates of NCP are reliable, in good agreement with primary production estimates at the surface. In addition, the wave age has been measured and found to be mostly a mature sea, with very few days of young waves.

How to cite: Merino-Sainz, I., Somavilla, R., Navarro-Engesser, M., Viloria, A., and Ibañez, L.: Comparison of net community and primary production estimates in the Bay of Biscay., EGU General Assembly 2025, Vienna, Austria, 27 Apr–2 May 2025, EGU25-18194, https://doi.org/10.5194/egusphere-egu25-18194, 2025.

Based on data diagnosis and numerical experiments, this study investigated the changes in the interannual properties of the May North Atlantic Oscillation (NAO) and their impact on summer (June–July) sea ice in the North Atlantic during 1979–2021. Results showed statistically significant increase in the interannual variability of the May NAO after the mid-2000s, which had remarkably enhanced impact on summer sea ice in the eastern Hudson Bay (EHB) and the western Labrador Sea (WLS). During 2005–2021, corresponding to a positive phase of the May NAO, anomalous surface westerly or northwesterly winds prevailed over the Hudson Bay and Labrador Sea in May. This led to statistically significant increase in sea ice in both the EHB and the WLS in May via dynamic processes (favoring southeastward movement of the sea ice) and thermal processes (changing surface turbulent heating and shortwave radiation). In comparison with the situation in May, the increase in sea ice in the EHB developed further during summer mainly via thermal processes (positive feedback between the increased sea ice and shortwave radiation). In contrast, amplitude of the increased sea ice in the WLS was comparable between May and summer. Dynamic processes (southeastward movement of sea ice), which was induced by a barotropic anomalous high in the troposphere centered over the Labrador Peninsula, favored the increase in sea ice in summer in the WLS. The tripole sea surface temperature anomalies in the North Atlantic and increased snowpack on the Labrador Peninsula in May, triggered by the positive phase of the May NAO, played an important role in the formation of the anomalous high. During 1979–2004, the surface wind, snowpack, and tripole sea surface temperature anomalies in May, triggered by the May NAO, were relatively weak, leading to statistically insignificant changes in summer sea ice in the EHB and WLS.

How to cite: Xu, Z. and Fan, K.: Enhanced interannual variability of the May North Atlantic Oscillation and its impact on summer sea ice in the North Atlantic after the mid-2000s, EGU General Assembly 2025, Vienna, Austria, 27 Apr–2 May 2025, EGU25-20281, https://doi.org/10.5194/egusphere-egu25-20281, 2025.

EGU25-337 | Orals | OS1.3

Seasonal productivity of the equatorialAtlantic shaped by distinct wind-drivenprocesses 

Peter Brandt, Mareike Körner, James N. Moum, Marisa Roch, Ajit Subramaniam, Rena Czeschel, Gerd Krahmann, Marcus Dengler, and Rainer Kiko

The eastern equatorial Atlantic hosts a productive marine ecosystem that depends on upward supply of nitrate, the primary limiting nutrient in this region. The annual productivity peak, indicated by elevated surface chlorophyll levels, occurs in the Northern Hemisphere summer, roughly coinciding with strengthened easterly winds. For enhanced productivity in the equatorial Atlantic, nitrate-rich water must rise into the turbulent layer above the Equatorial Undercurrent. Using data from two trans-Atlantic equatorial surveys, along with extended time series from equatorial moorings, we demonstrate how three independent wind-driven processes shape the seasonality of equatorial Atlantic productivity: (1) the nitracline shoals in response to intensifying easterly winds; (2) the depth of the Equatorial Undercurrent core, defined by maximum eastward velocity, is controlled by an annual oscillation of basin-scale standing equatorial waves and (3) mixing intensity in the shear zone above the Equatorial Undercurrent core is governed by local and instantaneous winds. The interplay of these three mechanisms shapes a unique seasonal cycle of nutrient supply and productivity in the equatorial Atlantic, with a productivity minimum in April due to a shallow Equatorial Undercurrent and a productivity maximum in July resulting from a shallow nitracline coupled with enhanced mixing.

How to cite: Brandt, P., Körner, M., Moum, J. N., Roch, M., Subramaniam, A., Czeschel, R., Krahmann, G., Dengler, M., and Kiko, R.: Seasonal productivity of the equatorialAtlantic shaped by distinct wind-drivenprocesses, EGU General Assembly 2025, Vienna, Austria, 27 Apr–2 May 2025, EGU25-337, https://doi.org/10.5194/egusphere-egu25-337, 2025.

EGU25-2963 | ECS | Orals | OS1.3

Two flavors of north tropical Atlantic climate variability with distinct  impact on Atlantic hurricanes 

Yi Liu, Michael McPhaden, Wenju Cai, Yu Zhang, Jiuwei Zhao, Hyacinth Nnamchi, Xiaopei Lin, Ziguang Li, and Jun-Chao Yang

Variability of sea surface temperature (SST) in the north tropical Atlantic (NTA) exerts a substantial impact on Atlantic hurricane activity. Referred to as the NTA mode, its positive phase features warm SST anomalies, conducive to increased intensity and frequency of North Atlantic hurricanes. The period 2023-2024 saw two consecutive positive NTA events, featuring a broad warm anomaly pattern in 2024 following the 2023/24 strong El Niño, but a localized SST warm anomaly in the coastal region off northwest Africa in 2023 following a La Niña. Whether there exists inherent diversity in NTA dynamics and impact is unclear. Here we find that the NTA possesses two distinctive flavors: the basin-wide (BNTA) mode and coastal (CNTA) mode. Such diversity is underpinned by an asymmetric response of air-sea heat flux at the SST anomaly centers of the two NTA modes. The BNTA has an overall stronger impact on Atlantic hurricane activity due to its more westward and persistent warm anomaly pattern. Furthermore, since 1990s, the well-known impact from El Niño-Southern Oscillation on the north tropical Atlantic is felt through its influence on the BNTA mode. Our finding highlights the importance of distinguishing and understanding NTA flavors in assessing and predicting their climatic impacts.

How to cite: Liu, Y., McPhaden, M., Cai, W., Zhang, Y., Zhao, J., Nnamchi, H., Lin, X., Li, Z., and Yang, J.-C.: Two flavors of north tropical Atlantic climate variability with distinct  impact on Atlantic hurricanes, EGU General Assembly 2025, Vienna, Austria, 27 Apr–2 May 2025, EGU25-2963, https://doi.org/10.5194/egusphere-egu25-2963, 2025.

EGU25-3073 | ECS | Posters on site | OS1.3

Distinct Impacts of the Central and Eastern Atlantic Niño on the European Climate 

Baiyang Chen, Lei Zhang, and Chunzai Wang

The Atlantic Niño is the primary interannual variability mode in the tropical Atlantic, with far-reaching impacts on global climate. A recent study identified two types of the Atlantic Niño, each with its maximum warming centered in the central and eastern equatorial Atlantic, respectively. Through analysis of observational data and numerical model experiments, we find that the two Atlantic Niño types have distinct climatic impacts on Europe. This is because the central Atlantic Niño is associated with a pronounced increase in precipitation in the western tropical Atlantic, while the positive precipitation anomalies during the eastern type are mainly located in the eastern basin with weaker amplitudes. Consequently, compared to the eastern Atlantic Niño, the extra-tropical atmospheric waves and the associated precipitation and temperature anomalies in Europe during the central type are stronger and shifted westward. Therefore, distinguishing between the two Atlantic Niño types may help improve seasonal climate predictions in Europe.

How to cite: Chen, B., Zhang, L., and Wang, C.: Distinct Impacts of the Central and Eastern Atlantic Niño on the European Climate, EGU General Assembly 2025, Vienna, Austria, 27 Apr–2 May 2025, EGU25-3073, https://doi.org/10.5194/egusphere-egu25-3073, 2025.

EGU25-4268 | Orals | OS1.3

On the mechanisms of Atlantic Niño/Niña decadal variability 

Yun Yang, Lixin Wu, Hong Wang, Yuhu Chen, and Chunxue Yang

The Atlantic Niño/Niña is a dominant climate variability, exerting substantial climate impacts. Besides interannual variability, the observed Atlantic Niño/Niña also demonstrates robust variations at decadal timescale (decadal ATL). The underlying mechanisms, however, remain unclear. Here, we conduct a 300yr picontrol experiment using CESM that reasonably captures mean climate of the Atlantic cold tongue and decadal ATL. A warming of the Atlantic cold tongue weakens St. Helena anticyclone via triggering atmospheric Rossby wave, which decreases the subtropical cell and suppresses the equatorial upwelling, amplifying the initial warming. Meanwhile, the weakened anticyclone enhances wind speed over the southwestern Atlantic and cools local SST. Such cooling propagates with mean current toward east, driving an eastward propagation of negative wind stress curl anomalies and thus a cooling along thermocline over 5S-12S, with a cross basin time of 6yr. This cooling is further advected with mean current at thermocline to reach the equator, after which it develops following the Bjerknes feedback and shifts the phase of decadal ATL.

How to cite: Yang, Y., Wu, L., Wang, H., Chen, Y., and Yang, C.: On the mechanisms of Atlantic Niño/Niña decadal variability, EGU General Assembly 2025, Vienna, Austria, 27 Apr–2 May 2025, EGU25-4268, https://doi.org/10.5194/egusphere-egu25-4268, 2025.

EGU25-4950 | Posters on site | OS1.3

Influences of Central and Eastern Atlantic Niño on the West African and South American Summer Monsoons 

Wen Xing, Chunzai Wang, and Lei Zhang

The rainfall variabilities of the West African and South American summer monsoons, pivotal for local and global climate systems, are strongly influenced by tropical Atlantic sea surface temperature anomalies. This study investigates the impacts of two recently identified Atlantic Niño types, central and eastern Atlantic Niño (CAN and EAN), on these monsoon systems using observational data and numerical experiments. During boreal summer, EAN events exhibit increased rainfall over West Africa compared to CAN events, indicating a strengthened West African summer monsoon. Enhanced moisture flux convergence from eastern Atlantic warming drives these wetting conditions during EAN events. Conversely, CAN events have a more pronounced influence on South American monsoon rainfall during austral summer, causing a rainfall anomaly dipole between the Amazon and eastern Brazil, suggesting an eastward shift in the South American summer monsoon rainfall belt. These rainfall changes are linked to cyclonic circulation anomalies over the southwest Atlantic Ocean, attributed to central Atlantic warming during CAN events. Furthermore, a statistical model assesses hindcast skills of rainfall variability in the two summer monsoon regions, affirming the benefits of separating Atlantic Niño into CAN and EAN events for improved seasonal climate predictions.

How to cite: Xing, W., Wang, C., and Zhang, L.: Influences of Central and Eastern Atlantic Niño on the West African and South American Summer Monsoons, EGU General Assembly 2025, Vienna, Austria, 27 Apr–2 May 2025, EGU25-4950, https://doi.org/10.5194/egusphere-egu25-4950, 2025.

EGU25-5072 | ECS | Posters on site | OS1.3

Role of the Maritime Continent in the remote influence of Atlantic Niño on the Pacific 

Siying Liu, Ping Chang, Xiuquan Wan, Stephen G Yeager, Ingo Richter, and Rong-hua Zhang

Atlantic Niño, the dominant climate mode in the equatorial Atlantic, is known to remotely force a La Niña-like response in the Pacific, potentially affecting seasonal climate predictions. Here, we use both observations and large-ensemble simulations to explore the physical mechanisms linking the Atlantic to the Pacific. Results indicate that an eastward propagating atmospheric Kelvin wave from the Atlantic, through the Indian Ocean, to the Pacific is the primary pathway. Interaction of this Kelvin wave with the orography of the Maritime Continent induces orographic moisture convergence, contributing to the generation of a local Walker Cell over the Maritime Continent-Western Pacific area. Moreover, land friction over the Maritime Continent dissipates Kelvin wave energy, affecting the strength of the Bjerknes feedback and thus the development of the La Niña-like response. Therefore, improving the representation of land–atmosphere–ocean interactions over the Maritime Continent may be fundamental to realistically simulate Atlantic Niño's impact on El Niño-Southern Oscillation.

How to cite: Liu, S., Chang, P., Wan, X., Yeager, S. G., Richter, I., and Zhang, R.: Role of the Maritime Continent in the remote influence of Atlantic Niño on the Pacific, EGU General Assembly 2025, Vienna, Austria, 27 Apr–2 May 2025, EGU25-5072, https://doi.org/10.5194/egusphere-egu25-5072, 2025.

EGU25-8915 | Posters on site | OS1.3

Driving mechanisms of Atlantic Niño under different vertical ocean resolutions 

Marta Martín-Rey, Belén Rodríguez-Fonseca, Teresa Losada, Arthur Prigent, Irene Polo, Adnan Abi, Elsa Mohino, Lucía Montoya-Carramolino, Elena Calvo-Miguélez, Jia Wu, and Diane Putrasahan

The Atlantic Niño controls the boreal summer tropical Atlantic variability at interannual time scales, with pronounced climate impacts in adjacent and remote areas. Changes in the spatial configuration of the Atlantic Niño has been reported during the observational record, coinciding with a modification of the background state and associated teleconnections. The driving mechanisms of the Atlantic Niño have been also changed in recent decades.

The aim of the present study is to explore the role of the ocean background state in the Atlantic Niño diversity and associated air-sea mechanisms. For such purpose, we will use two twin 30-year high-resolution simulations performed in the H2020-EU NEXTGEMS project. Both simulations have the same horizontal resolution (10km) and only differ in the vertical stratification of the upper 20m: 2m layers for the THIN simulation and 10m layers for the THICK one.

To this aim, the Bjerknes feedback and ocean wave propagation are analyzed, and a complete heat budget analysis will be computed and compared in both simulations. Finally, the role of the background state in the modification of air-sea interactions and thus, in Atlantic Niño diversity will be also investigated.

How to cite: Martín-Rey, M., Rodríguez-Fonseca, B., Losada, T., Prigent, A., Polo, I., Abi, A., Mohino, E., Montoya-Carramolino, L., Calvo-Miguélez, E., Wu, J., and Putrasahan, D.: Driving mechanisms of Atlantic Niño under different vertical ocean resolutions, EGU General Assembly 2025, Vienna, Austria, 27 Apr–2 May 2025, EGU25-8915, https://doi.org/10.5194/egusphere-egu25-8915, 2025.

EGU25-9323 | ECS | Posters on site | OS1.3

How alike are diabatic processes in the tropical Atlantic to the Pacific?  

Anna-Lena Deppenmeier, Frank Bryan, William Kessler, and LuAnne Thompson
The Atlantic Niño is the main mode of interannual sea surface temperature (SST) variability in the tropical Atlantic. It bears resemblance to the SST variability associated with the El Niño Southern Oscillation (ENSO) in the Pacific. Like its counterpart in the Pacific, this oscillating mode of variability is a source of weather and climate predictability for bordering countries and beyond. The Atlantic Niño is widely thought of as an air-sea coupled mode, though the ratio of atmospheric versus oceanic forcing leading to the SST anomalies is still under discussion. A recently developed novel water mass transformation analysis can shed light on this question. This method investigates the physical processes behind sea surface cooling and heat uptake into the ocean and relates them to diabatic equatorial upwelling in time and space. This analysis has successfully been applied to the tropical Pacific, where it highlighted the role of ocean processes in creating and enhancing SST variability. During El Niño, for example, subsurface ocean mixing, which drives the bulk of diabatic upwelling in the thermocline shuts down almost entirely, enhancing the warm SST anomaly. During La Niña, on the other hand, SST are strongly cooled by diabatic upwelling driven by anomalously strong vertical mixing. 
 
This method can be readily applied to the Atlantic, to investigate the role of ocean subsurface processes in driving SST variability. The water mass transformation calculations are applied on output of a 0.1° horizontal resolution forced ocean and sea ice simulation. This simulation exhibits realistic SST variability related to the Atlantic Niño. The resulting diabatic velocities and physical processes show that there are distinct differences between the diabatic upwelling in the Atlantic compared to the Pacific, promising additional insights into the mechanism of SST variability behind the Atlantic Niño as compared to the Pacific ENSO. 

How to cite: Deppenmeier, A.-L., Bryan, F., Kessler, W., and Thompson, L.: How alike are diabatic processes in the tropical Atlantic to the Pacific? , EGU General Assembly 2025, Vienna, Austria, 27 Apr–2 May 2025, EGU25-9323, https://doi.org/10.5194/egusphere-egu25-9323, 2025.

The upwelling region off northwest Africa exhibits pronounced seasonal variability and high productivity, playing a critical role in supporting fisheries. The sea surface temperature (SST) difference between the coast and offshore areas serves as a key proxy for upwelling intensity. Using observational data, we found distinct regional dependencies in the response of SST differences to atmospheric forcing. In the permanent upwelling region (21°N-30°N), both upwelling-favorable winds and heat flux enhance the coastal-offshore SST difference, leading the variations by about 70-100 days. In contrast, in the seasonal upwelling region (12°N-19°N),  changes in SST differences precede wind variations by less than one month, particularly during the transition to the downwelling season. Heat flux in this region acts to dampen SST gradients, contrasting with its role in the permanent upwelling zone. Additionally, our results indicate that the response of the SST difference to atmospheric forcing is faster and stronger when the mixed layer is shallower. These results highlight the spatial variability and complexity of air-sea interactions in the northwest African upwelling system, with implications for understanding coastal upwelling dynamics and informing fisheries management.

How to cite: Chen, L. and Juricke, S.: Seasonal cycle of sea surface temperature and air-sea interactions in the Northwest African upwelling region, EGU General Assembly 2025, Vienna, Austria, 27 Apr–2 May 2025, EGU25-11504, https://doi.org/10.5194/egusphere-egu25-11504, 2025.

EGU25-11559 | ECS | Posters on site | OS1.3

Impact of the equatorial Atlantic on ENSO prediction in SEAS5-20C re-forecast 

Antonio Jesús Robles Fernández, Belén Rodriguez-Fonseca, Teresa Losada Doval, Antje Weisheimer, and Magdalena Alonso Balmaseda

El Niño-Southern Oscillation (ENSO) is one of the most globally relevant modes of climate variability, playing a crucial role for tropical and extratropical seasonal predictions. During certain decades, specifically in the early and late 20th century, ENSO is coupled with the Atlantic Niño. Since the Atlantic Niño exhibits its maximum variability during the boreal summer (JJA), while ENSO peaks in winter (DJF), it has been shown that the Atlantic Niño can act as a predictor for ENSO in certain decades. This linkage operates on an interannual scale by alterations in the Atlantic Walker cell and, at decadal scales it has been related with changes in certain patterns, such as the Atlantic Multidecadal Variability (AMV), and an increase in pantropical oceanic variability. Nevertheless, further research on the mechanisms of this connection is needed.

This work analyzes this Atlantic-Pacific connection in SEAS5-20C, as well as the decadal and interannual mechanisms that underpin this connection. Furthermore, it discusses the influence of this connection on the decadal variability of ENSO and Atlantic Niño predictive skill. It is found that decadal changes in tropical basin interactions coincide with changes in the predictability of the tropical Atlantic and Pacific. These findings reveal how the connection between tropical basins is associated with improvements in ENSO and Atlantic Niño predictions.

How to cite: Robles Fernández, A. J., Rodriguez-Fonseca, B., Losada Doval, T., Weisheimer, A., and Alonso Balmaseda, M.: Impact of the equatorial Atlantic on ENSO prediction in SEAS5-20C re-forecast, EGU General Assembly 2025, Vienna, Austria, 27 Apr–2 May 2025, EGU25-11559, https://doi.org/10.5194/egusphere-egu25-11559, 2025.

EGU25-13437 | ECS | Posters on site | OS1.3

Structure of intermediate and deep waters in the tropical Atlantic 

Iana Samborskaia and Alexander Demidov

The purpose of this work is to reveal structural features of waters in the tropical Atlantic in the deep and intermediate layers. Based on the data set expanded in recent years, the content of deep and intermediate waters was calculated from conservative chemical variables.

The work includes data obtained from 1873 to 2023 (GLODAPv2.2022, eWOCE, WODB18 databases). Data from expeditions of the MSU Faculty of Geography from 2019 to 2023 were also used.

The following parameters were used to calculate the water mass content:

Results:

1) Broecker calculated the fraction of deep water in the Atlantic using the PO4*. It was found that the best agreement with the content calculated by PO4* was shown by the PO parameter with a deviation of 5-10%.

a)  b)   

Fig.1. North Atlantic Deep Water (NADW) distributions calculated by PO4*(a), PO (b).

2) Deep water contents calculated using PO4* on the sections were compared with water mass boundaries determined mainly using hydrophysical parameters.

NADW in the western tropical Atlantic is divided into three components: Upper NADW, Middle NADW and Lower NADW. It was found that in most of the analyzed sections, the lower boundaries of MNADW and LNADW practically coincide with the isolines of 85% and 60% of the NADW content.

In addition to large gradients of hydrophysical characteristics, the upper boundary of Antarctic Bottom Water (AABW) is determined by the Si/P=33 ratio (Arzhanova, Artamonova, 2014). In the western Atlantic it most often passes along the isoline of 25% AABW content, in the eastern Atlantic - along the isoline of 15% AABW content.

3) The distribution of AABW is of particular interest because it is transformed as it flows from the western basin to the eastern basin through the Mid-Atlantic Ridge faults. It was decided to refer to the transformed AABW as Northeast Atlantic Bottom Water (NEABW). It has been shown that NEABW is 50% composed of waters entering the eastern Atlantic through the Vema Fracture Zone, and 30% of these waters are “pure” AABW.

4) The PO parameter was used to determine the fraction of Antarctic Intermediate Water (AAIW) and Mediterranean Water (MW):


Fig. 2. Examples of obtained distributions of intermediate waters.

This work was supported by the Russian Science Foundation grant № 23-17-00032.

References:

1) Broecker et al. Radiocarbon decay and oxygen utilization in the Deep Atlantic Ocean // Global geochemical cycles. 1991. V 5, №1. Pp 87-117.

2) Broecker W. "NO" a conservative water-mass tracer // Earth and Planetary Science Letters. V 23. Pp 100-107.

3) Broecker et al. Sources and Flow Patterns of Deep-Ocean Waters as Deduced From Potential Temperature, Salinity, and Initial Phosphate Concentration // J. Geophys. : Oceans.1985. V 90, № C4. Pp 6925-6939.

4) V. Arzhanova, K. V. Artamonova. Hydrochemical structure of water masses in areas of the Antarctic Krill (Euphausia Superba Dana) fisheries // Proceedings of VNIRO. 2014. V 152. Pp. 118-132.


How to cite: Samborskaia, I. and Demidov, A.: Structure of intermediate and deep waters in the tropical Atlantic, EGU General Assembly 2025, Vienna, Austria, 27 Apr–2 May 2025, EGU25-13437, https://doi.org/10.5194/egusphere-egu25-13437, 2025.

EGU25-13553 | Posters on site | OS1.3

Tropical low oxygen extreme events caused by persistent submesoscale coherent vortices 

Florian Schuette, Johannes Hahn, Ivy Frenger, Arne Bendinger, Fehmi Dilmahamod, Marco Schulz, and Peter Brandt

Submesoscale coherent vortices (SCVs) have been frequently observed in the eastern tropical Atlantic (between 12°S and 12°N) based on moored and shipboard observations. They are located well below the mixed layer with no surface signature and, thus, undetectable by remote sensing making in-situ observations and modeling indispensable. The SCVs persist and are relatively long-lived and coherent, despite the increasing suppression of geostrophic balance and the rapid change in the Coriolis parameter (ß-effect) near the equator. These factors typically suggest predominant wave-like structures in this region. Additionally, the energetic zonal current system, which stretch and shear the vorticity fields, further complicate the formation of closed vortex structures. Ship-based oxygen measurements conducted in the area between 6°-12°N, 24°-18°W reveal that approximately two-third of these SCVs are associated with low oxygen cores with dissolved oxygen concentrations less than 60 µmol kg-1 (minimum 40 µmol kg-1). These values are significantly lower than the climatological averages for this depth range (> 80 µmol kg-1). Both, observed water mass characteristics and the analysis of an eddy-resolving ocean-biogeochemistry model indicate that the majority of SCVs originate from the eastern boundary and may last for longer than half a year. While propagating westward into a higher potential vorticity environment, anticyclonic SCVs with a low PV core are more effectively isolated and feature longer life times than cyclonic SCVs with a high PV core. The vertical structure of the dominating anticyclonic SCVs is characterized by higher baroclinic modes 4-10, associated with a Rossby radius of 34 -13 km respectively, which is in agreement with the observed eddy radius and well below the 1st baroclinic Rossby radius of deformation in the region (> 100 km). This study does not only increase our understanding of submesoscale dynamics in equatorial regions, but also how SCVs contribute to the formation of hypoxic zones in the open ocean due to their association with low-oxygen extremes. These hypoxic regimes have the potential to directly impact pelagic fish, biodiversity, and biogeochemical cycles.

How to cite: Schuette, F., Hahn, J., Frenger, I., Bendinger, A., Dilmahamod, F., Schulz, M., and Brandt, P.: Tropical low oxygen extreme events caused by persistent submesoscale coherent vortices, EGU General Assembly 2025, Vienna, Austria, 27 Apr–2 May 2025, EGU25-13553, https://doi.org/10.5194/egusphere-egu25-13553, 2025.

EGU25-16700 | ECS | Orals | OS1.3

Teleconnection of the winter Atlantic Niño to the North Atlantic-European atmospheric circulation 

Laura Gil Reyes, Javier García-Serrano, and Fred Kucharski

Tropical Atlantic Variability (TAV) exerts a significant influence on the climate of different regions. Understanding these teleconnections and their impacts can improve predictability, particularly in the North Atlantic-European (NAE) region. The Atlantic Niño (ATLN) or Equatorial Mode is known for being the dominant pattern of TAV. This study aims at exploring the atmospheric response to winter ATLN, as it has been much less documented than the summer ATLN. Coupled simulations and atmosphere-only experiments with the CMIP6 version of the climate model EC-EARTH (T255L91) have been performed and analysed to revisit the ATLN-NAE teleconnection and further improve process understanding. The coupled simulation consists in a 250-year long integration, after spin-up, with fixed radiative forcing at present conditions; the atmospheric response is estimated by linear regression onto the winter ATLN index defined by Okumura&Xie. The atmosphere-only experiments comprise two 150-year long integrations keeping again the radiative forcing fixed, a control run with climatological SSTs and a sensitivity run prescribing the observed ATLN with climatology elsewhere; the atmospheric response is evaluated by comparing both experiments. Results show a local Gill-type structure, symmetrically straddling the equator, whose amplitude increases from November-December to January-February. In the extratropics, the upper-tropospheric circulation displays a dipolar structure with cyclonic anomalies at mid-latitudes and anticyclonic anomalies at subpolar latitudes, which is different from the North Atlantic Oscillation (NAO). The associated precipitation anomalies show a robust and approximately-linear signal on the European continent.

How to cite: Gil Reyes, L., García-Serrano, J., and Kucharski, F.: Teleconnection of the winter Atlantic Niño to the North Atlantic-European atmospheric circulation, EGU General Assembly 2025, Vienna, Austria, 27 Apr–2 May 2025, EGU25-16700, https://doi.org/10.5194/egusphere-egu25-16700, 2025.

EGU25-18521 | ECS | Posters on site | OS1.3

 Interannual variability of net primary productivity in the Northwest African coastal upwelling system and their relation to Dakar Niños and Niñas. 

Rodrigue Anicet Imbol Koungue, Arthur Prigent, Joke Lübbecke, and Peter Brandt

The Canary upwelling system, located along the Northwest African coast between approximately 10ºN and 35ºN, is among the most productive marine ecosystems globally. It supports rich marine biodiversity and sustains economically significant fisheries. Notably, the coastal regions off Mauritania and Senegal (9ºN–22ºN), comprising the southern part of this system, exhibit pronounced interannual variability in net primary production (NPP). This variability is influenced by extreme warm and cold events, known as Dakar Niños and Niñas, respectively. In this study, we analyze the physical mechanisms driving the interannual variability of NPP from 2003 to 2022, using a combination of satellite observations, reanalysis data, and ocean model outputs. Our results indicate that the interannual variability of NPP is closely linked to changes in sea surface temperature (SST), with the most pronounced effects occurring during February-March-April, i.e. the main upwelling season. A total of six previously undocumented episodes of strong anomalous coastal high and low NPP were identified, nearly all of which are associated with Dakar Niños and Niñas. Our findings suggest that these events are linked to both local and remote forcing mechanisms. The local forcing is associated with variations of the coastal alongshore winds. The remote forcing involves the propagations of coastal trapped waves, triggered by wind fluctuations in the Gulf of Guinea, or by wind-forced equatorial Kelvin waves originating in the western-to-central equatorial Atlantic. Additional remote influences may stem from large-scale climate modes, including the El Niño-Southern Oscillation (ENSO), the North Atlantic Oscillation (NAO), and the Atlantic Meridional Mode (AMM).

How to cite: Imbol Koungue, R. A., Prigent, A., Lübbecke, J., and Brandt, P.:  Interannual variability of net primary productivity in the Northwest African coastal upwelling system and their relation to Dakar Niños and Niñas., EGU General Assembly 2025, Vienna, Austria, 27 Apr–2 May 2025, EGU25-18521, https://doi.org/10.5194/egusphere-egu25-18521, 2025.

EGU25-19250 | ECS | Orals | OS1.3

Influence of ocean background state in Atlantic Niño diversity 

Lucía Montoya-Carramolino, Teresa Losada, and Marta Martín-Rey

Previous studies have identified diverse spatial patterns of the Atlantic Niño (AN) linked to different teleconnections. The emergence of these structures coincides with different mean conditions and driving mechanisms. Here, we explore the role of the tropical Atlantic background state in changing the effectiveness of the dynamic mechanisms that generate the AN, and in shaping the distinct AN patterns.

To this aim, we use simulations from five models of the Extratropical-Tropical Interaction Model Intercomparison Project (ETIN-MIP), where changes in the background state are induced by perturbations in incoming solar radiation across three different latitudinal bands.

Our results reveal that modifying the ocean background state could induce the reported changes in the AN pattern through the alteration of ocean wave dynamics and air-sea coupling.

Mean thermocline slope and stratification in the equatorial Atlantic have a pronounced impact on the Bjerknes Feedback (BF), shaping the AN pattern. In particular, a less tilted equatorial mean thermocline (shallower in the west) in spring could strengthen wind-thermocline coupling under strong anomalous interannual westerlies. Additionally, a tilted mean thermocline, shallower in the east and less stratified in June-August, favors the thermocline-SST coupling. 

Consequently, the stronger BF produces an eastward AN, with SST anomalies confined to the east of the basin and the coast of Africa. Conversely, when the mean state is less favorable, a weaker BF, combined with less effective wave dynamics, results in a westward AN structure.

How to cite: Montoya-Carramolino, L., Losada, T., and Martín-Rey, M.: Influence of ocean background state in Atlantic Niño diversity, EGU General Assembly 2025, Vienna, Austria, 27 Apr–2 May 2025, EGU25-19250, https://doi.org/10.5194/egusphere-egu25-19250, 2025.

EGU25-19465 | Posters on site | OS1.3

Analysing the climate influence on sardinella abundance in northwest Africa from a novel end-to-end model strategy 

Jorge López-Parages and Jose Carlos Sánchez-Garrido

Canary Upwelling System (CUS) is, together with California, Humboldt, and Benguela, one of the four main Eastern Boundary Upwelling Systems (EBUS) across the globe. In particular, small pelagic fishes (hereinafter SPF) dominate the marine biomass in EBUS where they represent a vital intermediate connection between plankton and large predatory species. Regarding the CUS, SPF constitute in weight close to 70% of the total landings of northwest African countries, being the the Sardinella aurita (hereinafter sardinella) one of the dominant SPF species in terms of abundance. This species, for instance, represents the primary source of animal protein in Senegal. However, the absence of systematic observations of sardinella across northwest Africa largely constraint our understanding of how the environmental variability impacts the abundance and distribution of this species. In this work a novel end-to-end (here climate-to-fish) model-based strategy, including explicit representation of sardinella dynamics, has been designed. The results we are obtaining are enabling us to better understand interesting links (and related underlying processes) with well-known climate modes such as NAO and ENSO.

How to cite: López-Parages, J. and Sánchez-Garrido, J. C.: Analysing the climate influence on sardinella abundance in northwest Africa from a novel end-to-end model strategy, EGU General Assembly 2025, Vienna, Austria, 27 Apr–2 May 2025, EGU25-19465, https://doi.org/10.5194/egusphere-egu25-19465, 2025.

EGU25-19497 | Orals | OS1.3

Influence of the remote equatorial dynamics on the interannual variability along the northern coast of the Gulf of Guinea 

Serena Illig, Sandrine Djakouré, and Toussaint Mitchodigni

This study explores the oceanic connection between the equatorial dynamics and the coastal variability along the northern coast of the Gulf of Guinea on interannual timescales, based on experiments with a high-resolution tropical Atlantic Ocean model over 1958-2015. Equatorial Kelvin waves, forced by wind-stress anomalies in the west-central equatorial basin, significantly control the interannual fluctuations of the coastal sea-level and subsurface temperature near the thermocline (>70%), leaving only a marginal role for the local forcing contribution. The dynamical coastal response exhibits a clear propagative nature, with poleward propagations (0.75-1.2 m.s-1) from Cameroon to Liberia. Because the northern coast of the Gulf of Guinea is close to the equatorial waveguide, the coastal variability is influenced by both equatorially-forced coastal trapped waves and reflected equatorial Rossby waves. Furthermore, remote equatorial forcing explains more of the surface temperature variance for the coastal systems associated with clear upwelling characteristics such as Côte d’Ivoire and Ghana, where subsurface/surface coupling is more efficient. The surface thermal amplitude and timing is shaped by the coastal stratification and circulation and exhibits a marked seasonal modulation, so that the timing of the SST anomalies relative to the dynamical signature lacks consistency, making SST a less reliable variable for tracking coastal propagations in the Gulf of Guinea. Our findings open the possibility of predicting interannual changes in coastal conditions off Côte d’Ivoire and Ghana a few months in advance, to anticipate impacts on fish habitats and resources, and to facilitate proactive measures for sustainable management and conservation efforts.

How to cite: Illig, S., Djakouré, S., and Mitchodigni, T.: Influence of the remote equatorial dynamics on the interannual variability along the northern coast of the Gulf of Guinea, EGU General Assembly 2025, Vienna, Austria, 27 Apr–2 May 2025, EGU25-19497, https://doi.org/10.5194/egusphere-egu25-19497, 2025.

EGU25-20043 | ECS | Orals | OS1.3

Influence of winter Saharan dust on equatorial Atlantic variability 

Ignasi Vallès Casanova, Ori Adam, and Marta Martín Rey

The equatorial Atlantic plays a critical role in regional and global climates, yet the influence of Saharan dust in this region remains underexplored. While Saharan dust’s effects on sea surface temperature variability in the North Tropical Atlantic are well-documented, its impact near the equator, particularly during boreal winter, when dust transport reaches its southernmost extent, has received limited attention. Using observational and reanalysis data, we investigate the effects of Saharan dust on equatorial Atlantic variability. We observe a distinct and complex response contrary to the expected cooling from reduced solar radiation. Dust-induced warming in the lower troposphere drives significant sea surface temperature warming off northwestern Africa through changes in latent heat fluxes and Ekman convergence, leading to an off-equatorial warm front. This warm front generates cross-equatorial winds that shift the Atlantic rain belt northward, cool the equatorial region, and trigger wave activity, ultimately causing delayed warming. This study highlights the need to understand complex dust-climate interactions, identifying Saharan dust as a potential driver of equatorial Atlantic variability with broader climatic implications.

How to cite: Vallès Casanova, I., Adam, O., and Martín Rey, M.: Influence of winter Saharan dust on equatorial Atlantic variability, EGU General Assembly 2025, Vienna, Austria, 27 Apr–2 May 2025, EGU25-20043, https://doi.org/10.5194/egusphere-egu25-20043, 2025.

EGU25-1331 | PICO | HS7.9

Balancing Benefits and Challenges of Regreening in Semi-Arid Climates. 

Mokhammad suleiman Mostamandi, Sergey Osipov, Georgiy Stenchikov, and Yoshihide Wada

Land surface characteristics significantly influence regional weather patterns, with the surface heat budget being governed by factors such as surface albedo, emissivity, heat fluxes, and evaporation.  In this study, we investigate the impact of regreening on regional temperature regimes and livability factors in the semi-arid NEOM region in northern Saudi Arabia. We conduct numerical experiments using a high-resolution (1.5x1.5 km grid spacing) Weather Research and Forecast (WRF) regional model to study the effect of converting the surface type from desert to savanna trees with 45% density across a 3.2E5-hectare area. We evaluate the effects of regreening using simulations over three summer months.

Our results indicate that regreening reduces surface temperature by approximately 0.6°C, primarily due to enhanced evapotranspiration. However, irrigation and increased moisture fluxes contribute to a rise in wet-bulb temperature, an important metric for heat stress. Specifically, the wet-bulb temperature increased by 0.7°C, potentially exacerbating heat stress in the region. Notably, maintaining this regreened area requires about 1.2 billion tons of water for irrigation during the summer period.

In semi-arid regions used in this study, where natural water sources are absent, irrigation relies on desalinated water. Although desalination ensures a reliable water supply, it requires substantial energy and generates emissions that contribute to atmospheric warming and negatively impact regional air quality.

These findings highlight the trade-offs associated with regreening in semi-arid regions, where reductions in surface temperature due to evapotranspiration may be offset by increased heat stress, energy demands, and environmental costs of desalination. This emphasizes the need for integrated and sustainable approaches to such interventions.

How to cite: Mostamandi, M. S., Osipov, S., Stenchikov, G., and Wada, Y.: Balancing Benefits and Challenges of Regreening in Semi-Arid Climates., EGU General Assembly 2025, Vienna, Austria, 27 Apr–2 May 2025, EGU25-1331, https://doi.org/10.5194/egusphere-egu25-1331, 2025.

EGU25-2201 | ECS | PICO | HS7.9

Impacts of South-to-North Water Diversion Project  Continuous Water Diversions on Increased Precipitation and Decreased Temperature in Water-Receiving Areas 

Haodong Deng, Qingming Wang, Yongnan Zhu, Yunpeng Gui, Yong Zhao, and Xiaoxue Chen

Climate impacts of the South-to-North water diversion project in China on water-receiving areas (WRA) is simulated by the Weather Research and Forecasting (WRF) model. The results show that during the 2015—2022 water diversion period, the WRA experiences increased precipitation and decreased temperature. Annual precipitation increased by 2.8 mm, mainly dominated by non-convective precipitation (1.92 mm), Although the upwind region receives more water, the increase in water vapor flux is more dramatic in the downwind region due to the spring northwest monsoon; The decreased temperature effect is most pronounced in spring (over 0.15 °C), and over 10 mm of evaporation increase in the downwind region. The sensible heat flux decrease is less pronounced than the latent heat flux increase, mainly because of the insulating effect, which prevented evaporative cooling reduction. This study advances our understanding of the mechanisms by which large-scale water diversion affects WRA climates.

How to cite: Deng, H., Wang, Q., Zhu, Y., Gui, Y., Zhao, Y., and Chen, X.: Impacts of South-to-North Water Diversion Project  Continuous Water Diversions on Increased Precipitation and Decreased Temperature in Water-Receiving Areas, EGU General Assembly 2025, Vienna, Austria, 27 Apr–2 May 2025, EGU25-2201, https://doi.org/10.5194/egusphere-egu25-2201, 2025.

EGU25-4645 | ECS | PICO | HS7.9 | Highlight

Irrigation indirectly sustains rainfed crops in India and China through atmospheric recycling 

Akash Koppa, Francesca Bassani, Victoria Deman, Damián Insua-Costa, Jessica Keune, Diego Miralles, and Sara Bonetti

India and China host ~45% of the world’s irrigated area, with irrigation accounting for 65–75% of the total water usage in these countries. The impact of intense irrigation on regional precipitation and even monsoonal dynamics is well acknowledged. However, the degree to which recycled irrigation water helps sustain rainfed crops, acting as an indirect source of water supply, remains unknown. This is especially important in India and China, where irrigated crops are grown in close proximity to rainfed ones. In this study, we quantify (a) the contribution of atmospherically recycled irrigation water to rainfall over rainfed regions, and (b) the importance of this contribution for satisfying the water demand of rainfed crops. 

The methodology involves 20 years of global Lagrangian atmospheric model (FLEXPART) simulations tracking 10 million air parcels. These simulations were constrained by ERA5 reanalysis data and satellite-based terrestrial evaporation data from GLEAM4. Evaporation from irrigated and rainfed crops was computed using the FAO-Penman method. Air parcels that contribute to rainfall over rainfed crops were tracked backward in time for a period of 15 days. Subsequently, the contribution of evaporation from irrigated crops to rainfall over rainfed crop regions was computed. 

Preliminary results show that, on average, ~15% of the rainfall over rainfed crops can be attributed to irrigation evaporation in upwind regions. The irrigation contribution to rainfall reaches as high as 50% in parts of the intensively irrigated Indo-Gangetic plain. Stark differences are observed between India and China, with irrigation contribution to rainfall over rainfed regions being substantially higher in India. Removal of this irrigation contribution would result in an average increase in evaporative stress of ~10%, with a maximum increase of 25%. With irrigation projected to expand to sustain crop production in a changing climate, it is likely to play an indirect yet significant role in supporting rainfed crops as well. Our results highlight the relevance of considering recycled irrigation as an essential source of water supply for rainfed crops. 

How to cite: Koppa, A., Bassani, F., Deman, V., Insua-Costa, D., Keune, J., Miralles, D., and Bonetti, S.: Irrigation indirectly sustains rainfed crops in India and China through atmospheric recycling, EGU General Assembly 2025, Vienna, Austria, 27 Apr–2 May 2025, EGU25-4645, https://doi.org/10.5194/egusphere-egu25-4645, 2025.

Northwest China is a typical arid and semi-arid region and an important climate-sensitive and vulnerable area. In recent decades, this region has experienced a notable trend toward humidification. Understanding the characteristics and trends of precipitation and the atmospheric water vapor cycle in this area is essential for predicting the future evolution of this phenomenon. Using observational and reanalysis data, this study classified precipitation in Northwest China from 1961 to 2020 into 20 levels, ranging from light to heavy events. The analysis shows that the overall increase in precipitation is largely driven by extreme precipitation events exceeding the 90th percentile, with the rising frequency of heavy precipitation accounting for most of the observed changes. Precipitation intensity across different levels is positively correlated with both external moisture transport and regional moisture contributions. Heavy precipitation events are closely linked to stronger moisture inflows and more active regional recycling processes. Enhanced precipitation efficiency and shorter moisture residence times further facilitate the occurrence of intense precipitation in the region. The increasing trend in heavy precipitation is primarily associated with greater moisture contributions from cross-equatorial flows over the Indian Ocean and increased local evaporation. These factors enhance land-atmosphere interactions and precipitation efficiency, thereby driving the frequency and intensity of extreme precipitation events.

How to cite: Hua, L.: Extreme precipitation driven humidification in Northwest China: Changes in precipitation characteristics and atmospheric water vapor transport in Northwest China, 1961-2020, EGU General Assembly 2025, Vienna, Austria, 27 Apr–2 May 2025, EGU25-5660, https://doi.org/10.5194/egusphere-egu25-5660, 2025.

EGU25-6217 | ECS | PICO | HS7.9

Non-local impacts of upwind vegetation on soil moisture across South America 

Shijie Jiang, Feini Huang, and Wei Shangguan

Soil moisture variability and drought severity in South America are increasingly pressing challenges, driven by global climate change and extensive land use change. In particular, the biophysical effects of vegetation not only influence local water availability, but also have non-local impacts through atmospheric moisture transport. Understanding how upwind vegetation dynamics affect downwind soil moisture anomalies (SMA) is critical to addressing these challenges. In this study, we investigate the role of upwind vegetation in modulating SMA from 2001 to 2018 using a deep learning framework. We identified a pronounced sensitivity of downwind SMA to Amazonian vegetation, with water transport dominating during more than half of the drought events. Hotspots in the eastern Amazon were found where increased vegetation could significantly enhance atmospheric moisture supply to downwind regions, thereby buffering soil moisture variability in Brazilian agricultural zones. Overall, our results highlight the critical role of atmospheric moisture transport in shaping regional hydrology and emphasize the interconnectedness of land use change and hydrological processes. By integrating vegetation dynamics and non-local moisture transport into hydrological and land management strategies, this research provides actionable insights for improving drought resilience and managing the hydrological impacts of vegetation in a changing climate.

How to cite: Jiang, S., Huang, F., and Shangguan, W.: Non-local impacts of upwind vegetation on soil moisture across South America, EGU General Assembly 2025, Vienna, Austria, 27 Apr–2 May 2025, EGU25-6217, https://doi.org/10.5194/egusphere-egu25-6217, 2025.

EGU25-6823 | ECS | PICO | HS7.9

Simulating Precipitation Reductions from Land-Use Changes in South America: A Novel Emulator Approach 

Luis Gustavo Cattelan, Marina Hirota, Jess Baker, Stephen Sitch, Chris Huntingford, Jefferson Goncalves De Souza, and Emanuel Gloor

The Amazon rainforest faces mounting pressure from deforestation, resource extraction, and infrastructure development, with approximately 20% of its forest cover lost in recent decades. These changes, alongside rising temperatures and shifting precipitation patterns, are severely impacting the forest’s resilience Deforestation not only reduces local evapotranspiration and alters surface energy balance—leading to declines in precipitation and increases in temperature—but also disrupts downstream rainfall through changes in water vapor transport, affecting regions dependent on Amazonian moisture.

While Earth System Models (ESMs) offer critical insights into these impacts, their high computational demands limit the range of scenarios they can assess. To overcome this, ESM emulators such as the IMOGEN system provide efficient, pattern-scaled projections. However, existing emulators often fail to incorporate essential local climate feedbacks, which are critical for understanding the Amazon’s resilience to climate change and land-use shifts.

This study enhances the IMOGEN/PRIME emulator to account for localized rainfall changes driven by upstream land-use alterations and deforestation. Using the WAM-2layers model with ERA5 data, we generate sensitivity matrices to quantify how evapotranspiration (ET) from different Amazon regions contributes to precipitation elsewhere. These are combined with ET anomalies simulated by the JULES land-surface model under various land-use scenarios. Scenarios are derived from the LuccME framework (Aguiar et al., 2016) and include: Sustainability, reflecting socio-economic and environmental advancements; Fragmentation, representing resource depletion and inequity.; Middle of the Road, a mix of both; Extreme cases, such as total South American deforestation, are also assessed.

By combining ET anomalies with water vapor transport sensitivities, precipitation change patterns are spatially mapped for each scenario and incorporated into IMOGEN. This integration allows for simulations of cascading effects from land-use changes on regional precipitation and climate.

The enhanced emulator offers a powerful framework to assess deforestation-driven climate impacts, including their effects on forest resilience and biogeochemical cycles. This approach provides a comprehensive evaluation of Amazon forest dieback risks under diverse CMIP6-aligned scenarios, delivering critical insights for conservation and sustainable land management strategies.


How to cite: Cattelan, L. G., Hirota, M., Baker, J., Sitch, S., Huntingford, C., Goncalves De Souza, J., and Gloor, E.: Simulating Precipitation Reductions from Land-Use Changes in South America: A Novel Emulator Approach, EGU General Assembly 2025, Vienna, Austria, 27 Apr–2 May 2025, EGU25-6823, https://doi.org/10.5194/egusphere-egu25-6823, 2025.

Located in the Congo River basin, the Cuvette Centrale is a densely forested peatland containing billions of tons of carbon. Past work has shown that this peatland is susceptible to large-scale drying trends, which could lead to substantial carbon release to the atmosphere. Understanding the sources of atmospheric water that sustain the Cuvette Centrale, as well as changes to these sources, is essential for characterizing current and future vulnerability. In this presentation, I will share recent work that examines the sources of moisture for the Cuvette Centrale over the first two decades of the 21st century. The results indicate that a substantial fraction of mean annual precipitation falling in the Cuvette Centrale arises as both local evaporation and evaporation from elsewhere in the Congo Basin. An analysis of annual anomalies reveals a multi-decadal drying trend occurring in the Cuvette Centrale, which may be associated with changes occurring throughout key evaporation source areas. Likewise, important links are shown between key ecohydrologic dynamics and moisture recycling to the Cuvette Centrale, such as changes in upwind evaporative stress. This work provides an approach for examining and interpreting changing hydroclimatic vulnerability of critical, global carbon stocks, such as in tropical peatlands. Furthermore, this work underlines the importance of monitoring land-surface changes that could affect moisture recycling to the Cuvette Centrale, such as expanding deforestation across the Congo Basin.

How to cite: Keys, P.: Moisture recycling and vulnerability of Congo's peatlands, EGU General Assembly 2025, Vienna, Austria, 27 Apr–2 May 2025, EGU25-7817, https://doi.org/10.5194/egusphere-egu25-7817, 2025.

EGU25-10508 | ECS | PICO | HS7.9

Evapotranspiration and Feedback Effects with Climate and Land Use Change in the Eastern German Lowlands 

Somayeh Ahmadpour, Yasin Bayzidi, and Katja Trachte

Evapotranspiration (ET) is a vital component of the hydrological cycle, mediating energy, water, and carbon exchanges on land surfaces and the atmosphere, which are critical for agricultural water availability. Understanding the spatiotemporal variability of ET and its relationship with atmospheric drivers and land use/land cover change (LUCC)  is crucial for assessing environmental impacts on regional water cycles and improving water resource management.

This study focuses on the lowlands in eastern Germany. It is a predominantly agricultural region with a continental climate. Despite being one of the driest areas in Germany, 45% of its land is used for agriculture. Using environmental data obtained by MODIS (ET, temperature, solar radiation, and LUCC) and the German Weather Service (relative humidity, precipitation, wind speed, soil moisture, and vapor pressure deficit), ET trends and drivers are analyzed from 2000 to 2020. The objectives are to (i) identify key factors influencing ET and (ii) estimate the effects of climate change and LUCC on ET. 

Results reveal a slight increase in annual ET (taking into account the European vegetation period), with spatial trends showing increases of up to 7.17%, particularly in the southern and southeastern regions. Over the same period, Temp and VPD rose by 37% in the western and eastern areas, while RH decreased by more than 55% in areas experiencing higher Temp and VPD levels. Significant LUCC was observed, including a 22.24% decrease in cropland-to-grassland conversion and a 14.75% increase in grassland-to-cropland conversion, leading to a 21% decline and a 10% increase in ET, respectively.

Among climatic factors, VPD, Temp, RH, and SR had the most substantial influence on ET variability, contributing 28.24%, 27.68%, and 26.84%, respectively. Overall, climate change accounted for 97% of ET variation, underscoring its dominant role. Notably, discrepancies between ET and climatic drivers in western, eastern, and southeastern regions align with drought periods documented in this study. Our findings highlight the important role of Temp and RH in agricultural and water resources management, particularly in the context of climate change.

How to cite: Ahmadpour, S., Bayzidi, Y., and Trachte, K.: Evapotranspiration and Feedback Effects with Climate and Land Use Change in the Eastern German Lowlands, EGU General Assembly 2025, Vienna, Austria, 27 Apr–2 May 2025, EGU25-10508, https://doi.org/10.5194/egusphere-egu25-10508, 2025.

EGU25-12170 | ECS | PICO | HS7.9

Hydroclimatic simulations sensitivity to land use changes  

Mariana Castañeda-Gonzalez, Siavash Pouryousefi Markhali, Annie Poulin, Jean-Luc Martel, Richard Arsenault, François Brissette, Béatrice Turcotte, Olivier Asselin, and Richard Turcotte

Historical changes in land use have shown different effects on climatic and hydrological processes across spatial and temporal scales. Among these, snow accumulation, snowmelt, and evapotranspiration are key processes sensitive to land use changes that can directly influence streamflow production at the catchment scale. The potential future effects of land use changes on streamflow production highlight the importance of assessing the sensitivity of modelling tools commonly used to produce hydrological projections, such as hydrological models (HMs) and regional climate models (RCMs). Therefore, this study aims to assess the individual and combined effects of RCM- and HM-simulated land use changes on the streamflow simulations of five North American catchments. To assess RCM-simulated land use change impacts, three simulations from the Canadian RCM version 5 (CRCM5) were used: a reference simulation (current land uses), a forested scenario (100% forest land use), and a grass scenario (100% grass land use), following the Land-Use and Climate Across Scales (LUCAS) protocol. Two distributed HMs, WASIM and HYDROTEL, were used to evaluate HM-simulated land use change effects on streamflow under the same reference, forest and grass scenarios. Results indicated that RCM-simulated land use changes had a greater impact on streamflow than those simulated by HMs alone. Regarding the differences between hydrological models, HYDROTEL showed higher sensitivity to land use changes in snow processes, while WASIM showed greater sensitivity in modelling evapotranspiration. Further comparisons with a modified version of the GR4J hydrological model provided additional insights into how model structures influence the level of sensitivity to land use, highlighting the importance of each hydrological model internal formulations. Moreover, this study underscores the need for further research into how HMs represent complex land use changes and emphasizes the importance of selecting appropriate tools for specific local hydroclimatic conditions and land use dynamics to improve hydrological modelling and water resources management.

How to cite: Castañeda-Gonzalez, M., Pouryousefi Markhali, S., Poulin, A., Martel, J.-L., Arsenault, R., Brissette, F., Turcotte, B., Asselin, O., and Turcotte, R.: Hydroclimatic simulations sensitivity to land use changes , EGU General Assembly 2025, Vienna, Austria, 27 Apr–2 May 2025, EGU25-12170, https://doi.org/10.5194/egusphere-egu25-12170, 2025.

EGU25-14837 | ECS | PICO | HS7.9

On the Link Between Physical Aridity and Rainfall Intermittency 

Mijael Rodrigo Vargas Godoy, Annalisa Molini, Yannis Markonis, and Gabriele Villarini

Rainfall intermittency is a defining characteristic of the hydrology in arid and semi-arid regions. These climates experience prolonged droughts interrupted by brief, intense rainfall events, which have substantial effects on landforms, ecosystems, and water resources. Under climate change, intermittent precipitation patterns are expected to become more prevalent across a wider range of climates. Despite this, there is limited research on the link between rainfall intermittency and physical aridity. Furthermore, high-resolution representation of rainfall variability remains a significant source of uncertainty in rainfall modeling and downscaling. Herein, we investigate the relationship between rainfall intermittency, its temporal scaling behavior, and aridity from a climatological standpoint. We hypothesize that intermittency is shaped by fine-scale processes, such as land-atmosphere interactions and local water and energy dynamics, alongside large-scale atmospheric forces. By analyzing extensive hourly and sub-hourly precipitation datasets from the Contiguous United States (NOAA US-HPD) and Australia (Australian Bureau of Meteorology), we uncover a clear functional relationship between intermittency and aridity metrics across diverse water-limited climates. These findings offer a foundation for enhancing precipitation downscaling techniques and understanding future precipitation regimes in regions with limited water availability.

How to cite: Vargas Godoy, M. R., Molini, A., Markonis, Y., and Villarini, G.: On the Link Between Physical Aridity and Rainfall Intermittency, EGU General Assembly 2025, Vienna, Austria, 27 Apr–2 May 2025, EGU25-14837, https://doi.org/10.5194/egusphere-egu25-14837, 2025.

EGU25-15031 | PICO | HS7.9

Observational Evidence of Increased Afternoon Rainfall Downwind of Irrigated Areas 

Peter Greve, Amelie U. Schmitt, Diego G. Miralles, Sonali McDermid, Kirsten L. Findell, Almudena Garcia-Garcia, and Jian Peng

Irrigation plays a vital role in addressing the growing food demand of an increasing global population. About 70% of worldwide freshwater withdrawals are used for irrigation, and of the ca. 16 million km2 of global cropland, about 20% are irrigated. Due to the massive redistribution of water across the land surface and pumping of groundwater resources, irrigation represents one of the most critical and direct human interventions on the coupled water and energy cycles. As irrigated farmland continues to expand, understanding the climate impact of extensive irrigation becomes increasingly important. Yet, the effect on rainfall patterns near irrigated areas remains less clear. Here, we detect a systematic impact of extensive irrigation at the global scale on the location and downwind rainfall amount of afternoon rain. Using two global, high-resolution, sub-daily precipitation datasets, we show that afternoon rain events occur more often 10 km to 50 km downwind and less often upwind of extensively irrigated land. However, we also find that the total amount of heavy afternoon rain downwind of irrigated areas is lower than upwind. Our results provide large-scale observational evidence of the local precipitation dynamics and land-atmosphere interactions surrounding irrigated areas to provide new insights for regional water management and help constrain the representation of these processes in next-generation climate and weather forecasting models.

How to cite: Greve, P., Schmitt, A. U., Miralles, D. G., McDermid, S., Findell, K. L., Garcia-Garcia, A., and Peng, J.: Observational Evidence of Increased Afternoon Rainfall Downwind of Irrigated Areas, EGU General Assembly 2025, Vienna, Austria, 27 Apr–2 May 2025, EGU25-15031, https://doi.org/10.5194/egusphere-egu25-15031, 2025.

EGU25-18802 | ECS | PICO | HS7.9

Revisiting global oceanic and terrestrial moisture sources based on state-of-the-art Lagrangian transport simulations  

Victoria M. H. Deman, Damián Insua-Costa, and Diego G. Miralles

Understanding atmospheric moisture sources and their transport pathways is essential for advancing our knowledge of hydrological processes, regional precipitation patterns, and climate variability. In this study, we analyze continental and oceanic moisture sources with a focus on climatological patterns and long-term trends. To revisit our understanding of global moisture sources, we leverage a new global, open-source dataset spanning 45 years (1979–2024), derived from Lagrangian transport modeling with FLEXPART (Bakels et al, 2024). It contains 3-hourly information on the position of the air parcels which are distributed globally according to density as well as different associated state variables such as temperature or specific humidity. 

The outputs from the Lagrangian model are fed to HAMSTER, a tool for source attribution that is constrained by observational data of both precipitation and evaporation (Keune et al., 2022). Notably, we analyze the moisture sources for each continent separately in addition to the sources for the global land area as a whole, which enables us to: (1) assess intra-continental precipitation and evaporation recycling ratios, (2) investigate the inter-continental transport of moisture, and (3) analyze the role of different ocean basins in providing moisture to specific terrestrial regions. Moreover, the dataset’s longer record and its higher spatial and temporal resolution compared to their predecessors allow for an up-to-date investigation of the change in moisture source contributions over the past four decades. This includes exploring the impact of climate change and land use alterations on the hydrological cycle and how these changes affect the balance between oceanic and terrestrial moisture sources per continent. Overall, this study refines our understanding of atmospheric moisture transport dynamics in a changing climate, highlighting ongoing shifts in our global hydrological cycle.  


References

Bakels, L., Tatsii, D., Tipka, A., Thompson, R., Dütsch, M., Blaschek, M., Seibert, P., Baier, K., Bucci, S., Cassiani, M., Eckhardt, S., Groot Zwaaftink, C., Henne, S., Kaufmann, P., Lechner, V., Maurer, C., Mulder, M. D., Pisso, I., Plach, A., Subramanian, R., Vojta, M., and Stohl, A.: FLEXPART version 11: improved accuracy, efficiency, and flexibility, Geosci. Model Dev., 17, 7595–7627, https://doi.org/10.5194/gmd-17-7595-2024, 2024. 

Keune, J., Schumacher, D. L., and Miralles, D. G.: A unified framework to estimate the origins of atmospheric moisture and heat using Lagrangian models, Geosci. Model Dev., 15, 1875–1898, https://doi.org/10.5194/gmd-15-1875-2022, 2022. 

How to cite: Deman, V. M. H., Insua-Costa, D., and G. Miralles, D.: Revisiting global oceanic and terrestrial moisture sources based on state-of-the-art Lagrangian transport simulations , EGU General Assembly 2025, Vienna, Austria, 27 Apr–2 May 2025, EGU25-18802, https://doi.org/10.5194/egusphere-egu25-18802, 2025.

EGU25-19822 | ECS | PICO | HS7.9

Water Use in Agroecosystems: An Extended Budyko Framework 

Sara Cerasoli, Giulia Vico, and Amilcare Porporato

Climate change and human activities are rapidly altering watershed dynamics, with agricultural management being a key protagonist in modifying water partitioning within watersheds. The Budyko framework relates precipitation partitioning to climatic conditions through fundamental constraints of water and energy availability. However, managed watersheds deviate from the natural Budyko curve due to their modified water balance, particularly through irrigation inputs.
This study develops a process-based extension of the Budyko framework by explicitly incorporating irrigation into the water balance equations. Our approach accounts for both stochastic rainfall and irrigation inputs, considering different management methods, climatic conditions, and crop parameters. This allows us to predict and explain the shifts in water partitioning observed in managed watersheds within the Budyko space.
We validate our theoretical predictions using real-world basins that span diverse climates and management practices - from rainfed to fully irrigated agriculture. The framework successfully captures the transitions between different agricultural strategies through their modified evaporative patterns, showing good agreement with observed data across various irrigation methods and crop types, demonstrating how these interventions have altered hydrological patterns on a global scale.
This framework advances our understanding of agricultural feedbacks on the water cycle through modified evapotranspiration patterns. The ability to characterize these changes using minimal parameters makes it valuable for improving hydrological models and detecting irrigation practices through their distinctive signatures in the Budyko space.

How to cite: Cerasoli, S., Vico, G., and Porporato, A.: Water Use in Agroecosystems: An Extended Budyko Framework, EGU General Assembly 2025, Vienna, Austria, 27 Apr–2 May 2025, EGU25-19822, https://doi.org/10.5194/egusphere-egu25-19822, 2025.

EGU25-20298 | ECS | PICO | HS7.9

Simulating moisture-vegetation feedbacks in the Amazon under drought and deforestation scenarios 

Caterina Vanelli, Lauren Seaby Andersen, Simon Felix Fahrländer, Arie Staal, Werner von Bloh, Nico Wunderling, and Boris Sakschewski

The Amazon rainforest, a global biodiversity hotspot and home to over 40 million people—2.2 million of whom are Indigenous—plays a critical role in the global regulation of water and carbon cycles. However, its unique biocultural diversity is increasingly threatened by climate and land-use changes, which could shift vegetation in multi-stable forest areas to savannah- or grassland-like states. Satellite-based observations, Earth system models, and rainfall exclusion experiments provide evidence of the rainforest's critical dependency on precipitation and seasonality. Additionally, complex systems approaches suggest that forests in bistable areas are maintained by cascading moisture recycling, a process that is significantly reduced by regional deforestation.

This research employs  the dynamic global vegetation model LPJmL (version 5.9), incorporating variable tree rooting strategies and coupled with moisture network data derived from the Lagrangian moisture transport model UTrack. The observation-based monthly moisture networks for the period 2003–2014 proportionally redistribute evapotranspiration from LPJmL over the Amazon basin as precipitation, providing a partially dynamic representation of the moisture-vegetation feedback. Future scenarios, including increased drought frequencies (based on the major droughts of 2005 and 2010 as analogs for future extremes)and two deforestation projections (based on the Governance and Business as Usual scenarios from Soares-Filho et al. (2006)), are implemented to analyse rainfall changes and the forest's local and telecoupled moisture response in LPJmL. We also provide a first estimate of the collective contribution of Indigenous Peoples’ Lands to terrestrial precipitation in the Amazon, by explicitly accounting for atmospheric water flows originating from Indigenous territories as in the data provided by Garnett et al. (2018). 

These findings add to our understanding of forest-water interactions from a moisture recycling perspective, assessing the impacts of drought and deforestation while highlighting the role of Indigenous land management. Advances in modelling could support future assessments of forest resilience and tipping risks, providing critical inputs for forest management and underscoring the urgency of effective climate mitigation.

How to cite: Vanelli, C., Andersen, L. S., Fahrländer, S. F., Staal, A., von Bloh, W., Wunderling, N., and Sakschewski, B.: Simulating moisture-vegetation feedbacks in the Amazon under drought and deforestation scenarios, EGU General Assembly 2025, Vienna, Austria, 27 Apr–2 May 2025, EGU25-20298, https://doi.org/10.5194/egusphere-egu25-20298, 2025.

EGU25-21892 | ECS | PICO | HS7.9

Vegetation and Wind Speed Dominate Precipitation-Evaporation Recycling Processes during 1980–2021 

Yiying Wang, Chiyuan Miao, Qi Zhang, Jiajia Su, Jiaojiao Gou, Qingyun Duan, and Alistair GL Borthwick

Atmospheric moisture plays a crucial role in connecting global water and energy exchanges within the water cycle. Using a water recycling model, this study examines the spatiotemporal characteristics of precipitation and evaporation recycling ratios (PRR and ERR) across 200 river basins worldwide from 1980 to 2021, with data fused from three reanalysis datasets. The results reveal that regions near the equator exhibit higher PRR values, signifying strong moisture self-sufficiency, whereas arid, high-latitude, and inland regions show lower PRR values, indicating a higher dependence on external water vapor. Temporal trends indicate a decline in PRR and ERR in regions such as North America, South Africa, and Australia, while some areas in Central Asia and Europe have experienced increases. Structural Equation Modeling reveals that land cover, especially the Leaf Area Index (LAI), and wind speed are key drivers of spatial and temporal variability in water recycling ratios. The study classifies river basins into four categories based on their water recycling trends: ‘Enhanced Exchange Basins,’ ‘Beneficial Basins,’ ‘Shrinkage Basins,’ and ‘Reduced Exchange Basins.’ These classifications provide valuable insights into regional water cycles and can inform targeted water resource management strategies, crucial for addressing challenges like water scarcity and ecosystem restoration.

How to cite: Wang, Y., Miao, C., Zhang, Q., Su, J., Gou, J., Duan, Q., and Borthwick, A. G.: Vegetation and Wind Speed Dominate Precipitation-Evaporation Recycling Processes during 1980–2021, EGU General Assembly 2025, Vienna, Austria, 27 Apr–2 May 2025, EGU25-21892, https://doi.org/10.5194/egusphere-egu25-21892, 2025.

EGU25-2877 | ECS | Orals | AS4.1

Atmospheric response to Antarctic coastal polynyas 

Matthias Noel, Sébastien Masson, and Clément Rousset

Antarctic coastal polynyas are ice-free areas forming in sea ice-covered regions, primarily driven by strong katabatic winds that push sea ice offshore. These polynyas enable ocean-to-atmosphere heat exchange, driving intense sea ice production and dense water formation. Despite their role in generating Antarctic Bottom Water (AABW), which constitutes 30-40% of global ocean volume, their atmospheric dynamics remain poorly understood.

This study investigates the atmospheric impacts of Antarctic coastal polynyas using high-resolution (3 km) WRF simulations, focusing on the Prydz Bay region, including the Cape Darnley (CDP) and Mackenzie Bay polynyas (MBP). A sensitivity experiment without polynya, highlights the significant atmospheric changes when polynyas are open: a major heat release toward the atmosphere (up to 1000 W·m⁻²) increases the air temperature (over 5.5°C), creates a low-pressure anomaly (-70 Pa), an acceleration of the surface winds (over 5 m·s⁻¹) and an intense atmospheric convection leading to a thicker boundary layer (+400 m) and more clouds. Two recirculation anomaly cells develop upstream and downstream of the polynya. An analysis of meridional wind trends reveals that the dynamical response of the atmosphere to the polynya opening is controlled by a balance between the pressure gradient forces, the advection and the vertical diffusion, reinforced by the strong vertical turbulent mixing above the polynya. 

These results underline the substantial influence of polynyas on local atmospheric dynamics, and suggest potential feedback mechanisms that could influence polynya dynamics and consequently the AABW formation.

How to cite: Noel, M., Masson, S., and Rousset, C.: Atmospheric response to Antarctic coastal polynyas, EGU General Assembly 2025, Vienna, Austria, 27 Apr–2 May 2025, EGU25-2877, https://doi.org/10.5194/egusphere-egu25-2877, 2025.

EGU25-3313 | Posters on site | AS4.1

Decadal time series of high-resolution downwelling spectral radiancemeasurements from Concordia Station, Antarctica 

Giovanni Bianchini, Gianluca Di Natale, Luca Palchetti, and Marco De Pas

In December, 2011 the REFIR-PAD Fourier transform spectroradiometer was installed in Concordia Station, Antarctica to perform continuous monitoring of the atmospheric downwelling emitted radiance in the middle-far infrared region. The spectroradiometer is supported by several auxiliary instruments to monitor ground and sky conditions and, since 2020, by a compact lidar sensor to provide cloud structure in the lower troposphere and boundary layer region, thus establishing a complete and integrated set of sensors for the monitoring of the Antarctic troposphere.

The main product in the data set provided by the observing system consists in high-resolution spectral radiances measured in the 100-1500 cm-1 region with a 0.4 cm-1 resolution. This allows us not only to separate the contributions to the radiation budget due to H2O, CO2, O3 and clouds, but also to retrieve vertical profiles of water vapor and temperature, columnar amounts of minor constituents and cloud properties through a data inversion process.

The production of a consistent long-term dataset needs to front multiple challenges which are intrinsic in long period continuous operation in extreme environment, methods for the correction of systematic effects and to perform automatic data quality assessment had been developed in order to be able to make the data available for use by the atmospheric science community.

An example of the results that can be obtained exploiting the advantage of long term measurement and high temporal resolution provided by the dataset is the identification and analysis of extreme events: not only it is possible to perform a detailed analysis of the most prominent events on an hourly timescale, but also it is possible to search the dataset for the occurrence and statistics of minor events that could be of similar origin.

How to cite: Bianchini, G., Di Natale, G., Palchetti, L., and De Pas, M.: Decadal time series of high-resolution downwelling spectral radiancemeasurements from Concordia Station, Antarctica, EGU General Assembly 2025, Vienna, Austria, 27 Apr–2 May 2025, EGU25-3313, https://doi.org/10.5194/egusphere-egu25-3313, 2025.

EGU25-3634 | Posters on site | AS4.1

Assessment of Long-Term Climatic, Hydrological, and River Ice Dynamics in River Oulankajoki  

Abolfazl Jalali Shahrood, Amirhossein Ahrari, and Ali Torabi Haghighi

This study examines long-term climatic and hydrological trends in River Oulankajoki, in Finland. The aim is to understand the impacts of changing climate conditions on river systems. Using 57 years (1966–2023) of daily air temperature and snow depth data from the Finnish Meteorological Institute (FMI) and hydrological observations from the Finnish Environment Institute (SYKE), the analysis incorporates longwave (LW) and shortwave (SW) radiation data from ERA5, accessed through Google Earth Engine (GEE). The Mann-Kendall trend test was employed to detect significant temporal changes, that reveals a significant decreasing trend in both air temperature values and discharge Phase Change Timing (i.e., PCT) over the study period. The results show that the river ice break-up timing has been shifting about 3-weeks in time, meaning that the break-up season occurs earlier than 57 years ago. These changes indicate potential shifts in regional climate dynamics, likely influenced by global climate change. Correlation heatmaps showed strong positive relationships between air temperature (AT) and river ice Break-Up Days (i.e., BUDs).

How to cite: Jalali Shahrood, A., Ahrari, A., and Torabi Haghighi, A.: Assessment of Long-Term Climatic, Hydrological, and River Ice Dynamics in River Oulankajoki , EGU General Assembly 2025, Vienna, Austria, 27 Apr–2 May 2025, EGU25-3634, https://doi.org/10.5194/egusphere-egu25-3634, 2025.

EGU25-4130 | ECS | Orals | AS4.1

Quantifying the risk of unprecedented Antarctic heatwaves 

Charlie Suitters, James Screen, and Jennifer Catto

It has been widely documented that the East Antarctic heatwave (EAH) in March 2022 featured some of the largest positive temperature anomalies ever recorded anywhere on Earth. The heatwave was extraordinary in both extent and magnitude, where anomalies of at least 30°C were reached widely in the region. This study seeks to determine the likelihood of this event, the risk of even more extreme events occurring in the current state of the Antarctic climate; and whether events of a similar magnitude could occur elsewhere on the continent and at other times of year, with potentially more severe impacts for ice shelf stability. A large ensemble of seasonal hindcasts from multiple forecasting centres is used to assess the simulated occurrence of high temperature extremes over Antarctica, using a technique known as "UNprecedented Simulated Extremes using Ensembles" (UNSEEN).

The March 2022 EAH was outside the range of possible extreme temperatures suggested by the ensemble of hindcasts, signifying that events of this magnitude are incredibly rare. It is also shown with the ensemble that almost everywhere in Antarctica could experience unprecedented March heatwaves in the current climate, at least 5°C higher than has been observed. The UNSEEN method also suggests that temperature anomalies of a similar magnitude to those in the March 2022 EAH could occur widely across the continent in today’s climate. Therefore, Antarctic heatwaves on the scale of the 2022 event could occur almost anywhere, even though they have not yet been observed. This would be particularly problematic over the larger ice shelves of the Ross and Ronne-Filchner. If the extreme temperatures suggested by UNSEEN are realised here, it is shown that these ice shelves would be more susceptible to more frequent, or more severe, melting. This could ultimately result in weaker ice shelves, ice shelf collapse, and rising global sea levels.

How to cite: Suitters, C., Screen, J., and Catto, J.: Quantifying the risk of unprecedented Antarctic heatwaves, EGU General Assembly 2025, Vienna, Austria, 27 Apr–2 May 2025, EGU25-4130, https://doi.org/10.5194/egusphere-egu25-4130, 2025.

EGU25-5718 | Orals | AS4.1

Extreme increases in snow grain size on the Antarctic Plateau from Satellite Observations and Ice Sheet-Atmosphere Interactions 

Claudio Stefanini, Giovanni Macelloni, Marion Leduc-Leballeur, Vincent Favier, Benjamin Pohl, and Ghislain Picard

Grain size variations impact the albedo and have consequence for the energy budget of the surface.  The snow grain size in Antarctica follows a clear seasonal pattern: a summer increase and a winter decrease, which are conditioned by atmospheric processes —namely temperature, wind, snowfall— and by mechanisms acting inside the snowpack leading to water vapour transport thus causing the coarsening of the grains. This study focuses on the evolution of the grain size in the interior part of East Antarctica, where dry metamorphism occurs, by using satellite observations. For this, we use, as proxy for the snow grain size, the Grain Size Index (GSI) inferred from the 89 and 150 GHz radiometer observations collected by the Advanced Microwave Sounding Unit-B (AMSU-B) from 2000 to 2022. Four extreme increase in GSI have been identified over the Antarctic Plateau, along the highest ice divide. In these cases, the ERA5 reanalysis revealed an atmospheric blocking/ridge situation around the onsets of the summer growing of the grain size, conveying the relatively warm and moist air coming from the mid latitudes, often associated with atmospheric rivers. The snow dry metamorphism is facilitated conditions of weak wind, low temperature and low snowfall conditions during the following weeks, leading to grain growth. These conditions determine anomalous high value of the snow grain size at the end of summer. Theoretical analysis have been performed to investigate in detail the extreme snow grain size event happened near Dome Fuji during the summer 2019-2020. The simulations of the AMSU-B observations  confirm that this extreme variation is mainly related to an increase in snow grain size. Results also highlighted  a decrease in snow density during this event. This is supported by independent satellite observations at 1.4 and 36 GHz (from Soil Moisture and Ocean Salinity SMOS and Advanced Microwave Scanning Radiometer 2 AMSR-2, respectively), which showed synchronized variations related to an unusual change in surface snow density.

How to cite: Stefanini, C., Macelloni, G., Leduc-Leballeur, M., Favier, V., Pohl, B., and Picard, G.: Extreme increases in snow grain size on the Antarctic Plateau from Satellite Observations and Ice Sheet-Atmosphere Interactions, EGU General Assembly 2025, Vienna, Austria, 27 Apr–2 May 2025, EGU25-5718, https://doi.org/10.5194/egusphere-egu25-5718, 2025.

EGU25-7154 | ECS | Orals | AS4.1

Drivers and impacts of the vertical structure of the troposphere at Villum Research Station, Northeast Greenland 

Jonathan Fipper, Jakob Abermann, Ingo Sasgen, and Wolfgang Schöner

The vertical temperature structure controls atmospheric stability and is a key component for surface energy exchange. However, in situ data for validation of re-analysis data or process studies remain scarce in the Arctic. We collected 130 vertical temperature profiles up to 500 m above ground using uncrewed aerial vehicles (UAVs) over different surface types (ice, snow-free tundra, open water) around the Villum Research Station (VRS) in Northeast Greenland. The VRS is adjacent to Flade Isblink, the largest peripheral ice cap in Greenland. To assess the accuracy of our approach, we conducted 50 ascents and descents next to a meteorological mast equipped with temperature sensors at 2 m, 8 m, 20 m and 80 m above ground. Our UAV-based approach shows good agreement with the mast, with about 90% of the measurements being within the sensor accuracy of 0.6°C. Furthermore, we find a robust agreement between the UAV data and the Copernicus Arctic Regional Reanalysis (CARRA) data set (mean absolute difference of 1°C; r= 0.59) depending on the prevailing wind direction. To understand the influence of different surface properties on the vertical temperature structures and their temporal changes, we focus on daily CARRA data for June, July and August between 1991 and 2024. We show that differences in air temperature between regions of snow-free tundra and glacier ice maximize in July and find the maximum altitude up to which the atmosphere is significantly (α = 0.05) controlled by surface properties at about 100 m above ground. Next, we use K-means clustering to categorize temperature gradients above this threshold of 100 m and 500 m to analyze the associated large-scale atmospheric conditions. We are able to distinguish 5 clusters from the temperature gradients related to distinct patterns of large-scale atmospheric conditions of 850 hPa temperature and 500 hPa geopotential height. These preliminary results suggest that the temperature structures of the lowest 100 m of the troposphere are significantly controlled by surface properties and consequently by the fraction of snow cover in the tundra. Above 100 m, temperature gradients are driven by large-scale synoptic conditions. Finally, we study the effect of surface properties and large-scale circulation on the mass balance of the Flade Isblink ice cap using the Modèle Atmosphérique Régional (MAR).

How to cite: Fipper, J., Abermann, J., Sasgen, I., and Schöner, W.: Drivers and impacts of the vertical structure of the troposphere at Villum Research Station, Northeast Greenland, EGU General Assembly 2025, Vienna, Austria, 27 Apr–2 May 2025, EGU25-7154, https://doi.org/10.5194/egusphere-egu25-7154, 2025.

EGU25-9051 | ECS | Posters on site | AS4.1

30 years of Antarctic weather station observations by the IMAU network (1995-2025) 

Maurice Van Tiggelen, Paul Smeets, Carleen Reijmer, Peter Kuipers Munneke, and Michiel van den Broeke

Since 1995, the Institute for Marine and Atmospheric research Utrecht (IMAU) at Utrecht University has operated automatic weather stations (AWS) at 20 different locations on the Antarctic ice sheet. In cooperation with multiple institutes, AWS were installed in Dronning Maud Land, on the East Antarctic Plateau, on the remnants of the Larsen B ice shelf, and on the Larsen C and Roi Baudouin ice shelves.  Besides standard meteorological observations (wind speed, wind direction, air temperature, humidity, surface pressure), these stations also recorded the four components of net surface radiation, as well as surface height change. That allows for a reliable estimation of the surface energy balance (SEB) and surface mass balance (SMB) at hourly temporal resolution. Due to the harsh climatic conditions and limited number of maintenance visits, the data require a thorough quality control procedure and specific sensor corrections.

Here we present the corrections that were applied to the measurements, as well as the procedure that was implemented to flag suspicious samples. We give an overview of the first quantification of the long-term variability in SEB components, as well as the strong contrast between the high-melt locations near the grounding lines of ice shelves and the dry interior of the Antarctic ice sheet.  In total, 152 station-years of observations are available, of which 78% are non-flagged simultaneous observations of all meteorological and radiation parameters.

This dataset may be used for the evaluation of climate models and for the interpretation and validation of remote sensing products, but also for the quantification of climatological changes and for process understanding in general. The data are openly available at  https://doi.pangaea.de/10.1594/PANGAEA.974080.

How to cite: Van Tiggelen, M., Smeets, P., Reijmer, C., Kuipers Munneke, P., and van den Broeke, M.: 30 years of Antarctic weather station observations by the IMAU network (1995-2025), EGU General Assembly 2025, Vienna, Austria, 27 Apr–2 May 2025, EGU25-9051, https://doi.org/10.5194/egusphere-egu25-9051, 2025.

EGU25-9646 | Posters on site | AS4.1

Interconnections between the components of the Antarctic climate system: a causal inference approach 

Sebastian Berghald, Nicole Van Lipzig, Hugues Goosse, and Stef Lhermitte

Antarctica and the Southern Ocean have an important role in Earth's climate, influencing global heat balance and carbon uptake. Recent anomalies, such as drastic sea ice decline, anomalous snowfall, and unprecedented heat waves challenge our understanding of the region's climate response. Both internal (local processes) and external (influence from lower latitudes) factors have been suggested as drivers of this variability, but the relative contributions of these remain unknown due to the lack of observations as well as shortcomings in climate models. We aim to enhance the understanding of this system by making use of recent advances in causal effect estimation. Going beyond correlation, causal network reconstruction aims to detect cause-effect links and their strength from observational datasets, including satellite records and reanalysis data. For selected sectors of Antarctica, the interconnections between ice sheet surface mass balance (SMB), sea ice, ocean temperature, and meridional transport of heat and water from lower latitudes are examined and causal relationships identified and quantified.

How to cite: Berghald, S., Van Lipzig, N., Goosse, H., and Lhermitte, S.: Interconnections between the components of the Antarctic climate system: a causal inference approach, EGU General Assembly 2025, Vienna, Austria, 27 Apr–2 May 2025, EGU25-9646, https://doi.org/10.5194/egusphere-egu25-9646, 2025.

EGU25-10147 | ECS | Posters on site | AS4.1

Glacier-Climate Interactions across Time: A West Greenland Case Study  

Florina Roana Schalamon, Lindsey Nicholson, Sebastian Scher, Andreas Trügler, Wolfgang Schöner, and Jakob Abermann

Altitude-driven gradients of air temperature, humidity, wind, and surface mass balance play a critical role in understanding glacier-climate interactions, particularly in regions of rapid environmental change like the Arctic. In this study, we compare datasets from Alfred Wegener’s last expedition to the west coast of Greenland in 1930/31 with a modern measurement network established at the same locations in 2022. This unique comparison offers insights into how the atmospheric and glacial conditions have changed within a century.  
The measurement network consists of one automatic weather station at the coast over bare ground in vicinity of the outlet glacier Qaamarujup Sermia and another at 940 m a.sl. on the Greenland Ice Sheet. For both locations observations exist during the Wegener expedition and since 2022. Additionally, temperature and humidity sensors and surface mass balance measurements distributed between these two points provide high-resolution spatial data.  
The observed gradients in air temperature, humidity, wind speed, and wind direction are analysed at multiple temporal scales, from diurnal cycles to annual variations. Preliminary results show that the air temperature gradient between the coastal and the glacier station follows a seasonal cycle by being the smallest in spring (on average –6.5 °C) and the largest in winter (on average –11°C). Although this is true in the historic and modern dataset, the gradient in spring is colder in 2023 and 2024 with –7.0°C and –6.7°C respectively versus –5.7°C in 1931. The summer gradient is warmer in the modern dataset from -8.3°C in 1930, -9.3°C in 1931 to -7.7°C in 2023 and -7.8°C in 2024.  
Our goal is to understand the key factors shaping these gradients, including the influence of large-scale atmospheric patterns such as the Greenlandic Blocking Index and North Atlantic Oscillation and the prevailing regional conditions identified through self-organizing maps. By comparing historical and modern datasets, we further examine how changes in glacier geometry and a frontal retreat of approximately 2 km since the 1930s have shaped climatic gradients. A particular focus is placed on whether this influence is more pronounced at the coastal or the glacier station.  
This work contributes to the broader understanding of how glacier-climate interactions are influenced by both local and large-scale factors and underscores the value of historic observational records in assessing climate change impacts. 

How to cite: Schalamon, F. R., Nicholson, L., Scher, S., Trügler, A., Schöner, W., and Abermann, J.: Glacier-Climate Interactions across Time: A West Greenland Case Study , EGU General Assembly 2025, Vienna, Austria, 27 Apr–2 May 2025, EGU25-10147, https://doi.org/10.5194/egusphere-egu25-10147, 2025.

EGU25-11681 | Posters on site | AS4.1

Surface radiation budget data in a bipolar perspective: observations, comparison and exploiting for products. 

Alice Cavaliere, Claudia Frangipani, Daniele Baracchi, Francesca Becherini, Angelo Lupi, Mauro Mazzola, Simone Pulimeno, Dasara Shullani, and Vito Vitale

Clouds modulate the net radiative flux interacting with both shortwave and longwave radiation, but the uncertainties regarding their effect in polar regions are especially high, because ground observations are lacking and evaluation through satellites is made difficult by the high surface reflectance. In this work, the radiative regimes and sky conditions for five different stations, two in the Arctic (Ny-Ålesund, 78.92°N, 11.93°E,  Barrow, 71.32°N, 156.61° W) and four in Antarctica (Neumayer, 70.68°S, 8.27°W; Syowa,  69.01°S, 39.58°E; South Pole, 90°S, 0°E ; DomeC, 75.01°S, 123.33°E) will be presented, considering the decade between 2010 and 2020. Measurements of broadband shortwave and longwave radiation components (both downwelling and upwelling) are collected within the frame of the Baseline Surface Radiation Network (BSRN) (Driemel et al. 2018). Observations, together with  identification of the clear sky and overcast conditions will be compared with ERA5 reanalysis (Herschbach et al., 2023). Furthermore, the identified conditions based on estimated cloud fraction will serve as labels for a machine learning classification task, leveraging algorithms such as Random Forest and Long Short-Term Memory (LSTM) networks (i.e. Zeng et al., 2021; Sedlar et al., 2021). These models incorporate features including global and diffuse shortwave radiation, downward longwave radiation, solar zenith angle, surface air temperature, relative humidity, and the ratio of water vapor pressure to surface temperature. The Random Forest model will also compute feature importance, identifying the most influential variables in predicting sky conditions and providing insights into the relationships between these meteorological factors.

Bibliography

Driemel et al. (2018): Baseline Surface Radiation Network (BSRN): structure and data description (1992–2017). 

Riihimaki et al. (2019): Radiative Flux Analysis (RADFLUXANAL) Value-Added Product.

Hersbach, H. et al. (2023): ERA5 hourly data on single levels from 1940 to present. Copernicus Climate Change Service (C3S) Climate Data Store (CDS) 

Zeng, Z. et al. (2021): Estimation and Long-term Trend Analysis of Surface Solar Radiation in Antarctica: A Case Study of Zhongshan Station. Adv. Atmos. Sci. 38, 1497–1509. 

Sedlar, J. et al. (2021): Development of a Random-Forest Cloud-Regime Classification Model Based on Surface Radiation and Cloud Products. J. Appl. Meteor. Climatol., 60, 477–491.

How to cite: Cavaliere, A., Frangipani, C., Baracchi, D., Becherini, F., Lupi, A., Mazzola, M., Pulimeno, S., Shullani, D., and Vitale, V.: Surface radiation budget data in a bipolar perspective: observations, comparison and exploiting for products., EGU General Assembly 2025, Vienna, Austria, 27 Apr–2 May 2025, EGU25-11681, https://doi.org/10.5194/egusphere-egu25-11681, 2025.

EGU25-12116 | Orals | AS4.1

Melting energy sources in rainfall conditions over Pine Island Bay, Antarctica. 

Denys Pishniak, Ella Gilbert, Larysa Pysarenko, and Andrew Orr

The case of a strong heat anomaly around Pine Island Bay is examined. This region of west Antarctica is well known for its rapidly thinning and accelerating marine-terminating glaciers. Polar-WRF model simulations were used to investigate the atmospheric structure, dynamic and energy fluxes of this event at high spatial resolution. The modeling discovered a hot spot that formed due to the development of relatively large-scale foehn phenomena at the basin of Pine Island Glacier (PIG). The thickness of the positive temperature layer over this region can exceed 1 km with a maximum of +8ºC. The layering of several warm air masses, accompanied by atmospheric rivers, causes significant liquid precipitation over coastal glaciers and ice shelves.  In such rare cases precipitation makes the main contribution to heat flux directed from atmosphere to the surface. The flux can reach up to 400 W m-2 in the form of latent heat (which may release later). Direct heat transfer is also contributing to surface warming as a negligible part of the heat balance. We also tried to estimate a nonlinear dependence of precipitation heat fluxes in relation to atmosphere warming.  Finally, Noah LSM used in WRF model has some simplicities that make it not an ideal instrument for estimation of precipitation heat fluxes in polar regions. Although precipitation distribution and local wind patterns are sensitive to topography representation and demand high model resolution for estimation accuracy.

How to cite: Pishniak, D., Gilbert, E., Pysarenko, L., and Orr, A.: Melting energy sources in rainfall conditions over Pine Island Bay, Antarctica., EGU General Assembly 2025, Vienna, Austria, 27 Apr–2 May 2025, EGU25-12116, https://doi.org/10.5194/egusphere-egu25-12116, 2025.

EGU25-12294 | ECS | Posters on site | AS4.1

Evolution of precipitations and snow depth over the Arctic sea ice modeled by the regional climate model MAR 

Clara Lambin, Christoph Kittel, Damien Maure, Brice Noël, and Xavier Fettweis

The Arctic is experiencing changes in precipitation, both in terms of amount and phase, due to rising temperatures. Key mechanisms contributing to these changes include increased poleward moisture transport and higher ocean evaporation resulting from the shrinking sea ice cover. In autumn, changes in precipitation over the sea ice can influence its growth by altering the insulation between the ocean and the atmosphere. A reduction in snow cover (which has lower insulating properties) enables the ocean to cool faster by releasing heat into the atmosphere, thus promoting sea ice growth. In spring, variations in snowfall and rainfall can affect the sea ice albedo, influencing its melting rate. Using the regional climate model MAR, which includes a complex snow scheme, we examine trends in precipitation and snow depth over the Arctic sea ice during the growth season. We also conduct sensitivity tests to assess the response of snow depth to changes in sea ice thickness.

How to cite: Lambin, C., Kittel, C., Maure, D., Noël, B., and Fettweis, X.: Evolution of precipitations and snow depth over the Arctic sea ice modeled by the regional climate model MAR, EGU General Assembly 2025, Vienna, Austria, 27 Apr–2 May 2025, EGU25-12294, https://doi.org/10.5194/egusphere-egu25-12294, 2025.

EGU25-13156 | Posters on site | AS4.1

Polar-to-midlatitude teleconnections in a warming world: Statistical relationships from large ensembles 

Carley Iles, Bjørn Samset, and Marianne Lund

How are polar-to-midlatitude teleconnections represented in recent large ensembles of coupled climate model simulations? And how do they evolve with global warming? Using the rich information on internal variability available from large ensembles, we investigate the relationship between sea ice amount and atmospheric circulation for both Arctic and Antarctic sea ice variability in CESM2 and ACCESS-ESM1-5, using a composite analysis. We find that the links between sea ice and sea level pressure (SLP), the midlatitude jet stream and temperature depend on the region in which sea ice varies, for instance with low Barents-Kara sea ice in January being associated with a positive North Atlantic Oscillation SLP pattern and high pressure over Northern Eurasia. These circulation patterns persist with increased levels of global warming, until around 3 or 4°C when they start to evolve in some cases, as sea ice starts to disappear. Surface air temperatures are anomalously high around the region of sea ice retreat with varying patterns of remote cooling elsewhere. Lagged analysis shows that sea-ice circulation relationships when the atmosphere leads sea ice are very similar to the instantaneous relationships, suggesting that the latter largely reflects the atmospheric patterns leading to reduced sea ice. For positive lags (sea ice leading the atmosphere), for some regions the SLP teleconnections persist in a weakened state for subsequent months, whilst for others they evolve, e.g. into a negative Arctic Oscillation response for Barents-Kara sea ice reduction. However, results for positive lags differ between the two models examined. SLP relationships with Antarctic sea ice are model dependent, but feature a negative Southern Annular Mode pattern in ACCESS-ESM1-5. In CESM2, we find a less zonally symmetric pattern which also consists of high pressure over the pole in Autumn and Winter.

How to cite: Iles, C., Samset, B., and Lund, M.: Polar-to-midlatitude teleconnections in a warming world: Statistical relationships from large ensembles, EGU General Assembly 2025, Vienna, Austria, 27 Apr–2 May 2025, EGU25-13156, https://doi.org/10.5194/egusphere-egu25-13156, 2025.

EGU25-13164 | ECS | Orals | AS4.1

The Key Role of the Southern Annular Mode During the Seasonal Sea Ice Maximum in Recent Antarctic Sea Ice Loss 

Chloe Boehm, David W.J. Thompson, and Edward Blanchard-Wrigglesworth

Southern Hemisphere sea ice area (SH SIA) exhibited weak increases from the early 1980s until 2015 when it abruptly dropped, setting record low values in 2017, 2022, and 2023. The reasons for the rapid declines in SH SIA remain open to debate, with potential explanations ranging from changes in tropical Pacific climate, warming of the high latitude subsurface ocean, and contemporaneous variations in the extratropical atmospheric circulation. Here we provide novel insights into the role of the extratropical atmospheric circulation in driving year-to-year and long-term changes in Antarctic sea ice, with a focus on the influence of the Southern annular mode (SAM) on recent trends in SH sea ice area. The influence of the SAM on SH SIA exhibits a more pronounced seasonal variation than that indicated in previous work: during the annual sea ice minimum, anomalous circumpolar westerlies associated with the positive polarity of the SAM lead to increases in SH SIA that persistent for several months. In contrast, during the annual sea ice maximum, anomalous circumpolar westerlies associated with the positive polarity of the SAM lead to pronounced decreases in Antarctic sea ice that persist for up to a year. In terms of annual-mean SH SIA, by far the largest impacts arise from variations in the atmospheric circulation during the sea ice maximum. As a result, changes in the SAM during the sea ice maximum have had a marked impact on long-term changes in SH SIA. These linkages are robust in both observationally constrained data products and modeled data, with additional results exploring how this relationship changes as the mean state of the climate changes under global warming.

How to cite: Boehm, C., Thompson, D. W. J., and Blanchard-Wrigglesworth, E.: The Key Role of the Southern Annular Mode During the Seasonal Sea Ice Maximum in Recent Antarctic Sea Ice Loss, EGU General Assembly 2025, Vienna, Austria, 27 Apr–2 May 2025, EGU25-13164, https://doi.org/10.5194/egusphere-egu25-13164, 2025.

EGU25-13984 | ECS | Posters on site | AS4.1

Quality-controlled meteorological datasets from SIGMA automatic weather stations in northwest Greenland 

Motoshi Nishimura, Teruo Aoki, Masashi Niwano, Sumito Matoba, Tomonori Tanikawa, Tetsuhide Yamasaki, Satoru Yamaguchi, and Koji Fujita

In situ meteorological data are essential for a better understanding of the ongoing environmental changes in the Arctic. In order to increase the scientific value of discussions on understanding the actual state of environmental change in a given area, it is necessary to appropriately remove the anomalous values recorded due to external factors resulting from low temperature and icing. Here we present methods for quality control (QC) of meteorological observation datasets from two automatic weather stations in northwest Greenland, where drastic glaciological and meteorological environmental changes have occurred. The stations were installed in the accumulation area of the Greenland Ice Sheet (SIGMA-A site, 1490 m a.s.l.) and near the equilibrium line of the Qaanaaq Ice Cap (SIGMA-B site, 944 m a.s.l.). We describe the two-step sequence of QC procedures we used to produce increasingly reliable data sets by masking erroneous records. This method was developed for the climatic conditions of Greenland, however, it is designed to be as universally applicable as possible, with a basis in meteorology and glaciology, and with the intention of removing the subjectivity of the person performing the QC. The QC is divided into two processes: Initial Control and Secondary Control. Initial Control removes values that violate physical laws and also serves as a preliminary process to improve the accuracy of Secondary Control. Secondary Control removes abnormal values using stricter statistical criteria than Initial Control. As a result of this two-step process, controlled by scientifically objective criteria, we were able to successfully remove erroneous data sets and greatly reduce the time required for QC. In addition, by using a generally applicable process, we were able to successfully establish an algorithm that could be applied to multiple sites. The data sets from both the SIGMA-A and SIGMA-B sites were classified into three levels (Level 1.1 to Level 1.3) according to the stage of data processing. Level 1.1 is the so-called raw data, in which the data for the period when the logger was stopped are masked (processed to flag them as missing or abnormal), the so-called raw data. Level 1.2 and Level 1.3 are datasets to which Initial Control and Secondary Control have been applied to the Level 1.1 and Level 1.2 datasets, respectively, and the Level 1.3 dataset is a dataset from which all abnormal values have been removed. These datasets have been archived in the Arctic Data Archive System (ADS) operated by the National Institute of Polar Research in Japan (e.g., Level 1.3 dataset: SIGMA-A - https://doi.org/10.17592/001.2022041303 and SIGMA-B - https://doi.org/10.17592/001.2022041306).

How to cite: Nishimura, M., Aoki, T., Niwano, M., Matoba, S., Tanikawa, T., Yamasaki, T., Yamaguchi, S., and Fujita, K.: Quality-controlled meteorological datasets from SIGMA automatic weather stations in northwest Greenland, EGU General Assembly 2025, Vienna, Austria, 27 Apr–2 May 2025, EGU25-13984, https://doi.org/10.5194/egusphere-egu25-13984, 2025.

EGU25-14448 | ECS | Posters on site | AS4.1

Coupled Influence of Synoptic Weather and Topographic Control on Near-surface Wind Variability in the Denman Glacier Basin, East Antarctica 

Zhaohui Wang, Laurie Menviel, Alex Sen Gupta, Ian Goodwin, Zijian Chen, and Thomas Caton Harrison

Denman Glacier Basin, a critical region for studying polar ice dynamics and climate change impacts, is heavily influenced by the combination of topographic and atmospheric conditions, particularly experiencing strong downslope winds. This study examines the structure and variability of near-surface winds in the basin, focusing on the influence of large-scale circulation, synoptic weathers, and local orographic effects. Through high-resolution atmospheric simulation experiments, we demonstrate the forced components of near-surface winds during prevalent synoptic systems in the area, quantifying the roles of large-scale and locally driven forces in shaping wind structure and variability. We also conduct perturbation experiments with topographies of varying resolutions to examine the orographic controls on the spatial climatology of downslope winds, in response to a range of synoptic systems typical to the region. Our findings can be used to clarify uncertainties in interpreting snow accumulation variability in ice cores and determining whether modern regional mass balance trends result from increased glacial discharge or shifts in synoptic circulation. This research findings will be used to interpret the Denman Glacier discharge, snow accumulation over the basin, aiding in the interpretation of recent ice core data collected in the recent field season.


How to cite: Wang, Z., Menviel, L., Sen Gupta, A., Goodwin, I., Chen, Z., and Caton Harrison, T.: Coupled Influence of Synoptic Weather and Topographic Control on Near-surface Wind Variability in the Denman Glacier Basin, East Antarctica, EGU General Assembly 2025, Vienna, Austria, 27 Apr–2 May 2025, EGU25-14448, https://doi.org/10.5194/egusphere-egu25-14448, 2025.

EGU25-14582 | ECS | Orals | AS4.1

Extreme Precipitation in the Cyrosphere: Atmospheric River Interaction with Antarctic Sea Ice 

Gabrielle Linscott, Chelsea Parker, Linette Boisvert, and Elina Valkonen

In 2016, Antarctic sea ice experienced a regime shift when a persisting decreasing trend emerged from a relatively stable annual cycle. Drivers of the sea ice regime shift and future projections of Southern Ocean sea ice remain unresolved. One possible contributing phenomena are atmospheric rivers (ARs), which are long, narrow, and transient features responsible for the majority of global poleward water vapor transport. Though infrequent over Antarctica, ARs wield a substantial influence on the Antarctic ice mass balance. Previous studies highlight their significance, attributing 35% of the interannual precipitation variability over the Antarctic Ice Sheet (AIS) to ARs. The interaction between ARs and Antarctic sea ice has not been as clearly defined. Our ongoing work uses ERA5 reanalysis data, results from an AR tracking algorithm, and passive microwave sea ice concentration data from 1980 to 2023 to examine the relationship between ARs and Antarctic sea ice, especially in the context of the changing sea ice state. In this study, we explore the relationship between AR activity and sea ice area at a region and seasonal scale, then analyse the contribution of ARs to precipitation over sea ice and how that contribution has changed through the 40-year study period. On average, ARs can be attributed with 11% of total precipitation, 11% of snowfall, and 13% of rain over Antarctic sea ice. While the AR contribution to sea ice snowfall is fairly consistent through the year, the predominant AR contribution to rain rotates around the Southern Ocean sequentially by season. The strongest signal of AR precipitation over sea ice is in the Weddell Sea winter, when ARs constitute 25% of winter rain. The trends of these contributions vary by season and by region. For example, while AR precipitation on sea ice has an increasing trend across all types of precipitation in each season in the Weddell Sea, the opposite is true for the Ross Sea. These findings underscore the importance of the AR interaction with Antarctic sea ice, particularly in the context of seasonal and regional variability and change. This work will improve our understanding of the spatiotemporal variability and trends of ARs as precipitation mechanisms, which is vital for understanding and predicting sea ice mass balance in a changing climate.

How to cite: Linscott, G., Parker, C., Boisvert, L., and Valkonen, E.: Extreme Precipitation in the Cyrosphere: Atmospheric River Interaction with Antarctic Sea Ice, EGU General Assembly 2025, Vienna, Austria, 27 Apr–2 May 2025, EGU25-14582, https://doi.org/10.5194/egusphere-egu25-14582, 2025.

EGU25-15568 | ECS | Posters on site | AS4.1

Emulating Greenland Ice Sheet Surface Melt Using Graph Neural Networks 

Ziqi Yin, Aneesh Subramanian, and Rajashree Datta

As global mean temperatures exceeded the 1.5 °C threshold in 2024, the urgency to better quantify the impacts of global warming, including sea level rise contributions from polar ice sheets, has intensified. The Greenland Ice Sheet (GrIS) has experienced significant mass loss over recent decades, primarily driven by surface melting, a process expected to accelerate under continued warming. Surface melt is influenced by a combination of factors and complex interactions between atmosphere and ice sheet surface, but simulating these processes using coupled climate models is computationally expensive and often impractical.

In this study, we develop a graph neural network (GNN) as an emulator for GrIS surface melt, trained on output from the Community Earth System Model version 2 (CESM2), which explicitly calculates surface melt through a downscaled surface energy balance framework. GNNs are uniquely suited to this task, as they capture spatial and relational dependencies across the ice sheet, enabling the emulator to reproduce spatially resolved melt fields and identify the influence of key atmospheric patterns.

We will first evaluate the emulator’s performance in replicating CESM2 simulated melt under different climatic conditions and employ explainability techniques to identify the relative importance of key atmospheric patterns in driving surface melt. This work aims to demonstrate the utility of machine learning emulators in enhancing our understanding of GrIS surface melt dynamics and advancing projections of sea level rise under future climate scenarios.

How to cite: Yin, Z., Subramanian, A., and Datta, R.: Emulating Greenland Ice Sheet Surface Melt Using Graph Neural Networks, EGU General Assembly 2025, Vienna, Austria, 27 Apr–2 May 2025, EGU25-15568, https://doi.org/10.5194/egusphere-egu25-15568, 2025.

Greenland's contribution to global mean sea level exhibits decadal variability, driven by interannual surface mass balance (SMB) changes. In this study, we attribute historical Greenland SMB changes to radiative forcings using the Community Earth System Model version 2 Large Ensemble and its single-forcing Large Ensemble simulations (CESM2-LE and CESM2-SFLE), which enables separation of impacts from greenhouse gases and aerosols. We quantify the contribution of radiative forcings to Greenland SMB changes by estimating univariate and multivariate detection and attribution scaling factors through Bayesian total least squares regression implemented via Markov Chain Monte Carlo (MCMC). The MCMC formulation allows us to quantify the uncertainty of the scaling factors using prior knowledge from observation-based simulations and reconstructions, as well as CESM2-LE and CESM2-SFLE. Our results indicate that historical Greenland SMB changes can be attributed to anthropogenic forcings, including anthropogenic aerosols, which affect decadal scale variability superimposed on the greenhouse gas-driven long-term trend. However, CESM2 tends to underestimate the relative contribution of each individual forcing to observed historical Greenland SMB changes. To explore potential reasons for this underestimation, we test a few hypotheses, including the role of internal variability. Our analysis demonstrates that internal variability plays only a minor role in the underestimation of the forced Greenland SMB changes due to individual forcings. Additionally, we find that Greenland runoff changes, rather than precipitation changes, explain both the SMB changes and the underestimation of attributable portions to individual forcings. Our findings emphasize the confounding role of aerosol forcing on the historical SMB trajectory but also highlight outstanding questions regarding the ability of climate models to correctly parse such influences. We will discuss the implications of these issues and steps to address them.

How to cite: Kuo, Y.-N., Culberg, R., and Lehner, F.: Assessing the portion of historical Greenland surface mass balance change attributable to anthropogenic forcing and its uncertainties, EGU General Assembly 2025, Vienna, Austria, 27 Apr–2 May 2025, EGU25-15676, https://doi.org/10.5194/egusphere-egu25-15676, 2025.

EGU25-15824 | ECS | Orals | AS4.1

Exploring atmospheric transport into the Arctic 1940 to 2023 - A Lagrangian Perspective 

Andreas Plach, Lucie Bakels, and Andreas Stohl

The Arctic is a key component of the Earth’s climate system and has received much attention in recent years due to it’s above-average warming (Arctic Amplification). Furthermore, we know that the Arctic is not a closed system, but is influenced by atmospheric transport from lower latitudes, a fact that for example can be observed during spring when polluted air transported from lower latitudes regularly leads to a reduction in visibility (Arctic Haze).

In order to better understand the observed warming and pollution events we investigate circulation and transport patterns in the Arctic by calculating residence times, following air particle trajectories to and from the Arctic, and studying the dynamical characteristics of the Polar Dome. For our investigation we employ a newly created Lagrangian Reanalysis (LARA) dataset which is based on global simulations with the Lagrangian Particle Dispersion Model FLEXPART forced with ERA5 reanalysis data for the period 1940 to 2023.

Similar to a previous study we find average Arctic residence times in the order of one (January) to two weeks (July). Preliminary results indicate that these residence times have changed most during the transition months, especially in spring (e.g., shorter Arctic residence times in April at present than in the mid-20th century). However, we find strong spatial differences in residence times and in their changes over time. In this presentation we aim to discuss the seasonal and spatial characteristic of the residence times, investigate potential pollution source regions, explore the dynamical characteristics of the Polar Dome, and analyze how all of this has changed between 1940 and 2023. Furthermore, we plan to investigate the relation of observed dynamical changes to changes in sea ice, North Atlantic Oscillation, and other observations.

How to cite: Plach, A., Bakels, L., and Stohl, A.: Exploring atmospheric transport into the Arctic 1940 to 2023 - A Lagrangian Perspective, EGU General Assembly 2025, Vienna, Austria, 27 Apr–2 May 2025, EGU25-15824, https://doi.org/10.5194/egusphere-egu25-15824, 2025.

EGU25-15984 | ECS | Posters on site | AS4.1

Pathways of Atmospheric Rivers in the Arctic: Dynamics, Moisture Transport, and Impacts on Sea Ice during April 2020 

Luisa E. Aviles Podgurski, Patrick Martineau, Hua Lu, Ayako Yamamoto, Tony Phillips, Tom Bracegirdle, Amanda C. Maycock, Andrew Orr, Andrew Fleming, Anna E. Hogg, and Grzegorz Muszynski

In recent decades, the Arctic has warmed nearly four times faster than the global average, undergoing profound changes as a result. A key factor in this accelerated warming is the meridional transport of atmospheric water vapour. Particularly, intense intrusions of moisture and heat, so-called atmospheric rivers (ARs), are rare phenomena to reach the high latitudes, but can have severe impacts on the Arctic environment.

In this study, we examine an AR pair in April 2020 using a combination of Eulerian and Lagrangian methods alongside observational data from Multidisciplinary drifting Observatory for the Study of Arctic Climate (MOSAiC) expedition. The event consisted of two distinct ARs that followed separate pathways - one across Siberia and the other across the Atlantic - before converging in the central Arctic within the span of one week. Large-scale atmospheric circulation patterns associated with these ARs show a combination of low and high pressure systems on the flanks of the ARs, channelling moisture and heat northward. Notably, our results show that the Siberian AR was linked to extreme heat anomalies, whereas the Atlantic AR primarily transported abundant moisture.

Backward air parcel trajectories calculated using LAGRANTO provide new insights into the complex dynamics of Arctic ARs, revealing details of their distinct pathways and moisture source regions. Analysis of these trajectories also uncovers a strong connection between the observed sea ice melt in the Barents-Kara Sea and the interaction of an AR with the ice edge, underscoring the significant influence of ARs on the Arctic climate system.

How to cite: Aviles Podgurski, L. E., Martineau, P., Lu, H., Yamamoto, A., Phillips, T., Bracegirdle, T., Maycock, A. C., Orr, A., Fleming, A., Hogg, A. E., and Muszynski, G.: Pathways of Atmospheric Rivers in the Arctic: Dynamics, Moisture Transport, and Impacts on Sea Ice during April 2020, EGU General Assembly 2025, Vienna, Austria, 27 Apr–2 May 2025, EGU25-15984, https://doi.org/10.5194/egusphere-egu25-15984, 2025.

EGU25-16387 | Posters on site | AS4.1

Characteristics of Strong Winds at Jang Bogo Station in East Antarctica: An 8-Year Observational Study 

Hataek Kwon, Yonghan Choi, and Sang-Jong Park

This study investigates the characteristics and mechanisms of strong winds at Jang Bogo Station (74°37'S, 164°12'E) in Terra Nova Bay, East Antarctica, using 8 years (2015-2022) of Automated Synoptic Observation System (ASOS) data and ERA5 reanalysis data. Analysis of strong wind patterns reveals two distinct strong wind regimes: southwesterly (180-270°) and northwesterly (270-360°) winds. Strong wind events show clear seasonal variation, with peak frequencies occurring in March and July. Synoptic analysis using ERA5 reanalysis data indicates that these strong winds are primarily driven by the interaction between the Amundsen Sea Low and the Antarctic continental high pressure system. The intensity and positioning of these pressure systems significantly influence both wind direction and speed at Jang Bogo Station. Notably, the strongest winds (top 1%) are predominantly northwesterly, associated with enhanced pressure gradients near the station. Case studies of extreme wind events reveal two distinct generating mechanisms: one associated with intense pressure gradients from passing cyclonic systems, and another linked to katabatic flows descending from the Antarctic interior. These findings provide important insights into the wind regime of Terra Nova Bay and contribute to our understanding of Antarctic meteorological patterns, which has implications for both operational forecasting and regional climate studies.

How to cite: Kwon, H., Choi, Y., and Park, S.-J.: Characteristics of Strong Winds at Jang Bogo Station in East Antarctica: An 8-Year Observational Study, EGU General Assembly 2025, Vienna, Austria, 27 Apr–2 May 2025, EGU25-16387, https://doi.org/10.5194/egusphere-egu25-16387, 2025.

EGU25-17914 | ECS | Orals | AS4.1

EC-Earth- and ERA5-driven retrospective ensemble hindcasts with the fully coupled ice-sheet–ocean–sea ice–atmosphere–land circum-Antarctic model PARASO 

Florian Sauerland, Pierre-Vincent Huot, Sylvain Marchi, Hugues Goosse, and Nicole van Lipzig

We present 4 retrospective hindcasts using PARASO, a five-component (ice sheet, ocean, sea ice, atmosphere, and land) fully coupled regional climate model over an Antarctic circumpolar domain: a control run forced at its boundaries with reanalysis data from ERA5 and ORAS5, and an ensemble of 3 members forced by 3 different EC-Earth global hindcasts. The ERA5 driven hindcast is shown to accurately simulate the increase in maximum sea ice extent observed prior to 2014. This trend being absent from the EC-Earth driven hindcasts, with strong intra-ensemble agreement, suggests a large influence of mid-latitude forcings, rather than a misrepresentation of local processes in global models. We analyse other factors possibly contributing to the diverging sea ice trends, such as ocean temperature and large-scale circulation patterns, and the spatial pattern of these sea ice changes. It is shown that all simulations display a sea ice retreat in the Amundsen Sea, which has previously been shown to be related to the intensification of the Amundsen Sea Low. Similarly, they all display an increase in sea ice extent in the Indian ocean sector, off of Enderby Land and the Amery Ice Shelf. However, the spatial extent of these areas differs between the ERA5 and EC-Earth driven hindcasts, and the trend diverges around the Antarctic Peninsula and in the Weddell Sea.

Furthermore, we explore how the diverging sea ice extent trends are translating into diverging evaporation trends, which in turn results in diverging moisture transport and surface mass balance trends for the Antarctic continent, even though all hindcasts once again agree on an increasing trend of moisture transport from the mid-latitudes. It is demonstrated that the EC-Earth driven hindcasts agree on most trends affecting the surface climate in Antarctica and the Southern Ocean, both in intensity and spatial pattern. However, the trends seen over the continent are less consistent between the EC-Earth ensemble members, compared to the ones seen over the Southern Ocean, indicating a larger influence of internal variability.

How to cite: Sauerland, F., Huot, P.-V., Marchi, S., Goosse, H., and van Lipzig, N.: EC-Earth- and ERA5-driven retrospective ensemble hindcasts with the fully coupled ice-sheet–ocean–sea ice–atmosphere–land circum-Antarctic model PARASO, EGU General Assembly 2025, Vienna, Austria, 27 Apr–2 May 2025, EGU25-17914, https://doi.org/10.5194/egusphere-egu25-17914, 2025.

EGU25-19587 | ECS | Posters on site | AS4.1

Investigating the drivers of future changes in Arctic aerosols in UKESM1 using a Lagrangian air-mass trajectory framework 

Prerita Agarwal, Laura J. Wilcox, Steven T. Turnock, and Daniel Partridge

Aerosols are well-known climate forcers, yet their climatic impact on the Earth’s radiative budget remains uncertain. One of the reasons for this is poor representation of the aerosol-cloud interaction (ACI) process in the current Global Climate models (GCMs). Aerosol number size distributions in the atmosphere influence key ACI-relevant aerosol and cloud properties and, therefore, need to be accurately represented in GCMs. Understanding aerosol sources and sinks in pristine polar regions is crucial for improving climate projections, as several studies highlight the poor performance of GCMs in these areas. Moreover, it offers the advantage of understanding the impact of future changes in transport patterns on aerosol-climate feedback in sensitive background regions. To this end, improved representation of the regional distribution of aerosol emissions, and their temporal variations in climate models for near-term projections is a crucial gap that needs urgent attention. As the European Union (EU) aims to be climate-neutral by 2050, this study seeks to advance our understanding of aerosol life cycle processes in response to future regional emission changes.

We capitalise on a recently developed framework from the AeroCom Phase III GCM Trajectory (GCMTraj ) experiment, which leverages GCM meteorological fields to calculate the air-mass trajectories (Kim et al., 2020). Our work utilises the free-running and nudged UKESM1-0-LL versions from Regional Aerosol Model Intercomparison Project (RAMIP) simulations to calculate the trajectories and perform a spatio-temporal collocation of aerosol diagnostics. Here, we explore the various shared socioeconomic pathways (SSP370 and SSP370-126aer) from RAMIP to compare the impacts of global warming and aerosol reductions on future aerosol trends. This is the first time the free-running simulations from RAMIP have been used to calculate future air-mass trajectories. Using these trajectories we analyse the changes in source-receptor trends resulting from significant regional emission reductions in the post-fossil Arctic aerosol regime (2050) at Mt. Zeppelin.

We find continental air-mass transport from the northwest, Nordic and Siberian regions, towards the receptor site, Mt. Zeppelin and a strong seasonal variation in the transport patterns between 2010-2014 and 2046-2050. These results contrast with trajectories derived from ERA-Interim, ERA5 reanalysis and UKESM1 (nudged version), which reveal dominant air mass transport from the south-west, Eurasia and the northern Atlantic Ocean between 2010-2014. The results demonstrating seasonal characteristics of aerosol sources and sinks owing to changes in future circulation and emission patterns will be presented. This work will help improve knowledge of ACI evolution in response to changes in regional emission trends in the post-fossil remote aerosol regime. 

How to cite: Agarwal, P., J. Wilcox, L., T. Turnock, S., and Partridge, D.: Investigating the drivers of future changes in Arctic aerosols in UKESM1 using a Lagrangian air-mass trajectory framework, EGU General Assembly 2025, Vienna, Austria, 27 Apr–2 May 2025, EGU25-19587, https://doi.org/10.5194/egusphere-egu25-19587, 2025.

Floods are one of India’s most catastrophic natural disasters, causing extensive loss of life and property. Recent research highlights that compound floods—arising from the interplay of multiple drivers—pose greater risks than individual flood events. Although compound flood drivers like precipitation and storm surge, precipitation and runoff, and others have been the focus of recent research globally, very limited research has been done on these flood drivers in India. To address this gap, we conducted a comprehensive compound flood analysis of Peninsular India river basins from 1980 to 2023, utilizing precipitation, runoff, and soil moisture data. Extreme events were identified using a certain percentile threshold (95th and 99th percentiles) for all the parameters and each parameter was initially subjected to a univariate analysis. The preliminary results indicate that individual drivers provide limited insights of these flood drivers. To address this, we employed a bivariate copula-based approach to estimate joint distributions at varying percentiles (25th, 50th, 75th, 90th, and 95th percentile). The analysis using copula was focused to determine of exceedance probability, conditional probability, joint return period, and conditional return period for the paired variables: precipitation-runoff, precipitation-soil moisture, and runoff-soil moisture pairs, respectively. Our results illustrate that, especially in instances where there are multiple contributing components, bivariate analyses provide deeper insights into comprehending the complexity of flood dynamics. Additionally, it has been observed that some regions in our research region had shorter return durations and higher exceedance probabilities, suggesting that compound flood events of lower severity occur frequently. Identical patterns were noted for conditional return durations and conditional probabilities. These results underscore the critical importance of understanding the interconnections among flood drivers for effective flood risk estimation. Our study provides valuable insights for enhancing India’s flood management strategies by identifying disaster-prone regions and informing policymakers in the development of targeted mitigation measures.

How to cite: Mukherjee, A., Poonia, V., and Swarnkar, S.: Probabilistic Evaluation of Compound Flooding in Peninsular India: A Copula-Based Analysis of Precipitation, Runoff, and Soil Moisture , EGU General Assembly 2025, Vienna, Austria, 27 Apr–2 May 2025, EGU25-386, https://doi.org/10.5194/egusphere-egu25-386, 2025.

EGU25-847 | ECS | Posters on site | NH1.4

Seasonality change in ERA5 convective precipitation in the Greater Alpine Region. 

Giovanni Saglietto and Olivia Ferguglia

Convective precipitation plays a crucial role in extreme weather events, significantly influencing regional hydrological patterns, especially in topographically complex areas such as the Greater Alpine Region (GAR). Despite its importance, the study of convective precipitation remains limited due to its high spatial and temporal variability, which poses challenges for accurate observation and representation in climate models. Reanalysis datasets, such as ERA5, offer a valuable resource for overcoming these challenges, providing consistent, high-resolution data derived from both observational records and model outputs. However, the convective component of precipitation in ERA5 remains insufficiently explored, particularly regarding extreme events and seasonal trends. This study investigates the convective component of precipitation in the GAR using the ERA5 reanalysis dataset, focusing on extreme precipitation and their seasonality. By applying extreme precipitation indices from the ETCCDI framework, we identify a significant increase in the convective fraction of precipitation in recent decades, particularly during summer extreme events, along with an extension of the summer convective season. Trends in monthly precipitation are found to be largely driven by changes in the convective component, emphasising its growing influence on regional precipitation patterns. Additionally, the study is extended to CMIP6 global climate models, providing further insight into the representation of convective precipitation in climate projections. This work contributes to advancing the understanding of convective processes in climate models, emphasizing a critical gap in the current representation of precipitation in mountainous regions.

How to cite: Saglietto, G. and Ferguglia, O.: Seasonality change in ERA5 convective precipitation in the Greater Alpine Region., EGU General Assembly 2025, Vienna, Austria, 27 Apr–2 May 2025, EGU25-847, https://doi.org/10.5194/egusphere-egu25-847, 2025.

EGU25-973 | ECS | Posters on site | NH1.4

Elevation dependent effects of precipitation on river discharge at different spatio-temporal scales 

Vikas Kumar Kushwaha, Luca Lombardo, Anna Basso, Alberto Viglione, and Enrico Arnone

The link between climate extremes and river floods is complex and greatly affected by regional characteristics. River discharges are highly dependent on elevation and size of catchment in mountainous regions. This study explores the effects of orography on the precipitation-discharge relationship in the Greater Alpine Region (GAR). We make use of  daily discharge data and several reanalysis and observation datasets. The region is stratified into low (LE), and high (HE) elevation categories to assess variations in discharge responses. The correlation of discharges with precipitation at HE shows stronger relationship during the autumn season (September-November), while LE exhibits a stronger association in summer (June-August). Coarser resolution (>0.25o) datasets show degradation of the association of precipitation with river discharge at both elevation categories,  although with a larger sensitivity of HE  to decreasing spatial resolution (i.e. 0.10o to 1o degree) as compared to the LE category. Significant sensitivity to spatio-temporal scales is found also in the intensity and duration of the climate extremes (ETCCDI indices) and their relationship with discharges in the GAR. This study emphasizes the advantages of high-resolution, multi-scale approaches to understand the intensity and duration of climate extremes and their impacts on river discharges. An improved framework integrating climate and orographic indices is essential to identify the complex relationships governing flood extremes in the GAR. The improved framework will contribute to the development of diagnostic tools and enhance the skill of future flood extreme projections by climate models.

How to cite: Kushwaha, V. K., Lombardo, L., Basso, A., Viglione, A., and Arnone, E.: Elevation dependent effects of precipitation on river discharge at different spatio-temporal scales, EGU General Assembly 2025, Vienna, Austria, 27 Apr–2 May 2025, EGU25-973, https://doi.org/10.5194/egusphere-egu25-973, 2025.

EGU25-1036 | ECS | Orals | NH1.4

Reliability of Climate Information to Forecast Season-Ahead Flood Quantiles for Indian Catchments 

Abinesh Ganapathy and Ankit Agarwal

Forecasting floods (peak flows/quantiles) with significant lead time is crucial for effective water resources management. Traditionally, it has been carried out by forcing meteorological drivers onto the hydrological models. However, season-ahead flood forecasting remains challenging due to the limitations of weather forecasting models and the complexities associated with multiple model-chain linkages. Thus, to circumvent this, we applied a climate-informed approach to forecast season-ahead flood quantiles. Briefly, a climate-informed model comprises 1) selection of predictands, 2) identification of suitable large-scale climate predictors that control the predictands, and 3) derivation of a statistical link between predictands and predictors. In our study, we condition the probability distribution parameters of flood samples with large-scale climate predictors, focusing specifically on sea surface temperature (SST) patterns. The rationale behind this approach lies in the established linkage of SST in the Pacific and Indian Oceans to the Indian Monsoon system. To minimise the anthropogenic signals, we restricted our analysis to the gauging stations without significant reservoir influences by filtering the stations with reservoir indices less than 0.1. Both linear and nonlinear relations between the climate predictors and predictands have been applied in this study. Bayesian inference is used to estimate the parametric values of the Climate-Informed model. Furthermore, the selection of the suitable climate predictor and the nature of their relationship to a specific gauge is based on the widely applicable selection criterion (WAIC). WAIC computes log posterior predictive density and adjusts the overfitting using the effective number of parameters; the model with the least WAIC value is preferred. We assessed the skill of the climate-informed model on flood quantile forecasting by performing a leave-one-out cross-validation technique. Various performance metrics, including both deterministic and probabilistic measures, have been used to assess the prediction skill of the model in reference to the stationary model. Overall, our results suggest that for the majority of the gauges, climate indices have the potential to forecast flood-quantiles season ahead. While this initial forecast can inform decision-makers regarding expected flood quantiles, it is recommended that this method be complemented with traditional approaches that account for local catchment behaviour.

How to cite: Ganapathy, A. and Agarwal, A.: Reliability of Climate Information to Forecast Season-Ahead Flood Quantiles for Indian Catchments, EGU General Assembly 2025, Vienna, Austria, 27 Apr–2 May 2025, EGU25-1036, https://doi.org/10.5194/egusphere-egu25-1036, 2025.

In recent years, extreme runoff has been affected by increasing climate change, which causes non-stationary behaviors in extreme runoff series. Climate change is driven by external forcing and internal variability. However, the role of these two factors in runoff variability remains unclear. Taking the historical period as the baseline, this study employs four Single-Model Initial-Condition Large Ensembles (SMILEs) to investigate future changes in extreme runoff represented by annual maximum 1-day runoff (AM1R) over China and to evaluate the impacts of external forcing and internal variability on these changes. A decomposition-based non-stationary frequency analysis method is proposed to estimate the frequency changes of extreme runoff events, which incorporates components of runoff influenced by external forcing and internal variability. Two shared socioeconomic pathways (i.e., SSP2-4.5 and SSP5-8.5) are selected for the future. The results show that the catchments with increased AM1R are more than those with decreased AM1R under SSP-2.4.5 and SSP5-8.5 scenarios for all SMILEs, with the catchments showing decreased AM1R mainly in Qinghai-Tibet Plateau and northeastern China. The impact of external forcing on runoff is stronger than that of internal variability at more than 35% and 62% of catchments for all SMILEs under SSP2-4.5 and SSP5-8.5 scenarios, respectively. The catchments with significant trends of AM1R are mainly in the eastern Qinghai-Tibet Plateau under the SSP2-4.5 scenario, while those are mainly in Qinghai-Tibet Plateau and southwestern China under the SSP5-8.5 scenario. For changes in the frequency of extreme runoff events, corresponding to the 50-yr return level of AM1R in the historical period, the return period is projected to become shorter in at least 66% of catchments for all SMILEs under the two scenarios. The study indicates that extreme runoff events are likely to become more frequent in the future, which is important for the flood prevention policy.

How to cite: Liu, Y. and Chen, J.: Extreme runoff variation and non-stationary frequency analysis based on external forcing and internal variability decomposition, EGU General Assembly 2025, Vienna, Austria, 27 Apr–2 May 2025, EGU25-2720, https://doi.org/10.5194/egusphere-egu25-2720, 2025.

EGU25-3278 | ECS | Posters on site | NH1.4

Atmospheric moisture linkages to flood inducing Multiday extreme precipitation in India 

Deepak Pandidurai, Akash Singh Raghuvanshi, and Ankit Agarwal

Extreme precipitation events are becoming more frequent and intense worldwide, significantly elevating the risk of devastating floods. India, as a hydrologically vulnerable region, experienced recurrent floods that lead to substantial economic losses and fatalities. This study explores the atmospheric drivers and moisture linkages responsible for multi-day extreme precipitation events that resulted in meteorological floods across India. Severe meteorological flood events were identified across India using the Dartmouth Flood Observatory (DFO) database. The study examines the interplay between Integrated Vapor Transport (IVT) & Integrated Water Vapor (IWV) at different vertical layers of the atmosphere, and precipitation at hourly timescales. Results highlight the critical role of elevated moisture transport in the lower atmosphere, which intensifies prior to flood events. Spatial analysis reveals a strong correspondence between IWV and precipitation patterns, suggesting that IWV provides a more consistent spatial signal for extreme precipitation events than IVT. The findings indicate that sustained moisture influx alone is insufficient to trigger extreme precipitation. However, its interaction with local atmospheric instability and synoptic-scale disturbances creates a conducive environment for prolonged precipitation, culminating in floods. This study underscores the importance of atmospheric moisture dynamics in driving extreme precipitation events and calls for deeper investigation into regional moisture budgets to improve flood prediction and mitigation strategies. 

Keywords: Meteorological floods, Atmospheric moisture transport, Multi-day extreme precipitation, Flood drivers. 

How to cite: Pandidurai, D., Raghuvanshi, A. S., and Agarwal, A.: Atmospheric moisture linkages to flood inducing Multiday extreme precipitation in India, EGU General Assembly 2025, Vienna, Austria, 27 Apr–2 May 2025, EGU25-3278, https://doi.org/10.5194/egusphere-egu25-3278, 2025.

EGU25-3512 | Orals | NH1.4

Shifting Flood Regimes Under Contradictory Precipitation Trends 

Efrat Morin, Yair Rinat, Moshe Armon, Yaniv Goldschmidt, Raz Nussbaum, and Francesco Marra

Global warming is driving an increase in extreme precipitation events across many regions worldwide, often leading to intensified flooding. However, other changing precipitation characteristics may counterbalance this effect. These include reductions in total event precipitation, precipitation coverage area, duration, and frequency. The interplay of these often-contradictory trends remains poorly understood, with limited mapping and quantification available.
Through a series of studies focusing on the eastern Mediterranean region, we identify this area as susceptible to these contrasting precipitation trends. Our research reveals a decline in average precipitation and the number of wet days, alongside an increase in extreme precipitation events for return periods ranging from 10 to 100 years. Furthermore, storm total precipitation, coverage area, and duration decrease while conditional precipitation intensities rise.
When these trends are incorporated into hydrological models to simulate catchment responses and flood impacts, the role of soil moisture emerges as a critical factor in flood regulation. Due to lower precipitation amounts and wet days number, average soil moisture decreases. Despite heightened precipitation intensity, this leads to diminished runoff in most cases. Additionally, smaller storm sizes reduce runoff-contributing areas, resulting in lower flow discharges within concentrating channels. However, urbanization amplifies these dynamics, as urban areas are more sensitive to increased precipitation intensities due to limited soil moisture regulation. Consequently, in future climate scenarios, the largest runoff events produce higher peak discharges and total runoff compared to historical conditions. In contrast, lower-intensity events exhibit reduced peak and total runoff. These effects are intensified as urban impervious surfaces expand, making precipitation intensity a dominant driver of urban runoff.
Our findings suggest that floods are not universally intensifying, even in the context of more extreme precipitation. The dampening effects of other precipitation properties can offset flood magnitudes, highlighting the complexity of flood behavior under changing climate conditions.

How to cite: Morin, E., Rinat, Y., Armon, M., Goldschmidt, Y., Nussbaum, R., and Marra, F.: Shifting Flood Regimes Under Contradictory Precipitation Trends, EGU General Assembly 2025, Vienna, Austria, 27 Apr–2 May 2025, EGU25-3512, https://doi.org/10.5194/egusphere-egu25-3512, 2025.

EGU25-4110 | ECS | Posters on site | NH1.4

Weather Regimes and Extreme Precipitation in the Great Alpine Region 

Ilaria Tessari, Ignazio Giuntoli, and Susanna Corti

This study investigates the relation between Euro-Atlantic large-scale atmospheric circulation and extreme precipitation events (EPEs) in the Great Alpine Region (GAR). We analyze the connection between weather regimes (WRs)—recurrent and quasi-stationary circulation patterns—and EPEs to assess temporal and spatial variations.

The analysis covers the period 1940–2023, using daily geopotential height data at 500 hPa and daily total precipitation data from ERA5 reanalysis. WRs classification mainly follows the methodology outlined by Grams et al. (2017), enabling year-round characterization of atmospheric patterns, which are then linked to average precipitation and EPEs, defined as precipitation exceeding the 95th percentile of the distribution and an intensity greater than 15 mm/day (Q95R15).

Our results show diversities in the average precipitation patterns over the GAR when different regimes occur. In particular, Scandinavian Trough (ScTr), Greenland Blocking (GrBL), Scandinavian Blocking (ScBL) and Atlantic Ridge (AR) seem mostly connected with average precipitation, whose intensity varies according to the season.

Relating WRs and extreme precipitation, we observe that spatially the association between WRs and EPEs varies across GAR sub-regions and depends on the season. We detect higher frequencies of occurrence for ScTr, GrBL, ScBL, AR and Atlantic Trough (ATr) when precipitation above Q95R15 occurs. For instance, during autumn (SON), EPEs are primarily linked to ScTr, ScBL and AR regimes; during winter (DJF) we observe ScTr, GrBL, ScBL, AR and ATr instead. During spring (MAM) and summer (JJA) a clear association is elusive up to now, needing further analysis to be clarified.

Investigations into different sub-periods are ongoing, in order to obtain more insights about how decadal changes due to forced and/or internal variability in the Euro-Atlantic circulation affect the occurrence of EPEs in the GAR.

How to cite: Tessari, I., Giuntoli, I., and Corti, S.: Weather Regimes and Extreme Precipitation in the Great Alpine Region, EGU General Assembly 2025, Vienna, Austria, 27 Apr–2 May 2025, EGU25-4110, https://doi.org/10.5194/egusphere-egu25-4110, 2025.

EGU25-4431 | ECS | Posters on site | NH1.4

Impact attribution of European floods: towards an operational system 

Dominik Paprotny, Aloïs Tilloy, Paweł Terefenko, Matthias Mengel, and Anaïs Couasnon

Floods are an ever-present risk to society and economy in Europe, influenced by both climatic and socioeconomic drivers. An accurate and timely attribution of impacts is important for risk management, “loss and damage” debate and public communication in context of climate change. Here, we discuss the opportunities and challenges of operationalizing attribution for European flood impacts in the framework of Horizon Europe project “Compound extremes attribution of climate change: towards an operational service” (COMPASS). The prospective operational service would build upon the framework for attribution of historical flood impacts for 42 European countries. The work so far includes an extensive modelling chain covering both riverine and coastal floods that can reconstruct temporal changes in hazard, exposure and vulnerability to quantify their influence on the observed flood impacts. It considers drivers such as climate change, catchment alteration, population and economic growth, land use change, and evolution of flood precaution and adaptation. High-resolution datasets with long time series are used to first reconstruct each flood event under the factual (historical) scenario, and then under counterfactual scenarios in which a particular climatic or socioeconomic driver is set to 1950 conditions. In this way, the role of each driver can be quantified relative to a common temporal benchmark. In total, 1729 impactful floods occurring between 1950 and 2020 were attributed to the various drivers, highlighting the role of not only climate change (hazard), but particularly population growth (increase in exposure) and adaptation (decrease in vulnerability). Further integration with available operational services, primarily the Copernicus Climate Change Service, would enable timely input data processing for the hydrological and hydrodynamic modelling of riverine and coastal flooding. The approach will be extended to multihazard events, which will be showcased through the use case of extra-tropical cyclone Xynthia, which resulted in major impacts from both coastal flooding and extreme wind speeds in France in 2010.

How to cite: Paprotny, D., Tilloy, A., Terefenko, P., Mengel, M., and Couasnon, A.: Impact attribution of European floods: towards an operational system, EGU General Assembly 2025, Vienna, Austria, 27 Apr–2 May 2025, EGU25-4431, https://doi.org/10.5194/egusphere-egu25-4431, 2025.

EGU25-6938 | Posters on site | NH1.4

Attribution of the July 2021 flood event in the Ahr region to anthropogenic climate change 

Viet Dung Nguyen, Bruno Merz, Li Han, Heiko Apel, Xiaoxiang Guan, Heidi Kreibich, and Sergiy Vorogushyn

Flood event attribution, including the analysis of extreme precipitation and flood peaks, is crucial for understanding how anthropogenic climate change influences these events. This study employs an unconditional attribution approach to quantify changes in the likelihood of the July 2021 flood in the Ahr region, western Germany, in a factual world representing the current climate compared to a pre-industrial counterfactual world without anthropogenic greenhouse gas emissions.

To achieve this, the non-stationary weather generator nsRWG, conditioned on large-scale circulation patterns (CPs) and regional mean daily temperature (t2m), is used to generate 100 realizations of synthetic precipitation and temperature data over a 30-year period for both worlds. The CPs, derived from the classification of mean sea level pressure, and t2m are obtained from the ERA5 reanalysis dataset for the factual world and from natural historic simulations of several CMIP6 GCMs for the counterfactual world. The nsRWG-generated data are further disaggregated to an hourly resolution and fed into the hydrological model mHM, set up for the Ahr basin, to simulate streamflow and derive hourly peak flow. The simulated extreme precipitation and peak flows are analyzed to estimate the likelihood of the July 2021 flood event in each climate state, forming the basis for calculating the probability ratio between the two worlds.

Our model-based results indicate that the likelihood of 1-day and 2-day extreme precipitation of the Ahr event is on average 1.28 and 1.63 times higher, respectively, in the current climate. The flood peak appears to be 1.07 times more likely in the present climate compared to the counterfactual world. These findings suggest that anthropogenic climate change has notably increased the likelihood of events like the July 2021 flood. The use of a weather generator in combination with a hydrological model paves the way towards hydrologic event attribution and sets the stage for further research into attribution of flood impacts.

How to cite: Nguyen, V. D., Merz, B., Han, L., Apel, H., Guan, X., Kreibich, H., and Vorogushyn, S.: Attribution of the July 2021 flood event in the Ahr region to anthropogenic climate change, EGU General Assembly 2025, Vienna, Austria, 27 Apr–2 May 2025, EGU25-6938, https://doi.org/10.5194/egusphere-egu25-6938, 2025.

EGU25-7489 | Orals | NH1.4

Using global temperature as a covariate to project flood risk 

Conrad Wasko, Lalani Jayaweera, Michelle Ho, Rory Nathan, Declan O'Shea, and Ashish Sharma

Flood estimates used in engineering design are commonly based on intensity–duration–frequency (IDF) curves derived from historical extreme rainfall. Under global warming, extreme rainfall is increasing, threatening the capacity of existing infrastructure. Hence, there is a need to update our methods of engineering design, namely our design rainfall intensities, for climate change.

One way of adjusting our design inputs for climate change is to incorporate covariates into the fitted probability distributions that describe extreme rainfall. To this end, here we evaluate which large-scale climate driver is best for modelling non-stationarity in IDF curves up to the 100-year design return level. The climate drivers we evaluate include global and continental mean temperature, continental diurnal temperature range, continental dewpoint temperature, continental precipitable water, the Indian Ocean Dipole, the El Niño Southern Oscillation, and the Southern Annular Mode.

Based on the Akaike Information Criteria, precipitable water is the superior covariate, irrespective of storm duration. However, when quantile changes across the historical period are inspected, we find that global temperature is best able to adequately capture the variability in changes across both storm duration and annual exceedance probability. We finish with presenting a case study where extreme rainfalls are projected using a global mean temperature covariate. The implications for flood risk are that, under 4ºC of global warming, flood risk increases by a multiple of eight.

How to cite: Wasko, C., Jayaweera, L., Ho, M., Nathan, R., O'Shea, D., and Sharma, A.: Using global temperature as a covariate to project flood risk, EGU General Assembly 2025, Vienna, Austria, 27 Apr–2 May 2025, EGU25-7489, https://doi.org/10.5194/egusphere-egu25-7489, 2025.

Floods induced by rainstorm events (RSEs) are among the most frequent natural disasters and have a significant impact on ecosystems and human society. While most extensive researches have investigated the magnitude, frequency, and risk of floods, understanding the spatiotemporal evolution of contiguous flood-causing rainstorm events remains largely unexplored in China. Here, we collected historical flood disaster data from the Statistical Yearbook, news reports, and government sources and examined the evolution patterns of spatiotemporally contiguous flood-causing RSEs across China from 2000 to 2020, utilizing the connected component three-dimensional algorithm. Our results indicate that floods mostly occur in southern China (SC), followed by northern China (NC), with less frequency in northwestern China (NWC) and the Qinghai-Tibetan Plateau (TP). The flood-causing RSEs tend to occur with longer durations and higher magnitudes in SC and NC, while in NWC and TP, they are primarily characterized by short-term precipitation processes with lower magnitudes. Moreover, the flood-causing RSEs exhibit distinct evolutionary patterns in different subregions. In NWC and TP, RSEs generally move eastward and southeastward, with relatively longer lifespans, traveling longer distances at faster moving speeds, but covering smaller areal extent and lower accumulated rainfall amounts. In contrast, in both SC and NC, flood-causing rainstorm events are mainly moved in two directions, namely westwards and eastwards. These events have shorter average lifespans, and travel shorter moving distances at slower moving speeds, but have a larger areal extent and huge accumulated rainfall amounts. Our findings significantly enhance our understanding of flood-causing rainstorm characteristics in China.

How to cite: Wang, J. and Guan, X.: Spatiotemporal evolution patterns of flood-causing rainstorm events in China from a 3D perspective, EGU General Assembly 2025, Vienna, Austria, 27 Apr–2 May 2025, EGU25-7964, https://doi.org/10.5194/egusphere-egu25-7964, 2025.

EGU25-8219 | ECS | Orals | NH1.4

Does a changing climate lead to a higher flash flood hazard? 

Paul Voit, Maik Heistermann, and Harald Rybka

Does a changing climate lead to a higher flash flood hazard?

Flash floods pose a significant natural hazard and are triggered by high-intensity precipitation events occurring in small and steep catchments. The short lead time, high flow velocity, and transportation of debris and sediment of these floods can lead to devastating impacts. 

With the warming climate, the intensity and extent of precipitation events are likely to increase, consequently leading to an expected increase of flash flood hazard. But what do we have to expect, and how can we adapt to future climate scenarios? Simulating extreme rainfall is still highly uncertain under climate change. Because of their coarse spatio-temporal resolution, global circulation models are not suited to investigate the impacts of a warming climate on flash floods. However, new convection-permitting models (regional climate models) for the first time now offer an appropriate spatia-temporal resolution (3x3 km, 1 hour) for flash flood modelling. Based on the COSMO-CLM (COSMO model in CLimate Mode, Rockel et al., 2008; Sørland et al., 2021), we modelled the runoff in all small-scale catchments in Germany for the periods 1971-2000, 2001-2019, and for the period 2030-2100, which is based on the RCP8.5 scenario.

Our results reveal that half of the catchments would produce a flood peak of factor 1.5 or higher under the RCP8.5 scenario compared to the present period (2001-2019) and further enable us to estimate and compare return levels of flood peaks for the RCP8.5 scenario and shed light on regional differences within Germany. This study is the first comprehensive analysis of the (flash) flood response to a warmer climate in Germany.

References:

Rockel, B., A. Will, A. Hense, 2008: The regional climate nmodel COSMO-CLM (CCLM). Meteorol. Z. 17, 347–348, DOI: 10.1127/0941-2948/2008/0309.

Rybka, Harald, et al. "Convection-permitting climate simulations with COSMO-CLM for Germany: Analysis of present and future daily and sub-daily extreme precipitation; Convection-permitting climate simulations with COSMO-CLM for Germany: Analysis of present and future daily and sub-daily extreme precipitation." Meteorologische Zeitschrift 32.2 (2023): 91-111.

Sørland, S.L., C. Schär, D. Lüthi, E. Kjellström, 2018: Bias patterns and climate change signals in GCM-RCM model chains. Env. Res. Lett. 13, 074017, DOI:10.1088/1748-9326/aacc77.

How to cite: Voit, P., Heistermann, M., and Rybka, H.: Does a changing climate lead to a higher flash flood hazard?, EGU General Assembly 2025, Vienna, Austria, 27 Apr–2 May 2025, EGU25-8219, https://doi.org/10.5194/egusphere-egu25-8219, 2025.

EGU25-10340 | Posters on site | NH1.4

Impacts of rainfall variability on river discharges characteristics : A Case Study in Chenyulan Watershed, Taiwan, China 

Wen-Shun Huang, Jinn-Chyi Chen, Kuo-Hua Chien, Xi-Zhu Lai, and Yue-Ting Lai

In this study, the variations of rainfall and river discharges were analyzed in the Chenyulan watershed in Nantou County, central Taiwan. The hydrological data, including rainfall, daily discharges and yearly maximum instantaneous discharge, were collected from the Neimaopu hydrology station for the period from 1972 to 2022, covering approximately 50 years. According to the data analysis, when the rainfall exceeds the average, the river discharges in the Chenyoulan catchment increases, with larger rainfall events leading to more significant changes. Upon comparing the long-term data, it was found that the maximum instantaneous discharge occurred on August 1, 1996, during the Herb Typhoon. Though this event did not coincide with the historical maximum for total rainfall, rainfall intensity or average rainfall intensity, it resulted in the maximum instantaneous discharge.


 All of the rainfall events, daily average discharge and yearly maximum instantaneous discharge are preliminarily analyzed as follows: 1. Rainfall in the catchment shows a positive correlation with river discharge; 2. The increase in rainfall characteristics in the catchment and the increase in discharge are not linearly related; 3. The non-linear reasons for the relationship between rainfall and maximum instantaneous discharge are preliminarily summarized as being related to soil conditions, different rainfall intensity locations and the runoff coefficients of various catchment units; 4. This study will subsequently estimate the average runoff coefficient of the catchment based on the relationship between individual rainfall and discharge, and conclude rational formula.

How to cite: Huang, W.-S., Chen, J.-C., Chien, K.-H., Lai, X.-Z., and Lai, Y.-T.: Impacts of rainfall variability on river discharges characteristics : A Case Study in Chenyulan Watershed, Taiwan, China, EGU General Assembly 2025, Vienna, Austria, 27 Apr–2 May 2025, EGU25-10340, https://doi.org/10.5194/egusphere-egu25-10340, 2025.

EGU25-10885 | ECS | Orals | NH1.4

On the Changing Role of Climatic Drivers to River Basin Scale Flooding 

Nanditha Jayadevan Sobhana and Vimal Mishra

Floods result from the interplay of climatic drivers, catchment characteristics and river system dynamics. The observed shift to extreme climatic events necessitates a better quantification of their impact on flood generation. Improving our current understanding of flood generation processes in the observed climate provides a pathway to improve flood projections in a warming climate.

This presentation will share insights from our work on river basin scale flooding in India. Using a physical hydrological model, we conducted an event-scale analysis of high flows across multiple river basins in India. The results highlight the significant role of antecedent catchment moisture, as well as the duration and spatial extent of precipitation events, in driving river basin scale flooding. The study also examines and distinguishes the relative importance of large-scale moisture transport, and origin, persistence and direction of propagation of low-pressure systems in triggering localized and widespread floods. Furthermore, we find that prominent flood drivers in a warming climate are similar to those observed in the historical period. Careful attribution of observed flood changes, combined with a thorough assessment of changes in key drivers, is essential for deriving reliable projections of future flood risk.

How to cite: Jayadevan Sobhana, N. and Mishra, V.: On the Changing Role of Climatic Drivers to River Basin Scale Flooding, EGU General Assembly 2025, Vienna, Austria, 27 Apr–2 May 2025, EGU25-10885, https://doi.org/10.5194/egusphere-egu25-10885, 2025.

EGU25-11534 | ECS | Orals | NH1.4

Floods and moisture excesses induced by atmospheric blocking are related at the long-term scale in Europe 

Diego Hernandez, Miriam Bertola, David Lun, Bodo Ahrens, James McPhee, and Günter Blöschl

Among weather-related extreme events in Europe, floods are one of the most disastrous and costliest. Atmospheric blocking episodes (i.e., persistent, quasi-stationary, and self-preserved weather systems that propagate very slowly and interrupt the usual westerly flows) are part of the main weather regimes in the Euro-Atlantic and have been associated with notable flood events across Europe. So far, the relationship between blocking and some high-impact extreme weather events has been established, including the modulation of the odds of heavy precipitation. Yet, a long-term continental relationship between blocking and flooding remains unrevealed, and in particular, the way atmospheric blocking translates into floods. For the 1960-2010 period, this study analyses a pancontinental database of maximum discharge, atmospheric and soil variables from ERA5 and ERA5-Land reanalyses, and a gridded binary blocking index derived from ERA20C. Preliminary results indicate mixed positive and negative anomalies in mean precipitation and wet-spell frequencies in response to blocking, depending on the region. Nonetheless, robustly across Europe, the anomalies in wet-spell duration and total precipitation depth are generally positive under blocking conditions. We present the spatial patterns across Europe induced by atmospheric blocking in anomalies of, e.g., streamflow maxima, rainfall maxima, and root zone moisture excess maxima, pointing out that the patterns between streamflow maxima and moisture excess maxima are significantly correlated but not in the case between streamflow maxima and rainfall maxima. Hence, this research suggests that the effect of atmospheric blocking on floods is acting at the level of the interaction between rainfall and soil moisture. The outcomes presented here unveil a continental and long-term impact of atmospheric blocking in relevant variables for flood generation.

How to cite: Hernandez, D., Bertola, M., Lun, D., Ahrens, B., McPhee, J., and Blöschl, G.: Floods and moisture excesses induced by atmospheric blocking are related at the long-term scale in Europe, EGU General Assembly 2025, Vienna, Austria, 27 Apr–2 May 2025, EGU25-11534, https://doi.org/10.5194/egusphere-egu25-11534, 2025.

EGU25-12781 | ECS | Posters on site | NH1.4

The role of extratropical cyclones in flooding in Quebec, Canada, from 1990-2020 

Clarence Gagnon, Daniel Nadeau, Alejandro Di Luca, and François Anctil

Out of all weather-related hazards, flooding has the most widespread impact globally, and the province of Quebec is no exception. In the past decades, dozens of riverside municipalities have felt the socio-economic consequences of flooding firsthand. Most of Quebec is characterised by a cold and humid continental climate, with precipitation year-round. Here, river flooding often takes place in the spring, due to snowmelt. Although important, snowmelt alone is not the only factor influencing flooding in the mid-latitudes. By bringing heavier than normal precipitation with them, extratropical cyclones are also known to be key contributors. The relationship between extratropical cyclones and flooding have been extensively studied on the West Coast of North America, but remains largely unexplored in eastern Canada. Thus, this study aims to link flooding events that have happened in the past 30 years in Quebec to their triggering extratropical cyclones and identify possible characteristics (genesis locations, trajectories, lifetime, progression speed, or precipitation intensity) that set these systems apart. Coupled with financial aid claims data, highlighting the differences between regular vs flood-inducing extratropical cyclones coming through Quebec can help describe the region’s flooding history and better prepare for future events. We also explore the involvement of atmospheric rivers in these extreme events. This analysis is performed using three databases. First, the Quebec Floods Financial Aid Claims Database provides the 14360 financial aid claims filed by individuals or businesses for material loss following flooding, from 1990-2022. Each claim contains the location of the damaged infrastructures, watershed involved, and closest river section. Second, the North American Extratropical Cyclone Catalogue provides extratropical cyclone tracks derived from the ERA5 reanalysis, available every hour from 1979-2020, and includes variables of interest such as precipitation and near surface wind-speeds. Third, the Global Atmospheric River Scale Database gives the occurrence and scale (based on integrated water vapor transport and duration of event) of atmospheric rivers every 6 hours from 1979-2020. By grouping the financial aid claims by location and date, 385 events were identified. Through this analysis, 550 extratropical cyclones (storms) of interest were identified and ranked according to their associated percentage of cumulated rain during the event. Five zones of storm genesis locations were identified: western Canada, Great Lakes and Ontario, US Northern East Coast and Quebec, Central US, and US East Coast. The genesis location of weaker storms was uniformly distributed among the five regions. However, most of the remaining 108 more intense storms were coming from two genesis locations: Central US (48%), and US East Coast (25%). For these two genesis zones, trajectories of stronger storms were found to be different from those of weaker storms. For example, tracks were more likely to move over land going up the US East Coast and go over the Great Lakes when coming from Central US. As for atmospheric rivers, their involvement in flood-events was found to be very high in the winter, and minimal in the summer. The combination of data used in this method offers new insights for investigating flooding events.

How to cite: Gagnon, C., Nadeau, D., Di Luca, A., and Anctil, F.: The role of extratropical cyclones in flooding in Quebec, Canada, from 1990-2020, EGU General Assembly 2025, Vienna, Austria, 27 Apr–2 May 2025, EGU25-12781, https://doi.org/10.5194/egusphere-egu25-12781, 2025.

Convection-permitting regional climate models (CPRCMs) are increasingly recognized for their ability to improve extreme precipitation predictions, yet their application to hydrological modeling in complex terrains remains uncertain. This study evaluates the performance of CPRCMs in predicting hydrological extremes in two basins in Western Norway: Røykenes, dominated by rainfall-induced floods, and Bulken, characterized by snowmelt-induced floods. We compare the capabilities of a high-resolution convection-permitting model (HCLIM3, 3 km resolution) with a coarser regional climate model (HCLIM12, 12 km resolution) in driving two hydrological models: the physically based Weather Research and Forecasting Model Hydrological system (WRF-Hydro) and the conceptual Hydrologiska Byråns Vattenbalansavdelning (HBV) model. Performance was evaluated based on precipitation, temperature, runoff, and hydrological extremes. We found that HCLIM3 exhibited significantly better performance in estimating annual maximum 1-day (Rx1d) and 1-hour (Rx1h) precipitation, with reduced biases compared to HCLIM12. It also showed added value in capturing the probability density distribution of daily and hourly precipitation, as quantified by the Distribution Added Value (DAV) metric. However, both HCLIM3 and HCLIM12 displayed cold biases, especially in mountainous areas. Besides, in the rainfall-dominated Røykenes basin, WRF-Hydro outperformed HBV in simulating extreme flood magnitudes across return periods (5, 10, 20, and 50 years). However, in the snowmelt-dominated Bulken basin, cold biases in HCLIM3 and HCLIM12 introduced uncertainties in snowmelt timing, leading to larger errors. The added value of HCLIM3 was observed in hourly discharge in the Røykenes basin. However, this benefit was less pronounced in the snowmelt-dominated Bulken basin, where temperature sensitivities significantly influenced snowmelt processes. Biases in HCLIM3 and HCLIM12 meteorological forcing propagated through hydrological models, leading to discharge errors, as highlighted by DAV metrics. This research highlights the importance of applying bias correction to CPRCM simulations to improve hydrological modeling of extreme events, especially in mountainous terrains where biases in temperature and precipitation critically affect hydrological processes.

How to cite: Li, L. and Xie, K.: Evaluating the added value of convection-permitting regional climate models in simulating hydrological extremes over basins in western Norway, EGU General Assembly 2025, Vienna, Austria, 27 Apr–2 May 2025, EGU25-13633, https://doi.org/10.5194/egusphere-egu25-13633, 2025.

EGU25-15024 | Posters on site | NH1.4

The case of flash floods in Montsià county (Catalonia, Spain): from the source of precipitate water to thunderstorm cells  

Raül Marcos-Matamoros, Mari Carmen Llasat, Ramon Pascual, Tomeu Rigo, Damián Insúa-Costa, and Alfredo Crespo

The latest IPCC report (2022) projects an increase in climate risks for all regions of the world, both in frequency and intensity. In particular, on the Spanish Mediterranean coast, catastrophes such as the Gloria event in January 2020, or the tragic floods that occurred in October 2024 in Valencia and Castile-La Mancha, are aligned with these projections. On a smaller geographical scale, flash floods that occurred in the Montsià county (southern Catalonia) in 2018, 2021 and 2023 also point to an increase in frequency in this in this 733 km² region located at the south of the Ebro Delta. This region is a paradigmatic example of a Mediterranean region with a high flood risk. Firstly, it has a high flash flood hazard, as a result of its abrupt orography with steep slopes that favours the existence of numerous steep torrents, as well as the rise of humid air masses from the Mediterranean, especially when they hit perpendicular to the coastline, which helps trigger convection and gives rise to intense rainfall. Likewise, the geographical region in which it is located is favourable to the entry of humid air from remote sources, which contribute to the increase in the intensity and amount of precipitation. Secondly, it has a high flood exposure despite the low population density, but which is multiplied by four in summer and early autumn in some municipalities. Thirdly, it has a high flood vulnerability, a consequence of being divided into three hydrographic basins, managed by three different administrations, which makes coordination difficult, especially regarding flood prevention. This is combined with a low-risk awareness both socially and individually that is joined to the difficulty of predicting and nowcasting the convective events that give rise to the severe flash floods that the region frequently experiences.

During the catastrophic flooding event of October 18–20, 2018, the maximum precipitation recorded in the Montsià region was 312.2 mm, and a daily rainfall of 209.6 mm, with a peak of 30-minute rainfall of 52.4 mm. On September 1, 2021, 251.9 mm were recorded over three hours, with a peak of 30-minute rainfall of 72 mm.  On September 3, 2023, very heavy rainfall was recorded once again in Montsià, with a maximum rainfall of 206 mm/24h and a peak of 30-minute rainfall of 61.4 mm.  In this study we characterize these three catastrophic flash flood events taking into account the complexity that local scale phenomena may have. For this reason, the characteristics of the thunderstorms that gave rise to the catastrophic flash floods are analyzed, to then go on to understand the synoptic and mesoscale context and finish with the search for the moisture source fields at global scale. In order to ascertain whether this increase in frequency in recent years responds to a significant trend, a spatio-temporal analysis in extreme rainfall indicators has been made. To do this, information from multiple data sources has been integrated, including meteorological station observations, weather radar products, lightning detection networks, high-resolution mesoscale model outputs.

How to cite: Marcos-Matamoros, R., Llasat, M. C., Pascual, R., Rigo, T., Insúa-Costa, D., and Crespo, A.: The case of flash floods in Montsià county (Catalonia, Spain): from the source of precipitate water to thunderstorm cells , EGU General Assembly 2025, Vienna, Austria, 27 Apr–2 May 2025, EGU25-15024, https://doi.org/10.5194/egusphere-egu25-15024, 2025.

EGU25-15233 | ECS | Posters on site | NH1.4

A distributed rainfall-runoff model to explore the connection between floods and climate extremes in the European Alps 

Anna Basso, Luca Lombardo, and Alberto Viglione

Given the current warming trend of our climate system, the frequency and intensity of extreme weather events are expected to have a significant impact on flood dynamics. The Clim2FlEx project aims in this evolving context to assess how floods of different natures are linked to climate extremes under potential future climate scenarios.

This work focuses on the European Alps, an optimal natural laboratory for this topic due to the complex hydro-meteorological processes occurring in the region and its unique position at the intersection of the Mediterranean and continental Europe.

The methodology uses an innovative and integrated version of the TUWmodel, combined with a machine-learning-based regionalization approach, HydroPASS. Once the regional model is validated, it will enable hydrological runoff predictions for both current and future scenarios across the Greater Alpine Region. Based on these simulations, we aim to identify flood events in time and space, linking them to climate extreme indices and, ultimately, to the large-scale climatic phenomena driving their dynamics.

At the EGU, we will present the results obtained regarding the performance of the regional model, along with the steps taken, and those planned, for developing the spatio-temporal event detection strategies.

How to cite: Basso, A., Lombardo, L., and Viglione, A.: A distributed rainfall-runoff model to explore the connection between floods and climate extremes in the European Alps, EGU General Assembly 2025, Vienna, Austria, 27 Apr–2 May 2025, EGU25-15233, https://doi.org/10.5194/egusphere-egu25-15233, 2025.

EGU25-16468 | Posters on site | NH1.4

Synthetic Design Hydrographs Under Current and Future Climate for Local Bridge Scour Assessment 

Kristina Potočki, Damir Bekić, Nejc Bezak, Tobias Conradt, Damir Pintar, Marko Šrajbek, and Martina Lacko

One of the major challenges in hydrological research for estimating design flood events is accounting for the influence of climate change. These changes are reflected in increasingly frequent and intense fluctuations in river water regimes and sediment transport, indirectly affecting riverbed erosion processes. Therefore, assessing the long-term impacts on the lifespan of hydraulic structures (e.g., bridges) is crucial, requiring a comprehensive analysis of the interrelationship between climate change indicators, flood wave characteristics (including peak flow and hydrograph shape), and local riverbed erosion.

The SERIOUS project (Synthetic dEsign hydrographs undeR current and future clImate for local bridge scOUr aSsessment) aims to methodologically link synthetic design hydrographs (SDH) derived from statistical bivariate analysis under current and projected future climate conditions in the continental parts of the Danube River basin to the assessment of climate change impacts on bridge scour at selected pilot sites. The project objectives are to: (1) establish a methodological framework for determining control SDH based on literature reviews and available data in selected pilot areas; (2) apply and improve supervised and/or unsupervised machine learning algorithms to categorize different SDH types based on their shapes and/or topologies; (3) calibrate a regional hydrological model to evaluate climate change projections using historical discharge and water level data from the selected pilot areas; (4) investigate changes in SDH under climate change projections; and (5) develop a methodological framework for evaluating climate change impacts on bridge scour depth. These objectives are supported by the IAHS "Helping Decade" initiative (Working Group 11.1). The proposed project is expected to improve methodologies for determining SDH, serving as critical inputs for designing various engineering structures.


Acknowledgment:

This work has been supported in part by the Croatian Science Foundation under the project SERIOUS (IP-2024-05-1497) and the “Young Researchers’ Career Development Project – Training New Doctoral Students” (DOK-2020-01-5354).

How to cite: Potočki, K., Bekić, D., Bezak, N., Conradt, T., Pintar, D., Šrajbek, M., and Lacko, M.: Synthetic Design Hydrographs Under Current and Future Climate for Local Bridge Scour Assessment, EGU General Assembly 2025, Vienna, Austria, 27 Apr–2 May 2025, EGU25-16468, https://doi.org/10.5194/egusphere-egu25-16468, 2025.

EGU25-17369 | Orals | NH1.4 | Highlight

Controls on the temporal evolution of extreme precipitation in Austria 

Klaus Haslinger, Korbinian Breinl, Lovrenc Pavlin, Georg Pistotnik, Miriam bertola, Marc Olefs, Marion Greilinger, Wolfgang Schöner, and Günter Blöschl

The temporal evolution of extreme precipitation is expected to be influenced by the broader impacts of climate change. This is generally considered to be due to the increased water-holding capacity of a warmer atmosphere, as well as alterations in atmospheric circulation patterns. However, gaining a comprehensive understanding of how extreme precipitation has changed in the past has been a challenge due to limited historical data and inherent uncertainties, particularly when examining short-duration rainfall events such as those occurring within a one-hour period.

By analyzing rainfall gauge data from Austria collected during the twentieth century, we observe significant decadal-scale variations in daily extreme precipitation. These variations suggest that the frequency and intensity of daily extreme events are highly variable over time. In contrast, our analysis of hourly extreme precipitation reveals a more consistent and noticeable upward trend over the past four decades. This trend corresponds with the increase in global temperatures, showing a 7% rise in hourly extreme precipitation for every 1°C of warming, which is in line with the Clausius-Clapeyron relationship. This increase in hourly extreme precipitation is consistent across both the northern and southern regions of the Alps, indicating that the effects of warming are widespread across Austria. On the other hand, daily extreme precipitation appears to be more strongly influenced by atmospheric circulation patterns, with a more notable correlation to decadal-scale variations in these patterns. These atmospheric circulation shifts are responsible for driving the weather systems that generate extreme precipitation events, particularly on the daily timescale.

In summary, our findings suggest that thermodynamic changes, such as the increase in temperature, have a more pronounced impact on hourly extreme precipitation than on daily extremes. This highlights the distinct processes at play for different timescales, where the short-term (hourly) extreme events are more closely tied to the fundamental thermodynamic properties of the atmosphere, while longer-term (daily) extremes are influenced more by large-scale atmospheric circulation dynamics.

How to cite: Haslinger, K., Breinl, K., Pavlin, L., Pistotnik, G., bertola, M., Olefs, M., Greilinger, M., Schöner, W., and Blöschl, G.: Controls on the temporal evolution of extreme precipitation in Austria, EGU General Assembly 2025, Vienna, Austria, 27 Apr–2 May 2025, EGU25-17369, https://doi.org/10.5194/egusphere-egu25-17369, 2025.

EGU25-19877 * | Orals | NH1.4 | Highlight

Blocking patterns are crucial in producing recent extreme summer floods 

Hayley Fowler, Paul Davies, Anna Whitford, Stephen Blenkinsop, Christopher White, and Christoph Sauter

Extreme weather events often, but not exclusively, occur when the jet stream is highly disturbed and the atmospheric circulation becomes blocked, allowing long-lasting, quasi-stationary and self-sustaining atmospheric weather regimes to develop. The interactions of subtropical, warm and moist air with polar, cold and dry air within the structure of the atmospheric block may then provide the local ingredients for these highly impactful weather events, including persistent rainfall from cut-off low pressure systems causing floods like those in Central Europe in 2024, or in Germany in 2021, or in Greece or Spain in 2023, or short-duration downbursts leading to serious flash flooding as occurred in Liguria, Italy in Oct 2023 breaking the European record for hourly rainfall. This talk will draw on evidence from several published and unpublished studies to examine the mechanisms for such events, from global drivers, through synoptic scale weather regimes to local-scale processes. Identifying the causal pathways for hydroclimatic extremes is important for developing improved methods for event attribution, and for improving climate model projections, since even high-resolution climate models poorly simulate key mechanisms driving these events and likely underestimate future changes.

How to cite: Fowler, H., Davies, P., Whitford, A., Blenkinsop, S., White, C., and Sauter, C.: Blocking patterns are crucial in producing recent extreme summer floods, EGU General Assembly 2025, Vienna, Austria, 27 Apr–2 May 2025, EGU25-19877, https://doi.org/10.5194/egusphere-egu25-19877, 2025.

EGU25-20525 | Posters on site | NH1.4

Modeling of Ice-jam Flooding: Integrating SUMMA with River Ice Processes for Climate Change Impacts 

Karl-Erich Lindenschmidt, Mohammad Ghoreishi, and Darri Eythorsson

Ice-jam flooding linked with the interactions of hydrological and cryosphere processes is a serious threat to riverine communities in cold regions. This work uses the coupling of the Structure for Unifying Multiple Modeling Alternatives (SUMMA) hydrological model, which represents a wide range of hydrological processes, and the mizuRoute river routing model with that of a river ice model (i.e., RIVICE model) to project of ice-jam floods under changing climatic conditions. In fact, SUMMA and mizuRoute simulate streamflow, which is then passed to RIVICE to model ice formation and dynamics. The dynamics of streamflow simulated by SUMMA / mizuRoute include comprehensive representation of various hydrological processes, while the RIVICE model considers the processes of ice formation, frazil ice dynamics, and accumulation. This coupled modeling framework is applied to the Klondike River in Yukon, Canada, one of the regions historically affected by ice-jam flooding. This study uniquely integrates these models to enable projection of future ice-jam flood scenarios. The simulations are driven by climate projections from the CMIP6 datasets, enabling comprehensive assessments of future freeze-up events and associated flood risks at high spatial and temporal resolution. This work contributes to the increasing value of integrated hydrological and cryospheric modeling, improving flood risk assessments and informing adaptive strategies, such as improved forecasting systems and infrastructure design, for community protection in cold regions.

How to cite: Lindenschmidt, K.-E., Ghoreishi, M., and Eythorsson, D.: Modeling of Ice-jam Flooding: Integrating SUMMA with River Ice Processes for Climate Change Impacts, EGU General Assembly 2025, Vienna, Austria, 27 Apr–2 May 2025, EGU25-20525, https://doi.org/10.5194/egusphere-egu25-20525, 2025.

EGU25-3629 | ECS | Posters on site | AS3.16

Rapid Ash Removal in the 2022 Hunga Volcano Plume: The Role of Aerosol Microphysical Processes 

Simran Chopra, Julia Bruckert, and Gholamali Hoshyaripour

The record-breaking January 2022 Hunga eruption raised questions regarding the large amount of water vapor (150 Tg) reaching the stratosphere and the surprisingly less amount of ash detected. The emission of such large amount of water vapor in numerical models poses its own challenges and limitations. From ground-based estimates of emitted ash, the emitted fine ash is estimated to be around 17-34 Tg, however, only up to 1-2 Tg was present in the atmosphere which indicates an extremely fast removal of ash. This study investigates the role of various aerosol dynamical processes and hence, the accelerated removal of ash particles. This is done through emission of ash, water vapor, SO2 and NaCl in the ICOsahedral Nonhydrostatic model with Aerosols and Reactive Tracers (ICON-ART). Three possible pathways of faster growth and consequently, removal of particles, are explored in this study. These include (1) ash particle growth due to coagulation with sea salt and further growth by water owing to the highly hygroscopic nature of sea salt, (2) fast wet aggregation of particles during the plume rise, and (3) activation of particles to large hydrometeors.  The results emphasize the importance of including sea salts emission along with ash and SO2 in modelling studies and the subsequent effects on aerosol dynamical processes. 

How to cite: Chopra, S., Bruckert, J., and Hoshyaripour, G.: Rapid Ash Removal in the 2022 Hunga Volcano Plume: The Role of Aerosol Microphysical Processes, EGU General Assembly 2025, Vienna, Austria, 27 Apr–2 May 2025, EGU25-3629, https://doi.org/10.5194/egusphere-egu25-3629, 2025.

EGU25-3642 | Posters on site | AS3.16

Radiative forcing and stratospheric ozone changes due to major forest fires and recent volcanic eruptions including Hunga Tonga 

Christoph Brühl, Matthias Kohl, Jos Lelieveld, Landon Rieger, and Michelle Santee

Using the chemistry-climate model EMAC with nudged tropospheric meteorology, we show that organic carbon injected into the stratosphere through forest fire-related pyro-cumulonimbi enhances heterogeneous chlorine activation due to enhanced solubility of HCl in particles containing organic acids and a larger aerosol surface area. After the 2019/2020 Australian mega-bushfires, the upward transport of the pollution plume led to enhanced ozone depletion in the Southern hemispheric lower stratosphere, in agreement with AURA-MLS satellite observations. It reduced total ozone in 2020 and 2021 by up to 28 DU around 70oS, accompanied by a dynamic reduction in August 2020 from the lofting of smoke-filled vortices, reaching 24 DU (total about 40 DU near 65oS). The eruption of Hunga Tonga in January 2022 led to a reduction of total ozone in the entire Southern hemisphere, exceeding 10 DU south of about 55oS in Austral spring of 2022 and 2023. The water vapor injection by the volcano modified only the vertical distribution of ozone loss.
The absorbing aerosol from the combined Australian and Canadian forest fire emissions in 2019/2020 caused the largest perturbation in stratospheric optical depth (e.g., seen in OSIRIS data) since the eruption of Pinatubo. It changed the instantaneous stratospheric aerosol forcing -derived at the top of  the atmosphere- from -0.2 W/m2 to +0.3 W/m2 in January 2020. In January 2022, the remaining effect was about 0.05 W/m2, reducing the negative forcing by volcanoes. The computed global aerosol radiative forcing caused by the Hunga Tonga eruption in 2022 was about -0.12 W/m2, decreasing to -0.06 W/m2 by December 2023, dominated by the change in stratospheric sulfate aerosols. The positive forcing of the injected water vapor was small (in agreement with other models). 

How to cite: Brühl, C., Kohl, M., Lelieveld, J., Rieger, L., and Santee, M.: Radiative forcing and stratospheric ozone changes due to major forest fires and recent volcanic eruptions including Hunga Tonga, EGU General Assembly 2025, Vienna, Austria, 27 Apr–2 May 2025, EGU25-3642, https://doi.org/10.5194/egusphere-egu25-3642, 2025.

EGU25-3677 | ECS | Orals | AS3.16

Assessing the stratospheric temperature response to volcanic sulfate injections: insights from a multi-model framework 

Katharina Perny, Pavle Arsenovic, Christoph Brühl, Sandip Dhomse, Ales Kuchar, Anton Laakso, Graham Mann, Ulrike Niemeier, Giovanni Pitari, Ilaria Quaglia, Harald Rieder, Takashi Sekiya, Timofei Sukhodolov, Simone Tilmes, Claudia Timmreck, and Daniele Visioni

Volcanic sulfate injections into the stratosphere following major eruptions are able to modulate climate, as demonstrated by the well-documented 1991 Mt. Pinatubo eruption. Understanding the climate response to such events is critical, especially in the context of potential solar radiation management strategies to counteract climate change. An important part of volcanic impact on the atmospheric system originates from volcano-induced lower stratospheric heating that leads to changes in stratospheric circulation and transport and possibly in stratosphere-troposphere coupling and regional tropospheric circulation. Previous modeling studies have shown diverse results concerning these effects, partly due to model uncertainties and differences in simulation setup or study design, such as prescribed aerosols and/or chemistry, while the feedbacks between these system components were shown to be significant.

This study evaluates the tropical stratospheric temperature response to the Mt. Pinatubo eruption using eight global models with interactive aerosol microphysics. All models adhered to the Historical Eruptions SO2 Emission Assessment (HErSEA) protocol under the Interactive Stratospheric Aerosol Model Intercomparison Project (ISA-MIP). We focus on the uncertainties related to initial SO2 emission amounts and injection heights. Results reveal that while models exhibit consistent sensitivity to initial SO2 amounts and injection heights, the magnitude and extent of the stratospheric temperature response vary. By comparing model outputs and observations, this study enhances our understanding of individual model performances and the current multi-model uncertainty range and provides critical insights for future climate impact assessments of volcanic eruptions.

How to cite: Perny, K., Arsenovic, P., Brühl, C., Dhomse, S., Kuchar, A., Laakso, A., Mann, G., Niemeier, U., Pitari, G., Quaglia, I., Rieder, H., Sekiya, T., Sukhodolov, T., Tilmes, S., Timmreck, C., and Visioni, D.: Assessing the stratospheric temperature response to volcanic sulfate injections: insights from a multi-model framework, EGU General Assembly 2025, Vienna, Austria, 27 Apr–2 May 2025, EGU25-3677, https://doi.org/10.5194/egusphere-egu25-3677, 2025.

EGU25-6342 | Posters on site | AS3.16

Will the climate response to volcanic eruptions change in the future? 

Claudia Timmreck, Shih-Wei Fang, Johannes Meuer, Johann Jungclaus, Christopher Kadow, and Hauke Schmidt

In the future, in a warmer world due to anthropogenic greenhouse gas forcing, the impact of natural forcing on climate could change dramatically.  However, it is not yet clear how strong a volcanic forcing as in the early 19th century will affect future climate. Previous studies show both an amplification of the surface cooling response, mainly due to an increase in upper ocean stability, and a weakening of the volcanic-induced surface cooling in a future climate state due to a reduced effective volcanic aerosol radiative forcing.

To assess how different climate states affect the climate response to volcanic forcing, we have performed MPI-ESM ensemble experiments under historical, 4xCO2 and present-day conditions with volcanic forcing equivalent to that of the early 19th century.  On these simulations, we have also tested explicable artificial intelligence methods to see if they are able to achieve a similar skill for specific fingerprints in the temperature record when the boundary conditions are very different from the present, as in the case of a 4xCO2 scenario.

We find that different changes in Arctic sea ice cover and northern hemisphere winter sea level pressure are induced by the same volcanic forcing under distinct climate states, while the large-scale average temperature response shows no significant differences.  The volcanic fingerprint in the surface temperature pattern is similar for all climate states for large volcanic eruptions in the first post-volcanic year, while the background state becomes relevant afterwards, as well as for smaller eruptions

How to cite: Timmreck, C., Fang, S.-W., Meuer, J., Jungclaus, J., Kadow, C., and Schmidt, H.: Will the climate response to volcanic eruptions change in the future?, EGU General Assembly 2025, Vienna, Austria, 27 Apr–2 May 2025, EGU25-6342, https://doi.org/10.5194/egusphere-egu25-6342, 2025.

EGU25-10357 | Orals | AS3.16

Modulation of the Northern Polar Vortex by the Hunga Tonga-Hunga Ha’apai Eruption and Associated Surface Response 

Ales Kuchar, Timofei Sukhodolov, Gabriel Chiodo, Andrin Jörimann, Jessica Kult-Herdin, Eugene Rozanov, and Harald Rieder

The January 2022 eruption of Hunga Tonga-Hunga Ha’apai (HTHH) injected unprecedented amounts of water vapour (WV) and sulfur dioxide (SO2) into the stratosphere, significantly impacting the Earth's climate system. Utilizing the Earth System Model SOCOLv4, this study investigates the dynamical implications of the middle-atmosphere disturbances caused by HTHH. A novel dynamical pathway linking water-rich volcanic eruptions to surface climate was identified. The excess stratospheric WV led to significant anomalies in atmospheric circulation, particularly influencing the Northern Hemisphere polar vortex (PV). The findings highlight the potential for such eruptions to modulate the stratospheric PV and subsequent surface climate through altered temperature gradients and weakened polar-night jets, contributing to sudden stratospheric warmings (SSWs). Furthermore, we explain the mechanism dependency on model-projected forcing and its relation to identified biases common also in other chemistry-climate models.

How to cite: Kuchar, A., Sukhodolov, T., Chiodo, G., Jörimann, A., Kult-Herdin, J., Rozanov, E., and Rieder, H.: Modulation of the Northern Polar Vortex by the Hunga Tonga-Hunga Ha’apai Eruption and Associated Surface Response, EGU General Assembly 2025, Vienna, Austria, 27 Apr–2 May 2025, EGU25-10357, https://doi.org/10.5194/egusphere-egu25-10357, 2025.

Various sets of metrics have been used to rank the performance of CMIP6 models for a variety of purpose.

Here we present a potential set of metrics that would simplify a similar ranking for the purpose of evaluating the skill of climate models with a fully resolved stratosphere, including dynamics, chemistry, and aerosol microphysics in representing perturbations to stratospheric composition, such as past volcanic eruptions, as a first step to determine the reliability in future cases such as new volcanic eruptions or Stratospheric Aerosol Intervention.

Our purpose is to find metrics that include available observations of large and medium volcanic eruptions, such as Mt. Pinatubo in 1991, and that also consider the uncertainties in past retrievals, and that are representative of models skills across time (i.e. considering not just the initial plume development, but also the e-folding time and ultimate fate of the aerosol cloud) and space. We include metrics that consider aerosol spatial distribution, local and global size distribution and chemical properties through surface area density.

Our set of metrics could be of great use as more models in CMIP7 start including prognostic aerosols schemes and higher tops, and could inform future strategies for better observations of the stratospheres, as well as identify necessary variables to be requested by CMIP as part of the data requests prioritization for the Atmosphere Working Group.

How to cite: Visioni, D. and Quaglia, I.: Developing a set of simple metrics to evaluate the performance of models with interactive stratospheric aerosols, EGU General Assembly 2025, Vienna, Austria, 27 Apr–2 May 2025, EGU25-10745, https://doi.org/10.5194/egusphere-egu25-10745, 2025.

EGU25-11701 | ECS | Orals | AS3.16

Self-lofting and radiative forcing of stratospheric aerosol from major wildfires and how it compares to volcanic eruptions 

Raphaël Lebrun, Yevgeny Derimian, François Ravetta, Jérôme Bureau, and Sergey Khaykin

Caused by intense wildfires, Pyrocumulonimbus generate vigorous convective updrafts that inject biomass burning plumes into the stratosphere. Due to the absorption of solar radiation by carbonaceous aerosols, these plumes are uplifted by radiative heating, up to 35 km altitude, which prolongs their stratospheric residence time. In this study we model the self-lofting of these stratospheric plumes as well as their radiative impact.

In the first step, we focus on the physical properties of these plumes and the radiative modeling of their self-lofting. Measurement-based determination of the Single Scattering Albedo (SSA) for stratospheric aerosols is however a challenging task. We thus attempt to constrain the SSA using a combination of radiative transfer modeling and observations from both ground-based and CALIPSO space-borne lidars, as well as use of OMPS-LP extinction profiles. The DIScrete Ordinate Radiative Transfer (DISORT) model, as part of Atmospheric Radiative Transfer Database for Earth Climate Observation (ARTDECO) numerical tool is employed to reproduce the observed self-lofting rate of the plume for varying properties of the plume. We find that the aerosol optical depth and the geometrical thickness of the plume are crucial parameters to model the self-lofting. We also take into account the variations of the underlying cloud cover and surface albedo to better model the self-lofting mechanism.

In the second step, having assessed the SSA, we estimate the radiative forcing induced by these plumes at the top and the bottom of the atmosphere. This method is applied to the Pacific Northwest Event (PNE) wildfire outbreak in August 2017 and the Australian New Year Super Ourbreak (ANYSO) in 2019/20. The results are then compared with previous studies. Finally, we compare the radiative forcing efficiencies of stratospheric smoke with that of stratospheric aerosols from moderate volcanic eruption on local and global scales.

How to cite: Lebrun, R., Derimian, Y., Ravetta, F., Bureau, J., and Khaykin, S.: Self-lofting and radiative forcing of stratospheric aerosol from major wildfires and how it compares to volcanic eruptions, EGU General Assembly 2025, Vienna, Austria, 27 Apr–2 May 2025, EGU25-11701, https://doi.org/10.5194/egusphere-egu25-11701, 2025.

EGU25-12390 | Posters on site | AS3.16

ENSO response to tropical volcanic eruptions: the role of the season 

Francesco S.R. Pausata and David Zanchettin

Stratospheric volcanic aerosol can have major impacts on the global climate. However, these impacts are eruption specific, as they critically depend on the characteristics of the eruption, such as magnitude, location and timing. Towards understanding these criticalities, only a handful of studies have either assessed the effects of eruptions at distinct times throughout the year or the location of eruption. To our knowledge, no study has hitherto considered the combined of the timing and location of an eruption. Here we investigate variations in the impact of volcanic eruptions linked on the timing of the eruption in relation to the seasons of the year and the location (Northern or Southern Tropical eruption), focusing on ENSO dynamics. In doing so, we use the Norwegian Earth System Model (NorESM) to perform a set of sensitivity experiments in which the tropical volcanic eruptions are set to go off at the beginning of each season. These experiments are meant to shed light on the role of the season in shaping the ENSO response to volcanic eruption, elucidating the nuanced role of volcanic forcing in modulating ENSO variability and enhancing our predictive capabilities of this influential climate phenomenon. In our contribution, we will describe first results from our experiments showing how boreal spring and summer Northern Tropical eruptions lead to El Niño-like conditions in the winter of the eruption, followed by strong La Niña conditions. On the other hand, boreal fall and winter eruptions causes a weak La Niña on the first 6-8 months, followed by El Niño conditions in the winter after the eruption. For Southern Tropical eruptions the response is muted and only fall and winter eruptions show El Niño conditions in the second winter of the eruption. To better understand the different responses, we will also interpret the model results within the framework of a simple delayed oscillator of ENSO.

How to cite: Pausata, F. S. R. and Zanchettin, D.: ENSO response to tropical volcanic eruptions: the role of the season, EGU General Assembly 2025, Vienna, Austria, 27 Apr–2 May 2025, EGU25-12390, https://doi.org/10.5194/egusphere-egu25-12390, 2025.

EGU25-12721 | ECS | Orals | AS3.16

Unveiling volcanic forcing through lunar eclipses: past, present and future perspectives 

Lucas Boissel, Sébastien Guillet, Charlie Hureau, Franck Lavigne, and Salem Dahech

Explosive volcanic eruptions inject substantial quantities of sulfur gases into the atmosphere significantly influencing global temperatures and hydrological cycles. The formation of sulfate aerosols in the stratosphere following such eruptions can give rise to unusual optical phenomena, including solar dimming, red twilight glows, reddish solar halos, and dark total lunar eclipses. Recently, lunar eclipses have emerged as a valuable tool for reconstructing past stratospheric turbidity and refining the dating of major volcanic eruptions (Guillet et al., 2023).

This study presents a preliminary reconstruction of stratospheric aerosol optical depth (SAOD) from 1600 to 1850 CE, based on descriptions of 80 lunar eclipses documented in over 1,000 historical sources from across Europe. The reconstructed SAOD dataset was compared with bipolar ice core records (Sigl et al., 2015), model-derived aerosol optical depth (Toohey and Sigl, 2017), and climate reconstructions.

Our findings reveal that the darkest lunar eclipses of the past 400 years – occurring in 1601, 1642, 1696 and 1816 – correspond to the largest volcanic eruptions recorded in ice cores and align with significant cooling events in the Northern Hemisphere. This study highlights the potential of lunar eclipse observations to complement ice core data, providing additional, robust information to refine global stratospheric aerosol databases, which are essential for future climate modeling.

This contribution will also discuss plans to extend the dataset to the present day and address the inherent limitations and uncertainties associated with the methodology.


References:

Guillet, S., et al. (2023). Lunar eclipses illuminate timing and climate impact of medieval volcanism. Nature, 616, 90–95.

Sigl, M., et al. (2015). Timing and climate forcing of volcanic eruptions for the past 2,500 years. Nature, 523, 543–549.

Toohey, M., Sigl, M. (2017). Volcanic stratospheric sulfur injections and aerosol optical depth from 500 BCE to 1900 CE. Earth Syst. Sci. Data, 9, 809–831.

How to cite: Boissel, L., Guillet, S., Hureau, C., Lavigne, F., and Dahech, S.: Unveiling volcanic forcing through lunar eclipses: past, present and future perspectives, EGU General Assembly 2025, Vienna, Austria, 27 Apr–2 May 2025, EGU25-12721, https://doi.org/10.5194/egusphere-egu25-12721, 2025.

EGU25-12900 | ECS | Posters on site | AS3.16

The Impact of 2022 Hunga Tonga-Hunga Ha’apai (Hunga) Eruption on Stratospheric Circulation and Climate 

Simchan Yook, Susan Solomon, and Xinyue Wang

     The Hunga Tonga-Hunga Ha’apai (Hunga) volcanic eruption in January 2022 injected a substantial amount of water vapor and a moderate amount of SO2 into the stratosphere. Both satellite observations in 2022 and subsequent chemistry-climate model simulations forced by realistic Hunga perturbations reveal large-scale cooling in the Southern Hemisphere (SH) tropical to subtropical stratosphere following the Hunga eruption. This study analyzes the drivers of this cooling, including the distinctive role of anomalies in water vapor, ozone, and sulfate aerosol concentration on the simulated climate response to the Hunga volcanic forcing, based on climate simulations with prescribed chemistry/aerosol. Simulated circulation and temperature anomalies based on specified-chemistry simulations show good agreement with previous coupled-chemistry simulations and indicate that each forcing of ozone, water vapor, and sulfate aerosol from the Hunga volcanic eruption contributed to the circulation and temperature anomalies in the Southern Hemisphere stratosphere. Our results also suggest that 1) the large-scale stratospheric cooling during the austral winter was mainly induced by changes in dynamical processes, not by radiative processes, and that 2) ozone’s radiative feedback contributed to the prolonged cold temperature anomalies in the lower stratosphere (~70 hPa level) and hence to long lasting cold conditions of the polar vortex.

How to cite: Yook, S., Solomon, S., and Wang, X.: The Impact of 2022 Hunga Tonga-Hunga Ha’apai (Hunga) Eruption on Stratospheric Circulation and Climate, EGU General Assembly 2025, Vienna, Austria, 27 Apr–2 May 2025, EGU25-12900, https://doi.org/10.5194/egusphere-egu25-12900, 2025.

EGU25-13646 | Posters on site | AS3.16

Changes in the spectral composition of surface solar radiation under the presence of stratospheric aerosols: a case study for the Pinatubo eruption 

Ilias Fountoulakis, Stergios Misios, Anna Gialitaki, Antonis Gkikas, Vassilis Amiridis, Anna Kampouri, Dimitra Kouklaki, Andreas Kazantzidis, Kostas Eleftheratos, Konstantinos Kourtidis, Samuel Rémy, Bernhard Mayer, and Christos S. Zerefos

The presence of aerosols in the stratosphere alters the spectral shape, the amount and the spatial distribution of the solar light that reaches the Earth surface. Such changes in surface solar radiation have been discussed in a few studies, but the role of the underlying tropospheric aerosol layer in the presence of stratospheric aerosols has not been considered. In this study we investigate the changes in the direct and global spectral surface solar irradiances following the extremely intense volcanic eruption (VEI=6) of Mount Pinatubo (15°N, 120°E) in June 1991. The eruption of Mount Pinatubo ejected massive loads of sulphate and ash particles into the stratosphere, which covered the entire globe after three weeks and then remained in the stratosphere for several months. In the aftermath, major perturbations of the stratospheric ozone layer and the near-surface temperature have been documented. Here, we provide model-derived stratospheric aerosol optical properties, constrained by ground-based and airborne remote sensing and in-situ data, to the radiative transfer model libRadtran to calculate the spectral surface solar irradiance in the wavelength range 350 – 750 nm. Radiative transfer simulations have been performed for two European sites where in situ measurements of the aerosol extinction profile were available a few months after the eruption, assuming different concentrations and types of tropospheric aerosols present in the atmosphere along with the overlying stratospheric volcanic layers, as well as different solar zenith angles. Changes in the spectral composition and the distribution of surface solar radiation in the considered spectral range play a key role in many biological processes (e.g., photosynthesis), as well as in solar energy production. Thus, our results provide insights on how such processes could be impacted after future volcanic eruptions or under solar radiation modification scenarios.

Acknowledgements: This work has been supported by the action titled “Support for upgrading the operation of the National Network for Climate Change (CLIMPACT II)”, funded by the Public Investment Program of Greece, General Secretary of Research and Technology/Ministry of Development and Investments.  

How to cite: Fountoulakis, I., Misios, S., Gialitaki, A., Gkikas, A., Amiridis, V., Kampouri, A., Kouklaki, D., Kazantzidis, A., Eleftheratos, K., Kourtidis, K., Rémy, S., Mayer, B., and Zerefos, C. S.: Changes in the spectral composition of surface solar radiation under the presence of stratospheric aerosols: a case study for the Pinatubo eruption, EGU General Assembly 2025, Vienna, Austria, 27 Apr–2 May 2025, EGU25-13646, https://doi.org/10.5194/egusphere-egu25-13646, 2025.

EGU25-13842 | ECS | Orals | AS3.16

Stratospheric Aerosol layer responses to volcanic and wildfire perturbations 

Alexandre Baron, Katie Smith, Elizabeth Asher, Parker Case, Peter Colarco, Emrys Hall, Patrick Cullis, Nicolas Mastromonaco, Alex Fritz, Stephanie Evan, Jerome Brioude, Jean-Marc Metzger, Matthew Martinsen, Darryl Kuniyuki, David Nardini, Penny Smale, Ben Liley, Richard Querel, and Troy Thornberry

The stratospheric aerosol layer plays a critical role in the climate system and is often disrupted by natural phenomena such as volcanic eruptions and extreme wildfire events. These perturbations differ significantly in their injection magnitude, aerosol mass, composition, and the altitude of material deposition. When coupled with the dynamic and chemical state of the stratosphere, these factors produce varied responses in the aerosol layer’s optical and microphysical properties.

Quantifying microphysical responses in detail requires reliable in situ observations, such as those provided by the NOAA Balloon Baseline Stratospheric Aerosol Profiles (B2SAP) network. Spanning latitudes from 72°N to 90°S and capturing data from the surface to approximately 28 km, regular B2SAP soundings monitor the stratospheric aerosol background and the evolution of perturbations over time and space. The Portable Optical Particle Spectrometer (POPS) in the B2SAP payload measures aerosol number and  size distribution, variables crucial for understanding stratospheric aerosol microphysics and refining satellite retrievals of aerosol extinction and effective radius.

In this study, we leverage data collected by B2SAP since its inception in 2019, encompassing a range of perturbations from moderate to large volcanic eruptions and extreme wildfire events, including the 2019–2020 Australian wildfires. We compare in situ observations to satellite-derived measurements, examining differences in aerosol extinction and effective radius. Additionally, we interpret POPS size distribution data alongside NASA GEOS Chemistry Climate Model outputs, providing insights into the processes driving the observed variability in stratospheric aerosol responses.

How to cite: Baron, A., Smith, K., Asher, E., Case, P., Colarco, P., Hall, E., Cullis, P., Mastromonaco, N., Fritz, A., Evan, S., Brioude, J., Metzger, J.-M., Martinsen, M., Kuniyuki, D., Nardini, D., Smale, P., Liley, B., Querel, R., and Thornberry, T.: Stratospheric Aerosol layer responses to volcanic and wildfire perturbations, EGU General Assembly 2025, Vienna, Austria, 27 Apr–2 May 2025, EGU25-13842, https://doi.org/10.5194/egusphere-egu25-13842, 2025.

EGU25-14519 | ECS | Posters on site | AS3.16

State dependence of stratospheric aerosol chemistry-climate impacts in GFDL-ESM4.1 

Shipeng Zhang, Vaishali Naik, Larry Horowitz, and Yuchao Gao

Projecting the chemistry-climate effects of stratospheric aerosols within general circulation models (GCMs) requires simulating multiple coupled processes, which are subject to large uncertainties. Here, we utilize an updated version of the GFDL Earth System Model (GFDL-ESM4.1) with an interactive representation of the stratospheric sulfur cycle to explore the state dependence of stratospheric aerosol chemistry-climate impacts in GFDL-ESM4.1. Understanding this state dependence is crucial for assessing the volcanic chemistry-climate impacts under global warming and is beneficial for evaluating the effectiveness of stratospheric aerosol injection as a geoengineering approach.

We first conduct a baseline simulation from 1989 to 2014, driven by observed sea-surface temperature and sea ice, and including volcanic emissions of sulfur into the stratosphere. Then, we perform sensitivity simulations with sea surface temperature uniformly increased or decreased by 4K to examine the chemistry-climate impacts of stratospheric aerosols under warmer and cooler climate conditions. Our results show that stratospheric aerosol optical depth (SAOD) and burden are sensitive to surface temperature, in our simulations with prescribed volcanic injection heights. In a warmer climate, the accelerated Brewer-Dobson Circulation causes a rapid decay of stratospheric sulfate lifetime and lower SAOD in the 3 years following a the Mt. Pinatubo eruption. The warmer climate also produces a continuously lower SAOD during periods without major eruptions. Changes in SAOD from major eruptions are more sensitive to warming (approximately -11%/K) than to cooling (approximately -5%/K) from the baseline climate. Moreover, the lower SAOD from major eruptions is compensated by higher natural aerosol emissions under a warmer climate, buffering the changes in total AOD. Combined changes—decreased SAOD, albedo feedback, and increased natural aerosols emissions—result in an increase of clear-sky shortwave radiative effect by up to ~2.8 W/m2 in a warmer climate compared to the baseline. We will also explore the follow-on effects on ozone chemistry from the sensitivity of stratospheric aerosols to surface temperature in GFDL-ESM4.1. These results highlights the importance of the interactive sulfur cycle approach in GCMs.

How to cite: Zhang, S., Naik, V., Horowitz, L., and Gao, Y.: State dependence of stratospheric aerosol chemistry-climate impacts in GFDL-ESM4.1, EGU General Assembly 2025, Vienna, Austria, 27 Apr–2 May 2025, EGU25-14519, https://doi.org/10.5194/egusphere-egu25-14519, 2025.

EGU25-15396 | Posters on site | AS3.16 | Highlight

Can Reanalysis Datasets Show Unprecedented Stratospheric Water Vapor After the Hunga Tonga-Hunga Ha’apai Eruption? 

Yang Li, Xin Zhou, Wenhui Zhang, Chaochao Gao, Quanliang Chen, and Wuhu Feng

The 2022 Hunga Tonga-Hunga Ha'apai (HTHH) volcanic eruption injected around 150 Tg water vapor into the stratosphere. Using Microwave Limb Sounder (MLS) water vapor measurement, this study provides the first evaluation of the HTHH-induced stratospheric water vapor (SWV) products revealed by the ERA5, MERRA2 and M2-SCREAM reanalyses. Results show that ERA5 and MERRA2 underestimate the SWV mass compared to MLS observations, while M2-SCREAM shows good consistency not only in the magnitude but also in the transport and depletion details. M2-SCREAM also perform well in the estimation of the long-term trend of SWV mass, while ERA5 and MERRA2 both overestimate the trend, suggesting the potential value of M2-SCREAM in estimating the long-term climatic influence of HTHH eruption. The extent to which the assimilation of SWV contributes to the significant discrepancies observed between M2-SCREAM and ERA5 as well as MERRA2 offers valuable insights for enhancing the numerical simulation of reanalyses.

How to cite: Li, Y., Zhou, X., Zhang, W., Gao, C., Chen, Q., and Feng, W.: Can Reanalysis Datasets Show Unprecedented Stratospheric Water Vapor After the Hunga Tonga-Hunga Ha’apai Eruption?, EGU General Assembly 2025, Vienna, Austria, 27 Apr–2 May 2025, EGU25-15396, https://doi.org/10.5194/egusphere-egu25-15396, 2025.

EGU25-16379 | ECS | Posters on site | AS3.16

Radiative Effects of Hunga Volcanic Eruption in the Middle Atmosphere: A Model and Observation-Based Analysis 

Alistair Bell, Gunter Stober, Guochun Shi, Hanli Liu, and Axel Murk

The 2022 Hunga volcanic eruption, which injected approximately 150 Tg of water vapour directly into the stratosphere, was an unprecedented event and provided a basis for a multitude of middle atmospheric studies. Changes in water vapour in the stratosphere and above affect the chemical composition of the middle atmosphere, the heating and cooling rates in this region, and the longwave downwelling fluxes at the surface.

In this study, we focus on the radiative impact of the changes in the water vapour mixing ratio at two locations where continuous profiling of water vapour has been performed using high-spectral-resolution microwave radiometers. The radiative transfer schemes included in the Whole Atmosphere Community Climate Model (WACCM-X (SD)) are compared to a line-by-line radiative transfer scheme from the Atmospheric Radiative Transfer Simulator (ARTS) to assess the accuracy of these radiative transfer schemes in analysing differences in heating rates and fluxes in the middle atmosphere.

How to cite: Bell, A., Stober, G., Shi, G., Liu, H., and Murk, A.: Radiative Effects of Hunga Volcanic Eruption in the Middle Atmosphere: A Model and Observation-Based Analysis, EGU General Assembly 2025, Vienna, Austria, 27 Apr–2 May 2025, EGU25-16379, https://doi.org/10.5194/egusphere-egu25-16379, 2025.

EGU25-16471 | Posters on site | AS3.16

The dependence of tracer transport on grid refinement 

Ulrike Niemeier, Luis Kornblueh, and Andrea Schneidereit

The lifetime of sulphur in the strartosphere depends on volcanic emission parameters and aerosol microphysical processes, as well as on particle transport. These processes interact and determine the particle size and optical depth of the volcanic cloud.
While tracer transport, via advection and turbulence, affects mixing and dilution, it feeds back onto the aerosol concentration and the microphysical processes.  At the same time, the aerosols absorb terrestrial radiation, which heats the stratospheric aerosol layer and affects transport. Thus, all processes interact, feedback to each other and determine the concentration and particle size of the aerosol.
 
To disentangle the role of aerosol microphysical processes and heating from the role of transport in aerosol evolution, we introduced a passive tracer. This allows us to determine the impact of the grid size on stratospheric dynamics and tracer transport.  Therefore, we added emissions of the gas SF6 (sulphur hexafluoride) to ICON-XPP. SF6 is inert in the troposphere and lower stratosphere and is emitted in industrial production. This allows us to compare the simulated distribution of SF6 with observations.

Comparison with observations allows us to better understand the transport processes in the model. Important for the transport of a volcanic cloud is the velocity of the vertical transport in the tropical pipe or the meridional transport to higher latitudes. Since previous studies have shown a dependence of the transport in the tropical pipe on the model grid, we have performed simulations with different horizontal and vertical resolutions to determine the role of the grid. We had to tune the model for the different resolutions. In the process, we obtained different dynamical states in the lower tropical stratosphere, the region of the quasi-biennial oscillation (QBO). For example, we got only easterly or only westerly jets in the lower tropical stratosphere. These different jets allow us to see the effect of the QBO on the transport of SF6.


How to cite: Niemeier, U., Kornblueh, L., and Schneidereit, A.: The dependence of tracer transport on grid refinement, EGU General Assembly 2025, Vienna, Austria, 27 Apr–2 May 2025, EGU25-16471, https://doi.org/10.5194/egusphere-egu25-16471, 2025.

The release of stratospheric aerosols from major volcanic eruptions induces large-scale global and regional climate impacts through radiative perturbations. The extent of these impacts depends on the season, aerosol-cloud distribution, the height reached by the ejections, and the latitude of the eruption, causing symmetrical and asymmetrical forcing. Previous studies have linked some severe Sahel drought conditions during the 20th century from two to four seasons of post-eruption feedback. However, a detailed analysis of the causal mechanism through the complex teleconnections driving changes of the African monsoon and its atmospheric dynamics in response to the volcanic eruption is yet to be addressed. Besides, the interest in the deliberate stratospheric injection of sulfate aerosols as a Solar Radiation Management (SRM) technique has increased due to the difficulties of limiting the global mean temperature to 1.5 or 2.0 °C above the Pre-industrial level. This implies the need to investigate the associated hydro-climate changes in response to such climate change solution techniques across Africa. In this study, we explore the response of the African monsoon and its driving teleconnections changes to past volcanic eruptions to better understand the potential climate impacts of future eruptions and even further to the proposed SRM geoengineering. Since larger and wider varieties of eruptions occurred in the last millennium compared to the 20th century, we use the past millennium's natural external volcanic forcings as an analog to explore the dynamics feature and associated teleconnections of the African monsoon. We rely on the varied experimental simulation outputs of the state-of-the-art Earth System Models that participated in the sixth phase of the Coupled Model Intercomparison Project (CMIP6). More specifically, we use the models that simulated the past millennium (PMIP4; Jungclaus et al., 2017), volcanic forcing experiments (VolMIP; Zanchettin et al., 2016), and stratospheric aerosol geoengineering experiments (GEOMIP; Jones et al., 2021). Overall, the analyzed responses from the modelling perspective provide an overview of the impact of volcanic forcings across Africa in the past, present, and future climates.

How to cite: Arthur, F. and Boateng, D.: The response of African monsoons to the symmetric and asymmetric Volcanic eruptions in past and future climate, EGU General Assembly 2025, Vienna, Austria, 27 Apr–2 May 2025, EGU25-16818, https://doi.org/10.5194/egusphere-egu25-16818, 2025.

EGU25-17973 | ECS | Posters on site | AS3.16

Sensitivity of Monsoon Onset to Idealised Volcanic Forcing 

Shreyas Iyer, Moritz Guenther, Chetankumar Jalihal, and Claudia Timmreck

Large volcanic eruptions are a source of climate variability, affecting global temperatures and precipitation. The hydrology of the Indian monsoon region is particularly sensitive to volcanic forcing. Previous studies have focused on the seasonal mean response of the Indian monsoon to eruptions. Here, we investigate the changes to the onset of the monsoon, which is an important characteristic that impacts the water budget of the region. Using large Earth System ensemble simulations with idealised model eruptions that inject 40 Tg of sulphur into the stratosphere at varying latitudes, we observe changes in onset date by a few weeks compared to an unforced case. We find that the date of onset of the Indian summer monsoon is strongly dependent on the eruption latitude. Our results show a delayed (advanced) Indian monsoon onset for a Northern (Southern) Hemispheric eruption. However, the internal variability of the monsoon system also influences the onset. We find that existing mechanisms linking internal variability to monsoon onset are insufficient to explain the onset changes observed due to volcanic forcings. Based on the Low-Level Jet (LLJ) and ITCZ frameworks, we propose a new mechanism of monsoon onset variation due to volcanic eruptions. We show that not just a strengthening LLJ, but also an increased moisture flux into the Indian monsoon region triggers an earlier onset.

How to cite: Iyer, S., Guenther, M., Jalihal, C., and Timmreck, C.: Sensitivity of Monsoon Onset to Idealised Volcanic Forcing, EGU General Assembly 2025, Vienna, Austria, 27 Apr–2 May 2025, EGU25-17973, https://doi.org/10.5194/egusphere-egu25-17973, 2025.

EGU25-18228 | ECS | Orals | AS3.16

 The impact of the 2022 Hunga water-rich eruption on polar stratospheric clouds, chlorine activation and ozone depletion 

Saffron Heddell, Martyn Chipperfield, Sandip Dhomse, Graham Mann, Wuhu Feng, Masaru Yoshioka, and Xin Zhou

The Hunga eruption, January 2022, injected ~150 Tg of water vapour into the sub-tropical mid-stratosphere, unprecedented in the satellite era. The effects of the Hunga water vapour on the heterogeneous chemistry in the Antarctic stratosphere did not occur in the 2022 season, with the vortex edge a barrier to transport to high southern latitudes, until vortex break-up. Here, we analyse chlorine activation and ozone loss impacts starting with the 2023 vortex, and find these effects were not uniform throughout the vortex, and were limited by widespread mid-winter dehydration that occurs in the Antarctic each year, mainly in the colder “vortex core” region, via ice-containing polar stratospheric clouds (PSCs).  

Heterogeneous, chlorine-activating reactions on PSC surfaces play a key role in polar stratospheric ozone depletion and the formation of the seasonal Antarctic ozone hole. Stratospheric water vapour is one of the key factors in PSC formation; thus, the water vapour enhancement from Hunga is likely to impact PSC occurrence and therefore may increase the ozone depletion. However, the effects may vary between different regions of the vortex. The core region experiences the lowest temperatures, frequently reaching the threshold for ice PSCs, and the most extensive dehydration (in the lower stratosphere) over much of the vortex season. In contrast, the edge region is more sunlit, less cold, and experiences less extensive dehydration than the core, meaning there is scope for different chemical impacts in this region. Overall, the Hunga eruption offers a unique opportunity to test our understanding of how a large-scale increase in water vapour impacts polar ozone, and how the vortex structure influences the timing and magnitude of the effects.

Here we use the TOMCAT three-dimensional chemical transport model to investigate the impacts of the Hunga water vapour on Antarctic stratospheric ozone and associated heterogeneous chlorine reactions, comparing the 2023 and 2024 Antarctic vortex seasons. We find that the enhanced water vapour raised PSC formation temperatures, resulting in earlier formation and, consequently, an earlier onset of the heterogeneous chemistry and chlorine activation. However, it is evident that the vortex structure has some influence on the impact. Compared to a control simulation without Hunga, the effect on the edge region occurs throughout the PSC season, whereas the core, due to effective dehydration, experiences large differences at the beginning and end of the season, with minimal differences in between.

We will also briefly summarise the impact of Hunga water vapour on Arctic springtime ozone in recent years, including 2025. The effect of Hunga in the Arctic has so-far been limited by the timing of the water transport (2022/23) and a series of stratospheric warming events (SSWs) (2023/24). However, the 2024/25 Arctic winter began colder than usual in December/January. Therefore, effects of the Hunga water vapour may be more pronounced during this Arctic winter subject to any warming events still to come.

How to cite: Heddell, S., Chipperfield, M., Dhomse, S., Mann, G., Feng, W., Yoshioka, M., and Zhou, X.:  The impact of the 2022 Hunga water-rich eruption on polar stratospheric clouds, chlorine activation and ozone depletion, EGU General Assembly 2025, Vienna, Austria, 27 Apr–2 May 2025, EGU25-18228, https://doi.org/10.5194/egusphere-egu25-18228, 2025.

The stratospheric aerosol layer is a key component of the climate system through its impact on radiation, chemistry and climate. While satellite observations have observed this layer for more than 4 decades through solar occultation, limb scatter and lidar techniques, we still lack in situ measurements to fully understand how its spatial and temporal evolution vary through the influence of multiple sources. Long-term balloon measurements of stratospheric aerosols are available mostly at mid-latitudes and do not cover the tropics, a key region that largely affects the supply and the transport of stratospheric aerosols at global scales. Our team has deployed at multiple locations including Australia, India, Brazil since the past decade to study the impacts of volcanic eruptions, the Asian monsoon and PyroCbs on the stratosphere through in situ measurements. Leveraging on this experience, we believe that the next step is to conduct regular balloon-borne observations through a new network, the Balloon Network for stratospheric aerosol Observation (BalNeO). During this presentation, we will describe the overall objectives of BalNeO and show some preliminary results.

How to cite: Vernier, J.-P.: Balloon Network for stratospheric aerosol Observations (BalNeO): A new network to monitor the stratosphere, EGU General Assembly 2025, Vienna, Austria, 27 Apr–2 May 2025, EGU25-18647, https://doi.org/10.5194/egusphere-egu25-18647, 2025.

EGU25-18827 | ECS | Posters on site | AS3.16

Winter Warming in Northern Eurasia Following the 1783 Laki Volcanic Eruption 

Linshan Yang, Chaochao Gao, and Fei Liu

        Northern Eurasian winter warming (NEWW) is reported both in the observation and reconstruction following major tropical volcanic eruptions. However, current climate models struggle to accurately simulate this warming phenomenon, posing challenges to fully understand and validate this distinct climate response amidst the general trend of volcano-induced global cooling. Here we show that, the persistent volcanic cloud from summer to late autumn and the associated warming of the mid-latitude stratosphere plays a pivotal role in triggering NEWW. The role of winter aerosols is demonstrated by sensitivity simulations with updated volcanic forcing of the 1783 Icelandic Laki eruption, supported by two recently available temperature reconstructions, and reversely verified by model results of various eruptions without substantial cold season aerosol loadings. The abnormal mid-latitude stratospheric warming enhances the meridional temperature gradient, strengthens the polar vortex, alters both horizontal and vertical energy redistribution that contributed to NEWW. The findings help to reconcile the model-observation discrepancy of post-eruption winter climate responses, and point to the critical role of stratosphere-troposphere coupling in responding and redistributing the radiative perturbation.

How to cite: Yang, L., Gao, C., and Liu, F.: Winter Warming in Northern Eurasia Following the 1783 Laki Volcanic Eruption, EGU General Assembly 2025, Vienna, Austria, 27 Apr–2 May 2025, EGU25-18827, https://doi.org/10.5194/egusphere-egu25-18827, 2025.

EGU25-18860 | ECS | Posters on site | AS3.16

Investigating the Climatic Impacts of Volcanic Eruptions over Eurasia and MENA Using the MIROC6 Coupled Climate Model 

Muhammad Mubashar Dogar, Shingo Watanabe, and Masatomo Fujiwara

Tropical volcanic eruptions are significant drivers of climate variability, inducing North Atlantic Oscillation (NAO)-like circulation changes that lead to high-latitude Eurasian winter warming and amplified cooling in the Middle East and North Africa (MENA). However, recent studies have raised concerns about the robustness of this post-eruption NAO-like response, suggesting that its regional impacts on Eurasia and MENA could be linked to coexisting El Niño-like variability rather than volcanic-induced NAO variability. To address this gap, this study utilizes the high-top MIROC6 coupled model to examine the roles of NAO and ENSO in shaping regional climate dynamics over MENA following tropical volcanic events. Our findings reveal that post-eruption winter responses are primarily driven by NAO, with El Niño-like conditions amplifying MENA cooling but not initiating it. In summer, volcanic aerosols weaken the Hadley circulation's updraft branch (i.e., ITCZ), leading to tropical warming and drying, with further amplification by ENSO interactions. These results validate MIROC6's effectiveness in simulating volcanic impacts and offer critical insights for interpreting climate models and informing post-eruption climate policies.

How to cite: Dogar, M. M., Watanabe, S., and Fujiwara, M.: Investigating the Climatic Impacts of Volcanic Eruptions over Eurasia and MENA Using the MIROC6 Coupled Climate Model, EGU General Assembly 2025, Vienna, Austria, 27 Apr–2 May 2025, EGU25-18860, https://doi.org/10.5194/egusphere-egu25-18860, 2025.

EGU25-19434 | ECS | Posters on site | AS3.16

Climate Responses to Volcanic Eruption Clusters in the North Atlantic Under Different Boundary Conditions 

Deepashree Dutta, Peter Hopcroft, Francesco Muschitiello, Laurits Andreasen, Thomas Aubry, Xu Zhang, Claudia Timmreck, and Davide Zanchettin

Volcanic eruptions release aerosols into the stratosphere, which can trigger a wide range of climate responses across different temporal and spatial scales. However, the physical processes through which volcanic forcing leads to long-term global and regional cooling remain inadequately explored. Specifically, the climate responses following a series of intense volcanic eruptions before the Holocene remain insufficiently understood. The conditions during such past climates were vastly different from today’s, suggesting that potential amplifying feedbacks may also have differed. Using fully glacial, deglacial and pre-industrial boundary conditions, we conducted a suite of experiments with the Hadley Centre Coupled Model Version 3 and the Max Planck Institute's Earth System Model, forced with idealised volcanic eruption clusters, to investigate the long-term post-eruption sea surface temperature and sea ice responses in the North Atlantic. We find more intense and longer-lasting cooling in the subpolar North Atlantic in the fully glacial state compared to the other climate states. We explore the physical processes driving this cooling and how differences in the representation of upper-ocean conditions across the two climate models lead to model-dependent results.

How to cite: Dutta, D., Hopcroft, P., Muschitiello, F., Andreasen, L., Aubry, T., Zhang, X., Timmreck, C., and Zanchettin, D.: Climate Responses to Volcanic Eruption Clusters in the North Atlantic Under Different Boundary Conditions, EGU General Assembly 2025, Vienna, Austria, 27 Apr–2 May 2025, EGU25-19434, https://doi.org/10.5194/egusphere-egu25-19434, 2025.

EGU25-19899 | Posters on site | AS3.16

Diabatic Heating Rates and Mesoscale Vortices in Stratospheric Volcanic Plumes: Insights from the 2022 Hunga and 2019 Raikoke plumes 

Aurélien Podglajen, Duc Dung Tran, Pasquale Sellitto, Clair Duchamp, Bernard Legras, William Randel, and Jon Starr

Following the eruptions of Raikoke in 2019 and Hunga in 2022, it was recently discovered that stratospheric volcanic plumes may feature specific mesoscale dynamics. First, they undergo important vertical motions, a descent for the Hunga plume [e.g., 1,2], a self-lofting for the Raikoke plume [e.g., 3]. Second, they tend to self-organize into mesoscale anticyclonic circulations. This behavior dramatically affects the dispersion of the plumes and their climate impacts. While it is clear that they arise due to significant diabatic heating anomalies, a quantitative estimate of the radiative heating rates and their link with the vertical motions of the plumes is currently lacking .

In this study, we use offline radiative transfer calculations with a broad-band radiative transfer model to quantify the anomalous stratospheric heating rates resulting from a localized volcano-induced perturbation. The calculations are forced using particle optical properties and water vapor concentrations in the Hunga and Raikoke plumes observed from a suite of space-borne sensors including the spaceborne Lidar CALIOP. We explore the sensitivity of the heating rates to various plume properties, including altitude and composition. Their consequences on mesoscale organization are discussed in light of idealized mesoscale plume simulations [4].


References

[1] Sellitto, P., Podglajen, A., Belhadji, R. et al. The unexpected radiative impact of the Hunga Tonga eruption of 15th January 2022. Commun Earth Environ 3, 288 (2022). https://doi.org/10.1038/s43247-022-00618-z

[2] Legras, B., Duchamp, C., Sellitto, P., Podglajen, A., Carboni, E., Siddans, R., Grooß, J.-U., Khaykin, S., and Ploeger, F.: The evolution and dynamics of the Hunga Tonga–Hunga Ha'apai sulfate aerosol plume in the stratosphere, Atmos. Chem. Phys., 22, 14957–14970, https://doi.org/10.5194/acp-22-14957-2022, 2022.

[3] Khaykin, S.M., de Laat, A.T.J., Godin-Beekmann, S. et al. Unexpected self-lofting and dynamical confinement of volcanic plumes: the Raikoke 2019 case. Sci Rep 12, 22409 (2022). https://doi.org/10.1038/s41598-022-27021-0

[4] Podglajen, A., Legras, B., Lapeyre, G., Plougonven, R., Zeitlin, V., Brémaud, V., et al. (2024) Dynamics of diabatically forced anticyclonic plumes in the stratosphere. Quarterly Journal of the Royal Meteorological Society, 150(760), 15381565. https://doi.org/10.1002/qj.4658

How to cite: Podglajen, A., Tran, D. D., Sellitto, P., Duchamp, C., Legras, B., Randel, W., and Starr, J.: Diabatic Heating Rates and Mesoscale Vortices in Stratospheric Volcanic Plumes: Insights from the 2022 Hunga and 2019 Raikoke plumes, EGU General Assembly 2025, Vienna, Austria, 27 Apr–2 May 2025, EGU25-19899, https://doi.org/10.5194/egusphere-egu25-19899, 2025.

EGU25-19929 | ECS | Posters on site | AS3.16

 Impact of the April 2024 Ruang volcanic eruption on the Asian Tropopause Aerosol Layer: insights from Balloon measurements 

Hazel Vernier, Neeraj Rastogi, Nicolas Dumelie, Jean-Paul Vernier, Lilian Joly, Gwenael Berthet, and Rohit Meena

Stratospheric aerosols play a crucial role in Earth's radiative balance and atmospheric chemistry. Their sources and properties are influenced by various factors, including volcanic eruptions, biomass burning (PyroCbs), and the Asian Tropopause Aerosol Layer (ATAL). The ATAL, a prominent feature of the Asian Summer Monsoon (ASM), extends from the eastern Mediterranean across India to western China at altitudes of 13-18 km.

Recent volcanic eruptions have significantly impacted the stratosphere, with varying characteristics such as the magnitude and altitude of the eruption, the injected mass, and the resulting aerosol composition. These eruption characteristics, combined with the dynamics of the Asian Monsoon Anticyclone (AMA), and the pre-existing chemical state of the ATAL, contribute to complex and diverse aerosol properties within this region.

The Balloon measurement campaign of the ATAL (BATAL) project utilizes balloon-borne instruments to investigate the optical, physical, and chemical properties of the ATAL. Since its inception a decade ago, BATAL has employed optical particle counters, balloon-borne radiosondes, and aerosol collectors to characterize ATAL aerosols. These measurements are further complemented by satellite and ground-based lidar observations to enhance our understanding of aerosol sources and transport mechanisms. Understanding the different sources of stratospheric aerosols over Asia is critical to differentiate the impacts of anthropogenic and natural aerosols on the climate and monsoon hydrological cycle. 

In the summer of 2024, after a four-year hiatus due to the COVID-19 pandemic, the BATAL project resumed measurements in India. Our observations revealed a complex scenario where the UTLS was influenced by both the ATAL and the transport of aerosols from the Ruang volcanic eruption, which occurred in April 2024. By analyzing data from a suite of instruments, including balloon-borne optical particle counters, backscatter sondes, and aerosol samplers. This analysis will enable us to compare the characteristics of ATAL and volcanic aerosols and discuss the implications of these findings for understanding their combined impact on the atmosphere.


How to cite: Vernier, H., Rastogi, N., Dumelie, N., Vernier, J.-P., Joly, L., Berthet, G., and Meena, R.:  Impact of the April 2024 Ruang volcanic eruption on the Asian Tropopause Aerosol Layer: insights from Balloon measurements, EGU General Assembly 2025, Vienna, Austria, 27 Apr–2 May 2025, EGU25-19929, https://doi.org/10.5194/egusphere-egu25-19929, 2025.

"Radiative" or "rapid" adjustments refer to the climate system's responses to an instantaneous radiative forcing, which are independent of surface temperature changes. They occur on timescales from hours to months or even longer, making it difficult to distinguish them from feedbacks. Despite variations in definitions, understanding these processes is essential for advancing climate modeling.

Volcanic eruptions, which introduce scattering aerosol to the stratosphere, serve as natural experiments for studying short-term adjustments. However, the gradual global spread of aerosols during a volcanic eruption complicates analysis. To address this, we took a stepwise approach, starting with idealized model simulations, gradually increasing complexity and finally comparing model results with satellite measurements of the Mt. Pinatubo eruption in 1991. We analyzed data of the abrupt-solm4p experiment from the Cloud Feedback Model Intercomparison Project (CFMIP) within the 6th Coupled Model Intercomparison Project (CMIP6). This experiment simulates a 4% reduction in the solar constant. Additionally, we analyzed an MPI-ESM 1.2 model experiment with both absorbing and non-absorbing stratospheric aerosol layers, using fixed and fully coupled sea surface temperatures. Moreover, results from the volc-pinatubo-full experiment of the CMIP6 Volcanic MIP (VolMIP) were considered, simulating a Pinatubo like eruption, but initializing it from different years of the control run to account for climate variability. Finally, model results were compared to ERA5 reanalysis data of the Pinatubo eruption in 1991.

This study focused on changes in climate variables, cloud properties, and radiative fluxes during the first year after the onset of forcing. All model experiments were initialized on January 1st as the start of forcing, while ERA5 data was used from January 1st, 1992, onwards, since volcanic forcing from the Mt. Pinatubo eruption was strongest at that point.

Results show rapid cooling in the troposphere, especially over Antarctica and the Southern Hemisphere. In contrast, the stratosphere warms significantly when absorbing aerosol is present in the stratopshere. These temperature changes affect the jet streams, as well as the polar night jet, leading to a disruption of the polar vortex and consequently increased surface temperature in the Arctic. Within the first month, the troposphere cools faster than the ocean surface, reducing vertical stability and increasing relative humidity over the ocean. Conversely, over land in the tropics, the opposite effect occurs, influencing land-sea circulation.

How to cite: Lange, C. and Quaas, J.: Rapid adjustments after volcanic eruptions - A stepwise approach towards a better understanding of short-term adjustments in climate models, EGU General Assembly 2025, Vienna, Austria, 27 Apr–2 May 2025, EGU25-20169, https://doi.org/10.5194/egusphere-egu25-20169, 2025.

EGU25-20238 | ECS | Orals | AS3.16

Sulfur isotopes and tephra geochemistry in identifying the volcanic sources of mystery, climate forcing eruptions preserved in ice cores 

Helen Innes, William Hutchison, Celeste Smith, Patrick Sugden, and Andrea Burke

Ice cores provide the best record of volcanic sulfate aerosol emissions in the pre-satellite era, which are used in model simulations to understand the past and future climate hazards of volcanic stratospheric injection. However, the vast majority of ice core recorded events used in climate models are not attributed to known eruptive sources. Therefore, it is necessary to make assumptions of source latitude, plume height, and stratospheric sulfur loading – all variables which impact the climate forcing of an eruption. This is even the case for relatively recent eruptions recorded in ice during the post-industrial era, where cold conditions were experienced by global societies, but no historical records of the culprit eruptions exist.

Using a multi-pronged approach that combines high time resolution sulfur isotope analysis of deposited aerosols and geochemical analysis of microscopic ash particles in polar ice cores, these eruption characteristics can be better constrained. We demonstrate how this multi-method approach has recently aided the investigations into several volcanic eruptions recorded in polar ice cores which are associated with periods of notable climate cooling in the Common Era, including the mysterious 1831 CE eruption. These efforts will improve the volcanic forcing used in model simulations of the climate over the last 2000 years.

How to cite: Innes, H., Hutchison, W., Smith, C., Sugden, P., and Burke, A.: Sulfur isotopes and tephra geochemistry in identifying the volcanic sources of mystery, climate forcing eruptions preserved in ice cores, EGU General Assembly 2025, Vienna, Austria, 27 Apr–2 May 2025, EGU25-20238, https://doi.org/10.5194/egusphere-egu25-20238, 2025.

EGU25-20342 | Posters on site | AS3.16

Nonlinear precipitation and temperature response to large low-latitude eruptions spanning the last two millennia 

Dana Raiter, Zachary McGraw, and Lorenzo Polvani

We ask whether the temperature and precipitation response to large, low-latitude volcanic eruptions is a linear function of the eruption magnitude, as measured by the mass (in Teragrams) of sulfur injected in the lower stratosphere (TgS).  Consider the last 2,000 years, magnitudes of climatically interesting eruptions range from roughly 10 TgS from the 1991 Pinatubo and the 1883 Krakatau eruptions, to nearly 30 TgS for the 1815 eruption, to almost 60 TgS for the largest event, the 1257 Samalas eruption.  To span this entire range, we simulate eruptions of 5, 10, 20, 40, 80 and 160 TgS, using a state-of-the art climate model with a well-resolved stratosphere.  For each eruption magnitude we run a 20-member ensemble of 10-year-long simulations.

We confirm earlier studies, and find that the response is linear up to 20 TgS.  However, for eruptions of 40 TgS and above, our analysis reveals a clear nonlinear relationship between eruption magnitude and climate response.  We also find important differences between the responses in temperature and precipitation: while the temperature response saturates after 40 TgS, the precipitation response continues to increase in magnitude albeit at a reduced rate.  Furthermore, we find that the controlling mechanisms driving the precipitation response are different for the weakest and strongest events.  For small eruptions the precipitation anomalies are primarily driven by the cooling surface temperatures (slow response), while for the largest eruptions they are dominated by the absorption of longwave radiation by the volcanic aerosols which warms the lower stratosphere (fast response).

How to cite: Raiter, D., McGraw, Z., and Polvani, L.: Nonlinear precipitation and temperature response to large low-latitude eruptions spanning the last two millennia, EGU General Assembly 2025, Vienna, Austria, 27 Apr–2 May 2025, EGU25-20342, https://doi.org/10.5194/egusphere-egu25-20342, 2025.

EGU25-21360 | Posters on site | AS3.16

Exploring stratospheric aerosol radiative forcing using the SASKTRAN radiative transfer framework 

Matthew Toohey, Taran Warnock, Daniel Zawada, and Adam Bourassa

The radiative forcing associated with stratospheric aerosol is often diagnosed using coupled general circulation models. The radiation codes within such models are state-of-the-art, but contain simplifications in order to optimize computational efficiency and make it feasible to perform simulations on climate-relevant time scales. Calculating radiative forcing using different radiative transfer techniques is useful to validate results from GCMs, and explore sensitivities to parameters that are not easily modified in such models. Here, we report on progress toward quantifying global stratospheric aerosol radiative forcing using the SASKTRAN radiative transfer framework, which has a rich heritage in the context of the retrieval of aerosol and gas species from limb scattered radiation. SASKTRAN is coupled to the Easy Volcanic Aerosol (EVA) forcing generator, allowing for realistic but adjustable stratospheric aerosol properties in global or single column radiative transfer calculations. Simulations are used to assess the impact of multiple scattering on the global radiative forcing, and its dependence on location and aerosol perturbation magnitude. We also assess the impact of using the simplified scattering parameters used as input to most GCMs (extinction, single scattering albedo and asymmetry factor) compared to using the full Mie scattering phase function computed from a given aerosol size distribution.

How to cite: Toohey, M., Warnock, T., Zawada, D., and Bourassa, A.: Exploring stratospheric aerosol radiative forcing using the SASKTRAN radiative transfer framework, EGU General Assembly 2025, Vienna, Austria, 27 Apr–2 May 2025, EGU25-21360, https://doi.org/10.5194/egusphere-egu25-21360, 2025.

EGU25-3877 | Orals | NP1.3

The Typicality of Regimes Associated with Northern Hemisphere Heatwaves 

Christopher Chapman, Didier Monselesan, James Risbey, Abdelwaheb Hannachi, Valerio Lucarini, and Richard Matear

We study the hemispheric to continental scale regimes that lead to summertime heatwaves in the Northern Hemisphere. By using a powerful data mining methodology -archetype analysis - we identify characteristic spatial patterns consisting of a blocking high pressure systems embedded within a meandering upper atmosphere circulation that is longitudinally modulated by coherent Rossby Wave Packets. Periods when these atmospheric regimes are strongly expressed correspond to large increases in the likelihood of extreme surface temperature. Most strikingly, these regimes are shown to be typical of surface extremes and frequently reoccur. Three well publicised heatwaves are studied in detail - the June-July 2003 western European heatwave, the August 2010 "Russian" heatwave, and the June 2021 "Heatdome" event across western North America. We discuss the implications of our work for long-range prediction or early warning, climate model assessment and post-event diagnosis.

How to cite: Chapman, C., Monselesan, D., Risbey, J., Hannachi, A., Lucarini, V., and Matear, R.: The Typicality of Regimes Associated with Northern Hemisphere Heatwaves, EGU General Assembly 2025, Vienna, Austria, 27 Apr–2 May 2025, EGU25-3877, https://doi.org/10.5194/egusphere-egu25-3877, 2025.

EGU25-5631 | Orals | NP1.3

TurboMeter: attributing aviation turbulence events to climate change 

Tommaso Alberti, Lia Rapella, Erika Coppola, and Davide Faranda

Turbulence remains a pressing challenge for aviation safety and efficiency, as highlighted by recent incidents involving Singapore Airlines, Qatar Airways, and Scandinavian Airlines. Among the various types, Clear Air Turbulence (CAT) poses the greatest hazard due to its occurrence in clear skies, rendering it difficult to detect and predict. Furthermore, the unprecedented changes in Earth's climate are reshaping atmospheric dynamics on a global scale, with profound implications on aviation. As a companion of ClimaMeter, a platform designed to assess and contextualize extreme weather phenomena in relation to climate change, we introduce here TurboMeter. It is designed to use ERA5 reanalysis data to investigate the meteorological drivers of turbulence events by comparing them with historical analogues under similar atmospheric conditions. Turbulence diagnostics, including Ellrod’s indices, are used to evaluate the roles of jet streams, wind shear, and convective activity at typical cruising altitudes.

To illustrate TurboMeter, we present some recent aviation turbulence events occurred during 2024. Our findings reveal that they are closely linked to intensified jet streams and enhanced convective activity, influenced by the growing impacts of anthropogenic climate change. These results highlight a concerning trend: changing climatic patterns are altering the atmospheric drivers of turbulence, particularly CAT, with significant implications for flight safety and operational planning. Our study evidences the urgent need for improved weather forecasting and turbulence prediction models to mitigate aviation risks in a rapidly warming climate.

How to cite: Alberti, T., Rapella, L., Coppola, E., and Faranda, D.: TurboMeter: attributing aviation turbulence events to climate change, EGU General Assembly 2025, Vienna, Austria, 27 Apr–2 May 2025, EGU25-5631, https://doi.org/10.5194/egusphere-egu25-5631, 2025.

EGU25-5780 | Posters on site | NP1.3

ClimaMeter: a rapid attribution framework for weather extreme events 

Davide Faranda and the The ClimaMeter team
Climate change is a global challenge with manifold and widespread consequences, including the intensification and increased frequency of numerous extreme weather phenomena. In response to this pressing issue, we introduce ClimaMeter, a platform designed to assess and contextualize extreme weather phenomena in relation to climate change. The platform provides near-real-time information on the dynamics of extreme events, serving as a resource for researchers, policymakers, and acting as a scientific outreach tool for the general public. ClimaMeter currently analyzes heatwaves, cold spells, heavy precipitation, and windstorms.Our methodology is based on looking for weather conditions similar to those that caused the extreme event of interest with physics-informed machine-learning methodologies. We focus on the satellite era, namely the period since 1979, when widespread observations of climate variables from satellites have become available. The object studied (i.e. "the event") is asurface-pressure pattern over a certain region and averaged over a certain number of days, that has lead to a extreme weather conditions. We split the dataset 1979-Present in two parts of equal length and consider the first half of the satellite era  as "past" and the second part as "present" separately. We use data from MSWX. We then compare how the selected weather conditions have changed between the two periods, and whether such changes are likely due to natural climate variability or anthropogenic climate change.
This presentation sheds light on the methodology, data sources, and analytical techniques that ClimaMeter relies on, offering a comprehensive overview of its scientific foundations. To illustrate ClimaMeter, we present some examples of recent extreme weather events. Additionally, we highlight the role of ClimaMeter in promoting a profound understanding of the complex interactions between climate change and extreme weather phenomena, with the hope of ultimately contributing to informed decision-making and climate resilience. Follow us on the social-media @ClimaMeter and visit www.climameter.org.

How to cite: Faranda, D. and the The ClimaMeter team: ClimaMeter: a rapid attribution framework for weather extreme events, EGU General Assembly 2025, Vienna, Austria, 27 Apr–2 May 2025, EGU25-5780, https://doi.org/10.5194/egusphere-egu25-5780, 2025.

EGU25-7645 | ECS | Orals | NP1.3

Advancing the understanding of extreme events through the lens of dynamical system theory 

Chenyu Dong, Adriano Gualandi, Valerio Lucarini, and Gianmarco Mengaldo

Since Lorenz's pioneering work, dynamical systems theory has provided a powerful framework for studying complex systems. Among these, the study of their instantaneous properties is particularly significant for understanding short-lived yet impactful extreme events. Here, we propose an analogues-based index to measure the instantaneous predictability of dynamical systems over different forecasting horizons. We demonstrate its application in both classical dynamical systems and the Euro-Atlantic sector atmospheric circulation. Furthermore, recognizing that the onset of extreme events often involves processes operating across different scales, we introduce a novel framework that enables the exploration of scale-dependent dynamical properties. Given the flexible and generalizable nature of these methods, we believe they open new research avenues for studying extreme events from a dynamical systems perspective and will serve as valuable tools for deepening our understanding of extreme events.

How to cite: Dong, C., Gualandi, A., Lucarini, V., and Mengaldo, G.: Advancing the understanding of extreme events through the lens of dynamical system theory, EGU General Assembly 2025, Vienna, Austria, 27 Apr–2 May 2025, EGU25-7645, https://doi.org/10.5194/egusphere-egu25-7645, 2025.

EGU25-7685 | Orals | NP1.3

Progress and Challenges in the Study of Extreme Weather 

Gianmarco Mengaldo

Extreme weather events, including heatwaves, extreme precipitation, tropical cyclones, and other hazards, pose significant risks to society and ecosystems. Recent advancements in observational techniques, numerical modeling, theoretical frameworks, and AI methods have greatly improved our understanding and prediction of extreme weather events. However, despite significant progress, key challenges remain unresolved, particularly in achieving a thorough understanding of the physical drivers of extreme events, improving the transparency of AI-based prediction methods, and evaluating the vulnerability and resilience of cities to their impacts. To address these challenges, we present various approaches drawn from different fields, including dynamical systems theory, explainable AI, and NLP-based methods. Given the flexible and generalizable nature of these methods, we believe they may pave the way toward more robust solutions for addressing the challenges posed by extreme weather events.

How to cite: Mengaldo, G.: Progress and Challenges in the Study of Extreme Weather, EGU General Assembly 2025, Vienna, Austria, 27 Apr–2 May 2025, EGU25-7685, https://doi.org/10.5194/egusphere-egu25-7685, 2025.

Compound climate and weather extremes have received significant attention in recent years due to the increased risks that they pose to the environment, human societies, and the economy. While prior studies have identified associations between various hazards in disaster databases, investigations focussing on droughts and floods remain rare. In this study, we analyze the impacts of concurrent or sequential drought-flood extremes from two widely used disaster databases: the Emergency Events Database (EM-DAT) and its geocoded version (GDIS), as well as the DesInventar database. The analysis focuses on the period from 1960 to 2018, aligning with GDIS temporal coverage. We define concurrent or sequential hazards as instances where a flood occurs during a drought period or within four months following a drought.  


Our findings for the global extratropics reveal that the economic losses and the number of affected people resulting from the identified drought-flood events are two to eight times higher than those ascribed to isolated droughts or floods, with a confidence interval ranging from two to twelve. Specifically, in DesInventar, the impact ratio (the mean impact of concurrent or sequential events divided by the mean impact of isolated events) for indirectly affected individuals and financial losses is approximately three. In EM-DAT, the impact ratio reaches three for economic damages and eight for affected individuals. Furthermore, the impact ratios are notably higher in the last 30 years of the study period compared to earlier decades, emphasizing the increasing severity of the drought-flood compound events.


These results highlight the amplified negative impacts when droughts and floods occur concomitantly or sequentially, highlighting the need for more robust policies to address their socio-economic risks, particularly under changing climatic conditions.

How to cite: Worou, K. and Messori, G.: Amplified Socio-Economic Impacts of Concurrent or Sequential Drought-Flood Events: Insights from Disaster Databases (1960–2018), EGU General Assembly 2025, Vienna, Austria, 27 Apr–2 May 2025, EGU25-8719, https://doi.org/10.5194/egusphere-egu25-8719, 2025.

EGU25-10235 | ECS | Orals | NP1.3

Assessing the impact of climate change on wildfire development: insights from analogues and regional climate models 

Chen Lu, Rita Nogherotto, Tommaso Alberti, Gabriele Messori, Erika Coppola, and Davide Faranda

Climate change is an ongoing process that is modifying weather patterns and influencing weather phenomena and extreme events such as heatwaves, droughts, and floods. In this study, we investigate whether climate change can also play a role in enhancing wildfires by focusing on a set of three recent wildfires in Europe (i.e., events occurred in Central Sweden in July 2018, France in July 2022, and in Sicily and Greece in July 2023). We employ the concept of analogues to assess the influence of climate change on the atmospheric conditions underlying wildfire development monitored through the fire weather index, by comparing past and present atmospheric patterns similar to those that occurred during the wildfire. Our analysis focuses on both reanalysis data and high-resolution regional climate models to attribute the observed changes and provide future projections. Our findings show that climate change has altered critical factors supporting wildfire development, such as temperature, humidity, and wind patterns. The results from our sample of three events point out that climate change has increased wildfire hazards in Europe, which is projected to further increase for similar fire weather conditions in the future.

How to cite: Lu, C., Nogherotto, R., Alberti, T., Messori, G., Coppola, E., and Faranda, D.: Assessing the impact of climate change on wildfire development: insights from analogues and regional climate models, EGU General Assembly 2025, Vienna, Austria, 27 Apr–2 May 2025, EGU25-10235, https://doi.org/10.5194/egusphere-egu25-10235, 2025.

EGU25-10570 | Posters on site | NP1.3

VORTEX project: The role of the polar vortex on the predictabIlity of extreme events in the Northern Hemisphere 

Carmen Alvarez-Castro, Cristina Peña-Ortiz, David Gallego, and Davide Faranda

Extreme weather and climate events, marked by unexpected and severe conditions at the edges of historical distributions, significantly impact human health, society, and ecosystems. With global warming driving an increase in the frequency and intensity of these extremes, there is an urgent need to enhance weather prediction beyond the typical 7–10-day range. Among the atmospheric and oceanic components studied for improving predictability, the stratosphere stands out due to its slower and more predictable changes, which can have persistent impacts on surface weather patterns.

Research has highlighted the stratosphere's role in driving weather and climate extremes, particularly in the extratropical Northern Hemisphere. Events involving a weak or strong stratospheric polar vortex can precede the occurrence of surface extremes, making the polar vortex a key link between stratospheric variability and surface climate predictability. While various studies have previously identified this teleconnection, the processes connecting anomalous vortex states to extreme surface events are not yet fully understood.

In VORTEX project we employ a methodology based on advancements in dynamical systems theory to explore the relationship between anomalous polar vortex states and extreme precipitation and temperature events. This approach characterizes each vortex-extreme event's recurrence, persistence, and predictability, providing dynamic insights that traditional methods cannot. By identifying the intrinsic predictability of stratospheric patterns tied to extremes, this methodology offers a pathway to improve sub-seasonal to seasonal climate models, focusing future efforts on better representing critical patterns that influence extreme weather.

How to cite: Alvarez-Castro, C., Peña-Ortiz, C., Gallego, D., and Faranda, D.: VORTEX project: The role of the polar vortex on the predictabIlity of extreme events in the Northern Hemisphere, EGU General Assembly 2025, Vienna, Austria, 27 Apr–2 May 2025, EGU25-10570, https://doi.org/10.5194/egusphere-egu25-10570, 2025.

EGU25-10822 | ECS | Orals | NP1.3

Exploring a new methodology to quantify natural variability in conditional extreme event attribution 

Clara Naldesi, Mathieu Vrac, Nathalie Bertrand, and Davide Faranda

Anthropogenic climate change (ACC) is one of the most demanding challenges facing our society. The intensification and increased frequency of many extreme events due to ACC are among its most impactful consequences, threatening human health, infrastructure, and ecosystems. In this context, raising the awareness of the general public of the relationship between ACC, extremes, and associated impacts becomes a crucial task.

This work is grounded in attribution science and focuses on quantifying and understanding the influence of internal climate variability on extreme events. Among the many tools available for attribution, we use ClimaMeter [Faranda et al. 2023], a rapid framework designed to provide context for extreme events in relation to ACC. ClimaMeter’s approach emphasizes the dynamics associated with extreme events and identifies weather conditions similar to those characterizing the event of interest, leveraging the analogues methodology for conditional attribution [Yiou, 2014]. The analysis provided by such a framework enables the evaluation of significant changes over time of the event’s dynamics and associated meteorological hazards and links them to ACC.

An essential part of ClimaMeter’s methodology is quantifying the influence of natural variability relative to ACC in explaining the changes associated with the event. Specifically, three modes of Sea Surface Temperature variability are taken into account: the El Niño-Southern Oscillation, the Atlantic Multidecadal Oscillation and the Pacific Decadal Oscillation. These three modes are considered with equal weight and changes not explained by them are assumed to be due to ACC [Faranda et al., 2023]. While the methodology is rapid and easy to communicate, it also has some limitations. In this work, we investigate the implications of this approach. First, we test it on a pre-industrial simulation of the IPSL climate model to evaluate its performance under stationary climate conditions. Additionally, we explore a generalization of the current methodology, aiming to refine the quantification of natural variability by weighing the three modes based on the event region and associated hazard. This generalized approach has the potential to expand ClimaMeter’s methodology and provide new insights into the complex mechanisms linking natural variability and extremes.

How to cite: Naldesi, C., Vrac, M., Bertrand, N., and Faranda, D.: Exploring a new methodology to quantify natural variability in conditional extreme event attribution, EGU General Assembly 2025, Vienna, Austria, 27 Apr–2 May 2025, EGU25-10822, https://doi.org/10.5194/egusphere-egu25-10822, 2025.

EGU25-10966 | ECS | Posters on site | NP1.3

Winter cyclones drive stronger surface wind extremes in the North Atlantic than in the Southern Ocean 

Aleksa Stanković and Rodrigo Caballero

Hemispheric symmetries, including those in zonal-mean eddy kinetic energy and in hemispheric-mean planetary albedo, are a characteristic feature of Earth’s climate. Whether such a symmetry also holds for extreme surface windspeeds driven by midlatitude cyclones is currently unclear. We address this question by focusing on the regions with the peak of storm tracks over the North Atlantic, North Pacific and Southern Ocean. We analyse reanalysis and satellite datasets and employ objectively calculated storm tracks to associate cyclones with surface winds they produce. Additionally, we check for existence of trends in extreme windspeeds of each basin. Results show a statistically distinguishable hemispheric asymmetry in extreme surface windspeeds, with the North Hemisphere having stronger extremes, driven primarily by extreme windspeeds occurring during winter and in proximity to cyclones. This implies that cyclones in the North Hemisphere drive stronger surface windspeed extremes than in the South Hemisphere. The North Hemisphere also has higher extreme windspeeds above the boundary layer (700 hPa), pointing to the role of large-scale processes in driving these differences. Lastly, trends in the extreme surface windspeeds across all basins are positive in the reanalysis dataset, and statistically significant in the North Pacific and Southern Ocean.

How to cite: Stanković, A. and Caballero, R.: Winter cyclones drive stronger surface wind extremes in the North Atlantic than in the Southern Ocean, EGU General Assembly 2025, Vienna, Austria, 27 Apr–2 May 2025, EGU25-10966, https://doi.org/10.5194/egusphere-egu25-10966, 2025.

EGU25-12284 | ECS | Orals | NP1.3

Comparative predictability of eastern and western north pacific blocking events 

Anupama K Xavier, Oisín Hamilton, Davide Faranda, and Stéphane Vannitsem

North Pacific blocking patterns, defined by persistent high-pressure systems that disrupt atmospheric circulation, are pivotal elements of mid-latitude weather dynamics. These blocking events play a significant role in shaping regional weather extremes, such as prolonged cold spells or heatwaves, and can redirect storm tracks across the Pacific. For instance, the 2021 Pacific Northwest heatwave demonstrated the profound impact of blocking on terrestrial temperatures, where an upstream cyclone acted as a diabatic source of wave activity, intensifying the blocking system. This led to heat-trapping stable stratification, which elevated surface temperatures to unprecedented levels (Neal et al., 2022). Similarly, marine heatwaves in the Northeast Pacific have been linked to high-latitude blocking events, which weaken westerly winds, suppress southward Ekman transport, and enhance ocean stratification, thereby increasing sea surface temperatures (Niu et al., 2023). The predictability of North Pacific blocking events is governed by the intricate interplay of large-scale atmospheric dynamics, ocean-atmosphere interactions, and internal variability (Smith et al., 2020).

This study investigates the differences in predictability between eastern and western North Pacific blocking events, using a modified version of the Davini et al. (2012) blocking index to distinguish their geographical locations. Identified blocking events were tracked using a block-tracking algorithm until they dissipated. Predictability was assessed by identifying an analogue pair for each blocking event. Specifically, after classifying blocks as eastern or western, geopotential height maps for each event were compared to all other days in the dataset. The analogue pair for an event was defined as the day with the smallest root mean square (RMS) distance. Predictability was then evaluated by averaging the error evolution of the tracks between events in each analogue pair.

Using CMIP6 model simulations and ERA5 reanalysis data, the study revealed that eastern blocks are significantly more persistent and stable than their western counterparts. Eastern blocks exhibited longer durations and greater resistance to atmospheric variability, resulting in improved forecast accuracy. In contrast, western blocks were found to be more transient and challenging to predict due to their susceptibility to dynamic instabilities.

References

Davini, P., Cagnazzo, C., Gualdi, S. and Navarra, A., 2012. Bidimensional diagnostics, variability, and trends of Northern Hemisphere blocking. Journal of Climate, 25(19), pp.6496-6509.

Neal, E., Huang, C.S. and Nakamura, N., 2022. The 2021 Pacific Northwest heat wave and associated blocking: Meteorology and the role of an upstream cyclone as a diabatic source of wave activity. Geophysical Research Letters, 49(8), p.e2021GL097699.

Niu, X., Chen, Y. and Le, C., 2023. Northeast Pacific marine heatwaves associated with high-latitude atmospheric blocking. Environmental Research Letters, 19(1), p.014025.

How to cite: K Xavier, A., Hamilton, O., Faranda, D., and Vannitsem, S.: Comparative predictability of eastern and western north pacific blocking events, EGU General Assembly 2025, Vienna, Austria, 27 Apr–2 May 2025, EGU25-12284, https://doi.org/10.5194/egusphere-egu25-12284, 2025.

EGU25-13213 | ECS | Orals | NP1.3

Sensitivity of Dynamical Coupling to Large-Scale Circulation in European Winter Extremes 

Ane Carina Reiter, Martin Drews, Gabriele Messori, Davide Faranda, and Morten Andreas Dahl Larsen

The physical mechanisms underlying climate-induced extreme events are inherently complex, arising from the compounding nature of multiple drivers and/or hazards. Leveraging the chaotic nature of the atmosphere, a novel approach, based on results from dynamical system theory, has recently been adopted to reveal the drivers of both individual and compound extremes. Central to this approach is the co-recurrence ratio, which quantifies the instantaneous dynamical coupling between multiple variables in terms of joint recurrences of atmospheric configurations to similar ones in the past.

While the co-recurrence ratio has demonstrated potential in revealing the atmospheric drivers of certain extremes, its performance may depend heavily on factors such as the choice of geographical domain(s), selection of variables, and the thresholds used to define extremes. These sensitivities remain underexplored, limiting the broader applicability of this approach.

In this study, we aim to address these gaps by assessing the sensitivity of the co-recurrence ratio in a European setting, focusing on daily winter extremes in temperature, wind, and precipitation. For this analysis, we adopt a bivariate focus, diagnosing the coupling between large-scale circulation patterns and single hazard variables.

By exploring these sensitivities, this work seeks to enhance the understanding of the robustness of the co-recurrence ratio and its effectiveness in diagnosing the atmospheric drivers of various types of extremes.

How to cite: Reiter, A. C., Drews, M., Messori, G., Faranda, D., and Dahl Larsen, M. A.: Sensitivity of Dynamical Coupling to Large-Scale Circulation in European Winter Extremes, EGU General Assembly 2025, Vienna, Austria, 27 Apr–2 May 2025, EGU25-13213, https://doi.org/10.5194/egusphere-egu25-13213, 2025.

EGU25-13374 | ECS | Posters on site | NP1.3

Causality and predictability of the Pan Atlantic compound extremes 

Meriem Krouma and Gabriele Messori

The co-occurrence of wintertime cold spells in North America and wet, windy extremes in Europe, known as the Pan-Atlantic compound extremes, is linked to distinct dynamical pathways. One of those dynamical pathways involves the presence of a persistent high-pressure system west of Greenland. This high-pressure anomaly tends to simultaneously induce a southward displacement of a trough over the eastern United States and sustain an upper-level trough over southwestern Europe, creating conditions that induce both cold spells in North America and extreme precipitation in Europe. The co-occurrence of the Pan-Atlantic compound extremes has been investigated in previous studies. However, the causal association between extremes on both sides of the Atlantic has yet to be verified. In this study, we aim to assess the relationship between these compound extremes and to uncover the causal mechanisms driving their co-occurrence. Preliminary findings indicate that high-pressure anomalies over Greenland are a main driver of both phenomena, providing a coherent dynamical link that bridges these geographically distinct extreme events. The study further seeks to clarify the underlying dynamics and improve predictability for such interconnected extreme weather events, which can help to better manage and mitigate their impacts.

How to cite: Krouma, M. and Messori, G.: Causality and predictability of the Pan Atlantic compound extremes, EGU General Assembly 2025, Vienna, Austria, 27 Apr–2 May 2025, EGU25-13374, https://doi.org/10.5194/egusphere-egu25-13374, 2025.

EGU25-13784 | ECS | Orals | NP1.3

RHITA: a framework for real-time detection and characterization of weather extremes 

Greta Cazzaniga, Adrien Burq, Mathieu Vrac, and Davide Faranda

Extreme weather events such as heatwaves, droughts, thunderstorms, and cyclones threaten human lives, ecosystems, and economic stability. Tracking and characterizing the spatiotemporal dynamics of such events is essential for understanding their cascading impacts on socioeconomic and environmental systems. When the detection and characterization of extremes are done in real-time, they can provide critical information that benefits many sectors, including agriculture, emergency management, and regulatory authorities.

To offer a tool for operational monitoring of weather-related hazards across Europe, we developed RHITA (Real-time Hazards Identification and Tracking Algorithm), an online framework designed for the rapid, automated, and objective spatiotemporal detection of hazards driven by extreme weather events. RHITA is intended for a wide range of users, including scientists, policymakers, authorities, and the general public. It leverages the ERA5 dataset for real-time detection, and the algorithm is calibrated using the EM-DAT dataset, which documents global disaster occurrences and impacts.

RHITA currently offers two main features: (1) real-time tracking and spatiotemporal characterization of extreme weather events such as heatwaves, droughts, cold spells, cyclones, and storms, focusing on associated hazards like extreme temperatures, water deficits, heavy precipitation, and strong winds; and (2) publicly available, up-to-date, transboundary historical spatiotemporal hazard catalogs for Europe.

How to cite: Cazzaniga, G., Burq, A., Vrac, M., and Faranda, D.: RHITA: a framework for real-time detection and characterization of weather extremes, EGU General Assembly 2025, Vienna, Austria, 27 Apr–2 May 2025, EGU25-13784, https://doi.org/10.5194/egusphere-egu25-13784, 2025.

EGU25-13891 | Posters on site | NP1.3

Ensemble Random Forest for Tropical Cyclone Tracking 

Pradeebane Vaittinada Ayar, Stella Bourdin, Davide Faranda, and Mathieu Vrac


Even though tropical cyclones (TCs) are well documented from the moment they reach a certain intensity to the moment they start to evanesce, many physical and statistical properties governing them are not well captured by gridded reanalysis or simulated by earth system models. Thus, the tracking of TCs remain a matter of interest for the investigation of observed and simulated tropical. Many cyclone tracking schemes are available. On the one hand, there are trackers that rely on physical and dynamical properties of the TCs and users prescribed thresholds, which make them rigid, and need numerous variables that are not always available in the models. On the other hand, there are trackers leaning on deep learning which, by nature, need large amounts of data and computing power. Besides, given the number of physical variables needed for the tracking, they can be prone to overfitting, which hinders their transferability to climate models. In this study, the ability of a Random Forest (RF) approach to track TCs with a limited number of aggregated variables is explored. Hence, it becomes a binary supervised classification problem of TC-free (zero) and TC (one) situations. Our analysis focuses on the Eastern North Pacific and North Atlantic basins, for which respectively 514 and 431 observed tropical cyclones tracks record are available from the IBTrACS database over the 1980-2021 period. For each 6-hourly time step, RF associates TC occurrence or absence (1 or 0) to atmospheric situations described by predictors extracted from the ERA5 reanalysis. Then situations with TC occurrences are joined for reconstructing TC trajectories. Results show good ability of the method for tracking of tropical cyclones over both basins and good ability for spatial and temporal generalization as well. It also shows similar TC detection rate as trackers based on TCs' properties and significantly lower false alarm rate. RF allows us to detect TC situations for a range of predictor combinations, which brings more flexibility than threshold based trackers. Last but not least, this study shed light on the most relevant variables allowing to detect tropical cyclone.

How to cite: Vaittinada Ayar, P., Bourdin, S., Faranda, D., and Vrac, M.: Ensemble Random Forest for Tropical Cyclone Tracking, EGU General Assembly 2025, Vienna, Austria, 27 Apr–2 May 2025, EGU25-13891, https://doi.org/10.5194/egusphere-egu25-13891, 2025.

EGU25-14873 | ECS | Orals | NP1.3

Large-scale atmospheric circulation as a source of uncertainty in western European heat extreme projections  

Shutong Liu, Yinglin Tian, and Kai Kornhuber

Europe has been identified as a heatwave hotspot, where heatwave intensities have outpaced other mid-latitude regions in the Northern Hemisphere (Rousi et al. Nat. Comms. 2022). Accelerated European heatwave trends have been found to be associated with the increased persistence of Eurasian double jets, a specific set-up of the large-scale circulation in which the Northern hemisphere polar and subtropical jets occur as two clearly separated branches. However, if observed trends are projected to continue with anthropogenic warming and to what degree the present generation of climate models constitute useful tools to assess changes in the atmospheric circulation has not yet been ascertained.

In this study, we benchmark 11 CMIP6 climate models to evaluate their ability to reproduce the main characteristics of double jets and their relationship to heat extremes, aiming to identify the best-performing models for future projections. Our findings show that, on average, the models tend to underestimate the frequency of double jets by 80%. Moreover, half of the climate models underestimate the intensity of double-jet-associated heatwaves over Western Europe, with the remaining models even showing a negative anomaly in heatwave intensity during double jet events in the region. Furthermore, climate models fail to capture the growth rate of double jet persistence, with the model mean trend at -0.4 days per decade, while the observed rate is approximately 1.5 days per decade. The bias in the persistence trend of double jet in models is strongly correlated with the underestimation of the western European heat extreme trend, with an R2 value of 0.42.

Despite this, some models show reasonable agreement with the observations, and these models are further analyzed to project circulation-driven changes in extreme heat. Using EC-Earth3-Veg-LR, we observe an increase in double jet frequency from 2020 to 2060, at a rate of 0.2 days per decade. Our work highlights the need for better representation of double jet characteristics and their relationship with heat extremes in climate models to enhance preparedness for future heat risks.

How to cite: Liu, S., Tian, Y., and Kornhuber, K.: Large-scale atmospheric circulation as a source of uncertainty in western European heat extreme projections , EGU General Assembly 2025, Vienna, Austria, 27 Apr–2 May 2025, EGU25-14873, https://doi.org/10.5194/egusphere-egu25-14873, 2025.

EGU25-15668 | ECS | Posters on site | NP1.3

High-risk atmospheric circulation patterns for Italian precipitation extremes 

Cristina Iacomino, Salvatore Pascale, Giuseppe Zappa, Marcello Iotti, Federico Grazzini, Alice Portal, and Paolo Ghinassi

Extreme precipitation events (EPEs) are meteorological phenomena that are likely to intensify as a result of climate change. They are a major concern for our society, especially in densely populated areas, as they can have significant economic and environmental impacts. Therefore, identifying large-scale atmospheric circulation that lead to EPEs is crucial for detecting geographical areas at risk and mitigating their adverse impacts.

To achieve this objective, we study the circulation patterns associated with EPEs in Italy. Initially, we focus on North-Central Italy and we identify the precipitation extremes in three datasets: ARCIS 3.0, MSWEP, and CERRA LAND. Circulation types associated with the EPEs are obtained by applying Self Organizing Maps (SOMs), an unsupervised artificial neural network widely used in synoptic climatology, to anomalies of geopotential height at 500 hPa and mean sea level pressure. Since ArCIS, the reference dataset, is limited to North-Central Italy, we extend the analysis to the whole of Italy using CERRA-Land. Such choice is based on the fact that it produced the most similar results to ArCIS in North-Central Italy compared to MSWEP.

We then generate composites of various variables (all retrieved from ERA5) for each SOM pattern to better understand the circulation patterns and characterize the atmospheric dynamics associated with extreme events. Additionally, we analyze the probability of exceeding the 99th percentile of wet-days to identify the areas impacted by each pattern. Composites for the different circulation types show variations in the synoptic pattern's position within the Mediterranean basin, as well as differences in the direction and intensity of moisture flux. These patterns influence distinct regions and display varying frequencies across seasons.

In future works the classification obtained by this study will be applied to climate model simulations, aiming to investigate the role of anthropogenic climate change in the dynamics leading to EPEs in Italy. 

How to cite: Iacomino, C., Pascale, S., Zappa, G., Iotti, M., Grazzini, F., Portal, A., and Ghinassi, P.: High-risk atmospheric circulation patterns for Italian precipitation extremes, EGU General Assembly 2025, Vienna, Austria, 27 Apr–2 May 2025, EGU25-15668, https://doi.org/10.5194/egusphere-egu25-15668, 2025.

EGU25-17645 | Orals | NP1.3

Graph neural networks based climate emulator for kilometer scale hourly precipitation : a novel hybrid imperfect approach 

Erika Coppola, Valentina Blasone, Serafina Di Gioia, Guido Sanguinetti, Viplove Arora, and Luca Bortolussi

Regional climate emulators provide computationally efficient tools for generating high-resolution climate projections, bridging the gap between coarse-scale models and the detailed resolution required for local-scale hazard assessments. Climate hazards from extreme precipitation events are projected to increase in frequency and intensity under global warming, emphasizing the need for accurate modeling of convective processes. However, traditional numerical methods are constrained by low resolution or the high computational costs of kilometer-scale simulations.

To overcome these limitations, we introduce GNN4CD, a novel deep learning emulator that estimates kilometer-scale (3 km) hourly precipitation from coarse atmospheric data (~25 km). The model leverages graph neural networks and a hybrid imperfect approach (HIA) for downscaling, initially trained on ERA5 reanalysis and observational data, and applied using regional climate model (RegCM) data for present-day and future projections.

GNN4CD demonstrates exceptional performance in reproducing precipitation distributions, seasonal diurnal cycles, and extreme percentiles across Italy, even when trained on northern Italy alone. The model captures shifts in precipitation distributions, particularly for extremes, across historical, mid-century, and end-of-century scenarios. Additionally, evaluations using an ensemble of convection-permitting regional models confirm GNN4CD's ability to replicate ensemble spreads for both present-day and future projections essential for estimating the uncertainty in the future climate change signal..

How to cite: Coppola, E., Blasone, V., Di Gioia, S., Sanguinetti, G., Arora, V., and Bortolussi, L.: Graph neural networks based climate emulator for kilometer scale hourly precipitation : a novel hybrid imperfect approach, EGU General Assembly 2025, Vienna, Austria, 27 Apr–2 May 2025, EGU25-17645, https://doi.org/10.5194/egusphere-egu25-17645, 2025.

EGU25-17852 | ECS | Posters on site | NP1.3

The impact of the upward trend in the NAO index on precipitation dynamics in the Mediterranean region 

Emma Schultz, Barend Spanjers, and Dim Coumou

The North Atlantic Oscillation (NAO) is the dominant pattern of atmospheric variability over the North Atlantic region, having its greatest influence on Europe during the winter months. In winter, positive NAO index values are linked to warmer temperatures and increased precipitation in western and northern Europe, whereas southern Europe tends to experience colder and drier conditions. These drier conditions can pose significant challenges for agriculture and livelihoods. An overall positive trend in the NAO index has been observed in winter in recent decades. However, how precipitation dynamics in the Mediterranean region respond to the shift towards a higher NAO index are largely unknown, partly due to the poor capture of NAO’s upward shift in climate models. 

Here we examine the impact of the shift towards a higher NAO index on precipitation dynamics in the Mediterranean region in winter. We employ a novel statistical model to analyse next-day precipitation conditional on past observations. The analysis focuses on conditioning drought persistence on different NAO states to assess their influence on the distributional characteristics of drought durations across the Mediterranean region. We present preliminary analyses that contribute to the growing body of evidence that long-term positive trends in the NAO index have an impact on rainfall patterns and drought occurrence in Europe. Understanding the role of teleconnections in regional climate variability and long-term trends is essential for robust regional climate projections for improved risk assessment and policy planning.

How to cite: Schultz, E., Spanjers, B., and Coumou, D.: The impact of the upward trend in the NAO index on precipitation dynamics in the Mediterranean region, EGU General Assembly 2025, Vienna, Austria, 27 Apr–2 May 2025, EGU25-17852, https://doi.org/10.5194/egusphere-egu25-17852, 2025.

EGU25-17937 | ECS | Orals | NP1.3

Impact Attribution for Climate Law: The Case of Storm Irene 

Mireia Ginesta, Shirin Ermis, Rupert Stuart-Smith, and Benjamin Franta

People are increasingly turning to courts to combat climate crisis. In the early 2000s, fewer than 10 climate change litigation cases had been filed globally. By 2024, this number has grown to over 2,500, with more than half originating in the United States. Some of these cases rely on extreme weather attribution science to link damages to anthropogenic climate change. Developing rigorous, legally useful assessments of damage attributable to climate change is an increasingly pressing need.

We present a framework for forecast-based impact attribution which can link physically consistent hazards to impacts, providing evidence for legal cases and climate cost recovery laws. As a case study, we analyze the severe impacts of Storm Irene in August 2011 when it was undergoing extratropical transition in the north-eastern USA. In the state of Vermont, Irene caused rainfall of up to 180 mm within a few hours, leading to fluvial and pluvial flooding with catastrophic consequences that caused $850 million in economic damages. By integrating an operational weather forecast model (ECMWF’s IFS) and hydrological models with economic impact assessments, we assess the extent to which these damages can be attributed to anthropogenic climate change.

This research underscores the potential of interdisciplinary attribution methodologies to enhance the scientific basis for judicial adjudication on climate change and climate law-making.

How to cite: Ginesta, M., Ermis, S., Stuart-Smith, R., and Franta, B.: Impact Attribution for Climate Law: The Case of Storm Irene, EGU General Assembly 2025, Vienna, Austria, 27 Apr–2 May 2025, EGU25-17937, https://doi.org/10.5194/egusphere-egu25-17937, 2025.

EGU25-17947 | Orals | NP1.3

Towards an impact-based approach to the detection of analogues: the case study of Emilia-Romagna floods in May 2023 

Valerio Lembo, Mireia Ginesta, Tommaso Alberti, Roberta D'Agostino, and Davide Faranda

The framework of weather analogues is a powerful methodology for the detection of the climate change fingerprint on weather extremes, that has been widely used in several contexts. The procedure has several advantages compared to standard model-based attribution exercises, being fast and not computationally expensive. Here we address whether the detection of analogs based on impacts (e.g., environmental, socio-economic) of a severe weather event can provide added value on the attribution of the event intensity or likelihood to climate change.

As a case study, we analyse the twin Emilia-Romagna flood event of May 2023. It caused a sizable amount of casualties, widespread destruction and substantial economic damage. We detect analogues of the river runoff as an impact-based observable of interest, addressing it in an univariate context, but also jointly with other observables (i.e., in a multivariate framework), such as mean sea-level pressure, total precipitation, and 850 hPa vorticity. We therefore detect the optimal set of variables for performing multivariate analysis and the appropriate analysis domain. We suggest that by combining river runoff with other observables by carefully selecting the spatial domain, we obtain a clearer view of the role played by anthropogenic climate change for this event, also including the additional vulnerability linked to the environmental impact of human activities, such as land-use change and freshwater diversion.

How to cite: Lembo, V., Ginesta, M., Alberti, T., D'Agostino, R., and Faranda, D.: Towards an impact-based approach to the detection of analogues: the case study of Emilia-Romagna floods in May 2023, EGU General Assembly 2025, Vienna, Austria, 27 Apr–2 May 2025, EGU25-17947, https://doi.org/10.5194/egusphere-egu25-17947, 2025.

EGU25-18710 | Orals | NP1.3

The predictable chaos of rare events in geophysical and complex systems 

Tommaso Alberti, Davide Faranda, and Valerio Lucarini

Many natural systems show emergent phenomena at different scales, leading to scaling regimes with signatures of chaos at large scales and an apparently random behavior at small scales. These features are usually investigated quantitatively by studying the properties of the underlying attractor. This multi-scale nature of natural systems makes it practically impossible to get a clear picture of the attracting set as it spans over a wide range of spatial scales and may even change in time due to non-stationary forcing.

Here we present a review of some recent advancements in characterizing the number of degrees of freedom and the predictability horizon of geophysical and complex systems showing non-hyperbolic chaos, randomness, state-dependent persistence and predictability. We compare classical approaches, based on Lyapunov exponents and correlation dimension, with novel approaches based on combining adaptive decomposition methods with concepts from extreme value theory. We demonstrate that the properties of the invariant set depend on the scale we are focusing on and that the proposed formalism can be generally helpful to investigate the role of multi-scale fluctuations within complex systems, allowing us to deal with the problem of characterizing the role of stochastic fluctuations across a wide range of physical systems as well as the role of different dynamical components in determining the predictability of rare events in complex systems.

How to cite: Alberti, T., Faranda, D., and Lucarini, V.: The predictable chaos of rare events in geophysical and complex systems, EGU General Assembly 2025, Vienna, Austria, 27 Apr–2 May 2025, EGU25-18710, https://doi.org/10.5194/egusphere-egu25-18710, 2025.

EGU25-18740 | ECS | Orals | NP1.3

Analyzing the Historical and Projected Evolution of the Global Diurnal Temperature Range (DTR) 

Muskula Sai Bargav Reddy, Vinnarasi Rajendran, and Mukul Tewari

The Diurnal Temperature Range (DTR) serves as a crucial meteorological indicator, reflecting the difference between daily maximum and minimum temperatures and the magnitude of diurnal extremes. The anomalous values of DTR are often linked to the occurrence of various climatic extremes such as droughts, heatwaves, and wet spells, which make it necessary to understand the evolution of DTR both historically and for the future. This study focuses on analyzing the evolution of DTR globally by employing the non-stationary Multidimensional Ensemble Empirical Mode Decomposition (MEEMD) method. To accomplish this, historical temperature data spanning 69 years (1951-2019) and CMIP6 Bias corrected data covering 150 years (1951-2100) were utilized. The non-linear trend characteristics in temperature are computed using CRU 0.50 x 0.50 gridded temperature data for historical trends and five different bias-corrected climate projection datasets of NASA Earth Exchange Global Daily Downscaled Projections (NEX-GDDP-CMIP6) for the assessment of trends in future DTR by considering two SSP scenarios, i.e., SSP 245 and SSP 585, each corresponding to intermediate and high emissions scenarios. The CMIP6 models that are considered are CanESM5, GFDL CM4, MIROC6, NorESM2-MM, and MPI-ESM1-2-HR. The results from the analysis reveal the decrease in global DTR, with a faster rate of increase in minimum temperature than in maximum temperature. However, the southern regions of Australia and Africa showed an increase in DTR. The CMIP6 simulations showed that CanESM5 and MPI-ESM1-2-HR showed a decreasing trend in global DTR for both scenarios of ssp, with an increase in DTR for South America and the southern part of Africa for CanESM5, while GFDL CM4, MIROC6, and NorESM2-MM showed a decrease in global DTR. The findings underscore the importance of understanding regional climatic variations when assessing global temperature trends. The observed contrasting regional patterns in DTR highlight the influence of localized hydroclimatic factors, including land-use changes, aerosols, and atmospheric feedback mechanisms. These insights are crucial for refining climate models and improving future climate projections under different emission pathways. Overall, the study emphasizes the necessity of incorporating non-linear approaches like MEEMD to capture complex climatic trends and underscores the role of DTR as a key indicator of climate change and its impacts at both global and regional scales.

How to cite: Reddy, M. S. B., Rajendran, V., and Tewari, M.: Analyzing the Historical and Projected Evolution of the Global Diurnal Temperature Range (DTR), EGU General Assembly 2025, Vienna, Austria, 27 Apr–2 May 2025, EGU25-18740, https://doi.org/10.5194/egusphere-egu25-18740, 2025.

EGU25-19577 * | Orals | NP1.3 | Highlight

Unraveling the Rising Threat of Atmospheric and Marine Heatwaves in the Mediterranean Region 

Samira Khodayar Pardo, Paco Pastor, and Laura Paredes-Fortuny

Heatwaves (HWs) are extreme climate events increasingly magnified under climate change, posing significant risks to both human and environmental systems. The Mediterranean region, recognized as a climate change hotspot, is experiencing a worrying amplification of both atmospheric and marine heatwaves. In this presentation we will discuss the evolution and interplay of these phenomena emphasizing their compounding effects when occurring simultaneously.

Our findings reveal a clear increase in HW frequency, intensity, and duration, with the concurrence of atmospheric and marine heatwaves resulting in a significant local amplification of marine heatwave intensity. While atmospheric heatwaves remain largely unaffected by this interaction. This interaction has become more prominent in recent years, highlighting the increasing complexity of extreme climate phenomena in this region.

The results underscore the urgent need for regionally tailored strategies to mitigate the cascading impacts of compounding heatwaves, as their intensification under climate change exacerbates threats to Mediterranean ecosystems and communities.


How to cite: Khodayar Pardo, S., Pastor, P., and Paredes-Fortuny, L.: Unraveling the Rising Threat of Atmospheric and Marine Heatwaves in the Mediterranean Region, EGU General Assembly 2025, Vienna, Austria, 27 Apr–2 May 2025, EGU25-19577, https://doi.org/10.5194/egusphere-egu25-19577, 2025.

EGU25-19698 | Orals | NP1.3

 January 2025 Wildfires in Southern California are attributable to Anthropogenic Global Warming 

Rita Nogherotto, Chen Lu, Greta Cazzaniga, Coppola Erika, and Davide Faranda

Starting January 7, 2025, devastating wildfires have swept through the Los Angeles metropolitan area and nearby regions. By January 10, the fires had caused ten deaths, destroyed thousands of structures, displaced nearly 180,000 residents, and scorched approximately 30,000 acres. This study employs the extended ClimaMeter (climameter.org <http://climameter.org/>) protocol to explore the potential role of climate change in exacerbating the severity of this event. Specifically, we examine whether climate change has modified the atmospheric conditions, represented by the mean sea level pressure, that contribute to wildfire occurrence, represented by the fire weather index, by analyzing historical and current weather patterns similar to those observed during the fires. Our methodology integrates both reanalysis datasets and high-resolution regional climate models to assess observed changes and project future fire risk scenarios. The results indicate a significant increase in the fire weather index across much of California and surrounding regions, which suggests that this event can be ascribed to human-driven climate change. The models show a similar signal in the present climate and project increases in fire weather hazard in the future.

How to cite: Nogherotto, R., Lu, C., Cazzaniga, G., Erika, C., and Faranda, D.:  January 2025 Wildfires in Southern California are attributable to Anthropogenic Global Warming, EGU General Assembly 2025, Vienna, Austria, 27 Apr–2 May 2025, EGU25-19698, https://doi.org/10.5194/egusphere-egu25-19698, 2025.

EGU25-20545 | ECS | Orals | NP1.3

Characterizing ENSO Through Topological Analysis of Jin-Timmermann Model's Chaotic Regimes 

Maria Sanchez Muniz, Margaret Brown, and Pushpi Paranamana

The El Niño-Southern Oscillation (ENSO) represents one of the most significant drivers of global climate variability. This study investigates the chaotic parameter regimes of the Jin-Timmermann model, particularly focusing on the dynamics identified by Guckenheimer et al. where chaotic attractors emerge. We analyze the reduced three-dimensional system with specific attention to the critical parameters δ = 0.225423, ρ = 0.3224, which govern the time-scale interactions between oceanic and atmospheric processes. Using topological data analysis (TDA), we characterize the structural transitions between periodic and chaotic behaviors in the model's parameter space. Our methodology combines persistent homology with dynamical systems theory to identify distinct topological signatures associated with strong El Niño events. We validate these theoretical findings against observational data from the ERA5 reanalysis and NOAA/ERSSTv5 Niño 3.4 index, focusing particularly on the relationship between topological features and prolonged dry conditions in Southeast Asia. This approach provides new insights into the non-systematic relationship between strong El Niño events and regional climate impacts, while establishing a novel framework for comparing theoretical models with observational data. Our results demonstrate the utility of topological methods in understanding complex climate phenomena and suggest new possibilities for improving ENSO prediction capabilities.

How to cite: Sanchez Muniz, M., Brown, M., and Paranamana, P.: Characterizing ENSO Through Topological Analysis of Jin-Timmermann Model's Chaotic Regimes, EGU General Assembly 2025, Vienna, Austria, 27 Apr–2 May 2025, EGU25-20545, https://doi.org/10.5194/egusphere-egu25-20545, 2025.

Extreme rainfall events during the Indian monsoon season pose significant challenges due to their socioeconomic and environmental impacts. Understanding the spatial and temporal dynamics of these events requires robust analytical and statistical methods capable of capturing complex relationships within rainfall generating systems. Complex network approaches have emerged as powerful tools for analyzing spatiotemporal patterns in climate data, offering new insights into extreme weather phenomena.

This study compares two methodologies for constructing and analyzing climate networks to study the spatiotemporal structure and dynamics of heavy precipitation events in India during the monsoon season across multiple time scales. Specifically, we introduce a novel combination of Discrete Wavelet Decomposition with Event Coincidence Analysis (ECA), referred to as Multi-Scale Event Coincidence Analysis (MSECA) and compare the results with the existing Multi-Scale Event Synchronisation (MSES). From a conceptual perspective, MSECA appears to be a more reasonable method compared to MSES, as it mitigates certain undesired effects of temporal clustering of rainfall extremes across various timescales.

Our results reveal distinct differences in network properties depending on the methodology used, highlighting the sensitivity of network-based analyses to the choice of construction technique. These differences affect the identification of dominant heavy rainfall patterns and their underlying drivers, such as large-scale atmospheric circulation and/or local feedback mechanisms at daily to monthly temporal scales.

Our work underscores the importance of methodological rigor and the potential of complex network approaches in advancing the understanding of extreme rainfall events in monsoon-dominated regions. This comparison provides a foundation for developing standardized practices for network-based climate studies, enabling more robust assessments of extreme weather phenomena.

How to cite: Bishnoi, G., Dhanya, C. T., and Donner, R. V.: A Comparison of Methodologies for Studying Heavy Precipitation Events during the Summer Monsoon Season in India Using Complex Network Approaches, EGU General Assembly 2025, Vienna, Austria, 27 Apr–2 May 2025, EGU25-21222, https://doi.org/10.5194/egusphere-egu25-21222, 2025.

CL3.1 – Future Climate – Climate Change: From Regional to Global

In this study, the interdecadal variation of extreme precipitation in May over southwestern Xinjiang (SWX) and related mechanisms were investigated. The extreme precipitation in May over SWX exhibited a decadal shift in the 1990s (negative phase during 1970–86 and positive phase during 2003–2018). The decadal shift corresponded to strengthened moist airflow from the Indian Ocean and an anomalous cyclone over SWX during 2003–2018. It is found that the interdecadal change of the wave trains in Eurasia might account for the differences in atmospheric circulation between the above two periods. Further analyses reveal that spring snow cover over Eurasia is closely linked to extreme precipitation over SWX during 2003–2018. Increased snow cover in western Europe (WE) from February to March is accompanied by more snowmelt. This resulted in less local snow cover and lower albedo which lead to warm temperature over WE in May. The changes in temperatures increase the local 1000–500-hPa thickness over WE. These factors provide favorable conditions for the enhancement of the Eurasian wave trains which significantly influence extreme precipitation over SWX. On the other hand, corresponding to decreased albedo caused by the reduction of northern Eurasia (NE) snow cover in May, anomalous surface warming occurs over NE. The anomalous warming result in positive geopotential height anomalies which intensifies the meridional geopotential height gradient over Eurasia and causes an acceleration of the westerly jet in May. Anomalous upper-level divergence in SWX induced by the enhanced westerly jet provides a favorable dynamical condition for increased extreme precipitation.

How to cite: Chen, P. and Li, W.: Increased extreme precipitation in May over southwestern Xinjiang in relation to Eurasian snow cover in recent years, EGU General Assembly 2025, Vienna, Austria, 27 Apr–2 May 2025, EGU25-58, https://doi.org/10.5194/egusphere-egu25-58, 2025.

Droughts in Western Central Europe (WCE) have recently attracted attention due to their detrimental impact on crops, ecosystems, and society, as evidenced by events in 2018 and 2022. In this region, however, their variability and underlying causes remain unclear. This study aims to associate droughts with the atmospheric circulation to gain insight into their drivers. We employed reanalysis datasets (ERA5, 20CRv3, and ModE-RA) to identify meteorological drought events using the Standardized Precipitation Evapotranspiration Index at a 3-month scale and consistently connect them to atmospheric circulation patterns through k-means clustering. The three datasets are evaluated over the WCE regions, showing that they are highly reliable over periods ranging from 70 to 180 years, providing a long perspective on the recent events. Firstly, we demonstrate that droughts in WCE display a strong multidecadal variability with no significant long-term trend. Although precipitation has increased over time, this has been offset by the rising atmospheric evaporative demand due to warming. Secondly, we identify three distinct atmospheric circulation patterns associated with drought events in WCE: a high-anomaly geopotential height centred over Western Central Europe (WCE+); a dipole of high-anomaly geopotential height over the British Isles and low-anomaly geopotential height over the Maghreb (BIM+); and the negative phase of the North Atlantic Oscillation (NAO-), predominantly in winter. Our analysis shows that droughts have become increasingly associated with WCE+ over the last century, while their association with NAO- has decreased over the past 180 years. This research provides a regional historical analysis of meteorological drought and its drivers, offering better insight into long-term regional climate change.

How to cite: Neimry, E., Goosse, H., and Jonard, M.: Connecting Drought Events with Atmospheric Circulation Patterns in Western Central Europe: A Historical Perspective, EGU General Assembly 2025, Vienna, Austria, 27 Apr–2 May 2025, EGU25-478, https://doi.org/10.5194/egusphere-egu25-478, 2025.

EGU25-592 | ECS | Orals | CL3.1.1

Asymmetric response of Atlantic Nino on heatwaves over Northern India 

Ganaraj Dalal, Vittal Hari, and Shushobhit Chaudhary

Due to global warming, climate extremes like heatwave events will rise further in the 21st century. Earlier, heatwave characteristics like duration, intensity, and frequency have been studied independently, ignoring interdependence among them, leading to biases in the heatwave impact assessment. The heatwave intensity duration frequency(HIDF) model provides a feasible framework incorporating interdependencies among heatwave characteristics, helping quantify heatwave hazards more accurately. HIDF curves are produced for six metropolitan cities, namely, Ahmedabad, Bhopal, and Gwalior over the western part and Patna, Varanasi, and Deoghar over the eastern part of northern India using the Indian Meteorological Department daily maximum temperature from 1961-2023 for March-June months. Heatwave events of durations ranging from one to ten and their respective intensities are modeled using the nonparametric kernel distribution method. HIDF curves reveal that the intensity and frequency of heatwave events for each duration increased(decreased) in the western(eastern) cities. In Ahmedabad city, the likelihood of a six-day heatwave event increased by 59 %, whereas it decreased by 66 % over Patna, reflecting east-west asymmetry. We found that a positive anomaly pattern over the southern Atlantic Ocean, i.e., Atlantic Nino, influences heatwaves occurring over northern India, causing east-west asymmetry. Due to the Atlantic Nino, the cross-equatorial flow reversed its direction as the moisture from the northern Indian Ocean, instead of traveling towards north China, entered the eastern part of India. This resulted in entry of moisture laden winds from the Bay of Bengal and it contributed to more convection activity in northeast India causing temperature drop in the region. The strength of moisture-laden winds is reduced when they reach the western part; the chance of convection decreases, contributing to a rise in temperature. Our results provide significant inputs in understanding heatwave dynamics over northern India, which will be helpful in predicting the heatwaves more accurately in the future.


How to cite: Dalal, G., Hari, V., and Chaudhary, S.: Asymmetric response of Atlantic Nino on heatwaves over Northern India, EGU General Assembly 2025, Vienna, Austria, 27 Apr–2 May 2025, EGU25-592, https://doi.org/10.5194/egusphere-egu25-592, 2025.

EGU25-1557 | ECS | Orals | CL3.1.1

Linking European droughts to year-round weather regimes 

Onaïa Savary, Constantin Ardilouze, and Julien Cattiaux

Droughts are extreme events with major economic, social and environmental impacts, and it is crucial to be able to anticipate them.  To improve their prediction on a seasonal timescale, it is essential to better understand the underlying conditions that precede them. In  Europe, intra-seasonal to seasonal climatic variations are linked to atmospheric circulation and are weakly constrained by tropical teleconnections.

This study employs year-round weather regimes to demonstrate that the North Atlantic atmospheric circulation plays a fundamental role in precipitation deficits across Europe. Precipitation deficits are quantified using the reanalysed 3-month standardised precipitation index (SPI3). We use the SPI3 to define drought events and propose a new regionalisation of Europe, divided into regions with the same drought-related characteristics. We demonstrate that each weather regime is associated with a distinct precipitation pattern across regions, that remains relatively stable throughout the year. The representation of the regime-drought relationship in CMIP6 model simulations is then discussed.

How to cite: Savary, O., Ardilouze, C., and Cattiaux, J.: Linking European droughts to year-round weather regimes, EGU General Assembly 2025, Vienna, Austria, 27 Apr–2 May 2025, EGU25-1557, https://doi.org/10.5194/egusphere-egu25-1557, 2025.

Under global warming, the occurrence of compound extreme weather and climate events has increased, resulting in profound ecological and societal damages. Understanding the forming mechanisms of these events is imperative for formulating effective mitigation and adaptation strategies. This research focuses on causality of the compound extreme heat and precipitation events (CEHPEs) in northeastern China. From 1961 to 2018, a total of 55 heatwave events occurred in this region, with 18 identified as the CEHPEs.

The formation of CEHPEs in northeastern China is closely related to the southeastward propagating quasi-barotropic anomalous anticyclone. As the center of the anomalous anticyclone approaches northeastern China, the associated descent reduces the cloud cover and increases downward shortwave radiation. The thus-heated ground increases the upward longwave radiation and sensible heat, predominantly warming the surface air and causing the heatwave. During the development of the heatwave, the increased lower-level moisture due to the enhanced surface evaporation and the increased column moist static energy due to the warming air temperature destabilize the atmosphere. When the anomalous anticyclone moves out of northeastern China after the heatwave, intense convection rapidly develops, resulting in extreme precipitation and completing the CEHPEs.

Comparison between the CEHPEs and the mere heatwave events is also conducted. The major difference resides in the zonal scale of the anomalous anticyclone. In the CEHPEs, the anomalous anticyclone has a small zonal scale and decays locally due to the advection by the climatological westerly acting on the zonal gradient of anomalous vorticity. In contrast, the zonal scale of the anomalous anticyclone in the mere heatwave events is much larger, which slowers the decaying due to the weaker zonal advection and thus impedes the convection development and extreme precipitation.

How to cite: Yang, Y.: Causality of Compound Extreme Heat-Precipitation Events in Northeastern China, EGU General Assembly 2025, Vienna, Austria, 27 Apr–2 May 2025, EGU25-1872, https://doi.org/10.5194/egusphere-egu25-1872, 2025.

EGU25-2403 | Orals | CL3.1.1

Linking extreme precipitation during June in central eastern China to the East Asian jet stream changes 

Renguang Wu, Peijun Zhu, Ping He, and Wen-Jun Zhang

Extreme precipitation occurs under specific atmospheric circulation patterns. In this talk, we show the connection of extreme precipitation in central eastern China to the East Asian jet stream changes during June, the month with frequent occurrence of extreme precipitation. Two types of distinct East Asian jet stream configurations are detected for the occurrence of extreme precipitation. One is a latitudinal shift of the East Asian jet stream and the other is an intensification of the East Asian jet stream. The former corresponds to extreme precipitation to south of the Yangtze River and the latter corresponds to extreme precipitation along the Yangtze River. The changes in the location and intensity of the East Asian jet stream are associated with meridional wave patterns along East Asia and zonal wave patterns over mid-latitude Eurasia. The role of the western North Pacific subtropical high is robust but relatively larger for extreme precipitation south of the Yangtze River. The South Asian high plays an important role for extreme precipitation south of the Yangtze River, but its role is weak for extreme precipitation along the Yangtze River. Wind-induced temperature anomalies modulate the vertical change of the meridional height gradient over eastern China and thus contributes to the latitudinal shift and intensity change of the East Asian jet stream.

How to cite: Wu, R., Zhu, P., He, P., and Zhang, W.-J.: Linking extreme precipitation during June in central eastern China to the East Asian jet stream changes, EGU General Assembly 2025, Vienna, Austria, 27 Apr–2 May 2025, EGU25-2403, https://doi.org/10.5194/egusphere-egu25-2403, 2025.

With the significant warming, Central Asia (CA) has suffered from frequent drought events and vegetation degradation. However, whether it is the large-scale circulation dynamics or the surface local thermal mechanism that plays the dominant role in the drought remains unknown. Here we used 3-month Standardized Precipitation Evaporation Index in August to identify the summer drought events for 1980-2022 and conducted a composite analysis. Results indicate that the drought related wave train, originating from mid-high latitude North Atlantic (NA), has a barotropic vertical structure and propagates eastward, featuring a positive geopotential height center in CA. The pronounced warm sea surface temperature (SST) over the middle-latitude NA and cold SST over the high-latitude NA contribute to the Rossby wave formation, which is verified by an analysis of the apparent vorticity anomaly and linear baroclinic model experiments. The anticyclone anomaly over CA, corresponding to strong vertical subsidence, enhances downward shortwave radiation and surface sensible heat flux, while significantly reducing surface latent heat flux. The maintenance of drought is usually associated with persistent precipitation deficits. By using the backward moisture tracking model, we further found that the recycled precipitation, induced by the local evapotranspiration, contributes to the 88.39% reduction of total precipitation during drought periods, whereas the inflow of external advected moisture shows no significant decrease. The above results highlight the dominated role of local land-atmosphere interactions responsible for the drought through reduced local evapotranspiration, with large-scale circulation anomalies providing a conducive background for the drought.

How to cite: Ren, Y. and Yu, H.: Impact of Mid-high Latitude Circulation and Surface Thermal Forcing on Drought Events in Central Asia, EGU General Assembly 2025, Vienna, Austria, 27 Apr–2 May 2025, EGU25-2533, https://doi.org/10.5194/egusphere-egu25-2533, 2025.

EGU25-2668 | Orals | CL3.1.1

The Impact of the Madden-Julian Oscillation on Spring and Autumn Afternoon Diurnal Convection in Sri Lanka 

Wan-Ru Huang, Suranjith Bandara Koralegedara, Tzu-Yang Chiang, Cheng-An Lee, Po-Han Tung, Yu-Tang Chien, and Liping Deng

This study examines how the Madden-Julian Oscillation (MJO) phases affect afternoon diurnal convection (ADC) patterns in Sri Lanka during 2001-2020. Sri Lanka experiences the highest frequency of ADC events in the Indian subcontinent region while located in a pivotal position within the propagation pathway of the MJO. To address the research gap regarding the MJO’s impact on seasonal diurnal rainfall in Sri Lanka, we analyze both the spring and autumn seasons, which are the two seasons with greater diurnal rainfall variability, focusing on strong MJO phases (P1-P8). Our findings show that daily rainfall increases during the P2-to-P3 phases and decreases during the P6-to-P7 phases in both seasons. The diurnal rainfall patterns, however, show seasonal differences. In spring, the diurnal rainfall amplitude peaks during P2-to-P3 phases, while in autumn, it peaks during P8-to-P1 phases. ADC events are more frequent and intense during these respective phases. The MJO's effect on both diurnal rainfall amplitude and ADC events is stronger in autumn compared to spring. During active MJO phases, we observe enhanced westward propagation of diurnal rainfall linked to ADC events, driven by moisture convergence and increased upward motion. The combination of mid-to-upper level easterly winds and deep convection over Sri Lanka leads to more distinct westward propagation during P2-to-P3 phases in spring and P8-to-P1 phases in autumn. These findings enhance our understanding of how the MJO influences local rainfall patterns and can aid in improving regional weather forecasting.

How to cite: Huang, W.-R., Koralegedara, S. B., Chiang, T.-Y., Lee, C.-A., Tung, P.-H., Chien, Y.-T., and Deng, L.: The Impact of the Madden-Julian Oscillation on Spring and Autumn Afternoon Diurnal Convection in Sri Lanka, EGU General Assembly 2025, Vienna, Austria, 27 Apr–2 May 2025, EGU25-2668, https://doi.org/10.5194/egusphere-egu25-2668, 2025.

EGU25-3062 | ECS | Orals | CL3.1.1

Quantifying Relative Contributions of Three Tropical Oceans to the Western North Pacific Anomalous Anticyclone 

Zhiyuan Lu, Lu Dong, Fengfei Song, Bo Wu, Shuyan Wu, and Chunzai Wang

The western North Pacific anomalous anticyclone (WNPAC) often exists during the mature and decaying phases of El Niño, significantly affecting the East Asian summer monsoon. Previous studies have revealed the importance of the Indian, Pacific, and Atlantic Oceans in generating and maintaining the WNPAC. However, a quantitative comparison of the contributions from these three oceans is still lacking. This study uses pacemaker experiments with a state-of-the-art model to quantify the relative contributions of the three tropical oceans to the interannual WNPAC variability. We find that the Pacific accounts for over 50% of the interannual variance in boreal winter and the following spring, while the roles of the Atlantic and Indian Oceans become more pronounced in spring. In summer, all three oceans contribute significantly and equally. The Indian Ocean SST is influenced by remote forcing from the Pacific Ocean, while the Atlantic Ocean operates more independently, with no evident effect from other oceans.

How to cite: Lu, Z., Dong, L., Song, F., Wu, B., Wu, S., and Wang, C.: Quantifying Relative Contributions of Three Tropical Oceans to the Western North Pacific Anomalous Anticyclone, EGU General Assembly 2025, Vienna, Austria, 27 Apr–2 May 2025, EGU25-3062, https://doi.org/10.5194/egusphere-egu25-3062, 2025.

EGU25-4406 | Orals | CL3.1.1

Numerical investigations of turbulence in Mediterranean cyclone events: insights from the Turbimecs project 

Christian N. Gencarelli, Leonardo Primavera, Giuseppe Ciardullo, Jacopo Settino, and Francesco Carbone

The tropical cyclones are one of the biggest hazards to life and socio-economic activities even in the formative stages of their development. Some of their main features, especially in the shape evolution and in the dynamics, are common with events that in recent years are increasingly affecting the Mediterranean basin, defined as Mediterranean Tropical-Like Cyclones (MTLCs), or Medicanes.

In this study, we investigate the spatial and temporal properties of two Medicanes through high spatial resolution (1 km) reanalysis-based numerical simulations, generated using the Weather Research and Forecasting (WRF) model. The events examined are Qendresa (occurred in November 2014) and Ianos (occurred in September 2020), both developing over the Mediterranean Sea.

The WRF reanalyses were also used to conduct sensitivity studies on the parameterizations of atmospheric physics, focusing on PBL, radiation and microphysics schemes.

In order to address the problem in the classical fluid turbulence picture, the results were also analyzed using the Proper Orthogonal Decomposition (POD) method. With the aim of providing a first approach to understand how different contributions, operating on distinct spatio-temporal scales, can influence the local dynamics and the evolution of the medicanes. In addition the analysis will uncover the formation of coherent structures in the extreme event maturation.

How to cite: Gencarelli, C. N., Primavera, L., Ciardullo, G., Settino, J., and Carbone, F.: Numerical investigations of turbulence in Mediterranean cyclone events: insights from the Turbimecs project, EGU General Assembly 2025, Vienna, Austria, 27 Apr–2 May 2025, EGU25-4406, https://doi.org/10.5194/egusphere-egu25-4406, 2025.

Abstract. Western Ukraine has encountered significant challenges due to three extensive summer rainfall events and major floods in July 2008, July 2010, and June 2020, resulting in numerous fatalities and substantial economic damage. This study investigates the hydrometeorological factors, as well as the atmospheric processes, that led to these three devastating flood events in the basins of the Tisza, Prut, Siret, and Dniester rivers in western Ukraine. The 2008 flood was the most severe, with river levels surpassing historical records. The flood in 2020 was notable for its hydrological complexity and was evolving more rapidly than the 2008 flood. The 2010 flood was more localized. 

A series of intense precipitation events extending over about 5 days were one of the key factors resulting in floods in all three cases. The prolonged heavy precipitation that caused these floods mainly occurred during the transition of the large-scale flow from a Scandinavian blocking pattern to a western Russian blocking regime and typically formed beneath an upper-level trough located over southeastern Europe. An essential synoptic feature for initializing the heavy rain events was a quasi-stationary upper-level cutoff low  that existed for about 5 days.  This persistence of the synoptic flow pattern allowed for the advection of warm, moist air from the Black Sea at low to mid-tropospheric levels toward the eastern slopes of the Carpathians, leading to orographic lifting that strongly contributed to precipitation in the region. While each flood event shared common mechanisms, such as Rossby wave breaking with subsequent formation of cutoff lows, atmospheric blocking and orographic lifting, the arrangement, interaction, and intensity of these processes varied. The 2010 event was marked by a combination of two consecutive Rossby wave breaking events and an intense atmospheric block in western Russia. In contrast, the 2008 and 2020 floods were characterized by a merging of the Scandinavian blocking regime with a blocking system over western Russia, resulting in the formation of a cutoff cyclone over Romania.  Thus, through the characterization of hydrometeorological conditions during western Ukraine floods, we aim to provide knowledge for better preparedness for future floods both in the region and throughout Eastern Europe.

How to cite: Agayar, E., Armon, M., and Wernli, H.: The catastrophic floods in 2008, 2010 and 2020 in western Ukraine: Hydrometeorological processes and the role of upper-level dynamics, EGU General Assembly 2025, Vienna, Austria, 27 Apr–2 May 2025, EGU25-5086, https://doi.org/10.5194/egusphere-egu25-5086, 2025.

EGU25-6112 | ECS | Orals | CL3.1.1

Systematic approach for global identification of extreme weather events associated with atmospheric blockings and subtropical ridges 

Miguel M. Lima, Pedro M. Sousa, Tahimy Fuentes-Alvarez, Carlos Ordóñez, Ricardo García-Herrera, David Barriopedro, Pedro M. M. Soares, and Ricardo M. Trigo

It is known that some extreme weather events are associated with the appearance of large-scale blocking patterns (e.g. heatwaves and droughts), while others are linked to cut-off low systems that often occur on the southern flanks of the blocking patterns (e.g. extreme precipitation, intense snow storms). These quasi-stationary high-pressure systems disrupt the atmospheric flow, producing significant extreme weather and influencing surface impacts. However, identifying and tracking atmospheric blocks is challenging due to their diverse dynamics.

BLOCS (Blocking Location and Obstruction Cataloguing System) is an open-source, Python-based framework designed to systematically identify, classify, and track atmospheric blocking events. It is based on the state-of-the-art geopotential height gradient methodology (e.g., Sousa et al., 2021) and provides a robust tool applicable to different regular-grid datasets, such as NCEP-NCAR and ERA5. The method captures blocking subtypes (e.g., ridge, omega, Rex) and their life cycles, enabling detailed analyses of their spatial and temporal variability. By integrating customizable parameters, BLOCS can be adapted for studying atmospheric blocking and subtropical ridges under changing climate conditions across diverse datasets (e.g. Coupled Model Intercomparison Project, CMIP; Paleoclimate Modelling Intercomparison Project, PMIP).

Outputs from BLOCS include daily- and event-based catalogues, facilitating the study of blocking dynamics and their influence on extreme weather conditions, such as temperature anomalies and precipitation extremes. BLOCS has been used to analyze historic events like the 2003 European heatwave and the 2010 Russian mega-heatwave, demonstrating its ability to connect blocking patterns to surface impacts. Its applications extend to regional and global studies, enabling users to systematically explore blocking-driven socio-economic and environmental impacts.

By offering a user-friendly community-driven tool, BLOCS can be used to bridge traditional meteorological approaches with data-driven methods, provide a benchmark for assessing the prediction of extreme weather events, address critical gaps in atmospheric blocking research, and ultimately advance our understanding of these phenomena and their role in shaping extreme events.

Acknowledgements: This work is supported by the Portuguese Fundação para a Ciência e a Tecnologia (FCT) I.P./MCTES through national funds (PIDDAC): UIDB/50019/2025 and LA/P/0068/2020 (https://doi.org/10.54499/LA/P/0068/2020). M. M. Lima was supported through the PhD MIT Portugal MPP2030-FCT programme grant PRT/BD/154680/2023. Additional support comes from the EU-funded H2020 project CLINT (Grant Agreement No. 101003876), and MALONE (PID2021-122252OB-I00), funded by MICIU/AEI/10.13039/501100011033 and ERDF, EU.

How to cite: M. Lima, M., M. Sousa, P., Fuentes-Alvarez, T., Ordóñez, C., García-Herrera, R., Barriopedro, D., M. M. Soares, P., and M. Trigo, R.: Systematic approach for global identification of extreme weather events associated with atmospheric blockings and subtropical ridges, EGU General Assembly 2025, Vienna, Austria, 27 Apr–2 May 2025, EGU25-6112, https://doi.org/10.5194/egusphere-egu25-6112, 2025.

EGU25-6295 | Posters on site | CL3.1.1

Heavy convective and stratiform precipitation and their links to atmospheric circulation 

Romana Beranova and Zuzana Rulfová

Precipitation in Central Europe can be classified as stratiform or convective based on its origin. Heavy convective precipitation is associated with intense storms, develops rapidly in localized areas, and can cause flash floods. In contrast, heavy stratiform precipitation is linked to longer-lasting, less intense rainfall events that may lead to large-scale flooding. These two types of precipitation also differ in their causal conditions, such as atmospheric circulation patterns and thermodynamic properties.

This study analyses heavy precipitation using time series from 19 observation stations across the Czech Republic for the period 1982–2021. An algorithm based on SYNOP reports was applied to classify precipitation totals as either convective or stratiform. Days with heavy precipitation (totals exceeding the 90th percentile) were assigned a circulation type using the Jenkinson & Collins (1977) method. This approach identifies 27 circulation types based on three indices: flow direction, strength, and vorticity.

The circulation types associated with heavy precipitation vary by season, precipitation type, and station location. Across all seasons, heavy precipitation is predominantly linked to cyclonic circulation and directional types with westerly and northerly flow components. In summer, heavy convective precipitation is additionally associated with anticyclonic conditions and unclassified patterns.

As climate change may significantly alter the atmospheric conditions driving heavy precipitation, understanding these phenomena and projecting their future behaviour is essential. To achieve this, the regional climate model ALADIN-CLIMATE/CZ operated by the Czech Hydrometeorological Institute will be used to evaluate the future relationship between heavy convective and stratiform precipitation and atmospheric circulation.

How to cite: Beranova, R. and Rulfová, Z.: Heavy convective and stratiform precipitation and their links to atmospheric circulation, EGU General Assembly 2025, Vienna, Austria, 27 Apr–2 May 2025, EGU25-6295, https://doi.org/10.5194/egusphere-egu25-6295, 2025.

EGU25-6372 | Orals | CL3.1.1

Widespread multi-year droughts in Italy: identification and causes of development 

Salvatore Pascale and Francesco Ragone

Multi-year droughts pose a significant threat to the security of water resources, putting stress on the resilience of hydrological, ecological, and socioeconomic systems. Motivated by the recent multi-year drought that affected Southwestern Europe and Italy from 2021 to 2023, here we utilize two indices - the Standardized Precipitation Evapotranspiration Index (SPEI) and the Standardized Precipitation Index (SPI) - to quantify the temporal evolution of the percentage of Italian territory experiencing drought conditions in the period 1901-2023 and to identify Widespread Multi-Year Drought (WMYD) events, defined as multi-year droughts affecting at least 30% of Italy. Seven WMYD events are identified using two different different precipitation datasets: 1921-22, 1942-43, 1945-46, 2006-08, 2011-13, 2015-19 and 2021- 23. Correlation analysis between the time series of Italian drought areas and atmospheric circulation indicates that the onset and spread of droughts in Italy are related to specific phases of the winter North Atlantic Oscillation (NAO), the Scandinavian Pattern (SCAND), East Atlantic/Western Russia (EAWR) pattern and of the summer East Atlantic (EA) and East Atlantic/Western Russia (EAWR) patterns. Event-based analysis of these drought episodes reveals a variety of atmospheric patterns and combinations of the four teleconnection modes that contribute to persistently dry conditions in Italy during both winter and summer. This study offers new insights into the identification and understanding of Italian WMYD events and serves as a first step toward a better understanding of the impacts of anthropogenic climate change on them.

How to cite: Pascale, S. and Ragone, F.: Widespread multi-year droughts in Italy: identification and causes of development, EGU General Assembly 2025, Vienna, Austria, 27 Apr–2 May 2025, EGU25-6372, https://doi.org/10.5194/egusphere-egu25-6372, 2025.

EGU25-6883 | ECS | Orals | CL3.1.1

The role of Rossby wave dynamics in spatially compounding heatwaves in mid-summer 2023 

Caihong Liu, Vera Melinda Galfi, Fenying Cai, Walter A. Robinson, and Dim Coumou

In July 2023, a series of heat extremes hit the North Hemisphere, which posed threats to the high-risk population and societal infrastructure in Eastern Canada, the Mediterranean, and Central Asia. Here we identify a dynamical linkage behind the spatiotemporal compounding nature of heatwaves over the three regions. However, it remains unclear whether these record-shattering extremes were amplified by specific recurrent atmospheric teleconnection patterns. By investigating the 2023 case and conducting historical analysis, we show that the Northern Hemispheric concurrent heatwaves in July 2023 were attributed to a recurrent wave-6 pattern. In particular, pre-existing warmth and drought over Eastern Canada in early-July intensified the wave-6 teleconnection; which then led to extreme heatwaves over the Mediterranean and Central Asia in mid-July 2023. Furthermore, we reveal that the wave train was generated by early-July convection over the northern subtropical Pacific together with the lowest May snow cover over North America in the past 40 years helped to warm Eastern Canada. Multiple models from the Coupled Model Intercomparison Project 6 can also simulate those compound extremes connected by the wave-6 pattern with a high inter-model agreement. Our research offers insights into record-breaking compounding heatwaves in disparate parts of world during the mid-summer of 2023, with implications for disaster decision-making and risk management.

How to cite: Liu, C., Galfi, V. M., Cai, F., Robinson, W. A., and Coumou, D.: The role of Rossby wave dynamics in spatially compounding heatwaves in mid-summer 2023, EGU General Assembly 2025, Vienna, Austria, 27 Apr–2 May 2025, EGU25-6883, https://doi.org/10.5194/egusphere-egu25-6883, 2025.

EGU25-7402 | ECS | Orals | CL3.1.1

Sketching the spatial disparities in heatwave trends by changing atmospheric teleconnections in the Northern Hemisphere 

Fenying Cai, Caihong Liu, Dieter Gerten, Song Yang, Tuantuan Zhang, Kaiwen Li, and Jürgen Kurths

Pronounced spatial disparities in heatwave trends are bound up with a diversity of atmospheric signals with complex variations, including different phases and wavenumbers. However, assessing their relationships quantitatively remains a challenging problem. Here, we use a network-searching approach to identify the strengths of heatwave-related atmospheric teleconnections (AT) with ERA5 reanalysis data. This way, we quantify the close links between heatwave intensity and AT in the Northern Hemisphere. Approximately half of the interannual variability of heatwaves is explained and nearly 80% of the zonally asymmetric trend signs are estimated correctly by the AT changes in the mid-latitudes. We also uncover that the likelihood of extremely hot summers has increased sharply by a factor of 4.5 after 2000 over areas with enhanced AT, but remained almost unchanged over the areas with attenuated AT. Furthermore, reproducing eastern European heatwave trends among various models of the Coupled Model Intercomparison Project Phase 6 largely depends on the simulated Eurasian AT changes, highlighting the potentially significant impact of AT shifts on the simulation and projection of heatwaves.

How to cite: Cai, F., Liu, C., Gerten, D., Yang, S., Zhang, T., Li, K., and Kurths, J.: Sketching the spatial disparities in heatwave trends by changing atmospheric teleconnections in the Northern Hemisphere, EGU General Assembly 2025, Vienna, Austria, 27 Apr–2 May 2025, EGU25-7402, https://doi.org/10.5194/egusphere-egu25-7402, 2025.

EGU25-7615 | ECS | Posters on site | CL3.1.1

Delayed impacts of NPO on wintertime surface air temperature in East Asia 

Sunyong Kim and Jin Ho Yoo

Observations show that anticyclonic circulation anomalies over the subtropics associated with North Pacific Oscillation (NPO) in December are responsible for surface warming in East Asia of the following January, a 1-month lag. We demonstrate that the lagged impacts of December NPO anomalies on the East Asian surface warming in January are attributable to two possible pathways by way of the tropics-extratropics teleconnections and local air-sea interactions. The northeasterly anomalies along the southern edge of the December NPO-related anticyclonic circulation anomalies efficiently advect dry air towards the western North Pacific (WNP), leading the intensified negative precipitation anomalies from December to January. This results in a Rossby wave propagation forced by upper-tropospheric divergence in the WNP, and thus affects the persistence of anticyclonic anomalies over East Asia into January. Over the Kuroshio region the easterly anomalies along the southern edge of the December NPO anticyclonic circulation anomalies oppose the prevailing westerly winds. The significant weakening of wind speeds, which in turn give rise to sea surface temperature (SST) warming along the Kuroshio region as a result of wind-evaporation-SST feedback, lead to favorable conditions for the East Asian warming in January. Additionally, the Coupled Model Intercomparison Project Phase 6 (CMIP6) models reasonably simulate the delayed impacts of December NPO anomalies on the East Asian climate in January supporting observations.

How to cite: Kim, S. and Yoo, J. H.: Delayed impacts of NPO on wintertime surface air temperature in East Asia, EGU General Assembly 2025, Vienna, Austria, 27 Apr–2 May 2025, EGU25-7615, https://doi.org/10.5194/egusphere-egu25-7615, 2025.

This study presents a revised Tropical Cyclone Genesis Potential Index (χMqGPI) for projecting tropical cyclone genesis in the Western North Pacific (WNP) and evaluates its performance against the traditional χGPI index. Using simulations from 22 CMIP6 models, both indices were calculated and assessed for their accuracy in historical and future warming scenarios. The results indicate that in historical simulations, both χGPI and χMqGPI exhibit strong correlations with observed tropical cyclone data, with correlation coefficients exceeding 0.9. Both indices also effectively capture the primary genesis regions of tropical cyclones in the WNP in terms of spatial distribution.

Under future warming scenarios, however, the two indices project contrasting trends in tropical cyclone genesis frequency (TCGF). χGPI consistently predicts an increase in TCGF, while χMqGPI projects a declining trend that aligns more closely with recent findings from high-resolution models. This declining trend underscores the robustness and reliability of χMqGPI in climate projections.

Decomposition analysis of χMqGPI revealed that large-scale dynamic parameters, particularly absolute vorticity and vertical wind shear, are critical in explaining discrepancies between model simulations. These differences become increasingly pronounced with the severity of warming, highlighting the importance of accurately representing large-scale environmental dynamics in models to improve tropical cyclone projections under climate change.

These findings offer valuable insights into the potential future behavior of tropical cyclones and emphasize the significance of adopting refined indices, such as χMqGPI, for reliable climate predictions. This work underscores the critical role of advanced metrics in understanding the impact of global warming on tropical cyclone activity in the WNP and beyond

How to cite: Hsiao, L.-P. and Hsu, H.-H.: Evaluating the Impact of Global Warming on Tropical Cyclone Genesis in the Western North Pacific: A Comparative Study of Tropical Cyclone Genesis Indices Using CMIP6 Models, EGU General Assembly 2025, Vienna, Austria, 27 Apr–2 May 2025, EGU25-7700, https://doi.org/10.5194/egusphere-egu25-7700, 2025.

EGU25-7953 | Posters on site | CL3.1.1

The intensification of future extreme-rainfall events over Belgium and their dynamic and thermodynamic contributions 

Bert Van Schaeybroeck, Jozefien Schoofs, Kobe Vandelanotte, Hans Van de Vyver, Line Van Der Sichel, Matthias Vandersteene, Fien Serras, and Nicole P. M. van Lipzig

Climate change is expected to amplify extreme-rainfall intensity and frequency over Europe due to the increase in atmospheric moisture with warming, ensuing severe socio-economic impacts. The influence of future dynamic changes i.e. changes to atmospheric circulation patterns, on extreme-rainfall over Europe, on the other hand, remains unclear. Additionally, recent works point out that inadequate representation of regional circulation patterns by climate models may strongly impact their climate-change results over Europe (Vautard et al., 2023).

This study presents a methodology for assessing the dynamical and thermodynamical contributions to the changes in extreme daily rainfall based on the Lamb weather type classification and with an application over Belgium. Thereby, GCMs from CMIP6 are first sub-selected based on their ability to accurately represent the overall atmospheric circulation (Serras et al., 2024) and the atmospheric circulation during days of extreme rainfall. We find that models with a good circulation probability distribution do not necessarily feature a good circulation-probability representation when restricting to days with extreme rainfall events, and vice versa. This means that, for our purpose, additional to the model selection based on all days, a selection based on the circulation probability distribution during days of extreme rainfall is implemented. Additionally, the increase in extreme-rainfall intensity and likelihood at the end of century under the SSP3-7.0 scenario for Belgium, are driven by thermodynamic factors rather than dynamic changes. While the probability of extreme rainfall rises predominantly in fall and winter, the most significant intensity increases are projected for spring and summer. 

  • Vautard, R., Cattiaux, J., Happé, T., Singh, J., Bonnet, R., Cassou, C., ... & Yiou, P. (2023). Heat extremes in Western Europe increasing faster than simulated due to atmospheric circulation trends. Nature Communications, 14(1), 6803.
  • Serras, F., Vandelanotte, K., Borgers, R., Van Schaeybroeck, B., Termonia, P., Demuzere, M., & van Lipzig, N. P. (2024). Optimizing climate model selection in regional studies using an adaptive weather type based framework: a case study for extreme heat in Belgium. Climate Dynamics, 1-23.

How to cite: Van Schaeybroeck, B., Schoofs, J., Vandelanotte, K., Van de Vyver, H., Van Der Sichel, L., Vandersteene, M., Serras, F., and van Lipzig, N. P. M.: The intensification of future extreme-rainfall events over Belgium and their dynamic and thermodynamic contributions, EGU General Assembly 2025, Vienna, Austria, 27 Apr–2 May 2025, EGU25-7953, https://doi.org/10.5194/egusphere-egu25-7953, 2025.

EGU25-8108 | ECS | Orals | CL3.1.1

Drivers of multi-year droughts in large ensemble simulations 

Jonna van Mourik, Denise Ruijsch, Karin van der Wiel, Wilco Hazeleger, and Niko Wanders

Multi-year droughts (MYDs) are severe natural hazards that have become more common due to climate change. Given their significant societal impact compared to normal droughts (ND) of shorter duration, it is crucial to better understand the drivers of MYDs. In this work we used a combination of a large-ensemble of climate models and reanalysis data to study the difference between MYDs and NDs. For six different climatic regions, chosen to be of similar size to the dominating regional atmospheric circulation patterns, we used reanalysis data of precipitation and potential evapotranspiration to show the regional characteristics and drivers of MYDs and contrast these with characteristics of NDs. Our findings reveal that MYD occurrence and duration varies significantly between the regions, where relatively larger differences in duration between MYD and NDs can indicate different drivers resulting in the different drought durations. Regions with distinctive seasonality in their precipitation climatology tend to experience faster drought onsets compared to regions with climatologically steady precipitation. Furthermore, our analysis shows that MYDs and NDs often start with similar conditions but diverge over time, and that longer-term memory is present in some regions, which might provide avenues for the predictability of MYDs. However, since MYDs are rare events (2 to 6 MYDs per region between 1950-2023 in this study), we supplement reanalyis data with that of CMIP6 climate models with a large number of ensembles to assess the drivers of MYDs with more statistical rigour. This creates the opportunity to study the contributions of oceans, soil moisture, snow, and other climate variables on the persistent circulation patterns leading to MYDs, and to find the influence of climate variability on the occurrence of MYDs.

DOI: http://dx.doi.org/10.2139/ssrn.4974995

How to cite: van Mourik, J., Ruijsch, D., van der Wiel, K., Hazeleger, W., and Wanders, N.: Drivers of multi-year droughts in large ensemble simulations, EGU General Assembly 2025, Vienna, Austria, 27 Apr–2 May 2025, EGU25-8108, https://doi.org/10.5194/egusphere-egu25-8108, 2025.

EGU25-8195 | Orals | CL3.1.1

Cluster analysis of HYSPLIT backward trajectories for major heatwaves in Spain and Ukraine (1940–2023) 

Oleg Skrynyk, Enric Aguilar, Olesya Skrynyk, and Caterina Cimolai

Heatwaves (HWs) are extremely harmful weather phenomena that cause significant damage to the environment and society. Numerous studies have shown a substantial increase in the frequency and intensity of HWs in various parts of the world. Therefore, investigating the meteorological factors contributing to HW formation is an important task. In this study, we investigated the main air transport patterns associated with the most severe HWs observed during 1940-2023 in Spain and Ukraine.

Firstly, based on ERA5 (2 m) air temperature data, we identified all HW events for each grid point in both countries with the heatwaveR package. Following the approach used in many studies, a HW was defined as an extreme weather phenomenon when daily maximum air temperature exceeds 90-th percentile at least for three consecutive days. Additionally, each detected HW episode was categorized as moderate, strong, severe, or extreme based on its maximum observed intensity. A final list of HWs for further analysis in each country was compiled by selecting events with a spatial extent covering more than 20% of the country’s territory and with severe or extreme category identified in at least one grid point. Using this methodology, we selected 80 HW episodes in Spain and 18 in Ukraine.

Backward trajectories for the selected HW episodes were calculated using the HYSPLIT model, with ERA5 3D-data serving as input meteorology. For each HW event, only first three days were considered, regardless of the event's total duration. A starting location for backward trajectories for each HW was defined as a midpoint of its spatial extent. Additionally, to assess the influence of vertical wind shear on trajectory calculations, three altitudes (10, 1500, and 5000 m AGL) were defined as the starting heights. Backward trajectories were initiated hourly over the 3-day period and calculated for the seven days preceding each release hour. In total, 216 backward trajectories were calculated for each HW episode (72 trajectories per release height). The calculated trajectories were then grouped into three clusters based on the HYSPLIT clustering approach and a mean trajectory was determined for each cluster. Along with the cluster analysis, we also identified the dominant circulation types and their evolution during the selected HW episodes. This analysis was performed using the synoptReg package based on ERA5 mean sea level pressure data.

The mean cluster trajectories, calculated for all selected HWs, were used to build trajectory frequency maps, showing the most preferential routes of air masses associated with the severe and extreme HWs. Analysis of these maps revealed that a westerly trajectory flow is the most likely route for air masses responsible for the most intense HWs in Spain and Ukraine. In Spain, air masses are typically transported from the Atlantic, whereas in Ukraine, they traverse across Western Europe. Other directions of air mass transport, including from the south, occur relatively rarely. Our findings align with other similar studies for other regions in Europe, which suggest that heat advection is not dominant mechanism for HW formation.

This work has received funding through the MSCA4Ukraine project, funded by the European Union

How to cite: Skrynyk, O., Aguilar, E., Skrynyk, O., and Cimolai, C.: Cluster analysis of HYSPLIT backward trajectories for major heatwaves in Spain and Ukraine (1940–2023), EGU General Assembly 2025, Vienna, Austria, 27 Apr–2 May 2025, EGU25-8195, https://doi.org/10.5194/egusphere-egu25-8195, 2025.

EGU25-8369 | Posters on site | CL3.1.1

Heatwave climatology in Ukraine: current (1946-2020) and projected (2020-2100) 

Olesya Skrynyk, Enric Aguilar, Vladyslav Sidenko, and Oleg Skrynyk

Climatological and meteorological aspects of heatwaves (HWs) have been extensively studied in various parts of the world, as these extreme weather events have significant harmful effects on both humans and the environment. Several studies have examined HW climatology in Ukraine for specific historical periods using observational air temperature data. However, these results were obtained based on a relatively small number of meteorological stations.

In our study, we calculated HW climatology in Ukraine for both the current historical (1946–2020) and the projected (2020–2100) periods. For the historical period, we utilized the observation-based gridded dataset ClimUAd, which was recently developed for Ukraine. These gridded data are based on a comprehensive collection of instrumental meteorological measurements collected at 178 stations during 1946-2020 across the country. The dataset provides gridded daily time series of four essential climate variables: minimum, mean, and maximum surface air temperature, as well as atmospheric precipitation. The spatial resolution of ClimUAd is 0.1° × 0.1° in both longitude and latitude, enabling the analysis of HW climatology with fine spatial detail across Ukraine.

For the projected period, we applied a mini-statistical ensemble of climate simulations obtained with seven global climate models (GCMs) from the Coupled Model Intercomparison Project Phase 6. GCMs were selected for the ensemble based on two criteria: the use of the Gregorian calendar and a computational grid resolution no courser than 1.5o×1.5o. Our analysis incorporated climate projections obtained under two Shared Socioeconomic Pathways (SSP) scenarios: SSP2-4.5 and SSP5-8.5. Prior to calculating HW metrics, all climate projections of surface air temperature were bias-corrected using the quantile delta mapping method. In the bias-correction procedure, ClimUAd data were used along with historical climate simulations for the period 1985-2014.

For both the historical and projected periods, HWs were identified using daily maximum air temperature (TX) data. To detect HWs, we define this extreme weather phenomenon as an event when TX exceeds the 90-th percentile, calculated based on the WMO standard reference period of 1961-1990, for at least three consecutive days, allowing for a one-day gap. This approach is frequently used and widely recommended in studies as the most suitable for HW analysis with pure climatological purposes. The applied definition enables the identification of HWs throughout an entire year. To quantify HW peculiarities, we calculated four HW metrics on a yearly scale: HW number, HW frequency, HW duration, and HW amplitude. All HW calculations were performed using the heatwaveR package.

Our findings revealed a significant increase in all HW metrics during the historical period, with the most pronounced changes observed in the western part of Ukraine. In the projected period, the HW metrics continue to increase at a similar rate for both considered SSPs until approximately the mid-century. However, in the latter part of XXI, changes in HW climatology under SSP5-8.5 differ considerably from those under SSP2-4.5. The SSP5-8.5 scenario indicates that more than half of days in a year at the end of XXI could qualify as HWs.

This work has received funding through the MSCA4Ukraine project, funded by the European Union

How to cite: Skrynyk, O., Aguilar, E., Sidenko, V., and Skrynyk, O.: Heatwave climatology in Ukraine: current (1946-2020) and projected (2020-2100), EGU General Assembly 2025, Vienna, Austria, 27 Apr–2 May 2025, EGU25-8369, https://doi.org/10.5194/egusphere-egu25-8369, 2025.

Cut-off lows (COLs), which are warm season high altitude cold depressions originating from the pole, have lead to the most extreme precipitation events in Belgium in the past decades, notably in July 2021. Their frequency is expected to rise with Global warming due to slowing dynamics during the warm season. On top of this, extreme precipitation events are becoming more frequent, and more extreme due to the increase of atmospheric moisture content resulting from its warming (Brajkovic et al., 2025 in prep.). To understand the cause of this increased frequency, we want to assess the evolution of the frequency of COLs which lead to extreme precipitation events in Belgium.

First, over 1940-2023, using our bias-adjusted high-resolution (5-km) Regional Climate model MAR (Modèle Atmosphérique Régional) precipitation data over Belgium and ERA5 reanalysis 500hPa geopotential data over Europe, we identify COLs which lead to extreme precipitation over the country. We find COLs leading to extreme precipitation all over the period. Their occurence has increased over the last decades reaching a frequency of 1 COL per year. However, we find periods with less COLs like in the 1970s.

Second, MAR is forced 6 CMIP6 Earth System Models over 2015-2100. Four Shared Socioeconomic Pathways baseline scenarios (SSP) are used ranging from low-end (SSP1-2.6) to high-end emissions (SSP5-8.5). Again, using ESM 500hPa geopotential and bias-ajusted MAR precipitation data, we proceed to the same detection over the future. We find that the occurrence of COLs is stochastic and without clearly identified trends. Intense precipitation events occur irrespective of the scenario at timings which are challenging to predict. However, the frequency of COLs reaches 1 COL per year irrespective of the model or of the scenario. This analysis shows that a large amount of the uncertainty over future computed extreme precipitation statistics lies in the occurrence of COLs.


How to cite: Brajkovic, J., Fettweis, X., Ghilain, N., and Doutreloup, S.: Past and future evolution of synoptic weather patterns leading to extreme precipitation events in Belgium. Linking synoptic scale events to their local impacts. , EGU General Assembly 2025, Vienna, Austria, 27 Apr–2 May 2025, EGU25-9805, https://doi.org/10.5194/egusphere-egu25-9805, 2025.

EGU25-10214 | Orals | CL3.1.1

Using causal networks to constrain regional drought projections 

Marina Friedel, Marlene Kretschmer, and Bruce Hewitson

Severe droughts in the Cape Town region (CTR) are projected to become more frequent in the coming decades, posing significant societal challenges. However, while climate models consistently predict a precipitation decline for the CTR until the end of this century, these projections carry substantial uncertainties, with decreases ranging from almost zero to as much as -50%.

In this study, we employ causal networks to evaluate climate models based on their ability to accurately represent the large-scale dynamical processes that drive precipitation in the CTR. While previous research has identified links between precipitation in the CTR  and various large-scale drivers, such as the eddy-driven jet and sea surface temperatures in the South Atlantic, the interactions between these drivers remain poorly understood and the relative contributions of individual drivers to precipitation in the CTR remain unexplored.

Following causal inference theory, the causal relationships among the large-scale drivers of precipitation in the CTR are quantified in reanalysis data, pinpointing the main precipitation drivers, their interactions and relative contributions to precipitation and drought events. The resulting causal network is then applied to constrain precipitation projection. The study’s insights into the links between planetary-scale circulation patterns and regional processes could enhance our understanding of extreme and compound events, with potential implications for drought management.

How to cite: Friedel, M., Kretschmer, M., and Hewitson, B.: Using causal networks to constrain regional drought projections, EGU General Assembly 2025, Vienna, Austria, 27 Apr–2 May 2025, EGU25-10214, https://doi.org/10.5194/egusphere-egu25-10214, 2025.

EGU25-10994 | ECS | Orals | CL3.1.1

Pathways to concurrent North American cold and European wind extremes 

Richard Leeding and Gabriele Messori

We examine near-simultaneous occurrences of cold extremes in North America and wind extremes in Europe, referred to as pan-Atlantic compound extremes. Previous studies have established a robust spatial and temporal relationship between the location of cold extremes and the footprint of wind extremes. Individually, cold and wind extremes are highly impactful, but their coincident occurrence amplifies effects and exposes international actors to correlated losses. This study analyzes the large-scale circulations responsible for pan-Atlantic compound extremes through the lens of weather regimes and Fourier decomposition.

Five distinct dynamical pathways are identified, which non-uniformly govern the occurrence of cold extremes across three regions of North America. Three of these pathways also engender European wind extremes, providing a mechanistic explanation for the observed spatial and temporal relationships of pan-Atlantic extremes. The pathways are as follows:
(i) A persistent Atlantic low producing cold spells in eastern Canada and wind extremes in the British Isles.
(ii) A wave train generating cold spells in the eastern United States, culminating in an Atlantic low and wind extremes in Iberia and the British Isles.
(iii) A wave train producing cold spells in eastern Canada, culminating in Scandinavian blocking.
(iv) A quasi-stationary wave-2 pattern driving cold spells in central Canada and Scandinavian blocking.
(v) An Arctic high generating cold spells in the eastern United States and wind extremes in Iberia.

How to cite: Leeding, R. and Messori, G.: Pathways to concurrent North American cold and European wind extremes, EGU General Assembly 2025, Vienna, Austria, 27 Apr–2 May 2025, EGU25-10994, https://doi.org/10.5194/egusphere-egu25-10994, 2025.

EGU25-11026 | ECS | Orals | CL3.1.1

The Role of Teleconnection Indices in Modulating Rainfall and Drought in Central Brazil 

Lívia Sancho, Louise Aguiar, Vitor Luiz Victalino Galves, Priscila Esposte Coutinho, and Marcio Cataldi

Increasing temperatures due to climate change pose challenges to countries worldwide, including Brazil, where extreme weather may result in biodiversity loss, water resource availability changes, and significant economic and health impacts. This study evaluates the influence of various teleconnection indices on the variability patterns of atmospheric blocking events occurring in central Brazil and episodes of the South Atlantic Convergence Zone (SACZ). Nearly all teleconnection indices made available in the NOAA’s website were analysed, including those related to the Pacific, Atlantic, Indian Oceans and global-scale indices. Additionally, four new indices were explicitly developed for this study, focusing on NOAA’s OISST Sea Surface Temperature anomalies in the North Atlantic Ocean near the Moroccan coast. The characterization of atmospheric blocking events and SACZ episodes was carried out using indices developed at LAMMOC/UFF, which effectively capture the behaviour of these atmospheric systems across different regions of Brazil. The SACZ index was calculated using NCEP Reanalysis data, while the atmospheric blocking index used ERA5 reanalysis data, resulting in a time series spanning from 1981 to 2023. All data were normalized for statistical analyses, and methods including Pearson’s correlation coefficient, Principal Component Analysis, K-means clustering techniques, trend analysis, and the Mann-Kendall test were applied to identify and quantify trends in the data. Atmospheric blocking and SACZ episodes have contrasting yet significant influences on the rainfall in central Brazil. Atmospheric blocking events are typically associated with prolonged droughts, whereas SACZ episodes are linked to intense and spatially well-distributed precipitation. This region is vital for the country’s agriculture, industry, and energy production. The analysis revealed that a significant portion of oceanic indices from the Atlantic and the Pacific Oceans, along with atmospheric blocking events, exhibit strong increasing trends. These trends are accompanied by positive correlations, observed in the trend-inclusive and detrended series. For instance, correlations reach 0.7 values with the Global Mean Land/Ocean Temperature, 0.45 with ENSO indices, 0.55 with North Atlantic indices near the Moroccan coast, and 0.67 with the Pacific Warmpool Area Average. In contrast, the SACZ index showed no clear trend in the Mann-Kendall tests. Correlations between SACZ and the same oceanic indices often exhibited an inverse relationship compared to those with blocking indices and were also generally weaker, ranging between -0.15 and -0.30. One exception was a positive correlation of around 0.34 with the East Pacific/North Pacific Oscillation index. Overall, the study highlights that atmospheric blocking events are becoming increasingly frequent and intense in central Brazil, closely following the warming trend of the oceans. This poses a warning for the region’s hydrometeorological regime. While the absence of an evident decline in SACZ episodes provides some relief, the escalating deforestation in the Amazon, one of the primary sources of moisture driving precipitation during SACZ episodes, may become the decisive factor in altering the region’s precipitation patterns, potentially exacerbating the ongoing water crisis in central Brazil.

How to cite: Sancho, L., Aguiar, L., Victalino Galves, V. L., Esposte Coutinho, P., and Cataldi, M.: The Role of Teleconnection Indices in Modulating Rainfall and Drought in Central Brazil, EGU General Assembly 2025, Vienna, Austria, 27 Apr–2 May 2025, EGU25-11026, https://doi.org/10.5194/egusphere-egu25-11026, 2025.

EGU25-11431 | ECS | Orals | CL3.1.1

Influence of Atmospheric Blocking and SACZ Episodes on Extreme Heatwaves in Brazil: A Long-Term Analysis 

Louise da Fonseca Aguiar, Vitor Luiz Galves, Priscila Esposte Coutinho, Lívia Sancho, and Marcio Cataldi

Rising temperatures driven by climate change pose significant challenges worldwide. In Brazil, these challenges include extreme weather events such as heatwaves, which can have severe health impacts. This study investigates the influence of atmospheric blocking events and episodes of the South Atlantic Convergence Zone (SACZ) on Brazil's occurrence and intensity of extreme heatwaves. Atmospheric blocking and SACZ episodes were characterized using indices developed at LAMMOC/UFF, which effectively capture the behavior of these systems across different regions of the country. Atmospheric blocking events are typically associated with prolonged droughts, while SACZ episodes are linked to intense, spatially well-distributed precipitation. The newly developed Extreme Heatwave (XHW) index was applied in this study due to its global applicability, covering all 26 state capitals and the Federal District of Brazil. The SACZ index was calculated using NCEP Reanalysis data (I and II) while blocking and XHW indices were calculated using ERA5 reanalysis data, generating a time series from 1960 to 2024. To facilitate statistical analyses, all data were normalized. Methods such as Pearson’s correlation coefficient, Principal Component Analysis (PCA), K-means clustering, trend analysis, and the Mann-Kendall test were applied to identify and quantify trends in the series. The results showed an increase in extreme heat events in most cities, except for Florianópolis (in the South) and Fortaleza (in the Northeast), which displayed no significant trend. Atmospheric blockings also showed a clearer upward trend across all evaluated regions compared to SACZ episodes. The correlation between the SACZ and heatwaves is statistically insignificant across most of Brazil, with values close to zero, as the SACZ is not associated with significant temperature gradients, causing little to no impact on the occurrence of heatwaves. In contrast, atmospheric blockings show statistically significant positive correlations with heatwaves, particularly in geographically specific regions. For example, in the North region, Palmas (TO) stands out with a correlation of 0.44, while Manaus (AM) approaches a value of 0.38. These cities are more responsive to northern-located blockings. Rio de Janeiro (RJ), in the Southeast, and Cuiabá (MT), in the Central-West, exhibit a correlation of 0.37 due to southern and northern-located blockings, respectively. In the South, Porto Alegre (RS) is the most responsive to southern-located blockings with a correlation of 0.18. In the Northeast, values are generally low, with Recife (PE) showing the highest correlation (0.16) for northern-located blockings. This study emphasizes the importance of spatial analysis in understanding the influence of atmospheric blockings on extreme heatwaves events, revealing a direct relationship between the position of blockings and their impact, as evidenced by the varying responses of different cities. As atmospheric blockings increase in frequency due to climate change, heatwaves are also expected to become more frequent and intense. This trend poses a growing risk to public health and mortality, as well as significant challenges to the healthcare system.

How to cite: da Fonseca Aguiar, L., Galves, V. L., Esposte Coutinho, P., Sancho, L., and Cataldi, M.: Influence of Atmospheric Blocking and SACZ Episodes on Extreme Heatwaves in Brazil: A Long-Term Analysis, EGU General Assembly 2025, Vienna, Austria, 27 Apr–2 May 2025, EGU25-11431, https://doi.org/10.5194/egusphere-egu25-11431, 2025.

EGU25-11580 | ECS | Posters on site | CL3.1.1

Exploring and characterizing the life cycles of tracked anticyclones on the northern hemisphere 

Michael Thomas and Stephan Pfahl

Summer heat waves are among the most severe natural hazards in the mid-latitudes and known to be strongly associated with anticyclonic activity. Despite their frequent occurrence, gaps remain in the understanding of the processes that drive persistent heat outbreaks during the lifetime and in the vicinity of some anticyclones. A closer look at the life cycles of these anticyclones could be beneficial for understanding the circumstances under which there is an increased likelihood of near-surface extremes.
To date, numerous studies have performed some form of feature tracking on anticyclones, but many are limited to a specific region or context, while those that take a broader view focus on climatology rather than individual life cycles.
In this work, mid-tropospheric anticyclones are identified though geopotential height anomalies, tracked over time and analyzed based on their shape, propagation speed and overlap with other atmospheric phenomena, such as heat waves, droughts and blocking. Using 40 years of northern hemisphere reanalysis data, a detailed track dataset for around 5900 individual anticyclones is examined. It is shown that the most extreme temperature anomalies are systematically more likely to be associated with anticyclones with longer life times. Furthermore there is evidence that the probability for a heat wave maximum is higher in the early and late phases of the anticyclonic life cycles, with the former (latter) being particularly true for shorter-lived (longer-lived) high pressure systems.

How to cite: Thomas, M. and Pfahl, S.: Exploring and characterizing the life cycles of tracked anticyclones on the northern hemisphere, EGU General Assembly 2025, Vienna, Austria, 27 Apr–2 May 2025, EGU25-11580, https://doi.org/10.5194/egusphere-egu25-11580, 2025.

In mid-latitude regions, the development of a heatwave is closely linked to a quasi-stationary anticyclonic flow anomaly. For many cases over Europe, these anomalies are associated with atmospheric blocking events, which in summer usually manifest themselves in form of a so-called Omega blocking. However, not all heatwaves necessitate atmospheric blocking. Indeed, some heatwaves are enabled by poleward extensions of the subtropical high pressure belt, forming an atmospheric ridge pattern. We hypothesize that both the origin of the involved air masses as well as the processes modulating the air mass along its path to Central Europe may differ fundamentally between heatwaves forming under an Omega blocking and those that are initiated by a subtropical ridge.

In this work, we therefore select the respective 20 most textbook-like cases of Omega and ridge-type Central European heatwaves in the period of 1950 to 2023. Based on high-resolution ERA5 data, we conduct a Lagrangian analysis into the properties of air masses and the relative importance of the three processes warming the involved air masses, namely advection, adiabatic warming by subsidence and diabatic warming through sensible heat fluxes. By computing a large number of backward trajectories using Lagranto and the subsequent application of a Lagrangian temperature decomposition algorithm, we quantify the relative importance of each of the three mentioned processes. This analysis is done separately for the onset day and the subsequent three days of the heatwave.

Omega- and ridge-type heatwaves feature some significant differences in both air mass origin and the relative importance of the processes leading to anomalously high near-surface temperatures, which tend to become more apparent in the more mature stage of the respective type of heatwave. Overall, ridge-type heatwaves tend to be characterized by a higher advective contribution to the overall temperature anomaly. This is directly related to the fact, that the involved air masses tend to originate from slightly more southern and climatologically warmer regions. Particularly two or three days after heatwave onset, anomalous subsidence and associated adiabatic heating contributes significantly more to warming in ridge-type than in omega-type heatwaves. In turn, omega-type heatwaves are characterized by a significantly stronger contribution of diabatic heating. This is mostly due to air masses spending more time in the planetary boundary layer and stronger short-wave radiation along the air masses' path.

How to cite: Lemburg, A., Fink, A. H., and Pinto, J. G.: Lagrangian analysis of two flavours of Central European heatwaves: development under Omega blocking vs. initiation by subtropical ridges, EGU General Assembly 2025, Vienna, Austria, 27 Apr–2 May 2025, EGU25-11816, https://doi.org/10.5194/egusphere-egu25-11816, 2025.

EGU25-11855 | ECS | Orals | CL3.1.1

An analog-based weather generator using re-forecast data 

Jonathan Wider, Daniel Klotz, and Jakob Zscheischler

Accurately estimating the risks of weather-related impacts requires comprehensively simulating weather conditions that could occur but have not occurred in the historical record. This is the aim of weather generators. Analog-based weather generators exploit the fact that the large-scale atmospheric circulation constrains regional weather and generate multivariate spatiotemporal meteorological fields by resampling historical data. During the resampling, constraints are employed to ensure that successive samples have consistent circulation patterns. Compared to other types of weather generators, resampling-based methods have the advantage that dependencies between variables and between locations are automatically correctly captured. However, the generated time series are limited to observed ranges, and even “close” analogs in the historical record are relatively far away from each other.

We overcome these limitations by constructing a (daily) analog weather generator using ECMWF extended ensemble forecast hindcast (re-forecast) data, which provides a much larger sample size and the ability to sample values larger than the observed records. We choose this dataset because it has high spatial resolution and provides a large set of states from a relatively constant climate, while model biases remain limited because the forecasts are initialized from reanalysis data. With the ensemble hindcasts, we can also assess how “close” analogs are compared to typical ensemble spreads. We test our methodology by applying it to simulate weather over a European domain. Analogs are defined in terms of geopotential height at 500hPa and computed over an extended region including parts of the North Atlantic. With our approach, we can find better analogs compared to a baseline using only ERA5 data. We evaluate key properties of the simulated time series, such as their annual cycle, extremes, and lengths of wet and dry spells. The weather generator can be widely applied to estimate potential climate impacts, for instance with impact models. It is especially useful in cases where an accurate representation of dependencies between variables or across space is important for the impacts, which is the case for a number of different types of compound events.

How to cite: Wider, J., Klotz, D., and Zscheischler, J.: An analog-based weather generator using re-forecast data, EGU General Assembly 2025, Vienna, Austria, 27 Apr–2 May 2025, EGU25-11855, https://doi.org/10.5194/egusphere-egu25-11855, 2025.

EGU25-12052 | ECS | Orals | CL3.1.1

Impacts of Atmospheric Phenomena on River Flow and Hydropower Stability in Brazil 

Priscila Esposte Coutinho, Lívia Sancho, Louise da Fonseca Aguiar, Vitor Luiz Victalino Galves, Franciele Zanandrea, and Marcio Cataldi

Renewable energy sources are inherently influenced by environmental variability. In Brazil, hydropower constitutes approximately 65% of the country’s electricity matrix, relying directly on river flow, which is strongly governed by precipitation on an operational timescale. This study investigates the influence of atmospheric blocking events and episodes of the South Atlantic Convergence Zone (SACZ) on the occurrence and magnitude of natural flow in several hydropower plants in river basins across Brazil. Atmospheric blocking and SACZ episodes were characterized using indices developed at LAMMOC/UFF, which effectively capture the behavior of these systems in different regions of the country. The SACZ index was calculated using NCEP reanalysis data, while the blocking index was derived from ERA5 reanalysis data. Natural flow data for the power plant areas were provided by the National Electric System Operator (ONS). To maximize the availability of records for this study, the time series was defined from 1960 to 2023. All data were normalized for statistical analyses, and methods such as Pearson’s correlation coefficient, Principal Component Analysis (PCA), K-means clustering, trend analysis, and the Mann-Kendall test were employed to identify and quantify trends. Results indicate that blocking events have shown a rising trend across all evaluated regions, whereas SACZ episodes do not display an increasing trend uniformly throughout the country. Regarding river flow trends, increases were observed in Southern Brazil, while decreases predominate in the Southeast, Central-West, Northeast, and North regions. SACZ episodes positively influence flow in hydropower plants in the Central-West, North, and Northeast regions, while inhibiting precipitation in the South as their effects shift northward, away from the basins. For instance, the Paranaíba River basin in the Northeast shows a correlation of 0.55 with SACZ episodes, and the Paraopeba River basin located between the Southeast and Central-West Regions, presents a correlation of 0.57. Notable SACZ-related correlations are also observed in the Grande, Paranaíba, and Baixo Paraná basins, with values exceeding 0.3 and increasing towards the South, reaching over 0.5 for Baixo Paraná and 0.6 for Grande and Paranaíba basins. Conversely, the Araguaia-Tocantins basin in the North exhibits one of the highest correlations, at 0.69. Atmospheric blocking events, in turn, are positively correlated with river flow in the South, particularly in the Uruguai and Jacuí basins, which exhibit the highest correlation values. However, they produce a negative correlation in basins of other regions, as their associated high-pressure systems inhibit atmospheric dynamics, reduce precipitation, and prevent the advance of cold fronts, concentrating precipitation in Southern areas. The results reveal a decline in river flow across most hydropower plant areas, posing risks to Brazil’s electricity production, with potential impacts on the country’s Gross Domestic Product (GPD). SACZ and atmospheric blocking events significantly influence river flow, especially in the power plants of the Central-West, North, and Northeast regions. Developing indices for these atmospheric phenomena offers valuable insights into regional water availability, supporting strategies to mitigate risks from shifting precipitation regimes across Brazil’s diverse climates and biomes.

How to cite: Esposte Coutinho, P., Sancho, L., da Fonseca Aguiar, L., Victalino Galves, V. L., Zanandrea, F., and Cataldi, M.: Impacts of Atmospheric Phenomena on River Flow and Hydropower Stability in Brazil, EGU General Assembly 2025, Vienna, Austria, 27 Apr–2 May 2025, EGU25-12052, https://doi.org/10.5194/egusphere-egu25-12052, 2025.

EGU25-13453 | ECS | Posters on site | CL3.1.1

Seasonality of Heatwaves in Central Europe: Insights from Dynamical Systems Theory and Weather Regimes 

Ines Dillerup, Alexander Lemburg, Sebastian Buschow, and Joaquim Pinto

Heat extremes have severe impacts on human health, economies, and ecosystems. In particular in Europe, heatwaves are expected to become more frequent and intense with climate change, making it essential to understand and quantify the key factors driving these events, such as soil moisture deficits and atmospheric circulation. Further, global warming is likely not only to increase the frequency and intensity of heatwaves in the summer, but also in early autumn, highlighting the need to explore seasonal variations in their drivers.

We analyze heatwaves in Central Europe (45–55°N, 4–16°E) in the historical period (1950-2023) by quantifying atmospheric persistence and exploring the link between surface temperatures and atmospheric circulation patterns using dynamical system theory. This approach is further contextualized by an analysis of weather regimes representing the low-frequency variability of the atmosphere over the North Atlantic and Europe. Using ERA5 reanalysis data, we examine intra-seasonal variations of heatwaves during the extended summer months (May–September). Our results show an anomalously strong link between atmospheric circulation and surface temperatures on heatwave days. In July and August, an anomalously high persistence of the atmospheric circulation is found on heatwave days, associated with an enhanced frequency of Scandinavian and European blocking weather regimes. Moreover, we investigate additional drivers of heatwaves such as soil moisture, and examine the life cycle of heatwaves.

How to cite: Dillerup, I., Lemburg, A., Buschow, S., and Pinto, J.: Seasonality of Heatwaves in Central Europe: Insights from Dynamical Systems Theory and Weather Regimes, EGU General Assembly 2025, Vienna, Austria, 27 Apr–2 May 2025, EGU25-13453, https://doi.org/10.5194/egusphere-egu25-13453, 2025.

EGU25-15158 | ECS | Posters on site | CL3.1.1

Role of the Siberian Summer Cold Wave in Intensifying East Asian Summer Precipitation 

Kwang-hee Han, Baek-Min Kim, Ho-Young Ku, Hayeon Noh, Jee-Hoon Jeong, and Sung-Ho Woo

In this study, we clarify the role of a distinguished weather pattern over Siberia that has contributed to intense summer precipitation across East Asia, particularly in recent decades. This weather pattern, termed the Siberian Summer Cold Wave (SSCW), is defined through rigorous criteria and retrospective case selection. SSCW is characterized by the rapid influx of cold air from the Siberian region into East Asia during summer, which is associated with an increase in the potential temperature gradient, leading to the development of precipitation. Since the early 2000s, the frequency of SSCW events has increased, coinciding with a rise in severe precipitation events, underscoring its significance. Although SSCW has played a crucial role in influencing precipitation in East Asia, previous studies have predominantly focused on mechanisms related to heavy rainfall occurring in southern regions of East Asia. Consequently, there has been a relative lack of research investigating systems contributing to heavy precipitation from the north. This study provides a comprehensive analysis of SSCW events and elucidates their precipitation characteristics, positioning SSCW as a pivotal precipitation pattern within the East Asian summer climate. Our findings highlight the need for continued research to better understand SSCW dynamics and effectively mitigate associated risks.

How to cite: Han, K., Kim, B.-M., Ku, H.-Y., Noh, H., Jeong, J.-H., and Woo, S.-H.: Role of the Siberian Summer Cold Wave in Intensifying East Asian Summer Precipitation, EGU General Assembly 2025, Vienna, Austria, 27 Apr–2 May 2025, EGU25-15158, https://doi.org/10.5194/egusphere-egu25-15158, 2025.

EGU25-16474 | Orals | CL3.1.1

Contemporary Megadrought on Easter Island (Rapa Nui) since 2010  

Nathan Steiger and Eden Markovitz

Since 2010 Easter Island (Rapa Nui) has experienced an exceptional decadal-scale megadrought. Observations show a significant and unusual decrease in precipitation on Rapa Nui: every year from 2010-2023 has had lower precipitation than the average from 1979-2009, resulting in an average precipitation that is 67% of normal. This reduction in precipitation coincides with decadal-scale climate shifts: an intensification of the South Pacific Anticyclone and its shift closer to the island along with a poleward shift of the Southern Hemisphere storm track. Each of these phenomena are trending near or beyond their most extreme values since 1979 and each of them are directly linked to reduced precipitation on Rapa Nui. These trends are shown to continue into mid-century under an intermediate greenhouse gas emissions scenario. We therefore argue that the current megadrought is best explained by anthropogenic climate change and that Rapa Nui may be entering a fundamentally drier climate state.

How to cite: Steiger, N. and Markovitz, E.: Contemporary Megadrought on Easter Island (Rapa Nui) since 2010 , EGU General Assembly 2025, Vienna, Austria, 27 Apr–2 May 2025, EGU25-16474, https://doi.org/10.5194/egusphere-egu25-16474, 2025.

The El Niño-Southern Oscillation (ENSO) influences the global temperature and precipitation patterns. Generally, the ENSO influence has been related to its amplitude. We use information-theoretic generalization of Granger causality to observe the causal influence of phases of ENSO oscillatory components on scales of precipitation variability in Yangtze and Yellow River basins, with a focus on its quasi-oscillatory dynamics spanning various timeframes. We find that the ENSO quasi-biennial component has a causal effect on precipitation variability on and around the annual scale, while the amplitude of the precipitation quasi-biennial component is controlled by low-frequency ENSO components with periods of around 6 years. This cross-scale causal information flow is particularly noticeable in the Yellow River basin, whereas in the Yangtze River basin, the ENSO amplitude has the greatest causative effect. The provided results indicate that different components of ENSO dynamics should be used to predict precipitation in different regions.

This study is supported by the Czech Academy of Sciences, Praemium Academiae awarded to M. Paluš.

Latif, Y., Fan, K., Wang, G., & Paluš, M. (2024). Cross-scale causal information flow from the El Niño–Southern Oscillation to precipitation in eastern China. Earth System Dynamics, 15(6), 1509-1526

How to cite: Latif, Y., Fan, K., Wang, G., and Paluš, M.: A cross-scale causal information flow from the El Niño–Southern Oscillation to precipitation in the Yangtze and Yellow River basins, EGU General Assembly 2025, Vienna, Austria, 27 Apr–2 May 2025, EGU25-17086, https://doi.org/10.5194/egusphere-egu25-17086, 2025.

Rainfall intensification due to planetary warming is increasingly impacting nearly all regions of the globe. South America is no exception with unprecedented landslides (São Sebastião, February 2023) and river catchment-scale flooding (Rio Grande do Sul, September 2023 and May 2024) being observed more frequently. Over South America, tropical-extratropical cloud bands in the South Atlantic Convergence Zone (SACZ) produce most of the rainy season precipitation. Droughts can occur in years with fewer SACZ events while intensely raining clusters within the cloud bands can trigger flash floods and landslides. Here, we diagnose the impacts of future precipitation intensification on the frequency and intensity of SACZ tropical-extratropical cloud bands using the first-of-its-kind continental-scale convection-permitting climate simulation. While cloud bands will see a future 20-30\% decrease in their frequency, intense events with a likelihood of 1-in-5 in the present day will become more frequent in the future, with 3-in-5 likelihood, increasing the risk of heavily raining clusters. This tripling in intense cloud band frequency results from intensified mesoscale rainfall structures within the continental-scale cloud bands, a risk better captured by convection-permitting models. Geographically, the intensification of mesoscale rainfall structures is most prevalent in the highly populated coastal regions of Southeastern and Southern Brazil, areas already highly exposed to extreme weather events, floods, and landslides. This increased risk significantly exceeds the projections from traditional climate models with convection parametrizations and highlights the growing risk of intense cloud-band rainfall over South America under warming. 

How to cite: Zilli, M., Hart, N., Halladay, K., and Kahana, R.: Increased frequency of intense South Atlantic Convergence Zone-related cloud band events by 2100 in convection-permitting simulation , EGU General Assembly 2025, Vienna, Austria, 27 Apr–2 May 2025, EGU25-17349, https://doi.org/10.5194/egusphere-egu25-17349, 2025.

EGU25-17361 | ECS | Orals | CL3.1.1

Changes in the Timing of the Thermal Spring Season Across Finland and Its Turning Point Over the Past Six Decades. 

Sadegh Kaboli, Ville Kankare, Ali Torabi Haghighi, Cintia Bertacchi Uvo, and Elina Kasvi

Thermal season variations contribute to shaping natural hydrological processes in Nordic regions. Although changes in seasonal hydro-climatological factors due to global warming at both global and regional scales have been widely studied, there remains a limited understanding of the timing characteristics of these seasonal shifts. Given the critical role of the annual temperature transition from the cold to the warm phase in controlling hydrological events in Nordic regions, this research focuses on the temporal variation of the thermal spring season across Finland. We investigate how the timing of the thermal spring has changed over the past six decades across Finland and how the changes vary spatially. We also identify temporal turning points in these transitions.

This research utilizes high-resolution (1x1 km) daily mean temperature data over Finland, spanning past six decades, publicly provided by the Finnish Meteorological Institute. Several indices were calculated based on a fixed thermal threshold to track both spatial and temporal variations in the thermal spring season, and to identify possible trends and correlations using various statistical methods. Temporal changes in the indices were analyzed using Mann-Kendall test, while the Theil-Sen estimator was applied to determine the slope of the observed trends. To mitigate the influences of potential autocorrelation in the dataset, the Trend-Free Pre-Whitening (TFPW) method was employed. For spatial analysis, Empirical Orthogonal Function (EOF) decomposition was used to identify dominant spatial pattens. To separate significant physical signals from noise in the estimated spatial patterns, the North significance test was used. Furthermore, the Pettitt test was applied to assess the turning points in spatial behavior of timing indices. By analyzing an extensive dataset covering Finland, coupled with a long data period, this research provides valuable insights into temporal shifts in the thermal spring season and their potential connections to other hydro-climatological factors.

How to cite: Kaboli, S., Kankare, V., Torabi Haghighi, A., Bertacchi Uvo, C., and Kasvi, E.: Changes in the Timing of the Thermal Spring Season Across Finland and Its Turning Point Over the Past Six Decades., EGU General Assembly 2025, Vienna, Austria, 27 Apr–2 May 2025, EGU25-17361, https://doi.org/10.5194/egusphere-egu25-17361, 2025.

EGU25-17426 | ECS | Posters on site | CL3.1.1

Variability of spring temperature extremes in Europe 

Sophie Häfele, Johanna Baehr, Daniel Krieger, and Leonard Borchert

Spring in particular can carry impact-relevant extreme events over Europe, such as late frost or early summer heat. However, the dominating mechanisms and drivers of such temperature extremes in European springtime are currently not well understood. Across all seasons, one mechanism relevant for temperature extremes in Europe is atmospheric blocking. Unlike winter, where blocking is predominantly related to cold spells, and summer, where blocking is predominantly related to warm spells, spring is a transition period during which both cold and warm spells might be connected to blockings.

While this transition has been statistically analyzed before, available time series were limited, as was, in turn, the spatial analysis. Here, using ERA-5 and E-OBS for the period 1950-2023, with more than doubling the time series, we confirm existing literature on the statistics and the change of blocking patterns throughout the spring season, although our work indicates more early spring warm spells than previously found. The greater data availability also allows the spatial division into blocking regions, allows us to characterize the sensitivity of warm spell frequency to blocking location. We show that blockings over Scandinavia and the UK lead to Northern European warm spells. Comparing springtime occurrences of blocked and unblocked warm spell days shows that in Northern Europe, warm spells often occur simultaneously with blocking, whereas in Southern Europe, warm spells less frequently occur simultaneously with blocking. We identify temporal clusters of preferred occurrences of blocked or unblocked warm spell occurrences in Northern and Southern Europe to trace their seasonal drivers, thus indicating the potential for seasonal predictions of spring warm spells over Europe.

How to cite: Häfele, S., Baehr, J., Krieger, D., and Borchert, L.: Variability of spring temperature extremes in Europe, EGU General Assembly 2025, Vienna, Austria, 27 Apr–2 May 2025, EGU25-17426, https://doi.org/10.5194/egusphere-egu25-17426, 2025.

EGU25-19094 | Posters on site | CL3.1.1

Synoptic and Large-Scale Drivers of Extreme Precipitation Events in the Western Himalaya 

Pranab Deb, Priya Bharati, and Kieran Hunt

This study investigates the synoptic and large-scale atmospheric circulation associated with extreme precipitation events (EPEs) that occurred during the period 1979-2023 in the Western Himalaya (WH). These EPEs are defined as days when the mean precipitation exceeds the 99th percentile threshold of daily precipitation for each month from 1979 to 2023 across all grid points in the Indian Himalayan region (Karakoram, WH, Central and Eastern Himalaya). The weather regimes associated with these events are then classified using K-means clustering of geopotential height at 500hPa and vertical integrated moisture flux components. We have identified six clusters and determined that EPEs linked to four of these clusters predominantly occur during the monsoon months, whereas the other two clusters are characterized by WD (Western Disturbance)-driven EPEs that appear in the winter months. The EPEs in cluster-1 are mainly driven by the low-pressure system (LPS) in the Bay of Bengal and Rossby-wave breaking (atmospheric blocking by Siberian anticyclone) in the upper-atmosphere along with the midlatitude forcing of North Pacific Oscillation (NPO) (positive phase). The EPEs in clusters 2 and 5 resulted from a break in the monsoon caused by the northward displacement of LPS close to the Himalayan foothills, along with an omega type of blocking with a strong anticyclone over the WH, which is located between two cyclones. The midlatitude forcings of the negative phase of NPO and the negative phase of ENSO during EPEs in clusters 2 and 5, respectively, support the occurrence of EPEs in the WH. The EPEs in cluster-6 occurred due to incursion of a WD into the WH, along the northward migration of LPS in the break-monsoon phase over the WH; tropical forcing of positive phase of ENSO promotes the EPEs in this cluster. The WDs-driven clusters (cluster-3 and 4) mainly support higher amount of precipitation over the WH, and account for 80-95% of mean precipitation over the region, primarily driven by subtropical jet stream dynamics and upper-level trough over the WH. The EPEs in cluster-3 are linked with positive phase of North Atlantic Oscillation, while weaker Tibetan anticyclonic circulation is observed in the cluster-4 compared to cluster-3.

How to cite: Deb, P., Bharati, P., and Hunt, K.: Synoptic and Large-Scale Drivers of Extreme Precipitation Events in the Western Himalaya, EGU General Assembly 2025, Vienna, Austria, 27 Apr–2 May 2025, EGU25-19094, https://doi.org/10.5194/egusphere-egu25-19094, 2025.

We show that the wintertime (December-January-February) North Pacific jet in ERA5 has shifted northwards over the satellite-era (1979-2023) at a faster rate than any of the state-of-the-art CMIP6 coupled climate models used in this study. Differences in tropical sea surface temperature (SST) trends can only partially explain the discrepancy in jet trends between models and observations and a small minority of simulations forced with observed SSTs match the magnitude of the observed jet trend. However, analysis of longer-term jet variability in reanalysis suggests that the jet trend has not clearly emerged from multi-decadal internal climate variability. Consequently, it is unclear whether the difference in observed and modelled jet trends arises due to differing responses to anthropogenic forcing or overly weak long-term internal variability in models. These results have important implications for future climate projections for North America and motivate further research into the underlying causes of long-term jet trends.

How to cite: Patterson, M. and O'Reilly, C.: Climate models struggle to simulate observed North Pacific jet trends, even accounting for tropical Pacific sea surface temperature trends, EGU General Assembly 2025, Vienna, Austria, 27 Apr–2 May 2025, EGU25-19419, https://doi.org/10.5194/egusphere-egu25-19419, 2025.

EGU25-82 | Posters on site | CL3.1.2

Causal Inference of Root Zone Soil Moisture Performance in Drought 

Shouye Xue and Guocan Wu

Soil moisture plays a crucial role in surface hydrological processes and land–atmosphere interactions. It can influence vegetation growth directly, serving as a significant indicator for monitoring agricultural drought. However, spatially continuous datasets of root zone soil moisture rely on model simulations, introducing numerous uncertainties associated with model parameters and input data. Currently, multiple soil moisture products derived from model simulations exist, but their representation at spatial scales remains unclear. Moreover, their abilities to express soil–atmosphere and soil–vegetation interactions within land–atmosphere coupling are not understood, leading to divergent inclinations toward drought. This study investigates the performance of five soil moisture products, European Centre for Medium-Range Weather Forecasts Reanalysis v5-Land (ERA5-Land), Global Land Data Assimilation System (GLDAS), Global Land Evaporation Amsterdam Model (GLEAM), The Modern-Era Retrospective analysis for Research and Applications, Version 2 (MERRA-2), and SoMo.ml, under drought conditions. The bias, correlation, and difference of standard deviation (STDD) were calculated between these products and the observations from International Soil Moisture Network stations. The causal probability of soil, meteorological, and agricultural drought was calculated using the causal-effect Peter and Clark (PC) Momentary Conditional Independence (MCI) method to evaluate the data propensity of these products. ERA5-Land and SoMo.ml gave a similar performance with the highest accuracy, which was attributed to the use of the same meteorological forcing data. The biases of soil moisture from these two products at surface, middle and deep depths against station observations are below 0.1 m3/m3., and the STDD is within 0.05 m3/m3. The accuracy of GLDAS is comparatively lower, characterized by lower correlations (below 0.2 for deeper layers) and high bias (above 0.15 and 0.2 for middle and deep layers, respectively). This discrepancy could be attributed to substantial biases in the precipitation forcing data. ERA5-Land shows higher spatial resolution and greater spatial heterogeneity, whereas MERRA-2 underperformed in this area. MERRA-2 had the strongest connection to agricultural drought, with a propensity probability of 0.477. Conversely, SoMo.ml demonstrates the strongest connection to meteorological drought, with a propensity probability of 0.234. Due to the errors in simulated and observational data during the MERRA data assimilation, substantial biases in the soil moisture data, and low accuracy in meteorological forcing of GLDAS, there was no clear causal relationship between soil moisture drought and meteorological drought between these two products. These findings provide recommendations for the use of soil moisture products in drought research.

How to cite: Xue, S. and Wu, G.: Causal Inference of Root Zone Soil Moisture Performance in Drought, EGU General Assembly 2025, Vienna, Austria, 27 Apr–2 May 2025, EGU25-82, https://doi.org/10.5194/egusphere-egu25-82, 2025.

EGU25-724 | ECS | Orals | CL3.1.2

Evaluation of multiple bias-adjustment methods for estimating heat stress conditions in southern South America 

Rocio Balmaceda-Huarte, Ana Casanueva, and Maria Laura Bettolli

Regional Climate Models (RCMs) are valuable tools capable of providing finer-scale climate information, which is particularly relevant in regions like southern South America (SA), where the complex topography and the land-coast contrast strongly influence climate. Despite this, RCMs present systematic errors that need to be corrected for their proper use in impact studies, especially those relying on climate impact indices exceeding specific thresholds, such as heat-stress conditions. In these cases, bias adjustment (BA) methods are commonly used. These methods link climate model historical simulations and observations through the calibration of transfer functions that are subsequently applied to adjust systematic errors in the simulated distribution. In this study, different BA methods were evaluated for southeastern South America (SESA) with a special focus on the estimation of multivariate heat-stress indices, namely the wet bulb temperature and a simplified version of the wet bulb globe temperature. Both indices are based on temperature and humidity variables. The BA methods were calibrated using the historical CORDEX-CORE RCM simulations for the SA domain and the MSWX high-resolution observation dataset. The assessment accounted for: a) two adjustment strategies for estimating the bias-corrected indices (direct and indirect); b) comparison of univariate and multivariate BA methods; c) evaluation of trend-preserving and non-trend-preserving methods. In all cases, BA methods were trained and validated with a cross-validation scheme in the austral summer season during the historical period.  

Results show that under the indirect approach (i.e. adjusting individual variables involved in the indices calculation), all univariate methods presented similar performance, with no remarkable differences between trend- and non-trend-preserving methods. Notwithstanding, in this set up, the multivariate method considerably improved the representation of the thermal indices. This improvement was evident for the RegCM4.7 simulations, where the calculation of the indices using the individually adjusted variables amplified the errors. The lowest biases were found under the direct approach (i.e. adjusting indices directly),  although performance among methods varied depending on the heat stress index analyzed. 

Overall, this study provides insight into the suitability of the BA methods for estimating multivariate thermal indices and paves the way for future assessments of heat stress conditions over SA.

Acknowledgement: A.C. acknowledges support from project PROTECT (PID2023-149997OA-I00) funded by MICIU/AEI/10.13039/501100011033 and ERDF A way of making Europe.

How to cite: Balmaceda-Huarte, R., Casanueva, A., and Bettolli, M. L.: Evaluation of multiple bias-adjustment methods for estimating heat stress conditions in southern South America, EGU General Assembly 2025, Vienna, Austria, 27 Apr–2 May 2025, EGU25-724, https://doi.org/10.5194/egusphere-egu25-724, 2025.

The current work appraises the temporal and spatial discrepancies of temperature for the historical data (1951-2020) for the Lesser Himalayan Region. The temperature data has been obtained from the Indian Metrological Department (IMD), Pune. The 70-year data has been analysed using the temperature indices recommended by experts on Climate Change Detection and Indices (ETCCDI) and Expert Team on Sector-Specific Climate Indices (ET-SCI) for the divergence in the temperature using extreme climate indices. These indices will assimilate the climate prognosis and foreseen weather-space-relevant atmospheric disruptions leading to outright know-how of alterations in the temperature pattern in the developing Lesser Himalayan Region over a century. The study focuses on understanding the progression of dynamic temperature changes using certain key indices such as Summer days, Tropical Nights, Warm nights/days, and cold nights/days to detect patterns and trends in temperature behaviour across regions. The findings highlight the region’s susceptibility to rising temperature trends, a growing frequency of extreme heat events and their connection with extreme events and climate anomalies. The results will attempt to find out the effect of dynamic temperature changes occurring spatially and temporally in the region professing the impact of alterations in temperature patterns and will also figure out the atmospheric dynamics robustly occurring under what circumstances and time of the year and at what specific spots. Ultimately, the research contributes to a comprehensive understanding of temperature variability and its implications for the Lesser Himalayan Valley, offering a strong base for focused mitigation and adaptation strategies in the era of abrupt climate change and rapid urbanization.

How to cite: Gupta, S., Mishra, P. K., and Khare, D.: Navigating through Climatic Oscillations and Atmospheric Drift using Temperature Indices on Historical Data for a Lesser Himalayan Region, EGU General Assembly 2025, Vienna, Austria, 27 Apr–2 May 2025, EGU25-1034, https://doi.org/10.5194/egusphere-egu25-1034, 2025.

According to the Sixth Assessment Report of the IPCC, the global surface temperature has been higher in each of the last 4 decades compared to any previous decade since 1850. With the ongoing intensification of global warming, the intensity and frequency of extreme drought events have significantly increased. Based on the CN05.1 observational dataset and the results of five regional simulations from RegCM4.0 under future warming scenarios from the CORDEX (Regional Climate Downscaling Experiment), extreme dry periods are characterized by the number of consecutive dry days (CDD index). The Generalized Extreme Value (GEV) distribution is used to model the probability distribution of the CDD index in China to assess the spatiotemporal variations of extreme dry periods. By analyzing the spatiotemporal trends of the CDD index in China over the past 60 years and utilizing simulation techniques to assess the probability distribution characteristics of the CDD index, the study incorporates the Taylor diagram to evaluate the simulation performance of RegCM4.0. Finally, projections of the temporal and spatial distribution of the CDD index in China under a stable 2°C warming scenario, as well as changes in the ensemble mean of the five regional simulations relative to historical climate conditions, are presented.

The results indicate that the spatial distribution of the CDD index in China gradually decreases from northwest China and the Qinghai-Tibet Plateau to the eastern coastal areas. Over the past 60 years, the CDD index has decreased in northwest China and the Qinghai-Tibet Plateau, while it has increased in the eastern coastal regions, Northeast China, and North China, showing significant trends in these areas. The eastern coastal areas exhibit the lowest CDD index and minimal inter-annual variability, while northwest China and the Qinghai-Tibet Plateau show the highest CDD index values and the most significant inter-annual variability. According to the Taylor diagram, under the RCP4.5 emission scenario, the CDD index from simulations using the RegCM4.0 regional climate model, corrected by the Quantile Delta Mapping (QDM) method, shows better performance than uncorrected simulations. The corrected model results are strongly correlated with the CN05.1 observational dataset, with minimal error. Under a 2°C steady warming scenario, Generalized Extreme Value (GEV) analysis of the CDD index and return periods suggests that extreme dry periods will increase in northwest China, the Qinghai-Tibet Plateau, and Northeast China, with a growing disparity in extreme dry periods between the northern and southern regions as the return period increases. Multi-model ensemble projections for future periods under a 2°C stable warming scenario indicate a decreasing trend in the annual mean CDD index in northern China and an increasing trend in southern China.

How to cite: Feng, T.: Projection of Spatiotemporal Changes in the Probability Distribution of Extreme Dry Periods in China under a 2°C Stable Warming Scenario, EGU General Assembly 2025, Vienna, Austria, 27 Apr–2 May 2025, EGU25-1922, https://doi.org/10.5194/egusphere-egu25-1922, 2025.

Compared to increasingly clear responses of temperature and precipitation to anthropogenic climate change, forced changes in relative humidity (RH) remain largely elusive. This is mainly because climate models failed to capture sharp decline in RH shown in both observations and reanalysis data. Despite growing attention to plausible drivers for the observation—model discrepancy, none of the theoretical reconstructions or dedicatedly-designed simulations could reproduce the drying as strong as observed.

We here propose another possibility, that is, observations/reanalysis (incl. HadISDH and ERA5) are wrong due to overlooked data inhomogeneity arising from region-wide changes in observing instruments, as showcased in China in the 2000s. Such simultaneous changes in instruments failed the detection of ‘break-points’ by automated methods via a neighbor-comparison scheme. By getting access to detailed meta data information provided by the National Meteorological Information Center of China, we now could adjust for the inhomogeneity through combining automated methods and manual checks. The newly homogenized data corrects previously estimated strong and significant drying trends into weak and insignificant ones across humid China, in consistent with most of CMIP and single model initial condition large ensemble (SMILE) simulations.

The homogenized RH dataset is then used for attribution and projection of forced changes in RH and associated compound events (extreme wet-bulb temperature and VPD) over Eastern China, within a Bayesian statistical framework. We find historical forcings of greenhouses gases and aerosols on RH nearly counteracted each other, leading to a weak and non-detectable regional trend. The constrained projection shows that raw CMIP6 projections underestimated the magnitude of forced drying of RH. The Bayesian constraint narrows the uncertainty range of projected RH changes by around ~30%, and effectively eliminates the possibly of wetting response at late 21st century. Given the stronger-than-expected drying of RH, raw projections slightly overestimate future increases in extreme heat stress but substantially underestimate future rises in extreme VPD accordingly, with the inter-model spread in projections narrowed by 30~40% conditioned on the homogenized historical observational series.

How to cite: Chen, Y.: Projection of forced changes in regional relative humidity and associated compound extremes constrained by homogenized observations, EGU General Assembly 2025, Vienna, Austria, 27 Apr–2 May 2025, EGU25-2410, https://doi.org/10.5194/egusphere-egu25-2410, 2025.

EGU25-3496 | ECS | Posters on site | CL3.1.2

A Global-to-Regional Framework for Assessing Precipitation Inhomogeneity and Its Connection to Extreme Events 

Shengyuan Liu, Jeremy Cheuk-Hin Leung, Jianjun Xu, Shifei Tu, and Banglin Zhang

Climate change has led to significant shifts in precipitation patterns, with spatial inhomogeneity emerging as a key feature, which is directly related to extreme flooding or drought events. A quantitative method estimating how extreme events affect global precipitation inhomogeneity is crucial for monitoring, understanding, and predicting the role of precipitation variability in driving regional or global climate extremes under ongoing climate change.

In this presentation, we introduce a novel but simple framework that is able to (1) quantify the spatial inhomogeneity of global precipitation and its variability, (2) estimate contributions of different precipitation intensities and (3) assess contributions of regional disparities. Based on this framework, we show that the inhomogeneity of global annual precipitation has increased consistently across multiple datasets in the satellite era (1979–2021), attributed to the increasing area of both extremely high precipitation (over 2000mm per year) and low precipitation (under 250mm per year). Based on the Global Precipitation Climatology Project (GPCP) dataset, the increase in inhomogeneity of global precipitation is primarily contributed by the intra-regional inhomogeneity component of Northern Hemispheric tropical ocean (+60.2%) and Southern Hemispheric tropical ocean (+40.3%), and is partly offset by the inter-regional inhomogeneity component of Northern Hemispheric mid-latitude ocean (-4.5%). Further applied to high-resolution datasets, our framework is particularly effective in revealing the impacts of isolated extreme events, which are often obscured by surrounding normal precipitation or dismissed as noise in global average calculations.

How to cite: Liu, S., Leung, J. C.-H., Xu, J., Tu, S., and Zhang, B.: A Global-to-Regional Framework for Assessing Precipitation Inhomogeneity and Its Connection to Extreme Events, EGU General Assembly 2025, Vienna, Austria, 27 Apr–2 May 2025, EGU25-3496, https://doi.org/10.5194/egusphere-egu25-3496, 2025.

EGU25-3609 | Posters on site | CL3.1.2

Three-dimensional insight into heat waves in EURO-CORDEX regional climate models 

Ondřej Lhotka, Eva Plavcová, and Jan Kyselý

Heat waves are considered one of the most hazardous climate extremes in relation to climate change. To better understand their driving mechanisms in CORDEX regional climate models (RCMs) over Middle Europe, we employ a recently introduced approach to study heat waves as three-dimensional phenomena (Lhotka & Kyselý 2024). We classify them based on their vertical cross-sections of temperature anomalies into near-ground, lower-tropospheric, mid-tropospheric, and vertically extensive types. We show that even driven by the reanalysis, most RCMs tend to simulate substantially more lower-tropospheric heat waves than those located near the surface, which is in contrast to reference data from ERA5. This bias is associated with overly frequent southerly flow that is excessively warm especially at the lower-tropospheric level. We also identify large differences among the RCMs in simulations of near-ground and vertically extensive heat wave types, which are possibly related to deficiencies in links between easterly flow and those heat wave types.

Lhotka, O., Kyselý, J. Three-dimensional analysis reveals diverse heat wave types in Europe. Commun Earth Environ 5, 323 (2024). https://doi.org/10.1038/s43247-024-01497-2

How to cite: Lhotka, O., Plavcová, E., and Kyselý, J.: Three-dimensional insight into heat waves in EURO-CORDEX regional climate models, EGU General Assembly 2025, Vienna, Austria, 27 Apr–2 May 2025, EGU25-3609, https://doi.org/10.5194/egusphere-egu25-3609, 2025.

EGU25-6128 | ECS | Orals | CL3.1.2

Less frequent but more intense summertime precipitation in Finland: results from a convection-permitting climate model 

Laura Utriainen, Meri Virman, Anton Laakso, Jenna Ritvanen, Kirsti Jylhä, and Joonas Merikanto

Changes in short-term precipitation events have significant local impacts of climate change, yet are poorly captured by coarse-resolution global climate models. We analyse the projected changes in warm season precipitation events in Finland from a convection-permitting regional climate model HARMONIE-Climate, operating at 3-kilometer resolution. Realistic modeled precipitation characteristics are verified against multiple observational datasets for 1986–2018, and projected changes in precipitation events are analyzed until 2041–2060 and 2081–2100.

Our results show that all simulations agree on an increase in mean wet hour precipitation intensity and a decrease in the number of wet hours. The proportion of wet hours with respect to the all hours (calculated from the whole area of Finland) decrease from 11–13 % to 9–11 % by mid-century, and further reducing to around 9 % across all simulations and scenarios by late century. We also find that as climate change proceeds, the frequency of precipitation events over 2 mm h⁻¹ increases and the changes become greater for the categories of higher intensities, while lower intensity events become less frequent.

Of particular interest are the projected changes in intensity categories used in alert classification by the Finnish Meteorological Institute, wherein heavy rain is identified at a threshold of 7 mm h⁻¹, and the national alert level for potentially dangerous rainfall is set at 20 mm h⁻¹. According to the simulations, the frequency of such events in Finland will increase greatly as the climate change proceeds and their contribution to overall wet hours increase. In a strong climate change scenario (RCP8.5), extremely heavy precipitation exceeding 20 mm h⁻¹ will become twice to three times as common (three to six times) in 2041–2060 (2081–2100) compared to 1986–2005, while simultaneously the total number of wet hours is projected to decrease by 12–16 % (18–25 %).

How to cite: Utriainen, L., Virman, M., Laakso, A., Ritvanen, J., Jylhä, K., and Merikanto, J.: Less frequent but more intense summertime precipitation in Finland: results from a convection-permitting climate model, EGU General Assembly 2025, Vienna, Austria, 27 Apr–2 May 2025, EGU25-6128, https://doi.org/10.5194/egusphere-egu25-6128, 2025.

EGU25-9550 | Orals | CL3.1.2

Supercells in Europe modelled by a Convection-Permitting Climate Model: Climatological features and future change 

Abdullah Kahraman, Chris Short, Hayley Fowler, and Elizabeth Kendon

Supercells are the rarest type of thunderstorms, well known because of their multi-hazard characteristics in the Great Plains region of the US. These hazards include tornadoes, very large hail, lightning, damaging wind gusts, and/or excessive precipitation resulting in flash floods. However, their spatial footprints are not limited to there, with the whole of the midlatitudes, including Europe, having their share. Little is known about the spatial and temporal distribution of supercells outside the US. In Europe for instance, there are only a few short-term observational studies addressing the topic.

Supercells are characterized by the presence of a mesocyclone, which is a rotating updraft. Using an updraft helicity metric, which aims to extract such mesocyclonic features within a convection-permitting climate model (CPM), we present a supercell climatology for Europe and an assessment of their future changes based on RCP8.5. The climatology is based on a 20-y long hindcast, and  we also assess three further 10-y long simulations: 1) control, 2) mid-century future, and 3) end-of-century future.

Our results show that supercells are more frequent in southern Europe, compared to the north, and predominantly occur in summer. Left-movers, which are conventionally overlooked, but observations suggest can produce as much hazards in Europe (e.g. very large hail), consist of 15% of all supercells. With warming, the frequency increases in the south and to a lesser extent in the north, whilst there are decreases in Central Europe. Finally, we claim that changes in favourable environmental conditions of severe thunderstorms might not directly translate into the changes in severe thunderstorms themselves, highlighting the need for CPMs for assessing hazardous weather extremes at small spatial scales. 

How to cite: Kahraman, A., Short, C., Fowler, H., and Kendon, E.: Supercells in Europe modelled by a Convection-Permitting Climate Model: Climatological features and future change, EGU General Assembly 2025, Vienna, Austria, 27 Apr–2 May 2025, EGU25-9550, https://doi.org/10.5194/egusphere-egu25-9550, 2025.

EGU25-9748 | Posters on site | CL3.1.2

Climatological characteristics and atmospheric circulation associated with 3D heat wave types in European regions 

Zuzana Poppova, Ondrej Lhotka, Jan Stryhal, and Jan Kysely

We evaluate climatological characteristics (temperature anomalies, mean precipitation, and the Climatic Water balance index defined as the difference between potential evapotranspiration and precipitation) and links to atmospheric circulation for three-dimensional (3D) heat wave types in several European regions. Heat waves are classified according to their 3D structure of positive temperature anomalies in ERA5 over 1979–2022 (the satellite period) into near-surface, lower-tropospheric, higher-tropospheric, and omnipresent types (Lhotka & Kyselý 2024, https://www.nature.com/articles/s43247-024-01497-2). The Jenkinson–Collison classification of daily mean sea level pressure patterns is used to identify circulation types with increased frequency during the individual heat wave types compared to the June–September climatology. We show large differences in surface temperature anomalies and dryness among the heat wave types, as well as different links to circulation patterns. The differences are most pronounced between near-surface and higher-tropospheric heat waves and point to processes important for their onset and development. The analysis contributes to better understanding the interrelationships between heat waves, atmospheric circulation, and other driving mechanisms.

How to cite: Poppova, Z., Lhotka, O., Stryhal, J., and Kysely, J.: Climatological characteristics and atmospheric circulation associated with 3D heat wave types in European regions, EGU General Assembly 2025, Vienna, Austria, 27 Apr–2 May 2025, EGU25-9748, https://doi.org/10.5194/egusphere-egu25-9748, 2025.

EGU25-9815 | Posters on site | CL3.1.2

Links to atmospheric circulation vary for individual heat wave types in Middle Europe 

Jan Kysely, Zuzana Poppova, Jan Stryhal, and Ondrej Lhotka

We evaluate links to atmospheric circulation for three-dimensional heat wave types in Middle Europe over 1979–2022. Heat waves are classified according to their vertical structures of temperature anomalies in ERA5 into near-surface (HWG), lower-tropospheric (HWL), higher-tropospheric (HWH), and omnipresent (HWO) types. Jenkinson–Collison classification of daily mean sea level pressure patterns is used to identify circulation types (CTs) with increased frequency for the individual heat wave types. In all heat wave types, CTs with southerly flow are more common compared to the June–September climatology but differences are found for other groups of CTs. In HWG, the CT occurring most frequently is indeterminate flow, corresponding to a little pronounced pressure field with no clear role of anticyclonic vorticity or flow direction. The expected pattern of increased anticyclonic and decreased cyclonic flow is clearly manifest only for HWH, while it is reversed during HWG. The role of warm advection increases for the other two heat wave types, HWL and HWO. Anticyclonic circulation supporting gradual warming is important mainly before the onset of most heat wave types, except for HWH. The reported differences reflect diverse processes leading to the various heat wave types, with the dominant roles of anticyclonic vorticity for HWH and land–atmosphere coupling under little pronounced circulation patterns, following previous drying, for HWG.

How to cite: Kysely, J., Poppova, Z., Stryhal, J., and Lhotka, O.: Links to atmospheric circulation vary for individual heat wave types in Middle Europe, EGU General Assembly 2025, Vienna, Austria, 27 Apr–2 May 2025, EGU25-9815, https://doi.org/10.5194/egusphere-egu25-9815, 2025.

EGU25-10118 | ECS | Orals | CL3.1.2

Generalised Drought Index: a novel Multi-Scale Daily Drought Index 

João Careto, Rita Cardoso, Ana Russo, Daniela Lima, and Pedro Soares

Droughts are among the most impactful and complex climatic phenomena, widely recognised as pervasive natural hazards posing serious challenges to ecosystems and societies. Assessing droughts is challenging due to difficulties in accurately determining their spatial and temporal dimensions. This study introduces a novel daily drought index, the Generalized Drought Index (GDI), calculated using the Iberian Gridded Dataset (1971–2015) with precipitation and precipitation minus potential evapotranspiration data. The daily resolution enables the identification of flash droughts, which proves highly valuable for future research efforts.

A comparative analysis was conducted against the daily Standardised Precipitation Index (SPI), the Standardised Precipitation Evapotranspiration Index (SPEI), and a Z-Score standardisation. Seven accumulation periods (7, 15, 30, 90, 180, 360, 720 days) were evaluated, with focus on direct comparison amongst indices in their ability to conform to the standard normal distribution. Results showed that GDI, SPI, and SPEI follow the normal standard distribution, while Z-Score depends on the data's original distribution. Using the Distribution Added Value (DAV) technique, GDI demonstrated gains over other indices, with DAV up to 35% compared to SPI and SPEI. The spatial extent of the 2004–2005 drought was also analysed, with GDI, SPI, and SPEI providing similar results, while Z-Score exhibited limitations at shorter accumulation periods.

GDI was also applied to the Coordinated Regional Climate Downscaling Experiment for Europe (EURO-CORDEX), using data from 13 regional climate models (1971–2100) for RCP2.6, RCP4.5, and RCP8.5. An ensemble-based index approach was considered using all models and the same accumulation periods. Findings show Iberia's high vulnerability to climate change, with increases in drought severity, frequency, and duration, especially by mid-century. Under RCP2.6, changes were observed early in the century. RCP4.5 projects similar impacts in mid and end century, with up to 30 additional events at shorter timescales and 50 extra moderate drought days for longer periods. RCP8.5 projects dramatic increases, with over 50 severe events at shorter scales and durations exceeding 100 days for longer periods by the century's end. These results highlight the urgent need for mitigation policies and targeted adaptation strategies to address water challenges and minimize drought impacts in Iberia.


This work was funded by the Portuguese Fundação para a Ciência e a Tecnologia (FCT) I.P./MCTES through national funds (PIDDAC) – UID/50019/2025 and LA/P/0068/2020 (https://doi.org/10.54499/LA/P/0068/2020).

How to cite: Careto, J., Cardoso, R., Russo, A., Lima, D., and Soares, P.: Generalised Drought Index: a novel Multi-Scale Daily Drought Index, EGU General Assembly 2025, Vienna, Austria, 27 Apr–2 May 2025, EGU25-10118, https://doi.org/10.5194/egusphere-egu25-10118, 2025.

EGU25-13800 | Orals | CL3.1.2

Assessing Extreme Climate Indices for Precipitation in the Azores: Insights from CMIP6 Climate Projections 

Maria Meirelles, Fernanda Carvalho, Diamantino Henriques, Helena Vasconcelos, Patrícia Navarro, and João Porteiro

Extreme Climate Indices for precipitation are imperative climate indicators, especially in small islands such as the Azores, which are highly susceptible to climate variability and change. This study uses results from the Coupled Model Intercomparison Project Phase 6 (CMIP6) to evaluate historical and projected trends in precipitation related extreme climate indices within the Azores and spatial patterns extensive to the Northeast Atlantic region. Using a robust ensemble of climate models, this work analyzes the annual total precipitation, the annual number of wet days (≥20 mm/day) (R20) and the annual number of consecutive dry days (< 1mm) (CDD), examining their historical accuracy and future projections under different Shared Socioeconomic Pathways (SSPs).

Historically, CMIP6 simulations demonstrated a reasonable alignment with ERA5 reanalysis data for total precipitation, with a insignificant bias of −6.3 ± 123.7 mm for the Azores during the 1961–1990 baseline period. The models captured spatial variability across the Northeast Atlantic, although some localized discrepancies persisted. While annual precipitation projections show no significant changes, CDD and R20 mm increases are small but very likely for the SSP 5 8.5 scenario.

Projections under SSP scenarios reveal nuanced changes in precipitation patterns. The total annual precipitation exhibits small positive trends under SSP1-2.6 and SSP2-4.5 scenarios, with rates of 3.79 mm/decade and 2.11 mm/decade, respectively, while SSP5-8.5 projects a slight negative trend (−1.23 mm/decade). These findings suggest a potential stabilization or marginal increase in precipitation levels under low-to-moderate emission pathways but highlight the risk of drier conditions under high-emission scenarios.

The R20, a critical measure for agriculture, risk management and water resource planning, is projected to follow a similar pattern. Under SSP1-2.6 and SSP2-4.5, the annual count of wet days increases slightly, reflecting potential intensification in extreme precipitation events. Conversely, SSP5-8.5 shows a reduction in wet days, aligning with broader CDD trends projected for high-emission scenarios. These projections emphasize the heightened variability in precipitation characteristics under higher emission climate pathways.

Spatial analysis highlights significant heterogeneity across the Northeast Atlantic, with adjacent continental regions experiencing more pronounced changes compared to the oceanic regions. Furthermore, the role of topography in shaping localized precipitation patterns remains a critical area for future research, particularly given the limitations of coarse model resolutions in capturing island-scale processes.

The findings underscore the importance of integrating climate projections into regional planning and adaptation strategies. While the Azores may face relatively modest changes in precipitation under certain scenarios, the potential for increased variability and intensity of extreme events cannot be overlooked. As wet days and consecutive dry days trends evolve, their implications for water management, agriculture, risk management and infrastructure resilience warrant proactive measures. Continued refinement of climate models and increased resolution for small island systems are essential to enhance the accuracy and applicability of future projections.

This study contributes to a growing knowledge on the impacts of climate change on small island states and emphasizes the critical need for adaptation policies that consider the unique vulnerabilities of these regions.

How to cite: Meirelles, M., Carvalho, F., Henriques, D., Vasconcelos, H., Navarro, P., and Porteiro, J.: Assessing Extreme Climate Indices for Precipitation in the Azores: Insights from CMIP6 Climate Projections, EGU General Assembly 2025, Vienna, Austria, 27 Apr–2 May 2025, EGU25-13800, https://doi.org/10.5194/egusphere-egu25-13800, 2025.

The erratic and non-linear nature of extreme precipitation due to climate change presents significant challenges for water resource management. This study investigates disproportionate patterns of extreme precipitation under future climate scenarios (SSP 245 and SSP 585) by integrating precipitation extreme indices and advanced ensemble modeling techniques. The ensemble approach combines projections from multiple General Circulation Models (GCMs) to improve prediction reliability. Taylor Skill Score (TSS) rankings and seasonal evaluations were used to identify the most skillful models, such as BCC-CSM, CNRM-CERFACS, MPI, and MRI-ESM2.0. Weighted ensemble combinations progressively incorporated top-ranked models. Advanced regression techniques, including Artificial Neural Networks (ANN), K-Nearest Neighbors (KNN), and Support Vector Machines (SVM), optimized model merging. Ensemble performance was validated using metrics like RMSE and correlation, demonstrating improved accuracy compared to individual models.

Future precipitation patterns were analyzed under SSP 245 and SSP 585, revealing amplified extremes. Extreme precipitation indices were divided into two categories: Quantitative Upper-Tail Threshold Analysis (R90p, R95p, R99p) and Duration-Integrated Metrics (CWD, SDII, PRCPTOT). Results indicated an increase in days exceeding the 90th and 95th percentiles but a decline in days exceeding the 99th percentile, suggesting a threshold effect. Future projections show decreased CWD and increased PRCPTOT, reflecting fewer wet days but higher annual precipitation.

Correlation analysis revealed non-linear relationships. Quantitative Upper-Tail Threshold metrics showed increasing correlation with CWD under SSP 245 (336.84–500%) before declining under SSP 585 (17.78–96.88%). Their correlation with SDII increased from observed to SSP 245 (27.27–144.83%) but stabilized under SSP 585 (-1.43% to 1.41%). These findings highlight an evolving interplay between moderate and extreme precipitation events under intensifying climate conditions.

The results offer critical insights for water resource management, including optimized agricultural practices, adaptive urban infrastructure for flood management, and region-specific policies to enhance resilience against changing precipitation dynamics.

How to cite: Debnath, M. and Alamdari, N.: Ensemble Modeling and Threshold Analysis for Assessing Non-Linearity of Extreme Precipitation Under Future Climate Scenarios , EGU General Assembly 2025, Vienna, Austria, 27 Apr–2 May 2025, EGU25-18963, https://doi.org/10.5194/egusphere-egu25-18963, 2025.

EGU25-20028 | Posters on site | CL3.1.2

Future projections of human thermal comfort in the United Arab Emirates 

Basit Khan, Francesco Paparella, Olivier Pauluis, and Subrota Halder

Global warming is intensifying the frequency and severity of extreme heat events, significantly impacting human thermal comfort (HTC), particularly in vulnerable regions such as the United Arab Emirates (UAE). Heat waves rank among the most dangerous natural hazards, directly affecting public health and well-being. Vulnerable populations, including children, the elderly, and individuals with pre-existing health conditions, particularly face heightened risks. The UAE, classified as a hyper-arid desert region with most of its major cities located along the coast, experiences a hot and humid climate. This makes it imperative to develop robust estimates of future HTC to implement effective measures against potential adverse health outcomes.


This study examines past trends and future projections of human thermal comfort (HTC) in selected cities across the UAE. Two 10-year simulations were conducted: a historical run (2005–2014) driven by ERA5 reanalysis data and a Pseudo Global Warming (PGW) simulation using perturbation derived from the CMIP6 CCSM4 model under the Representative Concentration Pathway (RCP) 8.5 (business-as-usual) emission scenario. Key heat indices, Universal Thermal Climate Index (UTCI), Physiologically Equivalent Temperature (PET), wet-bulb temperature, and apparent temperature, were calculated and compared between the historical and future scenarios to evaluate changes in HTC.


The results reveal a substantial increase in all heat indices under future climate conditions, with UTCI showing the highest rise of over 5°C, while wet-bulb temperature exhibited the smallest increase. Heat index values were most pronounced from June to August, with Abu Dhabi recording the highest values among studied cities, followed by Dubai, Al Fujairah, and Al Ain. This research provides critical insights for developing intervention strategies to address future HTC challenges in the UAE. Future work aims to refine projections using ensemble modeling and alternative emission scenarios to reduce uncertainties.

How to cite: Khan, B., Paparella, F., Pauluis, O., and Halder, S.: Future projections of human thermal comfort in the United Arab Emirates, EGU General Assembly 2025, Vienna, Austria, 27 Apr–2 May 2025, EGU25-20028, https://doi.org/10.5194/egusphere-egu25-20028, 2025.

EGU25-20252 | ECS | Posters on site | CL3.1.2

The analysis of sub-daily scale temperature changes for Hungary  

Péter Szabó, Anna Kis, Ferenc Divinszki, and Rita Pongrácz

Understanding sub-daily scale temperature variability can be used for evaluating the impacts of climate change on human health, agriculture and daily life. In particular, higher temperature fluctuations (within a day, or from one day to another) increase physiological and psychological stress, demanding more frequent adaptation in areas such as clothing choices and energy management. The Pannonian Basin, encompassing Hungary, provides an ideal setting for this analysis due to its distinctive climate, well-defined four seasons, and sensitivity to global warming, which amplify the effects of temperature variability.

This study focuses on diurnal temperature range (DTR), inter-day temperature variability, and intra-day temperature changes using various thresholds. These metrics are analyzed on monthly and seasonal scales. Historical (1971-2024) DTR and inter-day variability were derived from the homogenized, high-resolution HuClim database using daily mean, maximum and minimum temperatures. For intra-day changes, we utilize hourly temperature data from ERA5-Land, a reanalysis product. Future projections are derived from an ensemble of EURO-CORDEX regional climate model simulations, encompassing multiple scenarios: RCP2.6 (limiting global warming to 2 °C), RCP4.5 (moderate mitigation), and RCP8.5 (business-as-usual).

Preliminary results indicate an increase in DTR and inter-day temperature variability across all months, especially in spring and late summer. Intra-day temperature changes show substantial increases during spring and minor changes during winter. Positive intra-day temperature changes peak in spring, while negative changes are more frequent in summer. These findings highlight the growing temperature volatility in the region, emphasizing the need for adaptive strategies in agriculture and human health to moderate the impacts of climate change.

Acknowledgements. This work has been implemented by the National Multidisciplinary Laboratory for Climate Change (RRF-2.3.1-21-2022-00014) project within the framework of Hungary's National Recovery and Resilience Plan supported by the Recovery and Resilience Facility of the European Union. In addition, this study has been supported by the European Climate Fund (G-2409-68866).

How to cite: Szabó, P., Kis, A., Divinszki, F., and Pongrácz, R.: The analysis of sub-daily scale temperature changes for Hungary , EGU General Assembly 2025, Vienna, Austria, 27 Apr–2 May 2025, EGU25-20252, https://doi.org/10.5194/egusphere-egu25-20252, 2025.

EGU25-20561 | ECS | Orals | CL3.1.2

Modelling a Binary Threshold Indicator for Maximum Temperatures with a Selection Algorithm for Spatio-Temporal Models 

Elsa Barrio, Zeus Gracia-Tabuenca, Jesús Asín, Jesús Abaurrea, Jorge Castillo, and Ana Cebrián

Signs of global warming are evident in extreme daily maximum temperature events Tx , especially those that break historical records. In the Iberian Peninsula, [Castillo-Mateo, 2023] demonstrated that the frequency of such records shows a trend surpassing what is expected under stationary conditions and varies spatially. A novel approach is introduced here to analyse and interpret the spatial variability and spatio-temporal patterns of this phenomenon.

Daily TX data spanning 1960–2023 from 36 Spanish stations were obtained from the European Climate Assessment & Dataset. Geopotential variables at 12 p.m. for pressure levels of 300, 500, and 700 hPa, on a 1o x 1o grid covering [45oN, 10oW, 35oS, 5oE], were sourced from ERA5 reanalysis data as the predictor database. The analysis focused on summer (JJA) days.

An algorithm was used to derive an optimal model for each station using logistic regression, along with several global models. The target variable was defined as a binary indicator of daily threshold exceedance for Tx . For each station s, the threshold was determined as the 95th percentile of maximum temperatures during the reference period 1981–2010, specifically for the summer months (June, July, and August). Mathematically, the threshold for station s is expressed as us = Q 0.95 (Tx s,t,l t ∈ [1981, 2010] , l ∈ [1, 92])  where Tx s,t,l  denotes the maximum temperature at station s for year t and day l, with l corresponding to the summer days. The binary indicator is defined as I s,t,l  = 1  if Tx s,t,l  > us , and 0 otherwise.

The series of geopotential covariates at the grid points corresponding to the four farthest corners, as well as the closest grid point to each station, were used as predictors. These variables were further expanded by including a lag and their second-order polynomial terms. The algorithm involved multiple steps; 1) Stepwise regression was employed at each station to identify optimal predictors; 2)The most significant and frequently selected predictor variables from these models were then used to construct a global model. 3)Three interaction models were developed by introducing interactions between the selected predictors and geodesic, climatic, and spatial factors, followed by stepwise regression. Data from the first 51 years were used for training, while the last 13 years were reserved for testing. To address class imbalance, the AUC was used as a measure of model performance.

The simplest global model demonstrated strong overall performance with an AUC of 0.88 and k = 15 parameters, though it exhibited lower scores for stations located near the coast. Notable improvements in coastal station AUC values were achieved in the three interaction models. The model including climatic interactions achieved an AUC of 0.89 with k=34 parameters. The model with climatic interactions was selected as the most top performer.

In conclusion, we analyzed extreme maximum temperature events in the Iberian Peninsula using station-specific and global models with geopotential predictors. Interaction models improved performance, particularly for coastal stations, with the climatic interaction model achieving the best balance of accuracy and simplicity.

How to cite: Barrio, E., Gracia-Tabuenca, Z., Asín, J., Abaurrea, J., Castillo, J., and Cebrián, A.: Modelling a Binary Threshold Indicator for Maximum Temperatures with a Selection Algorithm for Spatio-Temporal Models, EGU General Assembly 2025, Vienna, Austria, 27 Apr–2 May 2025, EGU25-20561, https://doi.org/10.5194/egusphere-egu25-20561, 2025.

EGU25-1944 | ECS | Posters on site | CL3.1.3

 Attribution of drought trends on the Mongolian Plateau over the past decades 

Yulan Li, Hainan Gong, Wen Chen, and Lin Wang

The Mongolian Plateau (MP) has undergone a significant drought trend in recent decades,
 presenting a substantial threat to local ecosystems and environments. The debate persists on
 whether this observed drought trend stems from external forcings or is a result of internal
 variability. Utilizing the large-ensemble simulations of the climate model and dynamical
 adjustment method, we have identified that the atmospheric circulation anomalies are the main
 drivers of drought trends in MP. A zonal atmospheric wave train, triggered by internally-generated
 warming of the North Atlantic sea surface temperature (NAS), is responsible for nearly 57% of the
 drought trend observed in MP. While external forcings could potentially induce a moistening trend
 in MPvia direct thermodynamic processes, the atmospheric circulation anomalies linked to the
 forced NAS warming can not only offset its direct effect but also further amplify the drought trend
 in MP, accounting for 43% of the drought trend observed in MP.

How to cite: Li, Y., Gong, H., Chen, W., and Wang, L.:  Attribution of drought trends on the Mongolian Plateau over the past decades, EGU General Assembly 2025, Vienna, Austria, 27 Apr–2 May 2025, EGU25-1944, https://doi.org/10.5194/egusphere-egu25-1944, 2025.

EGU25-2081 | ECS | Posters on site | CL3.1.3

Attribution of Antarctic Precipitation and Extremes to Anthropogenic and Natural Drivers 

Sai Prabala Swetha Chittella, Pranab Deb, and Andrew Orr

Over recent decades, Antarctica has experienced significant changes, contributing notably to global sea level rise. This mass loss is partially offset by precipitation accumulation, which is strongly influenced by extreme precipitation events. However, the extent to which human activities amplify these extremes remains uncertain. In this study, we analyze precipitation and extreme precipitation patterns over Antarctica using formal detection and attribution methods. Leveraging the ERA5 reanalysis dataset and CESM2 Large Ensemble (CESM2-LE) climate model simulations, we investigate the forced response in observed precipitation trends. Our analysis, focused on the Rignot basins in West Antarctica and the Dronning Maud Land region in East Antarctica, reveals that anthropogenic forcing, particularly from greenhouse gas emissions, has been the dominant driver of precipitation and its extremes since the 1980s, in conjunction with natural variability. These findings span the period 1979–2023 and provide critical insights into the role of human influence on Antarctic precipitation trends.

How to cite: Chittella, S. P. S., Deb, P., and Orr, A.: Attribution of Antarctic Precipitation and Extremes to Anthropogenic and Natural Drivers, EGU General Assembly 2025, Vienna, Austria, 27 Apr–2 May 2025, EGU25-2081, https://doi.org/10.5194/egusphere-egu25-2081, 2025.

EGU25-2244 | ECS | Orals | CL3.1.3

Increased Asian sulfate aerosol emissions remarkably enhance Sahel summer precipitation 

Jianing Guo, Xiaoning Xie, Gunnar Myhre, Drew Shindell, Alf Kirkevåg, Trond Iversen, Bjørn H. Samset, Zhengguo Shi, Xinzhou Li, Hui Sun, Xiaodong Liu, and Yangang Liu

Observational evidence shows that Sahel summer precipitation has experienced a considerable increase since the 1980s, coinciding with significant diverging trends of increased sulfate emissions in Asia and decreased emissions in Europe (dipole pattern of aerosols between Asia and Europe). The decrease in European sulfate aerosols has substantial effects on the Sahel summer precipitation increase, but the corresponding effect of increased Asian sulfate is unknown. Multi-model simulations in the Precipitation Driver and Response Model Intercomparison Project (PDRMIP) show, compared to decreased European aerosols, that increased Asian aerosols similarly enhance the Sahel summer precipitation but with different large-scale atmospheric circulation changes. Further analysis of the Sixth Coupled Model Intercomparison Project (CMIP6) simulations under historical attribution and various emission scenarios reinforces the results about the climate impacts of anthropogenic aerosols and suggests that in future scenarios with strong international cooperation and rapid climate mitigations (SSP2-45), the Sahel drought will be intensified likely due to the decline in Asian aerosol emissions. Our results suggest that Asian anthropogenic aerosols are likely a non-negligible driver of the recent recovery in Sahel precipitation amounts.

How to cite: Guo, J., Xie, X., Myhre, G., Shindell, D., Kirkevåg, A., Iversen, T., Samset, B. H., Shi, Z., Li, X., Sun, H., Liu, X., and Liu, Y.: Increased Asian sulfate aerosol emissions remarkably enhance Sahel summer precipitation, EGU General Assembly 2025, Vienna, Austria, 27 Apr–2 May 2025, EGU25-2244, https://doi.org/10.5194/egusphere-egu25-2244, 2025.

EGU25-2874 | ECS | Posters on site | CL3.1.3

Comparison of the GMST covariate and the time slice method for probabilistic extreme weather event attribution 

Jonas Schröter, Miriam Tivig, Philip Lorenz, Rene Sauerbrei, and Frank Kreienkamp

The probabilistic attribution has become a valuable tool for analysing the influence of anthropogenic climate change on recent extreme weather events in rapid attribution studies.

For this rapid analysis, the methods of the World Weather Attribution group (WWA) described by Philip et al. (2020) can be used. This method is a straightforward option for evaluation especially in a trend of operationalizing the probabilistic attribution. When estimating the General Extreme Value (GEV) distribution, the global mean surface temperature (GMST) is introduced as covariate such that the GEV shifts or scales with this temperature. This has the advantage that the complete timeseries of every observation and model dataset can be analysed to detect anthropogenic influences. The covariate method provides a trend proportional to the covariate and allows extrapolation of existing datasets to a past or future climate. Depending on the context, this can be seen as an advantage or disadvantage.

To avoid a proportional trend, an alternative method consists in evaluating time slices instead. Two 30-year blocks for a past climate and the current climate or a counterfactual and factual climate are analysed. Optionally, a future scenario from climate models can be included. While only one GEV with one additional covariate is estimated to describe a single model in the previous method, a standard GEV is used for every defined slice. In this case, the single 30-year climate periods are independent from the other time slices. The challenge here is the selection of climate models and scenarios which simulate a similar trend of anthropogenic impacts. Additionally, observation datasets can only be used when the time series is long enough to allow extraction of two independent time slices of 30 years each.

The difference between the two methods and the difference in the results will be analysed and presented. Both methods can be understood as part of the same toolbox and are both equally valid. Here, the main interest is in the ability to understand and explain upcoming differences in extreme weather attribution studies between the two methods.

The research of this project is part of the ClimXtreme Network, funded by the German Federal Ministry of Education and Research (BMBF). Focus of this project are extreme weather events and impacts caused by anthropogenic climate change.

Philip, S., Kew, S., van Oldenborgh, G. J., Otto, F., Vautard, R., van der Wiel, K., King, A., Lott, F., Arrighi, J., Singh, R., and van Aalst, M.: A protocol for probabilistic extreme event attribution analyses, Adv. Stat. Clim. Meteorol. Oceanogr., 6, 177–203, https://doi.org/10.5194/ascmo-6-177-2020, 2020.

How to cite: Schröter, J., Tivig, M., Lorenz, P., Sauerbrei, R., and Kreienkamp, F.: Comparison of the GMST covariate and the time slice method for probabilistic extreme weather event attribution, EGU General Assembly 2025, Vienna, Austria, 27 Apr–2 May 2025, EGU25-2874, https://doi.org/10.5194/egusphere-egu25-2874, 2025.

EGU25-3107 | ECS | Orals | CL3.1.3

Impact of aerosol forcing on heat extreme event attribution results 

Florian Kraulich, Peter Pfleiderer, and Sebastian Sippel

Heatwaves represent some of the most impactful extreme weather events, with profound implications for ecosystems, human health, and economies globally. Accurately attributing changes in their occurrence probabilities, intensity, and duration is crucial for effective climate change adaptation strategies. The intensity, frequency, and duration of heatwaves have increased globally, yet their attribution is not straightforward (Oldenborgh et al., 2022) because diverse factors influence regional heatwave trends.  A common practice for calculating heatwave return periods relies on extreme value statistics, where the Generalized Extreme Value distribution (GEV) shifts linearly with a covariate on global mean temperature (GMT) for the location parameter (the “standard method”). This approach is widely used in rapid event attribution studies. However, local temperature trends in recent decades have been influenced by anthropogenic aerosol emissions (AER), depending on the region. AER have a predominantly cooling effect on heatwaves via reflecting incoming solar radiation. AER trends can therefore counteract or amplify the warming effect of greenhouse gases (GHG), depending on emission trends. These trends may affect  regional climate dynamics and thermodynamic processes and, consequently, the return periods of extreme temperature events. In this study, we use state-of-the-art large ensemble and single forcing large ensemble climate model simulations from the Community Earth System Model 2 (CESM2). To examine the impact of AER on extreme event trends, we added an additional covariate on local aerosol optical depth (AOD) for the location parameter. We then compared this approach with the standard method. Our results indicate a substantial bias in the standard method during periods of strong regional AER trends. This bias is most pronounced in major industrial regions, where regional AER trends show the strongest deviation from the GMT covariate. In contrast, in some regions, AER trends have little or no impact. Adding AOD as an additional covariate reduces these biases and improves the goodness of the GEV fit. In regions such as North America, Central and Eastern Europe, and China, the GEV fit improves significantly for nearly all individual ensemble members with the addition of the covariate on AOD. For example, in Central Europe and the Midwest US, the standard method overestimates extreme temperatures by more than 1°C in the 1970s and 1980s, whereas this bias disappears when AOD is added as a covariate. This study underscores the importance of incorporating regional aerosol trends into attribution studies to improve the estimation of return periods, and thus attribution statements.

How to cite: Kraulich, F., Pfleiderer, P., and Sippel, S.: Impact of aerosol forcing on heat extreme event attribution results, EGU General Assembly 2025, Vienna, Austria, 27 Apr–2 May 2025, EGU25-3107, https://doi.org/10.5194/egusphere-egu25-3107, 2025.

EGU25-3365 | Orals | CL3.1.3

Emerging Climate Change Signals in Atmospheric Circulation 

Tiffany Shaw, Julie Arblaster, Thomas Birner, Amy Butler, Daniela Domeisen, Chaim Garfinkel, Hella Garny, Kevin Grise, and Alexey Karpechko

The circulation response to climate change shapes regional climate and extremes. Over the last decade an increasing number of atmospheric circulation signals have been documented, with some attributed to human activities. The circulation signals represent an exciting opportunity for improving our understanding of dynamical mechanisms, testing our theories and reducing uncertainties. The signals have also presented puzzles that represent an opportunity for better understanding the circulation response to climate change, its contribution to climate extremes, interactions with moisture, and connection to thermodynamic discrepancies. The next decade is likely to be a golden age for atmospheric dynamics with many advances possible.

How to cite: Shaw, T., Arblaster, J., Birner, T., Butler, A., Domeisen, D., Garfinkel, C., Garny, H., Grise, K., and Karpechko, A.: Emerging Climate Change Signals in Atmospheric Circulation, EGU General Assembly 2025, Vienna, Austria, 27 Apr–2 May 2025, EGU25-3365, https://doi.org/10.5194/egusphere-egu25-3365, 2025.

EGU25-4257 | ECS | Orals | CL3.1.3

Attribution of the 2023 Extreme Spring Hot Drought Event in Southwest China: Meteorological and Agricultural Perspectives 

Wenjun Liang, Simon Tett, Hongbin Liang, and Wenjie Dong

During March to May (MAM) 2023, Southwestern China experienced a prolonged hot and dry spring. This study investigates the role of anthropogenic climate change (ACC) in this extreme event and its impact on crop yields, using a 525-member ensemble from the HadGEM3 atmospheric model and the WOFOST agricultural model, respectively. Observational results indicate that the area-averaged surface air temperature anomaly (TAS) was 1.4°C higher than usual, and the percentage of anomalous precipitation (PAP) was nearly 33% below normal, making both metrics the most extreme since 1960. The hot event was predominantly driven by ACC, contributing about 60% to the TAS strength and increasing its likelihood 7 fold. In contrast, the severe drought was mainly influenced by internal climate variability, though ACC still increased its likelihood 9 fold. When these two extreme conditions are considered together as a concurrent hot-drought event, ACC increased its probability by about 8 fold. An attribution analysis of crop yields in the area was also conducted, revealing that ACC significantly shifts the probability distribution westward and reduces yields for both the winter wheat and rapeseed. Specifically, using the simulated 2023 crop yield results driven by ERA5, the likelihood of achieving the yield for winter wheat would have decreased by a factors of about 2. However, the results for winter rapeseed lack robustness due to model deficiency. Consequently, accurately modeling and projecting crop yields under changing climate conditions remains a challenge. Overall, global warming caused by anthropogenic activities has significantly increased the frequency of extreme hot drought events in Southwestern China, posing a severe threat to agricultural output and necessitating urgent action by policymakers.

How to cite: Liang, W., Tett, S., Liang, H., and Dong, W.: Attribution of the 2023 Extreme Spring Hot Drought Event in Southwest China: Meteorological and Agricultural Perspectives, EGU General Assembly 2025, Vienna, Austria, 27 Apr–2 May 2025, EGU25-4257, https://doi.org/10.5194/egusphere-egu25-4257, 2025.

EGU25-4522 | Orals | CL3.1.3

A comparison of storyline attribution methods for a midlatitude cyclone 

Shirin Ermis, Vikki Thompson, Nicholas Leach, Hylke de Vries, Geert Lenderink, Lynn Zhou, Pandora Hope, Ben Clarke, Sarah Kew, Sarah Sparrow, Fraser Lott, and Antje Weisheimer

Since 2004, methods for event attribution have been developed across many groups. Early studies showed that answers to attribution questions are sensitively dependent on the framing of the study used but recently developed methods for storyline attribution have not been compared in detail.

Here, we compare three common methods for storyline attribution, alongside the probabilistic method, based on the midlatitude cyclone Babet. This storm caused flooding in the UK and Ireland in October 2023. The three storyline methods are flow analogues, pseudo-global warming, and forecast-based attribution. We discuss four questions that might be asked of attribution studies by the public: (1) Has climate change impacted the event? (2) How has climate change impacted the frequency of the event? (3) How has climate change impacted the event severity? (4) Were the dynamics of the event influenced by climate change and if yes, how?

We argue that storyline methods are better suited to answer questions about severity changes in events but that probabilistic methods are needed to determine changes in frequency of the event. Limitations and opportunities of the methods need to be clearly communicated to the public when publishing event attribution studies.

Finally, we compare the framing of storyline attribution to that of probabilistic attribution. To the best of our knowledge, this comparison of methods is the first study discussing the differences in the framing and the quantitative results of storyline attribution methods. We hope it represents a basis for future systematic comparisons.

How to cite: Ermis, S., Thompson, V., Leach, N., de Vries, H., Lenderink, G., Zhou, L., Hope, P., Clarke, B., Kew, S., Sparrow, S., Lott, F., and Weisheimer, A.: A comparison of storyline attribution methods for a midlatitude cyclone, EGU General Assembly 2025, Vienna, Austria, 27 Apr–2 May 2025, EGU25-4522, https://doi.org/10.5194/egusphere-egu25-4522, 2025.

Changes in apparent temperature (APT), due to global warming can have a significant impact on human health and society. A recent study based on ERA5 reanalysis data and HadISD observations post 1979 has shown that the probability of extreme heat discomfort events over the Northern Hemisphere oceans has significantly increased, with the largest changes occurring in the tropics and parts of the Arctic. However, current APT studies have mostly focused on changes on land, while changes in marine APT (MAPT), which pose a potential threat to ocean-based economies and living conditions of people dependent on the sea, still remain unclear to a large extent. We examine historical changes in MAPT and the dominant role of different meteorological factors by separating their contribution to changes during 1950-2023.

The heat stress indicator - APT, is a function of surface air temperature, relative humidity (RH) and near-surface wind speed (NSWS) and is computed from 20CRv3-ERA5 reanalysis monthly average data. MAPT and MAT warm at 0.109±0.011 and 0.122±0.015 ℃/10a respectively. MAPT warms faster than MAT but with similar spatial patterns. We estimate contributions from changes in MAT, RH and NSWS to changes in MAPT using a linear sensitivity analysis. Global MAPT changes are mainly dominated by the change of MAT, RH has little influence and NSWS has some regional influence especially in parts of the equatorial Pacific and the Southern Ocean.

To explore whether reanalysis changes could be reproduced by CMIP6 simulations, contribution by changes in meteorological factors to changes in MAPT from REA and CMIP6 were computed. CMIP6 is consistent with reanalysis with both showing the dominant contribution is from changes MAT, but there are some differences in the spatial pattern of the RH contribution, which only has a small influence and NSWS which may impact regional change. Reanalysis-CMIP6 differences of MAT as well as differences of RH and NSWS in most mid-high latitudes are consistent with internal variability, while differences of RH and NSWS in low latitudes are beyond the range of internal variability. The consistency between reanalysis MAPT/MAT & CMIP-6 multi-model ensemble means we could attribute the bulk of the ‘obs’ changes to anthropogenic climate change.

How to cite: Liao, L., Tett, S., and Li, Q.: Changes in Apparent Temperature Over the Ocean during 1950-2023: Long-term Trends and Contributions of Meteorological Factors, EGU General Assembly 2025, Vienna, Austria, 27 Apr–2 May 2025, EGU25-4607, https://doi.org/10.5194/egusphere-egu25-4607, 2025.

EGU25-5993 | ECS | Orals | CL3.1.3

Observed and modelled changes in the drivers that trigger compound drought and heatwave events in the Adige River basin (Eastern Italian Alps) with a focus on May 2022. 

Marc Lemus-Canovas, Alice Crespi, Elena Maines, Massimiliano Pittore, and Stefano Terzi

The Adige River basin has been affected several times in recent years by the concurrence of very hot and dry conditions. In summers 2015, 2017 and more recently in 2021-2022 severe hydrological droughts compounded and cascaded with wildfire and heatwave events. The chained effect of snow deficit in winter, higher-than-normal temperatures in early spring and heatwaves during summer caused multiple drought impacts.

For these reasons, we initially developed a procedure to identify and rank past compound drought and heatwave events (CDHW) which occurred in the basin using precipitation and temperature observations from EOBS covering 1950 to 2023. CDHWs were identified combining two criteria: while heatwaves were defined as periods of at least three consecutive days with daily maximum temperatures (TX) exceeding the 90th percentile of the calendar day. A CDHW event was identified when both conditions occurred simultaneously over at least 60% of the catchment area. Detected CDHWs are then sorted by severity, as combination of their intensity and spatial extent. This ranking allowed us to characterise and determine the temporal extent of the major CDHW event that occurred in the late spring of 2022 (10–28 May). This event was selected for subsequent analyses since it is one of the most recent episodes when compound hot and dry conditions in spring and summer caused severe water use restrictions in the basin area affecting key sectors such as water supply, agriculture, and hydropower, among others. It was identified as the most intense CDHW events of the last 15 years and ranked sixth out of 119 events recorded since 1950.

To better understand the drivers of the May 2022 event, we reconstructed its atmospheric conditions using a flow-analogue attribution approach based on ERA5 Z500. We compared the characteristics of the event in two different periods: 1951–1980 (low anthropogenic forcing) and 1991–2020 (moderate-high anthropogenic forcing). Our analysis shows that heatwaves like the one in May 2022 are now significantly hotter—by 1–4°C—than historical analogues and occur in a much drier context, characterised by pronounced precipitation deficits. These conditions have also exacerbated river flow reductions and water stress in the recent period compared to the past.

We also evaluated the ability of 25 EURO-CORDEX climate model simulations to reproduce the observed changes in TX and SPI-6 through flow-conditioned reconstructions based on the May 2022 event. The assessment reveals that EURO-CORDEX models mostly fail to capture the observed signal and magnitude of changes in flow-analogue attribution experiments. Specifically, when identifying flow-conditioned analogues, nearly half of the models fail to reproduce the observed temperature increases, either in terms of sign or magnitude. Similarly, for drought conditions, models fail to reproduce both the direction and magnitude of observed changes.


This research was supported by the European Space Agency (ESA) under the EO4MULTIHA project (2023–2025), contract number 4000141754/23/I-DT.

How to cite: Lemus-Canovas, M., Crespi, A., Maines, E., Pittore, M., and Terzi, S.: Observed and modelled changes in the drivers that trigger compound drought and heatwave events in the Adige River basin (Eastern Italian Alps) with a focus on May 2022., EGU General Assembly 2025, Vienna, Austria, 27 Apr–2 May 2025, EGU25-5993, https://doi.org/10.5194/egusphere-egu25-5993, 2025.

EGU25-6830 | ECS | Orals | CL3.1.3

Building a global and rapid event impact attribution framework 

Emily Theokritoff, Nathan Sparks, Friederike Otto, Joeri Rogelj, and Ralf Toumi

While event attribution has made considerable progress in the last two decades, event impact attribution, which calculates the attributable share of impacts from extreme weather events, remains challenging. Impacts result from the interaction between the intensity of hazards, the exposure of affected areas and the vulnerability of individuals, infrastructures and the environment. Across different types of extreme weather events, impacts and world regions, a wide range of datasets and approaches need to be considered to tackle this complex and interdisciplinary field of research.

Here, we aim to develop simple methods that can be deployed rapidly and globally to estimate attributable impacts in the aftermath of extreme weather events. We will present initial work on attributing direct economic impacts from tropical cyclones and on an updated global physical asset database used in this context.

This initiative produces near-real-time results that can be communicated in a timely manner to a broad audience, raising awareness about the impacts of extreme weather and the role of climate change. It ultimately seeks to provide valuable information on losses and damages and levels of adaptation, which can be instrumental for policymaking, climate justice and preparing societies for future extremes.

How to cite: Theokritoff, E., Sparks, N., Otto, F., Rogelj, J., and Toumi, R.: Building a global and rapid event impact attribution framework, EGU General Assembly 2025, Vienna, Austria, 27 Apr–2 May 2025, EGU25-6830, https://doi.org/10.5194/egusphere-egu25-6830, 2025.

EGU25-6947 | Orals | CL3.1.3

Attributing climate and weather extremes to Northern Hemisphere sea ice and terrestrial snow: Progress, challenges and ways forward 

Kunhui Ye, Judah Cohen, Hans W. Chen, Shiyue Zhang, Dehai Luo, and Mostafa Essam Hamouda

Sea ice and snow are crucial components of the cryosphere and the climate system. Both sea ice and spring snow in the Northern Hemisphere (NH) have been decreasing at an alarming rate in a changing climate. Changes in sea ice and snow in the NH have been linked with a variety of climate and weather extremes including cold spells, heatwaves, droughts and wildfires. Understanding of these linkages will benefit the predictions of climate and weather extremes. However, existing work on this has been largely fragmented and are subject to large uncertainties in physical pathways and methodologies. This has prevented further substantial progress in attributing climate and weather extremes to sea ice and snow change, and will potentially miss a critical window for climate change mitigation. In this review, we synthesize the current progress in attributing climate and weather extremes to sea ice and snow change by evaluating the observed linkages, their physical pathways, uncertainties in these pathways and a way forward for future research efforts. By adopting the same framework for both sea ice and snow, we highlight their combined influence and the cryospheric feedback to the climate system. We suggest that future research will benefit from improving observational networks, addressing the causality and complexity of the linkages using multiple lines of evidence, adopting large-ensemble approaches and artificial intelligence, achieving synergy between different methodologies/disciplines, and widening the context and international collaboration.

How to cite: Ye, K., Cohen, J., Chen, H. W., Zhang, S., Luo, D., and Hamouda, M. E.: Attributing climate and weather extremes to Northern Hemisphere sea ice and terrestrial snow: Progress, challenges and ways forward, EGU General Assembly 2025, Vienna, Austria, 27 Apr–2 May 2025, EGU25-6947, https://doi.org/10.5194/egusphere-egu25-6947, 2025.

EGU25-7864 | ECS | Orals | CL3.1.3

Disentangling anthropogenic forced dynamic and thermodynamic precipitation changes from internal variability over the past seven decades 

Lei Gu, Sebastian Sippel, Dominik Schumacher, Robin Noyelle, Jitendra Singh, Erich Fischer, and Reto Knutti

The separation of human-induced climate change and internal unforced variability to precipitation changes is well established, yet the full extent of anthropogenic forcing in regulating terrestrial precipitation remains unclear. Here we present a novel approach that combines dynamical adjustment with fully coupled nudged circulation climate model simulations using the Community Earth System Model Version 2 (CESM2) to attribute anthropogenic contributions to forced thermodynamic and dynamic processes driving seasonal mean precipitation trends over the past seven decades, while isolating the influence of internal variability. We show that although anthropogenic forced thermodynamics increases terrestrial precipitation over the majority of land areas in boreal summer (~52.3% ) and winter (~78.3%), it dampens precipitation over hot and humid areas, likely because of terrestrial evaporation failing to balance the rising saturation deficit of a rapidly warming atmosphere. Opposing the traditional expectation of small human-induced changes in circulation patterns, we find that atmospheric circulation patterns shift in response to anthropogenic forcing and modulate mean precipitation with similar magnitudes as forced thermodynamics, in particular suppressing precipitation in humid regions. Our results not only reveal that the climate system responds to anthropogenic emissions with declining precipitation in some wet areas, but also demonstrate that these tendencies are influenced by both thermodynamic changes and shifting large-scale dynamic systems.

How to cite: Gu, L., Sippel, S., Schumacher, D., Noyelle, R., Singh, J., Fischer, E., and Knutti, R.: Disentangling anthropogenic forced dynamic and thermodynamic precipitation changes from internal variability over the past seven decades, EGU General Assembly 2025, Vienna, Austria, 27 Apr–2 May 2025, EGU25-7864, https://doi.org/10.5194/egusphere-egu25-7864, 2025.

EGU25-8242 | Posters on site | CL3.1.3

Development of the Climate Explorer Circulation Analogues Tool  

Vikki Thompson, Izidine Pinto, Sarah Kew, and Sjouke Philip

When an extreme weather event occurs scientists may be asked if similar events have occurred in the past. If the frequency of such events have changed. If such events are becoming more intense or more persistent. And if the impacts of such events are increasing or decreasing. We present a tool that uses atmospheric circulation analogues to provide a framework to answer such questions.   

When using our analogues tool there are methodological choices that need to be considered. Extreme weather events are, by their very definition, rare, so how can we assess if the analogues are close enough to the observed event to be useful? Analogues can be calculated using spatial correlation or Euclidean distance, from sea level pressure or 500 hPa geopotential height, over different domains, and for different timescales. Investigating how sensitive results are to these choices allows us to provide a set of rules for using our tool for a range of different types of climate extremes, from heatwaves to extreme rainfall. 

Through a series of case studies, we consider the methodological choices required when assessing analogues, and assess which events are most suited to analogues methods. 

How to cite: Thompson, V., Pinto, I., Kew, S., and Philip, S.: Development of the Climate Explorer Circulation Analogues Tool , EGU General Assembly 2025, Vienna, Austria, 27 Apr–2 May 2025, EGU25-8242, https://doi.org/10.5194/egusphere-egu25-8242, 2025.

Human-induced climate change is threatening hard-earned progress in public health. Extreme weather events, rising temperatures and related socioeconomic impacts are responsible for a substantial mortality and morbidity burden. The escalating health impacts are expected to amplify in coming decades as warming progresses and other societal challenges such as urbanisation, ageing and inequalities continue to expand. Quantifying robust estimates of health impacts attributed to anthropogenic climate change is a pressing issue and a high-priority research area nowadays. In recent years, substantive progress has been made in this field by developing new research and providing cutting-edge evidence. The main booster has been the establishment of interdisciplinary initiatives that have allowed the exchange of ideas, data and methods between mainly climate scientists and epidemiologists. The talk will provide an overview on the latest developments in health impact attribution (e.g., storylines of climate-health impacts, accounting for adaptation), and discuss the current and potential synergies between research fields, applications (e.g., climate litigation) and existing knowledge gaps.

How to cite: Vicedo Cabrera, A. M.: Translating the effects of climate change into health impacts: new perspectives in health attribution studies, EGU General Assembly 2025, Vienna, Austria, 27 Apr–2 May 2025, EGU25-8970, https://doi.org/10.5194/egusphere-egu25-8970, 2025.

EGU25-9000 | Orals | CL3.1.3

Attributing Local Precipitation Variability to Climate and Circulation Dynamics 

Andrea Vang, André Düsterhus, Hjalte Jomo Danielsen Sørup, and Jens Hesselbjerg Christensen

Precipitation has become an increasingly critical issue, particularly in the wake of events such as severe pluvial flooding and the subsequent emergence of fluvial flooding concerns during recent anomalously wet winters in many places in Europe. Observational data indicate a steady increase in precipitation over recent decades in many regions. While this trend is believed to be linked to global warming, it does not exhibit a simple linear relationship with rising temperatures. Instead, it likely results from a combination of factors, including indirect effects such as alterations in atmospheric circulation, which are influenced by both climate change and natural variability. This study seeks to quantify the relative contributions of these drivers to observed changes in precipitation.

The analysis begins with a dataset comprising of key drivers of regional precipitation variability - in this case the focus is Denmark. The reanalysis data used includes pressure, temperature and sea surface temperature (SST), along with indices for the North Atlantic Oscillation (NAO), global warming and latitudinal position of the polar front, all on monthly timescales. SST patterns are clustered using dynamical time warping, the clusters to be included in the analysis are based on their correlation to regional precipitation. Multilinear regressions are applied pointwise, with the target variable being monthly average of total precipitation. This produces a spatial extent of the relative importance of the different drivers. The importance ranking is also verified using permutation importance and mediation and suppression. The temporal evolution of the different drivers is also examined by taking field means over select areas and looking at how the drivers covary with precipitation.

Attribution of the observed precipitation changes is based on the weights derived from multilinear regressions, supported by validation tests and the temporal evolution of the identified drivers. The results provide insights into the dynamics underpinning precipitation changes, highlighting the interplay of thermodynamical and dynamical influences.

This study contributes to a deeper understanding of how precipitation patterns may evolve under global warming scenarios and offers a clearer perspective on the circulation changes driving these trends. Although the current focus is on a specific region, the methodology is generalizable to other areas, provided appropriate domain knowledge is incorporated. Future applications could expand the analysis to Northern Europe or similar climatological contexts with suitable datasets.

How to cite: Vang, A., Düsterhus, A., Jomo Danielsen Sørup, H., and Hesselbjerg Christensen, J.: Attributing Local Precipitation Variability to Climate and Circulation Dynamics, EGU General Assembly 2025, Vienna, Austria, 27 Apr–2 May 2025, EGU25-9000, https://doi.org/10.5194/egusphere-egu25-9000, 2025.

EGU25-9238 | ECS | Orals | CL3.1.3

Attributing floods to anthropogenic climate change using a hydrological model forced with climate simulations under nudged atmospheric circulation 

Peter Miersch, István Dunkl, Sebastian Sippel, and Jakob Zscheischler

Anthropogenic climate change can affect wide-spread river floods through changes in atmospheric circulation patterns and thermodynamic effects. Changes of atmospheric circulation patterns due to climate change are rather uncertain, while the thermodynamic effects can be simulated more accurately. Here, we employ a storyline approach to attribute the magnitude of recent extreme European floods to the thermodynamic effect of climate change. We use Newtonian nudging to constrain the zonal and meridional winds in simulations of the Community Earth System Model (CESM2) to reanalysis data, to generate factual and counterfactual weather conditions based on historical and pre-industrial greenhouse gases and aerosol concentrations respectively. Downscaled precipitation and temperature, along with observed climatology for leaf area index and fixed land cover from 2009, are used to force the mesoscale Hydrological Model (mHM), thereby simulating counterfactual and historical discharge at 0.125 degree resolution. However, spatial shifts in precipitation extremes observed in nudged circulation simulations present challenges for event attribution, particularly for smaller-scale phenomena. Thus, our focus is on large-scale floods, where we examine changes in flood patterns and explore the intensification of historical events in the context of climate change. By focusing directly on discharge, our approach is closer to actual flood impacts and thus goes beyond traditional flood attribution approaches that usually rely on precipitation extremes only. The presented approach also provides a blueprint for other types of impact attribution using impact models forced with nudged circulation climate model simulations.

How to cite: Miersch, P., Dunkl, I., Sippel, S., and Zscheischler, J.: Attributing floods to anthropogenic climate change using a hydrological model forced with climate simulations under nudged atmospheric circulation, EGU General Assembly 2025, Vienna, Austria, 27 Apr–2 May 2025, EGU25-9238, https://doi.org/10.5194/egusphere-egu25-9238, 2025.

EGU25-9789 | ECS | Orals | CL3.1.3

New normal? Attributing the unprecedented global heat in September 2023 

Svenja Seeber, Dominik L. Schumacher, Lukas Gudmundsson, and Sonia I. Seneviratne

Between July 2023 and June 2024, each month set a new temperature record, all exceeding the 1.5 °C threshold established by the Paris Agreement. The global mean surface temperature anomaly peaked in September 2023 at 1.8 °C above pre-industrial levels, exceeding the previous record by an unparalleled 0.5 °C.

Using a probabilistic attribution framework, we assess the likelihood of this global heat. Our analysis shows that both the absolute temperature anomaly and the year-to-year temperature difference were extremely unlikely from an observational perspective, and are generally not reproduced by CMIP6 models. Yet, the occurrence probability of the absolute temperature anomaly rises sharply within just a few years into the future. In contrast, the temperature jump from September 2022 to 2023 remains highly unlikely throughout the next decades, even under higher warming levels. A process-based analysis highlights water vapour feedback and resulting longwave forcing as key drivers of the heat build-up in September 2023, with no indication of nonlinearities in the climate models. Our findings suggest that the September 2023 temperature jump was an extremely rare event which would strongly challenge our understanding of the climate system if it were to reoccur.

How to cite: Seeber, S., Schumacher, D. L., Gudmundsson, L., and Seneviratne, S. I.: New normal? Attributing the unprecedented global heat in September 2023, EGU General Assembly 2025, Vienna, Austria, 27 Apr–2 May 2025, EGU25-9789, https://doi.org/10.5194/egusphere-egu25-9789, 2025.

EGU25-10296 | ECS | Posters on site | CL3.1.3

Contribution of anthropogenic influence to the 2022-like Yangtze River valley compound heatwave and drought event 

Dong Chen, Shaobo Qiao, and Wenjie Dong

In August 2022, an unprecedented compound heatwave and drought event (CHDE) lasting 24 days occurred in the Yangtze River valley (YRV), leading to severe reduction of crop, fresh water and power supply. We constructed a joint cumulative probability distribution of heatwave and drought intensity, and found that the lowest probability-based index (PI) of 0.06 in 2022 was estimated as a 1-in-662-year event over 1961–2022 climate. We then detected fingerprint of greenhouse gas forcing to the observed PI in a generalized extreme value framework, but not the aerosol forcing, suggesting the leading contribution of greenhouse gas forcing on such extreme CHDE. Furthermore, anthropogenic influence had increased the probability of such CHDE by more than 10 times compared to the counterfactual climate. Also, the PI decreased from about 0.30 at the present climate to about 0.14 at the 3°C global warming level, indicating that CHDE will become more extreme over YRV.

How to cite: Chen, D., Qiao, S., and Dong, W.: Contribution of anthropogenic influence to the 2022-like Yangtze River valley compound heatwave and drought event, EGU General Assembly 2025, Vienna, Austria, 27 Apr–2 May 2025, EGU25-10296, https://doi.org/10.5194/egusphere-egu25-10296, 2025.

EGU25-11237 | ECS | Orals | CL3.1.3

Unprecedented Winter Heatwave over East Antarctica in 2024 

Haosu Tang, Sihan Li, and Julie Jones

In austral mid-winter 2024, East Antarctica experienced an unprecedented heatwave with an estimated return period of approximately 1-in-130 years. Temperatures in parts of East Antarctica soared nearly 20°C above the climate norm, making it the most extreme heatwave ever recorded in the region. This record-breaking event was primarily driven by the weakening of the polar vortex, which trapped heat over the region and prolonged the warming. Here, we present initial findings from the first multi-method attribution study of this East Antarctic heatwave: pulling together the circulation analog method, statistical attribution analysis (leveraging multiple global model simulations and large-ensemble atmospheric model simulations), and a storyline approach using a set of pseudo-global warming regional climate simulations dedicated for this event.

Attribution based on the circulation analog method reveals that changes in the dynamical flow explain a fraction of more than 60% of increases in the probability of heatwaves. Furthermore, statistical attribution method indicates that such an event would have been potentially impossible without human-induced warming. The storyline approach demonstrates that background warming due to greenhouse gas emissions has significantly intensified the heatwave's magnitude and extended its duration. Under future warming scenarios, similar heatwave events are projected to become more frequent and intense. Our study underscores the growing vulnerability of the Antarctic climate system to future heatwave events, serving as a stark warning of the potential for polar extremes to intensify under global warming.

How to cite: Tang, H., Li, S., and Jones, J.: Unprecedented Winter Heatwave over East Antarctica in 2024, EGU General Assembly 2025, Vienna, Austria, 27 Apr–2 May 2025, EGU25-11237, https://doi.org/10.5194/egusphere-egu25-11237, 2025.

EGU25-11898 | Orals | CL3.1.3

Global scale mapping of unprecedented lifetime exposure to climate extremes 

Wim Thiery, Luke Grant, Inne Vanderkelen, Lukas Gudmundsson, Erich Fischer, and Sonia I. Seneviratne

Climate extremes such as heatwaves, river floods, droughts, crop failures, including aspects of wildfires and tropical cyclones, are increasingly attributable to anthropogenic climate change. Yet how this translates into unprecedented levels of extreme event exposure in one’s lifetime remains unclear. Here we show that, neglecting adaptation, many of today’s youth will experience unprecedented exposure to extremes during their lifetimes. For the events above, the share of people facing unprecedented lifetime exposure is projected to at least double from 1960 to 2020 birth cohorts under current mitigation policies aligned with a global warming pathway reaching 2.7 °C above pre-industrial temperatures by 2100. In a 1.5 °C pathway, ∼50% of people born in 2020 will experience unprecedented lifetime exposure to heatwaves. If global warming reaches 3.5 °C by 2100, this rises 30 to ∼90% of this birth cohort. For the same cohort and warming pathway, ∼30% will live with unprecedented exposure to crop failures and ∼10% to river floods. Further, under current policies, two indicators of vulnerability show that the most vulnerable experience significantly more unprecedented exposure to heatwaves than the least vulnerable. Our results call for sustained greenhouse gas emissions reductions to lower the burden of climate change on young generations

How to cite: Thiery, W., Grant, L., Vanderkelen, I., Gudmundsson, L., Fischer, E., and Seneviratne, S. I.: Global scale mapping of unprecedented lifetime exposure to climate extremes, EGU General Assembly 2025, Vienna, Austria, 27 Apr–2 May 2025, EGU25-11898, https://doi.org/10.5194/egusphere-egu25-11898, 2025.

EGU25-12014 | ECS | Orals | CL3.1.3

How climate change intensified storm Boris’ extreme rainfall, revealed by near-real-time storylines 

Antonio Sánchez Benítez, Marylou Athanase, Eva Monfort, Thomas Jung, and Helge F. Goessling

Understanding the impact of climate change on environmental extremes is of key importance for effective adaptation strategies. In this study, we used an innovative automated system that unveils the thermodynamical climate change signal of the day in near-real-time. To do so, we employed the so-called "event-based storyline approach". This method involves nudging our global CMIP6 coupled climate model (AWI-CM1) towards the observed large-scale free-troposphere winds, including the jet-stream, using various climate background conditions — preindustrial, present and 4ºC warmer climates.

Our analysis focuses on storm Boris, which resulted in record-breaking rainfall across Central and Eastern Europe in September 2024, causing catastrophic flooding. Our findings indicate that human-induced warming led to a 9% increase in rainfall associated with this storm. Furthermore, the area affected by extreme rainfall (exceeding 100 mm) expanded by 18% and would continue expanding in a future warmer climate. However, this future expansion is simulated to be more moderate due to a complex interplay between dynamics and thermodynamics. The case of Storm Boris demonstrates the potential of near-real-time storylines for rapid evidence-based climate change attribution and communication.

How to cite: Sánchez Benítez, A., Athanase, M., Monfort, E., Jung, T., and Goessling, H. F.: How climate change intensified storm Boris’ extreme rainfall, revealed by near-real-time storylines, EGU General Assembly 2025, Vienna, Austria, 27 Apr–2 May 2025, EGU25-12014, https://doi.org/10.5194/egusphere-egu25-12014, 2025.

EGU25-12923 | Orals | CL3.1.3

Constrained estimates of externally forced past and future warming for Canada 

Xuebin Zhang, Tong Li, and Francis Zwiers

Canada’s land mass, which extends well into the Arctic, has experienced some of the most rapid warming on Earth in recent decades. Here we apply a Bayesian observational constraint method to consistently assess the externally forced past, present and future warming in Canada, despite the presence of possible internal variability. Using observational constraints based on annual observational records of six Canadian sub-regions together with historical CMIP6 climate change simulations, we estimate that external forcing, which is almost entirely due to human activity, has warmed Canada by 2.1 [1.3, 2.8] °C between the 1850-1900 pre-industrial period and the recent 2015-2024 decade. Applying these same observational constraints to CMIP6 simulations of future climate conditions indicates that Canada will warm to 4.8 [3.5, 6.3] °C above pre-industrial levels by the end-of-century under an intermediate emissions scenario SSP 2-4.5, and to 6.2 [4.7, 7.9] °C under a high-emissions scenario SSP 3-7.0, with the largest warming projected for Northern Canada, followed by Quebec. The observational constraints, which were chosen and extensively evaluated using an imperfect model testing approach, reduce projected warming estimates for Canada relative to their unconstrainted counterparts, also materially reduce projection uncertainty.

How to cite: Zhang, X., Li, T., and Zwiers, F.: Constrained estimates of externally forced past and future warming for Canada, EGU General Assembly 2025, Vienna, Austria, 27 Apr–2 May 2025, EGU25-12923, https://doi.org/10.5194/egusphere-egu25-12923, 2025.

The global tropospheric temperature hit an all-time maximum in 2023. While new global average temperature records are routinely set as a result of greenhouse warming, the year-to-year rise in temperature from 2022 to 2023 is infrequently reproduced in climate models (e.g., Raghuraman et al. 2024). It is possible that such a rise in temperature could result from a unique manifestation of internal climate variability (e.g., Cattiaux et al. 2023). Earth recently experienced a transition from a prolonged La Niña event to an El Niño event. This phasing of ENSO variability is associated with increased odds of a spike in global temperature in climate models (e.g., Raghuraman et al. 2024). Other analyses indicate that multi-year trends in low cloud cover, aerosols, and the peak of the 11-year solar cycle are also important factors (e.g., Goessling et al. 2024). Now into 2025, we find that the year-to-year rise in temperature (over 2023 to 2024) is again large and the annual mean global tropospheric temperature anomaly (in 2024) exceeds the record set in the previous year. We examine the rapid and persistent rise in global tropospheric temperature using microwave-based measurements of tropospheric temperature from satellites. We contextualize the exceptional 2023-2024 warmth using model simulations of the a) pre-industrial period and b) the satellite era in order to estimate the effects of internal variability and greenhouse warming. We also explore the sensitivity of our results to model climate sensitivity and the representation of interannual variability with data from several large initial condition ensembles.

Cattiaux, J., Ribes, A., & Cariou, E. (2024). How extreme were daily global temperatures in 2023 and early 2024? Geophysical Research Letters, 51(19). https://doi.org/10.1029/2024gl110531

Goessling, H. F., Rackow, T., & Jung, T. (2024). Recent global temperature surge intensified by record-low planetary albedo. Science. https://doi.org/10.1126/science.adq7280

Raghuraman, S. P., Soden, B., Clement, A., Vecchi, G., Menemenlis, S., & Yang, W. (2024). The 2023 global warming spike was driven by the El Niño–Southern Oscillation. Atmospheric Chemistry and Physics, 24(19), 11275–11283. https://doi.org/10.5194/acp-24-11275-2024

Research at Lawrence Livermore National Laboratory was performed under the auspices of U.S. DOE Contract DE-AC52-07NA27344. This research was performed as part of the PCMDI Project, which is funded by the RGMA program area of the Office of Science at DOE.

How to cite: Po-Chedley, S.: The Exceptional Rise Global Tropospheric Temperature over 2022-2024, EGU General Assembly 2025, Vienna, Austria, 27 Apr–2 May 2025, EGU25-14244, https://doi.org/10.5194/egusphere-egu25-14244, 2025.

EGU25-15063 | Orals | CL3.1.3

Where is the probability of the next record-shattering extreme highest? 

Erich Fischer, Raphaël Huser, Iris de Vries, and Sebastian Sippel

Global mean temperatures are currently warming at a rate unprecedented in the observational record and most likely in millennia. Europe has experienced one of the highest warming rates globally in the last three decades. The high warming rate results from global greenhouse gas emissions and is regionally amplified by reduced aerosol emissions. Internal variability can both further amplify and damp the rate locally, for extended periods of time.

The exceptionally high forced warming rate is a crucial factor explaining the high frequency of record-breaking and record-shattering heat over land and oceans in recent decades. The ratio of occurrence of daily surface temperature records since 1950 (in ERA5 and the BEST gridded observational data set) relative to the theoretically expected occurrence in a stationary climate, is now about 3–3.5 for hot records globally.

To prepare for future record events, it is crucial to identify regions where the probability of breaking or shattering the local standing record is highest. Here, we use statistical tools to quantify the record probability conditional on the standing record level and identify hotspots of high record probability in the coming years. Our method is evaluated using several single-model initial condition large ensembles.

We demonstrate that the conditional probability of setting a new record is particularly high in years and regions where the standing record level is low relative to the forced response. This typically happens after periods of little to no warming, when a forced warming trend has been slowed down or muted by unforced internal variability. Ironically, it is thus often regions where recent trends were low that deserve particular attention with regard to preparing for record-shattering extremes.

We demonstrate that the biggest source of uncertainty relates to the separation of historical warming trends into the forced response and internal variability. We evaluate different methods to estimate the forced response and show that while the exact conditional probability is uncertain, the hot spot regions where the conditional record probability is high can be robustly identified.

How to cite: Fischer, E., Huser, R., de Vries, I., and Sippel, S.: Where is the probability of the next record-shattering extreme highest?, EGU General Assembly 2025, Vienna, Austria, 27 Apr–2 May 2025, EGU25-15063, https://doi.org/10.5194/egusphere-egu25-15063, 2025.

EGU25-15424 | ECS | Orals | CL3.1.3

Quantifying the Internal Variability of Midlatitude Storms Using Deep Learning 

Or Hadas and Yohai Kaspi

Extratropical storms shape midlatitude weather and are influenced by both the slowly evolving climate and rapid changes in synoptic conditions. While the impact of each factor has been extensively studied, their relative importance remains uncertain, creating challenges in resolving the signal-to-noise ratio necessary for attributing extratropical weather events to current anthropogenic climate change. Here, we quantify the climate's relative importance in both climatic storm activity and individual storm development using 84 years of ERA-5 data, tracks of 100,00 cyclones and 50,000 anticyclones, and Convolutional Neural Networks (CNNs). We find that the constructed CNN model predicts over 90% of the variability in climatic storm activity, indicating that, from a climatic perspective, internal variability is negligible. In contrast, a similar model predicts less than one-third of the variability in individual storm features, such as intensity, growth time, and trajectory, demonstrating that their variability is dominated by internal variability. Using this estimate of internal variability and the mean impact of present-day climate change, we calculate a signal-to-noise ratio for attribution of storm intensity of approximately 0.2%, highlighting the significant challenge in attributing extreme individual storms to anthropogenic climate change. However, a signal-to-noise ratio ten times higher is obtained for warm heat anomalies associated with storms, emphasizing the potential for attributing storm-related impacts that are directly linked to climate change.

How to cite: Hadas, O. and Kaspi, Y.: Quantifying the Internal Variability of Midlatitude Storms Using Deep Learning, EGU General Assembly 2025, Vienna, Austria, 27 Apr–2 May 2025, EGU25-15424, https://doi.org/10.5194/egusphere-egu25-15424, 2025.

In the aftermath of an impactful heatwave, storm or flood, attribution studies often ask whether events like this are becoming more intense due to climate change. Answers to this question can be deduced both from unconditional extreme value statistics and from approaches like storylines or circulation analogues, which analyze the event conditional on the dynamical weather conditions. But can we compare these two kinds of statements? How should we interpret situations where they disagree? This talk takes a systematic look at different notions of intensity changes. We see examples where conditional and unconditional approaches are fundamentally incomparable and find special cases where they can reasonably be compared and potentially combined into a single attribution statement.

How to cite: Buschow, S.: Unconditional apples and conditional oranges: can we compare different styles of attribution?, EGU General Assembly 2025, Vienna, Austria, 27 Apr–2 May 2025, EGU25-15959, https://doi.org/10.5194/egusphere-egu25-15959, 2025.

EGU25-17239 | Orals | CL3.1.3

Unprecedented 2023 Winter Heatwave in the Andes 

Sihan Li, Sutapa Bhattacharjee, Emily Potter, Julie Jones, Bethan Davies, and Jeremy Ely

In August 2023, South America experienced one of the most extreme heatwave events ever recorded, marking the warmest start to August in 117 years with temperature anomalies 10–20°C above the seasonal average. The heatwave impacted parts of Chile, northern Argentina, and southwestern Brazil, with temperatures in the Chilean Andes surpassing 38°C. Remote sensing images revealed widespread snowmelt across the Andes, and observations also suggested significant impacts on hydrological patterns, including spikes in winter runoff, affecting downstream water availability. Snow and glaciers in the Andes are essential reservoirs that sustain water supplies for millions of people. Winter plays a pivotal role in snowpack formation, which is crucial for the long-term stability of these resources. Extreme heatwave events during winter disrupt these processes, accelerating glacier retreat and snowmelt. This not only threatens water availability for agriculture, hydropower, and human consumption but also alters critical hydrological and ecological systems.

This study performs the first dedicated attribution on the 2023 unprecedented winter heatwave in the Andes, with a novel multi-method approach, combining 1) circulation analogue method, 2) statistical attribution method, and 3) physical-based storyline approach through a set of convective-permitting scale (4-km resolution) regional model simulations (CPRCM) over the Andes, to unpack the roles played by the blocking anticyclone, developing El Niño in the Pacific Ocean that year, and anthropogenic greenhouse gas emissions. The study leverages existing multiple global model simulations from Coupled Model Intercomparison Project Phase 6, a set of model simulations from the Large Ensemble Community Project, and the CPRCM simulations run in-house. Here we present initial findings from this attribution study on the attributed contributions from the different drivers to the spatial extent, intensity, and duration of the heatwave, as well as results on the changing frequency of occurrences between the current and pre-industrial climates using the large ensembles.

As global temperatures continue to rise, extreme winter heatwaves like this are projected to become more frequent, with profound consequences for snowpack dynamics and glacier stability in the Andes. This extraordinary winter heatwave serves as a stark reminder of the accelerating effects of climate change and the urgent need for adaptive strategies to protect critical Andean water systems.

How to cite: Li, S., Bhattacharjee, S., Potter, E., Jones, J., Davies, B., and Ely, J.: Unprecedented 2023 Winter Heatwave in the Andes, EGU General Assembly 2025, Vienna, Austria, 27 Apr–2 May 2025, EGU25-17239, https://doi.org/10.5194/egusphere-egu25-17239, 2025.

EGU25-17873 | Posters on site | CL3.1.3

Compound extreme event attribution: hot and dry events in Belgium 

Cristina Deidda, Patrick Willems, Jakob Zscheischler, and Wim Thiery

Compound weather and climate events refer to combinations of multiple weather and climate rivers and/or hazards that lead to potentially large impacts. Not only will single extreme events become more frequent in the future, but there will also be a higher likelihood of high-impact compound events. Extreme events are more likely to occur simultaneously, leading to increased damage and impact on the territory. Extreme Event Attribution (EEA) is an emerging field in climate sciences. One of the goals is to describe whether and how the probability of an event depends on climate change. Extreme event attribution typically focuses on univariate assessments, often leading to an underestimation of the risks and actual damages attributable to climate change.

While compound weather and climate events can result in significant socioeconomic consequences, their attributability to climate change remains largely unexplored. Here, we present a compound event attribution study assessing the change in probability of having co-occurrent hot and dry events in Belgium with and without climate change.

How to cite: Deidda, C., Willems, P., Zscheischler, J., and Thiery, W.: Compound extreme event attribution: hot and dry events in Belgium, EGU General Assembly 2025, Vienna, Austria, 27 Apr–2 May 2025, EGU25-17873, https://doi.org/10.5194/egusphere-egu25-17873, 2025.

EGU25-18112 | ECS | Orals | CL3.1.3

From Weather to Climate: Using Medium-Range Forecasts to Quantify Long-Term Trends in Extreme Events 

Olivia Vashti Ayim, Myles Allen, and Nicholas Leach

The frequency and intensity of some extreme weather events, such as heatwaves,
are increasing due to climate change, with significant implications for socio-economic
sectors globally. This study focuses on the question of how we quantify the rate at
which the probability of these severe events is changing, enhancing our ability to
support effective adaptation strategies and deepen our understanding of climate
change’s diverse impacts on different regions and populations. Our initial case
study uses the ECMWF’s Reforecast dataset to analyse trends and the evolving
risk of extreme high summer temperatures in the Pacific Northwest. We specifi-
cally explore the relationship between the probability of exceeding climatological
temperature thresholds and local, regional, and global temperature changes. We
identify a consistent relationship, statistically significant in the case of local and
regional trends, allowing large-scale temperature trend information to be used to
provide an estimate of a risk-doubling time to complement other approaches. Our
results indicate that regional and local rising temperatures significantly elevate
the likelihood of extreme weather events, highlighting the growing risk associated
with climate change. Our evaluation confirms the ECMWF Reforecast data as a
reliable model to use as a potential source for such analyses, although limited by
the relatively short (20-year) length of the dataset.

How to cite: Ayim, O. V., Allen, M., and Leach, N.: From Weather to Climate: Using Medium-Range Forecasts to Quantify Long-Term Trends in Extreme Events, EGU General Assembly 2025, Vienna, Austria, 27 Apr–2 May 2025, EGU25-18112, https://doi.org/10.5194/egusphere-egu25-18112, 2025.

EGU25-18150 | Orals | CL3.1.3

On the nature and attribution of severe droughts in the Amazon and Orinoco River basins in 2023 and 2024 

Neven Fučkar, Gracie Allen, Myles Allen, and Michael Obersteiner

As anthropogenic emissions of greenhouse gasses continue to increase, in 2024 we have experienced the hottest year on observational record globally, while the last ten years are the warmest ten years. Accelerating global climate change is intensifying the water cycle, leading to more frequent and/or severe droughts and floods as well as rapid transition between these opposite extremes in many parts of the world. Wide areas of the Amazon and Orinoco watersheds have endured severe drought in 2023 (the 2nd hottest year on record) and 2024 while El Niño-Southern Oscillation (ENSO, the dominant mode of internal climate variability at interannual timescales) was in El Niño (positive) phase and neutral conditions for most of this time. Some of the Amazon’s largest tributaries dropped to their lowest levels since records began in 1902, while more than 1700 schools and 760 health centres in the Amazon were inaccessible or out of reach at least at one point in the last two years. 

We examine dynamic and thermodynamic mechanisms leading to drought in both dry (JJASON) and wet (DJFMAM) seasons and their multiple combinations in the Amazon and Orinoco watersheds in 2023 and 2024. We employ multi-method attribution analysis to reveal the role of climate change leading to such prolonged and impactful drought conditions in this wider tropical region of the South America. We combine observational and reanalysis products with large ensembles of CMIP5/6 historical simulations and future projections to analyse the role of climate change and ENSO leading to these extreme events on timescales from six months to two years. We also use Met Office HadGEM3-A attribution system to assesses to what extent anthropogenic forcing has modified the probability and magnitude of multiple classes of meteorological droughts in the region experienced over the last two years. We explore both dynamically unconditional and conditional perspectives in our attribution analysis. Preliminary results point to a key role of climate change in likelihood and intensity of such droughts in both dry and wet seasons as well as from annual perspective in 2023 and 2024.   


How to cite: Fučkar, N., Allen, G., Allen, M., and Obersteiner, M.: On the nature and attribution of severe droughts in the Amazon and Orinoco River basins in 2023 and 2024, EGU General Assembly 2025, Vienna, Austria, 27 Apr–2 May 2025, EGU25-18150, https://doi.org/10.5194/egusphere-egu25-18150, 2025.

EGU25-18518 | Posters on site | CL3.1.3

Autumn and Winter storms over UK and Ireland about 20% wetter due to human-induced Climate Change 

Sarah Kew, Mark McCarthy, Emily Wallace, Jennifer Pirret, Oliver Claydon, Fraser Lott, Ciara Ryan, Barry Coonan, James Pope, Ellie Murtagh, Maja Vahlberg, Adwoa Amankona, Izidine Pinto, Clair Barnes, Sjoukje Philip, Friederike Otto, and Sam Fraser-Baxter

The 2023/2024 storm season for the UK and Ireland was exceptionally wet as a whole, as well as ‘hosting’ a notably large number of named storms, some of which led to devastating flooding, with cascading impacts on human health, food production and the cost of living.

Here we present a attribution study for the Oct-Mar season, quantifying the role of human-induced climate change on the frequency and intensity of strong winds and heavy rainfall on storm days as well as total precipitation for the season as a whole. The storm severity index (SSI) is used to identify stormy days and as an indication of wind intensity. We use probabilistic attribution methods following the world weather attribution protocol, synthesising trends in observations with climate models and communicating uncertainties. 

The rainfall associated with storms was found to have become about 20% more intense and that the 2023/24 level has become about a factor of 10 more likely. Climate change was also found to have a strong influence on Oct-Mar precipitation totals, in line with expectations. The influence of climate change on storm winds, was less clear however, with average wind (SSI) on stormy days being found to have decreased slightly. Possible reasons for this will be discussed in the light of relevant literature. We also highlight the importance of vulnerability and exposure information in combination with attribution outcomes to provide recommendations for reduced impacts.

How to cite: Kew, S., McCarthy, M., Wallace, E., Pirret, J., Claydon, O., Lott, F., Ryan, C., Coonan, B., Pope, J., Murtagh, E., Vahlberg, M., Amankona, A., Pinto, I., Barnes, C., Philip, S., Otto, F., and Fraser-Baxter, S.: Autumn and Winter storms over UK and Ireland about 20% wetter due to human-induced Climate Change, EGU General Assembly 2025, Vienna, Austria, 27 Apr–2 May 2025, EGU25-18518, https://doi.org/10.5194/egusphere-egu25-18518, 2025.

EGU25-19155 | ECS | Orals | CL3.1.3

Attribution of observed impacts of climate change on crop yields and economic damages from extreme weather events 

Mansi Nagpal, Jasmin Heilemann, Christian Klassert, Emanuele Bevacqua, Oldrich Rakovec, Luis Samaniego, Bernd Klauer, and Erik Gawel

As climate change intensifies, regions worldwide face increasing impacts from extreme weather events including, compound and successive occurrences. These events pose significant risks to agriculture, where weather variability directly affects crop yields and revenue. Understanding the role of human-induced climate change in exacerbating these effects is essential for informed decision-making. In this study, we quantify the direct yield damages and associated revenue losses of extreme weather events attributable to human-induced climate change in Germany from 2018 to 2022. We achieve this by simulating crop yields using crop-specific statistical yield model under observed (factual) climate data and counterfactual climate simulations, where the human-induced climate change trend is removed from observed climate data. The statistical yield model isolates the impact of multiple extreme weather events on crop yields. It employs the Least Absolute Shrinkage and Selection Operator (LASSO) approach, a penalized regression method that selects the most relevant predictors. This model is applied to eight key crops—winter wheat, winter barley, rapeseed, maize, spring barley, spring oats, sugar beets, and potatoes—that collectively account for 75% of Germany's agricultural area. The model integrates predictors derived using precipitation, temperature, and soil moisture data to represent yield-influencing extreme weather events.

Our preliminary findings reveal that the extreme weather impacts of climate change on crop yields vary significantly across crop types. Winter crops, including rapeseed, winter barley, and winter wheat, demonstrate average yield gains attributable to climate change across 2018–2022, with increases of 5.71%, 3.08%, and 1.56%, respectively. In contrast, the impacts on summer crops is mixed with crops like sugar beets and potatoes show average yield gains of 3.05% and 1.74%, respectively, silage maize and oats experience yield reductions, with silage maize yields declining by 2.52%. Despite yield gains for most field crops, the revenue losses highlight significant economic damage, with annual revenue damage due to extreme events attributable to climate change amounting to 184 million Euros across Germany from 2018 to 2022. The findings provide valuable insights for cost-benefit analyses in mitigation strategies and support climate-resilient agricultural policymaking to address the growing challenges posed by extreme weather events.

How to cite: Nagpal, M., Heilemann, J., Klassert, C., Bevacqua, E., Rakovec, O., Samaniego, L., Klauer, B., and Gawel, E.: Attribution of observed impacts of climate change on crop yields and economic damages from extreme weather events, EGU General Assembly 2025, Vienna, Austria, 27 Apr–2 May 2025, EGU25-19155, https://doi.org/10.5194/egusphere-egu25-19155, 2025.

EGU25-20721 | ECS | Posters on site | CL3.1.3

GDNat: a global, daily, high-resolution, natural-forcing only temperature data set for attribution research 

Robert Fofrich, Kelly McCusker, Steven Malevich, and Robert Kopp

Attribution studies are crucial for understanding the anthropogenic contributions to meteorological extremes and have com-
monly relied on approaches that compare historical observations with global climate model (GCM) simulations that are driven
solely by natural forcing (Bindoff et al. (2013)). However, GCM simulations have limited spatial resolution and are biased by
parameterized climate processes and uninitialized conditions that lead to the lack of representation of historical meteorological
events (Cannon et al. (2015); Eyring et al. (2016); Almazroui (2021); Zhang et al. (2023)). We address these gaps by devel-
oping a novel, high-resolution dataset that provides daily average global temperatures over the past four decades without the
influence of anthropogenic climate forcing. We use quantile delta mapping (QDM), a quantile trend-preserving bias adjust-
ment method, to remove anthropogenic warming from the fifth generation of the European Centre for Medium-Range Weather
Forecasts Reanalysis (ERA5) using historical and natural-forcing-only simulations from the Coupled Model Intercomparison
Project Phase 6 (CMIP6). The resulting dataset consists of historical Global Daily Natural temperature (henceforth, GDNat)
records at 0.25 x 0.25 spatial resolution from 1979 - 2020, providing a valuable resource for attributing extremes and their
impacts to anthropogenic warming.

How to cite: Fofrich, R., McCusker, K., Malevich, S., and Kopp, R.: GDNat: a global, daily, high-resolution, natural-forcing only temperature data set for attribution research, EGU General Assembly 2025, Vienna, Austria, 27 Apr–2 May 2025, EGU25-20721, https://doi.org/10.5194/egusphere-egu25-20721, 2025.

EGU25-2849 | ECS | Orals | CL3.1.5

A year above 1.5 °C signals Earth is most probably within the 20-year period that reaches the Paris Agreement limit 

Emanuele Bevacqua, Carl-Friedrich Schleussner, and Jakob Zscheischler

The temperature goals of the Paris Agreement are measured as 20-year averages exceeding a pre-industrial baseline. A first single calendar year above 1.5 °C relative to pre-industrial levels is imminent and may have already occurred in 2024, but the implications for the corresponding temperature goal are unclear. Here, we show that, without very stringent climate mitigation, the first year above 1.5 °C occurs within the first 20-year period with an average warming of 1.5 °C. This is due to the ongoing strong anthropogenic multi-decadal warming trend that renders it very unlikely for the temperature of a single year to exceed the average temperature over the coming decades. The results provide an early warning that signals the onset of a period where the climate impacts of a 1.5 °C warmer world will start to emerge, underscoring the urgency of adaptation action. Yet, our findings also indicate that, by rapidly slowing down the warming rate, very stringent near-term mitigation may substantially reduce risks of exceeding the 1.5 °C global warming level soon after the first single year above 1.5 °C has occurred.

How to cite: Bevacqua, E., Schleussner, C.-F., and Zscheischler, J.: A year above 1.5 °C signals Earth is most probably within the 20-year period that reaches the Paris Agreement limit, EGU General Assembly 2025, Vienna, Austria, 27 Apr–2 May 2025, EGU25-2849, https://doi.org/10.5194/egusphere-egu25-2849, 2025.

EGU25-4403 | Orals | CL3.1.5

Assessing the Realism of the TIPMIP ESM idealized Experiment Protocol 

Jeremy Walton, Ranjini Swaminathan, Colin Jones, Andrea Dittus, Spencer Liddicoat, Steven Rumbold, and Robin Smith

The TIPMIP ESM experiment protocol employs a specified CO2-emission rate, unique to each participating model, to achieve a common linear increase in global mean surface air temperature of ~0.2K/decade for integrations started from a pre-industrial (piControl) run. This is referred to as the ramp-up phase of TIPMIP.  At different levels of global warming (GWL) into the ramp-up, models switch to zero CO2 emissions and run in this mode for 500 years. Using CO2 emissions only, it is possible to control the rate of global warming across models and also ensure that models branch into zero-emission runs at the same GWL after the same period and rate of (ramp-up) warming. While the simplicity and commonality of warming across models is a positive feature of the protocol, it is reasonable to ask how representative of real-world global warming the protocol is. We address this question by comparing simulations made with version 1.2 of the UK Earth System Model  (UKESM1.2). We compare a 4-member ensemble of UKESM1.2 following the TIPMIP ramp-up protocol (i.e. CO2 emissions only started from a piControl run) against a 4-member ensemble using full CMIP6 historical forcing started from the same piControl. We compare the two ensembles over a 40-year period that approximately covers global warming of 0.2 to 1.0K above pre-industrial values. This corresponds to the interval 1975-2015 for the historical runs, and to years 10 to 50 of the ramp-up. We compare key metrics across the two ensembles, focusing on radiation and energetics, the cryosphere, carbon cycle, and modes of variability, examining both the mean climate and temporal trends across the 40-year period. Initial results suggest the TIPMIP ramp-up compares well to the full historical runs, as well to observations, providing confidence that conclusions drawn from a multi-model assessment of the TIPMIP protocol will be relevant to the real world.

How to cite: Walton, J., Swaminathan, R., Jones, C., Dittus, A., Liddicoat, S., Rumbold, S., and Smith, R.: Assessing the Realism of the TIPMIP ESM idealized Experiment Protocol, EGU General Assembly 2025, Vienna, Austria, 27 Apr–2 May 2025, EGU25-4403, https://doi.org/10.5194/egusphere-egu25-4403, 2025.

EGU25-5917 | ECS | Orals | CL3.1.5

Unpacking uncertainty in Carbon Dioxide Removal requirements 

Quirina Rodriguez Mendez, Sabine Fuss, and Felix Creutzig

Deep uncertainty about the costs and resource limits of carbon dioxide removal (CDR) options challenges the design of robust portfolios. To address this, we identified key uncertainties in CDR pathways and developed the CDR-SPEC model, a mixed-integer linear optimization model for cost-optimal and time-dependent CDR portfolios with endogenous treatment of technology cost dynamics. Within this framework, we sampled the option space to explore the impact of input parametric uncertainty on the composition and performance of CDR portfolios. The resulting database contains detailed information about how varying combinations of uncertainty conditions trigger the implementation of different CDR portfolios. What is missing is an understanding of which factors drive large variability in the outcomes, where outcome is understood as any metric of performance, without making assumptions about their desirability.

To shed light on this, we recur to the concept of entropy, a measure of the uncertainty in a distribution. We use this as a proxy for guiding an exploration strategy that aims at maximising the amount of information gained about a desired outcome, providing a comparative assessment of each uncertain parameter’s contribution to an outcomes distribution. This assessment shows that among all parameters represented in CDR-SPEC, cumulative (i.e., from 2020 to 2100) removal requirements (CRR) drives the largest entropy reductions across a series of outcomes. The interpretability of this result is nevertheless challenged by the multitude of uncertainty dimensions this parameter englobes: it represents both scenario uncertainty (i.e., how much abatement takes place for different greenhouse gases) and climate response uncertainty (i.e., potential additional CDR incurred when considering beyond-median warming outcomes). Unpacking these two dimensions bundled under CRR would allow highlighting the relative impact of key uncertainties in the science that informs CDR-deployment policies.

Representing all three dimensions of uncertainty (i.e., CDR-specific, scenario and climate response uncertainty) requires expanding our understanding of the impacts of different CDR approaches on global temperatures under varying assumptions on how the earth system responds to emissions. This could be achieved by, for a fixed illustrative mitigation pathway and set of CDR-specific parameters, iterating the results from the CDR portfolio analysis in a simple climate emulator until the removals required for climate stabilisation and the removals delivered by the CDR portfolio converge. For many illustrative mitigation pathways and sets of CDR-specific parameters, this results in a database which disentangles all three dimensions of uncertainty mentioned above.

How to cite: Rodriguez Mendez, Q., Fuss, S., and Creutzig, F.: Unpacking uncertainty in Carbon Dioxide Removal requirements, EGU General Assembly 2025, Vienna, Austria, 27 Apr–2 May 2025, EGU25-5917, https://doi.org/10.5194/egusphere-egu25-5917, 2025.

EGU25-6081 | Orals | CL3.1.5

Towards Net Zero: Evaluating Combined Terrestrial and Marine CDR Approaches 

Anusha Sathyanadh, Helene Muri, Homa Esfandiari1, Timothée Bourgeois, Jörg Schwinger, Tommi Bergman, Antti-Ilari Partanen, Matvey Debolsky, Miriam Seifert, and David Keller

With the global annual mean temperature in 2024 exceeding 1.5°C above preindustrial levels, there is an urgent need to investigate pathways for returning the Earth system to lower temperature levels. In addition to stringent emission reduction, we need portfolios of Carbon Dioxide Removal (CDR) techniques to achieve the net-zero emission target. Therefore, it is crucial to evaluate various land and ocean-based CDRs for their effectiveness, environmental risks, and additional benefits.

This study evaluates the CO₂ sequestration potential and efficacy of two prominent CDR methods—Bioenergy with Carbon Capture and Storage (BECCS) and Ocean Alkalinity Enhancement (OAE)—applied both individually and in combination. Using the Norwegian Earth System Model (NorESM2-LM), simulations were designed with ramped-up CDR deployment, targeting 5.2 million km² of bioenergy feedstock for BECCS and a CaO deployment rate of 2.7 Gt/year for OAE by 2100 across the exclusive economic zones of Europe, the United States, and China. The results reveal a nearly additive carbon removal effect of BECCS and OAE.   Over the period 2030-2100, OAEsequestered a total of 7 ppm of CO2 with an accumulated 82.3 Gt CaO, achieving a CDR effectiveness of 0.08 ppm per Gt of CaO, while BECCS removes 23 ppm of CO2, with CDR effectiveness of 3.1 ppm per million km² of bioenergy crops.  The combined BECCS-OAE simulation offsets anthropogenic CO₂ emissions of 5.4 Gt/year by 2100—equivalent to over 60% of current global transport sector emissions. However, the combined CDR scenario shows negligible effects on the global annual mean temperature, with no clear response detectable against the high internal variability. This underscores the limitations of current CDR approaches in addressing climate warming over the 21st century and emphasizes the need for substantial emissions reductions, supportive policies and diversified CDR strategies to facilitate a return to lower global temperatures.

How to cite: Sathyanadh, A., Muri, H., Esfandiari1, H., Bourgeois, T., Schwinger, J., Bergman, T., Partanen, A.-I., Debolsky, M., Seifert, M., and Keller, D.: Towards Net Zero: Evaluating Combined Terrestrial and Marine CDR Approaches, EGU General Assembly 2025, Vienna, Austria, 27 Apr–2 May 2025, EGU25-6081, https://doi.org/10.5194/egusphere-egu25-6081, 2025.

EGU25-7548 | ECS | Orals | CL3.1.5

Irreversibility and hysteresis in regional temperature extreme frequency under net-negative CO2 emissions 

Spencer Clark, Andrew King, Josephine Brown, Liam Cassidy, and Eduardo Alastrué de Asenjo

Currently implemented emission reduction policies are projected to result in anthropogenic warming of the climate system beyond the 1.5 ºC and 2ºC temperature targets of the Paris Agreement. Consequently, achieving the Agreement objectives may only be possible following a period of ‘overshoot’, where warming temporarily exceeds either of these targets, before later declining and stabilising below them through net-negative CO2 emissions. Whilst previous studies have illustrated that global mean surface temperature rise is reversible under net-negative CO2, it remains unclear whether other human-induced climate impacts will exhibit the same degree of reversibility. This study assesses the irreversibility and hysteresis behaviour of regional temperature extreme frequencies under net-negative CO2 emissions. We analyse the results of eight Earth System Models that have completed the Carbon Dioxide Removal Model Intercomparison Project (CDRMIP) Tier 1 experiment, in which atmospheric CO2 concentrations follow a symmetric 1% per year rise and decline between their preindustrial level and up to quadruple this value. For equivalent global warming levels reached through periods of positive and negative emissions respectively, we observe a high degree of hysteresis and short-term irreversibility in extreme temperature frequency across most land and ocean regions, with the sign of such changes displaying a general hemispheric asymmetry. Whilst much of this behaviour can be attributed to ongoing thermal inertia, our results suggest non-linearities in large-scale climate components, such as the Atlantic Meridional Overturning Circulation and El Niño-Southern Oscillation, may contribute to centennial-scale, irreversible changes in regional temperature extreme frequency under net negative CO2 emissions.

How to cite: Clark, S., King, A., Brown, J., Cassidy, L., and Alastrué de Asenjo, E.: Irreversibility and hysteresis in regional temperature extreme frequency under net-negative CO2 emissions, EGU General Assembly 2025, Vienna, Austria, 27 Apr–2 May 2025, EGU25-7548, https://doi.org/10.5194/egusphere-egu25-7548, 2025.

EGU25-9113 | ECS | Posters on site | CL3.1.5

Impacts and reversibility of meltwater-induced future Atlantic Meridional Overturning Circulation changes 

Oliver Mehling, Katinka Bellomo, Federico Fabiano, Marion Devilliers, Susanna Corti, and Jost von Hardenberg

The Atlantic Meridional Overturning Circulation (AMOC) is projected to weaken in the future due to increasing greenhouse gas concentrations, but it is still debated whether anthropogenic climate change can induce an irreversible collapse or “tipping” of the AMOC. Meltwater from the Greenland ice sheet has often been invoked as a key mechanism for a potential AMOC tipping, but it is not explicitly represented in most state-of-the-art (CMIP6) climate models, adding further uncertainty to assessing the likelihood of irreversible AMOC change.

Here, we perform ensemble simulations with the CMIP6 model EC-Earth3 to assess the effects of future Greenland ice sheet melt and to probe AMOC reversibility with and without Greenland meltwater. To this end, we force EC-Earth3 with a strong global warming scenario (SSP5-8.5) and a high-end Greenland meltwater estimate from the coupled climate–ice sheet model CESM2-CISM2 until 2300.

We find that, as expected, the addition of Greenland meltwater significantly exacerbates the greenhouse gas-induced AMOC weakening especially after the 21st century, with differences mostly attributable to the Arctic Ocean. However, we find no indication of an abrupt AMOC weakening. We then branch off idealized reversibility experiments in which the meltwater and/or greenhouse gas forcings are reversed. Although the AMOC recovery is slow (around two centuries), meltwater-driven additional AMOC weakening in EC-Earth3 appears to be reversible. Regardless of the added meltwater, the AMOC also recovers in an idealized CO2 ramp-down experiment, even overshooting its present-day strength. While our modeling results show little support for an irreversible AMOC change due to future Greenland ice sheet melt, they do underline the importance of representing meltwater in future projections, including overshoot pathways.

How to cite: Mehling, O., Bellomo, K., Fabiano, F., Devilliers, M., Corti, S., and von Hardenberg, J.: Impacts and reversibility of meltwater-induced future Atlantic Meridional Overturning Circulation changes, EGU General Assembly 2025, Vienna, Austria, 27 Apr–2 May 2025, EGU25-9113, https://doi.org/10.5194/egusphere-egu25-9113, 2025.

EGU25-9195 | ECS | Orals | CL3.1.5

Projecting long-term pathways of greenhouse gas emissions and carbon dioxide removal with an Integrated Assessment Model emulator 

Weiwei Xiong, Katsumasa Tanaka, Daniel J. A. Johansson, Leon Merfort, and Nico Bauer

Integrated Assessment Models (IAMs) combine economy, energy, and sometimes land-use modeling approaches and are commonly used to evaluate climate policies under least-cost scenarios. The marginal abatement cost (MAC) curve approach has been commonly used in climate policy analyses to show the carbon price level for a given abatement level, which has also been applied as a way to parameterize the complex behavior of IAMs. Here, we propose a new methodological framework to i) emulate the IAM’s emission reductions in response to carbon price pathways through MAC curves (i.e., IAM emulator) and then ii) extend IAM’s emission pathways (usually given until 2100) to 2300 with the emulator.

As part of the Horizon Europe RESCUE and OptimESM projects, our approach is used to extend the greenhouse gas (GHG) emission pathways from different sources and carbon dioxide removal (CDR) pathways generated by the REMIND-MAgPIE model. A key feature of the approach is that we individually capture the emission reductions associated with CDRs (i.e., afforestation, bioenergy and carbon capture and storage (BECCS), direct air capture with carbon storage (DACCS), industrial CCS, and ocean alkalinity enhancement (OAE)) through MAC curves. Our approach relies on the following simplifying assumptions: i) MAC curves are assumed time-independent over periods, ii) abatement levels are assumed independent across GHGs (CO2, CH4, and N2O), sectors (energy- and non-energy-related emissions), and CDR options, and iii) a uniform carbon price is used across sectors and CDRs, with the GWP100 metric used to fix the price ratios between different GHGs.

We approximated the dynamics of REMIND-MAgPIE with MAC curves, using equation log(f(x)+1)=a*xb+c*xd for sectoral gases and equation f(x)=a*xb+c*xd for CDR options, respectively. f(x) represents the corresponding carbon price level at x, while the variable x represents the abatement level relative to the assumed baseline level, expressed as a percentage for sectoral emissions or the absolute amount of CO2 removed for CDR options. a, b, c, and d are the parameters that are optimized for each case. Additionally, we derived the maximum abatement levels of REMIND-MAgPIE from its simulation results under all carbon budgets, which reflect the limit of, for example, CCS capacity and sectoral mitigation potential. We also calculated for each gas, sector, and CDR option the maximum first and second derivatives of temporal changes in abatement levels to capture the limits of the technological change rate and the socio-economic inertia.

By combining the IAM emulator with a reduced-complexity climate model ACC2, we further derived extended emission pathways beyond 2100 using the least-cost approach for temperature trajectories (1 °C, 1.5 °C, and 2 °C) with overshoots of up to 2 °C. These pathways illustrate various CDR use cases over the coming centuries. Our extended scenarios, generated on the basis of long-term climate-economy interactions, can serve as input to Earth System Models investigating the long-term consequences of climate change mitigation strategies, particularly the implications of CDR deployment and associated Earth system dynamics over centennial timescales.

How to cite: Xiong, W., Tanaka, K., Johansson, D. J. A., Merfort, L., and Bauer, N.: Projecting long-term pathways of greenhouse gas emissions and carbon dioxide removal with an Integrated Assessment Model emulator, EGU General Assembly 2025, Vienna, Austria, 27 Apr–2 May 2025, EGU25-9195, https://doi.org/10.5194/egusphere-egu25-9195, 2025.

EGU25-9780 | Posters on site | CL3.1.5

Climate extremes at various global warming levels 

Klaus Wyser, Torben Koenigk, Shuting Yang, Chuncheng Guo, Shiyu Wang, and Carolina Nilsson

The Optimal High-Resolution Earth System Models for Exploring Future Climate Changes (OptimESM) project aims at developing the next generation of ESMs, bringing together increased model  resolution and process realism. Project partners committed to provide a set of idealised simulations with state-of-the-art Earth System Models (ESMs) that go beyond CMIP6 experiments. In particular, there are new ESM simulations with zero CO2 emissions to represent different global warming levels (GWLs), including previous temperature overshoots. These new simulations take into account the committed warming from a gradually warming climate and thereby differ from the widely used time slots around a point in time when a transient climate simulation passes a given future warming level.

First results from these idealised simulations with EC-Earth3-ESM, a post-CMIP6 configuration of the EC-Earth model family will be presented. We analyse and compare the strength and duration of climate extremes at different GWLs with CLIMIX tools, including a comparison against a pre-industrial control  and a historical climate simulation.

How to cite: Wyser, K., Koenigk, T., Yang, S., Guo, C., Wang, S., and Nilsson, C.: Climate extremes at various global warming levels, EGU General Assembly 2025, Vienna, Austria, 27 Apr–2 May 2025, EGU25-9780, https://doi.org/10.5194/egusphere-egu25-9780, 2025.

The eruption of Mount Tambora in 1815 cooled the global climate and caused famines due to crop failures in the "year without summer". Such changes to Earth system conditions, triggered by volcanic activity, increase the uncertainty surrounding future climate change. However, the subsequent response of land carbon uptake and its potential implications for future emission pathways are not well-explored. While multi-annual mean responses are predictable and aid emission budget estimations, higher-order variability in land carbon flux and the effects of non-CO2 forcings, like volcanic aerosols, remain uncertain. Aerosols cause variability by altering the Earth’s radiation balance, reducing surface temperature, and modulating precipitation patterns, driving substantial regional climate change. Additionally, state-dependent non-linearities, such as regional sensitivity differences to aerosol forcing, complicate the climate’s response.

This study utilizes advanced Earth system model simulation to compare ensembles with both semi-stochastic and constantly recurring explicit volcanic forcing to examine their effect on land carbon flux variability in an overshoot scenario. Analyzing temperature and carbon flux spectra, along with mean standardized anomalies from global to regional scales, reveals the temporal and spatial structures of variability driven by intermittent volcanic forcing. On the event scale, we detect the system response via autoregressive processes, which allows us to quantify the impacts of individual events on the terrestrial carbon stock. We put these findings into the context of emission scales in future pathways.

We find a connection between increased volcanic forcing and more considerable variability in land carbon uptake, which seems to be exacerbated at lower CO2 forcing.  Because of this state-dependency, the effect varies along the overshoot pathway. Additionally, intermittent volcanic forcing affects carbon flux variability, most prominent on decadal timescales and regional proximity of the eruption. Our study indicates that both positive and negative carbon stock impacts are more variable with increasing event magnitude. However, attribution is challenging due to low signal-to-noise ratios and internal climate variability. The results identify vegetation carbon from the equatorial regions as the primary driver of these polar impacts, with minor positive contributions from soil and litter carbon in northern latitudes. While the average impact across the ensemble approaches zero, the cumulative effects of individual simulations can vary up to the order of the annual terrestrial carbon sink. These results hint that future emission pathways should consider a more realistic volcanic forcing when assessing the land carbon stock's transient behaviour. However, they also require validations through model comparisons. Intermittent volcanic forcing could also represent a natural analog to assess the impacts of stratospheric aerosol injection, a geoengineering method to counteract global warming with sulfur aerosols.

How to cite: Schürmann, T., Adam, M., and Rehfeld, K.: Testing the impacts of natural climate variability on land carbon uptake and overshoot emission pathways in an Earth System Model, EGU General Assembly 2025, Vienna, Austria, 27 Apr–2 May 2025, EGU25-10557, https://doi.org/10.5194/egusphere-egu25-10557, 2025.

EGU25-11943 | ECS | Orals | CL3.1.5

North Atlantic Ocean Circulation Changes Under Increased CO2 Concentrations Using a High-Resolution Global Coupled Climate Model  

René Gabriel Navarro Labastida, Mehdi Pasha Karami, Torben Koenigk, Agatha de Boer, and Marie Sicard

This study aims to analyze the effect of increasing atmospheric CO2 concentrations on the Atlantic Meridional Overturning Circulation (AMOC) and its dependence on North Atlantic deep water formation. We used EC-Earth3-HR, the high-resolution version of the global coupled climate model EC-Earth3, with a spatial resolution of about 0.25 degrees in the ocean and 40 km in the atmosphere. Our configuration has undergone a tuning process, and a multi-centennial spin-up has been performed. The experiments analyzed consist of a pre-industrial control simulation (piControl), a one percent per year increase in CO2 experiment (1pctCO2), branching from year 250 of the piControl simulation, and two experiments with fixed CO2 concentrations (400.9 ppm and 551.5 ppm). These two experiments branch off from points corresponding to global temperature anomalies of around 1°C and 2°C in the 1pctCO2 experiment. Both simulations equilibrate at a higher global warming level. As the climate warms, North Atlantic waters become warmer and fresher, weakening deep convection and deep water formation, which reduces the strength of the AMOC by approximately 10% in the low and 20% in the high fixed-CO2 concentration experiments. Deep water formation is assessed using a novel method based on horizontal volume convergence within the main convective areas. The weakening is primarily driven by the Labrador Sea, followed by the Greenland Sea, while the Irminger Sea sustains the remaining deep water formation. These changes align with variations in AMOC strength and meridional volume transport at 26°N and 45°N. Our study emphasizes the connection between North Atlantic deep water formation and AMOC, offering insights into its expected weakening as CO2 concentrations rise.

How to cite: Navarro Labastida, R. G., Karami, M. P., Koenigk, T., de Boer, A., and Sicard, M.: North Atlantic Ocean Circulation Changes Under Increased CO2 Concentrations Using a High-Resolution Global Coupled Climate Model , EGU General Assembly 2025, Vienna, Austria, 27 Apr–2 May 2025, EGU25-11943, https://doi.org/10.5194/egusphere-egu25-11943, 2025.

EGU25-12619 | ECS | Orals | CL3.1.5

Preventive carbon dioxide removal under climate response uncertainty 

Gaurav Ganti, Setu Pelz, Uta Klönne, Matthew Gidden, Carl-Friedrich Schleussner, and Zebedee Nicholls

Carbon dioxide removal (CDR) is now commonly considered an unavoidable part of a mitigation portfolio to meet global climate goals, complementing rapid and sustained cuts in existing emissions. However, current mitigation assessments of the potential role of CDR have tended to ignore the uncertainty in the Earth System response to our emissions. Here, we assess the level of “preventive” CDR to hedge against a stronger-than-median Earth System response. Using the C1 (“1.5°C with no or limited overshoot”) set of pathways assessed by the Intergovernmental Panel on Climate Change (IPCC), we show that the potential preventive CDR, in addition to CDR already deployed in these pathways, for a very likely (>= 90%) chance of reaching 1.5°C in 2100 may be 323 - 787 Gt CO2 (interquartile range). This is of a similar order of magnitude, and additional to the pathways’ existing assumed deployment, potentially exacerbating existing concerns over large-scale CDR deployment. We show that scenarios that limit residual emissions, both from long-lived (e.g., CO2 and N2O) and short-lived climate forcers (e.g., CH4), can significantly reduce the scale of required preventive CDR. Ensuring preventive CDR capacity is available at scale, if needed after net-zero, will require additional near-term investments. We cannot know now whether a net zero society will need to utilize it but emphasize that the option must be available to them. Our results suggest the need to rethink the role of so-called “hard-to-abate” emission sectors – limiting the emissions in these sectors in addition to rapid near-term cuts in emissions may be crucial to mitigate the worst climate impacts and avoid unsustainable CDR deployment.

How to cite: Ganti, G., Pelz, S., Klönne, U., Gidden, M., Schleussner, C.-F., and Nicholls, Z.: Preventive carbon dioxide removal under climate response uncertainty, EGU General Assembly 2025, Vienna, Austria, 27 Apr–2 May 2025, EGU25-12619, https://doi.org/10.5194/egusphere-egu25-12619, 2025.

EGU25-13927 | Posters on site | CL3.1.5

Earth system modeling of idealized overshoot scenarios under the TIPMIP ESM protocol using EC-Earth3-ESM 

Chuncheng Guo, Shuting Yang, Klaus Wyser, Torben Koenigk, Eveline van der Linden, Sybren Drijfhout, Etienne Tourigny, Lars Nieradzik, Jorge Bernales, and Tian Tian

We present the first results of the TIPMIP ESM experiments using the post-CMIP6 model EC-Earth3-ESM. The main objective of the TIPMIP ESM is to study the risks and consequences of potential tipping events in the Earth system, as well as the potential reversibility of triggered events - as a function of e.g., magnitudes and durations of different global warming levels (GWLs) before cooling the climate back to lower GWLs and pre-industrial climate.

Following the TIPMIP ESM protocol, we performed a set of idealized emission-driven simulations, including 1) ramp-up runs with a constant CO2 emission that drives a global mean surface air temperature (GMSAT) warming rate of 0.2 K/decade; 2) stabilization runs with zero CO2 emission at multiple GWLs; and 3) ramp-down runs to the pre-industrial climate with a negative CO2 emission (same magnitude with the ramp-up run) branched after 50 years of stabilization runs.

We present and discuss the simulated responses in the large-scale features of the different components of the earth system in the ramp-up, stabilization, and first test runs of the ramp-down experiments, with a focus on, e.g., GMSAT, AMOC, sea ice, carbon pools/fluxes, and Greenland Ice Sheet. Our findings suggest that some fast climate system components are reversible, e.g., sea ice, but Arctic summer sea ice can show some delays in recovering at high GWLs. AMOC linearly declines during the ramp-up phase, stabilizes during the stabilization phase, and recovers during the ramp-down phase (with an overshoot). Melting in the Greenland Ice Sheet accelerates during the ramp-up phase, its mass loss continues with somewhat slower speeds during stabilization and hardly reverses during the ramp-down phase when branched at high GWLs.

How to cite: Guo, C., Yang, S., Wyser, K., Koenigk, T., van der Linden, E., Drijfhout, S., Tourigny, E., Nieradzik, L., Bernales, J., and Tian, T.: Earth system modeling of idealized overshoot scenarios under the TIPMIP ESM protocol using EC-Earth3-ESM, EGU General Assembly 2025, Vienna, Austria, 27 Apr–2 May 2025, EGU25-13927, https://doi.org/10.5194/egusphere-egu25-13927, 2025.

EGU25-14840 | Orals | CL3.1.5

Three types of tipping dynamics in ice sheets 

Ricarda Winkelmann and Ann Kristin Klose

The polar ice sheets in both Antarctica and Greenland are considered tipping elements in the Earth system. However, the detailed nature of the underlying feedback mechanisms, hysteresis and irreversibility of ice loss on different temporal and spatial scales is an active research frontier.

Tipping dynamics can be triggered by forcing a system beyond a critical threshold (bifurcation-induced tipping), for instance through an increase in global warming beyond some critical level. Alternatively, tipping can also be initiated through fluctuations close to a critical threshold (noise-induced tipping), or by changing the forcing faster than a critical rate (rate-dependent tipping). These mechanisms have been described in complex systems theory and shown in conceptual modelling approaches, but a systematic insight into such dynamics in process-based models for Earth system components is lacking so far.

Here we explore these different types of tipping dynamics for the polar ice sheets based on simulations with the Parallel Ice Sheet Model, disentangling the complexity of critical transitions in response to anthropogenic climate change at different temporal and spatial scales. Our results underscore the importance of the rate of global warming, its variability, as well as the magnitude and duration of potential overshoots – all of which are decisive for the future evolution and long-term stability of the ice sheets.

How to cite: Winkelmann, R. and Klose, A. K.: Three types of tipping dynamics in ice sheets, EGU General Assembly 2025, Vienna, Austria, 27 Apr–2 May 2025, EGU25-14840, https://doi.org/10.5194/egusphere-egu25-14840, 2025.

EGU25-15742 | Orals | CL3.1.5 | Highlight

How Much Attention Should We Give to Overshoot Narratives? 

Nadine Mengis

As the global temperature approaches an average of 1.5°C above preindustrial levels - the most ambitious limit set in the 2015 Paris climate agreement - researchers and policymakers are increasingly considering overshoot pathways that aim to mitigate the impacts of transgressing these guardrails. Such overshoot narratives warrant cautious consideration:
Firstly, achieving net-zero goals is challenging as it is. But achieving large-scale net-negative CO2 emissions on a global scale to reverse a temperature or carbon budget transgression will be even more challenging, when considering context-specific feasibility and desirability constraints to the implementation of carbon dioxide removal (CDR) options (see e.g. Borchers et al., 2024).
Secondly, if we would achieve global net-negative CO2 emissions, detecting a temperature overshoots amidst internal climate variability will pose a considerable challenge, that would considerably complicate the monitoring and accordingly the management of such anthropogenic interventions into the climate system.
Thirdly, the financial, social, and governance frameworks required to incentivise, implement and sustain global net-negative CO2 emissions to manipulate the atmospheric CO2 concentration, similar to other forms of climate interventions, are likely unattainable.
Fourth, even if these barriers were overcome, the resulting post-overshoot climate would very likely differ from one where temperature stabilisation is maintained without overshoot (see e.g., Schleussner et al., 2024), with potentially irreversible impacts on ecosystems and climate systems.

Mitigation deterrence - reducing incentives for near-term emissions reductions - represents an considerable risk associated with CDR and overshoot narratives (Carton et al., 2023). It is therefore crucial to approach overshoot research and communication with care, prioritising immediate and effective mitigation strategies to minimise reliance on uncertain and potentially unfeasible overshoot pathways.


Borchers, M., Förster, J., Thrän, D., Beck, S., Thoni, T., Korte, K., et al. (2024). A comprehensive assessment of carbon dioxide removal options for Germany. Earth's Future, 12, e2023EF003986. https://doi.org/10.1029/2023EF003986 

Schleussner, CF., Ganti, G., Lejeune, Q. et al. Overconfidence in climate overshoot. Nature 634, 366–373 (2024). https://doi.org/10.1038/s41586-024-08020-9

Carton, W., Hougaard, I.-M., Markusson, N., & Lund, J. F. (2023). Is carbon removal delaying emission reductions? WIREs Climate Change, 14(4), e826. https://doi.org/10.1002/wcc.826

How to cite: Mengis, N.: How Much Attention Should We Give to Overshoot Narratives?, EGU General Assembly 2025, Vienna, Austria, 27 Apr–2 May 2025, EGU25-15742, https://doi.org/10.5194/egusphere-egu25-15742, 2025.

EGU25-16142 | ECS | Posters on site | CL3.1.5

Impacts of Simulated Coastal Ocean Alkalinity Enhancement on the Seasonal Cycle of CO2 Air-Sea Gas Exchange and ocean pCO2 in European Waters under Low and High Emission Scenarios 

Chiara Ciscato, Momme Butenschön, David Keller, Neha Mehendale, and Tronje Kemena

To reach climate neutrality, emission reduction must be complemented by carbon dioxide removal technologies aiming to sequester atmospheric CO2 and store it in permanent natural reservoirs. The ocean, which already sequesters roughly a quarter of all anthropogenic CO2 emissions annually, can play a crucial role in this effort. By storing carbon in forms that are not readily exchanged with the atmosphere, it acts as a vast and long-lasting carbon reservoir on a human-relevant timeframe. 

This potential has spurred growing interest in the development and deployment of ocean-based carbon dioxide removal technologies. One potentially scalable method is ocean alkalinity enhancement (OAE), which is performed by applying alkaline mineral rocks or solutions at the ocean surface to lower its CO2 partial pressure (pCO2) and accelerate CO2 sequestration and storage as bicarbonate and carbonate ions. 

For large-scale application, it is crucial to understand the potential earth system feedbacks generated by alkalinity addition, considering both the space and time dimension. Spatially, coastal alkalinity addition was investigated, as it is more feasible from a political and logistical standpoint. Temporally, as seasonality is a fundamental component of the ocean net annual CO2 uptake, attention was given to the changes to the seasonal CO2 flux and ocean pCO2 cycle. Additionally, different background climate scenarios were considered to assess whether varying levels of warming influence seasonal variations of OAE-induced ocean uptake. 

OAE was performed at the European coastline using an earth system model in emission-driven mode, with a low and a high climate change forcing (SSP1-2.6 and SSP3-7.0, respectively, following CMIP6 guidelines). No-OAE simulations were performed as baseline reference including climate change forcing. Alkalinity was applied continuously in the form of calcium hydroxide (Ca(OH)2) at the first ocean layer. Between 2025 and 2035, the alkalinity flux was increased linearly until the equivalent of 1Gt yr-1 (equal to 27 Tmol yr-1) was reached, then maintained constant until the year 2100. 

Results found that: a) with alkalinity addition, the ocean CO2 seasonal cycle is dampened due to the decreased sensitivity of an alkalinised ocean to CO2 fluctuations; b) the CO2 seasonal flux into the ocean is amplified given the larger pCO2 imbalance at the air-sea interface; c) while the ocean pCO2 seasonal amplitude reduction is stronger under low warming, the CO2 flux seasonal amplification is stronger in the high warming pathway. 

This project has received funding from the European Union’s Horizon Europe research and innovation programme under grant agreement no. 101056939 (RESCUE)

How to cite: Ciscato, C., Butenschön, M., Keller, D., Mehendale, N., and Kemena, T.: Impacts of Simulated Coastal Ocean Alkalinity Enhancement on the Seasonal Cycle of CO2 Air-Sea Gas Exchange and ocean pCO2 in European Waters under Low and High Emission Scenarios, EGU General Assembly 2025, Vienna, Austria, 27 Apr–2 May 2025, EGU25-16142, https://doi.org/10.5194/egusphere-egu25-16142, 2025.

Several important climate system tipping points are associated with the thawing Arctic including ice sheet collapse, AMOC shutdown, sea ice loss and permafrost thaw which may be imminent. This prompts examination of interventions to support the vulnerable systems and has raised great debate on potential governance of research into any future deployments. As well as their global impacts these systems also impact the lives of the Arctic Peoples and local ecosystems. The Arctic contains an estimated 25% of global untapped gas reserves and 13% of oil and large amounts of rare earths such as 40% of global palladium. Much of this is beneath hazardous seas, or as with Greenland, largely beneath thick permanent ice. But the Arctic is rapidly losing its ice cover, exposing more land and ice-free ocean, making it an attractive target for resource extraction and a geopolitical pawn.

Unfortunately, resource extraction provides limited sustainable benefits, for the locals, with most profits to the big mining companies. However, ice itself is a global resource that, if valued proportionately to the damage its loss causes via flooding and building coastal protection, as well as ice-albedo and carbon-temperature feedbacks would be worth tens of trillions of dollars per meter over the century. Even avoiding raising sea levels by 1 inch would be worth far more than the yearly $500 m Danish “block grant” to Greenland. This would allow Arctic Peoples more self-determination, while disproportionately benefiting the Global South which has limited adaptive capacity compared with the Developed World. The ethical alternative is to value the frozen Arctic as a global good, perhaps with an analogous system to the REDD+ mechanism applied to conserving the Amazon.

How to cite: Moore, J.: Exploit or empower: pros and cons of researching interventions in the Arctic  , EGU General Assembly 2025, Vienna, Austria, 27 Apr–2 May 2025, EGU25-17043, https://doi.org/10.5194/egusphere-egu25-17043, 2025.

EGU25-17370 | Posters on site | CL3.1.5

Deep sea and seafloor ecosystem response to net-zero and negative emissions 

Friederike Fröb, Timothée Bourgeouis, Nadine Goris, and Jörg Schwinger

With ongoing climate change, multiple stressors including ocean warming, deoxygenation, ocean acidification and limited nutrient availability will lead to large regime shifts within marine ecosystems[1]. Deep-sea ecosystems are adapted to the stable ambient conditions of the deep ocean and are therefore likely highly vulnerable to human impacts and climate change. Future projections show considerable deep-water warming, acidification, and heat accumulation, and moreover, in strong overshoot scenarios, irreversibility is found in various properties in the deep ocean[2]. Here, we compare rates of warming, acidification, and deoxygenation at depth and the seafloor for a range of emission driven idealized overshoot scenarios run with the fully coupled Norwegian Earth System Model version 2 (NorESM2). We discuss the impact that changing ambient conditions have for deep sea ecosystems at the example of Lophelia Pertusa, a common cold-water coral found in the North Atlantic. The continued exposure to calcium carbonate undersaturation and inhibited aerobic activity due to warming and deoxygenation lead to physiologically unsustainable conditions for cold water corals, which could be alleviated by sustained food supply, i.e., increased export production. We therefore conclude by showing different potential habitat extents in relation to environmental stressors under different evolving climates.


We acknowledge the project TipESM “Exploring Tipping Points and Their Impacts Using Earth System Models”. TipESM is funded by the European Union. Grant Agreement number: 101137673. DOI: 10.3030/101137673.


[1] Heinze et al., 2020, The quiet crossing of tipping points, PNAS, 118(9)

[2] Schwinger et al., 2022, Emit now, mitigate later? Earth system reversibility under overshoots of different magnitudes and durations, Earth Syst. Dynam., 13, 1641–1665

How to cite: Fröb, F., Bourgeouis, T., Goris, N., and Schwinger, J.: Deep sea and seafloor ecosystem response to net-zero and negative emissions, EGU General Assembly 2025, Vienna, Austria, 27 Apr–2 May 2025, EGU25-17370, https://doi.org/10.5194/egusphere-egu25-17370, 2025.

EGU25-17555 | Posters on site | CL3.1.5

Representing carbon dioxide removal in Earth System Models: towards an activity-driven framework. 

Raffaele Bernardello, Jörg Schwinger, Momme Butenschön, Lars Nieradzik, Etienne Tourigny, Paul Miller, Daniele Peano, David Wårlind, Shraddha Gupta, Sabine Bischof, Timothée Bourgeois, Nadine Mengis, Julia Pongratz, Lina Teckentrup, Leon Merfort, Nico Bauer, Matthew Gidden, Thomas Gasser, and Katsumasa Tanaka

The objective of the Paris Agreement is to obtain commitments from signing parties to reduce greenhouse gas (GHG) emissions to levels consistent with a global warming well below 2 °C above pre-industrial levels and to pursue further efforts to limit it to 1.5 °C. To achieve such ambitious goals, countries should collectively aim to reach a global peak in GHG emissions as soon as possible and to steadily decrease their emissions after that, to ideally accomplish a climate neutral world by the middle of this century. However, it soon became clear that the efforts being committed by signing parties were not enough to achieve such ambitious goals. As a result, the world is currently on track to warming levels that will either temporarily or permanently exceed the agreed temperature targets. Carbon Dioxide Removal (CDR) can complement the phase-out of fossil fuels, supporting net emission reduction towards the achievement of net-zero and, in case of temperature overshoot, net-negative targets. To reach such goals, while limiting the severity of side-effects, a broad set of CDR options - a CDR portfolio - will be necessary.

The RESCUE project aims to develop realistic scenarios that incorporate a mix of  large-scale implementations of technology- and ecosystem-based CDR. These scenarios are based on the current state-of-the-art knowledge regarding various aspects, including the limits and constraints of CDR on both land and ocean. The actual effectiveness of these CDR portfolios depends on a series of mechanisms and feedback loops linked to a changing climate.

Currently, the only tools that allow us to understand, assess, and quantify the processes that might affect the effectiveness of large-scale CDR interventions are Earth System Models (ESMs). However, even state-of-the-art ESMs are not yet equipped to represent the variety of CDR approaches being proposed. The RESCUE project is developing these representations in five European ESMs. The rationale behind these developments is to advance beyond the approach used in CMIP6, where negative emissions were prescribed from socioeconomic models as part of a given scenario. Inline with the CMIP7 emissions-driven experimental design focus, CDR interventions in RESCUE are provided to the ESMs as activities (e.g., area and carbon capture and storage efficiency of bioenergy plantations or alkalinity additions to the ocean) with the potential to alter net land and ocean CO2 fluxes. However, the ESM itself quantifies the actual effectiveness, taking into account known climate interactions and feedbacks. Here, we describe the overall design of these CDR representations, necessary assumptions and future directions for their improvement.

How to cite: Bernardello, R., Schwinger, J., Butenschön, M., Nieradzik, L., Tourigny, E., Miller, P., Peano, D., Wårlind, D., Gupta, S., Bischof, S., Bourgeois, T., Mengis, N., Pongratz, J., Teckentrup, L., Merfort, L., Bauer, N., Gidden, M., Gasser, T., and Tanaka, K.: Representing carbon dioxide removal in Earth System Models: towards an activity-driven framework., EGU General Assembly 2025, Vienna, Austria, 27 Apr–2 May 2025, EGU25-17555, https://doi.org/10.5194/egusphere-egu25-17555, 2025.

Over the last few years, there has been increasing interest in the long-term climate stabilisation response that we might expect when net-zero emissions of greenhouse gases are achieved. These studies often explore the stabilisation response across multiple global warming levels (GWLs). Several studies have now shown that regional patterns of change at given GWLs can be very different between transiently warming through a GWL and stabilising at that same GWL.

In a recent study with the UK Earth System Model 1.0, we showed that stabilising the external forcings and running the model forward for 500 years at various GWLs can stop the decline of southern European summer precipitation and reverse the sign of the trend. In northern Europe, the wetting trend is more substantial, and precipitation projections in UKESM1.0 overshoot the pre-industrial baseline in the second century after stabilisation (Dittus et al. 2024).  

In this presentation, we explore the mechanisms contributing to this spring and summertime increase in precipitation in the stabilisation simulations with UKESM1, relative to the transient projections from ScenarioMIP. We show that the frequency of different atmospheric circulation types is changing during the 500 years of stabilisation, and also highlight the important role of the land surface and soil moisture feedbacks onto the hydrological cycle.

Dittus, A. J., Collins, M., Sutton, R., & Hawkins, E. (2024). Reversal of projected European summer precipitation decline in a stabilizing climate. Geophysical Research Letters, 51, e2023GL107448. https://doi.org/10.1029/2023GL107448

How to cite: Dittus, A. and Hawkins, E.: Partial reversal of European summer precipitation decline in stabilisation scenarios: where does the moisture come from? , EGU General Assembly 2025, Vienna, Austria, 27 Apr–2 May 2025, EGU25-19149, https://doi.org/10.5194/egusphere-egu25-19149, 2025.

Taiwan’s coastal areas are highly vulnerable to typhoon-induced waves and storm surges, posing severe threats to coastal defenses, port operations, and maritime safety. Over the past decade, Taiwan has experienced an average of 4.5 typhoons annually, resulting in wave heights typically exceeding 10 meters, with maximums reaching 23 meters, and storm surges ranging from 20 to 40 cm. Understanding these extreme events under climate change scenarios is essential for effective disaster prevention and coastal planning. This study utilizes EC-Earth3 wind field data from the SSP5-8.5 high-emission scenario to simulate historical (1961–2020) and projected future (2021–2100) typhoon wave and storm surge data, followed by an analysis of their characteristics. Although the EC-Earth3 outputs have a spatial resolution of 100 km and a temporal resolution of 3 hours, this study refined them using an artificial intelligence-based downscaling model. A convolutional recurrent neural network (CRNN) enhanced the resolution to 3 km and 1 hour, enabling more detailed and accurate data for analyzing typhoon waves and storm surges.

Historical analysis reveals distinct regional variations in wave changes around Taiwan. The eastern coast exhibits the largest wave change due to its exposure to the Pacific Ocean, while the Taiwan Strait remains the most stable, predominantly influenced by monsoonal conditions. The southern and northern waters show intermediate wave change levels, with the latter affected by shifting typhoon tracks. Future projections suggest moderate increases in wave heights around Taiwan, particularly in the northern and northeastern waters, driven by the northeast monsoon and typhoon activity. These findings underscore the increasing risks to Taiwan’s coastal regions under changing climate conditions. This study further examines the regional characteristics of design wave heights, revealing the differential impacts of climate change on extreme wave conditions. Wave conditions in the Taiwan Strait are predominantly influenced by monsoons, with minimal climate change effects and relatively stable future design wave heights, ranging from approximately 3.63 to 3.68 meters for projected scenarios. In contrast, the eastern coastal waters, affected by typhoons and the Kuroshio Current, display moderate variability, with historical wave heights ranging from 4.42 to 4.92 meters and projected heights from 4.08 to 4.22 meters. The northern coastal waters show the most significant increases, with future wave heights reaching up to 5.65 meters for a 200-year return period. Meanwhile, the southern coastal waters exhibit limited changes, with future wave heights remaining stable between 5.21 and 5.26 meters, reflecting distinct regional response patterns to extreme wave conditions.

Storm surge simulations reveal additional risks. Historical records indicate that storm surges typically range from 10 to 30 cm, with peaks exceeding 40 cm during extreme typhoon events. Future scenarios indicate an increased frequency of extreme surges surpassing 40 cm, with localized peaks exceeding 50 cm, compounding risks when combined with large waves. These findings provide a scientific foundation for developing a joint probability distribution model for wave heights and storm surges, leading to the establishment of a Coastal Impact Index (CII) that quantifies the combined effects of waves and storm surges during typhoons.

How to cite: Fan, Y.-M.:  Typhoon-Induced Waves and Storm Surges along Taiwan’s Coast: Historical Trends and Future Projections, EGU General Assembly 2025, Vienna, Austria, 27 Apr–2 May 2025, EGU25-2104, https://doi.org/10.5194/egusphere-egu25-2104, 2025.

EGU25-3604 | Orals | OS1.14 | Highlight

The Atlantic overturning circulation (AMOC) ceases in many CMIP6 projections after 2100 

Stefan Rahmstorf, Sybren Drijfhout, Joran Angevaare, and Jennifer Mecking

New global warming projections in CMIP6 contain extensions beyond year 2100 up to 2300/2500. The Atlantic Meridional Overturning Circulation (AMOC) in these runs essentially ceases in all models forced by a high emissions (SSP585) scenario and sometimes also in models forced by intermediate (SSP245) or low (SSP126) scenarios. These extremely weak overturning states merely maintain a wind-driven shallow overturning at depths less than 200 m. Northward mass transport below this maximum is either completely absent or less than 2 Sverdrup. In all cases, this AMOC cessation is preceded by a mid-21st century collapse of deep convection in Labrador, Irminger and Nordic Seas, which likely represents the tipping point triggering the terminal AMOC decline.

How to cite: Rahmstorf, S., Drijfhout, S., Angevaare, J., and Mecking, J.: The Atlantic overturning circulation (AMOC) ceases in many CMIP6 projections after 2100, EGU General Assembly 2025, Vienna, Austria, 27 Apr–2 May 2025, EGU25-3604, https://doi.org/10.5194/egusphere-egu25-3604, 2025.

EGU25-4309 | Orals | OS1.14

Obtaining optimal fingerprints of the AMOC from sea surface observations 

Peter Ditlevsen and Susanne Ditlevsen

Records of Atlantic sea surface temperature (SST) and sea surface salinity (SSS) integrated over different areas have been proposed as fingerprints of the AMOC over the period of observations. Boers (2021) analyses eight different time series of fingerprints as AMOC indices and finds for all of them early warming signals of an approach to a tipping point. However, if two different AMOC indices are not strongly correlated, they can obviously not both be trustworthy representations of the AMOC. Thus, if significant EWSs are found in both of such records, at least one is spurious. In that case, it is questionable if EWSs for a forthcoming collapse can be trusted at all, since it is observed for unrelated reasons in (at least) one record. Here we propose a consistent fingerprint based on a combination of all the fingerprints. 

How to cite: Ditlevsen, P. and Ditlevsen, S.: Obtaining optimal fingerprints of the AMOC from sea surface observations, EGU General Assembly 2025, Vienna, Austria, 27 Apr–2 May 2025, EGU25-4309, https://doi.org/10.5194/egusphere-egu25-4309, 2025.

EGU25-4450 | ECS | Orals | OS1.14

Continued Atlantic overturning circulation even under climate extremes 

Jonathan Baker, Mike Bell, Laura Jackson, Geoffrey Vallis, Andrew Watson, and Richard Wood

The Atlantic Meridional Overturning Circulation (AMOC), crucial for transporting heat northward across the Atlantic Ocean, is expected to weaken due to global warming, with implications for global climate. It is uncertain, however, how much it will weaken or if it may even completely collapse this century. Hence, we assess the AMOC's ability to withstand extreme increases in greenhouse gases and freshwater forcing in the North Atlantic by examining the upwelling pathways that return deep waters of the AMOC to the surface in 34 CMIP6 climate models. Our findings show that upwelling in the Southern Ocean, maintained by persistent overlying westerly winds, prevents a total AMOC collapse and impacts its future strength. This Southern Ocean upwelling must be balanced by downwelling in the Atlantic or Pacific oceans, so only the development of a strong Pacific Meridional Overturning Circulation (PMOC) could enable an AMOC collapse. While a PMOC does appear in nearly all models, it is insufficient to offset the upwelling in the Southern Ocean, suggesting an AMOC collapse this century is unlikely. We uncover novel stabilising mechanisms that enhance the resilience of the AMOC, with implications for its past and future change. Our findings highlight the critical need for improved observation-based estimates of the Indo-Pacific and Southern Ocean circulations to reduce uncertainty in AMOC projections.

How to cite: Baker, J., Bell, M., Jackson, L., Vallis, G., Watson, A., and Wood, R.: Continued Atlantic overturning circulation even under climate extremes, EGU General Assembly 2025, Vienna, Austria, 27 Apr–2 May 2025, EGU25-4450, https://doi.org/10.5194/egusphere-egu25-4450, 2025.

EGU25-6379 | ECS | Posters on site | OS1.14

Uncertainties in the projection of sterodynamic sea level in CMIP6 models  

Chenyang Jin, Hailong Liu, Pengfei Lin, Kewei Lyu, and Yiwen Li

Sterodynamic sea level (SdynSL) is an essential component of sea level changes that climate models can simulate directly. Here we untangle the impact of intermodel uncertainty, internal variability, and scenario uncertainty on SdynSL projections from the Coupled Model Intercomparison Project Phase 6 (CMIP6) models. At global scale, intermodel (scenario) uncertainty reigns before (after) ~2070, but internal variability is negligible. At regional scale, intermodel uncertainty is the largest contributor (50~100%), internal variability is secondary (20~50%) in the Indian Ocean and tropical Pacific in the near term and midterm. Scenario uncertainty is negligible until emerging in the long term. The anthropogenic signal of global  mean SdynSL emerges from the beginning of this century relative to the 1971-2000 climatology. However, only 70% of the ocean can detect anthropogenic SdynSL signals until the long term. Assuming that model differences are eliminated, anthropogenic SdynSL signals will emerge 38 almost globally after the midterm.

How to cite: Jin, C., Liu, H., Lin, P., Lyu, K., and Li, Y.: Uncertainties in the projection of sterodynamic sea level in CMIP6 models , EGU General Assembly 2025, Vienna, Austria, 27 Apr–2 May 2025, EGU25-6379, https://doi.org/10.5194/egusphere-egu25-6379, 2025.

EGU25-7835 | Orals | OS1.14

A New Vision of the Adriatic Dense Water Future under Extreme Warming 

Clea Denamiel, Iva Vrdoljak, and Petra Pranić

We employ the Adriatic Sea and Coast (AdriSC) fine-resolution atmosphere-ocean model, operating at the kilometer scale, to assess the effects of a far-future extreme warming scenario on the formation, transport, and accumulation of the Adriatic dense and deep water. It is well-established that North Adriatic Dense Water (NAddW) is spreading across the entire basin and accumulates within the Jabuka Pit, while Adriatic Deep Water (AdDW) is only located within the Southern Adriatic Pit (SAP). However, unlike earlier studies that relied on coarser-resolution Mediterranean climate models, our approach incorporates updated thresholds for defining dense and deep water, reflecting far-future background density shifts due to increased sea surface temperatures.

Our analysis reveals a 15% increase in surface buoyancy losses at NAddW generation sites under extreme warming, driven primarily by evaporation, despite a 25% decline in both the intensity and spatial extent of the winter windstorms responsible for the surface cooling. Consequently, far-future NAddW formation is projected to remain comparable to present-day conditions. However, heightened stratification in the far-future scenario is expected to reduce the volume of dense water retained in the Jabuka Pit. Furthermore, the transport of dense water between the Jabuka Pit and the SAP's deepest regions is likely to cease, as future NAddW will be less dense than the AdDW.

Regarding the exchanges between the Adriatic and Ionian Seas, we find that the Bimodal Oscillation System's influence on Adriatic salinity variability will persist under extreme warming. Nonetheless, future AdDW dynamics will primarily be driven by density changes in the northern Ionian Sea.

These findings underscore the intricate nature of climate change impacts on Adriatic atmosphere-ocean interactions and highlight the necessity of higher resolution models for producing more reliable far-future projections at the coastal scale.

How to cite: Denamiel, C., Vrdoljak, I., and Pranić, P.: A New Vision of the Adriatic Dense Water Future under Extreme Warming, EGU General Assembly 2025, Vienna, Austria, 27 Apr–2 May 2025, EGU25-7835, https://doi.org/10.5194/egusphere-egu25-7835, 2025.

EGU25-7841 | ECS | Posters on site | OS1.14

Contrasting deeper ocean responses around the Kuroshio-Oyashio Extension in high and low-resolution coupled climate models 

Bo An, Yongqiang Yu, Helene Hewitt, Peili Wu, and Kalli Furtado

How much heat is pumped into the interior of the oceans directly affects projected future warmings of the atmosphere and surface climate, with both global and regional implications. Kuroshio-Oyashio Extension region (KOE) influences the local marine ecosystems and is part of the North Pacific decadal variation systems, it also tele-connects with the North American weather and is a key projection indicator for the marine heatwaves. For a more reliable understanding and future projection of the future climate and extreme events in the North Pacific, it is important to predict potential future spatial and temporal warming patterns in KOE more accurately. The future KOE warming pattern and warming mechanisms are analysed, with future scenario simulation by skillful high-resolution coupled model FGOALS-f3-H, compared with low-resolution model FGOALS-f3-L. Results show that high-resolution models simulate a future deep, strong warming reaching 600 m in the Kuroshio-Oyashio region, while the warming in low-resolution models is only above 300 m. Deep warming includes two spatial parts, one in the south of Kuroshio, which is contributed by heaving, and one in the north around Oyashio which is contributed by the northward movement of the subtropical gyre. The skill of high-resolution models to simulate future deep warming is co-contribute by the improvements in the ability to realistically capture the Kuroshio Extension current, with its meridional position, sharp front as well as large horizontal current speed, and mixed layer depth with mesoscale eddies effects.

How to cite: An, B., Yu, Y., Hewitt, H., Wu, P., and Furtado, K.: Contrasting deeper ocean responses around the Kuroshio-Oyashio Extension in high and low-resolution coupled climate models, EGU General Assembly 2025, Vienna, Austria, 27 Apr–2 May 2025, EGU25-7841, https://doi.org/10.5194/egusphere-egu25-7841, 2025.

EGU25-9412 | ECS | Orals | OS1.14

A Multi-Dimensional Evaluation of Global Ocean salinity in CMIP6 Historical simulations 

Yuxuan Lyu, Nathan Bindoff, Sandeep Mohanpatra, Saurabh Rathore, and Helen Phillips

A realistic representation of ocean salinity is essential for understanding large-scale ocean circulation, water mass transformation, and the global hydrological cycle. This study thoroughly assesses CMIP6 historical simulations by comparing ocean salinity outputs from climate models with EN4 datasets, investigating horizontal and vertical spatial patterns as well as temporal variability. Our analysis shows that while CMIP6 models display a strong spatial correlation with observations across multiple ocean basins, significant discrepancies arise in the temporal trends of salinity variations. Specifically, the models often hard to capture the magnitude and persistence of long-term salinity trends observed in the EN4 dataset. The evaluation also emphasizes vertical salinity profiles, where maximum and minimum salinity values serve as simplified indicators for structural assessment. To ensure consistent comparisons, model-simulated salinity extrema are standardized by aligning their values with the corresponding depths in the observational data. These results highlight both the strengths and limitations of CMIP6 models in representing key oceanographic features, such as the depth and magnitude of salinity extrema, mixed layer depth, and regional salinity gradients. By identifying areas of agreement and divergence between models and observations, this study provides valuable insights for improving the physical realism and predictive accuracy of historical climate simulations, ultimately guiding future model development.

How to cite: Lyu, Y., Bindoff, N., Mohanpatra, S., Rathore, S., and Phillips, H.: A Multi-Dimensional Evaluation of Global Ocean salinity in CMIP6 Historical simulations, EGU General Assembly 2025, Vienna, Austria, 27 Apr–2 May 2025, EGU25-9412, https://doi.org/10.5194/egusphere-egu25-9412, 2025.

Past trends in the strength of the Atlantic Meridional Overturning Circulation (AMOC) are still debated, and its fate under global warming is uncertain. Observational studies suggest that there has been persistent weakening since the mid-twentieth century, whereas CMIP models systematically simulate a stable circulation. Here, using Earth System and eddy-permitting coupled ocean–sea-ice models, we show that a freshening of the subarctic Atlantic Ocean and weakening of the overturning circulation increase the temperature and salinity of the South Atlantic on a decadal timescale through the propagation of Kelvin and Rossby waves. Applying this finding to observations provides novel evidence on the recent AMOC slow-down. We also show that accounting for upper-end meltwater input in CMIP6 historical simulations significantly improves the data–model agreement on past changes in the Atlantic Meridional Overturning Circulation, indicating the AMOC has weakened by 13% (9 to15%) under a 1ºC global warming, reached in 2017. Including estimates of subarctic meltwater input for the coming century suggests that this circulation could weaken by 33% under a 2ºC global warming, which can be attained over the coming decade, being twice the AMOC weakening projected by radiative forcing only (16%).

How to cite: Pontes, G. M. and Menviel, L.: Past and future of the Atlantic Meridional Overturning Circulation under radiative and meltwater forcings, EGU General Assembly 2025, Vienna, Austria, 27 Apr–2 May 2025, EGU25-9669, https://doi.org/10.5194/egusphere-egu25-9669, 2025.

EGU25-12966 | Orals | OS1.14

Comparing projected regional sea-level change from CMIP5 against observations 

Víctor Malagón-Santos, Carolina Camargo, Jeemijn Scheen, Brendan Oerlemans, and Aimée Slangen

Projections of regional sea-level change based on CMIP simulations are essential for coastal management, adaptation, and mitigation of impacts, as they serve as the foundation for producing policy-relevant reports like those from the IPCC (Intergovernmental Panel on Climate Change). Although evaluating future estimates of sea-level change against observations is important for asserting confidence in projected values, this has only been done for global-mean sea-level change and multiple tide gauge locations. In this study, we evaluate projections of regional sea-level change for the entire range of satellite altimetry measurements. Projections can only be evaluated against observations when a significant length of data has been collected. For instance, the latest IPCC assessment report (AR6) provides projections from 2020, which leaves only five years of data for comparison with recent observations up to 2025. Therefore, we turn to the previous IPCC report (AR5), based on CMIP5, as this allows for a longer overlapping period (2007–2022). We evaluate the IPCC AR5 projections of total sea-level change and its two main components—mass changes due to melting land ice and sterodynamic changes—against satellite altimetry, gravity measurements, and ocean reanalysis products, respectively. Over short periods and on regional scales, the large internal climate variability in observed sea levels obscures the underlying trend, hindering model comparisons. To address this, we use three methods to reduce internal climate variability in the observations before comparing them to the projections: low-frequency component analysis, multivariate regression analysis, and self-organizing maps. Error metrics indicate that low-frequency component analysis performs best at reducing internal climate variability, and we proceed with this method. The projected and observed total sea-level trends agree well for the overlapping period: in 98% of the ocean area, satellite observations fall within one standard deviation of AR5 projections for the middle-of-the-road emissions scenario (RCP4.5). We find that, in general, the AR5 projections underestimate total and mass-driven sea-level change, while they overestimate the sterodynamic component. The largest discrepancies occur in regions with strong ocean currents, such as the Kuroshio Current and the Southern Ocean, where models appear to inadequately capture sea-level trends. Overall, our results provide confidence in future sea-level trends as estimated in AR5, particularly over longer time periods and broad regions.

How to cite: Malagón-Santos, V., Camargo, C., Scheen, J., Oerlemans, B., and Slangen, A.: Comparing projected regional sea-level change from CMIP5 against observations, EGU General Assembly 2025, Vienna, Austria, 27 Apr–2 May 2025, EGU25-12966, https://doi.org/10.5194/egusphere-egu25-12966, 2025.

EGU25-13527 | ECS | Posters on site | OS1.14

Exploring ocean stratification in CMIP6 models: biases and evolution in a warming world 

Ignasi Vallès Casanova, Raquel Somavilla, Alberto Naveira Garabato, Cesar González Pola, and Julio Fernández Diaz

In the context of global warming, understanding the effects of rising ocean surface temperatures on ocean stratification and mixing is essential. Recent research challenges the traditional notion of a linear relationship between surface warming and increased stratification, raising critical questions about the ocean's interior response to climate forcing and future climate change. 

This study addresses these questions by analyzing upper-ocean stratification using historical simulations and two different warming scenarios from a representative set of CMIP6 models. We characterize the ocean's vertical structure by applying the sharp homogenization/diffusive retreat (SHDR) algorithm to fit vertical density profiles with an analytical one-dimensional model. This approach integrates various stratification metrics, including mixed layer depth, pycnocline amplitude, and slope, providing a comprehensive representation of the upper ocean. 

Our analysis reveals critical gaps in the representation of ocean stratification in historical simulations, including an asymmetric bias in the main pycnocline slope between hemispheres. Building on these findings, we examine how stratification responds and evolves under SSP2-4.5 and SSP5-8.5 scenarios, addressing these discrepancies within the context of a warming climate. These insights contribute to our understanding of ocean stratification dynamics and their implications for future climate projections.

How to cite: Vallès Casanova, I., Somavilla, R., Naveira Garabato, A., González Pola, C., and Fernández Diaz, J.: Exploring ocean stratification in CMIP6 models: biases and evolution in a warming world, EGU General Assembly 2025, Vienna, Austria, 27 Apr–2 May 2025, EGU25-13527, https://doi.org/10.5194/egusphere-egu25-13527, 2025.

EGU25-13538 | Orals | OS1.14

Investigating climate-induced changes in shelf – open ocean exchange in the Atlantic using global ocean downscaling 

Anna Katavouta, Jason Holt, Yuri Artioli, and Lee de Mora

To address shortcomings of global climate models (CMIP6) and project the impacts of climate change in the Atlantic Ocean with focus on regional scales, we downscale globally a 4-member ensemble of future climate projections (2 emission scenarios and 2 global climate models) with a NEMO-ERSEM coupled hydrodynamic-ecosystem ocean model. In our global ocean downscaling of climate projections, the resolution for the ocean is increased to ¼ of a degree and the river runoffs are represented more realistically in an attempt to better resolve the shelf break and the exchange of water between the shelf break and the deep ocean, as well as the influence of this exchange on both large and regional scales. Here, using the projections from our global ocean downscaling we investigate the cross shelf-open ocean volume, heat and salt transports along the Atlantic Ocean margins and how they may change in the near future (up to year 2070). We also present preliminary analysis for the role of changes in the large-scale circulation patterns versus changes in the regional water content/properties (e.g., heat and salt) on driving changes in the shelf-open ocean exchange, with a particular interest in the North Atlantic western boundary region and the Gulf Stream.

How to cite: Katavouta, A., Holt, J., Artioli, Y., and de Mora, L.: Investigating climate-induced changes in shelf – open ocean exchange in the Atlantic using global ocean downscaling, EGU General Assembly 2025, Vienna, Austria, 27 Apr–2 May 2025, EGU25-13538, https://doi.org/10.5194/egusphere-egu25-13538, 2025.

EGU25-13960 | ECS | Posters on site | OS1.14

The influence of freshwater input in the SOFIA simulations on the upper cell of the global MOC 

Johanna Wagner, Rowan Brown, and Alexander Haumann

Due to rising global air and sea temperatures, the Antarctic ice shelves and sheet is expected to melt more rapidly in the future, resulting in an increasing freshwater input into the Southern Ocean. The additional freshwater input could affect the MOC (Meridional Overturing Circulation), which extends over the oceans and distributes heat, carbon, and biogeochemical components globally. The majority of the global coupled climate models have fixed ice sheets, so the missing ice dynamics of the Antarctic ice sheet represent a key uncertainty in their future projections. In this study we investigate how additional freshwater input from the Antarctic ice sheet affects the upper cell of the global MOC.

For this purpose, we analyze output from the Southern Ocean Freshwater Input from Antarctica (SOFIA) initiative to investigate the change in the upper cell of the MOC. This analysis is carried out with regard to different freshwater inputs and different models based on the calculation of the stream function, intending to gain a better understanding of the changing of the upper cell MOC in response to Antarctic meltwater.


How to cite: Wagner, J., Brown, R., and Haumann, A.: The influence of freshwater input in the SOFIA simulations on the upper cell of the global MOC, EGU General Assembly 2025, Vienna, Austria, 27 Apr–2 May 2025, EGU25-13960, https://doi.org/10.5194/egusphere-egu25-13960, 2025.

EGU25-14882 | Posters on site | OS1.14

Intensifying Heat Stresses in Marine Protected Areas 

Eun Byeol Cho, Eun Young Kwon, Axel Timmermann, Thomas Jung, Tido Semmler, Jan Hegewald, and Sun-Seon Lee

Marine Protected Areas (MPAs) are vital for preserving marine biodiversity and supporting sustainable resource management. However, the intensifying impacts of future temperature extremes, such as marine heatwaves (MHWs), pose significant risks to marine ecosystems. This study utilizes high-resolution climate projections under the SSP585 scenario (AWI-CM3) to examine 21st century changes in MHWs, defined as extreme deviations from the seasonally varying long-term temperature trend, within global MPAs, focusing on the surface to a depth of 300 meters. Our findings reveal that, while the frequency of MHWs is expected to decline, their intensity and duration are projected to increase, exacerbating accumulative impacts. On average, accumulative intensity is anticipated to rise by approximately 30 %, surpassing the global average increase of 25%. Notably, substantial increases are identified in mid- and high-latitude MPAs below the surface, while in the surface layer, such increases are observed in tropical MPAs. These results highlight the urgent need to understand how marine organisms and habitats will adapt to escalating heat stresses. Such insights are critical for ensuring the resilience and sustainability of marine ecosystems in the face of future climate challenges.

How to cite: Cho, E. B., Kwon, E. Y., Timmermann, A., Jung, T., Semmler, T., Hegewald, J., and Lee, S.-S.: Intensifying Heat Stresses in Marine Protected Areas, EGU General Assembly 2025, Vienna, Austria, 27 Apr–2 May 2025, EGU25-14882, https://doi.org/10.5194/egusphere-egu25-14882, 2025.

EGU25-16442 | Orals | OS1.14

Historical Climate and Future Projection in the Arctic and North Atlantic: Insights from High-Resolution EC-Earth3 Simulations 

Mehdi Pasha Karami, Torben Koenigk, Shiyu Wang, Tim Kruschke, Aude Carreric, Pablo Ortega, Klaus Wyser, Ramon Fuentes Franco, René Navarro Labastida, Agatha de Boer, Marie Sicard, and Aitor Aldama Campino

Future climate projections in CMIP indicate that sea ice will continue to decline under all emission scenarios, although there is uncertainty regarding the timing of a summer ice-free Arctic. Additionally, while models agree that the Atlantic Meridional Overturning Circulation (AMOC) will weaken, they diverge on the rate of weakening and the underlying processes. Results from the HighResMIP initiative have highlighted the benefits of increased model resolution in improving the representation of key climate processes in the North Atlantic and Arctic oceans.

Building on this, we use the high-resolution global climate model EC-Earth3-HR, a higher-resolution version of the EC-Earth3 configuration developed for CMIP6, to investigate future changes in the Arctic and North Atlantic Oceans. EC-Earth3-HR consists of the IFS atmospheric model (T511, ~40 km), the NEMO ocean model (0.25°), and the LIM3 sea ice model. The model has undergone a tuning process, a long spin-up, and 350 years of pre-industrial control simulations, followed by full historical (1850–2014) and future (2015–2100, SSP2-4.5) simulations.

We will highlight the impact of increased horizontal resolution, compared to the lower-resolution version, on simulating the historical climate, with a focus on ocean and sea ice conditions in the North Atlantic and Arctic and their projected changes under SSP2-4.5. Our results show that EC-Earth-HR effectively captures sea ice trend and rapid sea ice loss events, and projecting a summer ice-free Arctic by 2050. It also shows a 40% weakening of the AMOC by the end of the century. Furthermore, we present a novel method for estimating deep water formation rates and examining the processes contributing to the weakening of the AMOC.

How to cite: Karami, M. P., Koenigk, T., Wang, S., Kruschke, T., Carreric, A., Ortega, P., Wyser, K., Fuentes Franco, R., Navarro Labastida, R., de Boer, A., Sicard, M., and Aldama Campino, A.: Historical Climate and Future Projection in the Arctic and North Atlantic: Insights from High-Resolution EC-Earth3 Simulations, EGU General Assembly 2025, Vienna, Austria, 27 Apr–2 May 2025, EGU25-16442, https://doi.org/10.5194/egusphere-egu25-16442, 2025.

EGU25-20518 | Posters on site | OS1.14

Dynamics of large changes in the Atlantic Meridional Overturning Circulation 

Bablu Sinha and Jeremy Grist

The possibility of large and potentially irreversible changes in the AMOC, with potentially significant impacts on global and regional climate, are currently being debated. Whilst many studies have been conducted investigating temperature and salinity changes associated with AMOC variability, feedbacks related to the in-situ density/pressure gradient have not thus far been studied in detail. We identify and examine large changes in the AMOC on timescales up to centennial in the CMIP6 multimodel climate model ensemble (preindustrial, historical, and future climate) and historical observations. Our specific focus is on constructing budgets of in-situ density at the continental boundaries in order to understand the mechanisms leading to permanent reduction of the transbasin zonal density/pressure gradient required to maintain the AMOC. We further investigate whether and how reduction in the AMOC impacts boundary densities, and whether positive feedback loops resulting in rapid change can occur.

How to cite: Sinha, B. and Grist, J.: Dynamics of large changes in the Atlantic Meridional Overturning Circulation, EGU General Assembly 2025, Vienna, Austria, 27 Apr–2 May 2025, EGU25-20518, https://doi.org/10.5194/egusphere-egu25-20518, 2025.

EGU25-1593 | ECS | Orals | OS1.13

Evaluation of the interior ocean ventilation of biogeochemical tracers in a global ocean model using observation-based metrics  

Simone Le Chevere, Christopher Danek, Seth Bushinsky, and Judith Hauck

The ocean has absorbed approximately 25% of anthropogenic CO2 emissions since the industrial era, playing a critical role in the global carbon cycle. However, the current ocean carbon sink as simulated by the ocean biogeochemistry models of the Global Carbon Budget shows a spread larger than the European Union’s fossil carbon emissions and mismatches with current observation-based estimates. The prime suspect for this deviation is the poorly constrained transfer of carbon between the surface and the interior ocean. This process is called ventilation and is based on the interior ocean carbon gradients that depend on mixing, advective and biological processes.

To address this, we developed a set of metrics based on the new dataset from biogeochemical Argo floats (BGC-Argo) that offer unprecedented observations from the surface to 2000 m, and the GLODAP bottle data. These metrics are a tool to evaluate and optimize ocean ventilation processes and carbon transport between the surface and the interior in ocean models. They target the stratification and mixing (physical variables) as well as the gradients of tracers such as apparent oxygen utilization, dissolved inorganic carbon or dissolved inorganic nitrate. We compute metrics quantifying these depth gradients averaged across large-scale biomes.

With this methodology, we evaluate the ventilation in the model FESOM-REcoM. Our results identify model-observation differences in terms of absolute values and magnitude of gradient in salinity and in the biogeochemical variables in many biomes. Biases in the gradients of biogeochemical properties can partially be explained by biases in the physical stratification of the water column, especially in biomes with high mixing at higher latitudes.  In other biomes, biases are attributed to an imperfect representation of biogeochemical processes in the model.  We characterize the distribution of biases in FESOM-REcoM, and discuss how to reduce them.

How to cite: Le Chevere, S., Danek, C., Bushinsky, S., and Hauck, J.: Evaluation of the interior ocean ventilation of biogeochemical tracers in a global ocean model using observation-based metrics , EGU General Assembly 2025, Vienna, Austria, 27 Apr–2 May 2025, EGU25-1593, https://doi.org/10.5194/egusphere-egu25-1593, 2025.

EGU25-1977 | Orals | OS1.13

Complex response of marine carbon pumps to global warming impacts atmospheric CO2 on multi-centennial time scales 

Samar Khatiwala, Olivia Strachan, and Andreas Schmittner

The ocean’s capacity to absorb anthropogenic CO2 is predicted to decrease with global warming, contributing to a positive climate-carbon cycle feedback. However, the precise nature of how climate change will impact the ocean’s various carbon pumps and hence atmospheric CO2 remains poorly constrained, especially on multi-centennial time scales. Here, we show that under a high emission scenario, reduced carbon uptake and redistribution of alkalinity leads to ~505 ppm (30%) higher atmospheric CO2 by 2500. Despite compensating changes in biological storage and air-sea disequilibrium, CO2 is still 16% higher due to climate change. These changes are a net response to slowing circulation and increased stratification, which not only reduces carbon uptake but lengthens by hundreds of years the time anthropogenic and biologically-respired CO2 are sequestered in the ocean, with long term implications for climate.

How to cite: Khatiwala, S., Strachan, O., and Schmittner, A.: Complex response of marine carbon pumps to global warming impacts atmospheric CO2 on multi-centennial time scales, EGU General Assembly 2025, Vienna, Austria, 27 Apr–2 May 2025, EGU25-1977, https://doi.org/10.5194/egusphere-egu25-1977, 2025.

EGU25-2675 | Posters on site | OS1.13

Simple Eulerian-Lagrangian approach to solve equations for sinking particulate organic matter in the ocean 

Seongbong Seo, Vladimir Maderich, Igor Brovchenko, Kateryna Kovalets, and Kyonghwan Kwon

A gravitational sinking of the particulate organic matter (POM) is a key mechanism of the vertical transport of carbon in the deep ocean and its subsequent sequestration. The size spectrum of these particles is formed in the euphotic layer by the primary production and various mechanisms including food web consumption. The mass of particles, as they descend, decreases under bacterial decomposition and the influence of grazing by filter feeders which depends on the water temperature and oxygen concentration, particle sinking velocity, age of the organic particles, ballasting and other factors. In this study, we consider the influence of the size and age of particles, temperature and oxygen concentration on their dynamics and degradation processes. The model takes into account feedback between the degradation rate and sinking velocity of particles.  We rely on the known parameterisations, but our Eulerian-Lagrangian approach to analytically and numerically solving the problem differs, allowing the model to be incorporated into biogeochemical global ocean models with relative ease. Two novel analytical solutions of the system of the one-dimensional Eulerian equation for POM concentration and Lagrangian equations for particle mass and position were obtained for constant and age-dependent degradation rates. At a constant rate of particle sinking, they correspond to exponential and power-law profiles of the POM concentration. It was found that feedback between degradation rate and sinking velocity significantly changes POM concentration and POM flux vertical profiles.  The calculations are compared with the available POM concentration and flux measurement data for the latitude band of 20-30oN in the Atlantic and Pacific Oceans and 50-60o in the Southern Ocean. The dependence of the degradation rate on temperature significantly affected the profiles of POM concentration enhancing the degradation of sinking particles in the upper layers of the oceans and suppressing it in the deep layers of the oceans. The influence of oxygen concentration in all cases considered was insignificant compared to the temperature distribution with depth.

How to cite: Seo, S., Maderich, V., Brovchenko, I., Kovalets, K., and Kwon, K.: Simple Eulerian-Lagrangian approach to solve equations for sinking particulate organic matter in the ocean, EGU General Assembly 2025, Vienna, Austria, 27 Apr–2 May 2025, EGU25-2675, https://doi.org/10.5194/egusphere-egu25-2675, 2025.

Upper ocean stirring and mixing strongly affect the nutrient flux into the euphotic zone and therefore ocean primary production. Additionally, besides particle sinking, the export of organic and inorganic matter is hugely determined by advective fluxes imposed by physical flows. Since both production and export play a role in oceanic carbon storage, it is important to re-assess its main drivers in models of increased ocean realism. With spatial dimensions below 25 km, sharp fronts, filaments, strong jets and small eddies, submesoscale motions induce large vertical velocities, adding extra transport to the already large lateral stirring induced by the mesoscale (25 km-200 km) field. The impact of resolved submesoscale flows on some aspects of the south Atlantic Ocean carbon cycle is here studied based on a novel global ocean-biogeochemical simulation integrated with the models ICON-O and HAMOCC using a telescoping grid with a resolution refined to approximately 600 m in the south Atlantic. Tracer budgets are used to quantify the relative importance of physical versus biogeochemical processes in the evolution of ocean carbon, including the uptake at the surface and the export to the deep ocean. A comparison between our submesoscale-resolved ocean and biogeochemical simulations with coarser resolutions (10 km and 40 km) sheds some light on the submesoscale role on tracer evolution and highlights expected differences between current climate and mesoscale models and models including the submesoscale. Despite being limited by the short duration of our simulation, this study suggests that submesoscales shape vertical profiles of carbon and nutrients and thereby affect export fluxes and seasonal dynamics.

How to cite: Serra, N. and Ilyina, T.: Impact of submesoscale flows on primary production and export fluxes of carbon in the South Atlantic Ocean, EGU General Assembly 2025, Vienna, Austria, 27 Apr–2 May 2025, EGU25-4128, https://doi.org/10.5194/egusphere-egu25-4128, 2025.

EGU25-5016 | Posters on site | OS1.13

Parameterization of sinking velocity rates in the Atlantic Ocean 

María Villa-Alfageme, Lucía Melgar, Álvaro López-Rodríguez, Unai Abascal-Ruíz, and Beatriz González-González

Particles sinking on the ocean constitute the vehicles of the Biological Carbon Pump (BCP). As these particles descend, they give form to a complex mixture of biogeochemical materials, each characterised by distinct size, density, porosity, and morphology. Consequently, the velocity of particle sinking (SV) and the flux of particulate organic carbon (POC) exhibit significant variability, influenced by factors such as depth, season, and the characteristics of the ecosystem. The flux of POC and the SV are interconnected parameters; besides, the profile of POC flux attenuation, i.e. the rate at which sinking particles are remineralised and degraded by bacteria and zooplankton, is also strongly dependent on the rate at which the particles sink. Intuitively, faster sinking particles would reach the Twilight Zone in a greater proportion than slow sinking particles; however, this simple correlation is not globally observed in the ocean. Overall, SV is a key variable directly impacting on the strength of the BCP, in spite of that, the methods to estimate particle SV are not standardized and this variable remains poorly measured in the ocean. Therefore, its influence is not properly quantified, nor is how to incorporate this parameter to ocean biogeochemical models.

The utilisation of the disequilibrium between radioactive pairs, 234Th-238U and 210Po-210Pb, allows obtaining both average SV and downward POC flux. In this study, disequilibrium profiles from 15 cruises in the Atlantic and Southern Oceans were examined (including data from COMICS, CUSTARD, APERO and EXPORTS programs), encompassing biogeochemically contrasting sites and various stages of the bloom. This analysis led to a novel compilation of POC flux and SV, coupled with satellite-driven net primary production (NPP) and including export efficiency and transfer efficiency, when available. The objective of this synthesis is to understand the mechanisms associated with the spatial and temporal variation of the SV and to look for patterns in the Biological Carbon Pump efficiency and, ultimately, ocean carbon storage.

How to cite: Villa-Alfageme, M., Melgar, L., López-Rodríguez, Á., Abascal-Ruíz, U., and González-González, B.: Parameterization of sinking velocity rates in the Atlantic Ocean, EGU General Assembly 2025, Vienna, Austria, 27 Apr–2 May 2025, EGU25-5016, https://doi.org/10.5194/egusphere-egu25-5016, 2025.

EGU25-8581 | ECS | Posters on site | OS1.13

Ocean heat uptake and storage during climate stabilization at different global warming levels in GFDL-ESM2M 

Yona Silvy, Friedrich A. Burger, and Thomas L. Frölicher

The ocean is storing the majority of excess heat in the Earth system resulting from the release of anthropogenic greenhouse gases into the atmosphere. This heat uptake will persist even after cessation of greenhouse gas emissions, and it will continue for centuries in scenarios where global warming is limited to levels set by the Paris Agreement. This continued heat uptake has important implications for regional climate, ecosystems and sea level rise. However, the dynamics of ocean heat uptake and the redistribution of this heat under stabilized global warming remain poorly understood, particularly the time scales involved. Here, we apply the Adaptive Emission Reduction Approach to a fully coupled Earth System Model to simulate different levels of stabilized global warming until the year 3000. We reveal significant differences between the transient phase when surface temperatures first reach the targeted warming level, and the near-stabilized state after close to 1000 years at the warming level. We explore non-linearities in the evolution of the ocean circulation and ventilation over these time scales, as well as the sensitivity of heat uptake and storage to different global warming levels. For example, the stabilization simulations reveal long-term differences across global warming levels in the vertical redistribution of heat, with a relatively warmer upper ocean and colder deep ocean with warmer surface temperatures. We also find a threshold effect between 1.5ºC and 2ºC of global warming, where surpassing this threshold triggers irreversible changes that profoundly impact the redistribution of heat in the ocean. Specifically, during the stabilization phase at 2ºC of global warming and above, the subpolar Southern Ocean shows a recovery of deep convection that leads to an export of colder bottom waters than under pre-industrial conditions, that is not present at 1.5ºC.

How to cite: Silvy, Y., Burger, F. A., and Frölicher, T. L.: Ocean heat uptake and storage during climate stabilization at different global warming levels in GFDL-ESM2M, EGU General Assembly 2025, Vienna, Austria, 27 Apr–2 May 2025, EGU25-8581, https://doi.org/10.5194/egusphere-egu25-8581, 2025.

Compelling evidence indicates that ocean circulation is undergoing significant changes due to global warming. These changes include reduced ocean ventilation caused by increased stratification and the weakening of the Atlantic Meridional Overturning Circulation (AMOC). Consequently, this will alter carbon, oxygen, heat and nutrient distribution, and will therefore affect primary production and, by extension, the biological carbon pump. Due to the ocean’s huge capacity for carbon storage, it is imperative that we understand the consequences of these changes.

To examine how ocean ventilation influences the biological carbon pump and overall oceanic carbon storage, two idealised box models of ocean carbon and heat uptake are extended to include biological processes and nutrient cycling. The first model is a one-dimensional box model, with ocean ventilation parameterised by a relaxation timescale that responds to emission-driven warming. The second model is more complex, including a thermocline with a dynamically controlled thickness and meridional overturning circulation, both of which vary with increasing temperatures, determining the extent of ocean ventilation.

These models, previously employed to analyse the ocean’s carbon and thermal response to anthropogenic emissions, are now adapted to explore the effects of changing circulation on the biological carbon pump. A simple nutrient-phytoplankton-zooplankton-detritus (NPZD) biological model is introduced to simulate the role of macronutrient concentrations on phytoplankton and zooplankton growth. Simulations are conducted under scenarios of both constant and changing circulation to investigate the impacts of slower circulation and increased stratification on the biological carbon pump and its contribution to oceanic carbon storage.

How to cite: Baltas, E., Katavouta, A., and Hunt, H.: Exploring the Impact of Changing Ocean Circulation on Carbon Storage due to the Biological Carbon Pump: An Idealised Modelling Approach, EGU General Assembly 2025, Vienna, Austria, 27 Apr–2 May 2025, EGU25-9243, https://doi.org/10.5194/egusphere-egu25-9243, 2025.

EGU25-10777 | ECS | Posters on site | OS1.13

Impact of intermittent volcanic forcing on ocean carbon uptake under climate overshoot 

Katja Labermeyer, Moritz Adam, and Kira Rehfeld

The ocean has absorbed between 20-35% of anthropogenic CO2 emissions, acting as a major carbon sink despite its slower response times compared to the atmosphere and biosphere [1]. However, carbon uptake in the ocean is predicted to decrease in the future, particularly under scenarios that exceed global warming targets, resulting in the uptake rate being close to zero. Volcanic aerosol forcing introduces uncertainty into these projections by altering the Earth's radiation balance, which, in turn, affects ocean carbon fluxes by changing temperature and circulation patterns. Despite that, intermittent forcing is not considered in widely used CMIP or ScenarioMIP simulations.

Here, we leverage Earth system model simulations to explore the impacts of intermittent versus baseline volcanic forcing on the ocean carbon fluxes under a temperature overshoot scenario. We hypothesize that irregular forcing will amplify variability in ocean carbon uptake and we expect stronger responses in ocean basins such as the Atlantic due to AMOC sensitivity and downstream effects of eruptions. Two ensembles, generated with the Max Planck Institute Earth system model (MPI-ESM), are compared [2]. One ensemble is forced with semi-stochastic irregular volcanic events and another with a recurring, median intensity event. We analyze key variables, such as ocean carbon uptake, vertical temperature profiles, Atlantic Meridional Overturning Circulation (AMOC), and thermocline depth, to assess the variability and response timescales under intermittent forcing. To find responses on temporal and spatial scales, we quantify the response and recovery times of the ocean and determine where the strongest responses occur spatially to determine which regions are most or least affected. Our study aims to improve the understanding of the sensitivity of ocean carbon uptake to intermittent forcing and its implications for future projections of the carbon cycle.

[1] S. Khatiwala, F. Primeau, and T. Hall. “Reconstruction of the history of anthropogenic CO2 concentrations in the ocean”. In: Nature 462, pp. 346–349. 2009.
[2] T. Mauritsen et al. “Developments in the MPI-M Earth System Model version 1.2 (MPI-ESM1.2) and Its Response to Increasing CO2”. In: Journal of Advances in Modeling Earth Systems 11.4, pp. 998–1038. 2019.

How to cite: Labermeyer, K., Adam, M., and Rehfeld, K.: Impact of intermittent volcanic forcing on ocean carbon uptake under climate overshoot, EGU General Assembly 2025, Vienna, Austria, 27 Apr–2 May 2025, EGU25-10777, https://doi.org/10.5194/egusphere-egu25-10777, 2025.

The ocean absorbs a quarter of the anthropogenic carbon and 90% of the anthropogenic heat in the Earth system, significantly impacting the climate. On decadal timescales most relevant for climate prediction, the ocean circulation plays a central role in modulating the ocean heat and carbon sinks. It is therefore crucial to understand how these sinks interact with changes in the circulation. We have applied a novel water mass based inverse model, the optimal transformation method (OTM), to study the uptake of heat and carbon by the ocean and its redistribution in the interior by the ocean circulation. The OTM simultaneously calculates budgets of heat, freshwater, and carbon from a combination of observational data products, solving for the air-sea flux and transport and mixing of these tracers in a manner consistent with the available observational data. We apply OTM to a combination of data products: the EN4 objective analysis of temperature and salinity; the ECCO ocean state estimate; our own machine learning reconstruction of ocean interior carbon based on the GLODAP dataset; ERA5 and JRA55 reanalyses of air-sea heat and freshwater fluxes; and air-sea CO2 fluxes from the SeaFlux product. We analyse two decades, estimating global carbon uptake of 2.02 ± 0.22 PgC yr-1 for 1993-2002 and 2.86 ± 0.25 PgC yr-1 for 2003-2012. We find that changes in the carbon uptake between the two decades are dominated by the Southern Ocean (>35°S) and North Pacific (>10°N) basins, and our results also suggest a southwards redistribution of carbon in the Atlantic linked to changes in ocean circulation. Meanwhile, a redistribution of carbon northwards in the Pacific is accompanied by a southwards redistribution of heat.

How to cite: Mackay, N., Ehmen, T., and Watson, A.: Ocean carbon and heat uptake and redistribution diagnosed from observations using a water mass inverse model, EGU General Assembly 2025, Vienna, Austria, 27 Apr–2 May 2025, EGU25-10806, https://doi.org/10.5194/egusphere-egu25-10806, 2025.

EGU25-11039 | ECS | Orals | OS1.13

The long lives of subducted spice and vorticity anomalies in the subtropical oceans 

Cora Hersh, Susan Wijffels, Geoffrey Gebbie, and Gaël Forget

Subtropical cells, which exist in nearly all ocean basins, connect subducting subtropical waters to upwelling sites along the equator. This tight link between the subtropics and the tropics, on a scale of 5-15 years, is well-established in a time-averaged sense by modeling and observations. Recently, evidence has emerged of spice (density-compensated temperature and salinity variations) and potential vorticity anomaly persistence along mean flow pathways on isopycnals. We provide the first global view of subtropical water mass anomaly propagation, using both an observational dataset and the Estimating the Circulation and Climate of the Ocean (ECCO) state estimate Version 4 Release 4. In this global synthesis that complements the existing body of largely regional studies, we find long-lived interannual water mass anomalies that translate along mean advective pathways in all ventilated subtropical gyres. They are detectable over multiple years and several thousand kilometers. Some anomalies are persistent enough to reach both the western boundary and equatorial current systems before being entirely eroded, and thus could form ocean “tunnels” along which heat anomalies could travel to impact remote climate variability. Analysis of ocean tunnel propagation of a passive tracer (spice) and an active tracer (potential vorticity) confirms earlier model results that the active tracer decays more quickly than the passive tracer. Similarities and differences between timing and frequency of the two tracers could provide clues to anomaly formation mechanisms in various subduction regions. The success of ECCO in capturing these phenomena is encouragement to further explore their upstream sources and downstream impacts within this framework.

How to cite: Hersh, C., Wijffels, S., Gebbie, G., and Forget, G.: The long lives of subducted spice and vorticity anomalies in the subtropical oceans, EGU General Assembly 2025, Vienna, Austria, 27 Apr–2 May 2025, EGU25-11039, https://doi.org/10.5194/egusphere-egu25-11039, 2025.

EGU25-12898 | Orals | OS1.13 | Highlight

Physical inconsistencies in the representation of the ocean heat-carbon nexus in simple climate models 

Roland Séférian, Thomas Bossy, Thomas Gasser, Zebedee Nichols, Kalyn Dorheim, Xuanming Su, Junichi Tsutsui, and Yeray Yeray Santana-Falcón

The oceans slow the rate of global warming by absorbing each year about 25% of the anthropogenic CO2 emissions and 90% of the additional heat resulting from the Earth energy imbalance induced by the accumulation of greenhouse gases in the atmosphere. The interplay between the ocean heat and carbon uptake, the “Ocean Heat-Carbon Nexus”, links together the responses of the Earth climate and the global carbon cycle to cumulative CO2 emissions and to net zero CO2 emissions. It results from a suite of processes involving the exchange of heat and carbon across the sea-air interface as well as their storage below the mixed-layer and redistribution by the ocean large-scale circulation. The Ocean Heat and Carbon Nexus is assumed to be consistently represented across two modelling platforms used in the latest IPCC assessments: the Earth System Models (ESMs) and the Simple Climate Models (SCMs). However, our research shows significant deficiencies in state-of-the-art SCMs in replicating the ocean heat-carbon nexus of ESMs due to a crude treatment of the ocean thermal and carbon cycle coupling. With one SCM, we show that a more realistic heat-to-carbon uptake ratio exacerbates the projected warming by 0.1°C in low overshoot scenarios and up to 0.2°C in high overshoot scenarios. It is therefore critical to explore how SCMs' physical inconsistencies, such as the representation of the ocean heat-carbon nexus, can affect future warming projections used in climate assessments, not just by SCMs in Working Group 3 but also by ESMs in Working Group 1 via SCM-driven emission-to-concentration translation.

How to cite: Séférian, R., Bossy, T., Gasser, T., Nichols, Z., Dorheim, K., Su, X., Tsutsui, J., and Yeray Santana-Falcón, Y.: Physical inconsistencies in the representation of the ocean heat-carbon nexus in simple climate models, EGU General Assembly 2025, Vienna, Austria, 27 Apr–2 May 2025, EGU25-12898, https://doi.org/10.5194/egusphere-egu25-12898, 2025.

EGU25-13345 | ECS | Posters on site | OS1.13

Analysis of Export and Transfer Efficiency around the PAP-Site Observatory: an update from the APERO project 

Álvaro López Rodríguez, Bea González González, Santiago Hurtado Bermúdez, Frédéric Le Moigne, Maeva Gesson, and María Villa Alfageme

The biological carbon pump (BCP) plays a key role in the regulation of atmospheric CO2 levels. Export efficiency (Expeff), defined as the proportion of primary production (PP) that is exported as particulate organic carbon (POC) flux below the base of the euphotic zone (EZ), and transfer efficiency (Teff), defined as the ratio of POC flux below the EZ and POC flux attenuated at a given depth in the twilight zone (TZ), are two of the main parameters used as metrics of BCP strength. The objective of this work is to investigate the factors that influence the variability of both parameters at different bloom stages. The APERO cruises aim to investigate the BCP, with emphasis on the TZ (200-1000 m), and were conducted at the PAP site oceanographic observatory during the decline of a spring bloom in June and July 2023. Water and particle profiles (0-1000 m) were collected at five stations and POC fluxes at the base of the EZ were obtained derived from 210Po-210Pb disequilibrium and high depth resolution sediment traps. In addition, data measured from 1989 to 2023 for POC fluxes, at the base of the EZ, derived from 238U-234Th and 210Pb-210Po disequilibrium and at 3000 m depth, derived from moored sediment traps were compiled. Expeff (FluxEz/satellite NPP time-integrated) and Teff (Flux3000m/FluxEz) were quantified, and both values were compared across different years and bloom stages. POC fluxes measured in APERO ranged from 3.1-17 mmol C m⁻² d⁻¹, which agrees well with the value measured in 2021 during the same bloom stage, 13 ± 3 mmol C m⁻² d⁻¹. Expeff  presents significant fluctuations and shows a strong intra-annual variability. It changed during the bloom development, from 5-20% in 1989 to 41% in 2012, from 16-42% in 1989 to 14% in 2021 during the bloom peak, and during the decline of the bloom, it decreased from 26 ± 4 % in 2021 to 2.2-11% during the APERO cruise. Finally, Teff exhibits a strong intra-annual variability as the bloom progresses, changing from 6–23% at the beginning of the bloom in 1989, 16% in 2004, and 12% in 2012, to 5–14% at the peak in 1989, and 16% during the postbloom in 2009.

How to cite: López Rodríguez, Á., González González, B., Hurtado Bermúdez, S., Le Moigne, F., Gesson, M., and Villa Alfageme, M.: Analysis of Export and Transfer Efficiency around the PAP-Site Observatory: an update from the APERO project, EGU General Assembly 2025, Vienna, Austria, 27 Apr–2 May 2025, EGU25-13345, https://doi.org/10.5194/egusphere-egu25-13345, 2025.

EGU25-14150 | ECS | Posters on site | OS1.13

The spatiotemporal evolution of the global interior ocean’s anthropogenic carbon sink: reconstructed through machine learning 

Tobias Ehmen, Neill Mackay, and Andrew Watson

The oceans mitigate climate change by absorbing roughly 25% of the anthropogenic carbon that is released. Past reconstructions of air-sea CO2 flux based on surface pCO2 observations have indicated that this carbon sink exhibits decadal variability, appearing to weaken during the 1990s and strengthen in the 2000s. However, the causes of this variability are unclear, and it is poorly represented in climate models and the future climate projections they generate. It also remains uncertain whether the estimated variability is a product of bias due to the limited availability of biogeochemical observations. To address the challenge posed by sparse data, machine learning techniques have been applied to surface pCO2 as well as interior dissolved inorganic carbon (DIC). However, reconstructions of DIC and anthropogenic carbon for the full depth of the global ocean have not yet been achieved.

Our objective is to determine whether the variability in the ocean carbon sink is real and to understand changes in the interior carbon inventory as part of the carbon budget. To this end, we use neural networks to predict the spatiotemporal distributions of full-depth DIC and C* from the 1990s to the 2010s. C* is a quasi-conservative tracer that corrects DIC for biological activity by applying Redfield stoichiometric ratios. ΔC*, the difference in C* between two time points, has been used as a proxy for added anthropogenic carbon.

The neural network is trained on observations from the GLODAPv2.2023 database. We make predictions of DIC and additional C* components - total alkalinity, oxygen, and nitrate - based on the location, depth, temperature, and salinity from the EN4 reanalysis product and atmospheric CO2. Here, we present findings on the spatiotemporal evolution of full-depth interior carbon in the global ocean, providing a quantification of the anthropogenic carbon sink and its variability over time. The interior carbon inventory changes are then compared with current air-sea CO2 flux products. In further work, the results are being combined with a water mass based inverse method to investigate the drivers of variability.

How to cite: Ehmen, T., Mackay, N., and Watson, A.: The spatiotemporal evolution of the global interior ocean’s anthropogenic carbon sink: reconstructed through machine learning, EGU General Assembly 2025, Vienna, Austria, 27 Apr–2 May 2025, EGU25-14150, https://doi.org/10.5194/egusphere-egu25-14150, 2025.

EGU25-16067 | Posters on site | OS1.13

Enhanced storage of carbon in marine dissolved organic matter in scenarios of global warming 

Takasumi Kurahashi-Nakamura, Thorsten Dittmar, Adam C. Martiny, and Sinikka T. Lennartz

The efficiency of the ocean to store atmospheric CO2 in the coming century strongly depends on the stability of marine carbon reservoirs. Marine dissolved organic carbon (DOC) contains more carbon than all living biomass on Earth combined (660 gigatons C) and is recalcitrant against remineralisation at a decadal to millennial timescale, which offers an additional carbon pump to sequester carbon from active air-sea gas exchange with a millennial-scale stability (microbial carbon pump). However, the fate of this key carbon reservoir in a changing future climate is unknown, because the impact of environmental controls on bacterial remineralisation of DOC to CO2 are not explicitly considered in global Earth System Models.

We developed a dynamical model for dissolved organic matter (DOM) that explicitly depicts the production of DOM through primary production and its degradation by heterotrophic microorganisms, and coupled it interactively to the marine biogeochemistry module of UVic ESCM, an Earth system model of intermediate complexity (EMIC). Being based on present-day simulations with the model, it is revealed that the factor that limits bacterial growth in the model and meta-genomic data indicating bacterial nutrient limitation show a similar pattern in the global ocean. Together with other experimental data, we suggest a strong link between the future developments of DOC and macronutrient cycles.

Our model indicates that an increase in the global DOC pool under global warming ranges from 17 to 42 gigatons C at the end of the 22nd century in a future simulation based on a high-emission scenario (SSP5–8.5). The estimated accumulation rate (2 GtC dec−1) is comparable to the amount of the terrestrial input of DOC to the ocean by rivers, underlining its quantitative relevance for the global DOC budget. Our results suggest that DOM-microbe interactions governed by bacterial nutrient limitation provide negative feedback on the climate state via DOC buildup, reinforcing the growth of DIC sequestration by the conventional biological pump (6 GtC dec−1 for > 1000 m depth) in the same simulation.

How to cite: Kurahashi-Nakamura, T., Dittmar, T., Martiny, A. C., and Lennartz, S. T.: Enhanced storage of carbon in marine dissolved organic matter in scenarios of global warming, EGU General Assembly 2025, Vienna, Austria, 27 Apr–2 May 2025, EGU25-16067, https://doi.org/10.5194/egusphere-egu25-16067, 2025.

EGU25-16169 | ECS | Orals | OS1.13

The role of AMOC in controlling ocean heat uptake in idealized abrupt forcing scenarios 

Chiara Ventrucci, Federico Fabiano, Paolo Davini, Oliver Mehling, and Katinka Bellomo

Over the past 150 years, the ocean has absorbed almost 90% of the excess heat induced by anthropogenic carbon dioxide (CO2) emissions, acting as our planet's main heat reservoir. Multiple mechanisms contribute to ocean heat uptake (OHU) and global heat storage, which redistribute heat from the surface to the deep ocean and across all basins. Nevertheless, a comprehensive picture remains unclear. Within this context, the Atlantic Meridional Overturning Circulation (AMOC) plays a key role in transferring heat to the ocean's deepest layers, with a stronger AMOC related to an increase in global OHU. However, it is difficult to quantify the importance of the AMOC from the analysis of existing simulations from the Coupled Model Intercomparison Project (CMIP), as many processes are simultaneously active. 

In this study, we use the climate model EC-Earth3 to investigate how an AMOC weakening induced by a CO2 increase would influence the heat storage inside the ocean. We compare the CMIP abrupt4xCO2 simulation with an idealized experiment with the same forcing but designed to artificially maintain the AMOC strength at preindustrial levels through a positive salinity anomaly in the North Atlantic.  

We find that a change in the AMOC strength is associated with a change in heat storage, influencing both the vertical and interbasin redistribution. Due to AMOC weakening, less heat accumulates below 750 m, especially in the Atlantic Ocean, while we observe increased heat storage in intermediate layers and further heat transfer toward the Indo-Pacific Ocean. Overall, we notice a small but significant difference between the two simulations in global heat uptake, increasing in a weaker AMOC state. We hypothesize that a reduced role for AMOC-driven OHU is compensated for by an increase in heat diffusion towards the interior at low latitudes, according to recently developed conceptual models of OHU. 

These differences could influence the surface warming pattern and regional sea level rise, with implications for long-term climate changes. 

How to cite: Ventrucci, C., Fabiano, F., Davini, P., Mehling, O., and Bellomo, K.: The role of AMOC in controlling ocean heat uptake in idealized abrupt forcing scenarios, EGU General Assembly 2025, Vienna, Austria, 27 Apr–2 May 2025, EGU25-16169, https://doi.org/10.5194/egusphere-egu25-16169, 2025.

EGU25-17516 | Orals | OS1.13

North Atlantic Carbon Uptake and Variability: The Gulf Stream's Role in Air-Sea CO2 Flux and Storage 

Yohei Takano, Dani Jones, Ric Williams, Gael Forget, Jon Lauderdale, David Munday, and Vassil Roussenov

The North Atlantic Ocean contributes approximately 30% of the global ocean carbon uptake. This region plays a vital role in anthropogenic carbon uptake and hosts a significant natural carbon cycle driven by physical and biogeochemical processes. This study focuses on understanding the inter-annual variability of air-sea CO2 fluxes, anthropogenic carbon storage, and the role of the Gulf Stream in transporting water masses with low anthropogenic carbon concentrations into the subpolar North Atlantic. We present the development and application of our forward and adjoint ocean carbon cycle and biogeochemistry models within the Estimating the Circulation and Climate of the Ocean (ECCOv4) framework (ECCOv4r2-Dissolved Inorganic Carbon (DIC)). The ECCOv4r2-DIC simulation overall captures the inter-annual variability and decadal trends of ocean carbon uptake in the subpolar North Atlantic. The adjoint model for ocean biogeochemistry is a powerful tool that enables us to investigate the sensitivity of ocean carbon uptake to physical and biogeochemical factors under dynamic ocean conditions. Preliminary results from the adjoint biogeochemistry sensitivity simulations indicate that subpolar North Atlantic carbon storage is highly sensitive to dissolved inorganic carbon (DIC) in the Gulf Stream region on inter-annual timescales (e.g., lag of -4 years). This finding suggests that remote advective carbon transport significantly influences inter-annual carbon variability in the subpolar North Atlantic Ocean.

How to cite: Takano, Y., Jones, D., Williams, R., Forget, G., Lauderdale, J., Munday, D., and Roussenov, V.: North Atlantic Carbon Uptake and Variability: The Gulf Stream's Role in Air-Sea CO2 Flux and Storage, EGU General Assembly 2025, Vienna, Austria, 27 Apr–2 May 2025, EGU25-17516, https://doi.org/10.5194/egusphere-egu25-17516, 2025.

EGU25-20100 | Orals | OS1.13

The import & export of carbon & nutrients from the Weddell Gyre. 

David Munday, Graeme MacGilchrist, Kate Hendry, Andrew Styles, Chris Auckland, and Yohei Takano

The physical circulation and biogeochemistry of the Southern Ocean has proved crucial to understanding the sensitivity of global climate. The ventilation of deep water, rich in carbon and nutrients throughout the subpolar Southern Ocean is usually framed in terms of the residual overturning. This places the emphasis on the up- and down-welling of different water masses. However, for the Weddell Gyre it has been proposed that casting the carbon cycle in terms of the horizontal gyre circulation may be more informative (MacGilchrist et al., 2019). This emphasises the role of remineralisation at mid-depth of organic carbon and the differential transport in/out of the Weddell Sea in the longitudinal direction.


Using MITgcm as an idealised two-basin model with a Weddell Sea at the southern boundary of the Atlantic basin, we examine the physical controls of the import/export of carbon & nutrients from the Weddell Sea. The idealised nature of the model allows us to easily change the surface forcing and bathymetry. By perturbing the idealised model's Scotia Ridge and Weddell Sea wind stress curl, we are able to influence the connection between the Weddell Gyre and the rest of the Southern Ocean. Other perturbation experiments, including the diapycnal diffusivity at depth, are used to perturb the overturning circulation. Using simple biogeochemistry and a carbon pump decomposition we are able to see how individual reservoirs are altered and the role of their transport in the overall carbon budget of the Weddell Sea. In particular, we are able to use Reynolds averaging to split the import/export of carbon & nutrients into the Weddell Gyre into components due to overturning and gyre circulations. Our experiments allow us to consider the physical aspects that control the relative strength of these components.

How to cite: Munday, D., MacGilchrist, G., Hendry, K., Styles, A., Auckland, C., and Takano, Y.: The import & export of carbon & nutrients from the Weddell Gyre., EGU General Assembly 2025, Vienna, Austria, 27 Apr–2 May 2025, EGU25-20100, https://doi.org/10.5194/egusphere-egu25-20100, 2025.

EGU25-21738 | Posters on site | OS1.13

The cooling potential of biological pump carbon after temperature overshoot 

Wolfgang Koeve and Ivy Frenger

In the event of insufficient mitigation efforts, net-negative CO2 emissions may be required to return to acceptable limits of climate warming as defined by the Paris Agreement. The ocean is an important carbon sink under increasing atmospheric CO2 levels,when physico-chemical carbon-uptake dominates. However, the processes that govern the marine carbon sink under net-negative CO2-emission regimes are unclear. Recent work with an Earth System model of intermediate complexity has shown that under idealized temperature overshoot scenarios CO2 from physical-chemical uptake was partly lost from the ocean at times of net-negative CO2-emissions, while storage associated with the biological carbon pump (DICremin) continued to increase and may even dominate marine excess CO2 storage on multi-centennial time scales (Koeve et al. 2014, Nature Geosciences, https://doi.org/10.1038/s41561-024-01541-y).

Here we extend this work and estimate, for the first time, the cooling potential associated with CO2-storage attributable to the biological carbon pump on centennial time scales, with a focus of conditions of net-negative CO2-emissions. In our approach we use the UVic Earth System model, complemented with explicit model tracers of DICremin and preformed DIC. Changes of these tracers since preindustrial conditions can be traced to either the biological carbon pump or the physical-chemical uptake of anthropogenic CO2, respectively. We quantify the cooling potential of biological pump carbon based on emission pathways perturbed by the change in DICremin since the preindustrial model state. The warming potential of anthropogenic carbon lost from the ocean during times of negative emissions is quantified from emission pathways perturbed by changes of preformed DIC since preindustrial.

How to cite: Koeve, W. and Frenger, I.: The cooling potential of biological pump carbon after temperature overshoot, EGU General Assembly 2025, Vienna, Austria, 27 Apr–2 May 2025, EGU25-21738, https://doi.org/10.5194/egusphere-egu25-21738, 2025.

EGU25-846 | ECS | Orals | AS1.38

Elevational dependency of precipitation climatology and trends in global mountains: a model view 

Olivia Ferguglia, Elisa Palazzi, and Enrico Arnone

High-altitude regions have been identified as hotspots of climate change. In particular, the dependence of warming rates on elevation, known as Elevation-Dependent Warming (EDW), has been extensively discussed in the literature. Recently, the focus has expanded to the broader concept of Elevation-Dependent Climate Change (EDCC), with attention to precipitation and its extremes, given their importance for mountain hydrological resources and their role in triggering geo-hydrological hazards. Recent studies have investigated the elevational stratification of precipitation in  in-situ observations and reanalysis datasets, showing a lack of uniform patterns of EDCC across the world, which point to the need for common methodologies and insight in the driving mechanisms. In this study, we extend results we obtained with the ERA5 reanalysis to CMIP6 global climate models, and study EDCC in key mountain regions of the world: Tibetan Plateau, the US Rocky Mountains, the Greater Alpine Region, and the Andes. We focus on precipitation and its extremes, assessing the ability of the models  to reproduce historical patterns of stratification by comparison with ERA5 reanalysis data and other observation-based gridded datasets. We also explore how the stratification in other key climate variables, such as cloud cover, humidity, besides temperature, influence the elevational patterns of precipitation and precipitation extremes and their trends. Our analysis aims to determine whether the observed elevation-dependent precipitation patterns are primarily driven by dynamical, thermodynamical, or microphysical processes, identifying seasonal variations and the specific precipitation type (i.e., stratiform vs convective)  mostly affected. Particular attention is given to the role of the model spatial resolution, including regional climate models in a case study analysis over the Greater Alpine Region.

How to cite: Ferguglia, O., Palazzi, E., and Arnone, E.: Elevational dependency of precipitation climatology and trends in global mountains: a model view, EGU General Assembly 2025, Vienna, Austria, 27 Apr–2 May 2025, EGU25-846, https://doi.org/10.5194/egusphere-egu25-846, 2025.

Orographic interactions of intense western disturbances (WDs) with western Himalayan (WH) topography often drive persistent extreme precipitation events (EPEs) in the region during the winter season, contributing to significant socio-economic losses. Accurate predictions of such events remain challenging due to the sparse gauge network and complex multi-scale interactions of dynamical and microphysical processes with the region’s heterogenous orography. Numerical weather prediction models, such as the Weather Research and Forecasting (WRF) model, are widely utilized tools for simulating extreme precipitation with high-resolution and physically informed configurations. Kilometer-scale convection-permitting hold potential for improved representation of sub-grid processes, such as orographic effects and land-surface interactions, thus offering more scope for enhancing predictability. The present study investigates the predictability of intense WD-associated EPEs using convection-permitting (3 km) dynamically downscaled WRF simulations and a multi-physics ensemble (ENSM) approach, initialized using ERA5 reanalysis and validated with high resolution IMDAA (12 km) regional reanalysis. Ten persistent EPEs (lasting 3 or more consecutive days) were analyzed to assess sensitivity to sea surface temperature (SST) forcings and eight microphysical parameterization (MP) schemes (Single-moment: WSM7, Thompson8; Double-moment: WDM7, Thompson28, Morrison, P3). The findings reveal minimal variations from SST forcings at 3–4-day time scales, highlighting the dominant role of atmospheric processes at shorter time scales during winter EPEs. Both single- and double-moment MPs exhibited comparable performance, with minor spatial variations. The ENSM demonstrated enhanced prediction skill (>0.6) and accurately captured precipitation characteristics, including diurnal variations and dynamics like atmospheric baroclinicity, vertical wind shear, and stability driven by meridional temperature gradients. Overall, the findings underscore the potential of a convection-permitting multi-physics ensemble frameworks in enhancing the predictability of extreme winter precipitation over the orographic WH region.

Keywords: Convection-Permitting Simulations, WRF Model, Mountain Precipitation Extremes, Prediction, Microphysical Parameterization

How to cite: Sharma, N. and Attada, R.: Enhanced Predictability of Himalayan Orographic Precipitation Extremes Using a Kilometer-Scale Convection-Permitting Multi-Physics Ensemble, EGU General Assembly 2025, Vienna, Austria, 27 Apr–2 May 2025, EGU25-1058, https://doi.org/10.5194/egusphere-egu25-1058, 2025.

EGU25-1443 | ECS | Orals | AS1.38

Quantifying processes of winter daytime and nighttime warming over the Tibetan Plateau 

Fangying Wu, Qinglong You, and Nick Pepin

The Tibetan Plateau (TP) has experienced accelerated warming in recent decades, especially in winter. However, a comprehensive quantitative study of its long-term warming processes during daytime and nighttime is lacking. This study quantifies the different processes driving the acceleration of winter daytime and nighttime warming over the TP during 1961-2022 using surface energy budget analysis. The results show that the surface warming over the TP is mainly controlled by two processes: a) a decrease in snow cover leading to a decrease in albedo and an increase in net downward shortwave radiation (snow-albedo feedback), and b) a warming in tropospheric temperature (850-200 hPa) leading to an increase in downward longwave radiation (air warming-longwave radiation effect). The latter has a greater impact on the spatial distribution of warming than the former, and both factors jointly influence the elevation dependent warming pattern. Snow-albedo feedback is the primary factor in daytime warming over the monsoon region, contributing to about 59% of the simulated warming trend. In contrast, nighttime warming over the monsoon region and daytime/nighttime warming in the westerly region are primarily caused by the air warming-longwave radiation effect, contributing up to 67% of the simulated warming trend. The trend in the near-surface temperature mirrors that of the surface temperature, and the same process can explain changes in both. However, there are some differences: an increase in sensible heat flux is driven by a rise in the ground-atmosphere temperature difference. The increase in latent heat flux is associated with enhanced evaporation due to increased soil temperature and is also controlled by soil moisture. Both of these processes regulate the temperature difference between ground and near-surface atmosphere.

How to cite: Wu, F., You, Q., and Pepin, N.: Quantifying processes of winter daytime and nighttime warming over the Tibetan Plateau, EGU General Assembly 2025, Vienna, Austria, 27 Apr–2 May 2025, EGU25-1443, https://doi.org/10.5194/egusphere-egu25-1443, 2025.

EGU25-2606 | ECS | Orals | AS1.38

Sources of temperature biases in Regional Climate Models over complex orography: a general approach 

Francesca Zarabara and Dario Giaiotti

Amid the alarming pace and effects of human-induced climate change, mountainous regions are warming at about twice the global average rate. Modeling climate and climate change scenarios over regions with highly complex topography, such as the Alps, remains a significant challenge for regional climate modeling. Better characterizing the sources of model biases is a major issue, particularly in areas with complex terrain.

We analyze the sources of bias affecting near-surface temperature (TAS) in an ensemble of EURO-CORDEX models, focusing on the Friulian Alps. By examining the vertical structure of atmospheric thermal profiles, we identify and quantify four main sources that contribute to surface temperature biases at specific locations or grid points.

  • The first source is related to the ensemble's ability to reproduce free-atmosphere temperatures, such as those at the 500 hPa level.

  • The second component accounts for the biased representation of the thermal gradient between the free-atmosphere and the boundary layer top.

  • The third component is associated with model errors in the height of the boundary layer top. Under the environmental lapse rate approximation, this component corresponds to the orographic bias at a station or grid point. In the mountainous region we examined, the orographic bias represents a significant source of error.

  • The final contribution to the TAS bias stems from the inadequate representation of processes within the boundary layer, which exhibit temporal and spatial variability depending on the type of mountain boundary layer.

We provide seasonal and annual estimates for each TAS bias component and suggest that advanced statistical bias correction techniques, including machine learning approaches, may be particularly effective in addressing the specific challenges posed by the boundary-layer-dependent component of the overall TAS bias.


How to cite: Zarabara, F. and Giaiotti, D.: Sources of temperature biases in Regional Climate Models over complex orography: a general approach, EGU General Assembly 2025, Vienna, Austria, 27 Apr–2 May 2025, EGU25-2606, https://doi.org/10.5194/egusphere-egu25-2606, 2025.

EGU25-2940 | ECS | Orals | AS1.38

Simulating the submesoscale rotating structures in the bora wind 

Petar Golem, Hrvoje Kozmar, Željko Večenaj, and Branko Grisogono

Wind speed within bora (downslope windstorm) events at the northern Adriatic coast is often found to be “pulsating” in a quasi-periodic manner with a period of a few minutes. In an earlier work, the characteristic horizontal rotational motion of these pulsations at the town of Senj, Croatia was studied using tower measurements. In the present work this analysis is extended to a larger domain using a hectometer-scale numerical simulation (WRF-ARW) of a summer bora event. The model successfully reproduced the rotational motion at the position of the tower: the near-ground wind velocity vector within the band of periods between 3 and 11 min traces out a highly elongated ellipse in the counterclockwise direction, its major axis aligned with the shear vector at the top of the leeside low-level jet. The pulsations are associated with Kelvin-Helmholtz instability between the low-level jet and the stagnation zone. The most interesting finding is that the predominant rotation direction over the rest of the domain, especially over the sea, depends strongly on directional shear within the low-level jet, i.e., which direction the wind turns with height. It is argued that the cause of the predominant rotation direction is deformation of the laterally unstable Kelvin-Helmholtz billows by the directional shear.

How to cite: Golem, P., Kozmar, H., Večenaj, Ž., and Grisogono, B.: Simulating the submesoscale rotating structures in the bora wind, EGU General Assembly 2025, Vienna, Austria, 27 Apr–2 May 2025, EGU25-2940, https://doi.org/10.5194/egusphere-egu25-2940, 2025.

EGU25-3039 | ECS | Orals | AS1.38

Strongly Heterogeneous Surface-Water Warming Trends in High Mountain Asia 

Taylor Smith and Bodo Bookhagen

High Mountain Asia has experienced significant warming in recent decades. Changes in both temperature and precipitation patterns have strongly impacted regional hydrology, including changes to glaciers, snowmelt, and river systems. Here we examine long-term (1983-2023) and high-resolution (30 m) changes in water-surface temperature over a large and topographically diverse region encompassing the world’s highest mountains. We find that water-surface temperatures have significantly increased in the vast majority of the study area -- especially in snow-covered and high-elevation regions -- with a noted acceleration over the past decade. While some of this warming can be explained by increasing regional air temperatures, we find that surface water is warming faster than nearby dry areas. We posit that modifications to snowmelt timing and volume have created strong spatial heterogeneities in surface-water warming. These impacts will be felt both directly by cold-water flora and fauna, and downstream through decreases in surface-water quality.

How to cite: Smith, T. and Bookhagen, B.: Strongly Heterogeneous Surface-Water Warming Trends in High Mountain Asia, EGU General Assembly 2025, Vienna, Austria, 27 Apr–2 May 2025, EGU25-3039, https://doi.org/10.5194/egusphere-egu25-3039, 2025.

Some of the rainiest regions on Earth lie upstream of tropical mountains, where the interaction of prevailing winds with orography produces frequent precipitating convection. Yet, the response of tropical orographic precipitation to the large-scale wind and temperature variations induced by anthropogenic climate change remains largely unconstrained.
Here, we quantify the sensitivity of tropical orographic precipitation to background cross-slope wind using theory, idealized simulations, and observations. We build on a recently developed theoretical framework that characterises the orographic enhancement of seasonal-mean precipitation, relative to upstream regions, as a response of convection to cooling and moistening of the lower free-troposphere by stationary orographic gravity waves. Using this framework and convection-permitting simulations, we show that higher cross-slope wind speeds deepen the penetration of the cool and moist gravity wave perturbation upstream of orography, resulting in a mean rainfall increase of 20--30% per m s-1 increase in cross-slope wind speed.
Additionally, we show that orographic precipitation in five tropical regions exhibits a similar dependence on changes in cross-slope wind at both seasonal and daily timescales. Given next-century changes in large-scale winds around tropical orography projected by global climate models, this strong scaling rate implies wind-induced changes in some of Earth's rainiest regions that are comparable with any produced directly by increases in global mean temperature and humidity. 

How to cite: Nicolas, Q. and Boos, W.: Sensitivity of tropical orographic precipitation to wind speed with implications for future projections, EGU General Assembly 2025, Vienna, Austria, 27 Apr–2 May 2025, EGU25-3810, https://doi.org/10.5194/egusphere-egu25-3810, 2025.

Parameterizations of subgrid scale mountains are commonly used in large scale numerical weather prediction and climate models. They try to represent quite separate processes: the enhancement of the turbulent drag by orography, gravity waves and low level flow blocking. Among the gravity waves some schemes eventually separate between the upward propagating waves and the trapped lee waves.  Using a recent theoretical methodology that addresses the interaction of stratified boundary layers with mountains, a theory that handles the transition from neutral to stratified dynamics and trapped waves, we propose a formalism that can include all these effects.  As in most parameterizations it separates the flow between a linear part and a blocked part.  Here  the linear part handles enhanced turbulent drag in the neutral case and gravity waves in the stratified case, trapped lee waves in the transition. In this presentation we evaluate the mountain drag associated to all these processes as well as the fraction of the drag that stays within the boundary layer instead of being radiated in the far field.  We also try to  evaluate the blocked part by combining the sheltering effects that dominate when stratification is small and the blocking effects that dominate when stratification is large.

How to cite: Lott, F., Beljaars, A., and Deremble, B.: Rationale for a subgrid scale orography parameterization that includes turbulent form drag, gravity wave drag and low level flow blocking, EGU General Assembly 2025, Vienna, Austria, 27 Apr–2 May 2025, EGU25-4362, https://doi.org/10.5194/egusphere-egu25-4362, 2025.

EGU25-5859 | Orals | AS1.38 | Highlight

The TEAMx Observational Campaign – First findings from the winter campaign 

Manuela Lehner, Mathias W. Rotach, Ivana Stiperski, Lena Pfister, Alexander Gohm, Christophe Brun, Jutta Vüllers, Jan Cermak, Andrew Orr, Ian Renfrew, Helen F. Dacre, and Charles Chemel

TEAMx (multi-scale transport and exchange processes in the atmosphere over mountains – programme and experiment) is an international research program that aims at improving our understanding of exchange processes over complex terrain and at evaluating and improving the representation of these processes in numerical weather and climate prediction models. As part of TEAMx, a one-year long field campaign, the TEAMx Observational Campaign (TOC), started in September 2024, with dedicated observations being conducted in four target areas aligned in an approximate north-south cross section through the European Alps. In addition to long-term monitoring during the TOC, shorter experiments with a high density of instrumentation target processes under different atmospheric conditions and at a range of spatial scales from turbulence to cross-Alpine transport during two extended observational periods.

The first of these two extended observational periods took place between January and February 2025, with experiments focusing on the Inn Valley, Austria, and the Wipp Valley, Italy. The measurements were designed to observe (i) the three-dimensional structure of the mountain boundary layer, including its turbulence characteristics; (ii) the mean and turbulent structure of katabatic winds over a steep snow-covered slope and its response to larger-scale flows; (iii) the three-dimensional structure of mountain waves; and (iv) the life cycle of low-level stratiform clouds forming in the valley atmosphere. To this purpose, measurements were conducted with a suite of instruments, including research aircraft, radiosoundings, remote-sensing wind and temperature profilers, tethered balloons, and a network of turbulence towers.

This presentation will give a brief overview of TEAMx and highlight some of the very first findings from the experiments conducted during the winter campaign.

How to cite: Lehner, M., Rotach, M. W., Stiperski, I., Pfister, L., Gohm, A., Brun, C., Vüllers, J., Cermak, J., Orr, A., Renfrew, I., Dacre, H. F., and Chemel, C.: The TEAMx Observational Campaign – First findings from the winter campaign, EGU General Assembly 2025, Vienna, Austria, 27 Apr–2 May 2025, EGU25-5859, https://doi.org/10.5194/egusphere-egu25-5859, 2025.

EGU25-6679 | Posters on site | AS1.38

Precipitation Uncertainty Hampers the Understanding of Glacier Response in High Mountain Asia 

Thomas Shaw, Achille Jouberton, Masashi Niwano, Marin Kneib, Koji Fujita, and Francesca Pellicciotti

High Mountain Asia (HMA) provides crucial water resources to more than 1.5 billion people and accurate quantification of high elevation precipitation in this region is essential for understanding the hydrological cycle, patterns of ongoing climatic change, and water resource management. This is particularly the case in high elevation, glacierised catchments where the interplay of complex cryospheric and atmospheric processes limits our understanding of current and future water resource availability. Moreover, the role of precipitation and snow accumulation is critical for the health of glaciers which represent both an important freshwater storage and hydrological buffer to drought conditions, but also pose an increasing hazard to downstream populations through potential lake-damming and outburst floods. In both present-day and future modelling scenarios, precipitation at both macro and local scales generate some of the greatest uncertainties in glacier response to climate, and in few places are these hydroclimatic complexities better demonstrated than in HMA.


We explore the variability of precipitation estimates across several of the latest regional gridded products with high spatial (>= 10 km) and temporal (hourly) resolution and provide a specific focus over glacierized areas of HMA. Given the common temporal window of 2001-2019, we find substantial disagreement between precipitation products in terms of i) their annual and seasonal magnitudes, ii) the fraction of precipitation occurring during the summer/monsoon period, iii) the decadal difference of precipitation sums, iv) the inter-annual correlation to station observations, v) diurnal precipitation frequency and, vi) dependence on elevation and topographic complexity. Biases of precipitation amounts against in-situ station data can exceed +400% in steep mountainous areas of the Himalaya and errors between products are 23-120% greater over glacierized areas relative to the HMA-wide mean. 


When forcing an energy balance model over select glaciers, annual mass balances can disagree by up to 8 m w.e. (1.5 m w.e.) over a single year without (with) bias correction to local observations, propagating into highly distinct long-term trends of estimated glacier health. The high variability of glacier response at the catchment scale relates to spatial patterns of precipitation occurrence due to orographic effects and the resolution and physical process representation of different products. Differences in the surface energy balance of glaciers is, however, most strongly linked to the sub-daily timing of precipitation events and resultant temperature-driven phase of precipitation in different seasons. 


We discuss the implications of process representation by different precipitation products and the uncertainty attached to their application in models of glacier energy and mass balance. We also highlight the role of elevation-dependent temperature changes over HMA during the last decades and the implications for changing precipitation phase as a key driver of regionally distinct patterns of glacier mass balance.

How to cite: Shaw, T., Jouberton, A., Niwano, M., Kneib, M., Fujita, K., and Pellicciotti, F.: Precipitation Uncertainty Hampers the Understanding of Glacier Response in High Mountain Asia, EGU General Assembly 2025, Vienna, Austria, 27 Apr–2 May 2025, EGU25-6679, https://doi.org/10.5194/egusphere-egu25-6679, 2025.

EGU25-6939 | ECS | Orals | AS1.38

Investigating lee wave trapping mechanisms over the UK and Ireland 

Hette G. Houtman, Miguel A.C. Teixeira, Suzanne L. Gray, Simon Vosper, Peter Sheridan, and Annelize van Niekerk

Although various lee wave trapping mechanisms have been studied theoretically since Lyra (1940), not much is known about the relative occurrence of these trapping mechanisms in the real world. For this purpose, vertical atmospheric profiles associated with trapped lee waves are clustered here using self-organising maps.

Because in-situ observations of trapped lee waves are scarce, these vertical profiles are extracted from the Met Office’s convective-scale UKV model (which encompasses the UK and Ireland). To demonstrate that this model accurately represents the conditions relevant to trapped lee wave generation, the wavelength and orientation of trapped lee waves visible in satellite imagery are compared to those in the model. The model is found to reproduce these observed characteristics well.

Subsequently, we use the trapped lee wave identification model developed by Coney et al. (2023) and a linear Taylor-Goldstein equation solver to determine which vertical profiles are associated with trapped lee wave activity. We confirm that high low-level wind speeds are a necessary condition for the generation of trapped lee waves of substantial amplitude. We find that wind speeds increasing with height contribute to wave trapping in most cases. Temperature inversions are present in roughly one-third of trapped lee wave cases. The implications of these results for the development of a trapped lee wave drag parametrisation scheme are discussed.


References:

Lyra, G. (1943) Theorie der stationären Leewellenströmung in freier Atmosphäre. Z. Angew. Math. Mech., 23, 1-28.

Coney, J. et al. (2023) Identifying and characterising trapped lee waves using deep learning techniques. Quarterly Journal of the Royal Meteorological Society, 150, 213–231.

How to cite: Houtman, H. G., Teixeira, M. A. C., Gray, S. L., Vosper, S., Sheridan, P., and van Niekerk, A.: Investigating lee wave trapping mechanisms over the UK and Ireland, EGU General Assembly 2025, Vienna, Austria, 27 Apr–2 May 2025, EGU25-6939, https://doi.org/10.5194/egusphere-egu25-6939, 2025.

EGU25-7058 | ECS | Posters on site | AS1.38

A KGE-based weighted mean of stations’ ensemble to estimate the air temperature at Jungfraujoch since 1900 

Marco Bongio, Carlo De Michele, and Riccardo Scotti

Air temperature is a key variable in the meteo-climatological fields because impacts the atmospheric stability and clouds formation, drives wind patterns and defines the kind of precipitation. However, there is a scarcity of long-term data, especially at high elevations (more than 2000 m). This study proposes a statistical-based methodology to reconstruct a long-term daily temperature record (maximum, mean, and minimum) for high-altitude sites. We have tested it at Jungfraujoch (3571 m a.s.l.), Switzerland, with a backward simulation extending to 1900. The methodology involves daily data from surrounding meteorological stations (thirty), within the MeteoSwiss database, located at elevations ranging 485-2691m a.s.l., providing uninterrupted observations spanning at least the period from 1971 to 2023. The methodology includes the following steps: 1) long-term temporal consistency was evaluated by removing observations with data gaps exceeding 30 days; 2) the mean monthly trend was removed using a non-linear trend estimation function; 3) for each meteorological station, during the calibration period (1988–2005), the daily temperature at Jungfraujoch was estimated as the sum of the temperature at the selected station plus a deterministic and stochastic component; 4) pairwise model performance was evaluated within two validation periods (1971–1985 and 2005–2023) by calculating biases, RMSE, correlation coefficients, rank-based metrics, and the Kling-Gupta Efficiency (KGE); 5) stations with a KGE greater than 0.9 were selected to calculate ensemble simulations, which were obtained as the weighted mean of these stations, extending back to the year 1900 ; 6) A validation was conducted by comparing the reconstructed time series with the closest grid point from two datasets: HISTALP and that provided by Imfeld et al. (2023).

The results suggest: i) comparable performance with existing datasets (HISTALP, Imfeld et al. 2023), despite using a highly parsimonious model that does not rely on additional variables such as relative humidity, cloud cover, wind velocity, or weather patterns; ii) the selection of stations with temporally consistent long-term observations is critical; iii) model performance, efficiency, and errors are primarily influenced by elevation, rather than latitude, longitude, exposure, or distance; iv) the Kling-Gupta Efficiency (KGE) is the most appropriate metric for selecting stations to be used in the ensemble; v) Temporally consistent time series generated by this methodology can provide a benchmark for evaluating observations anomalies and for deeper analysis of Elevation-Dependent Warming issue.

How to cite: Bongio, M., De Michele, C., and Scotti, R.: A KGE-based weighted mean of stations’ ensemble to estimate the air temperature at Jungfraujoch since 1900, EGU General Assembly 2025, Vienna, Austria, 27 Apr–2 May 2025, EGU25-7058, https://doi.org/10.5194/egusphere-egu25-7058, 2025.

The urban areas of many developing cities are suffering from environmental problems due to overpopulation and inadequate public services, in that sense, air pollution is one of the biggest problems. In general, Latin American cities have a higher density of vehicles and are therefore prone to experience high contributions of vehicular pollution. Considering also that the vehicle fleet is old and, in many cases, poorly maintained compared to more developed cities.

The dispersion of pollutants is mainly influenced by wind characteristics, which in turn are influenced by surface roughness (urban coverage) and mountain topography. The objective of the study is to evaluate the influence of surface roughness and topography on wind profiles and the dispersion of atmospheric pollutants in two populated hills located in the city of Cusco, the first called UNSAAC and the second Independencia Hill.

The analysis will be carried out using the numerical model RANS ENVI-met, which determines the dispersion of air pollutant taking into account the interaction between the cover and the atmosphere. The input of the model will be the topographic information, hourly meteorological data and the concentration of pollutants (NO2, SO2, O3, PM10) measured in the field for two months.

In the UNSAAC area, the urban coverage extends along one of the faces of a mountain with a 21 % slope and in the Indepencia area, the urban coverage is located between two mountains with a slope of 15 % (see Figure 1). Regarding roughness, 3 cases were evaluated: zero roughness (topography without buildings), normal roughness (topography with buildings) and increased roughness (topography with doubled-height buildings). Two wind directions were evaluated: 180° and 360°.

Figure 1: Northern axis of evaluation in the Independencia and UNSAAC area

According to the results, the velocity in the boundary layer is lower when the roughness is increased for both study areas; this difference is greater when the wind direction is 360° (see Figure 2). It can also be observed that the height of the boundary layer is higher in the urban area of Independencia. Here, the velocity exceeds 2 m/s at a height of 20 m, while, in the other profiles it exceeds this value at a height less than 5 m. On the other hand, a peak in the NO2 concentration values ​​with 180 µg/m3 can be observed in the urban area of ​​Independencia (see Figure 3).

The results of the study may be useful to buid a risk map of both areas, in order to identify areas with high concentrations of pollutants, and propose measures to reduce pollution, such as limiting the number of vehicles on certain roads.

Figure 2: Wind profiles for a) UNSAAC zone WD= 180° b) UNSAAC zone WD= 360° c) Independencia zone WD= 180° d) Independencia zone WD= 360°

Figure 3: NO2 concentration for a) UNSAAC zone  and b) Independencia zone

How to cite: Mallqui, R., Horna, D., and Cabrera, J.: Study of the influence of surface roughness and topography on wind profiles and the dispersion of atmospheric pollutant in two populated hills in Cusco, Peru, EGU General Assembly 2025, Vienna, Austria, 27 Apr–2 May 2025, EGU25-7252, https://doi.org/10.5194/egusphere-egu25-7252, 2025.

EGU25-8083 | Posters on site | AS1.38

Mountain waves occurrence in Polish Carpathians and their influence on aviation operations 

Alina Jasek-Kaminska, Łukasz Kiełt, Adrian Góra, and Mirosław Zimnoch

Mountain regions, as defined by the International Civil Aviation Organization (ICAO), cover less than 5% of Poland, but highly variable orography dominates almost whole southern border of the country. Under favorable conditions, orographic gravity waves are observed in the wind field over significant part of southern Poland, influencing airspace users. 

Private aircrafts, weighing around five tons and often less, experience orographically induced turbulence directly but not exclusively over the mountainous areas: rotors occurring downstream generate moderate or severe turbulence as well. Moreover, their presence may not be evident in cloudiness so that the pilot encounters so-called clear air turbulence (CAT). Airports located downstream can experience low level wind shear which creates additional difficulties for take-off and landing operations, and if encountered unprepared, can result in a dangerous loss of lift. It is recommended by the ICAO that mountain waves (MTW) of moderate or severe intensity are included in aviation weather forecasts products. 

This study presents the MTW climatology in Polish Carpathians, focusing mainly on the Tatra mountains, using observational data and ERA5 reanalysis. Typical synoptic situations favorable for MTW occurrence in southern Poland are summarized. Based on an extreme case of a devastating downslope windstorm in the Tatra mountains in 2013, the impact of numerical model resolution on resolving the mountain wave effects is investigated using high resolution WRF (Weather Research and Forecasting model) simulations. 

This project has been supported by the subsidy of the Meteorological Service for Civil Aviation of Institute of Meteorology and Water Management – National Research Institute of Poland, "Excellence Initiative - Research University" program at AGH University of Krakow (grant agreement no. 598707), and the subsidy of the Ministry of Science and Higher Education.

How to cite: Jasek-Kaminska, A., Kiełt, Ł., Góra, A., and Zimnoch, M.: Mountain waves occurrence in Polish Carpathians and their influence on aviation operations, EGU General Assembly 2025, Vienna, Austria, 27 Apr–2 May 2025, EGU25-8083, https://doi.org/10.5194/egusphere-egu25-8083, 2025.

EGU25-12489 | ECS | Orals | AS1.38

Forest Transition and its Hydro-Climatic Impacts in the Indian Himalayas: Inferences from Field Observations  

Jyoti Ranjan Mohanty, Jaya Khanna, Sumit Sen, and Jagdish Krishnaswamy

The Himalayas, known as the Earth's third pole, are vital to regional and global climate systems, supporting globally significant biodiversity and livelihoods through ecosystem services such as carbon sequestration and water. However, in the west-central Indian Himalayas, moist, broad-leaved mixed-Oak forests are increasingly being replaced by dry, fire tolerant and fire prone Chir Pine forests, posing ecological concerns. This transition threatens biodiversity, reduces ecosystem functionality, and disrupts water availability, raising significant ecological and societal concerns. While the socio-ecological impacts have been explored, the hydro-climatic consequences remain less understood. To address this knowledge and data gap, we established two research observatories in Uttarakhand’s Chir pine and mixed-oak forests (~1600m elevation, 23° slope) to investigate how these forest transitions affect land -atmosphere energy fluxes, soil moisture, streamflow, and transpiration. Our study integrates field measurements with numerical simulations to provide insights into these changes. Bowen ratio (BR) assemblies were installed at 30m (pine) and 18m (oak) heights, equipped with EE181 and HC2S3 temperature and humidity sensors. Seasonal on-site calibration ensured reliable data collection, resulting in a nearly complete year of high-quality data from these remote locations. During the monsoon season, Pines exhibit higher BR evapotranspiration (ET) compared to Oaks, while during the dry period, their ET is only marginally higher. At the tree level, Pines transpire over a larger sapwood area and exhibit less stringent regulation of sap flow and associated transpiration under varying environmental conditions compared to Oaks. Hydrological analyses indicate that the catchments dominated by Pine have lower baseflow to precipitation percentage compared to Oak, rendering streams in these Pine dominated catchments ephemeral, unlike the more sustained baseflow in Oak-dominated forests. All the measurements corroborate the higher evapotranspiration observed in the Chir pine forest compared to Oak. These observations have been used to parameterize vegetation in the Ocean-Land-Atmosphere Model, enabling high-resolution simulations of regional hydro-climatic conditions under different forest covers  This first ever study of these Himalayan vegetation transitions is likely to provide insights into the future changes in ecohydrology in this biodiversity and water security hotspot. 

How to cite: Mohanty, J. R., Khanna, J., Sen, S., and Krishnaswamy, J.: Forest Transition and its Hydro-Climatic Impacts in the Indian Himalayas: Inferences from Field Observations , EGU General Assembly 2025, Vienna, Austria, 27 Apr–2 May 2025, EGU25-12489, https://doi.org/10.5194/egusphere-egu25-12489, 2025.

EGU25-13871 | Orals | AS1.38

First Results From The TEAMx-FLOW Project: Wintertime Radiosonde Observations And Numerical Modelling Of Mountain Waves Over The Tyrolean Alps 

Neil Hindley, Andrew Orr, Corwin Wright, Andrew Ross, and Philip Rosenberg

The TEAMx programme is a coordinated international research programme focusing on improving our understanding of exchange processes in the atmosphere over mountains and evaluating their representation in numerical weather prediction (NWP) and climate models. TEAMx features several observational and modelling strategies conducted by nationally funded projects centred on the European Alps, including 6-week extended observational periods (EOPs) in both summer and winter 2025. In this presentation, we present the first results from the UK-funded TEAMx-FLOW project, which focuses on the representation of wintertime orographic drag from mountain waves across spatial scales (including sub-km) in the UK Met Office Unified Model (UM) and its evaluation against TEAMx observations. Here we present analysis of the first of these observations, an intensive radiosonde balloon campaign launched throughout January-March 2025 conducted by the UK National Centre for Atmospheric Science (NCAS). The NCAS campaign featured 6-hourly operational launches, complemented with 3-hourly intensive launch periods during mountain wave events and also simultaneous launches of offset pairs of radiosondes. We analyse and quantify mountain waves and their momentum transport in these measurements, including using cross-spectral analysis of the offset pairs to obtain scale separation of observed mountain waves, a process not routinely applied to balloon soundings before. We also explore observations of partial wave breakdown in horizontally sheared flow, a process highly challenging to represent in models. With these new observations, we outline how the representation of mountain waves across multiple spatial scales in the UM and other NWP models can be evaluated and improved to achieve ever more accurate sub-km modelling, leading to improved predictions of mountain weather and climate in next-generation models.

How to cite: Hindley, N., Orr, A., Wright, C., Ross, A., and Rosenberg, P.: First Results From The TEAMx-FLOW Project: Wintertime Radiosonde Observations And Numerical Modelling Of Mountain Waves Over The Tyrolean Alps, EGU General Assembly 2025, Vienna, Austria, 27 Apr–2 May 2025, EGU25-13871, https://doi.org/10.5194/egusphere-egu25-13871, 2025.

EGU25-13987 | Posters on site | AS1.38

Investigating the spatial structure of winds in complex terrain using a mobile wind lidar 

Stephan De Wekker, Jagdish Desai, Gert-Jan Duine, and Leila Carvalho

In the lee of the Santa Ynez Mountains north of Santa Barbara, CA, late afternoon-to-early morning episodes of offshore, northerly gusty downslope surface winds are frequently observed. These downslope winds are locally known as Sundowners. Sundowners are spatially non-uniform and can be accompanied by rapid increases in temperature and decreases in relative humidity with significant impact on fire behavior. Our understanding of the spatial and temporal variability of Sundowners and the underlying mesoscale mechanisms is limited. To address this knowledge gap, the NSF-funded Sundowner Wind Experiment (SWEX) was conducted in Spring 2022.  

In this presentation, we focus on observations made by the surface-based mobile observing platform UWOW (University of Virginia Wind Observatory on Wheels), a trailer-mounted lidar system to measure spatial and temporal variations of lower tropospheric winds.  UWOW uses a HALO photonics StreamLine XR Doppler lidar, a GPS, and an inertial navigation system placed in a custom trailer to measure boundary layer winds while traveling on the road. UWOW can measure wind profiles from approximately 100 to 3000 m above ground with 30 m vertical spacing. During SWEX, UWOW travelled about 7000 km on roads around the Santa Ynez Mountains to document the spatial wind and aerosol variability during Sundowner Wind days and during undisturbed days. Data examples and comparisons with 1-km numerical simulations using the Weather Research and Forecasting (WRF) model will be discussed. 

How to cite: De Wekker, S., Desai, J., Duine, G.-J., and Carvalho, L.: Investigating the spatial structure of winds in complex terrain using a mobile wind lidar, EGU General Assembly 2025, Vienna, Austria, 27 Apr–2 May 2025, EGU25-13987, https://doi.org/10.5194/egusphere-egu25-13987, 2025.

EGU25-14115 | ECS | Posters on site | AS1.38

Assessing The Impact of Global Warming on Glacial Elevation of The Bolam Glacier  

Lily Welsh, Sarah Neuhaus, and Slawek Tulaczyk

Mount Shasta, a large stratovolcano in northern California, contains the southernmost glacial system in North America (41.3 degrees N, about the latitude of Rome). Due to its southern position, this glacial system is very vulnerable to climate warming. However, previous research indicated that this glacial system experienced significant growth during the second half of the twentieth century, mainly as a result of the so-called "snowgun effect" at high elevations, operating in the warmer, wetter winters of this ocean-influenced climate (Howat & Tulaczyk, 2005 & Howat et al., 2006). New results indicate recent, significant glacier collapse as a result of continued climate warming leading to increased ablation, which eventually overwhelms the effect of increased snow deposition at high elevations. The Hotlum, Bolam and Whitney glaciers reside on the North face of Mount Shasta while Konwakiton and Wintun reside on the South face. It is evident that glacial bodies have receded in this time period, but a more indepth inspection of the effects of climate change on the Bolam Glacier was deemed necessary. The glaciers within Mount Shasta provide a small percentage of water to the Shasta Reservoir. More notably, the glacial bodies provide water supply to support habitats for immense biodiversity in flora and fauna within the region, including endemic species. Changes in glacial terminus elevation of the Bolam Glacier were observed in the field and through aerial photography. Through topographic and photographic inspection, in field geolocated waypoint collection and analysis of field data, a retreat of nearly 1500 meters at the Bolam Glacier was observed between the years photographs of 1998 and of 2024, suggesting a significant impact on glacial bodies in the region due to changes in climate.

References

Ewert, J. W., Diefenbach, A. K., & Ramsey, D. W. (n.d.). Eruption History of Mount Shasta U.S. Geological Survey. USGS.gov. Retrieved January 6, 2025, from https://www.usgs.gov/volcanoes/mount-shasta

Geology and History of Mount Shasta U.S. Geological Survey. (2023, November 6). USGS.gov. Retrieved January 6, 2025, from https://www.usgs.gov/volcanoes/mount-shasta/science/geology-and-history-mount-shasta 

Howat, I. M., & Tulaczyk, S. (2005, December 8). Climate sensitivity of spring snowpack in the Sierra Nevada. Journal of Geophysical Research, 110.

Howat, I. M., Tulaczyk, S., Rhodes, P., Israel, K., & Snyder, M. (2006, August 18). A precipitation-dominated, mid-latitude glacier system: Mount Shasta, California. Climate Dynamics, 28, 85-98.

Howat, I. M., & Tulaczyk, S. (2005). Trends in spring snowpack over a half-century of climate warming in California, USA. Annals of Glaciology, 40, 151.

Lindsey, R., & Dahlman, L. (2024, January 18). Climate Change: Global Temperature NOAA Climate.gov. Climate.gov. Retrieved January 6, 2025, from

How to cite: Welsh, L., Neuhaus, S., and Tulaczyk, S.: Assessing The Impact of Global Warming on Glacial Elevation of The Bolam Glacier , EGU General Assembly 2025, Vienna, Austria, 27 Apr–2 May 2025, EGU25-14115, https://doi.org/10.5194/egusphere-egu25-14115, 2025.

EGU25-14227 | Orals | AS1.38

Karakoram Anomaly and its connection with the Western Disturbances 

Pankaj Kumar and Aaquib Javed

The global retreat of glaciers is a widely recognized indicator of climate change. However, the Karakoram region of the Himalayas defies this trend, exhibiting a unique phenomenon termed the “Karakoram Anomaly,” characterized by glacier stability or surges. This anomaly has been increasingly linked to the dynamics of western disturbances (WDs), upper-tropospheric synoptic systems propagating eastward along the subtropical westerly jet stream, critical drivers of winter precipitation in the region. This study synthesizes recent analyses of WDs using tracking algorithms applied to reanalysis datasets (ERA5, MERRA2, and NCEP-CFSR/CFSv2) to evaluate their role in sustaining the Karakoram Anomaly. While the frequency of WDs has remained relatively steady, a ∼10% increase in precipitation intensity associated with WDs over the anomaly core region has been observed in recent decades. The Karakoram receives approximately 65% of its total winter snowfall from WDs, emphasizing its pivotal role in modulating regional glacier mass balance. Concurrently, snowfall from non-WD sources has declined by ∼17%, further underscoring the significance of WDs. Changes in atmospheric dynamics, including enhanced baroclinic instability and a latitudinal shift in the subtropical westerly jet, have been identified as contributors to the increased intensity of WDs. Moreover, a statistically significant eastward shift (~9.7°E) in the genesis zone of WDs has been noted, resulting in enhanced cyclogenesis potential, higher moisture availability, and reduced propagation speeds. These factors collectively intensify WD-induced precipitation events over the Karakoram, supporting anomalous glacier behavior. This study highlights the critical influence of strengthening WDs on the Karakoram Anomaly, providing new insights into the interplay between atmospheric dynamics and regional glacier dynamics under climate change.


Keywords: Glaciers, Karakoram anomaly, Western Disturbances, TRACK

Acknowledgement: Funding from Science and Engineering Research Board (SERB), Govt. of India, grant number CRG/2021/00l227-G

How to cite: Kumar, P. and Javed, A.: Karakoram Anomaly and its connection with the Western Disturbances, EGU General Assembly 2025, Vienna, Austria, 27 Apr–2 May 2025, EGU25-14227, https://doi.org/10.5194/egusphere-egu25-14227, 2025.

EGU25-15922 | Posters on site | AS1.38

Observed hotspots of changing snow depth and snowfall in European mountain regions 

Dana-Magdalena Micu, Vlad-Alexandru Amihaesei, Gabriele Quinti, Kirsten Halsnæs, Shreya Some, Monica-Gabriela Paraschiv, Alexandru Dumitrescu, and Sorin Cheval

Mountain regions are particularly vulnerable to natural hazards, such as snow avalanches, landslides, or flash-flooding, which are increasingly exacerbated by climate warming and changing climate patterns. This paper leverages the Copernicus Regional ReAnalysis for Europe (CERRA) dataset, with 5 km x 5 km spatial resolution, from the Copernicus Climate Change Service (C3S), covering the period 1985–2020, to analyse the changing of the seasonal patterns of snow depth and snowfall in two major European mountain ranges: the Alps and the Carpathians. More specifically, the study aims to identify the mountain areas with persistent and statistically significant increases or declines in snowfall and snow depth, referred to as "hotspots". The focus of the study is on four key snow depth and snowfall-related indicators including (i) total snow depth, (ii) number of snow cover days, (iii) days with snow depth exceeding 30 cm, and (iv) snowfall water equivalent. The hotspots are identified based on local spatial auto-corelation methods (the Getis and Ord G statistic), using the estimated Mann-Kendall trends of the four snow indicators as inputs. A positive Gi value signifies that a feature and its surrounding neighbours exhibit high values, whereas a negative Gi value indicates low values in the feature and its neighbours. The magnitude of the Gi value reflects the intensity of the clustering. 
The results indicate widespread hotspots characterised by significant declines in both snow depth and snowfall indicators, in all seasons, especially at low and mid-elevations in both mountain regions. The observed shifts are particularly pronounced during winter (December-January-February) and spring (March-April-May). The location of identified hotspots carries multiple implications for the distribution and availability of water resources, ecosystem services, infrastructure and tourism activities, and so for the livelihood of mountain communities. These findings provide critical insights into the shifting snow avalanche hazard and their socio-economic impacts at NUTS3 level and in specific areas where historical snow avalanche events have significantly impacted three key socio-economic sectors—tourism, infrastructures, and forestry. They also could underscore the ongoing challenges in the mountain risk management under a changing climate.
This research received funds from the project “Cross-sectoral Framework for Socio-Economic Resilience to Climate Change and Extreme Events in Europe (CROSSEU)” funded by the European Union Horizon Europe Programme, under Grant agreement n° 101081377.

How to cite: Micu, D.-M., Amihaesei, V.-A., Quinti, G., Halsnæs, K., Some, S., Paraschiv, M.-G., Dumitrescu, A., and Cheval, S.: Observed hotspots of changing snow depth and snowfall in European mountain regions, EGU General Assembly 2025, Vienna, Austria, 27 Apr–2 May 2025, EGU25-15922, https://doi.org/10.5194/egusphere-egu25-15922, 2025.

EGU25-16079 | Posters on site | AS1.38

Campaign TEAMx: First results of wind observations compared to model simulations at three sites in the Inn Valley (Austria) 

Rebecca Gugerli, Maxime Hervo, Alexander Gohm, Daniel Leuenberger, and Alexander Haefele

In the framework of the campaign TEAMx, MeteoSwiss deployed a Doppler Wind Lidar (WL, Windcube-100S) in Radfeld, Austria. The WL provides high resolution wind speed and – direction measurements within the Inn Valley at several altitudes. These observations provide a reliable reference to investigate the performance of model wind estimates in alpine valleys. In this study, we use analyses data from the ICON NWP model computed with KENDA, a Km-scale ENsemble-based Data Assimilation system. These data from the KENDA-CH1 NWP system have a spatial resolution of 1.1x1.1 km and a temporal resolution of 1 hour. First results show a good model performance at Radfeld with an average root mean square vector difference (RMSVD) of 3.78 m/s during the period from 23 October 2024 to 16 December 2024.

Furthermore, the comparison between observations and model analyses is extended to the sites of Kolsass and Innsbruck, which are both located in the same valley (Inn Valley) and at both sites wind observations are obtained by a WL (Halo Photonics Systems). In addition, we analyse the observations from a WL permanently deployed in Payerne (Switzerland).

Our results show that the model has an average RMSVD lower than 3.8 m/s for all sites during the given time period. The only exception with a higher RMSVD occurs during the storm Caetano (19-23 November 2024). For Payerne, we find a RMSVD of 2.7 m/s, which is significantly better than for the other sites. This is explained by the assimilation of several observed atmospheric profiles (wind and temperature) in the model, which positively impacts the model analyses. Moreover, Payerne has a flatter topography. Overall, our results confirm a good performance of the simulated wind dynamics by the high resolution KENDA-CH1 NWP system.

How to cite: Gugerli, R., Hervo, M., Gohm, A., Leuenberger, D., and Haefele, A.: Campaign TEAMx: First results of wind observations compared to model simulations at three sites in the Inn Valley (Austria), EGU General Assembly 2025, Vienna, Austria, 27 Apr–2 May 2025, EGU25-16079, https://doi.org/10.5194/egusphere-egu25-16079, 2025.

EGU25-16132 | ECS | Orals | AS1.38

Understanding elevation-dependent warming in the Alps through high-resolution surface energy balance analysis 

Simon Zitzmann, Benjamin Fersch, and Harald Kunstmann

This study investigates elevation-dependent warming (EDW) in the Alps, focusing on Berchtesgaden National Park, Germany, to provide insights into the drivers of warming patterns and their spatial variability.
EDW refers to the variation in warming rates across altitude, often characterized by intensified warming trends at higher elevations. This phenomenon has significant implications for mountainous and downstream ecosystems and water resources. While multiple factors contributing to EDW have been discussed in the literature – such as snow-albedo feedbacks and the increased sensitivity of cold, dry regions to climate change – the roles of soil interactions and topography remain underexplored.

Our research uses high-resolution spatial data and long-term temperature records to uncover how topography, soil properties and surface energy dynamics contribute to EDW. We utilize data from HISTALP, a homogenized observational dataset for the Greater Alpine Region, to examine the relationship between warming trends and topographic factors. Within the national park, 23 long-term stations monitor meteorological variables. Additionally, three temporary stations spanning altitudes from 617 to 1930 m measure surface energy balance components to capture elevation-dependent and small-scale effects.

Preliminary findings indicate that EDW is influenced by factors beyond altitude. Historical data (1910–2010) reveal significant warming across altitudes in the Greater Alpine Region, with rates of 0.4–2.4 K per century. Higher elevations generally experience stronger warming, except in winter, when mid-elevation bands (500–1000 m) warm the most. Slope orientation significantly affects warming rates, with north-facing slopes showing amplified trends. Ongoing research aims to develop a statistical model incorporating topography, vegetation and soil properties to map warming trends across the Alps.
Ground heat flux analysis reveals spatial variations potentially influenced by soil depth and moisture retention at different altitudes. Integrating these observations with simulations from the GEOtop hydrological model will provide spatially detailed and novel insights into relevant land surface processes.

How to cite: Zitzmann, S., Fersch, B., and Kunstmann, H.: Understanding elevation-dependent warming in the Alps through high-resolution surface energy balance analysis, EGU General Assembly 2025, Vienna, Austria, 27 Apr–2 May 2025, EGU25-16132, https://doi.org/10.5194/egusphere-egu25-16132, 2025.

EGU25-16472 | ECS | Orals | AS1.38

Assessing the representation of flow separation in Foehn descent with high-resolution numerical simulations 

Julian Quimbayo-Duarte, Yue Tian, and Juerg Schmidli

Foehn winds are warm, dry, downslope winds that occur on the lee side of mountain ranges. They result when moist air is forced to ascend on the windward side, cooling and losing moisture as precipitation. As the now-drier air descends on the leeward side, it warms adiabatically, leading to distinct temperature and humidity profiles. In the Alps, the descent of foehn winds is often confined to distinct hotspots where the interplay between complex topography, mountain-induced gravity waves, and flow separation processes focuses the descending air. These hotspots are associated with localized warming and drying, which can significantly influence weather conditions, predictability, and their impact on ecosystems and human activities in the affected regions. Previous studies, utilizing the COSMO model, a numerical weather prediction (NWP) model at 1 km resolution, visualized these hotspots and established their connection to mountain-induced gravity wave. However, the adequacy of a 1 km resolution in accurately capturing flow separation at the mountain surface—a key feature influencing foehn dynamics and predictability—remains an open question.

To address this question, we conducted high-resolution simulations for two case studies: one in the Rhine Valley from February 2017 and another in Meiringen, Switzerland, from March 2022. Simulations were performed using the ICON model in NWP mode at a horizontal resolution of 1.1 km and ICON-LES at resolutions of 520 m, 260 m, and 130 m. For the Meiringen case, we validated our model setup using wind and temperature profiles obtained from the Meiringen Campaign (2021–2022). Meanwhile, the Rhine Valley case, previously analyzed at a resolution of 1 km, was revisited to assess whether higher resolutions provide an improved representation of flow separation dynamics. Additionally, we employ offline trajectories to precisely track the descent locations of the foehn air parcels, providing a detailed assessment of how model resolution influences the spatial distribution of descent hotspots in the Swiss Alps.

Our study is the first to combine trajectory analysis with LES simulations in foehn research, enabling a detailed visualization of foehn trajectories. The ultimate goal of this study is to provide guidance on selecting appropriate model resolutions to enhance the accuracy of research on foehn winds and their associated effects.

How to cite: Quimbayo-Duarte, J., Tian, Y., and Schmidli, J.: Assessing the representation of flow separation in Foehn descent with high-resolution numerical simulations, EGU General Assembly 2025, Vienna, Austria, 27 Apr–2 May 2025, EGU25-16472, https://doi.org/10.5194/egusphere-egu25-16472, 2025.

EGU25-16725 | Posters on site | AS1.38

Steps for the identification of Elevation Dependent Warming in the Pyrenees 

Pere Esteban Vea, Marc Prohom Duran, and Jordi Cunillera Grañó

In recent decades, several research efforts have been made to quantify climate change in the Pyrenees, mainly focusing on temperature and precipitation trends since the 1950s. However, as in many mountain regions around the world, the lack of data at the highest elevations makes it difficult to draw solid conclusions about the varying warming rates at different altitudes.

As part of the LIFE-SIP project "Pyrenees4Clima" (2024-2032) various tasks for the detection and analysis of Elevation-Dependent Warming (EDW) have been planned. First, as much climate series as possible above 1,500 meters is being compiled, with trend analysis, quality control, and homogenization (if needed) being carried out. Additionally, temperature and relative humidity sensors will be installed during the summer of 2025 to create or enhance four pilot areas in Spain (Catalonia and Aragón), France, and Andorra for a detailed analysis of EDW and circulation patterns. To support this readings, a complete automatic weather station has been installed in one of the pilote areas (in the Catalan Pyrenees and 1,700 m). By incorporating snow measurements from existing automatic weather stations, the influence of the presence or absence of snow on warming will also be explored.

This presentation aims to show EGU 2025 participants our objectives, intentions, and results to date, learn about other EDW case studies, and share experiences and recommendations during this initial phase of our project.

How to cite: Esteban Vea, P., Prohom Duran, M., and Cunillera Grañó, J.: Steps for the identification of Elevation Dependent Warming in the Pyrenees, EGU General Assembly 2025, Vienna, Austria, 27 Apr–2 May 2025, EGU25-16725, https://doi.org/10.5194/egusphere-egu25-16725, 2025.

EGU25-16963 | ECS | Posters on site | AS1.38

Insight into subsurface - quantification of alpine heat waves and their impact on high mountain permafrost 

Tomasz Gluzinski, Christian Hauck, Christin Hilbich, Coline Mollaret, and Cécile Pellet

In recent years the changing state of the cryosphere has been one of the most visually striking effects of climate change in mountainous terrains, gathering increased attention of not only the scientific community but the general public. Ice loss in the subsurface, caused by a warming ground thermal regime, is not directly visible such as retreating glaciers or annual snow cover changes, but it can have major impacts on ground stability.
Heat waves may contribute twofold to cryospheric changes: (1) as contributors to the general warming trend and (2) by (potentially) irreversibly changing the ground ice content through excessive amounts of heat penetrating the ground during such an event. Here, we focus on the second aspect and its impact on mountain permafrost. Although climatological research provides several tools for heat wave analysis, the application of (often regional) studies to the sparsely available borehole data and discrete meteorological monitoring networks are rare.
We employ the Heat Wave Magnitude Index daily (HWMId) metric to analyse temperature data from several Swiss Permafrost Monitoring Network (PERMOS) and MeteoSwiss stations near well-studied permafrost monitoring sites in the Alps. Historical and reconstructed data are used to determine specific temperature thresholds per site, accounting for local conditions (such as geomorphology, geology or ice content) therefore a systematic heat wave definition can be applied uniformly across all locations.
HWMId is compared to the changes in ground moisture content and observed changes in the permafrost body derived from borehole data. In addition, ice content is independently estimated from time series of 2-dimensional geophysical data, namely seismic refraction tomography and electrical resistivity tomography jointly inverted by petrophysical joint inversion. Initial results from the analysis of decade-long time series show correspondence between ground resistivity decrease with a general increasing trend in heat wave occurrences and intensity. Moreover heat waves precondition the permafrost for further thawing in subsequent years. Resilience of permafrost to the heat wave events in different landforms brings important implications for slope stability and safety of communities and infrastructure in mountainous regions.

How to cite: Gluzinski, T., Hauck, C., Hilbich, C., Mollaret, C., and Pellet, C.: Insight into subsurface - quantification of alpine heat waves and their impact on high mountain permafrost, EGU General Assembly 2025, Vienna, Austria, 27 Apr–2 May 2025, EGU25-16963, https://doi.org/10.5194/egusphere-egu25-16963, 2025.

EGU25-17153 | Posters on site | AS1.38

Refining valley wind days detection from in situ observations and ERA5 reanalysis 

Sebastiano Carpentari, Mira Shivani Sankar, Nadia Vendrame, Dino Zardi, and Lorenzo Giovannini

Numerous studies proposed algorithms to identify days with well-developed valley wind circulations, commonly applying thresholds based on measurements from surface weather stations and/or reanalysis datasets. In the present study, the method suggested by Lehner et al. (2019) was selected as a starting point to detect valley wind days in the Alpine Adige Valley (Italy),  based on a year-long dataset collected at an eddy covariance flux station. The method employs three fixed thresholds: two on geopotential height gradients at 700 hPa in the North-South and West-East directions (synoptic forcing), and one on longwave radiation (Clear Sky Index, local forcing), following Marty and Philipona (2000). 

To refine the procedure, in this study four geopotential pressure levels were considered, using the ERA5 reanalysis dataset covering the period 1991-2020. Additionally, the daily threshold was assessed using a n-day moving window centered on the target day. The Clear Sky Index was calculated, choosing the most suitable emissivity parameterization for the Adige Valley. Furthermore, objective adjustments to the Clear Sky Index reference limit were made. Finally, the method was tested with data from other eddy-covariance stations to verify its performance in different contexts and generalize the results.

How to cite: Carpentari, S., Shivani Sankar, M., Vendrame, N., Zardi, D., and Giovannini, L.: Refining valley wind days detection from in situ observations and ERA5 reanalysis, EGU General Assembly 2025, Vienna, Austria, 27 Apr–2 May 2025, EGU25-17153, https://doi.org/10.5194/egusphere-egu25-17153, 2025.

EGU25-20147 | Orals | AS1.38

On the structure of the atmospheric boundary layer over highly complex terrain 

Juerg Schmidli and Bruno Neininger

The atmospheric boundary layer (ABL) over mountainous regions plays a crucial role in exchange processes between the surface and the free atmosphere, influencing weather, climate, and air quality. Unlike the relatively uniform ABL over flat terrain, the structure of the mountain boundary layer (MoBL) is highly complex due to the wide spectrum of scales of motion induced by the multi-scale orography. These scales range from small-scale turbulence and coherent structures to slope and valley winds, encompassing both thermally and dynamically forced flows. This intricate interplay of processes creates a highly heterogeneous and variable boundary layer that challenges traditional modeling approaches and necessitates detailed investigation. This study aims to enhance understanding of the convective boundary layer (CBL) over highly complex terrain by addressing the following questions: What are the characteristics of the coherent structures (e.g., thermals) in the CBL and how stationary are they? What is their diurnal cycle, and how do their statistics, such as preferred locations, vary from day to day?

To answer these questions, we utilize the ICON model to perform large-domain, real-world large-eddy simulations (LES) at a resolution of 65 m, incorporating 1.5 million grid points. The simulations employ a nesting strategy with four domains at resolutions of 520 m, 260 m, 130 m, and 65 m, progressively refining the model to capture fine-scale dynamics. Conducted over the Swiss Alps for seven days in August 2022, the simulations reveal a highly heterogeneous boundary layer with preferred locations for thermal formation. These locations exhibit a rather consistent diurnal cycle and remarkably small day-to-day variability, despite changing large-scale forcings. Comparisons with Alptherm, a Lagrangian model designed for forecasting gliding conditions, provide additional context. Insights from this study advance our understanding of the mountain ABL and support improvements in mesoscale and forecasting models for complex terrain.

How to cite: Schmidli, J. and Neininger, B.: On the structure of the atmospheric boundary layer over highly complex terrain, EGU General Assembly 2025, Vienna, Austria, 27 Apr–2 May 2025, EGU25-20147, https://doi.org/10.5194/egusphere-egu25-20147, 2025.

Collaboration on Capacity Development in Climate Change Impacts and Adaptation in Africa could provide a beneficial engagement between Europe and Africa. Knowledge exchange could facilitate the transfer of knowledge, technology, and expertise in climate change impact assessment and adaptation strategies while capacity Building will strengthen local skills and institutional frameworks in Africa to address climate-related challenges effectively. A joint research and innovation initiative between Europe and Africa can promote collaborative research projects focused on sustainable solutions tailored to African contexts. Finally, policy alignment between the two regions will align efforts with global frameworks such as the Paris Agreement and Agenda 2063. This paper  outlines the key objectives of such a collaboration and key focus areas for strengthening the collaboration and concludes with the implementation steps that will be required.

How to cite: Sa’id S., R.: Outlook for an European-African Collaboration for Climate Change and Adaptation Strategies , EGU General Assembly 2025, Vienna, Austria, 27 Apr–2 May 2025, EGU25-196, https://doi.org/10.5194/egusphere-egu25-196, 2025.

EGU25-3023 | Posters on site | EOS2.6

Climate change and water resources capacity development in Africa under the SASSCAL and WASCAL doctoral programmes 

Luna Bharati, Renee van Dongen-Köster, Julien Adounkpé, Layla Hashweh, and Omotayo Awofolu

The West- and Southern African Science Service Centers on Climate Change and Adapted Land Use (WASCAL and SASSCAL) have been established as part of the internationalization strategy of the German Federal Ministry of Education and Research (BMBF).

Both Science Service Centers have a regional focus and work with several member countries (WASCAL: 12 member countries, SASSCAL: 6 member countries). The International Centre for Water Resources and Global Change in Koblenz, Germany, is the partner institution of the SASSCAL PhD Programme on Integrated Water Resources Management hosted at the Namibia University of Science and Technology (NUST) and of the WASCAL PhD Programme on Climate Change and Water Resources hosted at the University of Abomey-Calavi in the Republic of Benin.

This presentation will showcase the relevance and the structure of these programmes and the process of establishing an impactful North-South partnership. Furthermore, both highlights and challenges will be discussed.  

How to cite: Bharati, L., van Dongen-Köster, R., Adounkpé, J., Hashweh, L., and Awofolu, O.: Climate change and water resources capacity development in Africa under the SASSCAL and WASCAL doctoral programmes, EGU General Assembly 2025, Vienna, Austria, 27 Apr–2 May 2025, EGU25-3023, https://doi.org/10.5194/egusphere-egu25-3023, 2025.

EGU25-6388 | Posters on site | EOS2.6

The UNESCO IHP FRIEND-Water programme: a global network for hydroclimatic change research and education  

Andrew Ogilvie, Bastien Dieppois, Ernest Amoussou, Oula Amrouni, Jane Tanner, Adeyemi Olusola, David Gwapedza, and Augustina Alexander

The Flow Regimes from International Experimental and Network Data (FRIEND-Water) is the oldest UNESCO Flagship Initiative within the Intergovernmental Hydrological Programme (IHP).  Active since 1985, it seeks to facilitate, promote and foster collaborations across borders between scientists (hydrologists and related disciplines) to conduct studies on shared river basins. The programme has evolved over time to focus on four key themes relating to (i) data collection and sharing, (ii) the impacts of global change on hydrological regimes and extremes, (iii) water-society interactions and equitable water management and (iv) interdisciplinary educational resources and programmes. Involving researchers from over 150 countries, FRIEND-Water is currently structured into six regional groups around the world of which four focus on Europe-African collaboration: Europe, the Mediterranean, West and Central Africa, Southern and Eastern Africa.  Collaborations include joint research activities, joint supervision of young researchers (PhD and postdoc), exchange visits and scientific events. In partnership with initiatives such as CEH Robin, WMO HydroSOS, IHP-WINS and GRDC, activities notably focus on increasing the collection and sharing of hydroclimatic data across FRIEND-Water regions. Hydrometry training, data rescue, and ongoing collection of hydrological data from ground observation networks are actively supported. Researchers explore large-scale climate and hydrological regime trends as well as the local impacts of future climate projections from CMIP5/CMIP6 models. Hydrological modelling helps forecast the amplitude and frequency of extreme events (floods, agricultural droughts and compound extremes) and support disaster risk reduction and early warning systems.  Working on urban and rural areas, research also seeks to define adequate hydrological norms (accounting for climate non-stationarity) and guide the design of water infrastructure, as well as water management and allocation policies. Activities over the past decade have notably led to the joint EU-African organization of over 30 workshops and trainings on topics including early warning systems, hydrological modelling, hydrometry, as well as four conferences on the Hydrology of African Large River basins. Going into UNESCO IHP-IX, the FRIEND-Water programme has been restructured and is now actively supported by the UNESCO Category II Centre ICIREWARD in Montpellier, leading to increased academic collaboration and capacity building opportunities between Europe and Africa.

How to cite: Ogilvie, A., Dieppois, B., Amoussou, E., Amrouni, O., Tanner, J., Olusola, A., Gwapedza, D., and Alexander, A.: The UNESCO IHP FRIEND-Water programme: a global network for hydroclimatic change research and education , EGU General Assembly 2025, Vienna, Austria, 27 Apr–2 May 2025, EGU25-6388, https://doi.org/10.5194/egusphere-egu25-6388, 2025.

EGU25-9543 | Orals | EOS2.6

Capacity Development to support transformation and contribute to achieving SDG6 

Micha Werner, Gaetano Casale, Ioana Popescu, and Jeltsje Kemerink

SDG6 is alarmingly off-track, as highlighted in the recent status report on the Sustainable Development Goals (SDGs) published by UN-Water. It has been recognised at high political level that Capacity Development is one of the main factors that will produce an “acceleration” in achieving SDG6. However, a deeper understanding is lacking on what is needed to have more impactful capacity development programmes particularly in relation to developing the capacity of national government and related institutions, in developing countries. These institutions support real and substantial changes across scales, and strengthening their capacity will contribute to address both existing and emerging issues in a rapidly changing world requiring quick adaptation of capacities in institutions.

The main objective of this contribution is to provide examples of instruments that are currently being developed to support organisations, especially in low and middle-income countries, to develop capacities to accelerate implementation of water related SDGs. In particular, to offer up to date instruments to deliver capacity development products and services to carry out institutional changes that will deliver ultimately impact to SDG6 achievement.

These examples include, but are not limited to, the SDG6 capacity development initiative (UNESCO, UN-DESA, UN-Water, IHE Delft), the Global Water Education Network (UNESCO, IHE Delft, Cap-Net and SIWI), and the Water and Development Partnership Programme (IHE Delft with a broad number of low and middle-income countries and in particular African partners), which are three of the main voluntary commitments related to Capacity Development within the Water Action Agenda resulting from the UN 2023 Water Conference.

The contribution will present ongoing activities in support of capacity development taking place within UN political processes, and beyond, with a special emphasis on Africa. In this contribution we will take a deeper look at typical capacity development challenges, illustrated by selected examples.

Identified challenges address the following questions:

  • What factors create impact in capacity development efforts to accelerate progress towards achieving SDG6?
  • What capacity development activities have the greatest impact?
  • What kind of learning alliances and partnerships, e.g., south-south collaboration, can catalyse capacity development interventions at regional, country level and local levels?
  • What are the investment gaps and opportunities in catering to the capacity development needs in low and middle-income countries?

The outcome of the contribution could be used to contribute to the capacity development accelerator of the SDG6 Global Acceleration Framework to support the SDG6 Capacity Development Initiative and other complementary initiatives like the Global Water Education Network.

How to cite: Werner, M., Casale, G., Popescu, I., and Kemerink, J.: Capacity Development to support transformation and contribute to achieving SDG6, EGU General Assembly 2025, Vienna, Austria, 27 Apr–2 May 2025, EGU25-9543, https://doi.org/10.5194/egusphere-egu25-9543, 2025.

EGU25-12524 | Posters on site | EOS2.6

European Academic Network for Capacity Development in Climate Change Adaptations in Africa 

Insa Otte, Lilly Schell, Michael Thiel, and Daouda Koné

The NetCDA project takes a long-term approach to strengthening and better networking academic education on climate change adaptation strategies in Africa. A sustainable implementation of this project will be achieved in three steps: (i) In the short term, PhD students of graduate schools of the West African Science Service Centre on Climate Change and Adapted Land Use (WASCAL) will be supported and co-supervised. (ii) In the medium term, the German network of WASCAL graduate schools will be strengthened and (iii) in the long term, an academic network will be initiated that brings together climate change researchers from Europe and Africa who are active in education. The first year of project implementation has successfully past, thus the current status and taken steps as well as the further ideas will be presented. Important for the future success of the project will specifically be, to find the right measures to move from a West Africa focused approach to a more general approach to cover the whole continent.

How to cite: Otte, I., Schell, L., Thiel, M., and Koné, D.: European Academic Network for Capacity Development in Climate Change Adaptations in Africa, EGU General Assembly 2025, Vienna, Austria, 27 Apr–2 May 2025, EGU25-12524, https://doi.org/10.5194/egusphere-egu25-12524, 2025.

EGU25-13012 | Posters on site | EOS2.6

Developing a reproducible and scalable climate atlas for Ghana through strategic cooperation between Danish Meteorological Institute and Ghana Meteorological Agency 

Shingirai Nangombe, Julie Stensballe, Mark Payne, Francisca Martey, David Quaye, Hayford Asuako, David Tetteh, Joana Amavih2, Peter-William Abbey, Christiana Aggrey, Etornam Kpodo, Adwoa Gyasi, Quarshie Wordu, Stanley Annan, Kim Sarup, Harrison Ofori, and Christian Johansen


Ghana’s vulnerability to climate change is amplified by lack of capacity among different agencies to undertake and coordinate adaptive measures informed by an effective climate services provision. Climate services provide tailored information to support climate adaptation at the local level. One common form of climate service is the provision of downscaled climate projections, bias adjusted using local observations and tailor-made to meet local society needs based on extensive stakeholder engagement. A well-established example of such services already exist in Denmark’s Danish Meteorological Institute (DMI) through the Danish Climate Atlas. Therefore, through a Danish governmant funded Strategic Sector Cooperation, DMI is part of a project with Ghana Meteorological Agency (GMet) which is strengthening authoritative and relevant climate services provision in Ghana through the increased use of climate information and meteorological data in climate change adaptation and climate risk management. This is being done through DMI collaborating with GMet in the development of a National Climate Atlas projecting climate change at regional level in Ghana for three different greenhouse gas emission scenarios. In the heart of this collaboraton is capacity building carried out via the principle of co-defining, co-development and co-producing the atlas by DMI and GMet researchers working with local stakeholders. Recognising the potential to learn from each other and to enable the development and replication of climate services in new regions, DMI developed KAPy (Klimaatlases in Python). KAPy is a tool that builds on software framework centered on the Python programing language, utilizing the extensive tools already established in the programming community. KAPy’s use of workflow control tools enables reproducibility and scalability, while its open-source approach drives both effective collaboration and transparency. Here, we illustate the capability of how this tool is central in producing climate service information in Ghana, including an extensive analysis of the efforts required to produce climate-service ready indicators starting from scratch. How internet bandwidth limitations can be avoided by using KAPy is also shown, thus increasing the productivity and enabling implementation in resource limited situations, such as those in Africa. We conclude by highlighting that KAPy contributes to making climate services provision more transparent and enables DMI to utilize it in other African countries to strengthen their climate services provision.

How to cite: Nangombe, S., Stensballe, J., Payne, M., Martey, F., Quaye, D., Asuako, H., Tetteh, D., Amavih2, J., Abbey, P.-W., Aggrey, C., Kpodo, E., Gyasi, A., Wordu, Q., Annan, S., Sarup, K., Ofori, H., and Johansen, C.: Developing a reproducible and scalable climate atlas for Ghana through strategic cooperation between Danish Meteorological Institute and Ghana Meteorological Agency, EGU General Assembly 2025, Vienna, Austria, 27 Apr–2 May 2025, EGU25-13012, https://doi.org/10.5194/egusphere-egu25-13012, 2025.

EGU25-13184 | Orals | EOS2.6

The fusion of agricultural sciences and geoinformatics in teaching in Northwestern Africa 

Ralf Löwner and Faiza Khebour Allouche

Landscape management, agricultural sciences and geoinformatics are inseparable nowadays, and this should also be reflected in teaching.  For example, green areas provide an important biodiversity, are positively associated with mental well-being and play a critical role in mitigating the impacts of climate change by absorbing carbon dioxide, reducing heat islands in urban areas, and providing shade and cooling. However, climate change is also affecting green areas.

On the other hand, geoinformatics offers powerful tools for assessing, monitoring and sustainable planning for all types of landscapes such as urban, rural and natural areas, and deserts. It relates to all data with a spatial reference with the focus on data acquisition, management, analysis, visualization and dissemination. Geographic information systems and remote sensing (aerial photography, satellite and radar images) play a major role for the use of geoinformatics in the geosciences, such as geography, geology, agricultural sciences, and ecology.

Prior to this, the Tunisian GEOMAG project was able to identify a lack of education in geomatics in the center of Tunisia, the Sahel region, which includes the governorates of Sousse, Mahdia, Monastir and Kairouan. This project included in particular an evaluation phase consisting of a self-assessment of 11 Tunisian universities (i.e. 51 “institutional” components) and a national survey of 66 public or private companies active in the geomatics sector.

To address this proven problem, an intensive exchange has been taking place between the Institut supèrieur agronomique de Chott Mariem (ISA CM ) in Tunisia and the Neubrandenburg University of Applied Sciences (HSNB). So far, the Tunisian students have attended the HSNB's Master's program “Geomatics” with a focus on spatial data analysis, landscape and risk management and remote sensing. The curricula are strongly oriented towards the use of Free and Open Source Software (FOSS), open data and open standards. Thanks to the high degree of interdisciplinarity, graduates are offered excellent and exciting career opportunities.

The exchange is guaranteed by a contract between the two universities and is supported by the Erasmus program of the European Union. Various theses have been successfully completed to date. The main objectives of these efforts are:

  • Promoting an interdisciplinary education that brings together the perspectives and skills of different disciplines;
  • Integrating geospatial information technologies into land use planning;
  • Fostering innovation and research and encouraging students to explore new approaches;
  • Promote international cooperation between universities and organizations, including opportunities for students to study and work with colleagues from different countries.

These objectives reflect the European Commission's priorities for interdisciplinary training, the integration of geoinformation technologies, innovation and research, and international cooperation in the field of territorial planning, agricultural sciences and in the European Green Deal strategy. In the future, these activities are to be expanded and a double Master's degree is to be targeted.

The existing and planned activities in the field of higher education can be seen as a pilot project that can be extended to countries such as Morocco, with which there is also very close cooperation, or even beyond.

How to cite: Löwner, R. and Khebour Allouche, F.: The fusion of agricultural sciences and geoinformatics in teaching in Northwestern Africa, EGU General Assembly 2025, Vienna, Austria, 27 Apr–2 May 2025, EGU25-13184, https://doi.org/10.5194/egusphere-egu25-13184, 2025.

The evidence base on the current status of biodiversity and the interlinked features of the ecosystem that define ecosystem integrity in the Democratic Republic of the Congo (DRC) is inadequate. Even less information exists on how the ecosystem responds to the changing climate and other pressures. That evidence deficit is particularly large for the aquatic ecosystems of the DRC, which are often exploited as a protein source for local communities. These shortcomings can be addressed through environmental monitoring and assessment (EMA). Established methods and promising developments (e.g. remote sensing, genomics and citizen science) can be used to build an evidence base that enjoys legitimacy as a basis for governance in the eyes of a broad range of stakeholders. To do so requires national capacity to perform EMA and utilize the results in governance. A new capacity building project “Improving biodiversity governance and sustainable livelihoods with capacities for Environmental Monitoring and Assessment In Democratic Republic of Congo” aims to assist the DRC in achieving its Agenda 2030 ambitions to support sustainable livelihood activities that preserve the integrity and functionality of ecosystems and biodiversity amid climate changes. This initially employs environmental monitoring and assessment (EMA) to build the scientific evidence base encompassing biodiversity, ecosystem integrity, and social and economic dynamics crucial for ensuring continued ecosystem functionality while improving human welfare. Governance must then leverage the EMA evidence base to support national institutions with policy implementation and international commitments. To enhance the prospects for success, the emphasis of this project will be on supporting nature based solutions. The two-year inception phase of the project has three objectives that target specific outputs and long-term outcomes (Table 1):

  • Evidence: Create a socio-ecological evidence base on biodiversity in the Lake Tumba Landscape of Equateur Province to support local governance of freshwater and marine resources in the face of climate change and resource exploitation.
  • Capacities: Plan for establishing national EMA capacity with appropriate educational programs.
  • Coordination: Explore the possibilities for sharing EMA evidence and using it meet local, regional and international needs for evidence- based governance of aquatic ecosystems.

The project is currently in a two-year inception phase in cooperation with the Mabali Research Station managed by the Centre de Recherche en Ecologie et Foresterie (CREF). The collection of biodiversity data to support the strategic plan of the research station will be developed and implemented in consultation with local and regional stakeholders.

How to cite: Bishop, K., Bila-Isia, I., Powell, N., and Ewango, C.: Improving biodiversity governance and sustainable livelihoods with capacities for Environmental Monitoring and Assessment In Democratic Republic of Congo , EGU General Assembly 2025, Vienna, Austria, 27 Apr–2 May 2025, EGU25-13246, https://doi.org/10.5194/egusphere-egu25-13246, 2025.

While it is generally well understood that climate change poses significant risks to economic stability and well-being, the gendered dimensions of its effects is still a nuanced area of research, especially in developing regions. Considering research within the African context, for example, women's businesses make wide-ranging contributions to family welfare, key value chains, and the provision of goods and services that support adaptation to climate change, yet they face a "triple differential vulnerability" due to heightened exposure to climate risks, frontline management of these risks, and barriers such as limited access to land and finance.

Noting these differential impacts, improved access to and use of credible climate information can be crucial for adaptation and disaster risk reduction efforts. However, it is imperative to better understand if and to what extent there may be differences in gender dynamics in climate information awareness and uptake. This study explores this knowledge gap through an analysis of 200 survey responses as well as follow-up semi-structured interviews by women and men entrepreneurs in South Africa (conducted November 2024-February 2025). We focus on understanding how climate events have affected businesses, the extent of climate information use to navigate adaptation and business decision-making, as well as barrier and enabling factors that may shape gender differences in the ability to interpret and use climate information. Such findings can underscore potential gendered differences in the understanding of and subsequent demand for climate information, which can in turn assist in closing knowledge gaps on gender equity in the access to and use of climate services. This study also includes a review of the status of gender mainstreaming in climate information production and dissemination, and, through collaborations with other regional partners and research projects, aims to scale findings to produce tailored insights for climate service designers across eastern and southern Africa towards the encouragement of broad capacity development and strengthening.

How to cite: Dookie, D. S. and Vincent, K.: Understanding gender dimensions in climate information awareness and uptake by entrepreneurs in South Africa, EGU General Assembly 2025, Vienna, Austria, 27 Apr–2 May 2025, EGU25-13908, https://doi.org/10.5194/egusphere-egu25-13908, 2025.

The West African Science Service Center on Climate Change and adapted Land Use (WASCAL) is an Intergovernmental Institution established since 2012 to support the capacity development of youth in Climate Change for the West African countries members through the support of the German Federal Minister of education and research (BMBF). Through the German cooperation and main financial with West African countries contribution in 2012, four Master and six PhD relevant programs were established respectively in Climate change & Land use (FUTMINNA, Nigeria), Climate Change & Human Security (UL, Togo), Climate Change & Education (UTG, The Gambia), Climate Change & Energy (UAM Niger) and Climate Change & Water Resources (UAC, Benin), Climate Change Economics (UCAD, Dakar, Senegal), Climate Change & Land Use (KNUST, Ghana), West African Climate System (FUTA, Nigeria), Climate change & Biodiversity (UFHB, Côte d’Ivoire), Climate Change & Agriculture (IPR/IFRA, Mali). The outcome was the transformation of 252 students as climate experts for West Africa. After successful implementation of the curriculum, the above master’s programs were upgraded in PhD to implement the 4th batch with the six other PhD Programs. The Master of Climate Change and Human Security was replaced by a PhD program in Disaster Risk Management and the master in Climate Change and Land use was replace by the PhD in Climate Change & Human Habitat. The fourth batch was implemented with 10 PhD program and two new Master program established in climate Change & Marines Science (UTA of Mindelo, Cabo Verde and Informatica and Climate Change (UJKZ, Burkina Faso). The fifth is currently running with the 11 countries across 12 Universities described above. Then the sixth batch recruitment will be effective with the new Program established in Guinea on Climate Change, Mining Environment and Forestry (UGAN, Conakry, Guinea). The graduation of more than 430 PhD and master’s holders working mainly in high education, research and international institution is a positive response to climate change. In line with its mission to improve the livelihood of communities, WASCAL with the support of BMBF has established master’s programs in four countries in Energy and green hydrogen to support African countries to foster the use of clean energy and contribute to reduce carbon footprint for a better energy transition. In addition to the climate experts, 59 master holders have been graduated through 6 relevant curricula in the followings tracks: Photovoltaic & System Analysis and Green Hydrogen in Niger, Biofuels, Bioenergy and Green Hydrogen in Togo, Economy, Infrastructure and Green Hydrogen Production in Senegal and Technology of green Hydrogen production, Georesources & green hydrogen Production. More than 700 publications, 150 policy brief and other relevant deliverables such as books chapter were produced. The collaboration was done with more than 35 lecturers, supervisors as well as several institutions across Germany and elsewhere. WASCAL and its partners from Germany are working to develop technologies and conduct activities that can support Africa countries resilience for better livelihood of communities.  


How to cite: Koné, D.: Training of Climate and Energy experts for West Africa to support West Africa communities’ resilience though the West African Science Service Center on Climate Change and Adapted Land Use, EGU General Assembly 2025, Vienna, Austria, 27 Apr–2 May 2025, EGU25-13951, https://doi.org/10.5194/egusphere-egu25-13951, 2025.

EGU25-15575 | Posters on site | EOS2.6

 Enhancing capacities in the field of agrometeorology: developing climatological crop calendars.   

Enric Aguilar, Kosi Tchaa Agniga, Anna Boqué, Caterina Cimolai, and Jon Olano

ccording to Food and Agriculture Organization for the United Nations (FAO), over 735 million people faced hunger in 2022. Less developed countries, where subsistence agriculture is a major livelihood, suffer disproportionately the effects of food insecurity. Weather, climate variability and climate change alter in time and space the phenological stages of crops and, therefore, agricultural planning and production. Climatological crop calendars for rainfed agriculture can be generated in the intertropical areas using time series of daily accumulated rainfall. They convey actionable information about the start and the end of the rainy season and, coupled with information on the crop's growing cycle length, allow to produce estimations for early, normal and late planting periods for different crops.  

In cooperation with the World Meteorological Organization and the project Climate Risk and Early Warning Systems Initiative (CREWS) in West Africa, the C3/IU-RESCAT/URV has developed a series of tools to support the generation of climatological crop calendars. We adopted a "from data to service" approach, guiding five National Meteorological and Hydrological Services in the region (in alphabetical order, Burkina Faso, Chad, Mali, Niger and Togo) from the quality control of the raw rainfall time series to the generation of the crop calendar. The cooperation started with a first workshop in Ouagadougou (Burkina Faso, 2019), continued on-line through the COVID-19 pandemia and has gained momentum in since 2024 after a workshop on Lomé (Togo). The cooperation includes easy to use software applications, short scientific missions, and a dedicated Moodle site to facilitate training and self-training events and a guidelines document.  

In this contribution, we walk through the software tools created and the contents of the moodle site, as well as examples of crop calendars for the different agroclimatic zones in West Africa and their practical application.  

How to cite: Aguilar, E., Agniga, K. T., Boqué, A., Cimolai, C., and Olano, J.:  Enhancing capacities in the field of agrometeorology: developing climatological crop calendars.  , EGU General Assembly 2025, Vienna, Austria, 27 Apr–2 May 2025, EGU25-15575, https://doi.org/10.5194/egusphere-egu25-15575, 2025.

Finding practical, workable and cost-efficient solutions to the problems posed by climate change is a global priority. Most developing countries still fail to adapt to the impacts of climate variability and change and adequately transform their potential to implement and increase their climate protection ambitions. This often is a result of a lack of human and institutional skills and know-how to integrate ambitious climate change adaptation strategies and policy into comprehensive development planning. Overcoming capacity constraints is a core challenge in developing countries. The more capacity countries have, the better they are equipped to face climate change and build resilience.

The Research and Transfer Centre “Sustainable Development and Climate Change Management (FTZ NK)” has a several decades experience in supporting fundamental and applied research on climate issues and contributing to knowledge and technology transfer at the national and international levels. Among the Centre’s projects and initiatives that contribute to capacity development in climate change impacts and adaptation in Africa are:

The International Climate Change Information and Research Programme (ICCIRP) that has been created to address the problems inherent to the communication of climate change and to undertake a set of information, communication, education and awareness-raising initiatives which will allow it to be better understood.

World PhD Students Climate Change Network that has been created to support doctoral students in providing a platform for their interaction, collaboration, exchange with other interdisciplinary groups, international PhD students and experts from outside of their organizations

Project “Green Garden/Jardins adaptés au climat (Towards Climate Resilient Farming/Des jardins partagés et d'adaptation aux changements climatiques)”, jointly funded by the Government of Canada’s New Frontiers in Research Fund (NFRF) and by the Deutsche Forschungsgemienschaft (DFG) brings together 200 vulnerable farmers from seven enterprises in Benin, Morocco, and Canada and 20 researchers representing an interdisciplinary consortium of academic partners from Canada, Germany, Morocco, and Benin to support the design and adoption of successful climate change adaptation practices in agriculture and agroforestry in collaboration with vulnerable groups.

Project “RECC-LUM (Feasibility Study on Climate Change, Land Use Management, and Renewable Energy in The Gambia)” funded by BMBF and supported by The Gambia Ministry of Higher Education, Research, Science, and Technology (MoHERST) focuses on sustainable land management practices within the Gambian agricultural landscape and the role played by using renewable energy in the process.  it will also develop a curriculum of Master of Science (MSc) program focused on renewable energy, climate change, and land use management for The University of The Gambia (UTG).

How to cite: Kovaleva, M. and Wolf, F.: Experience of the Research and Transfer Centre “Sustainable Development and Climate Change Management (FTZ NK)” at HAW Hamburg in supporting European-African collaboration on climate change adaptation capacity development  , EGU General Assembly 2025, Vienna, Austria, 27 Apr–2 May 2025, EGU25-15764, https://doi.org/10.5194/egusphere-egu25-15764, 2025.

How water changes interplay with climate change around the global land area is essential for societal water security and major water-related sustainability challenges, but still largely unknown over the global land area, particularly across the African continent that still largely lacks relevant monitoring data. Based on several comparative global datasets and with focus on the terrestrial water system over Africa, we have deciphered the change relationships in space and time between the landscape water fluxes and storages and the associated temperature and precipitation conditions during 1980-2010 in numerous non-overlapping hydrological catchments. We find that widely used climate reanalysis data imply distinctly unrealistic 30-year drying over Africa and the whole southern hemisphere, with physically unreasonable water flux and storage changes and sensitivities to warming. Robustly across the datasets, the landscape water sensitivities to the climatic changes also emerge as differing between space and time, questioning the use of space-for-time substitution for water changes on land. The complexities of terrestrial water system change are essential to recognize for getting water security planning and strategies right, in particular across the relatively data-poor African continent.

How to cite: Destouni, G. and Zarei, M.: Getting water security right across Africa: recognising major dataset biases and space-time change divergence, EGU General Assembly 2025, Vienna, Austria, 27 Apr–2 May 2025, EGU25-19247, https://doi.org/10.5194/egusphere-egu25-19247, 2025.

EGU25-19310 | ECS | Orals | EOS2.6

Climate change capacity building in Africa: initiatives at the United Nations University Bonn 

Sally Janzen, Anna Stamatogiannakis, Emmanuel Cheo, Michael Hagenlocher, Samira Pfeiffer, Stefan Schneiderbauer, Joerg Szarzynski, Erick Tambo, and Yvonne Walz

With the mission to build knowledge for a sustainable world, the United Nations University in Bonn (UNU Bonn) (including the Institute for Environment and Human Security (UNU-EHS) and the Vice-Rectorate in Europe (UNU-VIE)) is heavily involved in capacity development, especially in Africa, where the effects of climate change and associated extremes are felt disproportionately. UNU Bonn integrates its cutting-edge research on risk, adaptation and transformation into its capacity development activities in collaboration with universities in different countries of Africa, for example through the WASCAL Graduate Studies Programs in West Africa, the Pan African University, and the Disaster Management Training and Education Center in South Africa. In addition, UNU Bonn implements capacity building components in direct relation to and as part of the implementation of innovative research projects.

Against this background and in direct response to the aim of this session, UNU Bonn can provide an overview of the most recent and relevant capacity building initiatives in the context of climate change in Africa. Examples are contributions from UNU Bonn to university curricula in the context of disaster risk management and climate change adaptation, Training of Trainers initiatives, e.g. on "transboundary water management" in Togo and Benin, capacity building initiatives in the field "GIS and Remote Sensing for Impact-Based Early Warning", or training programs for young professionals, accelerating gender-just energy transition. In addition, UNU Bonn is closely working with regional organizations, such as the African Montane Unit (ARU) and co-organizing the Southern African Mountain Conference series (SAMC) with the aim to bring together science, policy and practitioners and build capacities on water management issues in the context of climate risks in different southern African mountain regions. UNU Bonn, furthermore, promotes innovation around “Internet of Things” (IoT) in agricultural production.

We can also bring insights into new projects, which build the basis for future capacity building initiatives, for example in the field of multi-goal-oriented management of ecosystems to address climate change, disaster risk, biodiversity loss, and land degradation simultaneously through targeted and strategic management of e.g. wetlands or forests.

With these initiatives, UNU Bonn builds and fosters African capacities of tomorrow’s decision-makers, enabling them to deal with climate change impacts – something the European-African Network for Capacity Development in Climate Change Adaptation Research in Africa can learn from and build on.

How to cite: Janzen, S., Stamatogiannakis, A., Cheo, E., Hagenlocher, M., Pfeiffer, S., Schneiderbauer, S., Szarzynski, J., Tambo, E., and Walz, Y.: Climate change capacity building in Africa: initiatives at the United Nations University Bonn, EGU General Assembly 2025, Vienna, Austria, 27 Apr–2 May 2025, EGU25-19310, https://doi.org/10.5194/egusphere-egu25-19310, 2025.

The Long-Term Euro-African Partnership on Renewable Energy (LEAP-RE) seeks to create a long-term collaboration framework of African and European stakeholders in a quadruple helix approach: government (programme owners and funding agencies), research and academia, private sector, and civil society. The aim is to reduce fragmentation by aligning existing bilateral and multilateral frameworks. LEAP-RE establishes and jointly implements research, innovation, and capacity- building activitie in renewable energies, notably:  (i) Planning and modelling future sustainable energy systems; (ii) Including society as an important stakeholder ; (iii) Market, pricing and business models for future sustainable energy systems; and (iv) Strengthening basic research and technology development. The approach encourages the development of scenarios that are appropriate to local contexts and can be further utilised to support policy makers. 

The partnership launched in 2020 will take a decisive step forward in 2025, based in particular on the following achievements: 

  • The establishment of a bi-continental co-funding mechanism: Two calls for projects have been launched in 2021 and 2022, with 220+ beneficiary organisations in over 30 countries in Europe and Africa.. The third call has been launched on 13th January 2025 under the guidance of the French National Research Agency (ANR).
  • A Strategic assessment for growth potential thanks to an ongoing analysis of Go to Market potential: LEAP-RE particularly explores strategies for scaling renewable energy innovations through market uptake of renewable energy technologies (development and commercialization, policy, building partnerships for market entry). One of the projects funded by LEAP-RE is RE4AFAGRI, led by IIASA. This project aims at demonstrating digital decision-support solutions based on technological, economic, and business model innovation to i) sustainable cropland irrigation and community-wide renewable electricity access, ii) increased agricultural productivity, local crop processing and cold storage, iii) agriculture as leverage for reduction of poverty and inequality, iv) agriculture as leverage for energy access financing. This project will be invited and will illustrate the importance of a bi-continental programme like LEAP-RE for scaling up and identifying market opportunities.
  • Institutional Teaming & Twinning capacities: This involves co-designing research agendas and decision-making processes. The Partnership is investigating new collaborative patterns which instruments are based on formal agreements between African and European institutions to promote long-term collaboration (twinning), and an emergent process where individuals and groups with multidisciplinary skills collaborate (teaming). This co-construction is key to pave the way for an inclusive partnership in critical challenges such as green energy and climate change with access to infrastructure, technology, and research laboratories.
  • Trainings & Capacity-building: develop quality protocol for training in sustainable energy, through the continuation of organizing Renewable Energy Schools (RESchools), MOOCs, and technical training sessions to foster bi-continental exchange. Three RESchools have been organized since 2020 and have gathered 150+ participants.

Thus, LEAP-RE could be instrumental with a view to implementing ambitious African strategies (Africa 2063, African Continental Master Plan) and European strategies (Partnership on Climate Change and Sustainable Energy (CCSE) as part of the AU-EU HLPD on Science Technology and Innovation, AU/EU Innovation Agenda on Green Transition) on sustainable energy, energy access and climate change mitigation.

How to cite: Lévêque, L. and Falchetta, G.: LEAP-RE: an example of coordination, resource mobilisation and capacity building in R&I between Europe and Africa, EGU General Assembly 2025, Vienna, Austria, 27 Apr–2 May 2025, EGU25-19464, https://doi.org/10.5194/egusphere-egu25-19464, 2025.

In September 2019, a partnership consortium[1] joined efforts to launch the One Planet Fellowship. This initiative, announced at the inaugural One Planet Summit in Paris, December 2017, was the coalition on the mobilization of researchers and young people to work for the climate. The One Planet Fellowship, a career development program, aims to build a robust pipeline of scientists equipped to lead climate change research in Africa, establishing an intergenerational network of scientists across Africa and Europe to foster research collaborations and bringing gender equality at the centre of the climate change and agrifood systems research.

Building on the summary points on adaptation from the Intergovernmental Panel on Climate Change (IPCC) 5th Assessment Report chapter on Africa, it was evident that applied research is essential to solve the challenges of adaptation of agriculture and food systems in Africa. Many of the basic underpinning aspects of the required research are available – what is now needed is the in-depth analysis, and deployment of resulting strategies and practice across the African continent. This requires a strong commitment of African scientists at different levels of career development and collaboration with non-African researchers, particularly from Europe as its nearest continental neighbour through its high level educational and research institutions.

It is thus important to invest in building the capacity of the next generation of African scientists so that they can be well-connected to the world as they find science-based solutions that are anchored in their local realities. To achieve this, the One Planet Fellowship targeted emerging, mid-career and seasoned scientists working in Africa and Europe to accelerate the career development process by:

  • Strengthening the leadership, scientific and mentoring skills of emerging agriculture-climate scientists from both continents and providing an opportunity to African scientists to share their context-specific knowledge and mentor emerging scientists from Europe and for European scientists to gain valuable exposure to the context within which scientific research is conducted on the African continent.
  • Incentivizing intra-continental research collaborations through the establishment of diverse research groups where Laureates identify, initiate, and implement joint projects of various forms including joint publishing, resource mobilization, and media engagement among others.
  • Enhancing the visibility of the One Planet Laureates through diverse opportunities to amplify African voices, access and contribute to national, regional and global conversations, storytelling, and media engagement.

Following the five-year of activity implementation in Africa and Europe, the One Planet Fellowship has mobilized over 400 scientists across Africa and Europe and facilitated their involvement in a range of interventions, including three-tiered mentoring programs, leadership, science and negotiation training series, Advanced Science Training (AST), science-policy linkages via learning visits, facilitating scientific networking and exchange between African and European scientists.

[1] The Bill and Melinda Gates Foundation, the BNP Paribas Foundation, the Canada’s International Development Research Centre (IDRC) and the European Union provided financial support for the One Planet Fellowship implementation jointly coordinated by African Women in Agricultural Research and Development (AWARD) based in Nairobi, Kenya and Agropolis Fondation based in Montpellier, France.

How to cite: Mbo’o-Tchouawou, M., Odongo, D., and Okoth, S.: Addressing the Multidimensional Impacts of Climate Change through Effective Capacity Development, Research Leadership, Strategic Networking, and Partnerships – The case of the One Planet Fellowship, EGU General Assembly 2025, Vienna, Austria, 27 Apr–2 May 2025, EGU25-21793, https://doi.org/10.5194/egusphere-egu25-21793, 2025.

Climate change adaptation is the process of responding and adjusting to actual and expected climate and its effects to reduce risk, loss, and damage, ensuring the right to survive, continue livelihoods, and sustain dignified lives. Adaptation effectiveness decreases with increasing warming, hence the need for impactful projects that entail flexible, robust, and inclusive decision-making to integrate climate action into broader development efforts. From current deficiencies of adaptation projects, we intend to highlight how innovative practices emerging from both research and practice can span cross sectoral interest improved environmental co-benefits.

The adequate implementation of adaptations projects necessitates a clear understanding of development realities: weak female labor force participation, rural distress, non-farm aspirations, informal economy. At the upper lever, it is key to have a genuine uptake of legal instruments, national policies, subnational programs and schemes. Rather than focusing on a range of sectors, this presentation focuses process-based adaptation outcomes. In particular the focus on multi-functional system concept that enhances livelihoods. How to twin knowledge creation with public and private partnerships to reduce the implementation gap for adaptation through a closer connection of science to the application.

How to cite: Mbow, C.: Managing scientific information to reduce implementation gaps in adaptation projects, EGU General Assembly 2025, Vienna, Austria, 27 Apr–2 May 2025, EGU25-21802, https://doi.org/10.5194/egusphere-egu25-21802, 2025.

EGU25-1559 | ECS | Posters on site | AS1.28

Changing characteristics of Western Disturbances precipitation over Western Himalayas  

Pooja Pooja and Ashok Priyadarshan Dimri

The Indian subcontinent experiences winter precipitation (December, January, and February) due to Western Disturbances (WDs), which are synoptic scale weather systems embedded in subtropical westerly jets (SWJs) at upper tropospheric levels. For Himalayan rivers, WDs precipitation is crucial for hydrological budget as it causes heavy precipitation, flooding, and snowfall. The precipitation caused by WDs is beneficial for agricultural activities such as sowing of wheat crop, barley etc. WDs and NON-WDs precipitation are classified into active and break phase. Active and break peaks of WDs and NON-WDs are computed based on the maximum precipitation occurring in each WDs and NON-WDs days. This study, highlights the changes in precipitation climatology of active WDs and NON-WDs during 1987-2020 using hourly ERA5 reanalysis dataset. Various statistical techniques such as Theil-Sen slope test is used to calculate the trend and to investigate the decline in frequency of active WDs precipitation. Further, the structure, dynamics, and moisture availability associated with changing WDs and NON-WDs are also examined in this work.  It has been observed that some characteristics of WDs have changed in the recent decade due to climate change. This is associated with decrease in active WDs precipitation but the precipitation amount is increasing in the recent years. Active WDs precipitation pattern has primarily been shifted towards the months of January and February. The dynamics showed that active NON-WDs days derive moisture from Bay of Bengal region which is due to ‘Ω shape’ amalgamated structure and ‘∞ shape’ wind formation leading to precipitation forming mechanism over Western Himalayas. This study helps in insightful understanding of WDs and NON-WDs precipitation during the recent years which is necessary to improve headwater storage policies and meet agricultural demands.

How to cite: Pooja, P. and Dimri, A. P.: Changing characteristics of Western Disturbances precipitation over Western Himalayas , EGU General Assembly 2025, Vienna, Austria, 27 Apr–2 May 2025, EGU25-1559, https://doi.org/10.5194/egusphere-egu25-1559, 2025.

EGU25-2146 | ECS | Posters on site | AS1.28

Is Europe becoming stormier? Extratropical cyclone clustering over the last century 

Zhi-Bo Li, Céline Heuzé, Jianing Song, and Deliang Chen

Extratropical cyclone clustering significantly impacts European weather extremes, such as heavy rainfall, strong winds, and flooding, often causing severe socio-economic consequences. Despite its importance, the long-term trends and variability of cyclone clustering remain poorly understood. In this work, we analyze the temporal and spatial evolution of extratropical cyclone clustering affecting Europe from 1940 to 2024, utilizing the high-resolution hourly ERA5 reanalysis dataset. This study provides unprecedented insights into century-scale changes in storminess and explores the underlying mechanisms driving these patterns. Our findings aim to enhance the understanding of extratropical cyclone behavior and their potential links to climate change, offering critical implications for risk assessment and adaptation strategies in Europe.

How to cite: Li, Z.-B., Heuzé, C., Song, J., and Chen, D.: Is Europe becoming stormier? Extratropical cyclone clustering over the last century, EGU General Assembly 2025, Vienna, Austria, 27 Apr–2 May 2025, EGU25-2146, https://doi.org/10.5194/egusphere-egu25-2146, 2025.

EGU25-2792 | Orals | AS1.28

Asymmetric hysteresis response of mid-latitude storm tracks to CO2 removal 

seok-woo son, Jaeyoung Hwang, Chaim I. Garfinkel, Tim Woollings, Hyunsuk Yoon, Soon-Il An, Sang-Wook Yeh, Seung-Ki Min, Jong-Seong Kug, and Jongsoo Shin

In a warming climate, storm tracks are projected to intensify on their poleward side. Here we use large-ensemble CO2 ramp-up and ramp-down simulations to show that these changes are not reversed when CO2 concentrations are reduced. If CO2 is removed from the atmosphere following CO2 increase, the North Atlantic storm track keeps strengthening until the middle of the CO2 removal, while the recovery of the North Pacific storm track during ramp-down is stronger than its shift during ramp-up. By contrast, the Southern Hemisphere storm track weakens during ramp-down at a rate much faster than its strengthening in the warming period. Compared with the present climate, the Northern Hemisphere storm track becomes stronger and the Southern Hemisphere storm track becomes weaker at the end of CO2 removal. These hemispherically asymmetric storm-track responses are attributable to the weakened Atlantic meridional overturning circulation and the delayed cooling of the Southern Ocean.

How to cite: son, S., Hwang, J., Garfinkel, C. I., Woollings, T., Yoon, H., An, S.-I., Yeh, S.-W., Min, S.-K., Kug, J.-S., and Shin, J.: Asymmetric hysteresis response of mid-latitude storm tracks to CO2 removal, EGU General Assembly 2025, Vienna, Austria, 27 Apr–2 May 2025, EGU25-2792, https://doi.org/10.5194/egusphere-egu25-2792, 2025.

The Tibetan Plateau (TP), known as the "Asian Water Tower," plays a crucial role in regional water resources, with summer storms contributing significantly to annual precipitation. However, the spatial structural changes of these storms remain understudied. This study analyzed satellite-retrieved precipitation data from 2001 to 2020 to investigate the changes in the spatial structure of summer storms over the TP and their underlying mechanisms. Results showed distinct regional differences: in the monsoon-dominated zone, reduced precipitation particularly at the storm center, led to a "dulling" of storm structures. In contrast, in the westerly-dominated and transition zones, a greater increase in precipitation was found at the center compared to other regions of storms, especially for extreme storms, resulted in a "sharpening" of storm structures. Ignoring the changes of spatial structural changes may overestimate the changes of storm-induced precipitation. Further analysis linked these changes to dynamic environmental factors, particularly stronger variations in vertical velocity near the storm center, driven by large-scale circulation changes around the TP.

How to cite: Jin, G. and Zou, L.: Spatial structural changes of summer storms over the Tibetan Plateau during 2001-2020 based on GPM IMERG data, EGU General Assembly 2025, Vienna, Austria, 27 Apr–2 May 2025, EGU25-2966, https://doi.org/10.5194/egusphere-egu25-2966, 2025.

EGU25-5700 | ECS | Orals | AS1.28

Cloud-radiative impact on the dynamics of extratropical cyclones during NAWDEX 

Behrooz Keshtgar, Aiko Voigt, and Corinna Hoose

Cloud-radiative heating (CRH) affects the dynamics of extratropical cyclones and near-tropopause circulations. Previous studies on the impact of CRH were mostly limited to simulations of idealized baroclinic life cycles. To bridge the gap between idealized studies and practical applications, we investigate the impact of CRH on the dynamics of North Atlantic cyclones. Using the ICOsahedral Nonhydrostatic (ICON) model, we simulate four cyclones during the North Atlantic Waveguide and Downstream Impact Experiment (NAWDEX) field campaign, and apply the Clouds On-Off Klimate model Intercomparison Experiment (COOKIE) method to compare simulations with and without CRH. We find that CRH systematically affects latent heating, vertical motion, and precipitation rates within the ascending regions of the cyclones, and that the impact of CRH is more prominent at upper levels. Furthermore, we investigate the impact of CRH on near-tropopause dynamics by diagnosing the evolution of differences in potential vorticity (PV). Consistent with idealized studies, CRH affects North Atlantic cyclones and PV near the tropopause mainly through changes in latent heating, and subsequently through changes in the divergent and rotational flows. Finally, we perform simulations with different ice optical parameterizations and radiation solvers. These simulations show that uncertainties in CRH can indeed affect the evolution of cyclones and PV near the tropopause. Our study highlights the importance of correctly simulating CRH for model predictions of extratropical cyclones.

How to cite: Keshtgar, B., Voigt, A., and Hoose, C.: Cloud-radiative impact on the dynamics of extratropical cyclones during NAWDEX, EGU General Assembly 2025, Vienna, Austria, 27 Apr–2 May 2025, EGU25-5700, https://doi.org/10.5194/egusphere-egu25-5700, 2025.

EGU25-6430 | ECS | Posters on site | AS1.28

Is Europe under UNSEEN Risk of Cyclones of Tropical Origin? 

Kelvin S. Ng and Gregor C. Leckebusch

Traditionally, European windstorms – the costliest meteorological hazards in Europe, are associated with extratropical cyclones in winter. However, in recent years, unorthodox cyclones such as Ophelia (2017), Leslie (2018), and Kirk (2024) have had noticeable impacts on Europe during autumn. These cyclones, referred to as Cyclones of Tropical Origin (CTOs), form in tropical or subtropical regions and can migrate toward Europe during their lifecycle. Although CTOs do not always cause significant impacts, they can exhibit exceptional intensity, posing unique hazards distinct from typical extratropical cyclones.

This raises important questions: Are these isolated events? Will these events become more common in future climates? Current efforts to quantify the risk posed by CTOs are hindered by limited observational data and an incomplete theoretical understanding of these phenomena. As a result, Europe may face an unseen hazard from CTOs.

In this presentation, we analyse CTO events using a physically consistent UNSEEN event set constructed from twentieth-century seasonal hindcast outputs (CSF-20C and SEAS5-20C). Our results show that while CTOs are rare, they are not isolated. We examine the interdecadal variability of CTO impact potentials—including wind, rainfall, and compound hazards—and assess their impact probabilities during the twentieth century. Finally, we present preliminary findings that highlight the genuine and previously unseen risk posed by CTOs to Europe.

How to cite: Ng, K. S. and Leckebusch, G. C.: Is Europe under UNSEEN Risk of Cyclones of Tropical Origin?, EGU General Assembly 2025, Vienna, Austria, 27 Apr–2 May 2025, EGU25-6430, https://doi.org/10.5194/egusphere-egu25-6430, 2025.

EGU25-6685 | ECS | Orals | AS1.28

Forced trends and internal variability in projections of European windstorms associated with extratropical cyclones 

Matthew Priestley, David Stephenson, Adam Scaife, and Daniel Bannister

Climate change projections of windstorms associated with extratropical cyclones for Europe are highly uncertain. This is due to differences between models and large internal variability present. Furthermore, year-to-year variations are very high, and the different representations of the driving extratropical cyclones are large, resulting in any forced changes from a warming climate being hard to detect. Windstorms and the associated extratropical cyclones are objectively identified in 20 CMIP6 models, and then Generalized Linear Models and a weighted median estimation are used to extract forced trends for a number of storm impact metrics. Trends are assessed over time, but also as a function of global mean surface temperature changes. Trends in aggregate severity are attributed to changes in storm average severity, frequency, and area impacted, with changes in area being the dominant driver of changes to average storm severity. Using a large ensemble we find that trends between individual members can vary significantly, however the uncertainty due to internal variability is generally 2-3 times lower than model variability. With largest uncertainty coming from model differences, a large proportion of uncertainty in future windstorms is therefore potentially reducible with modelling advances.

How to cite: Priestley, M., Stephenson, D., Scaife, A., and Bannister, D.: Forced trends and internal variability in projections of European windstorms associated with extratropical cyclones, EGU General Assembly 2025, Vienna, Austria, 27 Apr–2 May 2025, EGU25-6685, https://doi.org/10.5194/egusphere-egu25-6685, 2025.

EGU25-9818 | ECS | Orals | AS1.28

CMIP6 Multi-model Assessment of Northeast Atlantic and German Bight Storm Activity 

Daniel Krieger and Ralf Weisse

We assess the evolution of Northeast Atlantic and German Bight storm activity in the CMIP6 multi-model ensemble, as well as the Max Planck Institute Grand Ensemble with CMIP6 forcing (MPI-GE), using historical forcing and three emission scenarios. We define storm activity as upper percentiles of geostrophic wind speeds, obtained from horizontal gradients of mean sea-level pressure. We detect robust downward trends for Northeast Atlantic storm activity in all scenarios, and weaker but still downward trends for German Bight storm activity. In both the multi-model ensemble and the MPI-GE, we find a projected increase in the frequency of westerly winds over the Northeast Atlantic and northwesterly winds over the German Bight, and a decrease in the frequency of easterly and southerly winds over the respective regions. We also show that despite the projected increase in the frequency of wind directions associated with increased cyclonic activity, the upper percentiles of wind speeds from these directions decrease, leading to lower overall storm activity. Lastly, we detect that the change in wind speeds strongly depends on the region and percentile considered, and that the most extreme storms may become stronger or more likely in the German Bight in a future climate despite reduced overall storm activity.

How to cite: Krieger, D. and Weisse, R.: CMIP6 Multi-model Assessment of Northeast Atlantic and German Bight Storm Activity, EGU General Assembly 2025, Vienna, Austria, 27 Apr–2 May 2025, EGU25-9818, https://doi.org/10.5194/egusphere-egu25-9818, 2025.

EGU25-10092 | ECS | Orals | AS1.28

Intensity-based classification of North Atlantic and European extratropical cyclones 

Joona Cornér, Clément Bouvier, Benjamin Doiteau, Florian Pantillon, and Victoria A. Sinclair

Most of the day-to-day variability in weather in Europe, including damaging events, is caused by extratropical cyclones (ETCs). ETCs are very different from one another and to more easily study their development, intensity, and structure, various ETC classification schemes have been proposed. Here, we propose an intensity-based scheme in which we first identify necessary ETC intensity measures to describe ETC intensity comprehensively from both dynamical and impact-relevant perspective, and then use them to produce an ETC classification.

ERA5 reanalysis data from 1979 to 2022 was used to track ETCs and compute their intensity measures in the extended winter season (October-March). A total of 7361 ETC tracks were identified in the North Atlantic and Europe. Eleven intensity measures were analysed including 850-hPa relative vorticity, mean sea level pressure, wind speeds at various levels, wind gust, wind footprint, precipitation, and storm severity index. Among the 11 intensity measures, relevant ones were identified by analysing their correlation with each other combined with a sparse principal component analysis (sPCA). The selected measures were used to classify the ETCs by performing a cluster analysis with Gaussian mixture modelling.

Based on the sPCA and relationships between the intensity measures, the set was reduced to 5 measures: 850-hPa relative vorticity, 850-hPa wind speed, wind footprint, precipitation, and storm severity index. Therefore, to describe ETC intensity comprehensively, one needs to use more than one or two intensity measures. The cluster analysis with these 5 measures as input produced 4 discernible clusters. Between these clusters ETCs differed in terms of their intensity, life cycle characteristics, and geographical location. Despite only 9 % of all ETCs belonging to the most intense cluster, it contained 17 out of 21 investigated impactful named storms, which demonstrates the relevance of the classification and its ability to identify potentially impactful ETCs.

How to cite: Cornér, J., Bouvier, C., Doiteau, B., Pantillon, F., and Sinclair, V. A.: Intensity-based classification of North Atlantic and European extratropical cyclones, EGU General Assembly 2025, Vienna, Austria, 27 Apr–2 May 2025, EGU25-10092, https://doi.org/10.5194/egusphere-egu25-10092, 2025.

EGU25-10733 | Posters on site | AS1.28

Multi-model assessment of hazard uncertainties in a European windstorm NatCat model 

Hugo Rakotoarimanga, Rémi Meynadier, Gabriele Messori, and Joaquim G. Pinto

Extra-tropical winter storms are one of the most impactful natural hazards for the European insurance market causing large socio-economic damages.

AXA has been developing stochastic natural hazard models (also called natural catastrophe models) to quantify the impact of such events on its portfolios, including European extra-tropical cyclones. However, the correct representation of windspeeds and their spatial distribution across Europe during a storm is crucial to determine the risk posed by an event. The characterization of uncertainties in natural catastrophe models stemming from the hazard data used and its resolution is crucial to understand their limitations and guide decision-making.

We rely on a novel publicly available dataset of 50 extreme European windstorms for the period 1995–2015 (Flynn et al., 2024; doi:10.5194/essd-2024-298) with wind gust footprints derived consistently from four different datasets with different horizontal resolutions. Risk being a function of hazard, vulnerability and exposure, we set constant vulnerability and portfolio, and we quantify the range of uncertainties in the reproduction of historical insured losses stemming from the sole hazard component. We compare the losses derived from AXA’s model to the range of losses derived from this novel extreme windstorms dataset.

How to cite: Rakotoarimanga, H., Meynadier, R., Messori, G., and Pinto, J. G.: Multi-model assessment of hazard uncertainties in a European windstorm NatCat model, EGU General Assembly 2025, Vienna, Austria, 27 Apr–2 May 2025, EGU25-10733, https://doi.org/10.5194/egusphere-egu25-10733, 2025.

EGU25-14002 | ECS | Orals | AS1.28

Resolution-Dependent Impact of Extratropical Cyclones on Winter U.S. Precipitation Bias in the GFDL SPEAR Model 

Jaeyeon Lee, Xiaosong Yang, and Edmund Chang

Extratropical cyclones (ETCs) are the primary drivers of winter precipitation across the United States, accounting for up to 85% of total precipitation. This study uses the GFDL SPEAR models at atmospheric resolutions of 100 km, 50 km, and 25 km to examine how ETC dynamics impact precipitation patterns and biases across the United States. Higher-resolution models reduce ETC-related precipitation biases in the Southwest and Midwest but increase biases in coastal regions, including the West Coast and the Eastern United States. To understand these biases, we decompose ETC-related precipitation biases into those driven by precipitation frequency and intensity. Coastal precipitation biases are mainly due to overestimations of both the occurrence and intensity of precipitation, which are related to ETC frequency and intensity, respectively. In inland areas, biases are largely driven by occurrence bias associated with ETC frequency. Notably, higher-resolution models simulate amplified ETC frequency and intensity biases in coastal regions, while showing a decrease in ETC frequency bias in inland regions. This increase is especially linked to the overestimation of small-scale ETCs, which considerably inflate frequency-driven precipitation bias. Additionally, improvements in AMIP runs suggest that these biases are partly connected to SST bias. These findings emphasize the sensitivity of precipitation representation to ETC dynamics and underscore the importance of addressing resolution-dependent and SST related biases to improve midlatitude precipitation simulations in climate models.

How to cite: Lee, J., Yang, X., and Chang, E.: Resolution-Dependent Impact of Extratropical Cyclones on Winter U.S. Precipitation Bias in the GFDL SPEAR Model, EGU General Assembly 2025, Vienna, Austria, 27 Apr–2 May 2025, EGU25-14002, https://doi.org/10.5194/egusphere-egu25-14002, 2025.

EGU25-14515 | Orals | AS1.28

Warm core intensification of a Tasman Sea cyclone linked to Coral Sea sea-surface temperatures. 

Christopher Chambers, Yi Huang, and Dale Roberts

In early June 2016 a large rainband with an embedded subtropical cyclone, associated with a deep upper-level trough, brought extensive heavy rainfall along Australia’s east coast, from southern Queensland to Tasmania. In the lead-up to this event, sea-surface temperatures (SSTs) in the Coral and Tasman Seas were the warmest on record for the time of year. 
To investigate how the anomalously high SST, and its distribution, influenced the development of the cyclone, a high-resolution configuration of the Australian Community Climate and Earth System Simulator (ACCESS) over Australia, known as AUS2200, has been run under different SST scenarios. All simulations were run from 0000 UTC 3 June to 0000 UTC 8 June 2016, and use ERA5 data for the SST calculations.
A more intense subtropical cyclone develops off the New South Wales (NSW) coast in two simulations run with observed SST — one with fixed initial SST (Control) and the other with daily evolving SST (Evolving) — compared with a simulation using 3 June climatological SST (Climatology). The cyclone also stalls longer near the NSW coast in the observed SST runs.
Two additional simulations examine the role of the East Australian Current in the Tasman Sea. One smooths a prominent warm eddy (Smooth), and another replaces the Tasman Sea SST with climatological values (Tasclim). Both simulations retain the cyclone intensification seen in Control. A final simulation that replaces the Coral Sea SST with climatological values (Corclim) produces a weaker cyclone similar to Climatology.
Taken together, the results indicate that the anomalously warm Coral Sea SSTs were more important for the cyclone intensification than those of the Tasman Sea even though the greatest intensification occurred over the Tasman Sea. The greater cyclone intensity and slower southward movement over the Tasman Sea resulted in stronger and more prolonged onshore winds along the southern NSW coast, increasing the potential for coastal damage.
The greater intensity of the subtropical cyclone seen in Control, Evolving, Smooth, and Tasclim is associated with the formation of a warmer deep-tropospheric storm core than seen in Climatology and Corclim. This is linked to a greater reservoir of deep-tropospheric warm air that develops when using observed SST over the Coral Sea. These findings highlight the critical role of the Coral Sea’s warm SST as a driver of the cyclone’s development and intensification.

How to cite: Chambers, C., Huang, Y., and Roberts, D.: Warm core intensification of a Tasman Sea cyclone linked to Coral Sea sea-surface temperatures., EGU General Assembly 2025, Vienna, Austria, 27 Apr–2 May 2025, EGU25-14515, https://doi.org/10.5194/egusphere-egu25-14515, 2025.

EGU25-15033 | Posters on site | AS1.28

Explicit risk modelling of sting-jet extratropical cyclones.  

Emmanouil Flaounas, Remi Meynadier, Hugo Rakotoarimanga, Anyssa Diouf, and Rudy Mustafa

Extratropical cyclones (ETCs) are a major hazard for Europe as they cause most of the windstorms and floods in the mid-latitudes, resulting in high economic and social costs.

Sting jets (SJ) are responsible for windstorm damages well ahead the cyclone center. In this study we employ dedicated diagnostics and modeling approaches that identify -along with cyclone tracks- the spatial extent where actual impacts take place. The fine scales of processes involved in SJ generation demand exceptionally high spatial resolutions and dense vertical levels in model simulations (Rivière et al. 2020).

In this study we use the WRF model to simulate 143 historical ETC from 1980 to 2018 that potentially involve SJs. The model simulations use two domains: one parent domain that encompasses the whole cyclone track at a resolution of about 15 km, and another, square-sized domain with each side measuring 1300 km. The nested domain always follows the ETC centers, aiming to resolve explicitly the development of SJs. SJ detection has been achieved through lagrangian modeling, by identifying airstreams that sharply descend ahead of the cloud head and behind the cold front of the cyclones. Historical ETC footprints from ERA-5 and WRF physical downscaling of ERA-5 in convection-permitting resolutions are then used to assess the impact in term of financial losses of an explicit simulation of sting-jets processes.

How to cite: Flaounas, E., Meynadier, R., Rakotoarimanga, H., Diouf, A., and Mustafa, R.: Explicit risk modelling of sting-jet extratropical cyclones. , EGU General Assembly 2025, Vienna, Austria, 27 Apr–2 May 2025, EGU25-15033, https://doi.org/10.5194/egusphere-egu25-15033, 2025.

Atmospheric bomb cyclones that form off the United States east coast are high impact, complex weather systems. Many ingredients must come together to produce a storm of this magnitude. In recent years, high-resolution studies have indicated that one such critical ingredient is fine-scale Gulf Stream sea-surface temperature (SST) variability. However, studies still lack consensus on which particular aspect of the variability is most critical (e.g. absolute SST vs. the SST gradient, pre-conditioning vs. direct influence). Through novel high-resolution simulations in Community Earth System Model 2 (CESM2), this study attempts to isolate the influence of the fine-scale SST gradient specifically, motivated by the impact fine-scale heat flux gradients are expected to have on lower-level frontogenesis and subsequent cyclone development. Through targeted fine-scale SST gradient perturbations, the results illustrate how preexisting SST gradients can impact the frequency and intensity of bomb cyclones and may offer useful information regarding seasonal forecasting of these systems.

How to cite: Hair, J., Parfitt, R., Wills, R., and Müller, J.: Investigating the Impact of Fine-Scale Gulf Stream SST Gradients on the Development of Bomb Cyclones in the Community Earth System Model 2, EGU General Assembly 2025, Vienna, Austria, 27 Apr–2 May 2025, EGU25-15631, https://doi.org/10.5194/egusphere-egu25-15631, 2025.

EGU25-15755 | Posters on site | AS1.28

Assessment of the origin of moisture for the precipitation of North-Atlantic extratropical cyclones 

Raquel Nieto, Patricia Coll-Hidalgo, José Carlos Fernández-Alvarez, and Luis Gimeno

This study uses high-resolution simulations and Lagrangian diagnostics to identify the sources of moisture contributing to precipitation at the deepest stage of extratropical cyclones (ECs) over the North Atlantic (NATL). Precipitation was associated with target regions defined by a radius, warm conveyor belt (WCB) footprint, and square root spiral contours centred on the cyclone. The NATL region was divided into sectors for detailed analysis. In the northern North Atlantic (NNATL), moisture sources extend westward across the ocean. Subtropical moisture supports precipitation in non-central areas of ECs, which intensify over the central and western NNATL. The moisture uptake patterns of ECs in the higher latitudes of the western North Atlantic (WNATL) are similar to those in the NNATL, with southwestward extension and moisture uptake from the eastern American coast. For ECs in the lower latitudes of the WNATL, moisture uptake is more symmetric around the cyclone centre, with major contributions from the Caribbean and limited moisture flow from the Gulf of Mexico due to migrating anticyclones. For ECs in the eastern NATL, moisture comes from the surrounding ocean. Overall, 75% of the moisture gain occurs below 600 hPa, with a significant concentration observed around 800 hPa. Continental mass influence is observed for ECs deepening near the coasts of East America and Western Europe. ECs at higher latitudes in the WNATL and NNATL exhibit extensive synoptic-scale disturbances, with moisture sources for WCB and spiral precipitation extending 3,000 to 4,000 km southwest of their centres. The most intense moisture uptake occurs over the WNATL, particularly for lower latitude ECs.

How to cite: Nieto, R., Coll-Hidalgo, P., Fernández-Alvarez, J. C., and Gimeno, L.: Assessment of the origin of moisture for the precipitation of North-Atlantic extratropical cyclones, EGU General Assembly 2025, Vienna, Austria, 27 Apr–2 May 2025, EGU25-15755, https://doi.org/10.5194/egusphere-egu25-15755, 2025.

We propose the first unified objective framework (SyCLoPS) for detecting and classifying all types of low-pressure systems (LPSs) in a given data set. We use the state-of-the-art automated feature tracking software TempestExtremes (TE) to detect and track LPS features globally in ERA5 and compute 16 parameters from commonly found atmospheric variables for classification. A Python classifier is implemented to classify all LPSs at once. The framework assigns 16 different labels (classes) to each LPS data point and designates four different types of high-impact LPS tracks, including tracks of tropical cyclone (TC), monsoonal system, and tropical-like cyclones (subtropical storm and polar low). The framework thus provides the first global tropical-like cyclones (TLC) detection scheme by detecting similar physical features to TCs among non-tropical system candidates and optimizing detection thresholds against subjective data sets. The vertical cross section composite of the four types of high-impact LPS we detect each shows distinct structural characteristics. 

The classification process involves disentangling high-altitude and drier LPSs, differentiating tropical and non-tropical LPSs using novel criteria, and optimizing for the detection of the four types of high-impact LPS. A comparison of our labels with those in the International Best Track Archive for Climate Stewardship (IBTrACS) revealed an overall accuracy of 95% in distinguishing between tropical systems, extratropical cyclones, and disturbances, and a median error of 6 hours in determining extratropical transition completion time. We demonstrate that the SyCLoPS framework is valuable for investigating various aspects of mid-latitude storms and post-TCs in climate data, such as the evolution of a single storm track at every stage, patterns of storm frequencies, and precipitation or wind influence associated with impactful mid-latitude storms.

How to cite: Han, Y. and Ullrich, P.: The System for Classification of Low-Pressure Systems (SyCLoPS): An All-In-One Objective Framework for Large-Scale Data Sets, EGU General Assembly 2025, Vienna, Austria, 27 Apr–2 May 2025, EGU25-15800, https://doi.org/10.5194/egusphere-egu25-15800, 2025.

EGU25-16278 | Orals | AS1.28

Enhanced C3S Windstorm Service: A Novel Dataset of European Extratropical Cyclone Windstorms Based on ERA5 Reanalysis 

Lorenzo Sangelantoni, Stefano Tibaldi, Leone Cavicchia, Enrico Scoccimarro, Pier Luigi Vidale, Kevin Hodges, Vivien Mavel, Mattia Almansi, Chiara Cagnazzo, and Samuel Almond

Extratropical cyclones (ETCs) are dominant meteorological structures playing a crucial role in midlatitudes climate. ETCs are also responsible for heavy precipitation events, strong surface winds and wind gusts exposing populations to hazards and causing widespread and significant damages. The response of ETCs to a warming atmosphere is characterized by substantial uncertainty. This arises primarily from two key factors: significant inter-annual variability, which complicates trend detection, and the interplay of non-linear and potentially compensating mechanisms, which render future changes in the ETC climate challenging to evaluate, understand and predict. Additionally, North Atlantic ETC trend evaluation and understanding crucially depend on methodological analysis choices regarding datasets (e.g., observations, reanalysis, proxies, model simulations and analysis period) and approaches to examine storm features (i.e., Eulerian vs. Lagrangian).

Here, we present and preliminarily evaluate a novel dataset of European windstorms associated with ETCs based on the whole ERA5 reanalysis period (1940-present). This dataset is produced within the Copernicus Climate Change Service (C3S) Enhanced Operational Windstorm Service (EWS), to promote a knowledge-based assessment of the nature and temporal evolution of European windstorms associated with ETC. Such a dataset is primarily thought to provide high-quality, standardized data on windstorms which support various industrial sectors, particularly insurance and risk management, by offering insights into the intensity, frequency, vulnerability and impact of windstorms. EWS includes two datasets: windstorm tracks, based on two tracking algorithms (TRACK and TempestExtremes), and windstorm footprints, produced considering both original-resolution ERA5 variables and statistically downscaled ERA5 variables, with a target grid at 1 km resolution.

A preliminary analysis of the datasets shows increasing trends of cold-semester windstorm frequency and of the associated footprint magnitude over a portion of the European territory. The choice of the tracking algorithm is shown to be an important factor in the analysis process, as it results in non-negligible uncertainties in main windstorm statistics.


How to cite: Sangelantoni, L., Tibaldi, S., Cavicchia, L., Scoccimarro, E., Vidale, P. L., Hodges, K., Mavel, V., Almansi, M., Cagnazzo, C., and Almond, S.: Enhanced C3S Windstorm Service: A Novel Dataset of European Extratropical Cyclone Windstorms Based on ERA5 Reanalysis, EGU General Assembly 2025, Vienna, Austria, 27 Apr–2 May 2025, EGU25-16278, https://doi.org/10.5194/egusphere-egu25-16278, 2025.

EGU25-17891 | ECS | Posters on site | AS1.28

Temporal clustering of severe European winter windstorms on intra-seasonal timescales and the explanatory power of large-scale modes 

Sophie Feltz, Kelvin Ng, Christopher Allen, Tim Kruschke, Michael Angus, Andrew Quinn, and Gregor C. Leckebusch

When severe European winter windstorms cluster in time, socioeconomic impacts and losses are magnified. Yet, the behaviour and drivers on shorter, intra-seasonal timescales have not been fully investigated. The impact-relevant footprint of the storm system is identified using the wind-based impact-oriented tracking algorithm WiTRACK (Leckebusch et al., 2008), for the core winter seasons (DJF) 1980/01-2022/23 from ERA5 reanalysis. Derived from a Poisson Process, we quantify the magnitude of clustering through the widely established dispersion statistic (Mailier et al., 2006). On fixed 45- and 30-day timescales, the spatial distribution of the dispersion statistic has been analysed. The time-development of the dispersion statistic on shorter time horizons is investigated through 21-, 15- and 11-day moving windows. Preliminary results reveal an increase in clustering in the latter half of the winter season on the fixed 45- and 30-day timescales. Shorter time horizons reveal clear peaks at the middle and the end of the season.

To analyse mechanisms that drive the defined intra-seasonal behaviour on the shorter time horizons (<30 -days), we examined the roles of several large-scale variability modes, namely the North Atlantic Oscillation (NAO), the East Atlantic pattern (EA), and the Scandinavian pattern (SCA). Results reveal a correlation between intra-seasonal variability of clustering and the occurrence of such large-scale modes, suggesting the EA as a key driver for increasing clustering. In addition, the individual contributions of large-scale modes to clustering at different times of the season can be diagnosed.

How to cite: Feltz, S., Ng, K., Allen, C., Kruschke, T., Angus, M., Quinn, A., and Leckebusch, G. C.: Temporal clustering of severe European winter windstorms on intra-seasonal timescales and the explanatory power of large-scale modes, EGU General Assembly 2025, Vienna, Austria, 27 Apr–2 May 2025, EGU25-17891, https://doi.org/10.5194/egusphere-egu25-17891, 2025.

EGU25-313 | ECS | Orals | AS1.24

Forced Response in the Mean State and Interannual Variability of the Indian Summer Monsoon in Future Projections 

Nithya Kunnath, Aneesh Sundaresan, and Sijikumar Sivarajan

The Indian summer monsoon (ISM) is a complex system that plays a significant role in the climate of South Asia. We used Community Earth System Model 2-Large Ensemble (CESM2-LE) simulations to explore the forced response in the mean state and interannual variability of the ISM in future projections. The model is able to reproduce the mean state and interannual variability of the ISM during historical periods. The strengthening of monsoon circulation during excess rainfall years and weakening during deficient years are also well simulated by the model. It is also noticed that though the low-level jet stream shows a weakening during deficit monsoon years, it has more eastward extension up to the western Pacific Ocean compared to excess monsoon years. In simulations for future years, the mean structure of both the low-level jet stream and the tropical easterly jet stream becomes weaker compared to historical years. However, the precipitation pattern shows an enhancement in the future periods, and also the excess rainfall years in the future can be wetter than the historical excess years. Thus, the outcomes of CESM2-LE simulations are essential for formulating better plans for handling the effects of monsoon variability and policy-making efforts aimed at mitigating the impacts in a warming world. 

How to cite: Kunnath, N., Sundaresan, A., and Sivarajan, S.: Forced Response in the Mean State and Interannual Variability of the Indian Summer Monsoon in Future Projections, EGU General Assembly 2025, Vienna, Austria, 27 Apr–2 May 2025, EGU25-313, https://doi.org/10.5194/egusphere-egu25-313, 2025.

The Madden-Julian Oscillation (MJO) has been a topic of great scientific interest due to its higher predictability and significant impact on global climate and weather, including the South American monsoon system. As a pillar of subseasonal predictability, it is important to investigate the influence of major interdecadal oscillations, such as the Interdecadal Pacific Oscillation (IPO) and the Atlantic Multidecadal Oscillation (AMO), to assess the potential modulation of MJO impacts by these oscillations. How do variations induced by these slower oscillations influence MJO teleconnections to South America (SA)? What is the frequency of MJO phases during the austral summer, and how might the interaction between the MJO and these oscillations affect the monsoon in SA? The combined impact of the MJO and low-frequency oscillations was characterized by composites of daily anomalies filtered in the 20-90 days band during the austral summer (DJF, rainy season), when the MJO is strongest. Composite anomalies of convection and circulation were analysed over the entire period from 1979 to 2020, as well as during two periods characterized by distinct combinations of opposite phases of the IPO and AMO: IPO(+)/AMO(-) (1979-1999, Period 1) and IPO(-)/AMO(+) (2000-2020, Period 2). Results indicate that during DJF, convection anomalies and the frequency of extreme events over SA are more pronounced in the Period 1 compared to Period 2, particularly in the central-east SA (CESA), the core monsoon region. In this region, increased (reduced) precipitation is observed during MJO phases 8 and 1 (4 and 5). Previous findings (Grimm, 2019) using Influence Function analysis, based on an extended vorticity equation model, and simulations, indicated a link between anomalous convection over the central subtropical South Pacific (CSSP) and the SA during phase 8 of the MJO, which may be responsible for the convection pattern in the CESA in phase 1. This anomalous convection in CSSP is stronger in Period 1 than in Period 2. Furthermore, there is a reversal in the sign of convective anomalies from reduced to enhanced precipitation in phase 6 over CESA from Period 1 to Period 2 and this may be associated with the change from reduced to enhanced convection over CSSP during phase 5, through teleconnections. Therefore, convection associated with MJO events during Period 1 is stronger (weaker) than in Period 2 in the CESA region during phases 8 and 1 (4, 5, 6 and 7). In contrast, in southern Brazil, positive convection anomalies persist from phases 3 to 5 in Period 1, whereas in Period 2 these anomalies are observed only in phases 3 and 4. Additionally, during Period 2, a reversal of the anomalies occurs in phases 1 and 2 compared to Period 1.

How to cite: Scheibe, L. A. and Grimm, A. M.: The Relationship of the Madden-Julian Oscillation with Interdecadal Variability Modes During the Monsoon Season in South America, EGU General Assembly 2025, Vienna, Austria, 27 Apr–2 May 2025, EGU25-315, https://doi.org/10.5194/egusphere-egu25-315, 2025.

EGU25-1017 | ECS | Posters on site | AS1.24

Dynamical Influence of Subtropical Jet Stream (STJ) and Tropical Easterly Jet (TEJ) on Indian Summer Monsoon Rainfall 

Rona Maria Sunil and Manoj Manguttathil Gopalakrishnan

The subtropical jet stream (STJ) and tropical easterly jet (TEJ) are critical upper-tropospheric features shaping the Indian summer monsoon (ISM). BY analysing data for the period 2000–2023, this study investigates the positional dynamics of these jets and their relationship with rainfall variability over the Indian region. Using ERA5 reanalysis data and daily rainfall records from the India Meteorological Department (IMD), we analysed the zonal and meridional wind fields at 200 hPa along with rainfall observations.

Four distinct jet stream cases were examined: both southern and northern hemispheric STJs shifting: (i) equator-ward, (ii) pole-ward, (iii) northward, and (iv) southward. Results reveal that equatorward shifts of the STJ weaken the TEJ and displace it southward, reducing rainfall over central India. Conversely, poleward migration of the STJ strengthens the TEJ, driving its northward extension and intensifying monsoonal rainfall, including extreme rainfall events. Northward shifts of both hemispheric STJs enhance TEJ strength, while southward shifts suppress it, altering the spatial distribution of rainfall. Strengthening of TEJ is expected to enhance the vertical velocity and LLJ through easterly vertical shear mechanism, and result in enhanced rainfall over the central Indian region. A TEJ Index (TEJI) was developed by area-averaging the TEJ core at 200 hPa, demonstrating strong correlations with rainfall intensity.

These findings underscore the complex interplay between STJ and TEJ and their dynamical role in modulating ISM rainfall. Understanding these mechanisms provides essential insights into atmospheric circulation patterns and their influence on monsoonal extremes, aiding improved prediction and climate resilience strategies in the region.

How to cite: Sunil, R. M. and Manguttathil Gopalakrishnan, M.: Dynamical Influence of Subtropical Jet Stream (STJ) and Tropical Easterly Jet (TEJ) on Indian Summer Monsoon Rainfall, EGU General Assembly 2025, Vienna, Austria, 27 Apr–2 May 2025, EGU25-1017, https://doi.org/10.5194/egusphere-egu25-1017, 2025.

This study utilizes the monitoring of the onset dates of the rainy season across India, Southeast Asia, Central America, and West Africa to predict the upcoming season. By employing a straightforward objective method based on daily rainfall data, we pinpoint the onset date of the rainy season at each grid point of the rainfall analysis by identifying the minimum on the corresponding daily cumulative anomaly curve of rainfall. To accurately estimate the onset and retreat dates for each year, we introduce a perturbation technique that generates an ensemble of 100 time series of rainfall at every grid point.

Our research demonstrates that the onset data anomalies of the rainy season are directly linked to the length and seasonal rainfall anomaly of the season in all these regions. Specifically, seasons with an earlier onset tend to be longer and wetter, while those with a later onset are shorter and drier. Furthermore, we explore the relationship between onset, retreat, seasonal length, rainfall, and various large-scale climate drivers, revealing that although these relationships are local and relatively weaker, the intrinsic connections among the variables are robust.

In this study, we leverage the 12-hour latency product of Integrated Multi-Satellite Retrievals for the Global Precipitation Mission version 6 (IMERG) for near real-time monitoring of the season's evolution. The probabilistic skill scores, assessed using the area under the relative operating characteristic curve method, confirm the high predictive skill of anomalous onset dates.

How to cite: Misra, V.: The variations of the regional monsoons and their predictability from monitoring their evolution, EGU General Assembly 2025, Vienna, Austria, 27 Apr–2 May 2025, EGU25-1267, https://doi.org/10.5194/egusphere-egu25-1267, 2025.

EGU25-1484 | ECS | Orals | AS1.24

The role of the North American continent in strengthening the Asian monsoon 

Linlin Chen, Paul Valdes, and Alexander Farnsworth

Most studies on the formation of the modern Asian monsoon focus on mechanisms arising on the Afro-Eurasian continent. While few compare the effects of other remote continents. Using a fully coupled general circulation model, this study decomposes the relative contribution of each continent on the formation, distribution and intensity of the Asian monsoon. Here we show that the existence of the North American continent is critical for the formation and intensity of the Asian summer monsoon. The mechanism involves North America acting as an additional heating center, resulting in the strengthening and extension of oceanic advection towards the Asian monsoon region. This is achieved by the Rodwell-Hoskins mechanism that strengthens the North Pacific subtropical high and through a wide-spread Northern Hemispheric heating that shifts poleward the subsidence center of Hadley circulation. This teleconnection is not dependent on the Tibetan Plateau and its impact on East Asian summer precipitation is found to be smaller but comparable to the Tibetan Plateau. The individual role of the other non-Afro-Eurasian continents was found to be less important. Previous work has shown that the Asian monsoon has global impact, including changing the climate of North America. This study firstly shows the "reversed" teleconnection that North America can have a very significant impact on the Asian monsoon. Although these experiments are idealized and based on contemporary land-sea geometry, they also highlight the role of North America in the geologic evolution of the Asian monsoon, and imply the impacts of the anthropogenic climate change of North America to the Asian monsoon in the recent history and future.

How to cite: Chen, L., Valdes, P., and Farnsworth, A.: The role of the North American continent in strengthening the Asian monsoon, EGU General Assembly 2025, Vienna, Austria, 27 Apr–2 May 2025, EGU25-1484, https://doi.org/10.5194/egusphere-egu25-1484, 2025.

EGU25-2173 | ECS | Orals | AS1.24 | Highlight

Atmospheric Influence of Summer Monsoon on Sea Ice Variability 

Jiawei Zhu and Zhiwei Wu

The impacts of tropical systems on polar sea ice have been relatively underestimated, which could potentially offer insights into the mechanisms driving sea ice variability and enhance predictive skills regarding sea ice extent. Our recent study delves into the influence of July-August Indian Summer Monsoon (ISM) precipitation on shaping Arctic sea ice variability from August to October, alongside exploring how the December-February Australian Summer Monsoon (AUSSM) modulates simultaneous Antarctic sea ice. Our findings suggest that ISM could explain up to 20% of Arctic sea ice concentration (SIC) variance across the marginal Arctic Ocean, while AUSSM could account for roughly 10% of SIC variance in the Pacific sector of the Southern Ocean including Amunsen and Ross Seas. Insights from both observation and model experiments demonstrate that the diabatic heating associated with ISM and AUSSM can trigger the poleward propagation of Rossby waves, culminating in barotropic anomalous circulations over the Arctic and Antarctic regions. These anomalous atmospheric patterns, characterized by highs and lows, have the potential to influence surface downwelling longwave radiation and surface winds, thereby shaping sea ice variability through a combination of thermodynamic and dynamic processes.

How to cite: Zhu, J. and Wu, Z.: Atmospheric Influence of Summer Monsoon on Sea Ice Variability, EGU General Assembly 2025, Vienna, Austria, 27 Apr–2 May 2025, EGU25-2173, https://doi.org/10.5194/egusphere-egu25-2173, 2025.

EGU25-2285 | Posters on site | AS1.24

Reconciling roles of the South China Sea summer monsoon and ENSO in prediction of the Indian Ocean dipole 

Jianping Li, Yazhou Zhang, Yina Diao, Qiuyun Wang, Renguang Wu, Ting Liu, Yishuai Jin, Zhaolu Hou, and Haili Wang

The Indian Ocean dipole (IOD) is a remarkable interannual variability in the tropical Indian Ocean. The improved prediction of IOD is of a great value because of its large socioeconomic impacts. Previous studies reported that both El Ni˜ no-Southern Oscillation (ENSO) and South China Sea summer monsoon (SM) play a dominant role in the western and eastern pole of the IOD, respectively. They can be used as predictors of the IOD at 3 month lead beyond self-persistence. Here, we develop an empirical model of multi-factors in which the western pole is predicted by ENSO and persistence and the eastern pole is predicted by SM and persistence. This new empirical model outperforms largely the average level of the dynamical models from the North American multi-model ensemble (NMME) project in predicting the peak IOD in boreal autumn, with a correlation coefficient of ∼0.86 and a root mean square error of ∼0.24°C. Furthermore, the hit rate of positive culminated IOD in this new empirical model is equivalent to that in current NMME models (above 65%), much higher than that for negative culminated IOD. This improvement of skill using the empirical model suggests a perspective for better understanding and predicting the IOD.

How to cite: Li, J., Zhang, Y., Diao, Y., Wang, Q., Wu, R., Liu, T., Jin, Y., Hou, Z., and Wang, H.: Reconciling roles of the South China Sea summer monsoon and ENSO in prediction of the Indian Ocean dipole, EGU General Assembly 2025, Vienna, Austria, 27 Apr–2 May 2025, EGU25-2285, https://doi.org/10.5194/egusphere-egu25-2285, 2025.

EGU25-2330 | ECS | Orals | AS1.24

Unravelling large-scale onset and progression of the Indian monsoon from the evolution of clusters of local onsets using network science 

Gaurav Chopra, Yogenraj Patil, Shruti Tandon, Bhupendra Nath Goswami, and Raman I Sujith

Developing an accurate definition of the onset and progression of the Indian monsoon is an outstanding research area in climate science. Determining monsoon onset dates is critical for agricultural planning and ensuring food security for billions of people in India and the world. The onset of the Indian monsoon is associated with the northward shift of the planetary-scale intertropical convergence zone (ITCZ) from the equator. ITCZ is a zone of intense convective activity, cloudiness and high precipitation girdling the Earth. As a result, the onset and progress of the Indian monsoon are interconnected on a planetary scale.

The monsoon onset definition can be classified into local and large-scale definitions. Local-scale definitions utilize daily precipitation over a small region to determine the onset. However, they are prone to bogus onsets because of pre-monsoon rains and transient weather systems. Large-scale definitions are based on precipitation and wind/cloudiness over a bigger area. However, such averaging does not guarantee separation of the ‘large-scale’ component of ITCZ precipitation from the ‘small-scale’ local contributions and is still prone to bogus onsets. Large-scale onset definitions are largely confined to defining the monsoon onset over Kerala (MoK) while representing the progression of monsoon is based entirely on local onsets. We overcome this limitation by developing a large-scale definition from small-scale local onsets interconnected on a planetary scale.

We utilize networks and their phase transitions to develop a large-scale definition. We construct time-varying spatial proximity networks based on daily precipitation, where nodes are the geographical locations in a domain encompassing India. Links are established only between nodes that are in geographical proximity and if they have undergone local onsets. Next, we estimate connected components in the network that represent clusters of local onsets. The spatiotemporal evolution, involving the growth and coalescence of clusters disentangles the true large-scale monsoon onset and progression.

We discover two abrupt phase transitions in the size of the largest cluster of the local onsets. These phase transitions are associated with the formation of large clusters representing the local onsets interconnected at a planetary scale. Thus, we unravel the setting up of the ITCZ and other synoptic-scale convective systems that facilitate consistent monsoon activity over India. We define large-scale onsets when a location becomes part of the largest cluster following the first transition.

Using lead-lag composites of precipitation for the past 84 years centred on large-scale onsets, we find that our definition captures important characteristics of the Indian monsoon usually missed by conventional large-scale definitions. During our onsets, the rainfall is strong at a large scale along the western ghats and northeast India (NEI). Further, they are followed by a rapidly northward propagating rainfall pulse, also known as the monsoon intraseasonal oscillation. Our method captures that the onset over NEI occurs before MoK, which is consistent with several recent studies but missed by conventional definitions. These new findings necessitate a reexamination of the interannual variability in the Indian monsoon, which will be discussed in the talk.

How to cite: Chopra, G., Patil, Y., Tandon, S., Goswami, B. N., and Sujith, R. I.: Unravelling large-scale onset and progression of the Indian monsoon from the evolution of clusters of local onsets using network science, EGU General Assembly 2025, Vienna, Austria, 27 Apr–2 May 2025, EGU25-2330, https://doi.org/10.5194/egusphere-egu25-2330, 2025.

EGU25-2552 | ECS | Orals | AS1.24

The role of dry intrusions in breaks of the Indian summer monsoon 

Akshay Deoras, Andrew Turner, Ambrogio Volonté, Reinhard Schiemann, Laura Wilcox, and Arathy Menon

The Indian summer monsoon (ISM) is of great importance to over a billion people since it supplies over 75% of the country’s annual precipitation. Significant intraseasonal variability in rainfall affects people, with breaks responsible for causing water shortage. It is known that dry intrusions play a role in breaks; however, it is not well understood compared to the role dry intrusions play during progressions of the onset and withdrawal of the ISM. In this study, we use observations and the ERA5 reanalysis to understand the role of dry intrusions in breaks during 1940–2023. We develop an index based on moisture deficit to identify dry intrusions, and find that most breaks are associated with dry intrusions emanating from arid regions to the west and northwest of India. These dry intrusions begin to enter India around a week prior to the middle day of breaks, reaching their peak strength over north India three days prior to the middle day of breaks. Vertical profiles reveal that these are mid-level dry intrusions, which are similar to those driving the direction of the withdrawal of the ISM. As breaks evolve, these dry intrusions deepen throughout their horizontal extent and descend into the country, stabilising the troposphere and creating an unfavourable environment for deep convection. We also find that extended breaks have stronger dry intrusions as precursors. This work provides a new perspective on the causal relationship between mid-level dry intrusions and breaks. The results could help improve forecasts of breaks, ultimately benefiting stakeholders in improving long-term planning.

How to cite: Deoras, A., Turner, A., Volonté, A., Schiemann, R., Wilcox, L., and Menon, A.: The role of dry intrusions in breaks of the Indian summer monsoon, EGU General Assembly 2025, Vienna, Austria, 27 Apr–2 May 2025, EGU25-2552, https://doi.org/10.5194/egusphere-egu25-2552, 2025.

The East Asian monsoon is one of the most important features in the global climate system. Understanding the variation and moisture sources of East Asian monsoon precipitation is crucial for improving land-atmosphere interactions, developing more accurate global climate models, and optimizing the region’s water management strategies. Monsoon precipitation is produced from both local moisture through evapotranspiration and remote moisture transported from oceans via large-scale circulation. This study investigates the relative contribution of local and remote moisture sources to total monsoon precipitation in East China using model outputs from 12 CMIP6 simulations. Simulations from the historical experiments of CMIP6 are selected for the period of 1950-2014. These 12 CMIP6 models are selected based on the availability of data related to convective precipitation and soil moisture. In this study, we focus on the percentage of convective precipitation in total monsoon precipitation and soil moisture-precipitation relationship in East China. East China is divided into five regions based on their climate conditions. Our analysis suggests a significant spatial and temporal variation in the contribution of local convective precipitation to overall monsoon precipitation among different models. On average, the Southeast region shows a higher percentage of convective precipitation and a stronger soil moisture-precipitation correlation than other regions. Additionally, the percentage of convective precipitation varies significantly between models. The findings from this analysis could offer insights for enhancing the development of future climate models.

How to cite: Meng, L.: Relative contribution of local and remote sources of moisture to East Asian monsoon precipitation in CMIP6 simulations, EGU General Assembly 2025, Vienna, Austria, 27 Apr–2 May 2025, EGU25-2584, https://doi.org/10.5194/egusphere-egu25-2584, 2025.

We present novel explainable deep learning techniques for reconstructing South Asian palaeomonsoon rainfall over the last 500 years, leveraging long instrumental precipitation records and palaeoenvironmental datasets from South and East Asia to build two types of models: dense neural networks (“regional models”) and convolutional neural networks (CNNs). The regional models are trained individually on seven regional rainfall datasets, and while they capture decadal-scale variability and significant droughts, they underestimate inter-annual variability. The CNNs, designed to account for spatial relationships in both the predictor and target, demonstrate higher skill in reconstructing rainfall patterns and produce robust spatiotemporal reconstructions. The 19th and 20th centuries were characterised by marked inter-annual variability in the monsoon, but earlier periods were characterised by more decadal- to centennial-scale oscillations. Multidecadal droughts occurred in the mid-17th and 19th centuries, while much of the 18th century (particularly the early part of the century) was characterised by above-average monsoon precipitation. Extreme droughts tend to be concentrated in southern and western India and often coincide with recorded famines. The years following large volcanic eruptions are typically marked by significantly weaker monsoons, but the sign and strength of the relationship with the El Niño–Southern Oscillation (ENSO) vary on centennial timescales. By applying explainability techniques, we show that the models make use of both local hydroclimate and synoptic-scale dynamical relationships. Our findings offer insights into the historical variability of the Indian summer monsoon and highlight the potential of deep learning techniques in palaeoclimate reconstruction.

How to cite: Hunt, K. and Harrison, S.: A novel explainable deep learning framework for reconstructing South Asian palaeomonsoons, EGU General Assembly 2025, Vienna, Austria, 27 Apr–2 May 2025, EGU25-2815, https://doi.org/10.5194/egusphere-egu25-2815, 2025.

EGU25-2958 | ECS | Posters on site | AS1.24

Indian Summer Monsoon rainfall changes beyond the 21st century 

Sahil Sharma, Kyung-Ja Ha, Keith Rodgers, Eui-Seok Chung, Sun-Seon Lee, and Arjun Babu Nellikkattil

Future rainfall changes in India are of paramount importance for crop production and water management, but to date, longer-term changes beyond the year 2100 have not been evaluated. Here, we leverage a 10-member extension of the CESM2 Large Ensemble under relatively strong emissions (SSP3-7.0) to identify projected rainfall changes and the underlying physical mechanism out to 2500. Our main finding is that after 2100, substantial changes occur in large-scale atmospheric circulation patterns, which are more pronounced and distinct from the changes projected over the 21st century. We test the hypothesis that under substantial thermal perturbations to the climate system after 2100, the increased atmospheric stability caused by the enhanced differential heating in the upper troposphere relative to land weakens the large-scale monsoonal circulation, while enhanced warming over the Tibetan Plateau causes a poleward shift in low-level monsoonal circulation and the climatological pressure belt. This projected shift promotes enhanced northward moisture transport, resulting in a strengthened anomalous ascending motion over northern India, ultimately leading to increased Indian summer monsoon rainfall post-2100. These changes reflect local expression of large-scale climate dynamical perturbations and provide a broader mechanistic framework for understanding long-term future climate change over India. 

How to cite: Sharma, S., Ha, K.-J., Rodgers, K., Chung, E.-S., Lee, S.-S., and Nellikkattil, A. B.: Indian Summer Monsoon rainfall changes beyond the 21st century, EGU General Assembly 2025, Vienna, Austria, 27 Apr–2 May 2025, EGU25-2958, https://doi.org/10.5194/egusphere-egu25-2958, 2025.

EGU25-3589 | Posters on site | AS1.24

Future South American monsoon changes are sensitive to Atlantic SST pattern changes 

Robin Chadwick, Peter Good, Jorge Garcia-Franco, Lincoln Alves, Neil Hart, Marcia Zilli, Herve Douville, Marion Saint-Lu, and Brian Medeiros

Future projections of South American Monsoon (SAM) precipitation from CMIP6
(Coupled Model Intercomparison Project phase 6) show a consistent drying during the early part
of the monsoon season (September to November), which is also seen in a convection-permitting
model simulation. Using a set of idealised atmosphere-only GCM experiments, this drying signal
is shown to be mainly driven by sea surface temperature (SST) changes: uniform SST warming
and patterned SST change. Different processes appear to be more important in different months
for the ensemble mean drying signal, with this primarily driven by SST pattern change in October
and by uniform SST warming in November. There is significant inter-model uncertainty in the
SAM precipitation response to each of these drivers, particularly SST pattern change. For uniform
SST warming, an existing hypothesis which suggests that SAM drying is driven by the enhanced
land-sea temperature contrast is tested, but we find that this process is not dominant. For patterned
SST warming, moderate inter-model correlations (across the coupled CMIP6 models) are found
between SAM precipitation change and changes in meridional and zonal Atlantic SST gradients.
In November, a combined zonal and meridional Atlantic SST gradient index can explain more than
half of CMIP6 inter-model uncertainty in SAM core region precipitation change.

How to cite: Chadwick, R., Good, P., Garcia-Franco, J., Alves, L., Hart, N., Zilli, M., Douville, H., Saint-Lu, M., and Medeiros, B.: Future South American monsoon changes are sensitive to Atlantic SST pattern changes, EGU General Assembly 2025, Vienna, Austria, 27 Apr–2 May 2025, EGU25-3589, https://doi.org/10.5194/egusphere-egu25-3589, 2025.

EGU25-3823 | ECS | Orals | AS1.24

Monsoonal mixed layer heat budget of the Indian Ocean: Understanding the biases in coupled forecast models. 

Aparna Anitha Reghunathan, Ben Webber, Adrian Matthews, Dan Copsey, and José Rodriguéz

The Indian Ocean plays an important role in modulating the global weather and climate. However, many state-of-the-art climate models can't predict the dynamically complex mechanisms of the Indian Ocean accurately. Studies show that the biases in the earlier versions of the Met Office Climate Model developed during the initial days of model simulation and persisted up to climate time scales. To investigate biases in the revised GC5 model, we analyzed 208 monthly forecasts initialized every five days from June to November (2018–2023). The spatial evolution of the SST biases over the Indian Ocean from these forecasts showed specific regions of warm and cold biases with up to a magnitude of ~ -1°C to 1°C. This regional bias formation is examined using the mixed layer heat budget analysis during the Indian summer and winter monsoons to understand the relative contribution of the various parameters in driving this variability. We have selected three warm SST bias regions, on the east coast of Africa, near the Indian Peninsula and on the west coast of Sumatra. The cold bias regions are in the northern Arabian Sea and on the west coast of Java. The primary analysis from the mixed layer heat budget shows that the warm and cold SST biases in the model are modulated mainly by some common parameters such as the net heat flux and total advection. However, further analysis showed that the total advection is more important in the warm bias regions. The vertical mixing term is also significant in generating cold SST biases and this can be a consequence of the positive wind speed biases in the model. Our study also concludes that even though the biases have comparable spatial and temporal magnitude and evolution, the parameters which modulate the SST variability have regional variations. Additionally, anomalously positive precipitation in the equatorial Indian Ocean and the west coast of India and a negative precipitation bias along the east coast of India were also identified. Hence removing these discrepancies in the SST might be crucial for accurately simulating the Indian monsoon. 

How to cite: Anitha Reghunathan, A., Webber, B., Matthews, A., Copsey, D., and Rodriguéz, J.: Monsoonal mixed layer heat budget of the Indian Ocean: Understanding the biases in coupled forecast models., EGU General Assembly 2025, Vienna, Austria, 27 Apr–2 May 2025, EGU25-3823, https://doi.org/10.5194/egusphere-egu25-3823, 2025.

EGU25-4614 | ECS | Orals | AS1.24

Investigation and Future Projection of Warm Rain During Winter Monsoon in Java Sea, Indonesia 

Wendi Harjupa and Eiichi Nakakita

This study investigates the characteristics and future trends of warm rain during the winter monsoon season (December, January, February; DJF) over Indonesia, with a focus on the Java Sea. The analysis integrates satellite observations from the Tropical Rainfall Measurement Mission (TRMM), reanalysis datasets (ERA5), and model simulations from the Atmospheric General Circulation Model (AGCM). An analysis of ERA5 data (1950–2009) reveals a pronounced upward trend in SST across the broader Indonesian region (slope 0.0070) and the Java Sea (slope 0.0094), with the most significant increases occurring during DJF. Cloud Liquid Water Content (CLWC), positively correlated with SST and rainfall, is used as a proxy for warm rain. TRMM satellite observations confirm that warm rainfall corresponds spatially with CLWC distribution. AGCM simulations effectively replicate observed CLWC patterns, showing strong alignment with TRMM data, particularly over western Indonesia, including the Java Sea. Convergence patterns derived from ERA5 and AGCM data exhibit similar trends, emphasizing the role of atmospheric convergence in CLWC formation over the Java Sea. An analysis of 95th percentile CLWC values at lower atmospheric levels (1000–700 hPa) highlights a significant increase in CLWC during DJF over the northwestern Indonesian region, including the Java Sea, across 30-year intervals spanning 150 years (1950–2099). These findings underscore the critical influence of the winter monsoon on warm rain processes in the Java Sea and its connection to extreme weather events, such as flooding in Jakarta, located on the southern coast of the Java Sea.

How to cite: Harjupa, W. and Nakakita, E.: Investigation and Future Projection of Warm Rain During Winter Monsoon in Java Sea, Indonesia, EGU General Assembly 2025, Vienna, Austria, 27 Apr–2 May 2025, EGU25-4614, https://doi.org/10.5194/egusphere-egu25-4614, 2025.

EGU25-5379 | ECS | Orals | AS1.24

Aerosol mitigation matters to future water availability in the global monsoon region 

Jie Jiang, Tianjun Zhou, and Wenxia Zhang

Water availability, as measured by precipitation minus evaporation (P-E), is projected to increase in the 21st century across global monsoon regions. However, while the impacts of increased greenhouse gas (GHG) concentrations are highlighted in existing studies, the contribution of reduced anthropogenic aerosol (AA) emissions is likely to be overlooked. Here, utilizing single-forcing projections under the SSP2-4.5 scenario, we elucidate the fingerprints of GHG and AA forcings on future P-E evolution. We reveal that the future wetting trend is primarily driven by an increase in P-E during the wet season. The escalation of GHG concentrations is projected to increase P-E over Asian-African monsoon domains while decreasing it over American monsoon domains. Conversely, aerosol reductions will drive a transition from current widespread drying to future wetting. While both the GHG increase and AA reduction can elevate atmospheric moistening through radiative warming, the disparate P-E responses come from dynamic processes that favor drying trends in American monsoon domains under GHG forcing. In contrast, strengthened monsoon circulations contribute to a wetting trend in Asian monsoon domains under AA reductions, attributable to greater interhemispheric thermal contrast. Our finding highlights the importance of considering aerosol mitigation in climate risk assessment for densely populated monsoon regions.

How to cite: Jiang, J., Zhou, T., and Zhang, W.: Aerosol mitigation matters to future water availability in the global monsoon region, EGU General Assembly 2025, Vienna, Austria, 27 Apr–2 May 2025, EGU25-5379, https://doi.org/10.5194/egusphere-egu25-5379, 2025.

Using 51 models of the AMIP and historical experiments of CMIP6, we investigate the inter-model diversity of atmospheric and coupled models in the strength of the Indian Summer Monsoon Rainfall (ISMR)–El Niño-Southern Oscillation (ENSO) relationship. In atmospheric models, the Walker Circulation (WC) intensity associated with the western Pacific convective activity is most responsible for the inter-model diversity. Models with strong WC have a strong ISMR–ENSO relationship via enhancing ENSO-induced anomalies of the WC and monsoon circulation. The secondary source is the monsoon circulation differences associated with meridional rainfall contrast over the Indian monsoon region. In coupled models, the primary (secondary) source is the ENSO amplitude (WC intensity). In observation, the decadal variation of WC can also explain the changes in the ISMR–ENSO relationship. This study provides a basis for improving the model performance and advances our understanding of the observed ISMR–ENSO relationship changes.

How to cite: Yu, S.-Y.: Sources of Inter-Model Diversity in the Strength of the Relationship Between the Indian Summer Monsoon Rainfall and El Niño-Southern Oscillation, EGU General Assembly 2025, Vienna, Austria, 27 Apr–2 May 2025, EGU25-5422, https://doi.org/10.5194/egusphere-egu25-5422, 2025.

EGU25-6038 | ECS | Posters on site | AS1.24

Distinct Characteristics of Active and Break Spells in Flood and Drought Years of the Indian Summer Monsoon  

Ritesh Jha, Ravi Nanjundiah, and Ashwin Seshadri

The Indian summer monsoon displays intraseasonal variability with alternating "active" (intense rainfall) and "break" (deficient rainfall) phases. Analysis of Indian Meteorological Department (IMD) daily rainfall data (1979–2020, June–September) over Central India (CI) shows that active spells are more frequent during flood years (4.6 events/year) than drought years (2.3 events/year), with similar durations (3–4 days). In contrast, break spells are more frequent and prolonged in drought years (3.9 events/year, 6–7 days, occasionally exceeding 10 days) compared to flood years (1.2 events/year, 3–4 days).  

 Composites of mean sea level pressure reveal distinct intraseasonal dynamics between flood and drought years. During flood years, positive pressure anomalies propagate northwestward from the Bay of Bengal, while in drought years, they propagate poleward and stagnate over Central India, reducing active spell frequency. Similarly, break spells exhibit westward-moving anomalies in flood years, whereas drought years are characterized by stationary anomalies and poleward propagation.  

 Intraseasonal oscillations (ISOs) derived from IMD rainfall data strongly influence active and break spells. Flood years are characterized by high-frequency ISOs (HF-ISOs) with westward propagation, enhancing active spells, while drought years are dominated by low-frequency ISOs (LF-ISOs) with poleward movement, leading to prolonged breaks. Over 90% of these spells align with HF-ISO in flood years and LF-ISO in drought years. Total column water composites reveal frequent midlatitude dry air intrusions during drought years, contributing to extended break spells. Moisture budget analysis indicates that differences in mean moisture advection by mean winds drive anomalies, with positive values during flood years and negative values during drought years. 

 K-means clustering reveals the relationship between ISO variability and seasonal rainfall through four clusters based on variance explained by LF-ISO and HF-ISO. The cluster with the strongest LF-ISO and weakest HF-ISO records the lowest rainfall (92% of the long-term mean), while the opposite cluster experiences the highest rainfall (112% of the long-term mean). These findings align with observed HF and LF ISO intensities during flood and drought years. Strong HF-ISO activity is associated with enhanced formation and northwestward propagation of low-pressure systems from the Bay of Bengal to Central India, contributing to above-normal rainfall. Additionally, the strong HF-ISO cluster features strong low-level westerlies supported by upper-level easterlies, alongside tropospheric conditions limiting dry air intrusion from midlatitudes. In contrast, low rainfall in the cluster with large LF-ISO variance coincides with low-level easterly anomaly, and concomitantly weaker moisture transport from the Arabian Sea (AS).  Clusters with maximum LF-ISO intensity feature mid-tropospheric high pressure over CI, reflecting downdrafts of dry, cold upper-level air that suppress convection and cause seasonal rainfall deficits. Midlatitude intrusions are observed in clusters with moderately strong LF-ISO intensity, accompanied by southeasterly winds northwest of CI. These intrusions are weaker, maintaining rainfall near the long-term mean.  

This study underscores the contrasting active and break spells during flood and drought years, highlighting the role of ISOs, atmospheric dynamics, and thermodynamic processes. 

How to cite: Jha, R., Nanjundiah, R., and Seshadri, A.: Distinct Characteristics of Active and Break Spells in Flood and Drought Years of the Indian Summer Monsoon , EGU General Assembly 2025, Vienna, Austria, 27 Apr–2 May 2025, EGU25-6038, https://doi.org/10.5194/egusphere-egu25-6038, 2025.

EGU25-6560 | ECS | Posters on site | AS1.24

Environmental features related to the decadal variation of South China Sea tropical cyclogenesis in the context of summer monsoon 

Yuhao Cai, Song Yang, Huan Wu, Weizhen Chen, and Juying Xu

This study investigates the changes in environmental conditions related to the decadal variation of genesis frequency of tropical cyclones (TCGF) over the South China Sea (SCS) during summer. Corresponding to the decadal increase in the TCGF, the seasonal mean anomalies of the genesis potential and environmental fields over the SCS are not favorable for tropical cyclogenesis, indicating their limited role in the decadal variation of SCS TCGF. It is found instead that the decadal change in tropical cyclogenesis over the SCS is more attributed to the local environmental fields associated with atmospheric intraseasonal oscillation (ISO). The decadal change in SCS TCGF is closely linked to the northward extension of ISO-related convection from the central SCS, which is contributed by the horizontal advection by background monsoon flow and the vertical advection by ISO-related vertical motions. Further analyses indicate that the anomalous upper-level cyclonic circulation over East Asia and the lower-level anticyclonic circulation over the western Pacific produce the unfavorable seasonal mean environmental fields in the SCS, whereas the resultant strong summer mean SCS monsoon flow facilitates the northward extension of ISO-related convection. This study highlights the importance of ISO activity for projections of the long-term change in SCS TC activity.


How to cite: Cai, Y., Yang, S., Wu, H., Chen, W., and Xu, J.: Environmental features related to the decadal variation of South China Sea tropical cyclogenesis in the context of summer monsoon, EGU General Assembly 2025, Vienna, Austria, 27 Apr–2 May 2025, EGU25-6560, https://doi.org/10.5194/egusphere-egu25-6560, 2025.

This study examines how the summertime Indian Ocean (IO) SST anomalies (SSTAs) affect the Indian Summer Monsoon (ISM) and its predictability in the El Niño developing years from the perspective of seasonal predictions of 1972 and 1997 when observed drastically different ISM states. The CFSv2-COLA ensemble seasonal reforecasts produce a successful ISM prediction in 1972 but a failed one in 1997. Our sensitivity experiments, in which the ocean and atmosphere are decoupled in the tropical IO with the prescribed SST, reveal that the erroneous prediction of cold IO SSTAs in 1997 exacerbates an El Niño-induced ISM drought and “correcting” these SST errors improves the ISM prediction substantially, whereas a good prediction of the summertime IO SSTAs contributes positively to the skillful ISM reforecast in 1972. It is also demonstrated that the warm IO SSTAs centered in the Arabian Sea in 1997 reduce sea-level pressures locally and steer the low-level anomalous winds to transport water vapor into the India. This regional process counters the El Niño-induced drought tendency and results in a nearly normal ISM that defies the historical El Niño-ISM relation. However, the warm SSTAs centered at the western equatorial IO in 1972 strengthen the anomalous Walker circulations originally set up by the developing El Niño in the Indo-Pacific domain, which further enhance the El Niño evolution and its teleconnection to the ISM. This inter-basin feedback process intensifies the typical El Niño-ISM relation. The spatial structure of the summer IO SSTAs may determine whether the IO regional process or the inter-basin process prevails. 

How to cite: Shin, C.-S.: Influences of the Indian Ocean SST on the Indian Summer Monsoon and its Seasonal Prediction in El Niño Developing Years , EGU General Assembly 2025, Vienna, Austria, 27 Apr–2 May 2025, EGU25-7074, https://doi.org/10.5194/egusphere-egu25-7074, 2025.

Large mountain regions influence local- and global-scale atmospheric flow through mechanical forcing and changes in temperature and pressure fields. The topography of High-Mountain Asia (HMA), for example, is critical for the development of important characteristics of the Indian Monsoon. In this study, global climate model sensitivity experiments are applied to quantify the magnitude and geographical extent of the effects of HMA topography on Northern Hemisphere atmospheric flows. A series of ECHAM5-wiso (climate model) experiments were set up, in which HMA topography is reduced incrementally by 25% of its current height. All other boundary conditions, such as greenhouse gas concentrations and ice cover, are kept constant. The impact of the simulated topographic changes on the Eurasian Wave Train (EWT), which is critical for Northern Hemisphere atmospheric transport, is evaluated by examining the loading patterns from empirical orthogonal functions analyses conducted on the simulated pressure and wind fields. The impact of HMA topography on the intensity and extent of meridional flow in South Asia is assessed by examining wind speeds at different pressure levels. Changes in the EWT are particularly prominent in (Central) Asia. These may be attributed to the significant changes in pressure fields west of the Tibetan Pleateau as the topography in the HMA region is varied. Furthermore, increasing HMA topography from 0% to 100% significantly increases 1) average meridional summer wind speeds (by ≤10 m/s) at the 200hPa and 1000hPa levels, and 2) the extent of northward, monsoonal flow over the Indian subcontinent. The simulations only predict notable northward flow over western and northern India in summer if HMA topography is set to 50% of its modern height. The flow’s northeastern extent is restricted to 25°N-65°E in the absence of HMA topography, but reaches 33°N-75°E when it is fully developed.

How to cite: Mutz, S. G.: The Effect of High-Mountain Asia Topography on Northern Hemisphere Atmospheric Flow, EGU General Assembly 2025, Vienna, Austria, 27 Apr–2 May 2025, EGU25-7283, https://doi.org/10.5194/egusphere-egu25-7283, 2025.

EGU25-9304 | ECS | Orals | AS1.24

Indian Summer Monsoon Onset Delayed by the Weakening of Hadley Circulation  

Vaishnavi Wadhai, Balaji Senapati, and Mihir Kumar Dash

The timing of the Indian Summer Monsoon (ISM) onset significantly impacts agriculture, food production, the economy, and livelihoods in India. Parker et al. (2016) highlighted the role of both mid-level dry northwesterly winds and low-level moist southwesterly winds in influencing the climatological ISM onset. However, the question of what drives the delay in ISM onset remains unclear and uncertain. Is it primarily due to mid-level dry northwesterly winds, low-level moist southwesterly winds, or a combination of both? In this study, we find that the weakening of low-level moist southwesterly winds is the primary factor, while the mid-level dry northwesterly winds remain unaltered during delayed onset years. This weakening of southwesterly winds is associated with the low-level circulation anomaly caused by the anomalous high pressure over the Arabian Sea, which is further linked to the weakening of the Hadley circulation. The relatively low pressure over the Mascarene High reduces the cross-equatorial pressure gradient, weakening the Hadley circulation, which in turn weakens the southwesterly winds, thereby delaying the ISM onset. Understanding the underlying mechanisms of delayed monsoon onset provides critical insights for improving Indian monsoon modelling and prediction. 

How to cite: Wadhai, V., Senapati, B., and Dash, M. K.: Indian Summer Monsoon Onset Delayed by the Weakening of Hadley Circulation , EGU General Assembly 2025, Vienna, Austria, 27 Apr–2 May 2025, EGU25-9304, https://doi.org/10.5194/egusphere-egu25-9304, 2025.

EGU25-10023 | ECS | Posters on site | AS1.24

Understanding the Uncertainty in the West African Monsoon Precipitation Response to Increasing CO2 

Harry Mutton, Robin Chadwick, Matthew Collins, F. Hugo Lambert, Christopher Taylor, Ruth Geen, Hervé Douville, and Marion Saint-lu

The West African Monsoon (WAM) precipitation response to increased CO2 is uncertain, with both large increases and decreases predicted by  CMIP6 models. To address this, the full impact of increased CO2 has been decomposed into several drivers, three of which are shown to contribute most to  the uncertainty in WAM precipitation; the direct radiative effect of increased CO2, the impact of a uniform Sea Surface Temperature (SST) warming, and the impact of a patterned SST change. Much of the uncertainty associated with the response to the direct radiative effect and uniform SST warming is shown to be related to differing changes in 700hPa moisture flux divergence associated with the shallow meridional circulation over West Africa as well as differences in a soil moisture - surface heat flux feedback over the Sahel. For the SST pattern effect, the difference between North Atlantic SSTs as well as inter-hemispheric gradients in surface temperatures are key drivers of intermodel spread.

How to cite: Mutton, H., Chadwick, R., Collins, M., Lambert, F. H., Taylor, C., Geen, R., Douville, H., and Saint-lu, M.: Understanding the Uncertainty in the West African Monsoon Precipitation Response to Increasing CO2, EGU General Assembly 2025, Vienna, Austria, 27 Apr–2 May 2025, EGU25-10023, https://doi.org/10.5194/egusphere-egu25-10023, 2025.

EGU25-10438 | Orals | AS1.24

Attribution of the Extreme Drought Event over the Yangtze River Valley in China 

Lixia Zhang, Tianjun Zhou, Xing Zhang, Wenxia Zhang, Lijuan Li, and Laurent Li

Global warming has led to the intensification and increased frequency of drought events. Determining the extent to which these events are influenced by human activities is critical for developing effective strategies to address climate change. However, detecting human impacts and providing robust attribution results remain key challenges in drought research. In the summer of 2022, the Yangtze River Valley of China experienced an unprecedented extreme drought, marked by record-high surface temperatures and record-low precipitation over the past 60 years. This event caused substantial socio-economic and ecological disruptions. To assess the role of anthropogenic climate change in the intensity and frequency of such events, this study established an attribution framework based on GAMIL3.0. This study evaluated anomalies in surface temperature, precipitation, and large-scale circulation patterns during the summer of 2022. Results indicate that human activities have intensified the Western North Pacific Subtropical High and South Asian High, increasing their strength and frequency and thereby amplifying the intensity and likelihood of extreme drought events in the Yangtze River Valley. Anthropogenic forcing contributed to an additional 0.8°C rise in surface temperature (95% confidence interval: 0.1–1.5°C) and a 7.9% reduction in precipitation (-24.1% to 7.8%) during the 2022 summer. The anthropogenic forcing increased the probability of surface temperature anomalies associated with such an extreme drought event like 2022 by 1300 times (range: 87–3,001) and precipitation anomalies by 65 times (range: 1–90). This study highlights the urgent need to strengthen adaptive capacities to mitigate the impacts of extreme drought in the Yangtze River Valley.

How to cite: Zhang, L., Zhou, T., Zhang, X., Zhang, W., Li, L., and Li, L.: Attribution of the Extreme Drought Event over the Yangtze River Valley in China, EGU General Assembly 2025, Vienna, Austria, 27 Apr–2 May 2025, EGU25-10438, https://doi.org/10.5194/egusphere-egu25-10438, 2025.

The Hengduan Mountains region (HM), located in the Eastern Tibetan Plateau, is renowned for its rich biodiversity. High-resolution climate data from past periods are essential for gaining deeper insights into the ecological and evolutionary processes that have shaped this unique and diverse region. In this study, we applied the non-hydrostatic limited-area model COSMO, with a resolution of 12 km over East Asia, to simulate two distinct climatic periods: the mid-Pliocene (~3 Ma), representing a warmer period, and the Last Glacial Maximum (LGM; ~21 ka), a colder period, both compared to present-day conditions.

Our results reveal that, despite contrasting changes in moisture supply, both warm and cold periods experienced a weakened Indian summer monsoon, attributed to the exposure of the Indochina continental shelf during these times—caused by sea-level drops during the LGM and dynamic topography during the mid-Pliocene. During the mid-Pliocene, an earlier northward migration of the Western Jet led to an earlier onset of the Indian summer monsoon and a wetter spring in the HM. In contrast, the HM experienced increased precipitation during the LGM in both summer and winter. Increased summer precipitation was driven by enhanced moisture supply from the south, while enhanced winter precipitation, primarily in the form of snowfall at high elevations, was associated with more unstable atmospheric stratification.

The local precipitation characteristics of the HM are thus influenced by the interplay between large-scale atmospheric dynamics and regional topographical features such that, in contrast to most mid-latitude regions, the HM did not experience drying and wetting during glacial-interglacial cycles. The stability of mean precipitation across different climatic periods likely played a pivotal role in supporting the HM's high biodiversity, providing a stable and moist environment conducive to supporting diverse ecosystems.

How to cite: Xiang, R., Steger, C. R., Willett, S. D., and Schär, C.: Influence of Asian Monsoon Dynamics on Precipitation Characteristics of the Eastern Tibetan Plateau in Cold and Warm Climates: Insights from a Regional Climate Model, EGU General Assembly 2025, Vienna, Austria, 27 Apr–2 May 2025, EGU25-13143, https://doi.org/10.5194/egusphere-egu25-13143, 2025.

Analysis of ground-based and remotely retrieved precipitation data reveals that heavy Meiyu precipitation events (HMPEs) produce a relatively independent rain-belt over eastern China. A rotating calipers algorithm is applied to quantify the spatial scales of HMPEs. We find that HMPEs have regular spatial scales with an average length, width and extent of about 1400 km, 500 km and 40.00 × 10⁴ km2, respectively, through a comprehensive assessment of different types of HMPE, illustrating that HMPEs have a size similar to that of the sub-synoptic-scale Meiyu front (1500–2000 km). Convective activities along the Meiyu front zone and the upper westerly jet stream strongly affect the position and orientation of rain-belts of HMPEs. The Meiyu front zone, strong vertical motions and large transport of warm moisture have a comparable spatial scale to the HMPE rain-belts over eastern China.

How to cite: Du, Y., Xie, Z., and Miao, Q.: Spatial Scales of Heavy Meiyu Precipitation Events in Eastern China and Associated Atmospheric Processes, EGU General Assembly 2025, Vienna, Austria, 27 Apr–2 May 2025, EGU25-13901, https://doi.org/10.5194/egusphere-egu25-13901, 2025.

EGU25-13961 | ECS | Orals | AS1.24

Timescale-dependent fingerprint of the Asian Summer Monsoon during the last Glacial and its impact on vegetation 

Nils Weitzel, Martina Stebich, Moritz Adam, Jens Mingram, and Kira Rehfeld

The Asian Summer Monsoon is fundamental for the water supply of billions of people. It has undergone major changes over the Pleistocene in response to greenhouse gas and ice sheet forcing during glacial-interglacial transitions, orbital forcing from varying obliquity and precession, and millennial-scale shifts in the ocean circulation. Yet, the spatial fingerprint of these variations and their impact on local vegetation remain uncertain. Here, we present vegetation and climate reconstructions from a pollen record in Northeastern China covering the last 70kyr with unprecedented sub-centennial resolution. During the last Glacial, its position at the ecotone between cool mixed forest and steppe led to pronounced local vegetation changes, most likely driven by varying moisture availability. The vegetation changes occur synchronously with oxygen isotope variations in Chinese speleothems. However, the timescale-dependent contributions to the total variability differ between our precipitation reconstruction and the isotope record. A regional analysis of high-resolution proxy records covering the last Glacial supports comparatively stronger contributions from orbital-scale variability along the northern monsoon edge and from millennial-scale variability in India and Southern China. This suggests that orbital forcing and Atlantic Meridional Overturning Circulation (AMOC) variations possess distinct spatial fingerprints. Climate simulations indicate that the differences are driven by stronger North Pacific sea surface temperature changes in response to orbital forcing compared to AMOC shifts. The detected spatial heterogeneity of past monsoon variations can provide valuable insights into potential regional impacts of future monsoon changes.

How to cite: Weitzel, N., Stebich, M., Adam, M., Mingram, J., and Rehfeld, K.: Timescale-dependent fingerprint of the Asian Summer Monsoon during the last Glacial and its impact on vegetation, EGU General Assembly 2025, Vienna, Austria, 27 Apr–2 May 2025, EGU25-13961, https://doi.org/10.5194/egusphere-egu25-13961, 2025.

EGU25-14693 | ECS | Posters on site | AS1.24

Leading mode and physical dynamics of spring-to-summer rainfall evolution in eastern China 

Ruoyu Ma, Yue Zhang, and Chao He

Eastern China experiences substantial precipitation variability, primarily driven by the East Asian monsoon system, which is characterized by the stepwise northward progression of rainfall belt. The movement of the rainfall belt has significant socio-economic implications, necessitating precise forecasting to mitigate the risks associated with extreme weather events. This study employs Seasonal Empirical Orthogonal Function (S-EOF) analysis to examine precipitation variations, focusing on the transition of rainfall belt from spring (April-May) to summer (June-July). The results reveal that the northward shift of rainfall belt during the spring-to-summer period is strongly linked to variations in the East Asian Summer Monsoon activity. The leading mode exhibits a center of maximum rainfall in South China (SC) during spring, shifting to the middle and lower reaches of the Yangtze River basin (MLYZB) in summer, which emphasizes the spatial progression of rainfall patterns between these regions. In positive phase years, enhanced precipitation in SC during spring is related to increased moisture transported by an anomalous anticyclonic circulation over the western North Pacific (WNP). Subsequently, during summer, the enhanced rainfall moves to MLYZB along with the northward migration of the anomalous anticyclone in WNP. During negative phase years, precipitation markedly reducing in the two regions, mainly due to an anomalous cyclonic circulation over the WNP obstructs the influx of moisture from the Pacific. In summer, a cyclonic circulation over the South China Sea redirects moisture from the Indian Ocean to SC, resulting in reduced precipitation in the MLYZB. These large-scale atmospheric circulation patterns also indicate that the dominant transition of rainfall from spring to summer in eastern China can be associated with the monsoonal dynamics in the Bay of Bengal during spring. In particular, anomalous Bay of Bengal Summer Monsoon (BOBSM) activity triggers atmospheric convective heating and amplifies soil moisture anomalies in the Indochina Peninsula, thereby influencing and modulating rainfall patterns over eastern China. To further elucidate the mechanisms underlying this influence, numerical experiments are conducted to investigate the detailed processes through which BOBSM impacts the seasonal transition of rainfall in eastern China. In conclusion, this study can offer significant theoretical insights that enhance precipitation forecasting and inform extreme weather analysis.

How to cite: Ma, R., Zhang, Y., and He, C.: Leading mode and physical dynamics of spring-to-summer rainfall evolution in eastern China, EGU General Assembly 2025, Vienna, Austria, 27 Apr–2 May 2025, EGU25-14693, https://doi.org/10.5194/egusphere-egu25-14693, 2025.

EGU25-17038 | ECS | Orals | AS1.24

The role of convection-circulation coupling in expediting South Asian monsoon onset: Insights from SP-CAM 

Yung-Jen Chen, Yen-Ting Hwang, Wei-Ting Chen, Chien‐Ming Wu, and Ding‐Rong Wu

This study emphasizes the role of shallow circulation in transporting lower-level moist static energy northward, thereby intensifying the onset of summer cross-equatorial circulation in the South Asia monsoon region. Previous research has suggested that the monsoon onset can be considered as a transition between an eddy-driven regime and an angular-conserving regime, and momentum budget analyses from these studies support the theory of regime transition (Bordoni and Schneider 2008; Plumb 2005; Geen et al. 2018; Shaw 2014). Additionally, studies have highlighted the significant role of boundary layer entropy during the summer monsoon period (Emanuel 1995; Plumb 2005; Nie et al. 2014), when the circulation operates within the angular-momentum-conserving regime. Adopting this boundary-layer-entropy-centric perspective, many studies emphasizing the role of topography in blocking low entropy inflow from the north and intensifying the South Asian Monsoon (Boos and Kuang 2010; Privé and Plumb 2007; Geen et al. 2014). Meanwhile, the role of synoptic systems and the early onset in the Bay of Bengal (Parker et al. 2016), as highlighted in observational data, in establishing the strong cross-equatorial summer cell remains unclear.

To bridge the gaps between observational studies and theoretical frameworks, this study investigates the mechanisms shaping the evolution of the boundary layer entropy throughout the regime transition. With the goal of understanding the interactions between convective processes and large-scale circulation, we utilize the Superparameterized Community Atmosphere Model (SPCAM), which demonstrates higher convection variability and increased precipitation near the South Asian coastal region compared to traditional global climate models, aligning well with observational data. Compared to simulations without SPCAM coupling, the SPCAM simulations show a more abrupt monsoon onset in South Asia. The sector zonal mean analysis demonstrates that the higher convection variability in SPCAM runs results in more shallow convections before the monsoon onset. Also, the shallow circulation accompanied with these shallow convections can transport higher lower-level entropy northward, causing energy convergence near the coastal region and intensifying the abruptness of the monsoon onset. In contrast, simulations without SPCAM coupling exhibit an unrealistic jump of boundary layer entropy maximum from the equator to the mountainous terrain. Our energy budget analysis highlights that the shallow overturning cell associated with the deep and shallow convections in the coastal regions holds the key for the northward migration of boundary layer entropy maximum. Such a relaxed quasi-equilibrium perspective provides an interpretation for how convection-circulation coupling contributes to the theoretical framework of regime transition.

How to cite: Chen, Y.-J., Hwang, Y.-T., Chen, W.-T., Wu, C., and Wu, D.: The role of convection-circulation coupling in expediting South Asian monsoon onset: Insights from SP-CAM, EGU General Assembly 2025, Vienna, Austria, 27 Apr–2 May 2025, EGU25-17038, https://doi.org/10.5194/egusphere-egu25-17038, 2025.

EGU25-17380 | ECS | Posters on site | AS1.24

Neogene paleoclimatic evolution in Northwestern Luzon, Philippines: Insights from Lower Miocene to Lower Pliocene sedimentary records 

Kenneth Jan Sangalang, Mark Joshua Novero, Jillian Aira Gabo-Ratio, Betchaida Payot, Carla Dimalanta, Mariz Alcancia, Karl Jabagat, and Yuan-Hsi Lee

Geochemical analyses of Neogene clastic sediments overlying the Zambales Ophiolite Complex (ZOC) in northwestern Luzon, Philippines provide insights into paleoweathering and paleoclimatic conditions. This study examines the Early Miocene Cabaluan Formation and Late Miocene to Early Pliocene Santa Cruz Formation using weathering proxies, such as the Chemical Index of Alteration (CIA), Revised Chemical Index of Alteration (CIX), Chemical Index of Weathering (CIW), and dual-elemental ratios (e.g., Al/Ti, Sc/Ti, Na/Al). Elevated CIA, CIX, and CIW values in the Cabaluan Formation indicating intense weathering suggests warm and wet conditions during the Early Miocene. Conversely, lower values and reduced Al/Ti and Sc/Ti ratios in the Santa Cruz Formation reflect a shift to cool and dry conditions at the onset of the Late Miocene period. 

These findings align with regional patterns derived from similar geochemical proxies and δ18-O values in the northern South China Sea and global climatic cooling trends during the Neogene. They also highlight the influence of the East Asian Summer Monsoon (EASM) on the prevailing local weathering regime, supported by mobility indices (αᴬˡE) showing distinct elemental depletions and enrichments linked to climatic variations.

This study contributes to the scarce but growing paleoclimate studies in the Philippines using geochemical signatures in the sedimentary record. It provides a pioneering view into the Neogene paleoclimatic shift from a warm to cool climate in northwestern Luzon, Philippines, underscoring the influence of the EASM in the local and regional climatic evolution since the Early Miocene.

How to cite: Sangalang, K. J., Novero, M. J., Gabo-Ratio, J. A., Payot, B., Dimalanta, C., Alcancia, M., Jabagat, K., and Lee, Y.-H.: Neogene paleoclimatic evolution in Northwestern Luzon, Philippines: Insights from Lower Miocene to Lower Pliocene sedimentary records, EGU General Assembly 2025, Vienna, Austria, 27 Apr–2 May 2025, EGU25-17380, https://doi.org/10.5194/egusphere-egu25-17380, 2025.

EGU25-18478 | ECS | Orals | AS1.24

Precipitation extremes during Madden Julian Oscillation over India 

Akanksha Sharma, Pyarimohan Maharana, and Ashok Priyadarshan Dimri

The Madden-Julian oscillation (MJO) is the predominant ocean-atmospheric phenomenon that influences the intraseasonal variabilities in the tropical atmosphere and is associated with weather extremes across the globe. This study aims to investigate the influence of MJO on extreme precipitation during Indian summer monsoon over India using ERA5 reanalysis data from 1974 to 2022. The MJO phases are calculated following Wheeler & Hendon, (2004) methodology which utilizes variables outgoing longwave radiation (OLR), zonal wind at 200hPa and 850hPa in the near-equatorial region between 15°S and 15°N. 99th percentile is used as a threshold to identify extreme precipitation. The study employs the Theil Sen slope trend test and Pettitt test for change point detection to study extremes. Further the OLR, vertically integrated moisture divergence (VIMD), and zonal wind at 850hPa are examined to study the change in dynamics. The preliminary results suggest that active phases 3 and 4 shows positive trend of extreme precipitation over southern northwest, west central and Peninsular India while active phase 2 and inactive phases 6 and 7 shows overall positive trend except for northeast India. Apart from extreme precipitation, frequency of extremes has also increased in phases 1, 2, 4, and 5. The change point analysis indicates these changes are observed after 1997. The percentage change of VIMD after change point show increased moisture availability in inactive phases which is evidently due to enhanced convective activity in recent times as also suggested by OLR. Overall, the study contributes in understanding the pattern of extremes over Indian landmass which will helps in predicting and mitigating the effect of severe weather.

How to cite: Sharma, A., Maharana, P., and Dimri, A. P.: Precipitation extremes during Madden Julian Oscillation over India, EGU General Assembly 2025, Vienna, Austria, 27 Apr–2 May 2025, EGU25-18478, https://doi.org/10.5194/egusphere-egu25-18478, 2025.

EGU25-18490 | Orals | AS1.24

How can we narrow down the uncertainty in Afro-Asian monsoon projection? 

Tianjun Zhou and Ziming chen

The Afro-Asian summer monsoon (AfroASM) sustains billions of people living in many developing countries covering West Africa and Asia, vulnerable to climate change. Future increase in AfroASM precipitation has been projected by current state-of-the-art climate models, but large inter-model spread exists. Here we show that the projection spread is related to present-day interhemispheric thermal contrast (ITC). Based on 30 models from the Coupled Model Intercomparison Project Phase 6 (CMIP6), we find models with a larger ITC trend during 1981-2014 tend to project a greater precipitation increase. Since most models overestimate present-day ITC trends, emergent constraint indicates precipitation increase in constrained projection is reduced to 70% of the raw projection, with the largest reduction in West African (49%). The land area experiencing significant increases of precipitation is 57% of the raw projection. Given that the emergent constraint improves the reliability in AfroASM precipitation projections, we further investigate the impacts of the constrained projection on the potential water availability. The fractions of land area that will experience a significant increase of potential water availability are about 66% of the raw projection. We find that global surface air temperature warming plays a dominant role in the emergent constraint on precipitation changes, while the contribution from hydrological sensitivity should not be neglected. The smaller increase of potential water availability in the constrained projection than the raw projection may pose a challenge to climate change adaptation and mitigation activities related to water management and food security, although a smaller than expected increase in rainfall will also reduce the risk of extreme precipitation and flooding.

How to cite: Zhou, T. and chen, Z.: How can we narrow down the uncertainty in Afro-Asian monsoon projection?, EGU General Assembly 2025, Vienna, Austria, 27 Apr–2 May 2025, EGU25-18490, https://doi.org/10.5194/egusphere-egu25-18490, 2025.

EGU25-20535 | Orals | AS1.24

Role of large and local scale drivers in the recent rise in heavy precipitating events over western India 

Ayantika Deychoudhury, Sumit Kumar Mukherjee, Krishnan Raghavan, and Dipanjan Dey

Over the recent decades, the South Asian monsoonal environment has evolved, leading to a rise in heavy precipitation events over the Indian subcontinent. These events have increased in frequency and intensity, particularly over Western India since the 1980s. The present study employs Self-Organizing Map (SOM) clustering to examine atmospheric patterns associated with heavy rainfall over Western India, identifying two key clusters, which have shown a significant rise in occurrence since the 1970s. The first cluster is marked by a large-scale mid-level vortex stretching from the Bay of Bengal to the Arabian Sea, driven by strong easterly anomalies and low-pressure systems (LPS) along central India. In contrast, the other cluster is manifested as a localized system centred over Western India, with low geopotential heights and LPS activity, supported by moisture from the Arabian Sea and regional land evaporation. The development of the first pattern is linked to remote influences such as Indian Ocean Dipole (IOD) events, while local soil moisture conditions influence the second pattern. This study underscores the complex interactions between large-scale dynamics, land-atmosphere coupling, and extreme weather patterns, highlighting the need for enhanced understanding of multis-scale interactions and increased observational networks to improve predictions and management of hydrological extremes in Western India.

How to cite: Deychoudhury, A., Kumar Mukherjee, S., Raghavan, K., and Dey, D.: Role of large and local scale drivers in the recent rise in heavy precipitating events over western India, EGU General Assembly 2025, Vienna, Austria, 27 Apr–2 May 2025, EGU25-20535, https://doi.org/10.5194/egusphere-egu25-20535, 2025.

Understanding the dynamics of precipitation in the western Himalayas (WH) during the Indian Summer Monsoon (ISM) is vital for societal well-being and effective disaster management. The region's complex terrain, diverse meteorological conditions, and observational uncertainties pose significant challenges in comprehending precipitation disparities and predicting extreme precipitation events (EPEs) across the WH. The present study provides a comprehensive investigation into the characteristics, drivers, and variability of summer monsoon precipitation, with a focus on EPEs and their underlying mechanisms in the WH. The findings reveal that EPEs, over the WH, defined as precipitation exceeding the 99th percentile, are influenced by both large-scale (61%) and convective precipitation (39%). Monsoon depressions contribute to 25.49% of these events. Atmospheric patterns such as upper-tropospheric gyres, zonal waves, and omega-type blocking emerge as key precursors, facilitating the southward extension of moisture-laden winds and enhancing low-level moisture convergence. The tropical-extratropical interactions, including the shifting of the Intertropical Convergence Zone and baroclinic wave activity characterized by zonal wave numbers 5 and 8, play a crucial role in intensifying EPE. Furthermore, High-resolution simulation using WRF demonstrate improved representation of spatiotemporal precipitation patterns, interannual variability, and EPEs compared to observational datasets. Overall, this study provides valuable scientific insights into the complex interactions governing precipitation extremes in the Himalayas. The findings enhance the understanding of ISM precipitation variability and improve the ability to predict and mitigate the impacts of extreme events in the region.

Keywords: Western Himalayas, Indian Summer Monsoon, Extreme Precipitation Events, Physical Drivers

How to cite: Saini, R. and Attada, R.: Deciphering Characteristics, Variability, and Drivers of Summer Monsoon Precipitation and Extremes over the Western Himalayas, EGU General Assembly 2025, Vienna, Austria, 27 Apr–2 May 2025, EGU25-20634, https://doi.org/10.5194/egusphere-egu25-20634, 2025.

CL3.2 – Future Climate – Climate and Society

EGU25-148 | Orals | CL3.2.1

A prudent planetary boundary for geological carbon storage 

Matthew Gidden, Siddharth Joshi, John Armitage, Alina-Berenice Christ, Miranda Boettcher, Elina Brutschin, Alex Koberle, Hans Joachim Schellnhuber, Carl-Friedrich Schleussner, Keywan Riahi, and Joeri Rogelj

Storing carbon for centuries to millennia in geological formations will be required if the world is to achieve net-zero CO2 emissions, and an even more critical feature of mitigation strategies if net negative CO2 or net-zero greenhouse gas emissions are to be achieved in order for global mean surface temperature to decline. The technical potential for carbon storage is commonly assumed to be vast, with estimates of available storage of around 10,000-40,000 Gt CO2 in the scientific literature. We reassess that assumption, providing a new spatially explicit estimation of carbon storage potential in sedimentary basins consistent with the principle of harm prevention which can help guide policy makers when updating their climate pledges and stay within safe planetary boundaries. 


We begin with current estimates of sedimentary basin volume and systematically apply a number of prudent, precautionary spatial and volumetric risk exclusions. These include minimum depths of ~1 km to ensure cap rock seal, maximum depths of ~2.5 km to avoid bedrock and limit potential seismic activation of deep rooted faults, areas with more than “moderate” historic seismic activity, environmental protection areas including the polar circles, offshore areas with >300m water depth based on current practices in the oil and gas industry, and built-up areas of human settlement under a high-population future scenario. Combining all of our risk spatial layers, we find that global storage potential declines from 11,314 Gt GO2 to 1,550 Gt CO2 of which 70% is onshore. 


We classify countries into four categories combining their historical contributions to cumulative emissions and their available prudent carbon storage potential. We find that number of countries with strong per-capita contributions to historical emissions also can potentially play a strong role in storing carbon in the future (e.g., USA, Australia, Saudi Arabia) whereas others have a strong responsibility but low storage capacity (e.g., the EU) implying the need to utilize storage outside their borders.


We then compare our prudent storage potential with mitigation pathways assessed by the IPCC. We find that, if carbon storage injection rates were to be held constant at their respective levels at the time of CO2 net-zero, scenarios in line with the 1.5C limit of the Paris Agreement would allow for approximately 250 years of continued storage time, whereas scenarios with a 50% chance of limiting warming to 2C would have approximately 100 years of storage capacity remaining. However, scenarios in general tend to increase their use of storage beyond net-zero CO2 in order to counterbalance continued fossil fuel use or to draw down temperature levels beyond their peak. Extrapolating geologic storage usage forward, we find that nearly all IPCC-assessed scenarios limiting warming to 2C or less would reach our assessed planetary boundary before the year 2200.


Our analysis has broad implications for national mitigation plan development and suggests a need for countries to explicitly state their plans for geologic carbon storage as they develop the next round of their Nationally Determined Contributions.

How to cite: Gidden, M., Joshi, S., Armitage, J., Christ, A.-B., Boettcher, M., Brutschin, E., Koberle, A., Schellnhuber, H. J., Schleussner, C.-F., Riahi, K., and Rogelj, J.: A prudent planetary boundary for geological carbon storage, EGU General Assembly 2025, Vienna, Austria, 27 Apr–2 May 2025, EGU25-148, https://doi.org/10.5194/egusphere-egu25-148, 2025.

EGU25-745 | ECS | Orals | CL3.2.1

Impact of timing differences in achieving emissions targets on global heatwaves 

In-Hong Park and Sang-Wook Yeh

Achieving carbon neutrality is a great challenge, and the pathways to this goal are critical. However, it is still uncertain how the climate system will respond to different pathways for achieving carbon neutrality, including the timing of achieving the goal, whether quickly or slowly. Here, we analyze the mean and extreme climate responses under fast (SSP5-8.5) and slow (SSP1-2.6) achievement of the Paris Agreement target (2.0C), based on a linear relationship between cumulative CO2 emissions and global mean surface temperature. Results from CMIP6 multi-model simulations show a difference of about 20 years between the two scenarios, with insignificant differences in global mean surface warming between the fast scenario (SSP5-8.5) and the slow scenario (SSP1-2.6). However, there are significant regional differences, particularly in land temperature. Furthermore, these differences in achieving timing have also affected the degree of exposure to heat waves, with clear regional differences in heat wave exposure. We will discuss the physical mechanisms involved, as well as the differences in regional climate responses to extremes and averages.

How to cite: Park, I.-H. and Yeh, S.-W.: Impact of timing differences in achieving emissions targets on global heatwaves, EGU General Assembly 2025, Vienna, Austria, 27 Apr–2 May 2025, EGU25-745, https://doi.org/10.5194/egusphere-egu25-745, 2025.

EGU25-4158 | ECS | Orals | CL3.2.1

Unpacking the bottlenecks of deploying Direct Air Capture at scale 

Leonardo Chiani, Pietro Andreoni, Laurent Drouet, Katrin Sievert, Tobias Schmidt, Bjarne Steffen, and Massimo Tavoni

Pathways limiting global warming to well below two degrees presume the transition to low-carbon energy sources and deployment of carbon dioxide removal technologies. Among these technologies, the modeling literature consistently shows the value of direct air capture (DAC) for achieving climate stabilization in the long run. DAC offers unique advantages from a policy perspective: it is modular, less land-intensive than many comparable technologies, and enables straightforward accounting of removed emissions. However, as a novel technology, significant uncertainties remain about the barriers to scaling DAC, especially for what concerns the financial and economic viability of supporting policies and their capacity to develop DAC at scale. In this study, we explore the sensitivity of DAC deployment in an ambitious but realistic mitigation pathway (the long-term strategies committed by all major economies, or LTS) using a detailed-process Integrated Assessment Model, WITCH, across four dimensions of uncertainty: technological characteristics, financing, market requirements, and policy environments. We use recently developed probabilistic estimates to endonegize technological learning in DAC. We focus on the global level and on two time periods, namely 2025-2050, the critical moment for DAC deployment at scale, and 2050-2075, the moment where most of the net-zero goals are set. Using formal methods in statistics and sensitivity analysis, we analyze the amount of removed emissions, the energy and storage consumption, as well as the cost of the policy.

How to cite: Chiani, L., Andreoni, P., Drouet, L., Sievert, K., Schmidt, T., Steffen, B., and Tavoni, M.: Unpacking the bottlenecks of deploying Direct Air Capture at scale, EGU General Assembly 2025, Vienna, Austria, 27 Apr–2 May 2025, EGU25-4158, https://doi.org/10.5194/egusphere-egu25-4158, 2025.

EGU25-4714 | ECS | Posters on site | CL3.2.1

Leveraging Internal Carbon Pricing (ICP) for Financial Institutions: A Framework for Aligning Profitability with decarbonization objectives. 

Iwen Liu, Tsai-Chia Tsai, Chai-Yi Chuang, Jung-Hsuan Tsao, and Hsin Hui You

This study reveals the potential of internal carbon pricing (ICP) as an essential tool for financial institutions to align their profitability goals with carbon reduction targets. The research aims to establish a practical framework for applying ICP in daily financial operations, such as loan approval processes and investment decision-making. By integrating ICP into these activities, institutions can effectively balance environmental sustainability with financial performance while advancing towards carbon reduction targets.

The implementation of ICP involves four key processes:

  • Establishing  internal carbon pricing : Utilizing scenario-based methodologies to calculate ICP by assessing external carbon costs and internal financial risks, providing a basis for carbon-related evaluations.
  • Incorporating ICP into Carbon Management Indicators: Embedding metrics such as absolute emissions, emission intensity, and reduction pathways into operational systems to assess and manage the carbon impact of financial portfolios.
  • Integrating ICP with Financial Metrics: Linking ICP with traditional indicators, such as risk-adjusted return on capital (RORAC), to assess the combined impact of carbon risks and financial returns, creating a comprehensive decision-making framework.
  • Evaluating Transformation Plans: Quantifying the carbon reduction potential and financial implications of long-term business transformation strategies, factoring in projected carbon costs and benefits.

The study demonstrates that ICP can serve as a practical mechanism for financial institutions to incorporate sustainability considerations into core business operations without compromising profitability. By linking carbon pricing to both operational and financial metrics, institutions can enhance their decision-making processes and gain a competitive edge in the transition to a low-carbon economy.


How to cite: Liu, I., Tsai, T.-C., Chuang, C.-Y., Tsao, J.-H., and You, H. H.: Leveraging Internal Carbon Pricing (ICP) for Financial Institutions: A Framework for Aligning Profitability with decarbonization objectives., EGU General Assembly 2025, Vienna, Austria, 27 Apr–2 May 2025, EGU25-4714, https://doi.org/10.5194/egusphere-egu25-4714, 2025.

EGU25-5387 | Orals | CL3.2.1

The role of historic global inequality in avoided climate destabilisation 

Chirag Dhara, Shrutee Jalan, Shoibal Chakravarty, Soumyajit Bhar, and Ashwin Seshadri

In assessing responsibility for climate change, conventional metrics like cumulative and per-capita emissions do not capture the consequences of evolution of affluent lifestyles. Our study introduces a novel framework to assess the global mean surface warming that would have resulted if the historical lifestyles of individual countries had been the norm for the entire global population. We refer to the resultant warming as the carbon footprint temperature, Tcf. We find that universalising the carbon-intensive lifestyles of industrialised countries would have pushed the world beyond the 1.5°C threshold as early as the 1950s in some cases, and by the 2000s for many others, thereby risking significant destabilisation of the Earth's climate system. Our analysis concludes that the modest lifestyles of the global majority have contributed substantially to the experienced planetary stability, offering humanity a dual advantage: averting potential planetary destabilisation and providing a critical window for climate action extending from decades to a century.  Accordingly, we argue that affluent entities with high carbon footprint temperatures ought to have transitioned to low or even negative emissions regimes already instead of consuming the remaining carbon space. Additionally, per capita emissions across the world need to converge to collectively self-determined levels that are well below those of current affluent lifestyles.

How to cite: Dhara, C., Jalan, S., Chakravarty, S., Bhar, S., and Seshadri, A.: The role of historic global inequality in avoided climate destabilisation, EGU General Assembly 2025, Vienna, Austria, 27 Apr–2 May 2025, EGU25-5387, https://doi.org/10.5194/egusphere-egu25-5387, 2025.

EGU25-5835 | ECS | Orals | CL3.2.1

Re-evaluating progress towards climate targets with consistent national carbon budgets 

Konstantin Weber, Cyril Brunner, Giacomo Grassi, and Reto Knutti

Country-level Remaining Carbon Budgets (RCBs) can act as tools for evaluating progress in climate policy under the Paris Agreement. However, current national RCB calculations often lack comparability with National Greenhouse Gas Inventories (NGHGIs), hindering accurate assessment of Nationally Determined Contributions and progress towards emission reduction targets. Here, we developed a NGHGI-compatible methodology for calculating RCBs, revealing a significant decrease in global RCB available for allocation to countries when aligned with NGHGI accounting principles.

Our analysis further demonstrates that over 50 countries have already exceeded their fair share of the 1.5°C-compatible RCB under this NGHGI-compatible framework, when considering responsibility for historical emissions. While developed countries with lower RCBs exhibit greater emission reduction ambitions, their efforts remain minuscule compared to their accrued carbon debt.

This research is particularly relevant in light of the recent European Court of Human Rights (ECHR) ruling in the KlimaSeniorinnen vs Switzerland case, which emphasized the importance of quantifying national GHG emission limitations, including through the establishment of national carbon budgets. We aim to highlight the need for a consistent and NGHGI-compatible approach to evaluate national climate policies and take a step towards aligning national RCB assessments with the realities of national emission reporting for more accurately assessing domestic climate action on a global scale.

How to cite: Weber, K., Brunner, C., Grassi, G., and Knutti, R.: Re-evaluating progress towards climate targets with consistent national carbon budgets, EGU General Assembly 2025, Vienna, Austria, 27 Apr–2 May 2025, EGU25-5835, https://doi.org/10.5194/egusphere-egu25-5835, 2025.

EGU25-6341 | ECS | Orals | CL3.2.1

Potential of Ocean Alkalinity Enhancement in Climate Stabilization scenarios at Different Warming Levels 

Hendrik Grosselindemann, Friedrich A. Burger, and Thomas L. Frölicher

Carbon dioxide removal (CDR) strategies, such as ocean alkalinity enhancement (OAE), are crucial for limiting global warming to below 2°C alongside strong emission reductions. However, the efficiency and temperature mitigation potential of OAE under different stabilization scenarios and on long timescales remain uncertain. This study employs the Adaptive Emissions Reduction Approach within a comprehensive fully coupled Earth System Model to address these gaps. Two sets of five-member ensemble simulations spanning 1861 to 2500 were conducted: (i) stabilization scenarios at 1.5°C, 2°C, and 3°C global warming levels, and (ii) simulations applying idealized and large-scale OAE globally of 0.14Pmol per year at the ocean surface following the CDRMIP-protocol from 2026 onward using the emissions pathways from (i). Our results show that adding alkalinity at the surface lowers surface air temperature by 0.014°C per decade (1.5°C scenario) to 0.018°C per decade (3.0°C scenario). The ocean’s additional carbon uptake per unit of added alkalinity ranges from 0.53 to 0.69, with higher efficiencies in the higher global warming scenarios. However, atmospheric CO2 reduction efficiencies are up to 0.2 lower due to anomalous release of carbon from the land. OAE efficiency remains stable until atmospheric CO2 peaks but declines thereafter, driven by changes in the pCO2 equilibration timescale, which shortens with reductions in buffer capacity before peak CO2, and lengthens during the stabilization phase where buffer capacity increases again as a result of declining atmospheric CO2. These findings highlight the complex dynamics of OAE in response to evolving climate and carbon cycle feedbacks, offering critical insights for the deployment of CDR strategies.

How to cite: Grosselindemann, H., Burger, F. A., and Frölicher, T. L.: Potential of Ocean Alkalinity Enhancement in Climate Stabilization scenarios at Different Warming Levels, EGU General Assembly 2025, Vienna, Austria, 27 Apr–2 May 2025, EGU25-6341, https://doi.org/10.5194/egusphere-egu25-6341, 2025.

EGU25-6848 | ECS | Posters on site | CL3.2.1

Co-benefits of efficient and climate friendly cooling in China 

Pengnan Jiang, Pallav Purohit, Fuli Bai, Xueying Xiang, Ziwei Chen, and Jianxin Hu

The cooling sector plays a pivotal role in the global economy but significantly contributes to global warming. In 2022, cooling-related emissions accounted for 13% of global greenhouse gas (GHG) emissions. China, in particular, played a substantial role in cooling accounting for 10% of its national emissions and consuming 15% of its total electricity. This substantial environmental impact stems largely from the sector's reliance on refrigerants with high Global Warming Potential (GWP) and energy-intensive equipment. The refrigeration and air conditioning sector widely adopted hydrofluorocarbons (HFCs) as replacements for ozone-depleting substances regulated under the Montreal Protocol. However, as potent GHG, HFCs significantly contribute to global warming and are now subject to a global phase-down under the Kigali Amendment to the Montreal Protocol. Improving the energy efficiency of cooling equipment alongside the phasedown of HFCs could potentially double the mitigation benefits of the Kigali Amendment. With the growing demand for cooling in China, it is essential to explore mitigation strategies that simultaneously reduce HFC emissions and enhance energy efficiency. This study evaluates the co-benefits of efficient and climate-friendly cooling solutions in China.

This study adopts a bottom-up approach to integrate the Refrigeration and Air Conditioning - Demand, Emission, and Cost (RAC-DEC) model with Greenhouse Gas and Air Pollution Interactions and Synergies (GAINS) models. The research focuses on four key cooling subsectors: room air conditioning, mobile air conditioning, commercial air conditioning, and cold chain. The analysis is conducted under three scenarios: Business-as-Usual (BAU), reflecting current policies and practices; Kigali Amendment with enhanced energy efficiency of cooling equipment (KAE); and Accelerated Transformational Energy Efficiency (ATE). This study projects medium- and long-term trends in refrigerant and energy consumption, driven by key demand drivers for each subsector. It then quantifies both direct refrigerant emissions following the IPCC inventory methodology and indirect emissions from energy consumption. Finally, it evaluates the combined emission reduction potential under the alternative KAE and ATE scenarios.

The preliminary results indicate that among China's cooling sector, the commercial refrigeration sector offers the highest potential for emission reduction, accounting for approximately 40% of the total cumulative emission reductions from 2023 to 2060. By 2060, China’s cooling sector could achieve cumulative emission reductions of approximately 11.5 Gt CO₂-eq in the KAE scenario and 16.5 Gt CO₂-eq in the ATE scenario. In the KAE scenario, emissions are expected to decline by 48% from 2022 to 2050. In contrast, the ATE scenario predicts a 70% reduction in annual emissions, dropping from 714–721 Mt CO₂-eq in 2022 to 217–218 Mt CO₂-eq by 2050. These significant reductions are primarily driven by the accelerated phase-out of HFC refrigerants, enhanced energy efficiency, and the deep decarbonization of the power system.

This study underscores the critical role of the cooling sector in contributing to global climate goals, including the COP28 Global Cooling Pledge and the Kigali Amendment. By providing a methodological framework, our findings offer essential scientific support for policymakers in China and beyond, facilitating coordinated efforts to actively reduce fluorinated GHGs and enhance energy efficiency within the cooling sector.

How to cite: Jiang, P., Purohit, P., Bai, F., Xiang, X., Chen, Z., and Hu, J.: Co-benefits of efficient and climate friendly cooling in China, EGU General Assembly 2025, Vienna, Austria, 27 Apr–2 May 2025, EGU25-6848, https://doi.org/10.5194/egusphere-egu25-6848, 2025.

Human- and nature-driven disturbances threaten the longevity of land-based carbon removal. However, even carbon that is temporarily stored still reduces global temperatures while said carbon remains stored. This temporary carbon storage can be measured in tonne-years, a metric that measures the time-integrated amount of carbon storage. Previous studies have identified two key findings: 1) that tonne-years of temporary storage are proportional to degree-years of avoided warming, and 2) that degree-years of avoided warming are proportional to climate outcomes that affect inertial components of the climate system, such as thermosteric sea level rise, ocean warming, and permafrost carbon loss. As a result, tonne-years of temporary carbon storage should also be proportional to climate outcomes influencing these inertial climate variables. Using the UVic Earth System Climate Model (UVic-ESCM), we simulate each Shared Socioeconomic Pathway (SSP) scenario, along with nine variations of each representing nine removal pathways with varying magnitudes and durations of carbon removal. Our results demonstrate that tonne-years of carbon storage are proportional to climate outcomes affecting inertial components of the climate system. This proportionality holds across a wide range of peak temperatures and temporary removal pathways, emphasizing that the impact of temporary carbon storage is path independent for some slow-responding climate variables.

How to cite: Dickau, M. and Matthews, H. D.: The proportionality between tonne-years of temporary carbon storage and inertial climate variables , EGU General Assembly 2025, Vienna, Austria, 27 Apr–2 May 2025, EGU25-7422, https://doi.org/10.5194/egusphere-egu25-7422, 2025.

EGU25-8318 | ECS | Orals | CL3.2.1

Combining and scaling up the application of terrestrial and marine CDR methods does not compromise CDR efficiency 

Yiannis Moustakis, Hao-Wei Wey, Tobias Nützel, Andreas Oschlies, and Julia Pongratz

Reaching the Paris Agreement’s 1.5°C climate goal will require the large-scale deployment of Carbon Dioxide Removal (CDR). Relying on single CDR methods, however, risks exceeding sustainability thresholds as compared to CDR portfolios that integrate both land- and marine-based methods. Therefore, Integrated Assessment Models have already started to include diverse CDR portfolios in modelled future pathways. While Earth System Models (ESMs) have been used to explore the climate and carbon cycle feedbacks under the deployment of individual methods, no study has yet examined the co-application of land- and marine-based CDR methods using an ESM.

Here, we use two fully coupled Earth System Models (MPI-ESM and FOCI) to investigate scaling up and/or combining land- and marine-based CDR methods under a high-emissions scenario (SSP3-7.0). Specifically, we examine the whole spectrum of Afforestation/Reforestation (AR) (0-927 Mha) and Ocean Alkalinity Enhancement (OAE) (0-16 Pmol) using a multifactorial setup encompassing seven scenarios and an ensemble of 42 simulations. The AR scenario includes ambitious forestation within the range of country pledges and has been developed based on 1,259 scenarios generated by Integrated Assessment Models, while considering biodiversity constraints and restoration potential maps. The OAE scenario includes the continuous application of alkalinity across ice-free coastline gridcells globally, with up to 16 Pmol applied – an amount sufficient to sequester as much carbon in the ocean as is the sequestration on land in the AR scenario.

Our results suggest that the efficiency of CDR, expressed as the fraction of removed carbon that remains out of the atmosphere, is ~0.85-0.87 for both AR and OAE and is independent of the magnitude of the CDR application. Overall, scaling up and/or combining the two CDR methods results in a linear scaling of carbon flux responses, despite the emerging feedbacks in the Earth system. Specifically, compared to a counterfactual no-CDR scenario, the simulated AR and OAE reduce atmospheric carbon by up to 429 and 503 GtCO2, respectively, and co-applying the two results in a reduction of 856 GtCO2. Halving the application of AR and OAE results in a reduction of atmospheric carbon by 220 and 225 GtCO2 respectively, while their combination yields 443 GtCO2.

Our findings suggest flexibility in designing CDR portfolios, as incorporating both land- and marine-based CDR methods does not compromise one or the other method’s efficiency in the two models applied. This may address sustainability concerns around large-scale deployment of single methods and can alleviate the pressure on the water-food-land nexus.

How to cite: Moustakis, Y., Wey, H.-W., Nützel, T., Oschlies, A., and Pongratz, J.: Combining and scaling up the application of terrestrial and marine CDR methods does not compromise CDR efficiency, EGU General Assembly 2025, Vienna, Austria, 27 Apr–2 May 2025, EGU25-8318, https://doi.org/10.5194/egusphere-egu25-8318, 2025.

EGU25-8791 | Orals | CL3.2.1

Detection and communication of climate changes under net zero emissions 

Andrew King, Tilo Ziehn, Eduardo Alastrué de Asenjo, Nerilie Abram, Amanda Maycock, Alexander Borowiak, Spencer Clark, and Nicola Maher

Under rapid global warming, changes in the climate system are increasingly evident and detectable, even for extremes and at the local scale. This, in part, has motivated countries to target achieving net zero emissions in the coming decades and to limit further global warming in line with the Paris Agreement. Climate changes under net zero emissions are projected to be substantial but may be harder to detect. It is critical that changes under net zero are well understood, both in terms of the effects of delay in emissions cessation and how these changes differ across timescales.

Here, we use a set of net zero 1000-year-long ACCESS-ESM-1.5 simulations to study the detectability of climate changes given a range of emission cessation years. We demonstrate that some local climate changes and changes in climate variability and extremes under net zero emissions may be significant enough to be detectable over human lifetimes. Some large-scale changes, especially in the cryosphere and oceans, and in the Southern Hemisphere, would be detectable within years or decades of emissions cessation. The benefits of earlier emissions cessation are also detectable even at the local scale.

This kind of analysis is not currently possible in a multi-model framework. A lack of planned coordinated net zero experiments on timescales beyond 300 years has the potential to undermine policymaking related to long-term climate changes. Using findings from the ACCESS-ESM-1.5 experiments, we demonstrate the problems that a lack of long net zero emissions simulations poses and call for coordinated 1000-year-long simulations.

We also argue that communication of ongoing climate changes under net zero emissions needs to go beyond projected global-average temperature changes (i.e. the Zero Emissions Commitment or ZEC) and emphasise other Earth System changes and local climate changes.

How to cite: King, A., Ziehn, T., Alastrué de Asenjo, E., Abram, N., Maycock, A., Borowiak, A., Clark, S., and Maher, N.: Detection and communication of climate changes under net zero emissions, EGU General Assembly 2025, Vienna, Austria, 27 Apr–2 May 2025, EGU25-8791, https://doi.org/10.5194/egusphere-egu25-8791, 2025.

EGU25-9028 | ECS | Posters on site | CL3.2.1

Warming versus land-intensive mitigation impact on biodiversity refugia across climate policy scenarios 

Ruben Prütz, Joeri Rogelj, Jeff Price, Rachel Warren, Nicole Forstenhäusler, Yazhen Wu, Andrey Lessa Derci Augustynczik, Michael Wögerer, Tamás Krisztin, Petr Havlík, Florian Kraxner, Stefan Frank, Tomoko Hasegawa, Jonathan Doelman, Vassilis Daioglou, and Sabine Fuss

Background: Biodiversity loss is expected to escalate with every increment of additional global warming. At the same time, land-intensive climate change mitigation strategies, such as afforestation and bioenergy (with or without carbon capture and storage), may further compound biodiversity loss. This duality of drivers of biodiversity loss in the context of climate change raises the question of how these drivers compare in terms of magnitude.

Objective: By combining spatial data on biodiversity refugia with spatial time series data on bioenergy crop plantations and afforestation for multiple scenarios with varying levels of climate action and overshoot, we compare land use-related and warming-related pressure on today’s biodiversity refugia. We evaluate different biodiversity recovery assumptions when returning from a temporary temperature overshoot, compare impacts across climatic zones, and explore differences between three different models, namely, AIM, GCAM, GLOBIOM, and IMAGE.

Preliminary results: We show how scenarios with more ambitious temperature outcomes result in higher potential land pressure on today’s biodiversity refugia areas as more land-intensive mitigation options are implied. Meanwhile, more decisive climate action, including more land-intensive mitigation options, substantially reduces the warming-related loss of today’s biodiversity refugia areas. Based on our analysis, we find that refugia loss due to warming is larger than refugia loss due to land-intensive mitigation if we assume no refugia recovery after peak warming. However, this changes towards the end of this century if we assume that temporarily lost refugia can be recovered and repopulated when returning from a temporary temperature overshoot.

How to cite: Prütz, R., Rogelj, J., Price, J., Warren, R., Forstenhäusler, N., Wu, Y., Derci Augustynczik, A. L., Wögerer, M., Krisztin, T., Havlík, P., Kraxner, F., Frank, S., Hasegawa, T., Doelman, J., Daioglou, V., and Fuss, S.: Warming versus land-intensive mitigation impact on biodiversity refugia across climate policy scenarios, EGU General Assembly 2025, Vienna, Austria, 27 Apr–2 May 2025, EGU25-9028, https://doi.org/10.5194/egusphere-egu25-9028, 2025.

EGU25-10033 | ECS | Orals | CL3.2.1

Likelihoods of European hottest temperatures in net-zero stabilised climates 

Eduardo Alastrué de Asenjo, Andrew King, and Tilo Ziehn

While projections of European heat extremes have been widely explored, only recent efforts address heat extremes specifically in net-zero emissions futures and with a global rather than regional focus. In addition, existing studies extend to net-zero futures spanning a few decades, but new Earth system model simulations point to substantial net-zero emissions changes over multi-centennial timescales. Therefore, we address the knowledge gap on characterising European heat extremes in long-term net-zero stabilised climates. We quantify and attribute yearly hottest temperatures (TXx) in European regions using extended Earth system model simulations with ACCESS-ESM-1.5. Analysing these 1000-year net-zero emissions simulations branched over the coming decades at different times of a transient scenario, we address the long-term effects of delayed mitigation on European heat extremes. After favourably evaluating our model for European hottest days against the ERA5 reanalysis using rank frequency analysis, we compare present-day hottest days to their long-term net-zero future likelihood. Across all European regions, any delay in achieving net-zero emissions shifts the distribution of yearly hottest days towards higher temperatures, and these extreme temperatures remain elevated for centuries. Most European regions show two- to five-fold frequency increases for heat events as strong as currently observed records, while the Mediterranean region could experience more than 30-fold increases for current records. When comparing extreme heat distributions at global mean temperature warming levels from transient periods to levels in early and late stabilised periods, we find warm shifts (about one degree) in transient climates, while colder distributions result from earlier mitigation at higher (3°C) global warming levels. We provide the first assessment of European hottest temperatures in net-zero stabilised climates, paving the way for further investigations of other extreme event types or regions in net-zero long-term timescales.

How to cite: Alastrué de Asenjo, E., King, A., and Ziehn, T.: Likelihoods of European hottest temperatures in net-zero stabilised climates, EGU General Assembly 2025, Vienna, Austria, 27 Apr–2 May 2025, EGU25-10033, https://doi.org/10.5194/egusphere-egu25-10033, 2025.

EGU25-10172 | ECS | Posters on site | CL3.2.1

Advancing Ocean Modelling Tools to Constrain Marine CDR Effectiveness by Testing Air-Sea Equilibration Timescales 

Yinghuan Xie, Paul Spence, Stuart Corney, and Lennart Bach

Most Marine Carbon Dioxide Removal (mCDR) methods rely on creating a deficit in seawater CO₂ concentrations and partial pressure (pCO₂), quantified as a deficit in dissolved inorganic carbon (DIC). This DIC deficit drives atmospheric CO₂ uptake or reduces CO₂ outgassing.

The success of mCDR depends on efficient air-sea CO₂ equilibration before the DIC deficit becomes isolated from the atmosphere through water mass subduction. Since equilibration spans vast ocean regions, in situ measurements are impractical, making numerical modeling essential.

This study utilizes the ACCESS-OM2 model at three resolutions (0.1°, 0.25°, and 1°) to investigate how equilibration timescales vary with resolution, ranging from non-eddying to eddy-rich. Inter-model comparisons with CESM2 and ECCO indicate that model resolution has limited impact in the tropics but a stronger influence in polar regions. Furthermore, intra-model differences (due to resolution) are smaller than inter-model differences.

To improve accessibility, we introduce a computationally inexpensive virtual particle tracking method. This innovative approach offers a low-cost alternative to traditional, HPC-dependent ocean modeling, enabling easier testing of air-sea equilibration timescales, particularly for non-specialists.

These findings advance model-based assessments of air-sea CO₂ equilibration timescales and provide a practical, accessible tool for enhancing mCDR effectiveness.

How to cite: Xie, Y., Spence, P., Corney, S., and Bach, L.: Advancing Ocean Modelling Tools to Constrain Marine CDR Effectiveness by Testing Air-Sea Equilibration Timescales, EGU General Assembly 2025, Vienna, Austria, 27 Apr–2 May 2025, EGU25-10172, https://doi.org/10.5194/egusphere-egu25-10172, 2025.

EGU25-10673 | ECS | Posters on site | CL3.2.1

Earth system climate-carbon response to pulses and continuous negative emissions 

Makcim De Sisto, David Hohn, and Nadine Mengis

Carbon Dioxide Removal (CDR) encompasses a wide range of anthropogenic activities to remove CO2 from the atmosphere to reduce its climate warming effect. The implementation of CDR technologies is necessary to achieve global climate-temperature goals. Commonly, negative emissions effects on the climate and carbon cycle have been thought to be nearly equal but opposite to those of positive emissions. This assumption was challenged recently, with results showing an asymmetric response of the Earth system to positive and negative emissions over a 1000-year timescale (Zickfeld et al. 2021). Positive emissions showed a more potent effect at increasing atmospheric CO2 concentration than negative emissions at reducing it. Yet, positive emissions had a less potent effect at increasing atmospheric temperature than negative emissions at decreasing it. Here we aim to re-evaluate the asymmetric climate-carbon response of the Earth system to negative emissions in a shorter-immediate timescale using an emissions-driven approach. Starting from a preindustrial spin-up the University of Victoria Earth system climate model (version 2.10) was forced with 10 PgC/yr emitted to the atmosphere until the cumulative carbon emission budget reached 1000 PgC (esmflat-10-1000PgC). Thereafter, pulses of positive and negative CO2 emissions ranging from ±50 to ±750 PgC were emitted or removed instantly. To assess the transient climate response to cumulative negative CO2 emissions a -10 PgC/yr was carried. Finally, a zero  emission simulation from pre-industrial served as a control. Our results show agreement with the temperature and carbon asymmetry shown in previous studies. However, we only observed relative large differences with regards to atmospheric temperature and carbon redistribution in the first 40 years of simulations. Later responses (>50 years) show much small differences between the mirrored atmospheric CO2 concentrations and temperatures to negative and positive emissions. The transient climate response to cumulative CO2 emissions and cumulative CO2 removal was found to be 1.81 and -1.79 K/EgC, respectively. These findings suggest that, while temperature asymmetry may remain undetectable in the first century of negative emissions deployment, carbon cycle dynamics could deviate significantly from symmetric assumptions. This highlights the importance of accounting for asymmetric carbon redistribution when designing negative emission strategies.


References:
Zickfeld, K., Azevedo, D., Mathesius, S. et al. Asymmetry in the climate–carbon cycle response to positive and negative CO2 emissions. Nat. Clim. Chang. 11, 613–617 (2021). https://doi.org/10.1038/s41558-021-01061-2

How to cite: De Sisto, M., Hohn, D., and Mengis, N.: Earth system climate-carbon response to pulses and continuous negative emissions, EGU General Assembly 2025, Vienna, Austria, 27 Apr–2 May 2025, EGU25-10673, https://doi.org/10.5194/egusphere-egu25-10673, 2025.

EGU25-10845 | ECS | Posters on site | CL3.2.1

Cost-effective climate benefits through fluorocarbon lifecycle management in China 

Ziwei Chen, Pallav Purohit, Fuli Bai, Thomas Gasser, Yue He, Lena Höglund-Isaksson, Pengnan Jiang, and Jianxin Hu

Achieving global climate goals requires heightened ambition and innovative measures. Banks of hydrochlorofluorocarbons (HCFCs) and hydrofluorocarbons (HFCs), potent non-CO2 greenhouse gases, represent a significant yet untapped mitigation opportunity. Globally, fluorocarbon refrigerant banks are estimated at 24 Gt CO2-eq and continue to grow, forming a massive and expanding reservoir of greenhouse gases that will eventually be released into the atmosphere if left unaddressed. While the Montreal Protocol and its Kigali Amendment regulate the production and consumption of fluorocarbons, emissions from existing stocks remain largely unregulated. Fluorocarbon lifecycle management (FLM) – encompassing leakage prevention, recovery, recycling, reclamation and destruction – presents a viable solution to mitigate these emissions. In China, the world’s largest producer and consumer of HCFCs and HFCs, implementing FLM could unlock substantial mitigation potential beyond current climate action, serving as a critical step toward net-zero goals. This study provides the necessary systematic evaluation to harness this opportunity.

To comprehensively assess the emission profiles of banked fluorocarbons with or without FLM, we developed the Extended Lifecycle Emissions Framework (ELEF), a refined emission modeling approach rooted in IPCC methodologies. ELEF expands conventional frameworks to cover both direct and indirect emissions across the entire lifecycle of fluorocarbons in equipment/product. A bottom-up cost analysis, adapted from the widely applied Greenhouse gas and Air pollution Interactions and Synergies (GAINS) framework to capture sector- and substance-specific treatment nuances, was conducted to assess the cost-effectiveness of FLM in China. Leveraging detailed activity data and localized emission factors, we reconstructed the country’s fluorocarbon banks and emissions from 2000 and projected them through 2060. Mitigation potential was then quantified across varying ambition levels defined by abatement cost cap, with climate impacts assessed using impulse response functions (IRFs) that incorporate climate-carbon feedback.

Our results reveal that China currently holds 3.6 ± 0.1 Gt CO2-eq of fluorocarbon banks, which are projected to peak at 4.5 ± 0.1 Gt CO2-eq by 2034. If unmanaged, emissions from these banks could contribute an additional 0.014℃ to global warming by mid-century. FLM, however, could prevent up to 8.0 Gt CO2-eq of cumulative emissions by 2060, reducing the peak temperature increase contribution by 62.4%. Notably, 57 out of 76 mitigation options analyzed exhibit average abatement costs below 10 USD/t CO2-eq, enabling 93.2% of the maximum mitigation potential at a total cost of 18.9 billion USD. These cost-effective measures could deliver additional mitigation equivalent to over 50% of the 13 Gt CO2-eq reductions pledged under the Kigali Amendment in China, or reduce the surface warming contribution of global HFC emissions in 2050 by more than 10%.

This study introduces a robust framework for assessing the costs and benefits of FLM. By applying it to China, we demonstrate the significant mitigation scale and feasibility of national-level implementation. Our findings highlight the substantial and cost-effective climate benefits achievable through FLM, offering policymakers an actionable pathway to bridge the emission gap and echoing recent international calls for immediate action.

How to cite: Chen, Z., Purohit, P., Bai, F., Gasser, T., He, Y., Höglund-Isaksson, L., Jiang, P., and Hu, J.: Cost-effective climate benefits through fluorocarbon lifecycle management in China, EGU General Assembly 2025, Vienna, Austria, 27 Apr–2 May 2025, EGU25-10845, https://doi.org/10.5194/egusphere-egu25-10845, 2025.

EGU25-11441 * | Orals | CL3.2.1 | Highlight

Updated IPCC emissions scenarios no longer limit warming to 1.5°C 

Chris Smith, Benjamin Sanderson, and Marit Sandstad

Ongoing failure to reduce anthropogenic greenhouse gas emissions rates has fuelled debate within scientific, policy and public discourses on whether the 1.5°C high-ambition Paris Agreement goal remains within reach. The Working Group III (WG3) contribution of the Sixth Assessment of the Intergovernmental Panel on Climate Change (IPCC) report provided global mean temperature projections from 1202 integrated assessment model derived emissions pathways. Of these, 97 were deemed to be consistent with the 1.5°C Paris goal, interpreted as limiting warming to 1.5°C with no or limited overshoot. Of these 87 temporarily overshoot 1.5°C and 10 scenarios remained below 1.5°C throughout the 21st century. 

However, the IPCC mitigation scenarios are rapidly becoming out of date, as most scenarios depend on rapid greenhouse gas emissions reductions after 2020 which have not occurred in reality. Furthermore, scenario warming outcomes were assessed using simple climate models calibrated in the 2010s, excluding recent observations and advances in understanding. When IPCC emissions scenarios are reharmonized to take into account recent emissions, and simple climate model calibrations are updated to incorporate recent observational constraints, no scenario in the IPCC WG3 database avoids overshooting 1.5°C, and only a handful of scenarios remain consistent with the IPCC definition of a low overshoot. This implies that the window for limiting warming to 1.5°C without overshoot has now closed.

How to cite: Smith, C., Sanderson, B., and Sandstad, M.: Updated IPCC emissions scenarios no longer limit warming to 1.5°C, EGU General Assembly 2025, Vienna, Austria, 27 Apr–2 May 2025, EGU25-11441, https://doi.org/10.5194/egusphere-egu25-11441, 2025.

EGU25-14557 | Orals | CL3.2.1

Quantifying the transient climate response to carbon dioxide removal 

Kirsten Zickfeld, Rachel Chimuka, and Sabine Mathesius

As anthropogenic greenhouse emissions continue to rise, limiting warming to 1.5°C has become elusive. Emissions pathways seeking to return to 1.5°C after overshoot will therefore require net negative emissions. A crucial question in this context is how much CO2 needs to be removed from the atmosphere to achieve a given amount of cooling (say 0.1°C). Studies seeking to answer this question often resort to the Transient Climate Response to Emissions (TCRE), a measure of the warming effect of cumulative CO2 emissions, neglecting that the climate may respond asymmetrically to CO2 emissions and removals. This contribution draws on CDRMIP pulse CO2 removal simulations to quantify the temperature response to CO2 emissions and removals in a range of Earth system models of full and intermediate complexity. We find that the temperature response to an equivalent amount of CO2 emissions and removals differs in magnitude, with the sign of this difference being model dependent. We investigate the cause for these inter-model differences by quantifying the contribution of carbon cycle and physical climate response differences to the overall temperature asymmetry. Establishing a robust metric of the transient climate response to CO2 removal is key to our understanding of how climate will respond to net negative emissions and to quantifying the amount of removal needed to restore a given temperature target.

How to cite: Zickfeld, K., Chimuka, R., and Mathesius, S.: Quantifying the transient climate response to carbon dioxide removal, EGU General Assembly 2025, Vienna, Austria, 27 Apr–2 May 2025, EGU25-14557, https://doi.org/10.5194/egusphere-egu25-14557, 2025.

EGU25-15423 | Posters on site | CL3.2.1

Critical freshwater requirements for meeting the Paris Agreement 

Lan Wang-Erlandsson, Fabian Stenzel, Dieter Gerten, Lauren Seaby Andersen, Miina Porkka, Lars Wiersma, Malin Lundberg Ingemarsson, and Johan Rockström

Intact land and freshwater ecosystems are a prerequisite for limiting global warming in accordance with the Paris Agreement. However, the critical co-dependence of climate mitigation outcomes and freshwater dynamics tends to be neglected in both research and policies. Here, we suggest a framework for systematically quantifying the indispensable freshwater requirements for mitigation measures, focused on natural and managed terrestrial systems upholding the land carbon sink. We assert that while huge freshwater volumes are involved in this biospheric service per se, a substantial fraction of these volumes and their spatial connectivity need to remain inside a certain variability corridor in order to maintain the current mitigation potential and to enable measures creating further ‘negative emissions’. Moreover, we highlight that the freshwater volumes and flows required are limited both by the equally substantial water requirements for other societal goals such as food security and by the potential resilience loss due to aggravating impacts of ongoing climate change. In view of high uncertainties and knowledge gaps regarding the underlying processes and feedbacks, coordinated inter- and transdisciplinary research is needed to comprehensively assess global freshwater flows and uses with explicit consideration of water-resilient climate mitigation.

How to cite: Wang-Erlandsson, L., Stenzel, F., Gerten, D., Seaby Andersen, L., Porkka, M., Wiersma, L., Lundberg Ingemarsson, M., and Rockström, J.: Critical freshwater requirements for meeting the Paris Agreement, EGU General Assembly 2025, Vienna, Austria, 27 Apr–2 May 2025, EGU25-15423, https://doi.org/10.5194/egusphere-egu25-15423, 2025.

EGU25-15467 | ECS | Orals | CL3.2.1

Asymmetry in Regional Land Carbon Cycle Feedbacks under CO2 Emissions and Removals 

Rachel Chimuka and Kirsten Zickfeld

Carbon cycle feedbacks regulate the CO2 concentration in the atmosphere, with higher atmospheric CO2 levels resulting in increased uptake, and higher temperatures resulting in reduced CO2 uptake globally. Under positive emissions, the magnitude and sign of these feedbacks vary regionally. Achieving the Paris climate goals requires the use of carbon dioxide removal to reach net-zero, then enter a net-negative emissions phase, where CO2 removal exceeds CO2 emissions. The magnitude of global carbon cycle feedbacks is expected to differ under emissions and removals due to nonlinearities and state dependence of the climate-carbon cycle response. However, the magnitude of this difference (asymmetry) is poorly understood, both globally and on a regional scale. This study uses an Earth system model to investigate the regional asymmetry in land carbon cycle feedbacks under CO2 emissions and removals. To this end, two symmetric concentration-driven simulations are initialized from a state at equilibrium with twice the preindustrial CO2 concentration, with CO2 concentration increasing by 280 ppm in the “emissions” run and decreasing by an equivalent amount in the “removals” run. Each simulation is run in fully coupled, biogeochemically coupled and radiatively coupled modes to allow separate quantification of carbon cycle feedbacks. We use the Boer & Arora (2010) framework, which utilizes a carbon budget equation to compute local contributions to the global carbon cycle feedbacks, then compare these contributions under emissions and removals to determine their asymmetry. Understanding regional asymmetry in land carbon cycle feedbacks is key for determining regions likely to play a significant role in enhancing or counteracting carbon dioxide removal efforts.

How to cite: Chimuka, R. and Zickfeld, K.: Asymmetry in Regional Land Carbon Cycle Feedbacks under CO2 Emissions and Removals, EGU General Assembly 2025, Vienna, Austria, 27 Apr–2 May 2025, EGU25-15467, https://doi.org/10.5194/egusphere-egu25-15467, 2025.

EGU25-16915 | Orals | CL3.2.1

Assessing Earth system feedbacks in deep mitigation scenarios with activity-driven simulation of carbon dioxide removal 

Jörg Schwinger, Leon Merfort, Nico Bauer, Raffaele Bernardello, Momme Butenschön, Timothée Bourgeois, Umar Farooq, Matthew Gidden, Shraddha Gupta, Hanna Lee, Nadine Mengis, Yiannis Moustakis, Lars Nieradzik, Daniele Peano, Julia Pongratz, Pascal Sauer, Etienne Tourigny, and David Wårlind

Assessing Earth system feedbacks arising from carbon dioxide removal (CDR) requires developing and simulating pairs of scenarios - a mitigation scenario with deployment of CDR and a corresponding no-CDR baseline. Both scenarios respect a specific long-term constraint on a carbon emission budget (i.e. emission reductions are pursued at the same level of ambition), but the latter describes a world where no CDR is deployed, such that net carbon emissions are larger and a given temperature threshold is missed. While over the past years a rich literature on deep mitigation scenarios with CDR has been emerging, the need for such no-CDR baselines has never been articulated explicitly. In idealized Earth system model (ESM) simulations of CDR, a no-CDR baseline is easy to imagine and implement, since socio-economic constraints are typically not taken into account. However, the deployment of CDR in deep mitigation scenarios, created by integrated assessment models (IAMs), is embedded in a consistent socio-economic description of plausible futures, and disallowing CDR may change many aspects of such scenarios, for example, the energy-system and land-use. Particularly, when moving towards an “activity-driven” representation of CDR in ESMs, where the activity that leads to a drawdown of CO2 is explicitly modelled (rather than prescribed by using removal fluxes from the IAM simulation), the creation of no-CDR baselines comes with challenges. Here, we conceptualize how carbon cycle and biophysical feedbacks of CDR deployment can be determined from scenario simulations and corresponding no-CDR baselines. We show that different options exist for the creation of no-CDR baselines, which offer different insights and have their specific advantages and limitations. We argue that for certain applications (e.g., the determination of regional biophysical feedbacks) the use of idealized no-CDR baselines is unavoidable to some extent, implying that we have to accept some degree of socio-economic inconsistency in no-CDR baselines.

How to cite: Schwinger, J., Merfort, L., Bauer, N., Bernardello, R., Butenschön, M., Bourgeois, T., Farooq, U., Gidden, M., Gupta, S., Lee, H., Mengis, N., Moustakis, Y., Nieradzik, L., Peano, D., Pongratz, J., Sauer, P., Tourigny, E., and Wårlind, D.: Assessing Earth system feedbacks in deep mitigation scenarios with activity-driven simulation of carbon dioxide removal, EGU General Assembly 2025, Vienna, Austria, 27 Apr–2 May 2025, EGU25-16915, https://doi.org/10.5194/egusphere-egu25-16915, 2025.

To achieve the goals of the Paris Agreement requires deep and rapid reductions in anthropogenic CO2 emissions, but uncertainty surrounds the magnitude and depth of reductions. Using the concept of TCRE—the transient climate response to cumulative carbon emissions—we can estimate the remaining carbon budget to achieve 1.5 or 2 °C. But the uncertainty is large, and this hinders the usefulness of the concept.

We are also entering an era where some of the regular metrics to monitor climate and carbon cycle change are changing if/when emissions stop increasing, begin to decline and may one day reach net zero or even globally net negative. The past behaviour of the global carbon cycle has seen a remarkably constant fraction (the airborne fraction) of CO2 emissions remain in the atmosphere each year – approximately half. But how will the Earth system behave under a new regime of decreasing and negative emissions? And is the TCRE relationship reversible – does the same gradient hold for negative emissions? We also need to understand the sequence of events which will be visible and detectable in observations of the carbon cycle if/when we achieve net zero.

Here we explore uncertainty in carbon budgets associated with a given global temperature rise as determined by the physical feedbacks in the Earth system and also by the carbon cycle response to elevated temperatures and CO2 levels.  Earth system models provide a means to quantify the link from emissions to global climate change, and here we explore multi-model carbon cycle simulations across three generations of Earth system models to quantitatively assess the sources of uncertainty which propagate through to TCRE.

We examine the sequence of changes in observational metrics such as the airborne fraction and sink rate and the eventual reversal of land and ocean carbon sinks as CO2 levels decline. Quantitative understanding of this sequence is vital as we enter an era where the qualitative behaviour of the climate-carbon cycle system may be fundamentally different.

How to cite: Jones, C. and Friedlingstein, P.: Quantifying process-level uncertainty contributions to TCRE and carbon budgets for meeting Paris Agreement climate targets, EGU General Assembly 2025, Vienna, Austria, 27 Apr–2 May 2025, EGU25-17298, https://doi.org/10.5194/egusphere-egu25-17298, 2025.

Exceeding atmospheric CO2 concentration of 350ppm for extended periods risks triggering climate tipping cascades, including permafrost thaw, ice sheet collapse, and ecosystem diebacks (Armstrong McKay et al., 2022). To prevent these irreversible changes, it is crucial to urgently bind at least 400 Gt of carbon from the atmosphere (Desing, 2022). Capturing CO2 and disposing it in the Earth’s crust under pressure carries uncertainties regarding long-term storage stability and potential leakage back into the atmosphere (Vica et al., 2018). Additionally, such methods lack economic incentives. Therefore, capturing CO2 and processing it into more stable carbon-dense solid materials that can be used in industrial applications offers both a solution to prevent leakage and an economic incentive.

Mining the Atmosphere (MtA) technologies provide a pathway to achieve this by capturing CO2 and converting it into high-value, long-term carbon-based products (Lura et al., 2025). To assess the scalability and sustainability of such processes, we develop a comprehensive model to optimize CO2 capture and conversion to minimize minimising grey and operational energy demand. We exemplify the approach on conversion to methane, and methane pyrolysis, with the resulting graphite bound in concrete. The model incorporates temporal and spatial differences in solar energy availability as well as local demand for C-based products. Two key scenarios are explored: in the first, MtA process are localized to meet local demand, operating when excess renewable energy is available. In the second, CO2 capture and methanation occur in solar-rich regions (e.g., deserts), with methane transported to solar-constrained regions (e.g., high latitude areas) for pyrolysis to provide carbon for concrete and hydrogen for energy supply.

By integrating material and energy dynamics, our model provides actionable insights for scaling MtA technologies to capture and store CO2 at multiple Gt/a scale. This aligns with planetary boundaries, minimizes the risk of tipping cascades, and enables long-term, economic-incentivised, decentralized carbon storage. Our work highlights MtA as a vital strategy to mitigate climate change and transition towards a carbon-neutral socio-economic metabolism.

Armstrong McKay, D.I., Staal, A., Abrams, J.F., Winkelmann, R., Sakschewski, B., Loriani, S., Fetzer, I., Cornell, S.E., Rockstrom, J., Lenton, T.M., 2022. Exceeding 1.5 degrees C global warming could trigger multiple climate tipping points. Science 377 (6611), eabn7950. https://doi.org/10.1126/science.abn7950.

Desing, H., Widmer, R., 2022. How much energy storage can we afford? On the need for a sunflower society, aligning demand with renewable supply. Biophys. Econ. Sust. 7 (3), 3. https://doi.org/10.1007/s41247-022-00097-y.

Lura, P., Lunati, I., Desing, H., Heuberger, M., Bach, C., & Richner, P. 2025. Mining the atmosphere: A concrete solution to global warming. Resour. Conserv. Recycl. 212, 107968-. https://doi.org/10.1016/j.resconrec.2024.107968

Vinca, A., Emmerling, J., Tavoni, M., 2018. Bearing the cost of stored carbon leakage. Front. Energy Res. 6. https://doi.org/10.3389/fenrg.2018.00040.

How to cite: Vingerhoets, R. and Desing, H.: A spatiotemporal modelling framework for Mining the Atmosphere: a scalable pathway to mitigate climate change, EGU General Assembly 2025, Vienna, Austria, 27 Apr–2 May 2025, EGU25-18437, https://doi.org/10.5194/egusphere-egu25-18437, 2025.

EGU25-19617 | ECS | Posters on site | CL3.2.1

Scaling Carbon Dioxide Removal in Germany: Insights from the CDRterra Framework and Scenario 

Felix Havermann, Tabea Dorndorf, Antonia Holland-Cunz, Yiannis Moustakis, Jessica Strefler, Kristine Karstens, Tobias Haas, Hao-wei Wey, Felix Schenuit, Lisa Voigt, Christian Baatz, Elmar Kriegler, Andreas Oschlies, and Julia Pongratz

To achieve the goals of the Paris Agreement, the European Union and Germany have committed to achieving net-zero greenhouse gas emissions by 2050 and 2045, respectively. This requires not only drastically reducing emissions but also scaling up Carbon Dioxide Removal (CDR) deployment and infrastructure. Large-scale implementation of CDR involves challenges related to feasibility (technological viability, resource availability, legal compliance, political feasibility) and fairness (inclusive decision-making, transparent communication), while the CDR deployment impacts individuals, society, the environment, and the ratio and distribution of these impacts. To enable legitimate, fair, and widely supported decision-making on the scaling-up process, a comprehensive framework is needed that compares CDR measures and additionally evaluates their trade-offs with other sustainability goals, necessitating transparent assessments of both, implementation processes and outcomes.

Existing assessments of CDR either analyze CDR methods or portfolios without considering the socio-economic context or focus on future scenarios that only cover a small set of CDR methods due to missing method implementation in the models. To address these gaps, we developed the CDRterra assessment framework (AF) and an ambitious, plausible future CDR scenario for Germany to which the AF is applied to. All works are part of the interdisciplinary CDRterra research program involving around 100 researchers who contributed to workshops, including stakeholder groups and colleagues from the partner program CDRmare to design the scenario and develop the AF.

The scenario is based on the SSP2 aligned with Germany's climate policies and combines cost-optimization and agent-based models, ex-post assumptions, and bottom-up calculations. It considers land, biomass, energy, and CO₂ transport and storage capacities in Germany to derive consistent deployment targets for nine CDR methods: afforestation/reforestation and forest management, agroforestry, cover cropping, BECCS, DACCS, PyCCS, enhanced rock weathering, artificial photosynthesis, and CO₂-negative building materials. Results indicate potential annual removal of 1-40 MtCO₂ per method by 2045.

We applied the CDRterra AF to the CDR measures of this scenario for the years 2030, 2045, and 2060, and evaluate both, the process and impact of such a large-scale CDR implementation which is embedded in a future socio-economic context, described by e.g., energy and biomass demand and supply, economic growth, and societal behavior. The data to fill the AF was generated by the research process within CDRterra. The structure of the AF itself builds on existing frameworks (esp. IPCC and German-specific assessment frameworks) but introduces key innovations: a clear distinction between feasibility and desirability, and between descriptive information and its normative assessment. The descriptive level is based on a data base of 120 variables, informing 90 indicators. The indicators are evaluated according to the 18 assessment criteria linked to societal norms, policy goals, and ethical considerations.

By applying the CDRterra AF to the German CDRterra scenario, we evaluated large-scale CDR implementation and identified key risks, benefits, barriers, and leverage points for each CDR method. This analysis provides a transparent knowledge base to inform societal debates and support evidence-based climate policy decisions on CDR deployment.

How to cite: Havermann, F., Dorndorf, T., Holland-Cunz, A., Moustakis, Y., Strefler, J., Karstens, K., Haas, T., Wey, H., Schenuit, F., Voigt, L., Baatz, C., Kriegler, E., Oschlies, A., and Pongratz, J.: Scaling Carbon Dioxide Removal in Germany: Insights from the CDRterra Framework and Scenario, EGU General Assembly 2025, Vienna, Austria, 27 Apr–2 May 2025, EGU25-19617, https://doi.org/10.5194/egusphere-egu25-19617, 2025.

99% of current anthropogenic carbon dioxide removals (CDR) happen on land, and land-based CDR such as re/afforestation or bioenergy with carbon capture and storage (BECCS) will likely play important roles on our way to net-zero/net-negative emissions while more novel methods need to be scaled up. However, the partly large estimates of the potentials of land-based CDR require a reality check, as obstacles to their implementation and non-negligible side-effects on society and ecosystems have not been comprehensively considered so far. Here, we present key results from an interdisciplinary project that scrutinized the feasibility of land-based CDR potentials at the national level of Germany and at global level applying a holistic approach to socio-ecological constraints.

Investigating the potentials for land-based CDR in Germany under different socio-economic scenarios shows that even optimistic scenarios that include extensive economic, lifestyle and dietary changes fall short of meeting both food demands and CDR requirements in line with the national LULUCF sector target. To implement CDR on a relevant scale, extensive land management and land use transitions in particular through afforestation of agricultural land are required. However, interviews with relevant stakeholders reveal diverse and extensive barriers in this regard, such as land use conflicts, changes to the landscape, knowledge gaps, limited human and financial resources and legal restrictions. Uncertainty about the political and economic future are also major obstacles, as afforestation needs a considerable investment of time before leading to economic viability. This highlights the need to assess not only the feasibility of CDR measures, but also their desirability.

Limited CDR potentials at national level draw the attention to compensating residual emissions through CDR in other parts of the world. However, CDR faces different but similarly severe constraints on global level: We not only find global land-use scenarios to be conflicting with key biodiversity areas, but [1]  implementation and persistence of land-based CDR faces severe challenges by a range of socioeconomic limitations, particularly in the Global South. We find that economic and technological factors such as poverty, costs, and infrastructures are the primary constraints for successful re/afforestation across the globe, with institutional factors also being important. This provides insights into key levers for up-scaling CDR.

When comparing land-based CDR methods, as needed to inform the design of CDR portfolios, we find a lack of consistent specification of assumptions and targets in the literature. We find that the efficiency of BECCS and its advantages over conventional methods like forest-based CDR in terms of carbon storage depends strongly on the timing not just of its implementation, but even more on the world’s capacities to deliver efficient CCS. On short term, we find that re/afforestation is the more efficient CDR method across a range of vegetation models. For a complete picture, we propose to compare CDR efficiency in terms of several measures: area required, time needed to break even, and the levels of CCS and fossil-fuel substitution. Future studies should deliver explicit information on the assumed CCS and fossil-fuel substitution, which proved a major source of sensitivity of CDR estimates.

How to cite: Pongratz, J. and the STEPSEC Team: Scrutinizing the feasibility of land-based CDR potentials under socio-ecological constraints , EGU General Assembly 2025, Vienna, Austria, 27 Apr–2 May 2025, EGU25-19740, https://doi.org/10.5194/egusphere-egu25-19740, 2025.

EGU25-19796 | ECS | Posters on site | CL3.2.1

Socioeconomic determinants of re/afforestation efforts 

Wenkai Bao, Wolfgang Obermeier, Yiannis Moustakis, Matthias Garschagen, and Julia Pongratz

Meeting the Paris Agreements’ climate target will require the large-scale deployment of Carbon Dioxide Removal (CDR) methods. Afforestation/reforestation (A/R) has been widely practiced and constitutes virtually all of CDR applied so far. However, implementing large scale A/R strongly depends on biophysical conditions and socioeconomic contexts defining the likelihood for implementation as well as maintenance of an A/R project. To date, biophysical enabling and constraining conditions have been extensively investigated, but studies on socioeconomic determinants remain largely confined to local scales and are primarily in the forms of qualitative evaluations. Hence, we lack a unified global understanding of socio-economic factors that have determined A/R success so far, despite the large potential of drawing on the growing database of global spatially explicit socioeconomic dimensions for a more comprehensive assessment. Here, we use machine learning to leverage multiple data streams and to explore why some countries succeed in A/R efforts while others fall short. We show that a country is likely to achieve better A/R outcomes (both in terms of absolute area and ratio of planted forest) when it has lower poverty rate, lower relative implementation cost and lower food insecurity, as well as strong institutions, adequate infrastructure and social acceptance of A/R. Economic factors (poverty, food security, implementation cost, forest road and workforce) play a key role in predicting A/R outcomes (accounting for ~70% of the relative importance), and institutional factors (governance and land tenure) contribute around 20%, while social factors (social acceptance and land use decision making) contribute only marginally (~10% ). Our  analysis revealed that a considerable number of countries–particularly in tropical regions–have significant potential but simultaneously face multiple socioeconomic constraints to upscaling implementation and maintaining the carbon sink. Our findings suggest that the A/R-based CDR potential could be overestimated when such socioeconomic barriers are not considered. This is likely the case in future scenarios generated by Integrated Assessment Models, as they typically do not explicitly consider many social, institutional and ethics-related factors. Our results suggest key entry points for effective mitigation policy that alleviates socioeconomic barriers, in particular via fighting poverty. Our study complements the extensive literature base on biophysical constraints to CDR by a unique compilation of the existing global datasets on socioeconomic determinants. This provides a vastly expanded basis of factors that can be considered when assessing the implementation likelihood and permanence of A/R and can guide the design of pathways that not only operate within safe socioeconomic boundaries, but also realizes the biophysical potential of CO2 removal.

How to cite: Bao, W., Obermeier, W., Moustakis, Y., Garschagen, M., and Pongratz, J.: Socioeconomic determinants of re/afforestation efforts, EGU General Assembly 2025, Vienna, Austria, 27 Apr–2 May 2025, EGU25-19796, https://doi.org/10.5194/egusphere-egu25-19796, 2025.

EGU25-20630 | Orals | CL3.2.1

Cooling after net zero 

Nathaniel Tarshish, Nadir Jeevanjee, and Inez Fung

Climate policy aims to limit global warming by achieving net-zero greenhouse gas emissions. Climate models indicate that achieving net-zero emissions yields a nearly constant global temperature over the following decades. However, whether temperatures remain stable in the centuries after net-zero emissions is uncertain, as models produce conflicting results. Here, we explain how this disagreement arises from differing estimates of two key climate metrics, governing the carbon system’s disequilibrium and the ocean’s thermodynamics, respectively. By constraining these metrics using multiple lines of evidence, we demonstratewith greater than 95% confidencethat global temperature anomalies decline after net-zero. In the centuries that follow net-zero, the global-mean temperature anomaly is projected to decrease by 40% (median estimate). Consequently, achieving net-zero emissions very likely halts further temperature rise, even on multi-century timescales.

How to cite: Tarshish, N., Jeevanjee, N., and Fung, I.: Cooling after net zero, EGU General Assembly 2025, Vienna, Austria, 27 Apr–2 May 2025, EGU25-20630, https://doi.org/10.5194/egusphere-egu25-20630, 2025.

Carbon budgets are quantifications of the total amount of carbon dioxide that can ever be emitted while keeping global warming below specific temperature limits. They are widely used to interpret and inform climate change mitigation actions, be it by countries or corporates. Estimates of these budgets for limiting warming to 1.5 °C and well-below 2 °C include assumptions about how much warming can be expected from non-CO2 emissions. These assumptions, however, are often poorly understood by users of carbon budget information. In this study, we clarify the non-CO2 emissions assumptions that underlie the remaining carbon budget estimates by the Intergovernmental Panel on Climate Change and quantify the implication of the world pursuing alternative higher or lower non-CO2 emissions trajectories. We consider contributions of methane, nitrous oxide, fluorinated gases, and aerosols and show how pursuing inadequate methane emission reductions causes remaining carbon budgets compatible with the Paris Agreement temperature limits to be exhausted today. A decision not to reduce non-CO2 emissions hence effectively puts the achievement of the Paris Agreement out of reach.

How to cite: Rogelj, J. and Lamboll, R. D.: The carbon budget might be smaller than you think: non-CO2 contributions to the quantification of remaining carbon budgets in line with the Paris Agreement, EGU General Assembly 2025, Vienna, Austria, 27 Apr–2 May 2025, EGU25-21101, https://doi.org/10.5194/egusphere-egu25-21101, 2025.

EGU25-1157 | ECS | Orals | CL3.2.2

Bridging the Gaps in the Future Agroclimatic Suitability of Crops in New Zealand 

Baptiste Hamon, Hervé Quénol, Clémence Vannier, and Thomas Cochrane

Environmental conditions (i.e., soil and climate constraints) define where and when crops can be grown and produced. However, climate change threatens agriculture productivity by modifying the distribution of temperatures, the hydrological cycle, and the frequency and intensity of extreme events. In New Zealand, agricultural production represents over 80% of the country’s exported goods. Hence, understanding the impacts of climate change on New Zealand agriculture is necessary to better adapt to future climate conditions.

We combined soil data and CMIP6 climate projections from five models and four Shared Socio-economic Pathways (SSPs) to conduct Land Suitability Analysis (LSA) for five crops: apple, cherry, maize, wheat and pasture. We applied a fuzzy-logic approach with crop-specific indicators to compute the agroclimatic suitability of the five crops across New Zealand. The LSA was performed for each climate model separately to estimate the climate-related uncertainty. The agroclimatic suitability corresponds to the means of computations from individual climate models. In addition, the crop water requirements were quantified considering precipitation and evapotranspiration.

The results show how the agroclimatic suitability patterns of crops will change in the future under different climate change scenarios. This allows for identifying where and when the agroclimatic suitability for a given crop is expected to decrease/increase. Moreover, the computed crop water requirement allows for estimating irrigation needs and water use.

While LSAs have been extensively used in New Zealand, there are gaps in previous applications that our work addresses. This research is the first LSA application in New Zealand that uses a consistent methodology across all agricultural sectors allowing for better inter-crop comparisons. Our study also provides estimates of climate-related suitability uncertainties, which are important to consider when exploring future climate conditions given the role of climate variability on agricultural production. Finally, our work estimates crop water requirements which are critical for future water management planning.
Future application of this methodology to other crops (e.g., winegrapes, kiwifruit, avocado, vegetables, nuts…) will extend our knowledge, give a more comprehensive view of climate change impacts on New Zealand’s agriculture landscape, and help develop better climate change adaptation options.

How to cite: Hamon, B., Quénol, H., Vannier, C., and Cochrane, T.: Bridging the Gaps in the Future Agroclimatic Suitability of Crops in New Zealand, EGU General Assembly 2025, Vienna, Austria, 27 Apr–2 May 2025, EGU25-1157, https://doi.org/10.5194/egusphere-egu25-1157, 2025.

EGU25-2613 | ECS | Orals | CL3.2.2

Optimizing pesticide efficacy: the impact of extreme heat events and timing in a warming climate 

Bing-Xin Wang, Xue-Jing Wang, Yu Wang, and Chun-Sen Ma

Climate change complicates pest management practices, particularly pesticide application, as pests’ responses to pesticides are temperature-dependent. Here, we investigated the effects of extreme heat events on the toxicity of the neonicotinoid imidacloprid to wheat aphid Sitobion avenae, considering factors including temperature, exposure duration, intervals between heat events and pesticide application, and exposure order. We found that toxicity is both temperature- and time-dependent, with longer exposure durations and shorter intervals between heat stress and pesticide treatment generally increasing toxicity. The sequence of exposure (whether heat or pesticide occurs first) also influenced efficacy, with variations observed between adult (F0) and offspring (F1) stages. Both indoor and field experiments demonstrated that factors like the temperature post-application, the interval between stresses, and their order are crucial for pest control outcomes. Based on these results, we proposed several guidelines for farmers: 1) apply pesticides on hotter days; 2) ensure that post-application temperatures are elevated; 3) minimize the interval between pesticide application and heat events. These strategies can optimize pesticide use, enhance efficacy, and reduce overall pesticide application, offering valuable insights for improving pest management in a warming climate. Further field studies are needed to confirm these findings.

How to cite: Wang, B.-X., Wang, X.-J., Wang, Y., and Ma, C.-S.: Optimizing pesticide efficacy: the impact of extreme heat events and timing in a warming climate, EGU General Assembly 2025, Vienna, Austria, 27 Apr–2 May 2025, EGU25-2613, https://doi.org/10.5194/egusphere-egu25-2613, 2025.

EGU25-3007 | Posters on site | CL3.2.2

Impacts of Multi-Year La Niña Events on East Asia's Climate and Mango Production 

Yu-Hsuan Chang and Min-Hui Lo

As climate change intensifies, the frequency and intensity of multi-year La Niña events have altered, posing potential threats to East Asia's climate and agricultural production. However, the underlying atmospheric dynamics and their long-term impacts on high-value crops, such as mangoes, remain poorly understood.
This study investigates how multi-year La Niña events influence atmospheric processes in East Asia and quantifies their impacts on mango yields. Using the CESM2 climate model, we analyzed the dynamic mechanisms of multi-year La Niña events, while a Panel Data Model was employed to assess the influence of climate anomalies on mango production. The findings indicate that multi-year La Niña events significantly and oppositely affect East Asia's precipitation patterns: reduced rainfall in the first year leads to pollen washout and decreased mango yields, while increased rainfall in the second year affects yields differently. With ongoing climate change, the frequency and intensity of such anomalies are likely to shift, warranting further attention to their potential impact on mango yields.
By combining climate modeling and economic analysis, this study reveals the dynamic drivers of the "dry-wet" cycle in East Asia under multi-year La Niña events and quantifies their effects on the mango industry. These findings provide a critical basis for understanding agricultural vulnerability to extreme climate events and offer scientific support for developing agricultural adaptation strategies.

How to cite: Chang, Y.-H. and Lo, M.-H.: Impacts of Multi-Year La Niña Events on East Asia's Climate and Mango Production, EGU General Assembly 2025, Vienna, Austria, 27 Apr–2 May 2025, EGU25-3007, https://doi.org/10.5194/egusphere-egu25-3007, 2025.

EGU25-4116 | Posters on site | CL3.2.2

Analysis of Climate Change on Viticulture in Extremadura (Southwestern Spain) 

Francisco Jesús Moral García, Francisco Javier Rebollo Castillo, Lourdes Rebollo Moyano, Luis Lorenzo Paniagua Simón, and Abelardo García Martín

Climate is the main factor influencing winegrape production in a region, making viticulture highly sensitive to climate change. The increase in atmospheric temperature due to climate change affects both winegrape yield and composition. Given the importance of viticulture in Extremadura (southwestern Spain) both in terms of the area it covers and the socio-economic benefits it generates, it is crucial to understand the impact that climate change may have on viticulture in the region. The aim of this study is to analyze high-resolution climate projections in Extremadura under two different scenarios, considering several future periods up to the end of the 21st century. For this purpose, four temperature-based bioclimatic indices were used. Results indicate that most of the Extremaduran region will remain suitable for winegrape production during the period 2006–2035. However, projections for the mid-century (2036–2065) suggest that, depending on the index and scenario considered, between 65% and 92% of the total area of Extremadura will become too hot for viticulture. By the end of the century (2066–2095), this figure is expected to rise to between 80% and 98%. Nonetheless, under the low emissions scenario, a few areas might still be suitable for winegrape production, provided that new heat- and drought-resistant varieties and techniques are adopted.

How to cite: Moral García, F. J., Rebollo Castillo, F. J., Rebollo Moyano, L., Paniagua Simón, L. L., and García Martín, A.: Analysis of Climate Change on Viticulture in Extremadura (Southwestern Spain), EGU General Assembly 2025, Vienna, Austria, 27 Apr–2 May 2025, EGU25-4116, https://doi.org/10.5194/egusphere-egu25-4116, 2025.

EGU25-4120 | Posters on site | CL3.2.2

Spatial analysis of winter chilling accumulation in the current scenario of climate change in Spain. An application to some cherry cultivars. 

Francisco Javier Rebollo Castillo, Francisco Jesús Moral García, Lourdes Rebollo Moyano, Abelardo García Martín, and Luis Lorenzo Paniagua Simón

In the current context of climate change, understanding the chilling requirements necessary for breaking dormancy and flowering in fruit trees is crucial for selecting suitable cultivars for different geographical locations. Recent data is essential for precise estimates regarding the area's suitability. Temperature data from 72 weather stations, spanning the period from 1975 to 2015, were analyzed using three models to assess winter chilling accumulation (Chilling Hours, Utah Model, and Positive Utah Model). This aimed to estimate the spatial pattern across Spain. The mapping of accumulated winter chilling was achieved through an integrated geographic information system (GIS), combined with multivariate geostatistics (regression-kriging) and algebraic mapping

As chilling accumulation is greatly influenced by the elevation of each location, elevation was utilized as a secondary variable to establish linear relationships between it and each chilling model. These relationships enhanced estimates at unsampled locations when incorporated into the regression-kriging algorithm, resulting in more accurate maps.

The findings indicated a strong correlation among the measurements from the three models, facilitating visualization of the spatial variability in accumulated winter chilling for each model. Additionally, when considering a high probability of meeting chilling requirements, quantile maps can be used instead of mean value maps, allowing for the integration of uncertainty.

Finally, the potential spatial distributions of three sweet cherry cultivars were mapped using these findings. This information aids in advising farmers on which cultivars are most appropriate for their geographical area and which regions of Spain are best suited for sweet cherry production, utilizing the most recent temporal series that incorporate climate change's impacts on climatic data.

How to cite: Rebollo Castillo, F. J., Moral García, F. J., Rebollo Moyano, L., García Martín, A., and Paniagua Simón, L. L.: Spatial analysis of winter chilling accumulation in the current scenario of climate change in Spain. An application to some cherry cultivars., EGU General Assembly 2025, Vienna, Austria, 27 Apr–2 May 2025, EGU25-4120, https://doi.org/10.5194/egusphere-egu25-4120, 2025.

EGU25-4848 | ECS | Posters on site | CL3.2.2

Impacts of climate change on land suitability for cereal crops in Ethiopia  

Mosisa Tujuba Wakjira, Nadav Peleg, Johan Six, and Peter Molnar

Climate is a key factor influencing cropland suitability, hence, climate change poses a significant threat to future cropland quality and availability across the globe. The magnitude and direction of these impacts, however, vary across regions and crop types, with rainfed agriculture systems in vulnerable regions such as sub-Saharan Africa facing the greatest challenges. Here, we assessed current and future cropland suitability (CLS) for four major cereal crops (maize, teff, sorghum, and wheat) in Ethiopia (Wakjira et al., 2024). We established functional relationships between recorded crop yield and climatic factors (growing season rainfall, temperature, and solar radiation), as well as soil factors (texture, pH, and organic carbon) extracted from global datasets, to determine current suitability and to quantify changes in CLS under future climate scenarios based on multiple climate model projections.

We show that more than half of the rainfed agricultural region of Ethiopia is moderately to highly suitable for the top three cereals crops: teff (54%), maize (51%), and sorghum (63%) while only 29% of the region is currently suitable for wheat. Under the future climate, which is projected to be wetter and warmer across most of the rainfed agricultural region, major altitudinal shifts (from lowlands to highlands) in the currently suitable croplands are expected. The differences in suitability losses across lowlands and gains in highland agroecologies are relatively smaller (with losses being slightly higher) for maize and sorghum, compared to that of teff and wheat. As a result, suitable cropland areas are projected to decrease, for example by up to 25% for teff and 16% for wheat under the SSP2-4.5 emission scenario by the end of the century. Through climate sensitivity analysis, we found that changes in CLS in the lowland and highland agroecologies are primarily driven by temperature increases, while in semi-arid and hyper-humid areas, the changes in CLS are mostly driven by rainfall. These findings underscore the urgent need for adaptation actions considering the agroclimatic conditions and locations of the croplands.

Reference

Wakjira, M. T., Peleg, N., Six, J., and Molnar, P.: Current and future cropland suitability for cereal production across the rainfed agricultural landscapes of Ethiopia, Agric. For. Meteorol., 358, 110262, https://doi.org/10.1016/j.agrformet.2024.110262, 2024.

How to cite: Wakjira, M. T., Peleg, N., Six, J., and Molnar, P.: Impacts of climate change on land suitability for cereal crops in Ethiopia , EGU General Assembly 2025, Vienna, Austria, 27 Apr–2 May 2025, EGU25-4848, https://doi.org/10.5194/egusphere-egu25-4848, 2025.

The agricultural sector, especially in rural areas dependent on rainfall, is heavily impacted by escalating droughts, which are expected to worsen in the coming years. In developing countries like Thailand, this challenge threatens the livelihoods of farmers and their quality of life. In 2023, Thailand's agricultural sector suffered over $13.45 million in damage due to a dry spell from May to September, affecting more than 25,000 farmers and over 110,000 acres of farmland. This loss was greater than the $5.7 million in damages from flooding.

Older farmers are a supreme vulnerable group at high risk from climate change. They face challenges due to physical limitations, reduced adaptive capacity from a lack of skills and resources, and difficulty learning new methods. Supporting elderly farmers in addressing drought and other climate-related challenges is essential. Such assistance aims to enhance their well-being, helping them cope effectively with these impacts and ultimately improving their quality of life

The main objective of this study was to analyze the behaviors of older farmers in selecting coping strategies in response to drought during their farming activities. Our findings revealed three significant behavior patterns among farmers aged 60-69 in drought-prone areas of Thailand.

First, self-recognition plays a crucial role in the adaptability of aging farmers. Their long-standing experience with traditional agricultural practices often leads to the belief that these methods are best suited to their local conditions. However, this mindset may limit their awareness of changing environmental factors. In this context, learning typically occurs through observation, imitation, comparison, and self-regulation.

Second, normative values are a key factor in shaping older farmers’ decisions when selecting drought coping strategies. Their choice is influenced by behavioral beliefs and attitudes, which, in turn, affect their confidence in government policies addressing these challenges. Behavioral beliefs are shaped by expectations of the outcomes of participating in programs, particularly in terms of cost-effectiveness. The key costs include labor, financial resources, and time required for participation or strategy development. If the perceived cost-benefit ratio is favorable, elderly farmers are more likely to adopt the proposed strategies to tackle drought-related challenges.

Self-protective behavior in older farmers becomes more complex during drought. Their responses may involve direct actions like protecting crops and improving resiliency, or avoidance behaviors such as accepting fate or rejecting mitigation measures. A key factor influencing their decisions is cost-benefit comparison, shaped by their experience and agricultural culture. They evaluate the costs of participating in drought response efforts, considering past threats, and weigh the expected benefits from government support, such as financial aid and skills training. These factors guide their choice of coping strategies.

Based on these findings, we emphasized the behavioral patterns that can determine the success of agricultural extension and government promotion efforts. It is crucial to ensure the synthesis of adaptive patterns and processes of older farmers in response to climate change, considering the influence of cultural, behavioral, and socio-economic factors.

Keywords: Older farmers, drought, behavioral response, coping strategies, aging agriculture

How to cite: Pechdin, W.: Behavioral Patterns of Older Farmers in Selecting Coping Strategies for Plantation in Response to Drought, EGU General Assembly 2025, Vienna, Austria, 27 Apr–2 May 2025, EGU25-5040, https://doi.org/10.5194/egusphere-egu25-5040, 2025.

EGU25-5813 | Posters on site | CL3.2.2

Trends in evapotranspiration, temperature and precipitation in the main grassland areas of the Iberian Peninsula (1981-2022). 

Abelardo García Martín, Luis Lorenzo Paniagua Simón, Francisco Jesús Moral García, Fulgencio Honorio Guisado, and Francico Javier Rebollo Castillo

The dehesa, recognised as the most extensive High Natural Value Agricultural System in Europe, is one of the main natural and economic resources of the Southwest of the Iberian Peninsula and therefore of Europe. Numerous studies indicate that an increase in temperatures (Tm) and a reduction in precipitation (P) are expected due to climate change, especially in this area. This would lead to an increase in Evapotranspiration (ETP), which represents the water requirements of plants, and a reduced rainfall.  Utilizing time series data on climatic parameters spanning the period 1981-2021, a comparative analysis was conducted on the major pasture regions of Spain and Portugal (namely, Salamanca, Cáceres, Badajoz, Beja, Lisbon, and Córdoba). The analysis employed a range of statistical tests, including one-way analysis of variance (ANOVA) and Tukey's test, as well as Dunnet's test. Additionally, trends were examined through the utilization of the Mann-Kendall test and Sen's slope estimator (Q). The results obtained demonstrated significant variations between the grassland areas for the variables analyzed. Córdoba was found to have the highest mean annual temperature and ETP, while Salamanca exhibited the lowest values for temperature, precipitation and ETP. All areas demonstrated an increase in temperature, with Lisbon, Córdoba and Badajoz exhibiting particularly significant trends. However, precipitation did not exhibit a discernible trend. These findings contribute to the climatic characterization of the grassland regions and have the potential to impact the productivity and quality of pasture and woodland. This necessitates an adaptation of management techniques (stocking rate, frequency of grazing) and cultivation, as well as a change in the distribution of suitable areas.

How to cite: García Martín, A., Paniagua Simón, L. L., Moral García, F. J., Honorio Guisado, F., and Rebollo Castillo, F. J.: Trends in evapotranspiration, temperature and precipitation in the main grassland areas of the Iberian Peninsula (1981-2022)., EGU General Assembly 2025, Vienna, Austria, 27 Apr–2 May 2025, EGU25-5813, https://doi.org/10.5194/egusphere-egu25-5813, 2025.

EGU25-6134 | Posters on site | CL3.2.2

Temporal analysis of aridity in the Dehesa agroecosystems of the Iberian Peninsula (1981-2022) 

Luis L. Paniagua, Abelardo García martín, Dolores García García, João Serrano3, Javier Rebollo, and Francisco Moral

This study analyses the temporal trends (1981-2022) of two widely used aridity indices: the De Martonne index (IDM) and the FAO aridity index (IF) in the main grassland agroforestry areas (Dehesa) of the Iberian Peninsula, in the context of current climate change. It is essential to understand aridity and its trends in order to assess the sustainability of these agricultural systems, especially in a global warming scenario. The annual IDM and IF have been determined in the Dehesa areas of the southwest of the Iberian Peninsula (Spain and Portugal). The mean IDM in these areas was 20.2 (corresponding to a Mediterranean-type climate), ranging from 16.0 in Badajoz with a semi-arid climate to 28.0 in Lisbon with a humid climate. The coefficient of variation ranged from 21% in Salamanca to 34% in Córdoba, indicating significant variations in the data. The mean IF was 0.44, corresponding to a semi-arid climate, ranging from 0.31 in Salamanca, also classified as semi-arid, to 0.75 in Lisbon, characterised by a humid sub-humid climate. The coefficient of variation ranged from 23% in Salamanca to 37% in Córdoba, reflecting substantial variations in the data. The findings of this study have enabled the identification of two distinct trends: a decrease in the indices in the Spanish regions and an increase in the indices in the Portuguese regions. These results imply that changes in management are necessary, particularly in regions where the indices demonstrate a decrease, given the increasing aridity, which directly affects the productivity of the dehesa agroecosystems by reducing water availability.

How to cite: Paniagua, L. L., García martín, A., García García, D., Serrano3, J., Rebollo, J., and Moral, F.: Temporal analysis of aridity in the Dehesa agroecosystems of the Iberian Peninsula (1981-2022), EGU General Assembly 2025, Vienna, Austria, 27 Apr–2 May 2025, EGU25-6134, https://doi.org/10.5194/egusphere-egu25-6134, 2025.

EGU25-8851 | ECS | Orals | CL3.2.2

Climate Change Impacts on Viticulture in Canada 

Massimiliano Nicola Lippa, Eugenio Straffelini, and Paolo Tarolli

Canada's viticultural growing climates are changing and redefining the potential of the Canadian wine industry. Growing seasons are evolving, as observed through the changing trends of important variables, such as near-surface temperature and seasonal precipitation. Using open access NEX-GDDP-CMIP6 data available in Google Earth Engine, this research investigated the trend evolution of key viticultural variables, near-surface temperature (minimum, average, maximum) and seasonal precipitation, across various temporal timespans within the primary Canadian wine-producing provinces of Ontario, British Columbia, Quebec and Nova Scotia between 1994-2100. In addition, two shared socioeconomic pathways (SSPs), SSP245 and SSP585, were used to help build an understanding of how the key viticultural variables of interest may change in the near-term (2015-2050) and the long-term (2051-2100). Statistically significant near-surface temperature increases were demonstrated across all wine-growing provinces alongside seasonal precipitation increases over the growing season. Temperature increases can have an impact on the quality of wine produced as well as the type of grape variety used, which could be beneficial to Canadian wine producers. The Canadian wine industry is typically dominated by grape varieties reflective of cooler growing climates. Increasing temperatures, especially over the growing season, may allow for the utilization of grape varieties found in other wine-growing areas with warmer climates, like southern Europe. However, the increasing frequency of extreme events, like rainstorms, droughts, and heat waves, will present barriers to the potential growth of the Canadian wine industry.

How to cite: Lippa, M. N., Straffelini, E., and Tarolli, P.: Climate Change Impacts on Viticulture in Canada, EGU General Assembly 2025, Vienna, Austria, 27 Apr–2 May 2025, EGU25-8851, https://doi.org/10.5194/egusphere-egu25-8851, 2025.

EGU25-10223 | ECS | Orals | CL3.2.2

Connecting Large-Scale Atmospheric Circulation to Spring Frost Events in Marlborough Vineyards 

Erika Collet, Albin Ullmann, Hervé Quénol, Andrew Sturman, and Benjamin Pohl

Spring frost events pose a significant risk to viticulture (Poni S. et al., 2022). In Marlborough, New Zealand's leading wine region, the economy is heavily dependent on vineyard yields, making spring frost events a very important threat to consider. 

This risk is exacerbated in the context of climate change, as the increase in warmer temperatures has led to the advancement of phenological stages in grapevines, notably bud break (Van Leeuwen C., et al., 2016). This advancement makes grapevines more vulnerable to frost, as new growth is then exposed to potential late frost events. Despite these critical implications, frost risk in Marlborough has not been thoroughly assessed since 2018, emphasizing the need for an updated analysis.

Initial research on frost occurrence patterns was conducted by Clark and Sturman in 2009 and revealed significant variations in observed climate across New Zealand's primary vineyard regions. This suggests that temperature changes are not uniform throughout the country, with Marlborough experiencing an increase in frost occurrence in contrast to other areas. These regional disparities have been attributed to changes in large-scale atmospheric circulation and its interaction with New Zealand's complex topography (Sturman, A. et al., 2013).

Given the high sensitivity of the wine industry to weather fluctuations and the considerable regional variability in trends of key parameters, such as temperature, a deeper understanding of the spatial and temporal variability of New Zealand's weather regimes is proving to be highly valuable for viticulture. This study investigates the variability of spring frost events in Marlborough by linking large-scale atmospheric circulation patterns to local climate impacts. 

We use a combination of K-means clustering and Self-Organizing Maps (SOMs) on high-resolution WRF model data spanning three nested domains (27 km, 3 km, and 1 km resolution). While K-means is widely used to identify regional weather regimes (Polo, I. et al., 2011), its tendency to oversimplify the continuum of atmospheric variability is mitigated here by the Self-Organizing Maps, which preserve the topological relationships of the data and capture gradual transitions between climate states. 

The proposed methodology aims to elucidate the large-scale and synoptic drivers of frost events by exploring their spatial and temporal distribution with fine precision. The results identify the role and recurrence of specific circulation patterns, responsible for triggering spring frost events. By improving the identification of weather patterns responsible for frost events, this research sets the groundwork for developing targeted frost risk forecasts and management strategies, ensuring resilience in the face of climate change for the New Zealand wine industry. This methodology is transferable to other regions around the world and can be applied to a wide range of crops and agricultural systems. 


Stefano, P. et al. ; Am J Enol Vitic. 2022. doi:10.5344/ajev.2022.22011.

Van Leeuwen, C. et al. ; Journal of Wine Economics. 2016. doi:10.1017/jwe.2015.21.

Sturman, A. et al. ; Academic Journal. 2013. doi:10.1002/joc.3608.

Polo, I. et al. ; J. Climate. 2011. doi:10.1175/2011JCLI3622.1.

How to cite: Collet, E., Ullmann, A., Quénol, H., Sturman, A., and Pohl, B.: Connecting Large-Scale Atmospheric Circulation to Spring Frost Events in Marlborough Vineyards, EGU General Assembly 2025, Vienna, Austria, 27 Apr–2 May 2025, EGU25-10223, https://doi.org/10.5194/egusphere-egu25-10223, 2025.

EGU25-10247 | ECS | Orals | CL3.2.2

Modeling crop development and atmosphere interactions under changing climate conditions using the Noah-MP Model: A case study of Mediterranean rainfed barley 

Ioannis Sofokleous, George Zittis, Hakan Djuma, Niovi Christodoulou, and Adriana Bruggeman

Land Surface Models (LSMs) are a fundamental component of climate modeling as they simulate the energy and water fluxes between terrestrial and atmospheric systems. Agriculture is a sector strongly affected by changing climate conditions and the increasing occurrence of extreme weather patterns. For these reasons, we use the state-of-the-art Noah LSM with multi-parameterizations (Noah-MP), enhanced with a crop module (Noah-MP-crop) that incorporates crop growth and its interactions with the atmosphere. The main goal is to use Noah-MP-crop and downscaled climate projections to generate seasonal and decadal predictions of the climate impacts of drought and heat stress on the growth and development of a typical Mediterranean annual rainfed crop. The specific objectives of the study are: (1) to perform a sensitivity analysis to identify the most influential Noah-MP-crop model parameters affecting the model outputs of leaf area index (LAI), total biomass, and the exchange of water and carbon with the atmosphere, and (2) to calibrate the model using field-scale observations of these variables. Our case study area is an agricultural field in the central plain on the island of Cyprus, where rainfed barley is cultivated. Observations used in our study include eddy covariance fluxes of water and carbon, meteorological variables, soil moisture at depths of 10, 30, and 50 cm, LAI and phenology, soil properties and agricultural practices. These observations span three barley growing seasons, covering the period from 2020 to 2022 and 2023 to 2024.

How to cite: Sofokleous, I., Zittis, G., Djuma, H., Christodoulou, N., and Bruggeman, A.: Modeling crop development and atmosphere interactions under changing climate conditions using the Noah-MP Model: A case study of Mediterranean rainfed barley, EGU General Assembly 2025, Vienna, Austria, 27 Apr–2 May 2025, EGU25-10247, https://doi.org/10.5194/egusphere-egu25-10247, 2025.

EGU25-10401 | Orals | CL3.2.2

Use of Convection Permitting climate models for maize yield projection over Italy 

Beatrice Monteleone, Victor Nyabuti Ong'era, Milan Mathew, Laura Massano, and Giorgia Fosser and the CORDEX-FPS-CONV community

Agriculture is highly vulnerable to temperature increase and variations in precipitation patterns associated with climate change. The Mediterranean region is considered a hotspot, with Italy being particularly affected by a raise in the frequency and severity of prolonged periods of drought and extreme floods. The IPCC reported that maize and wheat yields have been negatively affected by the observed climatic changes in several lower-latitude regions during recent decades. Cereal production constitutes a key asset for Italy’s agricultural sector, with wheat and maize being the main cultivated crops, reaching together the 79% of the total harvested area. However, in Italy there is still limited information on the effects of climate change and extreme weather events on maize production, particularly at very high-resolution spatial scale. Given the peculiar topography of the Italian landscape and the sudden spatial variations of weather variables due to the country’s orography, the use of very high spatial resolution climate data could significantly contribute in offering better detailed future crop yield projections. The km-scale Convection Permitting Models (CPMs), which provide a more realist representation of hourly precipitation and dry hours compared to coarser resolution models, could constitute an interesting tool to project future yield with a very fine spatial scale.

This study uses CPMs from the CORDEX-FPS on Convective Phenomena over Europe and the Mediterranean (FPS Convection) to drive the Agricultural Production System sIMulator (APSIM) crop model to project maize yield under RCP 8.5 over the 2090-2099 period.

At first, the ability of APSIM in simulating the observed maize yield at province scale in Italy over the period from 2006 to 2023 is assessed. In this phase, the APSIM crop model is initialized with weather data from the reference dataset Era5Land remapped at the same spatial resolution of CPMs. Then, the performance of nine CPMs (run with boundary conditions provided by ERA-Interim) in reproducing the simulated maize yield over the 2000-2009 period is evaluated. The APSIM crop model is subsequently run over the 1996-2005 period with weather data from CPMs with boundary conditions provided by their respective GCM. Finally, APSIM is run over the 2090-2099 period under RCP 8.5 to get projections of future maize yield.

Results have shown that the APSIM crop model is capable of simulating maize yield over Italy at province scale, with an overall correlation between observed and simulated maize yield of 0.92 (initialization) and 0.86 (testing). Moreover, maize yield simulated through the use of CPMs shows a good agreement with maize yield simulated with Era5Land, with correlation from 0.79 to 0.91 (p<0.001) depending on the considered CPM. At province level, CPMs perform better in the high-producing areas, such as the Po Valley, while the correlation decreases over provinces with significant areas located on the Alps or the Apennines. Finally, over the 2090-2099 period, maize yield will decrease up to -30% over the Po Valley provinces, while it will increase at higher altitudes.

Results demonstrated the importance of high-spatial resolution yield projections to evaluate future adaptation strategies.

How to cite: Monteleone, B., Nyabuti Ong'era, V., Mathew, M., Massano, L., and Fosser, G. and the CORDEX-FPS-CONV community: Use of Convection Permitting climate models for maize yield projection over Italy, EGU General Assembly 2025, Vienna, Austria, 27 Apr–2 May 2025, EGU25-10401, https://doi.org/10.5194/egusphere-egu25-10401, 2025.

EGU25-10880 | Posters on site | CL3.2.2

Sustainability of bread wheat in France: A GAMLSS based risk and return period assessment. 

Maël Aubry, Benjamin Renard, Renan Le roux, Marie Launay, Iñaki García de Cortázar-Atauri, and Carina Furusho-Percot

Soft wheat is one of the most important crops in the French agricultural production, making France the 6th largest producer in the world and the leading producer in Europe. However, since the 1990s, yields have stagnated. Several studies have identified adverse climatic events as a major factor in this stagnation, including drought, heat stress, early and late wet conditions. Since 2000, these phenomena have led to four years of critically low yields: 2003, 2007, 2016, and 2024. Given the increasing likelihood of agroclimatic risks due to climate change, it is crucial to investigate the frequency and future occurrence of these risks—whether isolated or combined—for bread wheat production in France. This is particularly important in the context of global food security.

Characterising the exceedance probability of adverse climatic events represents a major challenge, especially in a context marked by a disruption in climate stationarity. Furthermore, given the crucial role of phenology in risk characterisation, it is essential to consider phenological shifts influenced by rising temperatures when analyzing these risks, rather than relying on fixed periods. To address these challenges, we propose developing risk indicators tailored to the sensitive phenological phases of wheat (ecoclimatic indicators). These indicators will be employed in generalised additive models (GAMLSS) to identify their exceedance probability across various French climatic zones (provisionally identified by k-means clustering method). The analysis will encompass three distinct emissions scenarios  based on climate projections from 17 coupled GCM-RCM models.

These individual risk trajectories will help determine the predominant risks within each climatic region at various time horizons. Since yield losses often result from the combination of adverse events, a probabilistic analysis of combined risks will also be conducted. This analysis will leverage copula functions to model dependencies between climatic variables. The results of this study will provide critical insights into future high-risk production zones and enable the establishment of timelines to prioritize adaptation actions based on the dominant risks identified for each region. These findings will be essential for strengthening the agricultural sector's resilience to the growing impacts of climate change. They will also provide a strategic foundation to guide breeders in identifying priority improvement pathways, while adhering to temporal constraints.

How to cite: Aubry, M., Renard, B., Le roux, R., Launay, M., García de Cortázar-Atauri, I., and Furusho-Percot, C.: Sustainability of bread wheat in France: A GAMLSS based risk and return period assessment., EGU General Assembly 2025, Vienna, Austria, 27 Apr–2 May 2025, EGU25-10880, https://doi.org/10.5194/egusphere-egu25-10880, 2025.

EGU25-11450 | ECS | Orals | CL3.2.2

The Influence of Climate Change on Vegetation Response Patterns During Drought and Recovery 

Syed Bakhtawar Bilal and Vivek Gupta

Throughout recent decades climate change has significantly impacted the dynamics of plant responses during drought and recovery. This has therefore had an influence on ecosystems and the patterns of recovery that they exhibit. The purpose of this study is to analyze and quantify the alterations climate change has caused to the resilience and adaptation ability of plants to changing climate stressors. These stressors include an increase in the frequency of severe weather events, a rise in global temperatures, and changing patterns of rainfall. In this study, we investigate the temporal and spatial changes in the health of vegetation during and after drought events in a number of different climatic zones by making use of meteorological data (rainfall) and long-term satellite-derived vegetation indices (NDVI). The results of our research indicate that vegetation is becoming more susceptible to drought, displaying more significant and apparent changes in health both during and after the occurrence of droughts. This increased sensitivity indicates that an ecosystem is becoming more susceptible to the stress that is caused by climate change, which will have long-term impacts on its resilience and ability to recover. Through this approach, the study aims to uncover patterns and trends that explain how ecosystems are adapting or failing to adapt to the compounded stressors posed by a warming climate. The analysis provides a foundation for understanding the interplay between climate change, drought, and vegetation, offering critical insights into the challenges of ecosystem management in a rapidly changing world.

How to cite: Bilal, S. B. and Gupta, V.: The Influence of Climate Change on Vegetation Response Patterns During Drought and Recovery, EGU General Assembly 2025, Vienna, Austria, 27 Apr–2 May 2025, EGU25-11450, https://doi.org/10.5194/egusphere-egu25-11450, 2025.

EGU25-13651 | ECS | Posters on site | CL3.2.2

The impact of climate change on areas suitable for growing fruit tree crops in Australia 

Shannon Jones, Gareth Roberts, and Jadu Dash

Fruit from tree crops such as avocados, apples, citrus and grapes are a major Australian export, generating over $1 billion in 2023. Fruit trees require specific climatic conditions for growth and fruit production, including an optimal temperature range to allow the accumulation of energy, and a winter chilling period during dormancy to encourage blossom. We examine how Australia's climate has changed over the past 80 years and is predicted to change in the future and how these changes effect areas under tree crop cultivation. This will enable farmers to make informed choices about future land use to maintain production levels and income.

We used the ERA5-Land climate reanalysis dataset to calculate the mean, minimum and maximum annual temperatures, the occurrence of extreme heat (> 35°C), and to derive agroclimatic indices relevant to some tree crops such as growing degree days and winter chill hours. Decreases in winter chill hours and increases in growing degree days are evident along the southeastern coastline around Sydney and Melbourne, and in Tasmania. Using the current and projected climatic and agroclimatic indices, we develop crop suitability maps for five major tree crops which are assessed in relation to a Western Australia tree crop map derived using Sentinel-2 data.

How to cite: Jones, S., Roberts, G., and Dash, J.: The impact of climate change on areas suitable for growing fruit tree crops in Australia, EGU General Assembly 2025, Vienna, Austria, 27 Apr–2 May 2025, EGU25-13651, https://doi.org/10.5194/egusphere-egu25-13651, 2025.

EGU25-13755 | ECS | Orals | CL3.2.2

Do perennial bioenergy crops offer greater resistance to vapor pressure deficit stress than annuals? 

Michael Benson, Taylor Pederson, and Carl Bernacchi

Bioenergy from biofuel crops will be an important tool for meeting global renewable energy demands and evolving energy mandates. As ongoing research demonstrates the environmental costs of traditional bioenergy candidates (e.g., maize bioethanol), novel perennial crops have emerged as enticing alternatives. Perennial crops offer numerous benefits over annuals, including more efficient nutrient use and enhanced soil carbon storage. Moreover, the robust rooting structures of perennials are also better equipped to extract water from deeper soils profiles, thereby buffering carbon sequestration potential and leading to more resilient yields under extreme growth conditions including heat and drought.

Though perennial bioenergy feedstocks are valued for their enhanced productivity and stress tolerance, the extent that these benefits will persist in a warming climate is uncertain. Rising temperatures are shifting hydroclimates across United States agricultural lands, uniformly intensifying vapor pressure deficit (VPD), whereas precipitation and soil moisture responses are varying regionally. While the rooting profiles of perennials confer greater advantages over annuals during soil water dry-down, the degree by which these respective life-history strategies confer differential success when faced with elevated VPD remains unresolved.

To shed light on these uncertainties, we perform a statistical decomposition of ecosystem carbon flux observations among co-located annual (e.g., maize) and perennial (e.g., miscanthus & switchgrass) bioenergy crops to evaluate the relative limitations imposed by soil water vs. VPD stress. Preliminary results suggest that gross primary productivity of annual systems is more sensitive to both soil water and VPD stress than their perennial counterparts. However, the greatest productivity declines imposed by elevated VPD on all systems occurred when soil water availability was most abundant. Collectively, these findings highlight that the enhanced carbon mitigation potential of perennial systems will persist in a future characterized by shifting drought regimes and increasingly high VPD. 

How to cite: Benson, M., Pederson, T., and Bernacchi, C.: Do perennial bioenergy crops offer greater resistance to vapor pressure deficit stress than annuals?, EGU General Assembly 2025, Vienna, Austria, 27 Apr–2 May 2025, EGU25-13755, https://doi.org/10.5194/egusphere-egu25-13755, 2025.

EGU25-14330 | ECS | Posters on site | CL3.2.2

Increasing cotton heat exposure during critical growth stages under projected warming in Xinjiang, China 

Tongtong Shi, Wei Zhang, Tong Li, Zhanbiao Wang, and Shengli Liu

China contributes approximately 25% to global cotton production, however, over 90% of cotton in China is harvested in Xinjiang, a region increasingly impacted by heat events. Despite this, the extent to which cotton cultivation is exposed to heat events, particularly during critical growth stages, remains uncharacterized. To address this gap, we employed extreme degree days (EDD) and accumulated heat stress days (AHSD) to reflect heat events during the flowering and boll development stages. We analyzed the spatiotemporal patterns of such exposure over the historical period (1961–2020) and projections under two warming scenarios (1.5 °C and 2.0 °C) that derived from the Coupled Model Intercomparison Project Phase 6 (CMIP6). The results revealed a modest upward trend of heat events during critical growth stages of cotton, characterized by considerable interannual variability. Specifically, EDD and AHSD increased at 0.12 d·°C/yr and 0.12 days/yr, respectively. Despite notable spatial heterogeneity, regions such as Hami, Paotai, Yuli, and Mossel were identified as the most vulnerable, with EDD exceeding 25 d·°C and AHSD surpassing 9 days. Future projections suggest a substantial intensification of heat events, with EDD and AHSD values tripling and doubling under the 2.0 °C warming scenario. The findings highlight the critical importance of optimizing growth stage windows to reduce cotton’s exposure to heat stress. Targeted adaptive measures, such as adjusting planting windows and breeding new cultivars, are urgently needed to mitigate the adverse impacts of heat stress and ensure stable cotton yield.

How to cite: Shi, T., Zhang, W., Li, T., Wang, Z., and Liu, S.: Increasing cotton heat exposure during critical growth stages under projected warming in Xinjiang, China, EGU General Assembly 2025, Vienna, Austria, 27 Apr–2 May 2025, EGU25-14330, https://doi.org/10.5194/egusphere-egu25-14330, 2025.

EGU25-14646 | ECS | Orals | CL3.2.2

Impact of Climate Change on Indian agroecosystems: Long-Term Trends from Site-Scale Data (1970–2020) 

Riya Yadav, K Narender Reddy, and Somnath Baidya Roy

Climate change is expected to affect crop phenology and productivity. There are no long term studies on this topic in India primarily due to lack of observational data. We developed  a database of 5-decade long (1970-2020) site-scale observations of rice and wheat crop parameters by digitizing archived masters and doctoral thesis from agricultural universities in India. The observed Leaf Area Index (LAI) during the growing season shows that the major growing season for rice is June to October and for wheat it is November to April. Rice and wheat have a statistically significant increasing trend in yield (38 kg/ha/yr for rice and 34 kg/ha/yr for wheat) over the study period (p<.05). However, there is no considerable difference or trend observed in the growing season length of the crops during this period. Interestingly, a statistically significant increasing trend in harvest dates of wheat crop is observed from the dataset, harvest dates extended by ~14 days over the 50-year period (p<.1). Further, a case study was conducted on the rice crop, the largest crop by harvested area in India, to attribute the increasing trends in yield and other crop parameters to mean growing season temperature and increasing CO2 levels. This case study comprised multiple site-scale data from two major agro-climatic zones: the Central India (CI) region and the Indo-Gangetic Plain (IGP) region during the wet season. The findings show increasing trends for plant height, grain yield, and straw yield in both the CI and IGP regions. In the IGP region, there is a negative correlation between mean temperature and crop variables, while a positive correlation is observed with CO2 concentration. On the contrary, in the CI region, the mean temperature is positively correlated with plant height and straw yield but negatively correlated with grain yield. However, with increased CO2 levels, all variables show a strong, significant positive correlation. These changes in crops may also be attributed to the development of hybrid crop varieties resulting from advancements in agricultural technology, which have impacted crop production and other plant variables. The growth of rice increased in elevated CO2 levels but decreased under high temperature conditions. These changes in crop behavior underscore the need for adaptive strategies to mitigate the adverse effects of climate change on agriculture in India. This study is the first work that offers site-scale observational data for two major Indian agroecosystems and further investigates the two major agro-climatic zones. This data will be invaluable for future agricultural research and model development.

How to cite: Yadav, R., Reddy, K. N., and Baidya Roy, S.: Impact of Climate Change on Indian agroecosystems: Long-Term Trends from Site-Scale Data (1970–2020), EGU General Assembly 2025, Vienna, Austria, 27 Apr–2 May 2025, EGU25-14646, https://doi.org/10.5194/egusphere-egu25-14646, 2025.

EGU25-16867 | Orals | CL3.2.2

Climate risk and vulnerability assessment for agriculture in Ukraine 

Svitlana Krakovska, Lidiia Kryshtop, Oleksii Kryvobok, Liudmyla Palamarchuk, and Anastasiia Chyhareva

Agriculture in Ukraine is one of the most important economic sectors which has an impact on global food security with over 600 million people dependent on the export of crops from Ukraine. It became even more obvious after Russia's full-scale invasion of Ukraine and blockage of Ukrainian seaports that triggered a global food crisis in 2022. In the last year 2024, Ukraine reached an export level of USD 24.5 billion and exported 78.3 million tonnes of agricultural products according to the Ministry of Agrarian Policy and Food of Ukraine, which accounted for 59% of total exports. At the same time, extreme events associated with climate change caused the second biggest losses for agriculture in Ukraine after the Russian war damage. One year of drought in 2020 caused two-fold more economic losses in agriculture than caused by all other hydrometeorological extreme events in the previous 10 years. Therefore, developing a strategy for adaptation to climate change in agriculture is a vital problem for Ukraine, and it should start with an assessment of possible future vulnerability and risks for the sector.

In our work, we used an updated methodological approach based on the presented in the IPCC AR6 (2021-2022). Namely, we estimate the change in 32 Climatic impact drivers (CIDs) grouped into 5 categories: heat and cold, wet and dry, snow, wind, and coastal. Those CIDs were calculated mainly from the ensembles of up to 34 Regional Climate Models (RCMs) from the Euro-CORDEX with the maximum available for Ukraine resolution of 0.1o. In addition, we used the IPCC AR6 Interactive Atlas and Copernicus database for some of the CIDs. We assessed vulnerability and risks based on projections for two scenarios (RCP 4.5 and RCP 8.5) for three future periods (2021-2040, 2041-2060, and 2081-2100) vs 1991-2010.

The methodological approach included expert judgement on sensitivity to changes in all 32 CIDs for two of the main sub-sectors in Ukrainian agriculture: crop farming and livestock. This sensitivity is a set of weighting coefficients, their sum was chosen for the convenience of comparing vulnerability between sectors and was equal to 10 units. Note that the obtained sensitivity coefficients are irrelevant to geographical location and purely attribute of assets, therefore, it could be used for all territories where such crops and animals are grown. But what is relevant to locations is the impacts of future change in CIDs which we got in all over 7300 grid points for Ukraine and categorized within obtained limits as negligible, low, medium, high, and very high. Vulnerability and risks were calculated based on the developed original procedure in the assumption that exposure and adaptive capacity are both equal to unit, that is an asset is present in all grid points and has minimum adaptive capacity.

Our results are presented in maps, diagrams and tables for 8 regions including The Carpathians and the Crimean mountains and coastal for the Black Sea and the Azov Sea. This research is a part of the project “Promoting Green Deal Readiness in the Eastern Partnership Countries” (PROGRESS)

How to cite: Krakovska, S., Kryshtop, L., Kryvobok, O., Palamarchuk, L., and Chyhareva, A.: Climate risk and vulnerability assessment for agriculture in Ukraine, EGU General Assembly 2025, Vienna, Austria, 27 Apr–2 May 2025, EGU25-16867, https://doi.org/10.5194/egusphere-egu25-16867, 2025.

EGU25-17169 | ECS | Posters on site | CL3.2.2

Integration of climate aridity changes and agricultural drought 

Mahsa Bozorgi, Jordi Cristóbal, and Jaume Casadesus

Integrating drought —a temporary state of dryness— with aridity —a permanent state of dryness — is crucial for enhancing long-term water resource management and agricultural productivity in regional planning. In this study, the Aridity Index (AI), defined as the ratio of precipitation to reference evapotranspiration, and the Evaporative Stress Index (ESI), reflecting temporal anomalies in evapotranspiration, were analyzed across the Iberian Peninsula over the past two decades (2003–2022). Results revealed a transition towards lower values of AI, indicating climate changed towards dryness, and an increase in drought intensity within the study areas. Notably, droughts were observed in both humid and dry zones, underscoring dried conditions not necessarily led to droughts. These findings highlighted that integrating the long-term variability of drought and aridity can significantly aid policymakers in planning for drought mitigation and response strategies, as well as enhance communities’ resilience to climate change.

How to cite: Bozorgi, M., Cristóbal, J., and Casadesus, J.: Integration of climate aridity changes and agricultural drought, EGU General Assembly 2025, Vienna, Austria, 27 Apr–2 May 2025, EGU25-17169, https://doi.org/10.5194/egusphere-egu25-17169, 2025.

EGU25-20217 | ECS | Posters on site | CL3.2.2

CLIMAROMA: Influence of climate change on the aroma of wines from the Pyrenees 

Roberto Serrano-Notivoli, Mónica Bueno, Ignacio Ontañón, Maria Pilar Sáenz-Navajas, Purificación Fernández-Zurbano, and Olivier Geffroy

Climate change is exerting strong pressure on the rural areas of the Pyrenean foothills on both sides of the Pyrenees (POCTEFA area). On the one hand, it is endangering viticulture in dryland and low-altitude areas, on the other hand, it is making cultivation viable at high altitudes (southern slope) or in areas that were previously too cold and wet (northern slope). In any case, climate change is introducing a high variability on grape ripening, causing uncertainty, excessive spending on pesticides and eventually frustrating results in terms of the quality of the vintage, with the increasingly frequent appearance of aromatic problems associated with overripeness, raisining and greenness, which sometimes only appear in bottled wines. The CLIMAROMA project (2024-2027), funded by the European Commission through the POCTEFA programme and participated by four institutions from Spain and France, aims to find out which are the most significant climatic variables in the generation of aromatic defects in wine, to avoid these defects by searching for areas with favorable climates for cultivation or with treatments based on biostimulants and, lastly, to develop an action and implementation plan in new vine growing areas in the POCTEFA regions. The project consists of: 1) evaluation of the appearance of aromatic defects related to climatic factors; 2) implementing strategies for adaptation to climate change in wine-growing areas; and 3) assessment of new potential areas of vine cultivation on POCTEFA territories. Addressing the first objective, new harmonized climatic zones were derived from a comprehensive climatic analysis of the region. To this end, ten temperature-based indices and six precipitation-based indices were calculated on a 1 km2 grid covering the entire study area. A Principal Component Analysis was applied to all of them to reduce the dimensionality of the data, leaving the first two, which accounted for 92.6% of the explained variance. These two components were used to perform a clustering analysis that would define climatically homogeneous areas. The analysis showed that four groups were the most optimal classification. In parallel, two bioclimatic indices were calculated using the Köppen and TBR methods. Both showed a spatial distribution similar to that of the groups estimated in the previous calculation, so the cartography with four groups was selected as the most appropriate for the analysis. Further work will find new potential wine-growing areas based on Species Distribution Models (SDMs).

How to cite: Serrano-Notivoli, R., Bueno, M., Ontañón, I., Sáenz-Navajas, M. P., Fernández-Zurbano, P., and Geffroy, O.: CLIMAROMA: Influence of climate change on the aroma of wines from the Pyrenees, EGU General Assembly 2025, Vienna, Austria, 27 Apr–2 May 2025, EGU25-20217, https://doi.org/10.5194/egusphere-egu25-20217, 2025.

EGU25-3037 | Posters on site | CL3.2.3

METEOR - a spatially resolved impacts emulator 

Marit Sandstad, Benjamin Sanderson, and Norman Steinert

Introducing METEOR (Multivariate Emulation of Time-Evolving and Overlapping Responses) - a spatially resolved impacts emulator. P. Spatially resolved emulators can produce such data with a fraction of the computational cost required by full Earth system models, allowing the exploration of a much richer scenario space.

METEOR uses Earth system model output to emulate impact response patterns of varying decay timescales to forcing changes. As such, METEOR allows for the projection of future climate changes, including modelling of hysteresis in overshoot scenarios. In-built emissions to forcing mapping enables a full chain emulation of impact variables from emissions scenarios to spatially resolved impacts. METEOR can emulate multiple independent forcer responses, relying on at least one abrupt-CO2-change experiment as training data, and using either more abrupt forcer change experiments or a residual technique to emulate additional responses. This presentation will describe the model and its design philosophy and show results for emulations of CMIP6 model yearly mean temperature and precipitation. The flexibility of the framework allows application to a wide range of other more impact specific variables, and in addition the emulation patterns and timescales in themselves may reveal interesting patterns in the emulated data.

How to cite: Sandstad, M., Sanderson, B., and Steinert, N.: METEOR - a spatially resolved impacts emulator, EGU General Assembly 2025, Vienna, Austria, 27 Apr–2 May 2025, EGU25-3037, https://doi.org/10.5194/egusphere-egu25-3037, 2025.

EGU25-5674 | Posters on site | CL3.2.3

A stochastic simulation strategy designed to study the future of extreme low flows in the context of electricity generation 

Sylvie Parey, Alexandre Devers, and Joël Gailhard

In a work published in 2022 (Parey and Gailhard 2022, [1]) a methodology designed to estimate extreme low flow, and based on stochastic modeling has been described and tested. This methodology was suited for a single watershed and involved a single site multivariate stochastic generator of consistent temperature and rainfall timeseries. Since then, methodological issues were raised, linked on the one hand to the hydrological modeling in a cascading basins context and on the other hand to the need of being able to produce and handle an ensemble of climate projections in a reasonable computing time. The first point refers to spatial added to multivariate consistency needed in the sub-basins to obtain coherent streamflow simulations, the second to the computational efficiency of the stochastic weather generator fitting and use.

Further investigations have shown that the multivariate stochastic generation was detrimental for the performance of the extreme events reproduction, especially for long heat waves such as the 2003 event in France. Furthermore, adding spatial consistency, in addition to the multivariate one, in the generator was not straightforward. Therefore, another weather generation strategy has been proposed and tested. It consists in using single variable generators, simple for precipitation and more sophisticated in the case of temperature for the purpose of heat wave projection, used independently and synchronized a posteriori through an empirical copula coupling approach linked with bootstrapping.

After a detailed description of the proposed approach to generate a large number of spatially and mutually consistent temperature and rainfall timeseries, its application to project future low flows in a French watershed of interest for electricity generation will be demonstrated with an example.


Reference:

[1] Parey, S.; Gailhard, J.: Extreme Low Flow Estimation under Climate Change. Atmosphere 2022, 13, 164. https://doi.org/10.3390/atmos13020164

How to cite: Parey, S., Devers, A., and Gailhard, J.: A stochastic simulation strategy designed to study the future of extreme low flows in the context of electricity generation, EGU General Assembly 2025, Vienna, Austria, 27 Apr–2 May 2025, EGU25-5674, https://doi.org/10.5194/egusphere-egu25-5674, 2025.

EGU25-6287 | ECS | Posters on site | CL3.2.3 | Highlight

AeroGP: machine learning how aerosols impact regional climate 

Maura Dewey, Annica Ekman, Duncan Watson-Parris, Anna Lewinschal, Bjørn Samset, Laura Wilcox, Maria Sand, Øyvind Seland, Srinath Krishnan, and Hans-Christen Hansson

Anthropogenic aerosol emissions have historically exerted a net cooling effect which has masked some of the simultaneous warming from greenhouse gases (roughly -0.5°C since pre-industrial times). This mean effect is the result of heterogenous climate forcing through aerosol-radiation and aerosol-cloud interactions both locally close to emission sources and remotely via teleconnections. Future reductions and shifts in aerosol emission patterns due to regional clean air policies and shifting industrial production could therefore unmask additional warming and induce spatially complex climate impacts. Therefore, there is a need for computationally efficient tools to assess the climate impacts of possible future aerosol policy decisions.

We have developed a machine-learning emulator using Gaussian Processes (GP), trained on output from the Norwegian Earth System Model (NorESM), to predict the global spatially resolved surface temperature response to regional aerosol emission perturbations. We use a novel design for our GP model which considers the joint spatial covariance of the outputs. We show the efficacy of the emulator is comparable to that of the parent model NorESM for a fraction of the computational cost, and then use it to assess potential future aerosol emission scenarios that might be relevant to European policy decisions.

How to cite: Dewey, M., Ekman, A., Watson-Parris, D., Lewinschal, A., Samset, B., Wilcox, L., Sand, M., Seland, Ø., Krishnan, S., and Hansson, H.-C.: AeroGP: machine learning how aerosols impact regional climate, EGU General Assembly 2025, Vienna, Austria, 27 Apr–2 May 2025, EGU25-6287, https://doi.org/10.5194/egusphere-egu25-6287, 2025.

EGU25-6759 | ECS | Posters on site | CL3.2.3

Statistical Emulation of Climate Impacts on Tourism Dynamics in Italy: Long-term Projections and Policy Implications  

Nguyen Thanh Thanh Duong, Flavio Pons, Ida D’Attoma, and Andrea Guizzardi

Understanding the long-term impacts of climate change on socio-economic systems requires computationally efficient methods that integrate complex climatological and economic processes. In this study, we employ statistical emulation techniques to project the impacts of climate change on domestic tourism demand in Italy through the year 2100. Using outputs from 22 regional climate models (RCMs) produced by the Coordinated Regional Climate Downscaling Experiment over Europe (EURO-CORDEX) project under RCP 4.5 and RCP 8.5 scenarios, we develop a statistical model that combines economic indicators (e.g., GDP and exchange rates) with climate variables such as temperature, solar radiation, and precipitation.

Non-linear effects of climate on tourism demand are also incorporated. By utilising statistical emulators, we achieve computational efficiency, enabling scenario analyses across diverse emissions pathways.

This research advances impact modelling for the tourism sector, illustrating how parsimonious statistical models can bridge the gap between complex Earth system simulations and practical applications in policy and industry. By quantifying these effects based on empirical evidence and widely accepted climate change projections, this study aims to inform mitigation policies and strategies that enhance sustainability and resilience in tourism destinations facing climate challenges. Ultimately, the findings are intended to influence policymakers and entrepreneurs, emphasising the need to address the long-term impacts of climate change on tourism demand.

How to cite: Duong, N. T. T., Pons, F., D’Attoma, I., and Guizzardi, A.: Statistical Emulation of Climate Impacts on Tourism Dynamics in Italy: Long-term Projections and Policy Implications , EGU General Assembly 2025, Vienna, Austria, 27 Apr–2 May 2025, EGU25-6759, https://doi.org/10.5194/egusphere-egu25-6759, 2025.

EGU25-7013 | ECS | Posters on site | CL3.2.3

RIME-X: Emulating regional climate impact distributions using simple climate models and impact models 

Niklas Schwind, Mahé Perrette, Quentin Lejeune, Peter Pfleiderer, Annika Högner, Michaela Werning, Edward Byers, Anne Zimmer, Zebedee Nicholls, and Carl-Friedrich Schleussner

Simple climate models (SCMs) are widely used to simulate global mean temperature (GMT) trajectories across a wide range of emission scenarios by combining simplified representations of the carbon cycle and other Earth system processes. These simulations depend on uncertain Earth system parameters, and ensembles of SCM simulations are created by exploring plausible parameter sets, resulting in scenario-specific distributions of GMT for all considered years.

In this work, we introduce RIME-X (Rapid Impact Model Emulator Extended), a novel emulator approach that extends SCM outputs by translating GMT distributions into distributions of regionally aggregated climate or climate impact indicators. RIME-X uses historical and scenario simulations from climate and impact modeling intercomparison projects, such as CMIP and ISIMIP, to record relationships between global warming levels and indicators. By extracting distributions of indicators at specific global warming levels from those records and combining them with the GMT distributions from SCM ensembles, RIME-X produces scenario-dependent distributions of these indicators over time.

This framework integrates multiple sources of uncertainty along the modeling chain, including model uncertainty (from diverse climate or impact model records), Earth system parameter uncertainty (from SCM ensembles), and internal variability, depending on the indicator’s temporal resolution.

RIME-X is broadly applicable to any indicator whose distribution is predominantly influenced by the global warming level, offering a versatile and efficient tool for assessing climate impacts across a variety of scenarios. We demonstrate the capabilities of RIME-X by emulating a diverse set of regionally aggregated climate and climate impact variables available from ISIMIP3 and beyond for the NGFS (Network for Greening the Financial System) climate scenarios.

How to cite: Schwind, N., Perrette, M., Lejeune, Q., Pfleiderer, P., Högner, A., Werning, M., Byers, E., Zimmer, A., Nicholls, Z., and Schleussner, C.-F.: RIME-X: Emulating regional climate impact distributions using simple climate models and impact models, EGU General Assembly 2025, Vienna, Austria, 27 Apr–2 May 2025, EGU25-7013, https://doi.org/10.5194/egusphere-egu25-7013, 2025.

EGU25-9384 | ECS | Posters on site | CL3.2.3

Implementing global climate damage functions in a new Integrated Assessment Model 

Christopher Wells, Christopher Smith, Benjamin Blanz, Lennart Ramme, Ben Callegari, Muralidhar Adakudlu, Jefferson Rajah, Axel Eriksson, and Billy Schoenberg

The coupled interactions between components of the human-Earth system – impacts of human activity on the climate, and vice versa via climate impacts – are thought to be crucial determinants of the evolution of this system. However, the representation of these feedback loops is often minimal, or intentionally excluded, in existing integrated assessment modelling approaches.

The new global Integrated Assessment Model FRIDA v2.0 seeks to represent climate impacts as comprehensively as possible, at the global scale, focusing on high-level feedbacks between components of this system. This broad scope and high level of aggregation necessitates a reduced focus on individual impact channel complexity, with impacts simulated as functions of key global climate variables – e.g. temperature, CO2 concentration, and sea level rise.

Through this process, we have implemented key impact channels in FRIDA – on e.g. crops, energy supply and demand, mortality, and human behaviour. These channels generate substantial, complex effects on the evolution of the fully coupled human-Earth system.

In this presentation, we detail the process of collating and modelling climate impact channels within FRIDA v2.0, and present initial results of their overall effects on the system. We discuss the challenges of extracting internally consistent estimates from the literature, dealing with uncertainty across and between studies, conceptualising extremes. Finally, we discuss the need for future work to construct more comprehensive, consistent damage functions, and to coordinate their implementation in IAMs.

How to cite: Wells, C., Smith, C., Blanz, B., Ramme, L., Callegari, B., Adakudlu, M., Rajah, J., Eriksson, A., and Schoenberg, B.: Implementing global climate damage functions in a new Integrated Assessment Model, EGU General Assembly 2025, Vienna, Austria, 27 Apr–2 May 2025, EGU25-9384, https://doi.org/10.5194/egusphere-egu25-9384, 2025.

EGU25-10007 | Posters on site | CL3.2.3

Build your own! From tailored box-model climate emulators to pattern scaling 

Doris Folini, Aryan Eftekhari, Aleksandra Friedl, Felix Kübler, Simon Scheidegger, and Olaf Schenk

Efficient and interpretable carbon-cycle emulators (CCEs) as part of climate emulators play a key role in Integrated Assessment Models. We present a framework enabling economists to custom-build purpose-tailored multi-reservoir linear box-model CCEs, accurately calibrated to advanced climate science. Three CCEs are presented for illustration: the 3SR model (replicating DICE-2016), the 4PR model (explicitly accounting for a land biosphere carbon reservoir), and the 4PR-X model, which accounts for dynamic land-use changes like deforestation that impact the reservoir's storage capacity and result in a time dependent CCE. We demonstrate that all three models are in line with benchmark data from comprehensive Earth System Models and exemplify how the dynamic land biosphere in the 4PR-X model impacts atmospheric carbon and temperature. The findings highlight the potential and relevance of use-cased tailored, efficient and interpretable climate emulators for economic studies. We complement our 'build your own CCE' toolbox by another set of statistical tools, commonly known as pattern scaling, that allows to go from the global mean temperature change obtained from the climate emulator to regional temperatures and changes thereof. The regional temperatures may be further translated into regional damages. We discuss the relative importance and uncertainty of each building block of this interpretable climate emulator chain, from (dynamic) CCE, to climate emulator, to pattern scaling.

How to cite: Folini, D., Eftekhari, A., Friedl, A., Kübler, F., Scheidegger, S., and Schenk, O.: Build your own! From tailored box-model climate emulators to pattern scaling, EGU General Assembly 2025, Vienna, Austria, 27 Apr–2 May 2025, EGU25-10007, https://doi.org/10.5194/egusphere-egu25-10007, 2025.

EGU25-11014 | Posters on site | CL3.2.3

Progress developing the PRIME framework and using it in FASTMIP.  

Camilla Mathison, Eleanor Burke, Gregory Munday, Chris Smith, Chris Jones, Chris Huntingford, Andy Wiltshire, Eszter Kovacs, Norman Steinert, Rebecca Varney, Laila Gohar, Michael Windisch, Yann Quilcaille, Sonia Seneviratne, and Daniel Hooke

Regionalized climate risk assessments are crucial for understanding impacts on ecosystems and society, and to allow planning for climate change. While existing Earth System Models (ESMs) provide a framework for such assessments, they often lack the critical processes simulated by dedicated Impact Models. However, Impact Models are often driven by output data from ESMs, which may need bias-correcting, and therefore, there is a significant time lag in the modelling chain. Furthermore, reliance on existing ESM data for Impact Models limits our analysis to the handful of scenarios (i.e. SSPs) and models that ran them (an “ensemble of opportunity” bias), while there is a need for multiple model simulations to try to capture uncertainty in future climate.


Over the last few years, we have developed the PRIME framework for producing scenarios of regional impacts for user-prescribed future emissions scenarios. PRIME combines global mean temperature and CO2 concentrations from the emissions driven FaIR simple climate model, as used in the IPCC Sixth Assessment Report, with patterns of climate change from CMIP6 (Coupled Model Intercomparison Project Phase 6) Earth System models to drive the JULES land surface model. This modelling framework projects regional changes to the land surface and carbon cycle. We will describe PRIME for the benefit of a new audience and demonstrate how this powerful and flexible approach answers questions on regional impacts using a range of scenarios. We will also talk about the FASTMIP modelling activity led by ETH Zurich with strong contributions of the UK metoffice and PNNL, which aims to provide a coordinated experiment of regional emulators for a wide range of scenarios. We will discuss how these systems tend to be flexible and fast to run and therefore represent a wealth of future development opportunities. In particular we will focus on how PRIME and similar frameworks will enable rapid probabilistic assessment of novel scenarios emissions scenarios that have not yet been run in ESMs thereby providing a useful insight and the capability to quantify societally-relevant climate impacts.

How to cite: Mathison, C., Burke, E., Munday, G., Smith, C., Jones, C., Huntingford, C., Wiltshire, A., Kovacs, E., Steinert, N., Varney, R., Gohar, L., Windisch, M., Quilcaille, Y., Seneviratne, S., and Hooke, D.: Progress developing the PRIME framework and using it in FASTMIP. , EGU General Assembly 2025, Vienna, Austria, 27 Apr–2 May 2025, EGU25-11014, https://doi.org/10.5194/egusphere-egu25-11014, 2025.

EGU25-11101 | Posters on site | CL3.2.3

Evolution of the PRIME emissions-to-impacts modelling framework. 

Daniel Hooke, Camilla Mathison, David Sexton, Eleanor Burke, Andy Wiltshire, Chris Jones, and Laila Gohar

The PRIME emissions-to-impacts framework (Mathison et al. 2025) uses a chain of models, including the FaIR simple climate model and the JULEs land surface model, to simulate spatial resolved climate impacts and carbon cycle processes for policy relevant emissions scenarios. We present multiple updates to this framework, including a new methodology to sample large ensembles of the FaIR simple climate model, using an algorithm which maximises diversity across multiple dimensions (Sexton et al. 2021). The results are a sample with a more thorough representation of both atmospheric CO2 concentration and Global Mean Temperature. We use this sample to simulate the response of the carbon cycle under a more representative range of CO2 and temperature outcomes. In the latest version of PRIME we also include a more sophisticated representation of internal variability, and an updated daily climatology. A third methodological update is use of the PRIME framework with updated versions of JULES which include additional physical processes, such as permafrost physics and explicit representation of fire. This enables evaluation of processes not yet included in coupled Earth System Models. We use the PRIME framework in this configuration to model policy relevant overshoot scenarios, which gives us the opportunity to evaluate climate tipping points over a wide range of uncertainty. Finally, flexibility of the PRIME framework also allows us to provide driving data for other land surface models.

How to cite: Hooke, D., Mathison, C., Sexton, D., Burke, E., Wiltshire, A., Jones, C., and Gohar, L.: Evolution of the PRIME emissions-to-impacts modelling framework., EGU General Assembly 2025, Vienna, Austria, 27 Apr–2 May 2025, EGU25-11101, https://doi.org/10.5194/egusphere-egu25-11101, 2025.

EGU25-11574 | Posters on site | CL3.2.3

Northern high latitude ecosystem carbon balance under climate change 

Eleanor Burke, Rebecca Varney, Daniel Hooke, Norman Steinert, Luke Smallman, Chris Jones, Gregory Munday, and Camilla Mathison

Recent studies suggest that the northern terrestrial permafrost region was a weak CO2 sink during the period 2000-2020. Future model projections remain highly uncertain – will the region remain a sink or become a source of CO2? And, if it becomes a source, when? Here we use a novel probabilistic framework PRIME (Probabilistic Regional Impacts from Model patterns and Emissions) constrained with observations to quantify a range of plausible pathways. Included are uncertainties in the global temperature response to emissions which are combined with uncertainties in spatial climate response to the global temperature change. This information is used to provide driving data for a range of JULES (the Joint UK Land Environment Simulator) configurations all of which include a representation of permafrost carbon to investigate the ecosystem carbon balance in the northern high latitudes.

How to cite: Burke, E., Varney, R., Hooke, D., Steinert, N., Smallman, L., Jones, C., Munday, G., and Mathison, C.: Northern high latitude ecosystem carbon balance under climate change, EGU General Assembly 2025, Vienna, Austria, 27 Apr–2 May 2025, EGU25-11574, https://doi.org/10.5194/egusphere-egu25-11574, 2025.

EGU25-13058 | ECS | Posters on site | CL3.2.3

Quantifying the Disproportionate Contributions of High-Income Groups to the Emergence of Climate Extremes 

Sarah Schöngart, Zebedee Nicholls, Roman Hoffmann, Setu Pelz, and Carl-Friedrich Schleussner

Climate change impacts are unevenly distributed, with those least responsible often bearing the brunt of its effects. This study quantifies how greenhouse gas emissions from high-income groups have influenced present-day global mean temperature levels and the frequency of temperature and potential drought extremes worldwide. We deploy an emulator-based modeling framework to systematically attribute changes in regional climate extremes to emissions from different wealth groups. 

Our results show that the wealthiest 10% globally contributed about 6.5 times the global average to warming (0.40°C ± 0.16°C), while the top 1% contributed 20 times the average (0.12°C ± 0.05°C). These disproportionate contributions are further amplified for extreme events, with the top 10% contributing about 7 times more to the emergence of 1-in-100 year heat and potential drought events than the global average. Emissions from the wealthiest 10% in the United States and China are associated with a two- to three-fold increase in the frequency of heat and drought extremes across vulnerable regions. This research provides a quantitative basis for discussions on climate equity and justice by linking wealth disparities to concrete climate change impacts. Our findings have important implications for designing effective and equitable climate policies that address both mitigation and adaptation needs. The study's application of a coupled MAGICC-MESMER-M-TP framework illustrates how emulator approaches can inform policy debates on differential responsibilities and capabilities in climate action, potentially supporting more targeted and just approaches to emissions reduction and climate finance.

How to cite: Schöngart, S., Nicholls, Z., Hoffmann, R., Pelz, S., and Schleussner, C.-F.: Quantifying the Disproportionate Contributions of High-Income Groups to the Emergence of Climate Extremes, EGU General Assembly 2025, Vienna, Austria, 27 Apr–2 May 2025, EGU25-13058, https://doi.org/10.5194/egusphere-egu25-13058, 2025.

EGU25-14775 | ECS | Posters on site | CL3.2.3

Advancing ProFSea: a spatially-resolved sea-level change emulator for long-term impacts  

Gregory Munday, Matthew Palmer, Rachel Perks, Lesley Allison, Jennifer Weeks, Chris Smith, and Jonathan Gregory

Sea-level rise simulation has previously been limited to Earth system models and global emulators - restricting spatially-resolved sea-level projections to those based on ageing emissions pathways with inflexible and expensive frameworks for updating projections using the latest scenarios. The ProFSea (Projecting Future Sea-level) tool improved on AR5 methods for fast regional sea-level prediction, but was limited to RCP scenarios and a 21st century timescale. We use the FaIR simple climate model to generate an ensemble of global surface temperatures from a range of policy-relevant scenarios, and drive a global sea-level rise simulator. The global projections are then localised using spatial patterns (derived from model estimates and observational evidence) related to key sea-level change drivers. Uncertainty is quantified and propagated throughout the modelling chain. We present the evaluation of this enhanced version of the ProFSea sea-level projections tool, and demonstrate its utility as a policy tool for predicting local sea-level change risk through the 21st century, out to 2300.

How to cite: Munday, G., Palmer, M., Perks, R., Allison, L., Weeks, J., Smith, C., and Gregory, J.: Advancing ProFSea: a spatially-resolved sea-level change emulator for long-term impacts , EGU General Assembly 2025, Vienna, Austria, 27 Apr–2 May 2025, EGU25-14775, https://doi.org/10.5194/egusphere-egu25-14775, 2025.

EGU25-16962 | ECS | Posters on site | CL3.2.3

Statistical Emulations of Extreme Precipitation for Future Climate Scenarios 

Lorenzo Pierini, Lukas Gudmundsson, and Sonia Seneviratne

Extreme precipitation events have recently shown the potential to cause catastrophic flooding and damages, and the increasing effects of climate change are expected to intensify the associated socioeconomic and environmental risks. To facilitate the assessment of future scenarios, we extend the capabilities of the probabilistic emulator MESMER-X to represent extreme precipitation.
MESMER-X, designed to generate spatially resolved realizations of impact-relevant variables — such as annual maximum temperatures, fire weather, and soil moisture — for given global mean temperature trajectories, is adapted to emulate annual maximum daily precipitation.  Using data from CMIP6 Earth System Models across various Shared Socioeconomic Pathways, the emulator captures the underlying statistical distributions and spatial patterns, enabling the exploration of customized future scenarios at a fraction of the computational cost of fully coupled Earth System Models.  The performance of the emulation process is evaluated through probabilistic skill scores, residual analysis, and quantile comparisons with the original datasets.
MESMER-X outputs can support climate risk models in assessing future damages under policy-relevant scenarios, including those not previously explored with Earth System Models. This extension highlights the flexibility of MESMER-X in emulating a wide range of variables and provides a valuable support for analyzing precipitation-related climate impacts and potential targeted adaptation strategies.

How to cite: Pierini, L., Gudmundsson, L., and Seneviratne, S.: Statistical Emulations of Extreme Precipitation for Future Climate Scenarios, EGU General Assembly 2025, Vienna, Austria, 27 Apr–2 May 2025, EGU25-16962, https://doi.org/10.5194/egusphere-egu25-16962, 2025.

EGU25-848 | ECS | Posters on site | CL3.2.4

Heat Stress Threats in Europe: A Comprehensive Analysis of sWBGTVariations and Trends (1979 -2023) 

Qi Zhang, Joakim Kjellsson, Emily Black, and Julian Krüger

Heat stress has lately been acknowledged as a significant threat to public health, with heat waves becoming more frequent and severe due to global warming. The Simplified Wet Bulb Globe Temperature (sWBGT) is a effective indicator for heat stress, combining both temperature and relative humidity. Using observations and reanalysis datasets, we identify annual heatwave days (HWD) and analyze sWBGT variations and trends during HWD. We focus on three European regions: Northern Europe (NEU), Western and Central Europe (WCE), and the Mediterranean (MED). We observed an increasing trend in sWBGT over most of Europe , with the exception of areas around the Black Sea, parts of eastern and western WCE, and the western MED. Importantly, the  contribution of temperature and humidity on heat stress vary by regions. In NEU, positive trends in both temperature and relative humidity contribute to increased heat stress, with temperature showing a more significant rising trend (0.4°C/decade). In WCE, while the overall trend in sWBGT is positive, changes in relative humidity are minimal (0.007% /decade), with temperature trends being the primary driver. In MED, a positive trend in sWBGT of 0.3 /decade is a residual of a  negative trend in relative humidity and a positive temperature trend. Comparing ERA5 dataset with meteorological station data revealed biases in the ERA5 data in Mediterranean cities with pronounced urban heat island effects. Analysis of sWBGT threat levels showed that NEU and WCE regions currently remain at safe levels. In contrast, most MED regions are at alert levels, with some areas escalating to caution levels. Our research provides comprehensive insights into heat stress variations across European regions over recent decades. This work can provide scientific evidence to help policymakers develop effective adaptation to address potential future heat stress threats.

How to cite: Zhang, Q., Kjellsson, J., Black, E., and Krüger, J.: Heat Stress Threats in Europe: A Comprehensive Analysis of sWBGTVariations and Trends (1979 -2023), EGU General Assembly 2025, Vienna, Austria, 27 Apr–2 May 2025, EGU25-848, https://doi.org/10.5194/egusphere-egu25-848, 2025.

EGU25-916 | ECS | Orals | CL3.2.4

Atmospheric and Oceanic Processes Behind Extreme Precipitation: A Case Study of the Western Ghats 

Leena Khadke, Sachin Budakoti, Akash Verma, Moumita Bhowmik, and Anupam Hazra

India has experienced a notable rise in the intensity, frequency, and spatial extent of extreme weather events in recent decades, with extreme precipitation along the southwest coast being particularly alarming. The drivers behind these events remain uncertain due to the variability in meteorological and oceanic factors and associated large-scale circulations. The present study attempted to identify a combination of dynamic, thermodynamic, and cloud microphysics processes contributing to the anomalous precipitation over the southwest coast of India from 1-10 August 2019 against its climatology using reanalysis and observational datasets. Key findings reveal the critical role of warm sea surface temperature anomalies (>1.4°C), reduced outgoing longwave radiation (<-50 W/m²), and elevated atmospheric temperatures (>1.6°C over the ocean) in enhancing atmospheric moisture capacity by nearly 10%. Strengthened low-level winds (anomalies >4 m/s) transported this moisture from the ocean to the land, while vertical updrafts (> -0.4 m/s anomalies) increased atmospheric instability and moisture convergence. Additionally, significant anomalies in cloud hydrometeors (>2.5×10⁻⁴ Kg/Kg) supported prolonged intense precipitation. These results improve our understanding of the interaction between ocean-atmosphere dynamics and wind patterns, highlighting their vital role in shaping regional weather and climate.

Keywords: Extreme precipitation, Western ghats, Atmospheric processes, Reanalysis.

How to cite: Khadke, L., Budakoti, S., Verma, A., Bhowmik, M., and Hazra, A.: Atmospheric and Oceanic Processes Behind Extreme Precipitation: A Case Study of the Western Ghats, EGU General Assembly 2025, Vienna, Austria, 27 Apr–2 May 2025, EGU25-916, https://doi.org/10.5194/egusphere-egu25-916, 2025.

EGU25-1049 | ECS | Posters on site | CL3.2.4

Analysis of projected monthly changes of extreme temperature indices to support decision-makers 

Ferenc Divinszki, Anna Kis, and Rita Pongrácz

As global warming intensifies, the building of adaptation and mitigation strategies has become an urgent task. In the centre of these strategies often lie extreme weather events, which are expected to become even more severe and more frequent in the next decades. Therefore, extending our knowledge on the potential changes in these events is crucial to provide assistance for appropriate preparation and planning necessary actions. Using the latest CMIP6 global climate model simulations available in the IPCC’s Interactive Atlas (IA), a study on extreme events focusing on Europe was completed, with special emphasis on Central Europe.

Our goal was to study the potential changes of extreme temperatures over the continent, in order to analyse the spatial patterns and trends of changes for the end of the 21st century. First, monthly multi-model mean data were downloaded from the IA for two different extreme temperature indices. The number of days with maximum temperature above 35 °C (i.e. TX35) and the number of days with a minimum temperature below 0 °C (i.e. frost days or FD) were selected for the analysis. The use of both hot and cold extreme temperature indices enabled us to cover every month in our study with TX35 analysed in the May–September and FD in the October–April period. Our target period was the 2081–2100 period compared to the values of 1995–2014 (i.e. the last two decades of the historical simulation period) as a reference. Every scenario available in the IA was considered, namely, SSP1-2.6, SSP2-4.5, SSP3-7.0 and SSP5-8.5.

Six zonal segments were defined over Europe to analyse the projected changes, ensuring that the segments fairly cover the continent. This approach is able to reveal the major effects creating the spatial patterns in different regions. The most important effects are (i) the differences due to the north-south or east-west locations (i.e. the zonal and continental effects), (ii) elevation above sea level (i.e. the orographical effect), and (iii) the different levels of anthropogenic forcing (i.e. the different scenarios).

Our results show that the anthropogenic effect is a key factor due to the direct connection between the greenhouse effect and air temperature. Moreover, the sea-land surface differences have the greatest effect on the magnitude of changes in the indices, while continentality is also an important factor. Potential differences due to elevation, however, are often supressed by the spatial patterns created by sea-land differences.

How to cite: Divinszki, F., Kis, A., and Pongrácz, R.: Analysis of projected monthly changes of extreme temperature indices to support decision-makers, EGU General Assembly 2025, Vienna, Austria, 27 Apr–2 May 2025, EGU25-1049, https://doi.org/10.5194/egusphere-egu25-1049, 2025.

EGU25-1556 | ECS | Orals | CL3.2.4

A global Lagrangian analysis of near-surcface warm and cold temperature extremes 

Amelie Mayer and Volkmar Wirth

Temperature extremes have a substantial impact on society and the environment, however a full physical understanding of their formation mechanisms is still lacking. In particular, the relative importance of the three key processes – horizontal temperature transport, subsidence accompanied by adiabatic warming, and diabatic heating – is still debated. Here, we present a global quantification of the contributions from these processes to near-surface warm and cold extremes using the Lagrangian framework. To this end, we apply two different Lagrangian temperature anomaly decompositions: one based on the full fields of the respective terms, and the other one based on the anomaly fields of the respective terms (i.e., deviations from their corresponding climatologies). We will show that the results from the full-field decomposition mostly align with those of a previous study, while the anomaly-based decomposition offers a completely new assessment of the roles of the different processes, especially with regard to warm extremes.

How to cite: Mayer, A. and Wirth, V.: A global Lagrangian analysis of near-surcface warm and cold temperature extremes, EGU General Assembly 2025, Vienna, Austria, 27 Apr–2 May 2025, EGU25-1556, https://doi.org/10.5194/egusphere-egu25-1556, 2025.

EGU25-1678 | Orals | CL3.2.4

How do transitions from dry to wet states propagate to drought-to-flood transitions? 

Manuela Irene Brunner, Bailey Anderson, and Eduardo Munoz-Castro

Transitions from dry to wet states challenge water management and can lead to severe impacts on infrastructure and water quality. Such transitions occur both in the atmosphere and hydrosphere, that is, from dry-to-wet spells and from droughts to floods, respectively. While transitions from dry-to-wet spells, i.e. from negative to positive precipitation anomalies, are relatively well studied, it is yet unclear how they propagate to hydrological transitions from negative to positive streamflow anomalies. Here, we address the question of how often, where, when, and why meteorological transitions do propagate to drought-to-flood transitions using a large-sample dataset of precipitation and streamflow observations over Europe. Our analysis of the relationship between meteorological and hydrological transition events shows that only 10% and 25% of the dry-to-wet transitions propagate to drought-to-flood transitions at a monthly and annual time scale, respectively. The limiting factors for transition propagation are clear differences in the seasonality of meteorological and hydrological transitions and the limited propagation of wet spells, in particular those with low precipitation intensities and small volumes. Transition propagation is most likely in small and rainy catchments, that is, catchments with a relatively direct link between precipitation and streamflow and limited storage influences. We conclude that hydrological transitions are only weakly related to meteorological transitions, which highlights the important influence of land-surface and storage processes for the development of hydrological transitions. As a consequence, changes in dry-to-wet transitions are a relatively poor proxy for future changes in drought-to-flood transitions.

How to cite: Brunner, M. I., Anderson, B., and Munoz-Castro, E.: How do transitions from dry to wet states propagate to drought-to-flood transitions?, EGU General Assembly 2025, Vienna, Austria, 27 Apr–2 May 2025, EGU25-1678, https://doi.org/10.5194/egusphere-egu25-1678, 2025.

Humid heatwaves negatively affect human health due to the integrating effect of temperature and humidity, and thus the early warning and timely mitigating on climate extremes are essential. Yet, systematic assessment on the intra‐annual onset and end of humid heatwaves, which is associated to the occurrence of first and last humid heatwaves, are missing globally. Using a new station‐based data set of daily maximum wet‐bulb temperature, the start and end dates, cumulative anomaly and extremely humid heat of the first and last humid heatwaves in the Northern Hemisphere were explored. It was found that at 91.54% of stations, humid heatwaves started earlier or ended later in the period of 2001–2020 compared to 1981–2000. High cumulative anomalies of the first or last humid heatwaves were found in the mid‐ and high‐latitude regions. Average difference between all humid heatwaves and the first humid heatwaves in cumulative anomalies increased steadily at stations north of 35°N. At regional scales, South East Asia had become the most prominent area with intensification of intra‐annual onset and end of humid heatwaves and will experience more frequent extreme events by 2100.

Furthermore, our focus goes from physical understanding to exposure impacts. Human exposure to humid heatwaves develops with the significant intensification of extreme humid-heat and population agglomeration. Although urban areas are typical spaces of the heat stress, urban heat is expanding outward to rural areas spatially. However, the difference of long-term changes and attributions between urban and rural human exposure to humid heatwaves is still unclear, especially lacking global comparisons supported by continuous series. We also used the new wet-bulb temperature dataset and integrated scenario data to assess historical and future human exposure to humid heatwaves in the Northern Hemisphere. The differences between urban and rural areas in the contribution of enhanced heatwaves and increasing population were quantified. The results showed that about 96.62 % of the stations had pronounced increases in human exposure among those with significant changes. The domination of enhanced heatwaves to human exposure rate was stronger in urban areas in typical developed countries, while domination of increasing population was higher in rural areas in eastern China, with 87.5 % of rural stations dominated by population growth. Under extremely increasing conditions in SSP5 scenario, average rates of human exposure to humid heatwaves in rural areas would be 11.78 % higher than urban areas.

Our findings demonstrated more intensified characteristics of the intra‐annual onset and end of humid heatwaves and provide a scientific cognition for the local risk of humid heatwaves.

How to cite: Dong, J.: Intra‐annual occurrence and risk of humid heatwave in the Northern Hemisphere, EGU General Assembly 2025, Vienna, Austria, 27 Apr–2 May 2025, EGU25-2790, https://doi.org/10.5194/egusphere-egu25-2790, 2025.

EGU25-2889 | ECS | Orals | CL3.2.4

Storyline climate attribution for compound flooding from tropical cyclone Idai in Mozambique.  

Doris Vertegaal, Bart van den hurk, Anaïs Couasnon, Natalia Aleksandrova, Tycho Bovenschen, Simon Treu, Matthias Mengel, and Sanne Muis

It is widely recognized that climate change is altering the likelihood and intensity of extreme weather events globally, including hydrological extremes such as floods. Compound flooding is driven by fluvial, pluvial and coastal flooding occurring simultaneously, resulting in a potentially larger impact when co-occurring than the sum of the univariate drivers happening separately. Identifying and communicating the effect of climate change on compound flooding remains challenging. A method to quantify the effect of climate change on these events is through climate attribution assessments. 

This research assesses how existing climate attribution methods can be applied to compound events instead of univariate events. An event-based storyline attribution approach for compound flooding from historical tropical cyclones (TCs) in Mozambique is used to examine the effect of climate change on multiple flood drivers propagated to impact. TC Idai hit Mozambique in 2019 and caused over 600 fatalities, affected over 1.8 million people, resulting in $3 billion in damages. Idai is used as a case study, representing a highly destructive compound flood event. 

Compound flooding is modelled using a state-of-the-art hydrodynamic modelling chain that combines the Super-Fast INundation for coastS (SFINCS) model with the hydrodynamic model Delft3D Flexible Mesh and hydrological model wflow, linked to a fast impact assessment tool Delft-FIAT to calculate the flood impact, here the direct economic damages. The drivers of compound flooding from TCs that are known to be affected by climate change, such as precipitation, wind and sea-level rise, are adjusted to create counterfactual scenarios. The compound flooding is modelled for the multiple factual and counterfactual scenarios, adjusting the separate drivers individually and simultaneously.  

This approach enables the attribution of climate change effects on compound flooding from TCs while identifying potential changes in the contributions of individual flood drivers. Next steps include attribution uncertainty partitioning, comparing multiple climate attribution approaches for these events, assessing regional differences with relation to climate change effects on compound flood impact and comparing this methodology for multiple TCs in the same region, which may have different driver contributions.

How to cite: Vertegaal, D., van den hurk, B., Couasnon, A., Aleksandrova, N., Bovenschen, T., Treu, S., Mengel, M., and Muis, S.: Storyline climate attribution for compound flooding from tropical cyclone Idai in Mozambique. , EGU General Assembly 2025, Vienna, Austria, 27 Apr–2 May 2025, EGU25-2889, https://doi.org/10.5194/egusphere-egu25-2889, 2025.

EGU25-3474 | ECS | Orals | CL3.2.4

Dynamical evolution of extremely hot summers in Western Europe in response to climate change 

Robin Noyelle, Arnaud Caubel, Yann Meurdesoif, Davide Faranda, and Pascal Yiou

The study of the statistical and dynamical characteristics of extreme and very extreme events in the climate system is impaired by a strong under-sampling issue. Here we use a rare events algorithm to massively increase the number of extremely hot summers simulated in the state-of-the-art IPSL-CM6A-LR climate model under present and future anthropogenic forcings. This allows us to reach precise climatological results on the dynamics leading to centennial hot summers. We demonstrate that the dynamics leading to these hot summers tend to be more local and less large scale-organized with climate change. In the future, high temperatures are still reached via a large anticyclone, but anomalies do not extend as far longitudinally as in the present and arise mainly as a result of an increase in the intensity of surface heat fluxes.

How to cite: Noyelle, R., Caubel, A., Meurdesoif, Y., Faranda, D., and Yiou, P.: Dynamical evolution of extremely hot summers in Western Europe in response to climate change, EGU General Assembly 2025, Vienna, Austria, 27 Apr–2 May 2025, EGU25-3474, https://doi.org/10.5194/egusphere-egu25-3474, 2025.

EGU25-4554 | ECS | Orals | CL3.2.4

Future Changes to Extreme Rainfall over Puerto Rico in an Ensemble of Convection-Permitting Simulations 

Erin Dougherty, Andreas Prein, and Paul O'Gorman

Puerto Rico is a tropical island that frequently receives heavy rainfall from a variety of systems, including tropical cyclones like Hurricane Maria (2017), mesoscale convective systems (MCSs), and isolated convection. Its two distinct rainy seasons are dictated by moisture convergence associated with the North Atlantic Subtropical High, while sea breezes and complex topography influence precipitation on the mesoscale. Previous research has examined how tropical precipitation could change in a future climate, showing a decrease in precipitation by 2100 using global climate models (GCMs). However, relatively little research has been conducted using convection-permitting climate models over the tropical Atlantic to understand how precipitation extremes could change in a warmer climate. Here, we fill this gap by dynamically downscaling a 0.25 degree GCM 10-member ensemble to 3 km using the Model Prediction Across Scales (MPAS) model for extreme precipitation events in a current (2001-2021) and future climate (2041-2061) over Puerto Rico. We show that MPAS is largely able to reproduce extreme precipitation events in the current climate when compared to observations and captures a variety of systems. We explore how future changes in extreme rainfall events in the early rainy season, which are largely driven by MCSs and isolated convection, compare to changes in the late rainy season, which are primarily due to tropical cyclones. 

How to cite: Dougherty, E., Prein, A., and O'Gorman, P.: Future Changes to Extreme Rainfall over Puerto Rico in an Ensemble of Convection-Permitting Simulations, EGU General Assembly 2025, Vienna, Austria, 27 Apr–2 May 2025, EGU25-4554, https://doi.org/10.5194/egusphere-egu25-4554, 2025.

Possibility of the occurrence of extreme weather and climate is often predicted in recent climate impact studies under certain global warming scenarios using climate models. However, it is usually unclear how such weather extremities occur as the resolution of the current generation climate models is not good enough to resolve individual storm system let alone pinning down the physical mechanisms. This ambiguity in physical mechanism impedes the better understanding of the nature of these extreme weather/climate events and can lead to ineffective mitigation and/or adaptation measures. For example, when the term extreme rainfall is mentioned, it is unclear whether it is caused by severe convective storms or by regular storms that have higher liquid water contents (LWC), as both can lead to large amount of rainfall. But the detailed physical mechanisms of these two types of storms are different. Clearly it is desirable to remove such ambiguity and clarify what type of storms would occur in certain climate regime.

 In this study, we utilize the meteorological series derived from the REACHES climate database compiled from Chinese historical documents (Wang et al., 2018; 2024) as well modern weather data to pin down the type of storms and the respective physical mechanisms responsible for the extreme events that preferably occur in cold versus warm climate regime. We use the REACHES reconstructed temperature series in China in 1368-1911 and construct convection index series to show that the severe deep convective storms are the preferable type that causes extreme weather events in cold climate regime and utilize modern observational data to demonstrate that the high LWC (but not necessarily severe) storms are the type most likely to lead to extreme events.

Finally, physics-based storm model simulation results will be used to illustrate the dynamical processes of these two types of storms and explain why they lead to different precipitation patterns.  

How to cite: Wang, P. K.: Extreme weather types and their physical mechanisms in cold versus warm climate regimes: evidence from historical and modern climate data, EGU General Assembly 2025, Vienna, Austria, 27 Apr–2 May 2025, EGU25-4671, https://doi.org/10.5194/egusphere-egu25-4671, 2025.

EGU25-5022 | Orals | CL3.2.4

Human and land exposure to future recurrent unprecedented extremes 

Jonathan Spinoni, Marta Mastropietro, Carlos Rodriguez-Pardo, and Massimo Tavoni

In the last decades, highly impacting climate extremes have become increasingly frequent in many different global hotspots. According to climate projections, such events are likely to become even more severe during the 21st century, to the point that under the less conservative scocio-economic scenarios, they could become so recurrent that they possibly constrain the ability to adapt and mitigate, especially in poorly developed countries.


This study investigates the future occurrence of unprecedented heatwaves, droughts, rainfall and snowfall, namely the time of their emergence and when and where they will become the new climate normals, defined here as at least one such event any other year. As input data, we use an ensemble of high-resolution bias-adjusted climate simulations from the ISIMIP3b family and we focus on four SSPs (SSP1 to SSP5, excluding SSP4). Using population, land-use, and GDP projections without climate change, we also analyse their exposure to such unprecedented climate extremes from 2041 to 2100, focusing on continental and macro-regional scales.


We also present preliminary results obtained by using emulated scenarios, with a special focus on the possibility of preventing such unprecedented extremes under low-emission scenarios (SSP1-1.9 and SSP1-2.6) with specific temperature overshoot trajectories. We show that limiting frequent record-breaking heatwaves and droughts could be highly beneficial, especially in regions with lower income and higher vulnerabilities as Africa and Latin America.


The results presented in this study are included in the framework of the EUNICE project, which aims at quantifying the economic and non-economic impacts of future climate extremes, providing robust quantification of uncertainties. 

How to cite: Spinoni, J., Mastropietro, M., Rodriguez-Pardo, C., and Tavoni, M.: Human and land exposure to future recurrent unprecedented extremes, EGU General Assembly 2025, Vienna, Austria, 27 Apr–2 May 2025, EGU25-5022, https://doi.org/10.5194/egusphere-egu25-5022, 2025.

EGU25-5625 | ECS | Orals | CL3.2.4

The importance of internal variability for climate extreme indices 

Leonard Borchert, Benjamin Poschlod, Lukas Brunner, Vidur Mithal, Natalia Castillo, and Jana Sillmann

The occurrence of climate extremes is influenced by climate forcing as well as internal climate variability: internal variability may temporarily obscure or enhance the forced signal in climate extremes. The role of signal versus noise plays an important role, for instance in the analysis of emergence. The climate extreme indices from the Expert Team on Climate Change Detection and Indices (ETCCDI) are routinely used to assess the impacts of forced change on climate extremes, but in such analyses internal variability is often ignored. We present a comprehensive catalogue of the importance of internal variability for the 27 ETCCDI indices to inform climate extreme analysis and guide impact science.

In our assessment, we use a 50-member ensemble of the CMIP6 generation MPI-ESM 1.2 LR Earth System Model for 1961-2014 to highlight combinations of regions and indices that are strongly affected by internal variability. Unlike previous work, we consider all ETCCDI indices in the same model ensemble to provide a clean identification of internal variability. Using the coefficient of variation as initial metric, we find that the total signal is strongly affected by internal variability  

  • over ocean regions for temperature indices based on percentile thresholds (e.g. tx90p), 
  • along quasi-zonal mid-latitude bands for absolute maximum/minimum temperature indices (e.g. txx), and 
  • in characteristic (sub-)tropical “hot-spot” regions such as northern Africa, the eastern central Pacific, and the south-east of all ocean basins for precipitation-based indices (e.g. r95p). 

This grouping illustrates the differing relative importance of internal variability for the extreme signal depending on the index and the region, and sheds light on processes that contribute to the occurrence of climate extremes. Further, the catalogue provides a tangible resource that enables users of ETCCDI indices to better understand the robustness of index information they might derive from single model runs or observations. Based on our catalogue, users, e.g. impact scientists, may select suitable indices specific to their region of interest and application.

How to cite: Borchert, L., Poschlod, B., Brunner, L., Mithal, V., Castillo, N., and Sillmann, J.: The importance of internal variability for climate extreme indices, EGU General Assembly 2025, Vienna, Austria, 27 Apr–2 May 2025, EGU25-5625, https://doi.org/10.5194/egusphere-egu25-5625, 2025.

EGU25-6589 | Orals | CL3.2.4 | Highlight

The perfect storm: loss potential of Eunice-like cyclones in a counterfactual climate 

Nicholas Leach, Shirin Ermis, Aidan Brocklehurst, Dhirendra Kumar, Alexandros Georgiadis, Lukas Braun, and Len Shaffrey
Storm Eunice was a severe windstorm that impacted Central Europe in February 2022, causing over €2.5 Bn in insured loss. It formed on a cold front west of the Azores before undergoing explosive cyclogenesis and tracking across Central Europe, producing recorded wind gusts of up to 55 ms-1. The contribution of climate change to the storm dynamics and severity was examined by Ermis et al., who found that in counterfactual weather forecasts - given an identical initial synoptic setup - climate change had measurably increased the severity of the storm. 
 
Here we move beyond their meteorological attribution and quantify the role of climate change in the losses incurred during Eunice. We combine the same counterfactual weather forecasts with two loss models, including one state-of-the-art catastrophe model, finding that the increases in meteorological severity do translate through to substantial increases in estimated loss. We compare the loss model results with a commonly used “loss index” finding that the index inadequately represents the heavy tail of the loss distribution, demonstrating the importance of using impact models for quantitative assessments of loss in a changing climate.
 
Of particular note is the existence of several “boosted” members within the forecast ensembles whose losses are far greater than what unfolded in reality. This includes one realisation, simulated in a warmer “future” climate, in which the total loss nearly reaches €50 Bn. The plausible existence of such a catastrophic loss is of considerable relevance to a wide variety of stakeholders across adaptation planning, and the financial sector. We suggest that our results demonstrate not only the potential utility of weather forecast models in quantifying impacts attributable to climate change, but also the value of academic - private partnerships in which the two sectors are able to bring different areas of expertise.

How to cite: Leach, N., Ermis, S., Brocklehurst, A., Kumar, D., Georgiadis, A., Braun, L., and Shaffrey, L.: The perfect storm: loss potential of Eunice-like cyclones in a counterfactual climate, EGU General Assembly 2025, Vienna, Austria, 27 Apr–2 May 2025, EGU25-6589, https://doi.org/10.5194/egusphere-egu25-6589, 2025.

EGU25-6594 | ECS | Posters on site | CL3.2.4

A Counterfactual Emulator for Circulation-Driven Extremes in Southeast Asia 

Xinyue Liu, Xiao Peng, and Xiaogang He

Climate extremes jeopardize human health and the environment. Recent unprecedented extremes suggest a complex interplay between anthropogenic warming and internal variability of the climate system, with large-scale circulations exhibiting considerable uncertainty in response to climate change. Therefore, understanding the influence of large-scale atmospheric and oceanic circulations on extreme events in a changing climate is crucial for climate adaptation and risk assessment. Traditional physical climate models, while powerful, require extensive computational resources to explore the broad spectrum of potential future circulation states and their implications for the infrequent occurrence of extreme events. This study takes Southeast Asia as an example to demonstrate the influence of Madden–Julian Oscillation (MJO) on extreme precipitation and droughts in a changing climate, as MJO strongly modulates local convective systems in Southeast Asia. We develop an AI-empowered emulator framework based on a conditional diffusion model to generate the precipitation field in a counterfactual world, where the enhanced convective phases of MJO are more (less) frequent than the current climate. We then estimate the intensity-frequency curves of extreme precipitation (drought) events and quantify the uncertainty using the generated large ensemble of samples. This counterfactual emulator allows us to isolate the influence of MJO phases and frequencies on extreme event probabilities, making it feasible to simulate a wide array of circulation states and examine their impacts under various climate change scenarios. By overcoming computational barriers, the study offers a clearer understanding of climate extremes in response to changing circulations for policymakers and stakeholders, enabling climate-informed resilience planning and evidence-based governance policy.

How to cite: Liu, X., Peng, X., and He, X.: A Counterfactual Emulator for Circulation-Driven Extremes in Southeast Asia, EGU General Assembly 2025, Vienna, Austria, 27 Apr–2 May 2025, EGU25-6594, https://doi.org/10.5194/egusphere-egu25-6594, 2025.

Between July 19 and 24, 2023, a multi-day outbreak of severe convective storms impacted Europe, affecting several countries. Northern Italy experienced multiple severe storms during this period, with July 24 marking the most intense day, particularly for hailstorms. On this day, three long-lived hailstorms caused significant damage, injured 119 people, and produced the largest hailstone ever observed in Europe—and the second largest globally—with a diameter of 19 cm. Recent studies highlight positive trends in both the frequency and intensity of convective environments favorable to thunderstorm activity in this region, alongside an increase in reports of large hail events.

This case study examines these trends in the context of the July 24, 2023, event, aiming to determine whether significant changes have occurred that may have increased the likelihood or severity of such an event. We employ a storyline approach based on circulation analogs to analyze the atmospheric conditions leading to this hailstorm.

Results show that similar events are fuelled by much larger CAPE today compared to just a few decades ago, likely linked to the strong upward trend in Mediterranean sea surface temperatures, coupled with a modest decrease in bulk wind shear. Additionally, the data suggest a potential intensification of the dynamics underlying similar configurations over the past 70 years, due to steepening of the horizontal geopotential gradient across the region. 

How to cite: Pons, F.: Analogs-based attribution of the July 24th, 2023 extreme hail storms in northeastern Italy, EGU General Assembly 2025, Vienna, Austria, 27 Apr–2 May 2025, EGU25-6770, https://doi.org/10.5194/egusphere-egu25-6770, 2025.

Extreme weather events have been increasing as global temperatures rise. Semi-enclosed basins such as the Black Sea and the Mediterranean are particularly susceptible to extreme weather due to their unique topographic features and land-sea distribution. Extreme precipitation events on the north-facing slopes of the mountains in the Black Sea Region occur due to relatively cold air interacting with the warm sea and being orographically lifted over the mountains. On August 10-12 2021, a deadly flash flood occurred on the coast of the Black Sea in Northern Türkiye which resulted in excessive precipitation (200-450 mm) causing loss of lives of 97 people and leaving 228 injured. We investigated extreme weather event which occurred near the Black Sea along with future climate conditions using the Pseudo-Global Warming method. In order to analyze the event, we used a numerical weather prediction model (WRF) in convection-permitting 3 km horizontal resolution with a domain covering the Black Sea and surrounding area. The model simulations are driven by ECMWF Reanalysis 5th Generation (ERA5) data for initial and boundary conditions. To derive climate change signals, we used 25 CMIP6 Earth System Models and eliminating the rest of the models that have no ocean model component over the Black Sea. The signals are computed for three different future periods (2025–2049, 2050–2074, and 2075–2099) relative to the 1990–2014 historical period. Each climate change signal which represents different periods were added to ERA5 6-hourly data as ensemble means. In the first future period (2025-2049), sea surface temperature (SST) in August is projected to increase by 1.7 °C, and by the end of the period (2075-2099), SST is expected to rise by 5 °C over the Black Sea. Additionally, while near-surface air temperatures in August are projected to increase by 1.5 °C to 2.5 °C initially, they are expected to rise by approximately 5.5 °C to 8.5 °C in the final period over the simulation domain. Moreover, near-surface relative humidity over land in August is simulated to decrease by nearly 10% in the last quarter of the century. The findings of this study will contribute to our understanding of how extreme precipitation events develop under future climate conditions and provide insights of the physical and dynamic processes that could drive these events in a warmer world.

How to cite: Şahinoğlu, S. and Önol, B.: Convective Permitting Simulations for Excessive Precipitation Event Under Pseudo-Global Warming in the Black Sea Region, EGU General Assembly 2025, Vienna, Austria, 27 Apr–2 May 2025, EGU25-6834, https://doi.org/10.5194/egusphere-egu25-6834, 2025.

EGU25-8204 | Orals | CL3.2.4 | Highlight

Was July 2021 extreme rainfall in western Germany close to the worst possible?  

Vikki Thompson, Rikke Stoffels, Hylke de Vries, and Geert Lenderink

In July 2021 extreme rainfall associated with a cut-off low pressure system led to huge impacts in western Germany, Belgium, and the Netherlands. The event was costly both in terms of loss of life and insurance damages. We use a multi-method approach to examine the event and to assess whether it could have been even worse. Using atmospheric analogues from reanalysis, pseudo global warming simulations, and a boosted ensemble of a dynamically similar event we show that the observed rainfall pattern is highly sensitive to the large-scale dynamics. For example, although good dynamical analogues are found in reanalysis, these do not all show the same hazards – with many showing very little rainfall.  

Our results suggest the magnitude of rainfall experienced was very unusual, perhaps close to the worst possible in the current climate, as small dynamical changes lead to a drastic reduction of the rainfall. 

How to cite: Thompson, V., Stoffels, R., de Vries, H., and Lenderink, G.: Was July 2021 extreme rainfall in western Germany close to the worst possible? , EGU General Assembly 2025, Vienna, Austria, 27 Apr–2 May 2025, EGU25-8204, https://doi.org/10.5194/egusphere-egu25-8204, 2025.

EGU25-8539 | ECS | Posters on site | CL3.2.4

Meteorological Conditions during Compound Wind and Precipitation Extremes in Coastal Southeast Asia 

Diah valentina lestari, Wei jian, and Edmond yatman lo

Compound precipitation and wind (CWP) extreme events can bring a destructive impact to cities located along coastal areas. Total seasonal occurrence of CWP extreme events reaches its highest number of more than sixty events per year in several coastal cities of Southeast Asia (SEA) with a peak occurrence during summer (June-September). This study investigates nine meteorological variables to identify linkages between atmospheric conditions and CWP extreme events using the Coordinated Regional Climate Downscaling Experiment for Southeast Asia (CORDEX-SEA) dataset. These nine variables are chosen due to their importance as trigger factors to convections and wind gusts, e.g. equivalent potential temperature to represent moist enthalpy and atmospheric static stability as affecting wind gusts. Twelve coastal cities across Vietnam (five cities), the Philippines (three cities), Thailand (two cities), Cambodia (one city), and Myanmar (one city) are grouped into four groups with similar climatological patterns of the nine meteorological variables during the historical summer period (1975-2005). All groups imply the importance of their regional underlying zonal and meridional wind anomaly, outgoing longwave radiation (OLR) anomaly, and low-level moisture flux conditions during CWP extreme events days. CWP days for Group 1 (Cebu, Davao, and Metro Manila) are associated with low-level moisture convergence, negative OLR anomaly, and stronger zonal wind anomaly that enhances the precipitation intensity and wind gusts. The presence of a low-pressure system over the northern part of Metro Manila may also influences the CWP extremes for Group 1. Similarly, as a group that is prone to tropical cyclones, Group 2 (Da Nang, Hanoi, and Hai Phong) are also affected by similar dominant factors as Group 1 with an additional factor from the meridional wind anomaly. Located in between the South China Sea and the Indian Ocean, Group 3 (Yangon, Bangkok, and Chon Buri) is dominantly affected by low-level moisture convergence, zonal wind anomaly, and warm-moist transports from the Indian Ocean. Group 4 (Can Tho, Ho Chi Minh City, and Phnom Penh) shows a similar metrological pattern as Group 3 without notable changes in warm-moist transports. The regional means of these nine meteorological variables are further applied to train a Support Vector Machine (SVM) with an additional unbalanced data handling stage prior to the model training process. The best-trained SVM model results in the highest f1 score of 0.78 and 0.76 on the model’s testing set for Group 3 and 4. Further evaluation of the trained SVM model shows that the model’s predictions on a testing dataset fall within the 95% confidence interval. The best model is next used to predict the occurrence of CWP extreme events in the summer of 2006-2023. This model results in a predictive f1 score of 0.61 for Group 3 and 0.54 for Group 4, corresponding to a total of 98% and 97% correctly predicted (true positive), respectively.

How to cite: lestari, D. V., jian, W., and lo, E. Y.: Meteorological Conditions during Compound Wind and Precipitation Extremes in Coastal Southeast Asia, EGU General Assembly 2025, Vienna, Austria, 27 Apr–2 May 2025, EGU25-8539, https://doi.org/10.5194/egusphere-egu25-8539, 2025.

EGU25-8602 | ECS | Orals | CL3.2.4

Climate change caused the catastrophic severity of Cyclone Daniel over Libya in 2023 

Laurenz Roither, Douglas Maraun, and Heimo Truhetz

Cyclone Daniel was the deadliest Mediterranean storm on record and struck Greece and Libya in September 2023. In our study, we aim to disentangle the factors contributing to the severity of the event, with a focus on the influence of anthropogenic climate change. To this end we utilized a process-based, conditional attribution approach and simulated storylines of the event with a convection permitting regional climate model under actual and counterfactual conditions. Specifically, we tested how cyclone Daniel would have unfolded (1) in a 1970s world with 1°C less climate change; (2) without the prevalent Mediterranean sea surface temperature anomaly of +1.3 °C; and (3) with decreased soil moisture in the Balkans assuming no rainfall anomalies had occurred in the months prior to the event. Climate response uncertainties have been approximately accounted for by imposing climate change signals from different GCMs. 

Our simulations show that 1°C of climate change only moderately influenced the cyclone's extreme precipitation during its early phase in Greece. In contrast, during its tropical-like Libyan phase, this level of climate change has amplified the severity of the event by a staggering 30 to 60%. Increased energy availability and convection led to the formation of a rare and destructive Medicane with a warm and rapidly deepening core. Artificially lowering only the sea surface temperatures reduced the meteorological hazards in both phases and underpins the importance of the Mediterranean as an energy and moisture source. Reducing soil moisture over the Balkans alone, although an important source for evapotranspiration during the early phase, did not substantially affect the intensity of the cyclone.

Our results demonstrate that current climate change can already be a game changer for individual extreme events and highlight the power of storylines to analyze the potentially destructive influence of climate change on rare extreme weather events.

How to cite: Roither, L., Maraun, D., and Truhetz, H.: Climate change caused the catastrophic severity of Cyclone Daniel over Libya in 2023, EGU General Assembly 2025, Vienna, Austria, 27 Apr–2 May 2025, EGU25-8602, https://doi.org/10.5194/egusphere-egu25-8602, 2025.

EGU25-9252 | ECS | Posters on site | CL3.2.4

How can the catastrophic risk potential of unseen climate extremes be understood? 

Tom Wood, Hebe Nicholson, Jenix Justine, and Tom Matthews

The Earth’s climate is heading into unprecedented territory, with the global mean surface temperature reaching record-breaking levels in 2024. Meanwhile, on regional scales, extreme events are becoming both more frequent and more severe, with some events being without precedent in the observational record. These types of ‘unseen’ events could result in very high-impact, potentially catastrophic impacts for society on a variety of temporal and spatial scales. However, due to the inherent uncertainty in the complex climate system, we have a poor understanding of the risk of unprecedented events, including what is physically and statistically plausible, and the role of critical thresholds in both the physical climate and societal responses. We also have limited capacity to imagine and anticipate events with no historical precedent. Given the risk of very high societal impacts, including mortality, morbidity, and other socio-economic vulnerabilities already possible under present climate conditions, and the potential for a substantial increase in the number of people exposed to these threats under climate change, it is critical that we improve our understanding of these unknown-likelihood unseen events.

In late 2024, a workshop was hosted at King’s College London to address the question of how to reduce the catastrophic risk potential from unseen climate extremes. Twenty-seven researchers participated from a range of disciplines to solicit a variety of perspectives on the question. This included, amongst others, contributions from physical climate scientists, researchers in existential threats, and social scientists. Here, we present the outcomes from these interdisciplinary discussions, including perspectives on the framing and definition of the problem, open research questions, and a research agenda to advance toward a more comprehensive understanding of risk and improved societal preparedness to facilitate pragmatic policy decisions. Areas of discussion included developments in large ensemble climate modelling; modelling of connected systems; counterfactual thinking; and risk-based limits to adaptation; as well as wider philosophical questions regarding what constitutes a catastrophic or existential risk and how this should be defined in a climate context.

How to cite: Wood, T., Nicholson, H., Justine, J., and Matthews, T.: How can the catastrophic risk potential of unseen climate extremes be understood?, EGU General Assembly 2025, Vienna, Austria, 27 Apr–2 May 2025, EGU25-9252, https://doi.org/10.5194/egusphere-egu25-9252, 2025.

EGU25-9371 | Posters on site | CL3.2.4

Storylines of heatwaves over Po Valley in a warmer World: drivers and impacts  

Antonello A. Squintu, Ronan McAdam, Jorge Pérez-Aracíl, César Peláez Rodríguez, Carmen Álvarez-Castro, and Enrico Scoccimarro

Heatwaves heavily affect European public health, society and economy. A full understanding of the drivers behind the occurrence and intensity of heatwaves (HWs) is one of the priorities of H2020 CLimate INTelligence (CLINT) project. Particular attention is given to the detection and attribution of HW and on the understanding of their future evolution thanks to the Storylines method. For the implementation of this technique, it is important to assess the capability of climate models in thoroughly identifying relationships between the drivers and the occurrence and intensity of HW. The relevant drivers of this extreme event are selected among a set of clustered variables on European and Global domains. This step is performed applying a feature selection algorithm (Probabilistic Coral Reef Optimization with Substrate Layers, PCRO-SL, Pérez-Aracil et al., 2023) to ERA5 summer data between 1981 and 2010, using as a target the Po Valley HW occurrence. The PCRO-SL is then applied to CMIP6 models, considering for each of them the period in which their Global Surface Air Temperature (GSAT) corresponds to the one of ERA5 between 1981 and 2010 (“current-climate”, 14.2°C). If a benchmark driver is selected for a CMIP6 model, its relationship with the target event is well resolved. The models that satisfy this requirement can be considered for an inspection of the non-linear and joint impacts of the drivers on Po Valley HWs in a future-climate scenario with higher GSAT. Thanks to this procedure it is possible to identify relevant pairs of drivers, whose combined influence on the target event is inspected by constructing Storylines. The projected evolutions of HWs over Po Valley corresponding to each scenario are displayed, highlighting the role of teleconnections and unveiling undocumented impacts.

Pérez-Aracil, J., Camacho-Gómez, C., Lorente-Ramos, E., Marina, C. M., Cornejo-Bueno, L. M., & Salcedo-Sanz, S. (2023). New probabilistic, dynamic multi-method ensembles for optimization based on the CRO-SL. Mathematics11(7), 1666.https://doi.org/10.3390/math11071666 

How to cite: Squintu, A. A., McAdam, R., Pérez-Aracíl, J., Peláez Rodríguez, C., Álvarez-Castro, C., and Scoccimarro, E.: Storylines of heatwaves over Po Valley in a warmer World: drivers and impacts , EGU General Assembly 2025, Vienna, Austria, 27 Apr–2 May 2025, EGU25-9371, https://doi.org/10.5194/egusphere-egu25-9371, 2025.

EGU25-10026 | ECS | Posters on site | CL3.2.4

Using seasonal forecast ensembles to estimate of low-probability high-impact events and unprecedented extremes 

Irene Benito Lazaro, Jeroen C. J. H. Aerts, Philip J. Ward, Dirk Eilander, Timo Kelder, and Sanne Muis

Extratropical cyclones (ETCs) can cause severe storm surges, leading to extreme sea levels, coastal flooding and significant economic losses. Accurate estimates of storm surge frequency and intensity are crucial for flood hazard assessments and effective risk mitigation. However, limited observational records pose a challenge for predicting low-probability high-impact events and unprecedented extreme surges, particularly in regions yet to experience such events.

Global synthetic datasets have demonstrated to be crucial in addressing these limitations by providing larger datasets that reduce uncertainties in risk estimates and capture unprecedented events. Despite their potential, a comprehensive large-scale dataset for ETC-induced storm surges is currently lacking.

In this study, we explore the feasibility of pooling ensembles from ECMWF’s SEAS5 seasonal forecasting system and integrating them with the Global Tide and Surge Model (GTSM) to generate realistic synthetic storm surge events. Using the resulting extended storm surge time series, we assess the storm surge risk for Europe, identify unprecedented surge events, and advance our understanding of their underlying large-scale physical drivers.

How to cite: Benito Lazaro, I., Aerts, J. C. J. H., Ward, P. J., Eilander, D., Kelder, T., and Muis, S.: Using seasonal forecast ensembles to estimate of low-probability high-impact events and unprecedented extremes, EGU General Assembly 2025, Vienna, Austria, 27 Apr–2 May 2025, EGU25-10026, https://doi.org/10.5194/egusphere-egu25-10026, 2025.

EGU25-10125 | ECS | Orals | CL3.2.4

Extremely Warm European Summers predicted more accurately by considering Sub-Decadal North Atlantic Ocean Heat Accumulation 

Lara Wallberg, Laura Suarez-Gutierrez, and Wolfgang A. Müller

In the past decades European summers were marked by extreme heat, marking the most severe warm seasons of temperature records. In particular, in 2003, 2018, and 2022, Europe experienced unprecedented extreme temperatures with temperature anomalies exceeding 2.5 standard deviations. The prolonged heat affected human health, agriculture, economy, and our whole ecosystem, highlighting the need for reliable climate predictions. By using the Max-Planck-Institute Earth System Model, we demonstrate that these extreme summers could have been predicted at least three years in advance by taking into account the preceding sub-decadal variations of heat content in the North Atlantic Ocean. By using a subset of ensemble members that can explicitly include the heat accumulation in the North Atlantic, the prediction skill of physical states, i.e. temperature could be improved, but also user-specific quantities in the agricultural sector, such as growing degree days, for both, Europe-wide and smaller scales for certain regions and specific growing degree day thresholds for crop harvests. These findings underscore the value of incorporating sub-decadal oceanic processes into user-relevant climate prediction methodologies. We demonstrate that the agricultural sector particularly benefits from improved predictions for growing degree days which allow for timely adaption and preparation against extreme heat.

How to cite: Wallberg, L., Suarez-Gutierrez, L., and Müller, W. A.: Extremely Warm European Summers predicted more accurately by considering Sub-Decadal North Atlantic Ocean Heat Accumulation, EGU General Assembly 2025, Vienna, Austria, 27 Apr–2 May 2025, EGU25-10125, https://doi.org/10.5194/egusphere-egu25-10125, 2025.

EGU25-10393 | ECS | Orals | CL3.2.4

Estimating Return Periods for Extreme Climate Model Simulations through Ensemble Boosting 

Luna Bloin-Wibe, Robin Noyelle, Vincent Humphrey, Urs Beyerle, Reto Knutti, and Erich Fischer

With climate change, heavy-impact extremes have become more frequent in different regions of the world. It is therefore crucial to further physical understanding of extremes, but due to their rarity in samples, this remains challenging.

One way to overcome this under-sampling problem is through Ensemble Boosting, which uses perturbed initial conditions of extreme events in an existing reference climate model simulation to efficiently generate physically consistent trajectories of very rare extremes in climate models. However, it has not yet been possible to estimate the return periods of these storylines, since the conditional resampling alters the probabilistic link between the boosted simulations and the underlying original climate simulation they come from.

Here, we introduce a statistical framework to estimate return periods for these simulations, by using probabilities conditional on the shared antecedent conditions between the reference and perturbed simulations. This theoretical framework is evaluated in and applied to simulations of the fully-coupled climate model CESM2. Our results show that return periods estimated from Ensemble Boosting are consistent with those of a 4000-year control simulation, while using approximately 5.8 times less computational resource use.

We thus outline the usage of Ensemble Boosting as a tool for gaining statistical information on rare extremes. This could be valuable as a complement to existing storyline approaches, but also as an additional method of estimating return periods for real-life extreme events.

How to cite: Bloin-Wibe, L., Noyelle, R., Humphrey, V., Beyerle, U., Knutti, R., and Fischer, E.: Estimating Return Periods for Extreme Climate Model Simulations through Ensemble Boosting, EGU General Assembly 2025, Vienna, Austria, 27 Apr–2 May 2025, EGU25-10393, https://doi.org/10.5194/egusphere-egu25-10393, 2025.

EGU25-10851 | Orals | CL3.2.4

Projected Evolution of Compound Temperature-Precipitation Extremes in the Arctic: Insights from a multi-model High-Resolution regional climate ensemble  

Chiara De Falco, Priscilla A. Mooney, Alok Kumar Samantaray, Ruth Mottram, Jan Landwehrs, Annette Rinke, Willem Jan van de Berg, Christiaan van Dalum, Oskar A. Landgren, Hilde Haakenstad, Bhuwan C. Bhatt, Clara Lambin, and Xavier Fettweis


The polar regions are among the most affected by global warming, making them particularly vulnerable to extreme events with significant impacts on the cryosphere, permafrost, and wildfires. Record-breaking temperature and precipitation extremes are becoming increasingly widespread and intense globally.  Extreme heat events are projected to increase in frequency, intensity, and duration throughout the 21st century. Furthermore, a sea-ice-free Arctic is becoming a probable scenario. This raises critical questions with significant implications for hazard assessment and adaptation policies: how will compound temperature-precipitation extremes evolve in the polar regions, and which areas will be most vulnerable? Addressing these questions is challenging due to the coarse resolution of current state-of-the-art (CMIP6) future projections. We use state-of-the-art simulations from the EU project PolarRES. They offer an unprecedentedly high-resolution (11 km) Pan-Arctic ensemble developed within the Polar-CORDEX framework. The simulations downscale two different CMIP6 models that are representative of the spread for CMIP6 projections under the SSP3-7.0 scenario. They provide a continuous 120-year (1985-2100) time series of hourly temperature and precipitation data.  We assess compound temperature-precipitation extreme events in the Arctic by mid and end of the century, with a focus on the intensity and persistence of these extremes. This extensive dataset allows us to confidently (1) pinpoint areas that may become more vulnerable to increased occurrences of extreme events in the future, (2) compare near-term, mid-century and end-century distributions and patterns, and (3) identify emerging trends. A clustering analysis will be used to identify regions of the Arctic with similar precipitation-temperature characteristics. With this approach, we can determine whether regions with distinct climate profiles exhibit different trends and behaviours. 

How to cite: De Falco, C., Mooney, P. A., Kumar Samantaray, A., Mottram, R., Landwehrs, J., Rinke, A., van de Berg, W. J., van Dalum, C., Landgren, O. A., Haakenstad, H., Bhatt, B. C., Lambin, C., and Fettweis, X.: Projected Evolution of Compound Temperature-Precipitation Extremes in the Arctic: Insights from a multi-model High-Resolution regional climate ensemble , EGU General Assembly 2025, Vienna, Austria, 27 Apr–2 May 2025, EGU25-10851, https://doi.org/10.5194/egusphere-egu25-10851, 2025.

EGU25-11051 | ECS | Posters on site | CL3.2.4

Preferred pathways of traveling extreme events in land precipitation and temperature 

Yu Huang, Kaiwen Li, Mingzhao Wang, and Niklas Boers

Extreme precipitation events and hot-weather events are usually examined at separate grids of a longitude-latitude map. A spatiotemporal perspective can provide additional insights, such as the spatial extent of extreme events and their potential traveling across the spatial domain over time. Here, we present the regular long-distance traveling patterns of these extreme events, highlighting the preferred spatial pathways through which the extreme precipitation events and hot-weather events tend to travel. Our in-depth analysis reveals that such long-distance traveling behaviors are influenced by midlatitude Rossby waves, and these preferred pathways can offer valuable information for early warning of downstream extreme events, potentially enhancing preparedness and response strategies.

How to cite: Huang, Y., Li, K., Wang, M., and Boers, N.: Preferred pathways of traveling extreme events in land precipitation and temperature, EGU General Assembly 2025, Vienna, Austria, 27 Apr–2 May 2025, EGU25-11051, https://doi.org/10.5194/egusphere-egu25-11051, 2025.

EGU25-11794 | ECS | Orals | CL3.2.4

The drivers of summer extreme temperature trends in Europe 

Luca Famooss Paolini, Salvatore Pascale, Paolo Ruggieri, Erika Brattich, and Silvana Di Sabatino

The frequency, duration and intensity of summer extreme temperatures over Europe have increased since the mid-20th century due to dynamic changes, thermodynamic factors, and their interaction via land—atmosphere feedbacks. However, a comprehensive analysis of all the mechanisms underlying their future trends, including an assessment of uncertainties due to inter-model differences and internal variability, is still lacking.

In this study, we investigate historical and future trends in the occurrence of atmospheric circulation patterns that triggered the three most intense heat waves during 1940—2022, identified using the Heat Wave Magnitude Index daily (Russo et al., 2015): the 2010 Russian, the 1972 Scandinavian and the 2003 French heat wave. To do that, we adopt the atmospheric flow analogue technique. We then decompose the trends of summer extreme temperature occurrences associated with these analogues in their thermodynamic, dynamic and interaction components, following Horton et al. (2015). The analyses are performed using large ensemble of climatic projections from six different models (three CMIP5 and three CMIP6), under the “business-as-usual" emission scenario. This approach allows us to investigate the role of the global warming, internal climate variability and model uncertainties on the European extreme temperature trends.

The results show a future increase in the occurrence of atmospheric circulation patterns similar to the 2003 French heat wave across all models. However, models generally underestimate observed historical trends, suggesting that future trends may be even higher. Furthermore, the results show that the extreme temperature occurrences associated with these analogues have increased in the historical period and will keep increasing in the future. In this context, trend partition analysis indicates that, while the historical trends were primarily driven by thermodynamic component, the future trends will be mainly driven by the interaction term. Interestingly, the interaction and dynamic components will explain a larger percentage of the total trend compared to the past, while the thermodynamic contribution will become less significant. Finally, the results suggest that land—atmosphere coupling processes will play a critical role in explaining the physical meaning of future interaction term and, thus, in driving projected increase in extreme temperature occurrences.

Results for the 2010 Russian and 1972 Finland heat waves generally align with those of the 2003 French heat wave. However, their dynamic trends are subjected to a certain degree of uncertainty due to inter-model differences, limiting the reliability of future dynamic projections and trend partition.

Bibliography

Horton, D. E., et al. (2015). Contribution of changes in atmospheric circulation patterns to extreme temperature trends. Nature, 522 (7557), 465-469.

Russo, S., et al., (2015). Top ten European heatwaves since 1950 and their occurrence in the coming decades. Environmental Research Letters, 10 (12), 124003.

How to cite: Famooss Paolini, L., Pascale, S., Ruggieri, P., Brattich, E., and Di Sabatino, S.: The drivers of summer extreme temperature trends in Europe, EGU General Assembly 2025, Vienna, Austria, 27 Apr–2 May 2025, EGU25-11794, https://doi.org/10.5194/egusphere-egu25-11794, 2025.

EGU25-12412 | Posters on site | CL3.2.4

The CANARI HadGEM3 Large Ensemble: Design and evaluation of historical simulations 

Reinhard Schiemann, Grenville Lister, Rosalyn Hatcher, Dan Hodson, Bryan Lawrence, Len Shaffrey, Ben Harvey, Steve Woolnough, Jon Robson, David Schröder, Adam Blaker, Hua Lu, and Tony Phillips

Large Ensembles, or Single Model Initial Condition Large Ensembles (SMILEs) of climate model simulations, have been produced by different modelling centres in recent years. Here, we present the HadGEM3 Large Ensemble recently completed within the UK NERC multi-centre CANARI project. In the context of existing all-forcings Large Ensembles, noteworthy properties of the CANARI Large Ensemble are (i) a relatively high model resolution (60 km in the atmosphere in the mid latitudes, and about 25 km in the ocean), (ii) the availability of sub-daily output on a range of pressure levels to study weather systems, and (iii) boundary conditions allowing for regional modelling driven by the CANARI Large Ensemble for a range of CORDEX-like domains covering most land regions.

In this poster, we document the ensemble design and evaluate key aspects of historical ensemble performance against observational data, such as the global mean surface temperature evolution, the climatology of the Stratospheric Polar Vortex and of Sudden Stratospheric Warmings, the historical evolution of the Atlantic Meridional Overturning Circulation (AMOC), and trends of midlatitude storm tracks, Arctic Sea Ice area, and tropical Pacific sea surface temperature. Furthermore, an application is presented showing that analogues of the extremely hot North Atlantic sea surface temperature anomalies in the summer of 2023 can be found in the CANARI Large Ensemble, whereas there are no close analogues in the historical record.

(This poster has 40 authors, which exceeds the number of authors allowed in the abstract submission form.)

How to cite: Schiemann, R., Lister, G., Hatcher, R., Hodson, D., Lawrence, B., Shaffrey, L., Harvey, B., Woolnough, S., Robson, J., Schröder, D., Blaker, A., Lu, H., and Phillips, T.: The CANARI HadGEM3 Large Ensemble: Design and evaluation of historical simulations, EGU General Assembly 2025, Vienna, Austria, 27 Apr–2 May 2025, EGU25-12412, https://doi.org/10.5194/egusphere-egu25-12412, 2025.

EGU25-12916 | ECS | Orals | CL3.2.4

Evolution of the probability of record-shattering spatially compounding droughts in a changing climate  

Ji Li, Jakob Zscheischler, and Emanuele Bevacqua

Record-shattering events, defined as extreme events that exceed previous records by large margins, pose increasing risks under climate change. Concurrent soil moisture droughts across multiple crop-growing regions can severely impact the agricultural sector and global food security by exposing a large fraction of the global crop area to water stress. Here, using soil moisture data from Single Model Initial-condition Large Ensembles (SMILEs) over 1950-2099, we investigate the evolution of the probability of spatially compound droughts that shatter previous records in terms of total global crop area affected by droughts within the same year. Our results indicate that trends in mean soil moisture related to climate change are the major driver in the evolution of the record-shattering compound drought probability, while changes in variability (standard deviation of the time series)  are less important. We further attribute changes in the probability of such global-scale record-shattering events to trends in soil moisture in individual large crop-growing regions. By separating the distinct roles of long-term trends in mean conditions, variability of the soil moisture time series, as well as contributions from individual regions to global-scale record-shattering droughts across breadbaskets, this study provides novel insights on compound events threatening the global food security system.

How to cite: Li, J., Zscheischler, J., and Bevacqua, E.: Evolution of the probability of record-shattering spatially compounding droughts in a changing climate , EGU General Assembly 2025, Vienna, Austria, 27 Apr–2 May 2025, EGU25-12916, https://doi.org/10.5194/egusphere-egu25-12916, 2025.

EGU25-13073 | ECS | Orals | CL3.2.4

Dynamics-informed attribution of a record-shattering heavy precipitation event over Central Europe during Storm Boris (2024) 

Jacopo Riboldi, Ellina Agayar, Hanin Binder, Marc Federer, Robin Noyelle, Michael Sprenger, and Iris Thurnherr

Statistics-based extreme event attribution is often limited by the scarce availability of data and by the potentially inadequate representation of relevant physical processes in climate models. Storyline approaches, such as the ones involving large-scale flow analogs, can be used to constrain the impact of anthropogenic climate change on extreme events in a physically robust manner, complementing the information gained from statistics-based approaches.

In this work, we employ operational ECMWF analysis data and simulations from the CESM large ensemble (providing up to 1000 years of data) to characterize the dynamical evolution of Storm Boris, that brought a record-shattering precipitation event over central Europe between the 13th and the 16th of September 2024. Leveraging on the available large ensemble, we perform an analog-based attribution of the associated extreme precipitation informed by the peculiar atmospheric dynamics of the event.

The analysis is articulated in two parts. The first concerns a description of the salient dynamical features that made Storm Boris so extreme. Such features are: 1) a deep upper-level cut-off cyclone over the Mediterranean; 2) a slow-moving surface cyclone over eastern Europe; 3) a strong high-latitude blocking anticyclone building up during the event; and 4) moisture contributions from several sources across storm lifetime, rotating from the North Atlantic to the central and the eastern Mediterranean/Black Sea.

The second part is an analog-based attribution of the extreme precipitation that takes into account the pinpointed dynamical features. We show that a correct representation of the upper-level cut-off cyclone (using potential vorticity as a target field to determine analogs) and of the surface cyclone position at the time of the extreme precipitation (using a cyclone detection algorithm) drastically improves the quality of the detected large-scale flow analogs. Those two adjustments, informed by the knowledge of the dynamics of the event, allow to isolate the thermodynamical effect of climate change in a consistent manner and indicate a robust enhancement of extreme precipitation over central Europe for Boris-like storms occurring in a warmer climate.

How to cite: Riboldi, J., Agayar, E., Binder, H., Federer, M., Noyelle, R., Sprenger, M., and Thurnherr, I.: Dynamics-informed attribution of a record-shattering heavy precipitation event over Central Europe during Storm Boris (2024), EGU General Assembly 2025, Vienna, Austria, 27 Apr–2 May 2025, EGU25-13073, https://doi.org/10.5194/egusphere-egu25-13073, 2025.

An increase in the intensity of daily precipitation extremes is among the most robust responses to anthropogenic climate change. However, while many studies have focused on moderate extremes corresponding to the mean of annual maxima, or their median which corresponds to a return period of 2 years, high-impact extreme precipitation events are related to less studied events with much longer return periods (e.g. 100 years, or longer). The physical and statistical study of these events is hampered by the difficulty in building robust statistics in climate records only a few-decades long. In particular, it is still poorly understood whether moderate and high-impact precipitation extremes may intensify at the same rate, or whether differences may arise due to, for instance, changes in the frequency or meteorology of the driving weather events, in their seasonality, or in the balance between convective and stratiform precipitation.

We address this question by exploring the projected changes in tail heaviness of daily  precipitation extremes in 63 single-member simulations from the EURO-CORDEX ensemble, run at 12km resolution, in the RCP8.5 scenario. Tail heaviness (TH) is here defined as the ratio between the quantiles corresponding to the 100-year return period relative to the 2-year return period. Due to the difficulty in evaluating long return periods from single-member simulations, we first use the 50-member initial condition CRCM5 regional large ensemble, for which statistics can be accurately estimated, to test the ability of extreme value theory (GEV distribution) and Simplified Metastatistical Extreme Value theory (SMEV) in estimating changes in TH.

The results show that SMEV has a smaller root mean squared error than GEV in estimating changes in TH from 30-year long climate records extracted from the CRCM5 ensemble, proving it a better methodology for this purpose. When SMEV is applied to the CORDEX ensemble, a likely (66% to 90% of models) increase in TH is found in the Mediterranean region, while small and non robust changes are found in Central and Northern Europe. The robustness of the Mediterranean response is not detectable using GEV. The increase in TH is shown to constitute a sizable contribution to the increase in the 100-year level of Mediterranean precipitation extremes. A reduction in the number of precipitation events partly balances the increase in the 2-year return period, but has little impact on the 100-year return period, contributing to its faster relative intensification. 

We conclude that while in Central and Northern Europe the rate of change in moderate (2-year) and high-impact extremes cannot be distinguished from estimation uncertainties, great care is needed in the Mediterranean region, where the risk of exposure to high-impact precipitation events due to climate change may be increasing faster than what perceived based on the trends of moderate extremes

How to cite: Zappa, G., Marra, F., and Pascale, S.: High-impact Mediterranean precipitation extremes to increase faster than moderate extremes in the CORDEX future projections, EGU General Assembly 2025, Vienna, Austria, 27 Apr–2 May 2025, EGU25-13285, https://doi.org/10.5194/egusphere-egu25-13285, 2025.

EGU25-14675 | Posters on site | CL3.2.4

High-impact climate extremes in India 

Vimal Mishra, Dipesh Singh Chuphal, Urmin Vegad, Iqura Malik, Hiren Solanki, and Rajesh Singh
India's large population, high socio-economic vulnerability, intensive agriculture, and rapidly growing infrastructure make it particularly susceptible to extreme climate and weather events. Despite their significant economic implications and the costs of adaptation, high-impact climate extremes over the last 45 years (1980-2024) have not been comprehensively documented. In this study, we identify high-impact heatwaves, extreme precipitation events, floods, droughts, and combined hot and dry extremes that occurred during this period, using observations and model simulations. We also utilize climate model projections from the Coupled Model Intercomparison Project Phase 6 (CMIP6) and the CESM2 Large Ensemble Community Project (LENS2) to explore the analogues of these observed high-impact climate extremes. Furthermore, we investigate the occurrence and driving factors of these extremes in India under various levels of global warming. Our findings indicate that there will be a substantial increase in high-impact climate extremes in India if global mean temperatures exceed 2°C.
 

How to cite: Mishra, V., Chuphal, D. S., Vegad, U., Malik, I., Solanki, H., and Singh, R.: High-impact climate extremes in India, EGU General Assembly 2025, Vienna, Austria, 27 Apr–2 May 2025, EGU25-14675, https://doi.org/10.5194/egusphere-egu25-14675, 2025.

EGU25-14842 | Orals | CL3.2.4

Assessing record-breaking North Atlantic warming extremes in summer 2023 using reanalysis and Grand Ensemble simulations 

Katja Lohmann, Hayat Nasirova, Quan Liu, Johann Jungclaus, Daniela Matei, and Ben Marzeion

The marine heatwave in the North Atlantic in summer 2023 set new temperature records and raised concerns about the impact of climate change on oceanic extreme events. This study examines this record-breaking marine heatwave with a focus on the subpolar North Atlantic by analysing ECMWF ERA5 reanalysis data and the Max Planck Institute Grand Ensemble CMIP6 version (MPI-GE CMIP6).

We demonstrate that due to a superposition of the global warming background state and natural variability, individual members of MPI-GE CMIP6 reproduce a North Atlantic summer heat wave within recent decades, which matches the strength of the observed 2023 heatwave. We assess possible atmospheric and oceanic drivers, including those not discussed in the literature so far, such as the atmospheric circulation state and associated surface heat flux in the preceding winter or the oceanic heat transport convergence across the subpolar North Atlantic. Our results indicate that for the subpolar North Atlantic processes related to oceanic and atmospheric variability have significantly contributed to the record observed and simulated heatwaves. Based on the historical and future scenarios of MPI-GE CMIP6, we suggest that both frequency and intensity of marine heatwaves in the North Atlantic will increase significantly, which may have various impacts on marine ecosystems and regional climate.

How to cite: Lohmann, K., Nasirova, H., Liu, Q., Jungclaus, J., Matei, D., and Marzeion, B.: Assessing record-breaking North Atlantic warming extremes in summer 2023 using reanalysis and Grand Ensemble simulations, EGU General Assembly 2025, Vienna, Austria, 27 Apr–2 May 2025, EGU25-14842, https://doi.org/10.5194/egusphere-egu25-14842, 2025.

EGU25-14912 | Posters on site | CL3.2.4

Study on the Establishment of Dispatch Mechanism for Mobile Pumps Under Climate Change: A Case Study of Taiwan 

Jian-Li Lin, Hsun-Chuan Chan, and Chia-Chi Tang

Taiwan faces significant challenges due to climate change, as rainfall patterns are increasingly shifting toward short-duration, high-intensity events. Although the government has implemented various flood control projects, the protective capacity of existing infrastructure remains limited. Extreme rainfall can still lead to severe flooding, as evidenced by the 2018 flood in southern Taiwan. In addition to structural measures, non-structural approaches—such as the mobile deployment of mobile pumps, community-based disaster prevention initiatives, and water monitoring systems—are essential for mitigating risks and reducing losses.

Currently, the deployment of mobile pumps heavily relies on personnel experience and ad hoc government requests, underscoring the need for systematic and scientific dispatch mechanisms. This study integrates data from rainfall forecasts, QPESUMS, flood sensors, and pump distribution to develop a comprehensive dispatch mechanism for proactive deployment and disaster response. The proposed strategy aims to enhance the efficiency of flood prevention and mitigation efforts in vulnerable areas during extreme weather events.

Keywords: Mobile Pumps; Dispatch Mechanism; Climate Change

How to cite: Lin, J.-L., Chan, H.-C., and Tang, C.-C.: Study on the Establishment of Dispatch Mechanism for Mobile Pumps Under Climate Change: A Case Study of Taiwan, EGU General Assembly 2025, Vienna, Austria, 27 Apr–2 May 2025, EGU25-14912, https://doi.org/10.5194/egusphere-egu25-14912, 2025.

EGU25-15386 | ECS | Orals | CL3.2.4

Increased central and northern European summer heatwave intensity due to the forced changes in internal climate variability 

Goratz Beobide-Arsuaga, Laura Suarez-Gutierrez, Armineh Barkhordarian, Dirk Olonscheck, and Johanna Baher

In the past two decades, the intensity of European summer heatwaves has strongly increased due to anthropogenic emissions and associated rising global mean temperatures. On the one hand, the anthropogenic forcing is causing an increase in European summer temperatures, shifting European summer temperature distributions towards warmer values and intensifying European summer heatwaves. On the other hand, the anthropogenic forcing is expected to affect the internal climate variability under global warming, changing the variability of European summer temperatures. While the effects of the forced changes in internal variability have been long debated for mean or maximum summer temperatures, the effects of the forced changes in internal variability on European summer heatwave intensity under increasing global warming levels remain unknown. Using four state-of-the-art global climate model large ensembles, we find that the forced changes in internal variability will intensify central and northern European summer heatwaves. In central and northern Europe, soil moisture is projected to decrease, leading to frequent moisture limitations, enhancing land-atmospheric feedback, and increasing heatwave intensity and variability. On the contrary, the forced changes in internal variability will weaken southern European summer heatwaves. Southern Europe is projected to face significant soil moisture depletion, leading to more stable moisture-depleted conditions that reduce extreme temperature variability and heatwave intensity. Our findings imply that while adaptation to increasing mean temperatures in southern Europe should suffice to reduce the vulnerability to increasing European summer heatwave intensity, adaptation to increased temperature variability will also be needed in central and northern Europe.

How to cite: Beobide-Arsuaga, G., Suarez-Gutierrez, L., Barkhordarian, A., Olonscheck, D., and Baher, J.: Increased central and northern European summer heatwave intensity due to the forced changes in internal climate variability, EGU General Assembly 2025, Vienna, Austria, 27 Apr–2 May 2025, EGU25-15386, https://doi.org/10.5194/egusphere-egu25-15386, 2025.

EGU25-15441 | ECS | Posters on site | CL3.2.4

On the role of sea surface temperature variability in southern Arabian Peninsula extreme rainfall on 16th April 2024 

Subrota Halder, Basit Khan, Olivier Pauluis, Zouhair Lachkar, and Francesco Paparella

The United Arab Emirates (UAE) experienced unprecedented rainfall on 16th April 2024, with Al-Ain recording 254 mm and Dubai 142 mm in a single day, driven by a Mesoscale Convective System (MCS). This extreme event resulted from the interaction of cold air from higher latitudes pushed eastward by the subtropical jetstream with warm, moist air from the Arabian Sea. The unusually high sea surface temperature (SST) in the Arabian Sea, reaching 30.5°C (1°C above the 40-year average), was influenced by El Niño and one of the strongest positive Indian Ocean Dipole episodes on record, which enhanced evaporation and atmospheric moisture content. 


To investigate the role of anomalous SSTs, we conducted two numerical experiments using the Weather Research and Forecasting (WRF) model: one with the actual 2024 SST conditions from ERA5 and another with 1981-2020 SST climatology. Time series and probability density function analyses revealed that extreme rainfall was more widespread in the 2024-SST simulation compared to the climatology, with higher precipitable water content (40–60 mm) observed in the former, a range rarely seen in the latter. Further analysis of moisture transport and equivalent potential temperature confirmed that the warm SST-induced moisture played a pivotal role in driving the enhanced transport and heavy precipitation. 


These findings underscore the critical role of anomalously high SSTs in intensifying extreme rainfall events, highlighting the need for improved predictive models and resilient infrastructure to mitigate the growing risks posed by climate change in the region.

How to cite: Halder, S., Khan, B., Pauluis, O., Lachkar, Z., and Paparella, F.: On the role of sea surface temperature variability in southern Arabian Peninsula extreme rainfall on 16th April 2024, EGU General Assembly 2025, Vienna, Austria, 27 Apr–2 May 2025, EGU25-15441, https://doi.org/10.5194/egusphere-egu25-15441, 2025.

EGU25-15644 | Orals | CL3.2.4

  Recent extreme cold waves are likely not to happen again this century 

Aurélien Ribes, Yoann Robin, Octave Tessiot, and Julien Cattiaux

As the climate warms, cold waves are expected to become less intense and less frequent. Is there still a risk of reliving events comparable to the most intense cold spells we can remember? We analyze four remarkable cold spells that have occurred since 2010 in different regions: Western Europe, Texas, China, Brazil. We show that all these recent events have a moderate to high probability of not happening again by 2100 – typically 50% to 90% in an intermediate emissions scenario, depending on the event. The probabilities are even higher for iconic events of the 20th century or earlier. Our results suggest that the most intense cold snaps, and their associated icy landscapes in mid-latitude regions, are disappearing or have already disappeared due to anthropogenic climate change.

How to cite: Ribes, A., Robin, Y., Tessiot, O., and Cattiaux, J.:   Recent extreme cold waves are likely not to happen again this century, EGU General Assembly 2025, Vienna, Austria, 27 Apr–2 May 2025, EGU25-15644, https://doi.org/10.5194/egusphere-egu25-15644, 2025.

EGU25-15749 | Orals | CL3.2.4

Many reasons to safeguard the polar regions from dangerous geoengineering 

Marie G. P. Cavitte, Martin Siegert, and Heidi Sevestre and the Authors of "Safeguarding the polar regions from dangerous geoengineering"

Continued greenhouse gases emissions are warming our planet, with catastrophic consequences for its habitability and the natural world. Rapid and deep decarbonization to "net zero" carbon dioxide emissions will be needed to halt global warming, and must be achieved by 2050 to stay within the 2015 Paris Agreement thresholds. However, the public debate is increasingly exposed to claims that technological geoengineering "fixes" could reduce projected climate impacts, including in polar regions where current and projected changes have severe and irreversible consequences locally and globally. 

As a community of polar and cryosphere scientists, we have evaluated five highly publicized geoengineering proposals that are either focused on the polar regions or would have major impacts on these systems: stratospheric aerosol injection, sea curtains/sea walls to prevent warm waters reaching glaciers and ice shelves, sea ice management through modifying albedo and thickening sea ice, slowing ice sheet flow through basal water removal and ocean fertilization. Based on our rigorous analysis of technological availability, logistical feasibility, cost, predictable adverse consequences, environmental damage, scalability (in time and space), governance, and ethics, we conclude that none of these geoengineering ideas pass an objective and comprehensive test regarding its use in the coming decades. Instead, many of the proposed ideas are environmentally dangerous. Furthermore, funds spent in researching these ideas further is divesting from much needed research on mitigation and adaptation to climate change and bestow unwarranted public credibility to these geoengineering schemes. We stress that given their feasibility challenges and risks of negative consequences, these ideas should not distract from the foremost priority to reduce greenhouse gas emissions and achieve successful adaptation.

How to cite: Cavitte, M. G. P., Siegert, M., and Sevestre, H. and the Authors of "Safeguarding the polar regions from dangerous geoengineering": Many reasons to safeguard the polar regions from dangerous geoengineering, EGU General Assembly 2025, Vienna, Austria, 27 Apr–2 May 2025, EGU25-15749, https://doi.org/10.5194/egusphere-egu25-15749, 2025.

EGU25-15809 | ECS | Orals | CL3.2.4

From Greenland to the Mediterranean Sea: Unveiling a new cascade mechanism under anthropogenic warming? 

Juan Jesús González-Alemán, Marilena Oltmanns, Sergi González-Herrero, Markus Donat, Francisco Doblas-Reyes, Frederic Vitard, Jacopo Riboldi, Carmen Álvarez-Castro, David Barriopedro, and Bernat Jiménez-Esteve

On 17 August 2022, the western Mediterranean experienced an unusual thermodynamic environment with extremely high unstable atmospheric conditions, combined with strong wind shear. These conditions, occurring ahead of an eastward-moving weather disturbance called a shortwave trough, led to the formation of a bow-shaped system of thunderstorms. This system produced a long path of severe winds, stretching from the Balearic Islands to southern Czech Republic on 18 August. The strongest wind gust reached 62.2 m s⁻¹ at Corsica, where numerous records were beaten. Unfortunately, 12 people lost their lives, and 106 were injured during this event. Such a system was classified as a derecho, a type of long-lasting and severe windstorm generated by a line of thunderstorms.

A record-breaking marine heatwave (MHW) was present in the western Mediterranean simultaneously during the summer of 2022, peaking in July. The sea surface temperature (SST) was more than 3 °C above normal levels in the region where the storm developed. The extremeness of the summer 2022 MHW is evidenced by the high SST anomalies in the first half of August 2022, ranking first among all years since 1940. An attribution exercise with numerical experiments and novel results (González-Alemán et al., 2023) indicated that this derecho event was substantially amplified by the extreme MHW and suggested that current anthropogenic climate change forcing contributed to triggering the severe storm by creating an environment more favourable for convective amplification. The study demonstrated that in case a similar dynamical synoptic situation had happened in a preindustrial climate, the derecho would have not developed, highlighting the role of thermodynamic contributions from global warming. However, no answers can be obtained regarding its dynamical contribution.

Thus, to further investigate this event and the dynamical role of global warming in it, we explore the atmospheric mechanisms that potentially can lead to such a record-breaking event, from the atmospheric dynamics and circulation point of view, and try to answer why climate change has played a crucial role from this perspective.

How to cite: González-Alemán, J. J., Oltmanns, M., González-Herrero, S., Donat, M., Doblas-Reyes, F., Vitard, F., Riboldi, J., Álvarez-Castro, C., Barriopedro, D., and Jiménez-Esteve, B.: From Greenland to the Mediterranean Sea: Unveiling a new cascade mechanism under anthropogenic warming?, EGU General Assembly 2025, Vienna, Austria, 27 Apr–2 May 2025, EGU25-15809, https://doi.org/10.5194/egusphere-egu25-15809, 2025.

EGU25-15941 | ECS | Orals | CL3.2.4

Anthropogenic Climate Change Attribution to a Record-breaking Precipitation Event in October 2024 in Valencia, Spain  

Carlos Calvo-Sancho, Javier Díaz-Fernández, Juan Jesús González-Alemán, César Azorín-Molina, Amar Halifa-Marín, Ana Montoro-Mendoza, Pedro Bolgiani, Santiago Beguería, Sergio M. Vicente-Serrano, Ana Morata, and María Luisa Martín

Cut-off lows are, and will be in the future, one of the main threats related to severe weather in the Iberian Peninsula, especially in the Mediterranean arc. Cut-off lows are often accompanied by heavy precipitations in a short time promoting flash-floods, as well as hail, strong convectively wind gusts and/or tornadoes.   

On the week of October 27th – November 4th, 2024, a cut-off low affected the Iberian Peninsula with extreme socio-economical impacts in several Spanish regions and, especially, in the Valencia area. The phenomena on the surface have varied depending on the region: large hail (5-7 cm), several tornadoes, strong wind gusts and, above all, extreme precipitations. The most severe day was October 29th in the Valencia region, with rainfall accumulations higher than 300 mm in a notable area and locally registering 771 mm in 24 hours. In addition, the Turís official weather station registers numerous rainfall intensity national records. Moreover, the convective system promotes 11 tornadoes (two of them with intensity IF2) and large hail (~ 5 cm). The social impact of the floods in Valencia was very high, with more than 16.5 billion euros of damage to infrastructure (roads, railways, etc.), housing and croplands, as well as 231 fatalities and three missing.

In this survey, we focus on Valencia’s floods on October 29th. Here, by performing model simulations with the WRF-ARW model and using a storyline approach, we find an enhancement in intensity and a significant increase in extreme accumulated rainfall area (e.g., 100 mm, 180 mm, 200 mm, and 300 mm) caused by current anthropogenic climate change conditions compared to preindustrial ones.

How to cite: Calvo-Sancho, C., Díaz-Fernández, J., González-Alemán, J. J., Azorín-Molina, C., Halifa-Marín, A., Montoro-Mendoza, A., Bolgiani, P., Beguería, S., Vicente-Serrano, S. M., Morata, A., and Martín, M. L.: Anthropogenic Climate Change Attribution to a Record-breaking Precipitation Event in October 2024 in Valencia, Spain , EGU General Assembly 2025, Vienna, Austria, 27 Apr–2 May 2025, EGU25-15941, https://doi.org/10.5194/egusphere-egu25-15941, 2025.

EGU25-16597 | Orals | CL3.2.4 | CL Division Outstanding ECS Award Lecture

Physical drivers and statistical properties of high impact climate extremes  

Kai Kornhuber

Accurately modeling emerging physical climate risks to natural and societal systems—such as global supply chains, the food system, health, and critical infrastructures—is essential for effective preparedness and honest discussions about the consequences of rising greenhouse gas emissions.

A series of anomalous weather events that shattered previous records by wide margins has —yet again—highlighted the need for an improved understanding of the physical processes behind weather and climate extremes, their statistical characteristics, and our ability to project them under future emission scenarios using climate models.

In this Award lecture, I will present an overview of recent studies and preliminary findings that explore the mechanisms and physical drivers of high-impact climate extremes, as well as their statistical characteristics, such as simultaneous or sequential occurrences, which can lead to high societal impacts under current and future climate conditions and will reflect on our capacity to reproduce such events in climate models.

How to cite: Kornhuber, K.: Physical drivers and statistical properties of high impact climate extremes , EGU General Assembly 2025, Vienna, Austria, 27 Apr–2 May 2025, EGU25-16597, https://doi.org/10.5194/egusphere-egu25-16597, 2025.

EGU25-16878 | Posters on site | CL3.2.4

The impact of carbon neutrality timing on climate extremes in East Asia 

Su-Jeong Kang, Hyun Min Sung, Jisun Kim, Jae-Hee Lee, Sungbo Shim, Hyomee Lee, Pil-Hun Chang, and Young-Hwa Byun

Carbon neutrality is an essential approach for the mitigation of climate change and plays a key role in the implementation of the Paris Agreement. This study analyzes future climate change in East Asia using carbon neutrality scenarios(Shared Socioeconomic Pathways SSP1-1.9, SSP1-2.6, SSP4-3.4, and SSP5-3.4-OS) and evaluates how earlier carbon neutrality could mitigate the impact of extreme climate events. Using carbon neutrality scenarios and indices of temperature and precipitation based on ETCCDI(Expert Team an Climate Detection and Indices), we analyzes frequency and intensity of climate extremes.  Furthermore, we defined the Fraction of Avoidable Impact(FAI) to evaluate the extent of impact that can be avoided when achieving carbon neutrality, similar to the SSP1-1.9 scenario. For the extreme temperature, FAI values of intensity(frequency) were projected to be approximately 33-42%(33-35%) in the SSP1-2.6 scenario and 49-54%(49-53%) in the SSP4-3.4 scenario, indicating a relatively larger increase in intensity.  In the case of extreme precipitation, FAI values of intensity(frequency) were projected to be about 25%(26-31%) in the SSP1-2.6 scenario and 40%(38-47%) in the SSP4-3.4 scenario, showing a similar trend of relatively larger increase in intensity as observed for extreme temperature. These findings emphasize that if the timing of achieving carbon neutrality is advanced to align with the Paris Agreement, the impact of climate extremes will be significantly reduced. 

This research was funded by the Korea Meteorological Administration Research and Development Program “Development and Assessment of Climate Change Scenario” under Grant (KMA2018-00321). 

How to cite: Kang, S.-J., Sung, H. M., Kim, J., Lee, J.-H., Shim, S., Lee, H., Chang, P.-H., and Byun, Y.-H.: The impact of carbon neutrality timing on climate extremes in East Asia, EGU General Assembly 2025, Vienna, Austria, 27 Apr–2 May 2025, EGU25-16878, https://doi.org/10.5194/egusphere-egu25-16878, 2025.

Following the extreme European summer heatwave of 2003, it has been suggested that the event might have been associated with changes in the distribution of summer temperatures. Here we revisit this hypothesis and investigate observed European and Swiss summer temperatures for the period 1864-2024.

The pronounced increase in skewness has a number of important implications: (1) It implies that extreme hot summers have become more frequent than expected from the median warming. In particular, the increase in skewness strongly affects estimates of the probability of extreme summer heatwaves such as 2003 and 2018. (2) It is demonstrated that the increase in skewness can partly be explained by the accelerating warming around 1980. It is thus not clear whether the high values in skewness will persist into the future. (3) There is a statistically significant difference in the trends of median and mean warming, with mean temperatures warming stronger than the median. (4) These different warming rates explain a non-negligible fraction of the so-called mismatch (i.e., summer temperatures in observations have warmed stronger than in CMIP and CORDEX scenarios). (5) It is demonstrated that understanding this mismatch requires an assessment of extreme summer temperatures, beyond the more commonly used mean summer temperature trends.

We will also provide estimates of the frequency of 2003-like summer heatwaves for the current and future climate, making different assuptions about the persistence of the aformentioned changes in skewness.

How to cite: Schär, C. and Chiriatti, F.: Revisiting recent changes in European summer temperature distributions and assessing their role for extreme summer temperatures, EGU General Assembly 2025, Vienna, Austria, 27 Apr–2 May 2025, EGU25-17421, https://doi.org/10.5194/egusphere-egu25-17421, 2025.

EGU25-17450 | Orals | CL3.2.4

Future Heat Stress Projections in Northwestern Türkiye: Urbanization and Population Impacts in Istanbul 

Gökberk Ozan Tiryaki, Cemre Yürük Sonuç, Ayşegül Ceren Moral, and Yurdanur Ünal

The frequency and intensity of heat stress are expected to escalate markedly in the near future under various global climate change scenarios, with densely populated cities becoming hotspots because of the urban heat island effect. Therefore, heat stress analysis for highly populated cities is crucial since changes in this stress exacerbate vulnerability, increase health-related risks and impose constraints on outdoor activity. This study investigates changes in heat stress during 21st century in terms of frequency, intensity and durations while quantifying population exposure to heat stress covering Northwestern Türkiye, with particular attention to Istanbul, the most populous city in Türkiye with nearly sixteen million population.

In this study, we use climate simulations from convection-permitting model COSMO-CLM under SSP3-7.0 emission scenario to investigate future changes in heat stress. The analysis focuses on calculating Wet Bulb Temperature (WBT) values and assessing consecutive hours when Wet Bulb Temperature (WBT) is above specific thresholds, which are critical indicators of heat stress severity. In addition, we conduct comprehensive heat stress evaluation by computing Environmental Stress Index (ESI) values, an effective alternative to WBGT, to assess outdoor activity limitations. These analyses are performed for the reference period of 1985-2015 and extended to future periods of 2030-2039, 2050-2059, 2070-2079 and 2090-2099, providing a detailed temporal perspective on the progression of heat stress and its implications under changing climatic conditions.

WBT uses air temperature and relative humidity as its primary parameters while ESI incorporates radiation alongside air temperature and relative humidity. Thus, this study also comprehensively analyzes the role of radiation in amplifying heat stress. Our results reveal a remarkable seasonal shift in heat stress pattern within the study area with Istanbul standing out as a hotspot where heat stress indices are notably higher than those of other cities in the covered region, highlighting the effect of urbanization in heat stress dynamics.

Notably, ESI values in the southern parts of Istanbul, where urbanization is more concentrated, exceed critical thresholds that makes any physical activity to be hazardous especially by the end of this century. Moreover, projections demonstrate that in the late 21st century, majority of Istanbul’s population will be exposed to heat stress levels exceeding the risky thresholds. Furthermore, this study explores the extent of population exposure to heat stress, the duration of consecutive hours exceeding critical thresholds, and the percentage of areas where indices exceed their limits.

Key words: Climate modelling, heat stress, heat extremes, population exposure, COSMO-CLM

How to cite: Tiryaki, G. O., Sonuç, C. Y., Moral, A. C., and Ünal, Y.: Future Heat Stress Projections in Northwestern Türkiye: Urbanization and Population Impacts in Istanbul, EGU General Assembly 2025, Vienna, Austria, 27 Apr–2 May 2025, EGU25-17450, https://doi.org/10.5194/egusphere-egu25-17450, 2025.

EGU25-17451 | ECS | Posters on site | CL3.2.4

Disentangling drivers of compound heat and drought in Europe 

Victoria Dietz, Laura Suarez-Gutierrez, Leonard Borchert, and Wolfgang Müller

Future projections suggest that compound heat and drought in Europe will occur more frequently under increasing global warming. Year-to-year variability driven by atmospheric circulation patterns and decadal phenomena like the Atlantic Multidecadal Variability (AMV) temporarily dampens or amplifies these changes. As such, the frequency and intensity of these events can be affected by anthropogenic and natural drivers.
Disentangling these contributions is essential for understanding current events and the reliability of future projections, as well as for improving long-term predictions of such events and refining risk assessments. Although recent attribution studies have started to address the impact of natural climate variability, these studies are often limited to heat waves and do not explore other high-impact phenomena. Further, they are often based on observational data exclusively and therefore lack the sampling of internal variability that is required for a robust assessment. To address these gaps, we present a comprehensive analysis that quantifies the dynamical and thermodynamical contributions of not only global warming, but also considers internal climate variability using conditional attribution with atmospheric flow analogues. We use the CMIP6 version of the MPI Grand Ensemble (MPI-GE6) single-forcing (30 member) and historical (50 member) experiments to identify analogues based on real events from ERA5. This approach enables a clear separation and quantification of dynamical and thermodynamic contributions and how these change under different global warming states and under different forcing configurations, helping to better distinguish how both anthropogenic and natural factors influence high-impact heat and drought events in Europe.

How to cite: Dietz, V., Suarez-Gutierrez, L., Borchert, L., and Müller, W.: Disentangling drivers of compound heat and drought in Europe, EGU General Assembly 2025, Vienna, Austria, 27 Apr–2 May 2025, EGU25-17451, https://doi.org/10.5194/egusphere-egu25-17451, 2025.

The severity of the impacts of (convective) rainfall extremes in the past year alone, e.g., storm Boris and the flooding in middle Europe, or the flooding in the Valencia region, is mind blowing. With several hundreds of millimeters of rain falling in often fewer than 48 hours, the flooding was locally very disruptive, or even catastrophic. While often embedded in large-scale and reasonably well predictable (but anomalous) flow conditions, the level of small-scale detail and the role of smaller-scale (convective) processes that ultimately determine whether the situation "gets out of hand" - or not - is challenging both observation networks, and the NWP and climate-modelling centers. 

In this presentation we take the example of storm Boris that caused widespread flooding in Middle Europe in September 2024 to illustrate that only by simulating the event at very high resolution the true changes in the impacts are revealed. Using a pseudo-global warming (PGW) framework in which the event is placed in historic and possible future climate conditions, we show that on a local scale the response strongly exceeds the regional response. By subsequently matching the patterns to underlying population densities an impression is obtained of how this leads to a greatly elevated impact on society.

Different frameworks have been developed to analyse, attribute and project extreme events often immediately after, or even prior to the event. The regional PGW framework we are adopting here is but one of the several existing approaches based on analysing 'counterfactuals', i.e., simulating the event in a different climate. Another framework is that of dynamic analogues which relies on deriving paste-to-present or present-to-future changes, by selecting and comparing similar (observed or modelled) events based on large-scale flow similarity. In this approach therefore, the event is also captured. Structural similarity in terms of flow conditions is not required by the approach of world-weather attribution (WWA). The WWA-approach examines changing frequency and intensity of local or regional extremes using non-stationary extreme-value analysis of observational and model data, and blends these two lines of information. All methods have their advantages and disadvantages. At best, these methods give overlapping results, but in practice they highlight different aspects of the (past or future) changes. This forces one to think how to combine or merge the output from the different methodologies to provide society with the most relevant information and to better anticipate on the future changes. 

How to cite: de Vries, H. and Lenderink, G.: Local versus regional impact changes for storms like Boris (2024): insights from high-resolution pseudo global warming simulations, EGU General Assembly 2025, Vienna, Austria, 27 Apr–2 May 2025, EGU25-19142, https://doi.org/10.5194/egusphere-egu25-19142, 2025.

EGU25-19550 | Orals | CL3.2.4

Interlinks between marine heatwaves, multi-hazard extratropical cyclones, meteotsunamis and phytoplankton blooms over Northwest Europe: insight from a km-scale regional coupled model 

Segolene Berthou, Nefeli Makrygianni, Sana Mahmood, Dale Partridge, Juan Castillo, Alex Arnold, and Piyali Goswami

Climate change is bringing more marine heatwaves and more rainy extratropical cyclones, both trends already detectable. In parallel, storms are usually responsible for the ending of surface-based marine heatwaves. We employ a newly-developed regional coupled system at km-scale over Northwest Europe to show the relationships between marine heatwaves, storms and phytoplankton activity. We show that a marine heatwave amplified the rainfall, river flows, waves and surge of the most impactful storm of 2023 over the United Kingdom (storm Babet). We also show that storms terminating marine heatwaves can either increase or decrease phytoplankton activity, depending on seasonality. Finally, we show the high resolution, high frequency coupling system is also able to represent meteotsunamis (sub-tidal sea surface disturbances linked with slow-moving pressure disturbances), and opens a whole new area of research on compound convective systems and meteotsunami research. In addition to case-studies, we will present plans to use this coupled system across weather and climate time-scales, to increase our understanding and resilience to extreme compound events.

How to cite: Berthou, S., Makrygianni, N., Mahmood, S., Partridge, D., Castillo, J., Arnold, A., and Goswami, P.: Interlinks between marine heatwaves, multi-hazard extratropical cyclones, meteotsunamis and phytoplankton blooms over Northwest Europe: insight from a km-scale regional coupled model, EGU General Assembly 2025, Vienna, Austria, 27 Apr–2 May 2025, EGU25-19550, https://doi.org/10.5194/egusphere-egu25-19550, 2025.

EGU25-19798 | Orals | CL3.2.4

Moisture origin for the heavy precipitation event in Central and Eastern Europe in September 2024 

Marina Duetsch, Sarah Furian, Lucie Bakels, and Andreas Stohl

In September 2024, cyclone Boris brought intense precipitation to Central and Eastern Europe, causing severe flooding in Austria, Czech Republic, Poland, and neighboring countries. Understanding the processes that led to this event is important for improving the prediction and mitigation of similar events in the future. Here we trace the origin and transport pathways of the moisture contributing to the precipitation during the event using a Lagrangian moisture source diagnostic. The results show that evapotranspiration from land played a more important role than previously thought: most of the moisture came from the European continent, with additional contributions from the Mediterranean, Black, and Baltic Seas. To place the results in a broader context we compare them with a climatology of moisture sources based on a Lagrangian reanalysis dataset for the years 1940 - 2023. This provides additional insight into atmospheric processes driving heavy precipitation events in this region and highlights anomalous patterns associated with cyclone Boris.

Contributions of different source regions to precipitation in Central and Eastern Europe in September 2024. The figure shows the total precipitation from ECMWF (orange line) compared with the precipitation estimated by the Lagrangian moisture source diagnostic (blue line) and the contributions of different regions (defined in the upper left panel) in colors.

How to cite: Duetsch, M., Furian, S., Bakels, L., and Stohl, A.: Moisture origin for the heavy precipitation event in Central and Eastern Europe in September 2024, EGU General Assembly 2025, Vienna, Austria, 27 Apr–2 May 2025, EGU25-19798, https://doi.org/10.5194/egusphere-egu25-19798, 2025.

EGU25-21505 | Posters on site | CL3.2.4

Assessment of Surface Urban Heat Island over Bengaluru City in India 

Swadesh Mohapatra and Krushna Chandra Gouda

The population approaching 14 million in the Bengaluru's metropolitan area in South India and is grappling with various environmental challenges like poor urban planning, including unchecked urbanization, air pollution, water scarcity, and waste management issues etc. The impact of climate change (CC) is also well observed in the urban Bengaluru resulting in the local Urban Heat Island (UHI). The interaction between local UHI and global CC creates challenges to human health, wellbeing and development. This study uses MODIS-Aqua Land Surface Temperature (LST) data for a decade (i.e., 2015-2024) to examine the UHI effect over the city. Climatological analysis of night time LST shows an average annual temperature-increasing trend between the urban Bengaluru and its neighboring suburbs and villages. This difference is computed at monthly scale and the fluctuations are being estimated using the satellite and validated against the ground observations. The Land use Land cover estimation are also linked to the UHI effect and the role of vegetation cover in the LST distribution is also quantified and it indicates the direct impact. This study will help in understanding the LST dynamics in the UHI effect over a rapidly urbanization city and can be used in the climate projection studies offering a ways to guide the urban planners, disaster managers and policy makers.

How to cite: Mohapatra, S. and Gouda, K. C.: Assessment of Surface Urban Heat Island over Bengaluru City in India, EGU General Assembly 2025, Vienna, Austria, 27 Apr–2 May 2025, EGU25-21505, https://doi.org/10.5194/egusphere-egu25-21505, 2025.

The way life on Earth adapts to the climate can change the climate. In the Anthropocene, humans have become a planetary force dominating the biosphere. Could human climate adaptation therefore have substantial feedback effects on the Earth system? We work out the bio-geo-physical mechanisms of adaptation within a new Earth system-based framework of human climate adaptation. Thereby we can for the first time approximate the contribution of climate adaptation to the current state of affected planetary boundaries. By establishing what we call artificial climate niches, Homo sapiens is the only known species able to fully emulate all recorded climates on Earth at a small scale. Many of those niches exceed the human scale by orders of magnitude but still remain small at Earth system scales. Yet climate adaptation-Earth system-feedbacks are extremely disproportional to scale. Linking research from various domains, we find that human climate adaptation currently contributes ≥25.7 percent of annual greenhouse gas emissions and ≥73.2 percent of human freshwater withdrawals. Climate adaptation even affects the stratosphere: the ozone hole is largely a product of climate adaptation. The large majority of those impacts likely still results from adaptation to mostly stable Holocene climates and not yet from adaptation to climate change. This proves both the importance and the urgency of establishing a safe and just operating space for human climate adaptation.

How to cite: Grudde, B.: The human climate: towards an Earth system-based perspective on human climate adaptation, EGU General Assembly 2025, Vienna, Austria, 27 Apr–2 May 2025, EGU25-1992, https://doi.org/10.5194/egusphere-egu25-1992, 2025.

EGU25-2758 | ECS | Orals | CL3.2.6

Widespread forest-savanna coexistence but limited bistability at a landscape scale in Central Africa 

Aart Zwaan, Arie Staal, Mariska te Beest, and Max Rietkerk

Tropical forest and savanna frequently coexist under the same climatic conditions, which has led to the hypothesis that they could represent alternative ecosystem states, stabilized by internal feedbacks. An implication of this hypothesis is that forest and savanna may be bistable and exhibit tipping behavior in response to changing conditions. However, we pose that the local presence of forest and savanna within coexistence landscapes is not sufficient evidence that these are alternative stable states at larger ecosystem scales. Therefore, we explore forest-savanna coexistence and bistability at landscape scale in Central Africa. Using remote sensing data on tree cover, we classify 10 x 10 km landscapes as homogeneous forest, homogeneous savanna, or coexistence, and analyze the factors driving their distributions. We find that the precipitation ranges for which homogeneous forest and savanna occur have only limited overlap, and that this overlap can largely be explained by other external drivers, such as seasonality, soil sand content, and elevation. Conversely, local coexistence of forest and savanna under the same climatic and edaphic conditions is common within landscapes. In these coexistence landscapes, however,  the spatial configuration of tree cover can often be predicted based on topographic variables, indicating that the apparent bistability of forest and savanna is likely caused by local redistribution of resources, rather than internal feedbacks. Considering the limited evidence found for forest and savanna as true alternative ecosystem states, particularly at landscape scale, we conclude that the likelihood of tipping between both states may be lower than previously thought. Intermediate coexistence states, facilitated by topographic heterogeneity, may lead to more gradual and reversible transitions between tropical forest and savanna, increasing the resilience of these ecosystems to changing drivers and disturbances.

How to cite: Zwaan, A., Staal, A., te Beest, M., and Rietkerk, M.: Widespread forest-savanna coexistence but limited bistability at a landscape scale in Central Africa, EGU General Assembly 2025, Vienna, Austria, 27 Apr–2 May 2025, EGU25-2758, https://doi.org/10.5194/egusphere-egu25-2758, 2025.

EGU25-3432 | ECS | Orals | CL3.2.6

The fate of Amazon precipitation after massive deforestation 

Arim Yoon and Cathy Hohenegger

Deforestation in the Amazon has been predicted to cause irreversible forest dieback, primarily due to significant reductions in mean precipitation driven by decreased evapotranspiration. However, these results are based on conventional climate models that use convective parameterizations and/or limited boundaries, leading to precipitation with high sensitivity to evapotranspiration and restricted large-scale interactions. To overcome these limitations, we use a storm-resolving global climate model run at a 5km grid spacing to simulate the response of precipitation to complete deforestation over the Amazon basin. We find no significant change in annual precipitation and a distinct spatial pattern of precipitation change compared to previous studies. This suggests that the Amazon may be more resilient to deforestation than previously thought. However, we do observe an increase in the intensity of extreme hourly precipitation at both ends – no rain and violent rain – after deforestation, indicating potential risks to the forest ecosystem. We identify key mechanisms that differentiate the storm-resolving model from previous conventional models, highlighting the missed basic physical processes in previous studies, which distorted their response to precipitation to Amazon deforestation. Additionally, we underscore the importance of considering short-term precipitation, often masked by long-term averages, to more accurately evaluate the impacts of deforestation.

How to cite: Yoon, A. and Hohenegger, C.: The fate of Amazon precipitation after massive deforestation, EGU General Assembly 2025, Vienna, Austria, 27 Apr–2 May 2025, EGU25-3432, https://doi.org/10.5194/egusphere-egu25-3432, 2025.

EGU25-4777 | Posters on site | CL3.2.6

Integrated framework for assessing coastal water auto-purification potential 

Morena Galešić Divić, Vladimir Divić, Darko Koračin, and Roko Andričević

In tourism-oriented coastal regions, maintaining water quality is critical amidst growing anthropogenic pressures. Balancing the natural auto-purification capacity of coastal waters with human interventions requires innovative approaches to mitigate and manage pollution. This study presents a multidisciplinary and integrated framework for assessing auto-purification potential, demonstrated through a case study in the Brač Channel and Kaštela Bay in the Eastern Adriatic Sea. Using the results of atmospheric-oceanographic modelling with WRF-ROMS, Lagrangian particle tracking was applied to simulate non-conservative pollutant transport under varying hydrodynamic conditions. Stochastic ensemble analysis and spatially integrated statistics were utilized to develop a novel, scale-adaptive methodology for quantifying auto-purification potential. Results revealed significant differences in pollutant dispersion during characteristic Bora and Sirocco events, offering actionable insights for monitoring strategies and managing additional pressure inputs. While focused on this case study, the framework provides a scalable approach for evaluating and sustaining water quality in other critical recreational coastal zones.

How to cite: Galešić Divić, M., Divić, V., Koračin, D., and Andričević, R.: Integrated framework for assessing coastal water auto-purification potential, EGU General Assembly 2025, Vienna, Austria, 27 Apr–2 May 2025, EGU25-4777, https://doi.org/10.5194/egusphere-egu25-4777, 2025.

EGU25-8514 | ECS | Orals | CL3.2.6

Causal pathway from AMOC to Southern Amazon Rainforest indicates stabilising interaction between two climate tipping elements 

Annika Högner, Giorgia Di Capua, Jonathan F. Donges, Reik V. Donner, Georg Feulner, and Nico Wunderling

Climate tipping elements like the Atlantic Meridional Overturning Circulation (AMOC) and the Amazon Rainforest (AR) are critical components of the Earth system that currently both show declining trends in their resilience due to anthropogenic climate change and other human disturbances such as deforestation. A shutdown of the AMOC or a large-scale dieback of the AR would have severe impacts on a global scale. Additionally, AMOC and AR are not independent from each other but disturbances from one system can propagate to the other. The sign and strength of this interaction has so far been classified as unknown by recent literature surveys. Using causal discovery and inference methods on observational and reanalysis data, we find that AMOC weakening increases precipitation in the Southern Amazon during the critical dry season. Specifically, a 1 Sv AMOC weakening results in 4.8% additional dry season precipitation, amounting to a 16.5% increase under the current estimated 3.45 Sv AMOC weakening since 1950. These findings, supported by multiple data sources, suggest that the Southern AR drying trend due to global warming and deforestation, which amounts to 4 mm/year since 1982, would be even more severe without concurrent AMOC weakening. Our results demonstrate the potential of causal discovery in the data-driven study of tipping element interactions and contribute to the understanding of coupled AMOC-AR dynamics, with the potential to improve assessments of climate tipping risk under ongoing global warming.

How to cite: Högner, A., Di Capua, G., Donges, J. F., Donner, R. V., Feulner, G., and Wunderling, N.: Causal pathway from AMOC to Southern Amazon Rainforest indicates stabilising interaction between two climate tipping elements, EGU General Assembly 2025, Vienna, Austria, 27 Apr–2 May 2025, EGU25-8514, https://doi.org/10.5194/egusphere-egu25-8514, 2025.

EGU25-8987 * | ECS | Posters on site | CL3.2.6 | Highlight

Closure of the Bering Strait to prevent an AMOC tipping 

Jelle Soons and Henk A. Dijkstra

The present-day Atlantic Meridional Overturning Circulation (AMOC) is considered to be a prominent tipping element and its collapse would have grave consequences on the global climate. Its dynamics are partly determined by the Bering Strait Throughflow where fresh Antarctic Intermediate Water from the Pacific Basin enters the Arctic Ocean through the Bering Strait and eventually joins the lower branch of the AMOC through deep-water formation in the North Atlantic. The Throughflow's net effect is a freshening of the North Atlantic. Closure of the Bering Strait produces therefore a strengthening of the AMOC. Various studies have indicated that the AMOC is weakening and may even collapse before the end of this century. As the Bering Strait is only 80 km wide and on average 50 m deep an enclosure dam is technically feasible as a measure to strengthen the AMOC and prevent its tipping. In this work we use a hierarchy of climate models including CESM1 to study the effect of a Bering Strait closure on the AMOC under various climate and freshwater forcings. It shows that for low freshwater forcings to the North Atlantic a closure can mitigate the weakening of the AMOC and even prevent an AMOC tipping due to climate forcing. However, for larger freshwater forcings a Bering Strait closure destabilizes the AMOC and would make a tipping more likely as now the additional freshwater can no longer directly be exported out off the North Atlantic to the Pacific via the Bering Strait. Additionally, a small conceptual model is employed in order to illuminate these results further.

How to cite: Soons, J. and Dijkstra, H. A.: Closure of the Bering Strait to prevent an AMOC tipping, EGU General Assembly 2025, Vienna, Austria, 27 Apr–2 May 2025, EGU25-8987, https://doi.org/10.5194/egusphere-egu25-8987, 2025.

EGU25-9141 | ECS | Posters on site | CL3.2.6

Exploring the Potential of Satellite-Based Earth Observation for Monitoring Planetary Boundaries 

Kasra Rafiezadeh Shahi, Levke Caesar, Boris Sakschewski, and Johan Rockström

The Planetary Boundaries (PBs) framework identifies nine essential Earth system processes that are critical for maintaining global stability and resilience. These include climate regulation, biosphere integrity, land system dynamics, and freshwater availability. However, recent studies reveal that six of these boundaries have already been crossed, posing significant threats to Earth's sustainability. In this context, satellite-based Earth Observation (EO) has emerged as a powerful tool for monitoring PBs, offering global-scale data with rich temporal, spatial, and spectral insights. In particular, EO missions such as Sentinel, Landsat, and Aqua/Terra play a critical role in tracking PB-related control variables (CVs), such as atmospheric CO2 concentrations and land-use changes. While these EO missions provide valuable insights, significant challenges remain. Monitoring certain boundaries, such as biogeochemical flows, is still beyond the capabilities of current EO technologies. Additionally, the exponential growth in EO data acquisition creates difficulties in data processing, requiring advanced analytical techniques, substantial computational power, and effective harmonization of multi-scale and multi-sensor datasets. Accessibility to EO resources is another critical issue, particularly in remote or underdeveloped regions that are vital for PBs monitoring. Programs such as Copernicus, with its free data access policy, are addressing these disparities. At the same time, emerging technologies like machine learning (ML) and deep learning (DL) are revolutionizing data processing, enabling the development of indicators aligned with PBs.

This study aims to explore the potential of satellite-based EO for PBs monitoring. By integrating EO capabilities with cutting-edge computational tools and fostering interdisciplinary collaboration, stakeholders can develop actionable strategies for sustainable planetary management. Continued innovation and equitable access to EO resources are essential to preserving Earth’s stability and resilience.

How to cite: Rafiezadeh Shahi, K., Caesar, L., Sakschewski, B., and Rockström, J.: Exploring the Potential of Satellite-Based Earth Observation for Monitoring Planetary Boundaries, EGU General Assembly 2025, Vienna, Austria, 27 Apr–2 May 2025, EGU25-9141, https://doi.org/10.5194/egusphere-egu25-9141, 2025.

EGU25-11367 | ECS | Posters on site | CL3.2.6

Tree seed dispersal strategies affect resilience of savanna-forest boundary ecosystems 

Max van der Ree, Gerard T. Barkema, and Arie Staal

Anthropogenic disturbances to ecosystems on the boundary between tropical savannas and forests may lead to changes in vegetation cover that are difficult to reverse. Given a sufficiently large disturbance, feedback mechanisms between forest tree cover and fire frequencies could trigger a transition between forest and savanna. Tree cover suppresses grass fires that maintain savanna, and thus tropical forest recruitment drives forest resilience against critical transitions. Tree seed dispersal strategies may be important determinants of spatial patterns of forest recruitment. However, their role in shaping forest resilience is not well understood. We therefore investigate the influence of tree seed dispersal strategies on tropical forest resilience. To this end, we introduce a novel individual-based model of Seed Dispersal in Savanna-Forest ecosystems (SDSF), simulating the interaction between tree dispersal strategies, spatial patterns of tree cover, and fire percolation. We find that seed dispersal by birds induces lower recruitment rates and more heterogeneous seed deposition patterns than dispersal by wind. In addition, forest recruitment rates and resilience are more sensitive to spatial pattern morphology when dispersed by birds than by wind. This effect is more pronounced for coarser spatial patterns containing larger forest patches that are spaced further apart. Our findings demonstrate for the first time that tree seed dispersal strategies interact with spatial patterns of tree cover and fire percolation, affecting tropical forest resilience against tipping toward a savanna state. Thus, efforts to understand the impact of global change on critical transitions in savanna-forest boundaries should account for the different effects of seed dispersal strategies.

How to cite: van der Ree, M., Barkema, G. T., and Staal, A.: Tree seed dispersal strategies affect resilience of savanna-forest boundary ecosystems, EGU General Assembly 2025, Vienna, Austria, 27 Apr–2 May 2025, EGU25-11367, https://doi.org/10.5194/egusphere-egu25-11367, 2025.

EGU25-12239 | ECS | Orals | CL3.2.6

A bottom-up spatial pattern of Earth system interactions 

Hannah Zoller, Juan Rocha, Ingo Fetzer, C. Kendra Gotangco Gonzales, Nitin Chaudhary, and Steve Lade

The intricate interplay of the Earth system’s biophysical processes provides the basis for Earth resilience and human wellbeing. While this interplay has been systematically studied on a global scale, a better understanding of the sub-global interactions is crucial in order to fully assess the systemic environmental impact of human activities.       
Building on the quantitative framework provided by the Earth system impact metric (Lade et al. 2021), we present a bottom-up spatial pattern of cross-scale Earth system interactions. In this study, we focus on the processes of change in carbon dioxide concentration, vegetation cover, and surface water runoff. These processes lie at the critical interface between human pressures and the major Earth system components of climate, land, and water. Interactions are quantified using the spatially resolved dynamical global vegetation model LPJmL (Lund-Potsdam-Jena managed Land). A comparison of the resulting spatial patterns to established climate- and vegetation-based divisions of the Earth reveals that parts of the patterns are already explained by the simple combination of vegetation types being naturally prevalent in an area. The effects of climate change on runoff are for example particularly high in areas originally covered by cool seasonal grasses only. In contrast, the effects of changes in vegetation cover on climate more closely follow the Köppen-Geiger climate classification, showing a particularly high interaction strength under tropical rainforest climate. Eventually, we derive an integrative world map of interaction zones using multivariate spatially constrained clustering.       
With this study, we provide a refined local assessment of cross-scale interactions between three crucial Earth system processes. By aggregating the results into larger regions, we aim to facilitate its applicability in decision support and communication.

Steven J Lade et al., A prototype Earth system impact metric that accounts for cross-scale interactions, Environ. Res. Lett. 16 115005 (2021).

How to cite: Zoller, H., Rocha, J., Fetzer, I., Gotangco Gonzales, C. K., Chaudhary, N., and Lade, S.: A bottom-up spatial pattern of Earth system interactions, EGU General Assembly 2025, Vienna, Austria, 27 Apr–2 May 2025, EGU25-12239, https://doi.org/10.5194/egusphere-egu25-12239, 2025.

EGU25-13351 | ECS | Posters on site | CL3.2.6

Global temperature and carbon cycle changes after AMOC collapse 

Da Nian, Matteo Willeit, Nico Wunderling, Andrey Ganopolski, and Johan Rockström

There is increasing interest in understanding how the collapse of the Atlantic Meridional Overturning Circulation (AMOC) impacts global climate, yet its effects on the carbon cycle remain underexplored. While previous studies have focused on these impacts under preindustrial conditions, our research takes a novel approach by examining equilibrium states under different CO2 levels, offering a perspective not previously addressed.

Using the intermediate-complexity Earth system model CLIMBER-X, we conducted a series of hosing experiments to simulate AMOC collapse under various CO2 equilibrium conditions. Our analysis focuses on the carbon cycle and global climate changes resulting from AMOC collapse, while also exploring the roles of ocean dynamics and carbon cycle during this process.

Our findings highlight that under a warming climate, a potential AMOC collapse could result in significant oceanic carbon release to the atmosphere, amplifying global warming. Although it would take hundreds to thousands of years for the AMOC to reach equilibrium after collapse and fully produce these effects, the rate of this process can vary depending on the CO2 levels of the equilibrium. Furthermore, certain scenarios may even trigger additional warming before the AMOC collapse is fully realized.

How to cite: Nian, D., Willeit, M., Wunderling, N., Ganopolski, A., and Rockström, J.: Global temperature and carbon cycle changes after AMOC collapse, EGU General Assembly 2025, Vienna, Austria, 27 Apr–2 May 2025, EGU25-13351, https://doi.org/10.5194/egusphere-egu25-13351, 2025.

EGU25-13909 | ECS | Orals | CL3.2.6

Resilience of the Amazon rainforest to an AMOC collapse 

Valérian Jacques-Dumas and Henk A. Dijkstra

The Amazon rainforest and the Atlantic Meridional Overturning Circulation (AMOC) are two crucial components of the Earth system that may be on tipping course. As the world’s largest tropical rainforest, the Amazon is a major carbon sink and biodiversity reservoir. Therefore, its transition into a savanna under the pressure of climate change may have large-scale consequences. The AMOC plays an important role in the global meridional heat transport and may collapse due to greenhouse gas emissions. This would, among other consequences, alter the ocean-induced moisture inflows over the Amazon rainforest, where precipitation over certain areas may increase and decrease over other areas.

Resilience of the Amazon is here defined as the ability of the Amazon rainforest to remain in a rainforest regime or to return to this state, against perturbations that may bring it towards a savanna-like state. Our objective is to analyse the resilience of the Amazon rainforest with respect to a collapse of the AMOC. More precisely, we study the interaction between the Amazon rainforest and AMOC in a conceptual coupled. We have estimated parameter values (such as mean annual precipitation) of the Amazon rainforest dynamics from a AMOC collapse experiment carried out in a CMIP5 global model (CESM1).

The notion of resilience we consider here is solely based on footprints extracted from an ensemble of AMOC tipping trajectories. It is difficult to simulate many instances of an AMOC collapse because of the rarity of such event. We overcome this problem using a rare-events algorithm, Transition-Adaptive Multilevel Splitting (TAMS), that iteratively pushes trajectories towards a tipping, however unlikely it is, until obtaining an ensemble of tipped trajectories and the corresponding probability of tipping. This algorithm allows us to obtain an ensemble of simulations where the Amazon rainforest tips (i.e. loses resilience) under the influence of the AMOC, at a much lower computational cost than with Monte-Carlo simulations. From this ensemble, we can then extract from this ensemble, footprints characterizing the behaviour of the system as it is losing resilience. With this approach, we can precisely quantify the resilience of the Amazon rainforests to changes induced by an AMOC collapse.

How to cite: Jacques-Dumas, V. and Dijkstra, H. A.: Resilience of the Amazon rainforest to an AMOC collapse, EGU General Assembly 2025, Vienna, Austria, 27 Apr–2 May 2025, EGU25-13909, https://doi.org/10.5194/egusphere-egu25-13909, 2025.

The planetary boundaries framework is a cornerstone for assessing Earth's resilience and stability, with significant traction in academia and policy-making. However, despite its relevance, many boundaries remain provisional and require rigorous refinement. This study introduces a comprehensive, data-driven methodology to determine planetary boundaries for locally variable Earth system processes. By integrating empirical approaches with advanced analytical techniques, we aim to improve the framework’s precision and applicability. Our approach utilizes spatially explicit binary outcome indicators—such as ecosystem degradation—to identify grid-level thresholds for control variables like Human Appropriation of Net Primary Production (HANPP).

Thresholds are optimized using Receiver Operating Characteristic (ROC) curves for each indicator, and the final local threshold is defined as the median of these values. Widely used in engineering and other disciplines to evaluate model performance and decision thresholds, ROC analysis provides a robust statistical framework for identifying optimal boundaries. Aggregating grid cells exceeding local thresholds enables the derivation of robust global boundaries. We demonstrate this methodology by refining the functional biosphere integrity boundary and propose its application to other locally variable boundaries, including biogeochemical flows, freshwater change, and land-use change.

Additionally, the ROC-based approach allows for the systematic comparison of control variables by quantifying their predictive strength using the Area Under the Curve (AUC). Like ROC analysis, AUC is extensively applied in engineering, data science, and other fields to evaluate the accuracy and performance of predictive models. The AUC is particularly valuable for expanding the planetary boundaries framework to new frontiers, such as the current endeavor to incorporate ocean processes. By providing a robust and empirical means of assessing the compatibility of different proposed control variables, AUC helps ensure that the framework remains both scientifically rigorous and adaptable. This approach also facilitates the evaluation of how well various control variables encompass the breadth of the processes they represent, guiding their selection and potential refinement.

Building on this foundation, we leverage AI algorithms to explicitly predict outcome indicators using one or multiple control variables. This enables a deeper analysis of different regimes of the control variable, as well as spatial variations in behavior, by examining how prediction statistics vary across values. Furthermore, these predictive models offer an opportunity to reframe planetary boundaries, directly based on empirical outcome indicators. Such a reframing allows for clearer, outcome-oriented definitions of boundaries while retaining the ability to simulate and assess their behavior under various scenarios using the original control variables.

Our findings provide a robust, empirically validated methodology for determining planetary boundaries and offer new tools for understanding thresholds and spatial dynamics in Earth system processes. By integrating advanced analytical techniques and predictive models, this approach supports the development of a more precise framework for assessing resilience and stability in a rapidly changing Earth system.

How to cite: Ben Uri, L., Stenzel, F., Shmuel, A., and Milo, R.: An Empirically Grounded Data-Driven Methodology for Setting Planetary Boundaries thresholds with A Case Study on Biosphere Integrity, EGU General Assembly 2025, Vienna, Austria, 27 Apr–2 May 2025, EGU25-14767, https://doi.org/10.5194/egusphere-egu25-14767, 2025.

EGU25-15604 | ECS | Posters on site | CL3.2.6

Planetary boundary for freshwater change: past drivers and future projections 

Vili Virkki and Miina Porkka

Direct and indirect human pressures have notably changed the global freshwater cycle. The recently updated planetary boundary for freshwater change (PB-FW) illustrates the extent and degree of freshwater change in the Earth system by reporting the share of global land area experiencing anomalous streamflow and soil moisture conditions. However, analysis underlying the new PB-FW remains ambiguous in distinguishing the different drivers of water cycle change and offers no look into how future climate change may affect the PB-FW status. Here, we fill these missing pieces of the recent PB-FW research.

We adopt the methodology introduced in the new PB-FW definition while utilising an updated state-of-the-art global hydrological model ensemble from ISIMIP 3a and 3b simulation rounds. Scenarios in ISIMIP 3a offer a way to separate between direct human forcing (DHF) and climate related forcing (CRF), whereas ISIMIP 3b allows for projecting the status of the PB-FW into the future with respect to Shared Socioeconomic Pathway (SSP) scenarios. Furthermore, we enrich the metrics of PB-FW transgressions by considering also the magnitude of previously identified deviations from stable (unaffected) conditions at the local (grid-based) scale.

Our tentative results show that CRF generally dominates over DHF in determining the PB-FW status at the global scale during the historical period (1901–2019), both for streamflow and soil moisture. However, DHF has a stronger contribution to increasing dry streamflow deviations, which is particularly visible at smaller scales in regions under heavy anthropogenic influences. Quantifying the magnitude of local deviations shows how certain areas, such as Central Africa and the Mediterranean, have experienced the strongest dry local deviations, whereas the strongest wet local deviations locate to the northernmost latitudes and southern South America.

In line with the domination of CRF over DHF in the historical period, analysing future climate projections emphasises the strong dependence of the PB-FW status on climate action. Both for streamflow and soil moisture, the PB-FW transgression plateaus in the low-emission scenario (SSP1-2.6) projections, while high-emission scenarios (SSP3-7.0 and SSP5-8.5) project a continuously increasing trajectory of PB-FW transgression towards the end of the 21st century.

The results are largely in line with the existing PB-FW and related studies on past and projected global water cycle change. By resolving the drivers of PB-FW transgressions with updated scenario simulations and better quantifying PB-FW transgressions by considering the magnitude of local deviations, this study makes the new PB-FW more tangible and actionable.

How to cite: Virkki, V. and Porkka, M.: Planetary boundary for freshwater change: past drivers and future projections, EGU General Assembly 2025, Vienna, Austria, 27 Apr–2 May 2025, EGU25-15604, https://doi.org/10.5194/egusphere-egu25-15604, 2025.

EGU25-15832 | ECS | Posters on site | CL3.2.6

Estimating parameters for a simple tipping model from complex Earth system model output 

Jonathan Krönke, Jonathan F. Donges, Johan Rockström, Nils Bochow, and Nico Wunderling

The existence of large-scale tipping points - thresholds where small changes can trigger drastic, often irreversible shifts in the climate system - has been a major concern of climate science in the past two decades. The ability to evaluate tipping risks using computationally manageable models is crucial to assess the resilience of the climate system and also to identify safe global warming trajectories for tipping elements. Here, we present an approach to estimate parameters of a simple tipping model based on complex Earth system model output. We validate our results by reproducing simulations that have not been used in the training process and apply the model to major earth system tipping elements such as the Greenland Ice Sheet. A simple model that captures essential behaviour of complex earth system models provides an important step towards a tipping point emulator for extensive tipping risk analyses.

How to cite: Krönke, J., Donges, J. F., Rockström, J., Bochow, N., and Wunderling, N.: Estimating parameters for a simple tipping model from complex Earth system model output, EGU General Assembly 2025, Vienna, Austria, 27 Apr–2 May 2025, EGU25-15832, https://doi.org/10.5194/egusphere-egu25-15832, 2025.

EGU25-16769 | ECS | Orals | CL3.2.6

Identifying the safe operating space for food systems 

Sofie te Wierik, Johan Rockström, Anna Norberg, Sonja Vermeulen, Detlef van Vuuren, Fabrice DeClerck, Wim de Vries, Lena Schulte-Uebbing, Arthur Beusen, Marco Springmann, Dieter Gerten, Federico Maggi, Fiona Tang, and Kevin Noone

Reducing environmental pressure from food systems is critical to limiting environmental degradation and the risk of irreversibly destabilizing the Earth system, but an integrated framework that sets out the safe operating space for food systems is lacking. We assess the current state of food systems across all Planetary Boundaries and propose Food System Boundaries, which are specific shares of the Planetary Boundaries delineating environmental limits for food systems. Our findings reaffirm that food systems are the single largest driver of Planetary Boundary transgressions, and are dominating at least four Planetary Boundary transgressions (i.e. biosphere integrity, land system change, freshwater change, biogeochemical flows). Food systems are beyond all proposed food system boundaries. Returning to the safe operating space for food requires rapidly eliminating CO2 emissions associated with food systems, halting intact land conversion from agriculture, redistribution of fertilizer input, and (regionally) limiting water, pesticide and antibiotic use.

How to cite: te Wierik, S., Rockström, J., Norberg, A., Vermeulen, S., van Vuuren, D., DeClerck, F., de Vries, W., Schulte-Uebbing, L., Beusen, A., Springmann, M., Gerten, D., Maggi, F., Tang, F., and Noone, K.: Identifying the safe operating space for food systems, EGU General Assembly 2025, Vienna, Austria, 27 Apr–2 May 2025, EGU25-16769, https://doi.org/10.5194/egusphere-egu25-16769, 2025.

EGU25-16810 | ECS | Posters on site | CL3.2.6

Assessing Planetary Boundary Transgressions and Their Causes - Using the FRIDA System Dynamics Model 

Axel Eriksson, Dieter Gerten, Lars J. Nilsson, Jannes Breier, and William A. Schoenberg

The planetary boundaries (PBs) framework defines a "safe operating space" based on nine key Earth system processes. Out of these, four are terrestrial and their primary driver of transgression is agriculture. To better understand how agricultural activities might further influence the terrestrial PBs, it is essential to model their drivers and interactions over time. A helpful tool for studying complex dynamic relationships like these are World-Earth models, in particular FRIDA because of its aim to provide an internally consistent representation of many societal and Earth system processes. In this study, we included within FRIDA the PBs for: biosphere integrity, land system change, freshwater use, biogeochemical flows and climate change. This allows us to quantify their temporal trajectories, identify drivers of their transgression, and explore their main interactions. In total, seven different PB control variables are implemented across the five PBs studied, using both directly related variables in FRIDA and proxies related to the calculations using assumed relationships based on literature. By running the FRIDA model in a scenario governed by endogenous model behaviour, the PB quantifications are validated against values documented in the literature. Since FRIDA is still under active development, this study should be seen as a first effort to integrate PB status quantification and analysis into such a model.

The results show strong agreement with independent, earlier, estimates of PB trajectories and in particular whether the PB’s control variables are in the safe operating space, the zone of increasing risk or the high risk zone. However, some notable differences still occur, which may be attributed to the proxies developed to account for some relevant processes not currently represented in FRIDA. We also explore the role of certain drivers of (single or joint) PB transgressions centred around agriculture and associated societal processes and behaviours such as diet. As a part of this, we illustrate that an unambiguous attribution of PB transgressions to any given driver is challenging given that the coupling of drivers leads to non-linear and dynamically evolving feedback processes. Overall, we demonstrate the general suitability of the FRIDA model for simulating PB trajectories, their drivers and interactions. For future studies potentially using the model to inform decision-making, we recommend implementing all PB control variables, if possible in a more spatially explicit manner and without the aforementioned proxies.

How to cite: Eriksson, A., Gerten, D., Nilsson, L. J., Breier, J., and Schoenberg, W. A.: Assessing Planetary Boundary Transgressions and Their Causes - Using the FRIDA System Dynamics Model, EGU General Assembly 2025, Vienna, Austria, 27 Apr–2 May 2025, EGU25-16810, https://doi.org/10.5194/egusphere-egu25-16810, 2025.

EGU25-18398 | ECS | Orals | CL3.2.6

Negative AMOC tipping feedback on permafrost carbon in climate mitigation scenarios  

Norman Julius Steinert, Eleanor Burke, Jörg Schwinger, Biqing Zhu, Thomas Gasser, Gregory Munday, Camilla Mathison, and Hanna Lee

Recently, Wunderling et al., (2024) reviewed the current knowledge on climate tipping interactions and cascades, which highlighted lacking knowledge on the interaction between the AMOC and northern high-latitude permafrost carbon loss – labeled with ‘very limited/missing evidence’ for their interaction strength and direction. Here, we investigate the response of permafrost-carbon to idealized climate stabilization and overshoot scenarios with different modeling approaches ranging from complex to simplified Earth system models (ESM, LSM and SCM). Net warming in these mitigation scenarios results in irreversible loss of soil carbon from permafrost regions, even after achieving net-zero emissions. However, Northern Hemisphere regional cooling from a temporary slowdown or collapse of the AMOC partially negates the release of permafrost carbon. Our modeling approach allows for the first time to illustrate and quantify a stabilizing negative feedback loop between the AMOC and permafrost, whose effectiveness ranges between 30-60% of permafrost carbon loss reduction if the critical temperature for AMOC tipping is crossed.

[Wunderling, N., von der Heydt, A. S., Aksenov, Y., Barker, S., Bastiaansen, R., Brovkin, V., Brunetti, M., Couplet, V., Kleinen, T., Lear, C. H., Lohmann, J., Roman-Cuesta, R. M., Sinet, S., Swingedouw, D., Winkelmann, R., Anand, P., Barichivich, J., Bathiany, S., Baudena, M., Bruun, J. T., Chiessi, C. M., Coxall, H. K., Docquier, D., Donges, J. F., Falkena, S. K. J., Klose, A. K., Obura, D., Rocha, J., Rynders, S., Steinert, N. J., and Willeit, M.: Climate tipping point interactions and cascades: a review, Earth Syst. Dynam., 15, 41–74, https://doi.org/10.5194/esd-15-41-2024, 2024.]

How to cite: Steinert, N. J., Burke, E., Schwinger, J., Zhu, B., Gasser, T., Munday, G., Mathison, C., and Lee, H.: Negative AMOC tipping feedback on permafrost carbon in climate mitigation scenarios , EGU General Assembly 2025, Vienna, Austria, 27 Apr–2 May 2025, EGU25-18398, https://doi.org/10.5194/egusphere-egu25-18398, 2025.

Terrestrial ecosystems worldwide are under increasing stress due to changing climate and weather regimes, as well as direct anthropogenic influences such as land use changes. The combination of stressors can erode an ecosystem’s ability to resist and recover from external shocks and pressures.

Vegetation resilience loss is often assessed by applying temporal early warning signals (EWS) based on dynamical systems theory to remotely sensed time series of different vegetation indices. The global coverage and regular measurement intervals of the satellite data in combination with easily computable EWS such as temporal autocorrelation and variance make this an appealing approach. Recent studies have confirmed that common EWS are good indicators of recovery rates after small disturbances in global ecosystems. However, to be useful in real-world applications, EWS need also be able to provide warning signals before a major upcoming ecosystem collapse, as driven for example by drought or heat stress. This has been evaluated for local case studies of specific ecosystems, but a global assessment of EWS accuracy and sensitivity for predicting terrestrial ecosystem collapses is lacking.

Here, we evaluate the performance of different EWS in predicting forest dieback events recorded in situ and on manually assessed satellite data around the world. We compare different frequently used remote sensing datasets, vegetation indices, and a range of EWS. This work highlights limitations of commonly applied resilience loss assessment methods for real-world applications and aims to contribute to the discussion on how to reliably evaluate changes in large-scale ecosystem resilience.

How to cite: Knecht, N., Lotcheris, R., Fetzer, I., and Rocha, J.: Limitations of early warning signals: evaluating the performance of resilience loss detection methods to predict forest die-back events from remote sensing data, EGU General Assembly 2025, Vienna, Austria, 27 Apr–2 May 2025, EGU25-18547, https://doi.org/10.5194/egusphere-egu25-18547, 2025.

Climate change and biodiversity loss and are regarded as major global environmental issues. However, the interactions between these and other environmental issues, which vary in type and magnitude across regions, have not been adequately considered before measures for addressing each major issue are planned, decided, or implemented. To achieve the simultaneous resolution of multiple environmental issues without externalizing the problem (e.g., shifting "wrinkles" to other areas or regions), it is essential to enhance trans-scale integration of top-down management and bottom-up action planning, leveraging the advantages of both approaches.

To date, at the global level, targets for greenhouse gas (GHG) emission reductions and their timelines are typically determined first, followed by allocation to individual countries. This process often overlooks the "ripple effects" of GHG reduction measures on ecosystems and human well-being within each country.

On the other hand, at the local (national) level, policymakers generally possess a good understanding of societal constraints, demands, and capacities for implementing such measures. However, causal interactions among various issues and their cross-border effects are rarely considered or prioritized.

Here, a Double PDCA-cycle framework is proposed to bridge local action plans (bottom-up) with global evaluations and recommendations (top-down):

  • First Cycle: Simulation-based assessment to evaluate the external and global impacts of the proposed local action plans before implementation.
  • Second Cycle: Post-implementation assessment and iterative modifications based on observed outcomes.

A set of simple dynamic models incorporating the global system and two nations was analyzed under the following assumptions:

  • Top-down: Global-scale goal-oriented approach,
  • Bottom-up: National-scale goal-oriented approach, and
  • Double PDCA-cycle: Integration of both approaches.

Preliminary results from the comparisons of these three assumptions demonstrate the following advantages of the Double PDCA-Cycle Framework:

  • Each country can design its local action plan tailored to its unique natural and cultural conditions.
  • Appropriate models can be employed to evaluate the globally integrated impacts of local action plans proposed by each country.
  • Existing observation and assessment mechanisms can be effectively utilized.

How to cite: Ishii, R.: A new conceptual framework for integrating multiple problems at multiple spatial scales to achieve simultaneous solutions to global environmental issues, EGU General Assembly 2025, Vienna, Austria, 27 Apr–2 May 2025, EGU25-18634, https://doi.org/10.5194/egusphere-egu25-18634, 2025.

EGU25-19136 | ECS | Orals | CL3.2.6

Investigating transitions to regenerative agriculture using the InSEEDS World-Earth model – foundations, first results, and research directions 

Luana Schwarz, Jannes Breier, Hannah Prawitz, Sara Constantino, Max Bechthold, Dieter Gerten, Christoph Müller, Johan Rockström, Ronja Hotz, Werner von Bloh, Jobst Heitzig, and Jonathan Donges

Worldwide, developments towards highly industrialized, conventional agriculture systems have led to ecological deterioration, as well as societal problems. On the ecological side, many Planetary Boundary transgressions can - in substantial parts - be attributed to agricultural developments: Land System Change, Biosphere Integrity, Climate Change, Freshwater Change, and Biogeochemical Flows were all found to be majorly impacted by agriculture. Social issues like worker health and unstable livelihoods add to the dire picture.

Many approaches towards sustainable agriculture exist, among them Regenerative Agriculture (RA). While RA practices, according to most definitions, center on improving soil health, broader interpretations of the term exist. Some include factors like agrobiodiversity and water cycles, others additionally include social aspects like farmer well-being. While studies assessing the biophysical potential of different RA practices exist, the question how a wide-spread, up-to-global adoption of RA practices can unfold, remains understudied.

To tackle this key research question, we developed the Integrated Social Ecological rEsilient lanD Systems (InSEEDS) model (v0.2), an agent-based dynamic global vegetation model (AB-DGVM). InSEEDS is a World-Earth Model that comprises an environmental and a socio-cultural component. Through a bidirectional tight coupling facilitated by the novel copan:lpjml framework (Breier et al., in prep), the Lund Potsdam Jena managed Land (LPJmL) is integrated as the Environmental component of InSEEDS. The model’s socio-cultural component is represented by an agent-based model (ABM) to simulate farmers’ management decisions for or against conservation tillage, which is a RA practice. 

This presentation introduces the InSEEDS model and describes its model set-up and design. It delineates the ABM structure, focussing on the farmers’ decision-making process, as well as the different farmer types. It lays out results regarding the co-evolutionary interactions in which the adoption and spreading dynamics are rooted in, the role of social and ecological heterogeneity in the model, as well as the interplay of factors in the agent decision-making.

The development and application process of the InSEEDS model points to future research directions for our model development team. In future model versions, the integration of qualitative and quantitative empirical knowledge for the ABM structure as well as parameterization could be an asset in comparison to the purely theoretical approach v0.2 follows. To capture more broad management options in the ecological component, the implementation as well as bundling of further RA practices like cover crops and agroforestry is planned (Breier et al., in prep). Furthermore, loop learning processes, more diverse agent types, non-local farmer networks, and higher levels of social organisation are envisioned as extensions of the farmer ABM component (Schwarz et al., in prep; Prawitz et al., in prep). 

How to cite: Schwarz, L., Breier, J., Prawitz, H., Constantino, S., Bechthold, M., Gerten, D., Müller, C., Rockström, J., Hotz, R., von Bloh, W., Heitzig, J., and Donges, J.: Investigating transitions to regenerative agriculture using the InSEEDS World-Earth model – foundations, first results, and research directions, EGU General Assembly 2025, Vienna, Austria, 27 Apr–2 May 2025, EGU25-19136, https://doi.org/10.5194/egusphere-egu25-19136, 2025.

EGU25-19409 | Posters on site | CL3.2.6

Attractor landscapes for characterising ecological resilience in real-world systems 

Will Rust, Marko Stojanovic, Ron Corstanje, Daniel Simms, and Jim Harris

Advanced warning of catastrophic changes in ecosystem function and composition are fundamental to protect and restore nature, particularly from novel climate threats. Critical slowing down (CSD) has been proposed as an early warning system for ecosystem critical transition and, alongside other state measurements, for defining a system’s ecological resilience. These concepts are based on the idea of stable states, which are difficult to define in ecological systems, and have not been demonstrated empirically because reference states are inherently static in field data. Using remote sensing data we show the dynamic regime of real-world ecological systems by mapping trajectories as a surface to quantify the geometry governing transitions between locally stable states. We find different attractor landscapes between ecosystems with extremes in biodiversity. Sites with high diversity (such as nature reserves) show a single local minima representing a single stable state - a resilient system, while ecosystems with low diversity exhibit multiple local stable states and trajectories between states after perturbation (drought), showing a critical transition. Our results evidence the theory of resilience and stability of ecological systems. We anticipate the use of our approach to better understand and visualize ecosystem resilience and as a tool for identifying ecosystems in critical transition that can be targets for intervention, such as ecological restoration.

How to cite: Rust, W., Stojanovic, M., Corstanje, R., Simms, D., and Harris, J.: Attractor landscapes for characterising ecological resilience in real-world systems, EGU General Assembly 2025, Vienna, Austria, 27 Apr–2 May 2025, EGU25-19409, https://doi.org/10.5194/egusphere-egu25-19409, 2025.

EGU25-19647 | Orals | CL3.2.6

Holocene stability: climate attractor, or lucky break? 

David Armstrong McKay

Palaeorecords indicate that global temperatures have been relatively stable for the past ~10,000 years of the Holocene epoch, in contrast to cooling trends during previous interglacials and multiple abrupt shifts during past glacials. Hypotheses for this seeming stability range from early anthropogenic emissions to orbital factors or the timing of carbon cycle feedbacks. An alternative suggestion grounded in dynamical systems theory is that Holocene stability reflects the Earth system residing in a climate ‘attractor’, with strong negative feedbacks acting to stabilise the climate’s state, and glacial/interglacial cycling representing either a limit cycle or tipping between interglacial and glacial attractors. This in turn has led to the more recent hypothesis that human actions are eroding the resilience of the Earth system’s current state, and at some level could be sufficient to tip the whole Earth system into a warmer “Hothouse Earth” attractor. However, despite multiple hypotheses for Holocene stability, that the Earth system is close to the edge of a dynamical attractor is often assumed rather than demonstrated. Here, I review the basis for the Holocene climate attractor hypothesis in the literature, and assess to what extent there is sufficient evidence to support it versus other possibilities. I then outline what additional evidence might be needed, and consider how Earth system states and resilience can be alternatively conceptualised.

How to cite: Armstrong McKay, D.: Holocene stability: climate attractor, or lucky break?, EGU General Assembly 2025, Vienna, Austria, 27 Apr–2 May 2025, EGU25-19647, https://doi.org/10.5194/egusphere-egu25-19647, 2025.

EGU25-21249 | ECS | Posters on site | CL3.2.6

Social tipping towards revolution? New perspectives for the MayaSim model 

Fritz Kühlein, Ilkhom Soliev, and Jonathan Donges

When assessing prerequisites for the resilience or collapse of present and future societies in the Anthropocene, computational models of ancient civilizations can provide valuable insights. The Classic Maya are a common example for a civilization that has experienced spectacular growth in population and technology before apparently undergoing catastrophic reorganization. The MayaSim social-ecological model was conceived by Heckbert (2013) to test conflicting theories on these events and has since been further developed and evaluated in several studies (Heckbert et al. 2014, 2019; Kolb 2020). It is the first spatially explicit, agent-based computational model of the ancient Maya, and the first one to incorporate trade. Within the scope of a master thesis, we thoroughly revisited MayaSim on multiple levels. A full technical revision revealed that the model does not inherently produce large scale population collapses. On the aggregate level, the model system will converge to long-term population stability under all tested parameter settings. From what is set up in the model, even a climate forcing could only lead to either full recovery or extinction, which is confirmed by results from previous model versions. Both cases, however, do not apply to the Mayan Classic-to-Post-Classic transition. That transition, despite a significant decrease in population numbers, did not feature a full population collapse, but was mainly characterized by a collapse of the established societal structure and a spatial reorganization from the inland to the coasts of the Yucatán peninsula. Mayan culture, however, continued to flourish and is still present around Yucatán today. Hence, despite an ambitiously comprehensive approach taken in the development of MayaSim, the model does not appear fit to explain the dynamics at hand. For this contribution, the modeling approach that lead to MayaSim is therefore critically reviewed, adopting new perspectives on how the Maya timeline can be insightful for present-day societies. Especially, the role of societal dynamics in the Classic-to-Post-Classic transition is explored, aiming to account for the influence of colonial history and “western” ideas of development on our view of the Classic Maya. How did the societal organization before and after the famous "collapse" differ? Is the Classic era state really a more desirable one, given that it did not persist? And is the concept of social tipping helpful in the interpretation of that transition? Drawing from these perspectives, how could MayaSim 2.0 be re-conceived from scratch? How can dynamics of power, inequality and centralization be explored in a simple, conceptual model? What are further examples of such a hypothesized revolution in human history that this model might apply to?

How to cite: Kühlein, F., Soliev, I., and Donges, J.: Social tipping towards revolution? New perspectives for the MayaSim model, EGU General Assembly 2025, Vienna, Austria, 27 Apr–2 May 2025, EGU25-21249, https://doi.org/10.5194/egusphere-egu25-21249, 2025.

Anatolia is a geography that has experienced major natural disasters from ancient times to decay due to its geological location. In this context, Anatolia has always attracted the attention of researchers. The earthquakes that occurred in 6 provinces of Turkey, namely Anatolia, on February 6, 2022, and caused great loss of life and property, the re-emergence of the earthquake explosion in Anatolia. We, archaeologists, have been exposed to major earthquakes and climates from ancient times to decay, and situations that can be defined as natural have caused great losses. The Hittites, Assyrians, Hellenes, Romans, and societies before and after these civilizations, who continued their existence in Anatolia in ancient times, suffered great material and spiritual losses as a result of natural disasters experienced in the geography of Anatolia, and the ancient geological and climatological documentation of Anatolia has been documented. This is possible, the earthquakes and climatic conditions that occurred in Anatolia from ancient times to decay and are included in historical records due to its service location will be included, and it will be discussed how these earthquakes and climatic events will end archaeological settlements in ancient times and today.


How to cite: Yüksel Özer, F.: Natural disasters that occurred in ancient times in Anatolia and the damage they caused to ancient settlements, EGU General Assembly 2025, Vienna, Austria, 27 Apr–2 May 2025, EGU25-1907, https://doi.org/10.5194/egusphere-egu25-1907, 2025.

Architectural heritage in the African context, as a domain of cultural heritage, frequently encounters substantial obstacles for conservationists and custodians due to the lack of fully documented current conditions or as-built blueprints, which serves as the initial obstacle. Most architectural heritage buildings constructed prior to and during the colonial era lack documentation; traditional heritage structures were created through generational knowledge, while colonial buildings were built using imported knowledge, which largely dissipated after independence.
The second primary difficulty is the absence of documented social narratives pertaining to these heritage buildings. Numerous heritage buildings in Africa has profound cultural significance that is gradually being eroded owing to insufficient recording. This essay will introduce a prototype project in Porto-Novo, Benin, wherein the author utilizes local social engagement and digital technologies to chronicle Afro-Brazilian or Aguda architecture, a vanishing architectural heritage in Benin. Afro-Brazilian architecture is a construction style created by formerly enslaved Africans who resettled in the Bight of Benin countries following the abolition of slavery in Brazil. This settlement developed a distinctive architectural style that amalgamated Brazilian and native African influences, particularly Yoruba, significantly affecting the urban morphology of Benin.
The project utilizes LiDAR scanning, photogrammetry, and geolocation technologies to digitize heritage structures and develop interactive immersive interfaces that facilitate engagement with and access to this valuable architectural heritage.

H. Killion Mokwete is Assistant Professor at Northeastern and UK-trained and registered Architect (RIBA-chartered Architect & Urban Designer) and Co-Founder of the community-based design startup Social Impact Collective (SIC). He teaches various design studios both at undergraduate and graduate level and is currently undertaking multidisciplinary research initiative in Benin with local historians at the Ecole du Patrimoine Africain - School of African Heritage (EPA), Benin, Porto-Novo.

How to cite: Mokwete, H.: Digitizing Afro Brazilian Architectural Heritage buildings in Benin through LiDAR technology and social participation, EGU General Assembly 2025, Vienna, Austria, 27 Apr–2 May 2025, EGU25-2907, https://doi.org/10.5194/egusphere-egu25-2907, 2025.

EGU25-4316 | ECS | Orals | CL3.2.7

From Polygon to Prediction: A Request-Driven Architecture for Disaster Mapping and Impact Assessment  

Luca Barco, Gaetano Chiriaco, Tommaso Monopoli, Edoardo Arnaudo, and Claudio Rossi

Disasters pose significant threats to cultural heritage and natural landscapes. To mitigate damage and plan effective recovery actions, it is crucial to conduct precise impact assessments. 

This work presents a service that offers an innovative, adaptable and scalable solution, integrating remote sensing and delineation models to map catastrophic events and estimate the elements affected within the area of impact. By leveraging satellite imagery and advanced AI-based mapping models, the service is tailored to delineate and estimate the severity of the hazards, providing additional information about population, infrastructures, constructed elements (potentially including culturally significant structures) and land cover. 

The primary utility of the service lies in its ability to map catastrophic events, i.e. fires, floods and landslides with high accuracy. By delineating the affected areas, stakeholders can gain immediate insights into the extent and nature of the disaster. In addition to this core functionality, the service also provides valuable metadata about the elements within the impacted area, enabling a deeper understanding of the disaster’s impact. 

Cultural heritage sites, particularly those integrated into natural landscapes, are vulnerable to various natural phenomena. Assessing the extent of the damage requires accurate and timely information about the affected areas. Our approach is rooted in geospatial technologies, providing an automated workflow that begins with the input of a polygon defining the area of interest and a specific period. From there, the system downloads the best high-resolution remote sensing images available and runs delineation models designed for disaster mapping. These models enable the identification of impacted cultural and natural assets with high precision. 

A unique aspect of the service is its adaptability. While current assessments are often based on standardized taxonomies, these classifications were generally not designed to explicitly characterize cultural heritage. The service allows for the integration of site-specific base maps, enabling a more refined analysis tailored to the unique attributes of cultural sites and their surrounding landscapes. 

Impact assessments are a cornerstone for planning recovery actions post-disaster. service’s ability to integrate diverse datasets ensures that assessments are not only accurate but also actionable. By providing insights into the damage sustained by cultural heritage and natural landscapes, stakeholders can make informed decisions about restoration priorities and resource allocation. 

Incorporating cultural heritage and natural landscapes into disaster impact assessments is a practical necessity for preserving our shared history and identity. By leveraging remote sensing, advanced delineation models, and adaptable taxonomies, the service provides a robust tool for understanding and mitigating the impacts of disasters.

How to cite: Barco, L., Chiriaco, G., Monopoli, T., Arnaudo, E., and Rossi, C.: From Polygon to Prediction: A Request-Driven Architecture for Disaster Mapping and Impact Assessment , EGU General Assembly 2025, Vienna, Austria, 27 Apr–2 May 2025, EGU25-4316, https://doi.org/10.5194/egusphere-egu25-4316, 2025.

EGU25-4438 | ECS | Posters on site | CL3.2.7

Historic buildings under the impact of climate change: insights from geoelectric field monitoring 

Wiebke Lehmann, Lukas Römhild, Wolfgang Gossel, and Peter Bayer

Extreme weather events driven by climate change, such as floods and droughts, are damaging the structural stability of historic buildings in Central Germany by causing moisture retention and soil desiccation. The alternating wet and dry periods lead to cracks in walls and subsidence from falling groundwater levels. Understanding the impact of these conditions on regional groundwater dynamics and building materials is crucial as droughts and floods are expected to increase in the coming years.
As part of this study, three geoelectric field campaigns with a total of 17 profiles are being carried out between April 2024 and April 2025 at five different field sites of monuments in the federal states of Saxony and Saxony-Anhalt. For investigating seasonal and weather-dependent fluctuations in groundwater conditions, transient trends are observed by repeated electrical resistivity tomography (ERT) measurements. These provide insights into hydrological changes in the subsoil, and thus information on how weather events can affect different layers of the soil as well as foundation structures. In addition to the geoelectrical investigations, 14 groundwater wells are being drilled to a depth of around 10 m to monitor the fluctuations in the groundwater level over time. Furthermore, complementary laboratory tests are being conducted to characterize the soil properties, allowing a reliable interpretation of the ERT inversion results.
Preliminary results indicate that layers down to 25 m depth can be affected by weather-dependent variations in resistivity, depending on the hydraulic properties of the soil material at the respective site. Despite the elevated precipitation during the summer months of June and July, the topsoil underwent significant drying by November 2024, leading to a reduction in the groundwater level and subsequent saturation of the deeper soil layers. Ongoing continuous measurements shall provide further insights.

How to cite: Lehmann, W., Römhild, L., Gossel, W., and Bayer, P.: Historic buildings under the impact of climate change: insights from geoelectric field monitoring, EGU General Assembly 2025, Vienna, Austria, 27 Apr–2 May 2025, EGU25-4438, https://doi.org/10.5194/egusphere-egu25-4438, 2025.

EGU25-4992 | Orals | CL3.2.7

Assessing the Exposure of Coastal Cultural Heritage Sites to Sea Level Rise Phenomena in the EU Mediterranean Countries using open access data 

Sevasti Chalkidou, Charalampos Georgiadis, Themistoklis Roustanis, and Petros Patias

The Mediterranean Sea has a long record of cultural heritage sites located near its coast, reflecting each nation’s historical continuum and identity. These monuments also attract tourism and provide financial benefits to local communities. However, they are subject to structural damage and decay exacerbated by climate-change-related phenomena including extreme weather events, sea-level rise, etc. Sea Level Rise (SLR) is a major threat to coastal heritage sites as it can  lead to extensive inundation and soil erosion. SLR projections are constructed by studying representative pathway scenarios (RCP), which try to deliver possible alternatives about the future atmospheric composition.  SLR has escalated from an average of 1. 2 mm/year before 1990 to 3 mm/year between 1993 and 2010, with projections indicating a rise of 1–2 meters by 2100 across different scenarios.

The ongoing Triquetra Project, funded by the European Union, aims to design a toolbox for assessing and mitigating climate-related risks and natural hazards, expected to affect Heritage Sites. A methodology has been developed to evaluate future exposure of coastal heritage sites SLR in EU Mediterranean Countries. This workflow uses open-access data to produce SLR projection maps for 2050 and 2100 based on the IPCC (2019) report for RCP 2.6, 4.5, and 8.5. Four main sources of data were used: a hybrid coastline vector file combining national fine-scale datasets with the European Environment’s Agency (EEA) coastline file, FABDEM as the primary source of elevation information,  the European Ground Motion Vertical Service’s (EGMS) L3 product which measures vertical ground movements using Synthetic Aperture Radar Interferometry (InSAR) data from the Sentinel-1 mission, and, finally, NASA’s Sea Level Projection Tool which provides information on all RCP scenarios. Coastal Heritage Sites and Assets were identified using OpenStreetMap and UNESCO’s Word Heritage Site point layer.

The pre-processing stage of the algorithm involves the projection of all datasets into a common coordinate reference system, the clipping of the data into the area of interest (AOI), defined as a 2km buffer zone from the coastline, and the conversion of EGMS and NASA’s SLR data units to meters. The algorithm proceeds with raster calculations to determine the AOI’s elevation for the target years 2050 and 2100 under different RCP scenarios by adding the elevation values to the EGMS data and subtracting NASA’s SLR projected values. Raster calculations and Boolean algebra are performed to identify sub-areas affected by these scenarios. Finally, spatial queries are conducted to find coastal heritage sites at risk from Sea Level Rise, organized by monument type and country for vulnerability assessment.

The results demonstrate that Greece, France, and Italy are expected to be more affected by SLR phenomena due to their extensive coastline and unique geomorphology, with the impact being more severe on Greece and Italy between 2050 and 2100. Finally, more than 240 heritage sites appear to be at risk primarily on the Greek and Italian coast, including UNESCO sites like Delos, the Medieval City of Rhodes, et al.

How to cite: Chalkidou, S., Georgiadis, C., Roustanis, T., and Patias, P.: Assessing the Exposure of Coastal Cultural Heritage Sites to Sea Level Rise Phenomena in the EU Mediterranean Countries using open access data, EGU General Assembly 2025, Vienna, Austria, 27 Apr–2 May 2025, EGU25-4992, https://doi.org/10.5194/egusphere-egu25-4992, 2025.

EGU25-6132 | Orals | CL3.2.7

Value-based and stakeholder-driven complex risk mapping for underwater heritage through Living Labs 

Deniz Ikiz, Paloma Guzman, Cristina Veiga-Pires, Sonia Oliveira, Stella Demesticha, Anna Demetriou-Patsalidou, Paschalina Giatsiatsou, Ionut Cristi Nicu, and Panagiotis Michalis

Climate change is one of the biggest threats to cultural and natural heritage across marine and coastal ecosystems. Multiple risks interact, cascade, and/or compound broader environmental, socio-economic, and cultural impacts on tangible (places, structures, ecosystems, etc.) and intangible heritage attributes (values, socio-economic activities, etc.). These risks arise from exposure, vulnerability, and responses to such impacts. For example, the physical materiality and integrity of underwater cultural properties are threatened by changes in water temperatures and acidity levels, compounded by extreme weather events causing strong waves and currents, which disrupt livelihoods tied to tourism and fisheries and provide conditions for looting and unregulated diving. This study adopts an empirical, value-based, and stakeholder-driven approach to identify, assess, and map these complex risks and their interactions.  

As part of the THETIDA Horizon Europe project that aims to develop an integrated risk monitoring, preparedness, and management mechanism for underwater and coastal heritage sites, the Living Labs methodology has been employed in the pilot sites. Through public-private-people partnerships, the Living Labs engage relevant national and local stakeholders and community groups to identify values, determine impacts, and assess exposure, vulnerability, and responses. This stakeholder-driven complex risk mapping methodology relies on the framework for complex climate change risk assessment that includes response as the fourth determinant of risks, together with hazard, exposure, and vulnerability [1]. In addition, it builds upon the Climate Vulnerability Index (CVI) for World Heritage, which employs a systematic and value-based approach to assess the climate vulnerability of shared values and attributes of cultural and natural properties [2]. Building upon CVI’s two-stepped procedure targeting to assess impacts on heritage values and communities, this complex risk mapping framework adopts a similar process to determine:

  • Risks to heritage values: The heritage values attributed to the sites are identified. Moreover, their vulnerability, exposure to risks, and the impacts of key hazards and climate stressors on the sites are assessed.
  • Risks to heritage communities: The heritage communities (stakeholders) and their socio-economic and cultural connections to the sites are identified. At the same time, their vulnerability, exposure to risks, and collective and/or institutional responses to climate-induced impacts are being evaluated.

This paper will present this innovative complex risk mapping framework and its preliminary implementation results in one of the THETIDA underwater sites. These sites include the Ottoman shipwreck in Paralimni, Cyprus, and the Second World War airplane wreck off the coast of Algarve, Portugal.

The complex risks posed to underwater heritage sites and their interactions remain largely underexplored in the existing literature, limiting the adoption of inclusive strategies to address them. This value-based and stakeholder-driven complex risk mapping framework outlined here enables a comprehensive assessment of risks and impacts on heritage values and communities. While initially tested for underwater sites, this framework provides a systematic methodology that can be applied to all heritage types, making it highly relevant for decision- and policy-makers working to safeguard underwater and coastal heritage.

Acknowledgement: This research has been funded by European Union’s Horizon Europe research and innovation funding under Grant Agreement No: 101095253, THETIDA project.

References:

[1] DOI: 10.1016/j.oneear.2021.03.005

[2] DOI: 10.5070/P536146384

How to cite: Ikiz, D., Guzman, P., Veiga-Pires, C., Oliveira, S., Demesticha, S., Demetriou-Patsalidou, A., Giatsiatsou, P., Nicu, I. C., and Michalis, P.: Value-based and stakeholder-driven complex risk mapping for underwater heritage through Living Labs, EGU General Assembly 2025, Vienna, Austria, 27 Apr–2 May 2025, EGU25-6132, https://doi.org/10.5194/egusphere-egu25-6132, 2025.

EGU25-8771 | Orals | CL3.2.7

CLICapp: A co-created tool for climate adaptation and safety in human tower exhibitions  

Jon Xavier Olano Pozo, Òscar Saladié Borraz, and Anna Boqué-Ciurana

Climate change poses increasing challenges to outdoor cultural events, including human towers (castells) festivals, which demand favourable weather conditions. Human towers, recognised by UNESCO in 2010 as an Intangible Cultural Heritage of Humanity, rely on safe and comfortable conditions for participants and audiences alike. Building on a project developed in 2024, this communication wants to present the development of a climate-smart decision-making tool to enhance the management of casteller exhibitions under evolving climatic conditions. The prototype tool named Castells, Llindars i Informació Climàtica- CLICapp (Human Towers, Thresholds and Climate Information) aims to transform climate data into valuable information for decision-makers to manage the human tower exhibitions better, especially in summer (due to extreme temperatures and high humidity values) but not only.

The project’s groundwork is the study of temperature trends from 1951 to 2023 during the central hours of the day (12–15h) at four significant festivals (Sant Joan in Valls, Festa Major of La Bisbal del Penedès, Sant Magí in Tarragona, and Sant Fèlix in Vilafranca del Penedès). Results highlighted rising thermal stress, with Heat Index values underscoring the growing discomfort for Castellers (Olano et al., 2024). Then, participatory workshops based on the co-creation methodology for climate services (Font et al., 2021) were held with 109 castellers from 10 teams (colles castelleres), offering qualitative and quantitative insights into their perceptions of favourable and adverse weather for castells. These workshops also generated adaptation proposals prioritised by feasibility and importance (Saladié et al., 2025).

This communication will outline the two new steps undertaken in this project: the introduction of real-time measurements using temperature and humidity sensors in 11 urban squares during the summer season, which provided empirical data on thermal conditions of the exhibitions, and the initial insights into transforming all this data in useful information (climate raw data and co-creation insights) into an app. This app prototype aims to convert climate data and the information collected from the squares and participant groups into understandable and actionable insights for decision-makers—whether they are the Castellers, organisers (i.e. City Hall), other stakeholders (medical services, businesses, police, civil defence), or the public. The developing tool wants to integrate near real-time weather forecasts to identify potential risks for specific festival dates and times. Combining these insights with adaptive strategies proposed in the co-creation workshops provides a robust framework for pre-event planning. The advanced monitoring capabilities will allow organisers to receive near real-time updates on key parameters such as temperature, humidity, Heat Index, or co-created indices based on the information gathered during the workshops.

This project advances the adaptive management of outdoor cultural events by ensuring casteller festivals remain safe and sustainable amid climate change while preserving their cultural essence, safeguarding heritage, promoting climate innovation, and prioritising the well-being of participants. This initiative provides a replicable model for other cultural manifestations facing similar climate challenges worldwide. Incorporating climate services into intangible cultural event management combines scientific research and innovation with cultural preservation to protect the identity, ensure the sustainability of traditions under climate stress, and safeguard human health.

How to cite: Olano Pozo, J. X., Saladié Borraz, Ò., and Boqué-Ciurana, A.: CLICapp: A co-created tool for climate adaptation and safety in human tower exhibitions , EGU General Assembly 2025, Vienna, Austria, 27 Apr–2 May 2025, EGU25-8771, https://doi.org/10.5194/egusphere-egu25-8771, 2025.

Underwater cultural heritage (UCH) sites provide insight into past human behavior and history and thus their preservation is crucial. Within the scope of THETIDA, a Horizon Europe project dedicated to developing technologies and methods to protect coastal and underwater cultural heritage, this work aims to predict the physical processes that can put UCH at risk. This risk assessment is applied to a specific site in the Algarve, Portugal where a WWII U.S. B24 bomber plane crashed approximately 3 km offshore Praia de Faro. The plane now sits 21 m deep on the coastal shelf, which consists mainly of sand. The site is exposed to dominant, more energetic waves coming from W-SW and sheltered from less energetic E-SE waves. The mean significant wave height is 0.9 m, but it can rise to above 3 m with the occurrence of storms. As the site is located in the open ocean, a highly energetic environment, the site is subject to risks caused by wave-induced currents and sediment transport. To analyze and predict these risks in real time a numerical framework integrating three operational process-based models was developed. The numerical system is composed of: 1) the wave model SWAN, 2) the hydrodynamic model MOHID, and 3) the sediment transport model MOHID sediment. The operational wave model uses bathymetric data from EMODNET and is forced with wind conditions from the Skiron Atmospheric Modeling and Weather Forecasting Group in Athens and wave conditions at the boundary from the Copernicus Marine Environmental Monitoring Service (CMEMS). The model was calibrated by testing various formulas for the physical parameters attributed to wave propagation. A statistical analysis was completed to determine the best physics formulas to use for the model by comparing the results of each calibration setting with in-situ buoy measurements. SWAN was then two-way coupled to the hydrodynamic modeling system SOMA (Algarve Operational Modeling and Monitoring System), which is powered by MOHID. The coupling mechanism forces the wave model with velocities and water level output from SOMA and forces SOMA with wave results from SWAN. Preliminary results of the coupling revealed that the impact of current velocity and water levels on wave propagation in the study area is negligible in deeper areas, where the observations used for model validation lie. Further investigations are been conducted to analyze the effects of the two-way coupling in nearshore areas such as the location of the B24. The wave-hydrodynamic coupled system is now being used to develop a non-cohesive sediment transport model, which will be used to evaluate in real-time risks on UCH. This forecasting system will be included in the decision support system of the THETIDA platform.

How to cite: Mills, L.: An Operational Numerical Framework for Assessing Risks to Underwater Cultural Heritage, EGU General Assembly 2025, Vienna, Austria, 27 Apr–2 May 2025, EGU25-9465, https://doi.org/10.5194/egusphere-egu25-9465, 2025.

EGU25-12307 | Orals | CL3.2.7 | Highlight

Monitoring Climate Change in Cultural Heritage Sites Through Enhanced Visualisation Experiences and Crowdsourcing  

Kyriacos Themistocleous, Valentinos Evripidou, and Kyriakos Toumbas

One of the most significant consequences of climate change is the threat it poses to cultural heritage sites. The TRIQUETRA project addresses this critical challenge by applying a comprehensive risk assessment framework. This framework integrates both traditional and advanced technologies, including remote sensing and laser-based spectroscopy, to quantify the severity of risks, monitor their progression, and inform effective mitigation strategies.

Climate risks emerge from the interplay of climate hazards, exposure, and vulnerability. Understanding these risks at the site level is essential to ensure the implementation of appropriate adaptation and mitigation measures. Recent research highlights the compounded impacts of climate-induced geo-hazards, such as landslides and earthquakes, which threaten the physical integrity of monuments and the socio-economic systems they support.
Citizen engagement is a core component of the TRIQUETRA project, which includes a dynamic web and mobile platform where visitors actively participate in monitoring cultural heritage sites. The TRIQUETRA application enables citizens and visitors to contribute valuable datasets by capturing and uploading site photos, complementing and enhancing existing 3D models. A backend system assists cultural site authorities in better monitoring sites by providing up-to-date imagery and reports from visitors. Simultaneously, the TRIQUETRA Citizen Engagement Application creates an interactive and enriched experience for visitors through Virtual Reality (VR) and immersive Augmented Reality (AR) technologies. The application offers additional information through VR and AR experiences, allowing users to learn more about critical features at risk, such as areas affected by climate change or structural vulnerabilities. This fosters awareness and encourages preservation efforts.

The Choirokoitia case study demonstrates the application of the TRIQUETRA methodology in monitoring how the site is affected by climate change while also enhancing the visitor experience. Choirokoitia, a UNESCO World Heritage Site, is one of the best-preserved Neolithic sites in the Mediterranean. It represents the Aceramic Neolithic period of Cyprus at its peak, around the beginning of the 9th millennium BCE. Located in the District of Larnaka, about 6 km from the southern coast of Cyprus, the site leverages crowd-sourced information to provide stakeholders with real-time updates on its condition. By comparing uploaded images to a referenced 3D model, authorities gain valuable insights for preservation.

By integrating advanced technologies and community-driven monitoring, TRIQUETRA ensures a holistic approach to safeguarding cultural heritage. The project establishes a replicable framework that enhances risk assessment and promotes active participation in preservation efforts, offering scalable benefits for cultural heritage sites worldwide.

How to cite: Themistocleous, K., Evripidou, V., and Toumbas, K.: Monitoring Climate Change in Cultural Heritage Sites Through Enhanced Visualisation Experiences and Crowdsourcing , EGU General Assembly 2025, Vienna, Austria, 27 Apr–2 May 2025, EGU25-12307, https://doi.org/10.5194/egusphere-egu25-12307, 2025.

EGU25-13403 | Posters on site | CL3.2.7

Establishment of a transdisciplinary monitoring facility in Delos, Greece for the protection of Natural Heritage from the impacts of Climate Change 

Ilias Fountoulakis, Nikolaos S. Melis, Stavros Solomos, John Kapsomenakis, Anastasia Poupkou, Christos Maris, Costas Synolakis, and Christos S. Zerefos and the Delos Observatory team

The Delos archaeological site, inscribed on the UNESCO World Heritage Site List, is situated on a small rocky island in the center of the Aegean Sea. This uninhabited island boasts of monuments with immense significance to human civilization and it is set within a pristine natural landscape. Delos is increasingly vulnerable to risks due to climate change and geodynamic events, which together endanger its cultural and natural heritage. Recently, a multi-hazard environmental monitoring facility has been established in Delos, incorporating climate and numerical prediction modelling, as well as satellite-based and in-situ real-time monitoring of various seismic, atmospheric, and oceanographic parameters. In addition to providing an overview of the overall facility, we discuss the potential long-term changes in atmospheric parameters such as air temperature, and precipitation along with sea level, that could impact the monuments and the landscape in the future, for different socioeconomic scenarios. Furthermore, we discuss how state-of-the-art models have been downscaled and optimized to forecast meteorological conditions, air quality, and wave activity in the Delos area. Local monitoring of earthquake activity and how it is incorporated into the National Seismic Network, as well as measurements of atmospheric and oceanic parameters are also discussed. The project is a groundbreaking initiative aimed at formulating policies and strategies to promote sustainable growth in the economy, tourism, and culture. It also serves as a model for strengthening the resilience of cultural heritage against natural hazards and risks, as well as a pilot program that aims to be applied to other monuments in Greece and abroad with the support of international organizations (e.g., UNESCO, ICOMOS, Europa Nostra, etc.).

Acknowledgments: This work has been performed in the framework of the project: “Development and installation of an integrated system for the monitoring of the impacts of climatic change on the monuments of Delos” that has been funded by benefit foundations of "Protovoulia ‘21“.

How to cite: Fountoulakis, I., Melis, N. S., Solomos, S., Kapsomenakis, J., Poupkou, A., Maris, C., Synolakis, C., and Zerefos, C. S. and the Delos Observatory team: Establishment of a transdisciplinary monitoring facility in Delos, Greece for the protection of Natural Heritage from the impacts of Climate Change, EGU General Assembly 2025, Vienna, Austria, 27 Apr–2 May 2025, EGU25-13403, https://doi.org/10.5194/egusphere-egu25-13403, 2025.

EGU25-15505 | Posters on site | CL3.2.7

DInSAR analysis for slope instability monitoring due to Climate Change: CUZCO and Machu Picchu case study. 

daniele spizzichino, federica ferrigno, gabriele leoni, and francesco menniti

Andean plateau in Peru and its World Heritage sites are particularly affected by the impacts of climate change. The sacred Valley Archaeological Site around the city of Cuzco, a UNESCO World Heritage Site, is exposed to significant geological risks due to recurrent landslides induced and worsened by climate change effects that threaten its structural integrity, security and exploitation. The Machu Picchu Historic Sanctuary was built on Upper Permian-Lower Triassic (250–300 Ma) igneous rocks, primarily plutonic, which form the Vilcabamba Cordillera's backbone (from 2000m since 6000m a.s.l.) These intrusive formations, oriented ONO–ESE, constitute the elevated regions of the Eastern Cordillera. The area is dominated by a batholith composed mainly of granite and granodiorite, with medium-textured basic granite prominently outcropping within the citadel. The Machu Picchu site and all the sacred valley of Cuzco its surroundings are characterized by instability phenomena driven by complex geomorphological and structural/tectonic conditions worsened by the effects induced at altitude by the climate change (melting of the permafrost, heavy rainfall and increase in temperature). The above mentioned phenomena are exacerbated by the interplay of primary discontinuity families, resulting in recurring processes such as planar slides, rockfalls, topples, debris slides, debris flows, and avalanches. The present work shows the application of Differential Interferometric Synthetic Aperture Radar (DInSAR) technique to measure slow, non-catastrophic morphological changes with millimeter-scale precision. A previous interferometric satellite analysis work carried out in the early 2000s to test the general stability of the Inca Citadel has been resumed and updated. The analysis captures both long-term and seasonal processes triggered by diverse causative factors, enabling informed planning of mitigation strategies. Specifically, DInSAR data processing was conducted for the Machu Picchu archaeological area and for the wider Cusco area, complemented by direct field surveys to validate the results (November 2024). Multi-temporal SAR images from the Sentinel-1 constellation (C-band radar) were processed using advanced DInSAR techniques to generate ground displacement measurement points. The spatial distribution and correlation of these measurements with slope instability and structural damage were analyzed, revealing ground deformation trends from January 2020 to August 2024. Preliminary results indicate that the citadel exhibits average ground and structural displacement of less than 1 mm/year substantially negligible. However, localized analyses highlight distinct patterns of small-scale displacement in the Grupo de las Tres Puertas with slight brick detachment and in the Upper Plaza and Eastern Citadel sector showing relative subsidence compared to adjacent areas, suggesting potential movements of the eastern flank. Monitoring systems (remote and in situ) are recommended. The use of Sentinel-1 DInSAR data provided critical insights into the interaction between ground displacement and archaeological structures. It facilitated the identification of potentially unstable areas, detected anomalies, and traced ground displacement accelerations over time. Displacement anomalies and weather-climate anomalies over time, highlights the effects of the latter on the spatial-temporal increase of instability phenomena. These findings underscore the utility of DInSAR as a powerful tool for addressing preservation of intervention on CH threatened by slope instability, offering data-driven approaches for damage prevention and site management.

How to cite: spizzichino, D., ferrigno, F., leoni, G., and menniti, F.: DInSAR analysis for slope instability monitoring due to Climate Change: CUZCO and Machu Picchu case study., EGU General Assembly 2025, Vienna, Austria, 27 Apr–2 May 2025, EGU25-15505, https://doi.org/10.5194/egusphere-egu25-15505, 2025.

EGU25-16404 | Orals | CL3.2.7

Safeguarding the Past: Monitoring Climate Change at Kalapodi Sanctuary through the TRIQUETRA Project 

Artemios Oikonomou, Angelos Sotiropoulos, Penelope Gourgouleti, and Themistoklis Bilis

Kalapodi arcaheological site is located in central Greece, in the region of present-day Fthiotis consisting of a complex of temples and surrounding remains. It comprises a very important sanctuary, being among the most significant of ancient Phokis, providing crucial insights into Greek religious practices and architectural forms from the Mycenaean to the Classical periods. The archaeogical site in Kalapodi has been the focus of extensive cultural heritage management efforts by the German Archaeological Institute (DAI) since 2017.

As a case study in the TRIQUETRA program, funded by the EU Horizon Europe research and innovation program (GA No. 101094818), this site exemplifies the challenges posed by climate change on cultural heritage. TRIQUETRA project aims to develop an integrated methodological model to safeguard archaeological remains, such as those at Kalapodi, from environmental risks and mainly frost. Central to the project is the creation of an evidence-based assessment platform for precise risk stratification, coupled with a comprehensive database of mitigation measures.

In this paper we would like to leverage environmental data and materials analysis from Kalapodi, so as to quantify the impacts of climate change and propose tailored preservation strategies. These include assessing the effects of frost on ancient structures and implementing preventative measures to ensure their long-term stability. To achieve this a pilot site has been designed and constructed on which several monitoring equipment has been attached to understand the influence of environmental conditions on the pilot and hence the ancient monument. The acquired knowledge and the methodology followed highlights the importance of combining scientific research and heritage management to address climate-related challenges and protect cultural heritage for future generations.

How to cite: Oikonomou, A., Sotiropoulos, A., Gourgouleti, P., and Bilis, T.: Safeguarding the Past: Monitoring Climate Change at Kalapodi Sanctuary through the TRIQUETRA Project, EGU General Assembly 2025, Vienna, Austria, 27 Apr–2 May 2025, EGU25-16404, https://doi.org/10.5194/egusphere-egu25-16404, 2025.

The development of an Agent-Based Model (ABM) has proven highly effective for analyzing how the behavior of different agents leads to aggregated phenomena. Despite the challenges in creating such a model—including conceptualization, agent definition, relationship establishment, behavior design, programming, testing, validation, and reporting—the process allows for valuable testing and rethinking of strategies for enhancing the resilience of cultural landscapes, as the results offer significant insights into phenomena like drought. While not predictive, the observed trends can inform general analysis and highlight key areas for action to achieve specific goals. The RescueMe project developed an ABM that simulates three types of administration and underscores the impact of decision-making on territorial resilience, significantly influenced by timely policies and actions. The primary goal of the model is to simulate how farmers, agricultural plots, and decision-makers interact with each other and their environment, particularly under varying drought conditions. The model tests the hypothesis that decision-makers can intervene to mitigate the effects of drought by creating mechanisms that enhance plot resilience and/or attract new farmers safeguarding the values of the cultural landscapes. In this way, the ABM aims to develop a reflection and awareness-raising tool to allow cultural landscapes to consider the consequences of different climate change adaptation measures and behaviors. The impact chains co-created with the project case studies have been used as a basis for the modeling. The impact chain of drought on agriculture (impact of specific climatic hazards on a given sector) was selected due to its importance for a significant number of cultural landscapes, and the organigraphs created during the early stages of the project were used to help define the agents. The scenarios generated with the ABM simulate the impact of the behavior of agents on landscape resilience and potentially inform the definition of a serious game.

How to cite: Egusquiza, A., Cantergiani, C., and Villanueva, A.: Agent-Based Modeling for analyzing the climate resilience and decision-making impact on drought dynamics in Cultural Landscapes, EGU General Assembly 2025, Vienna, Austria, 27 Apr–2 May 2025, EGU25-17815, https://doi.org/10.5194/egusphere-egu25-17815, 2025.

EGU25-18452 | ECS | Posters on site | CL3.2.7

A Multi-Scale Framework for Flood Risk Assessment in Cultural Heritage Sites: The Apollo Temple in Aegina 

Marcos Julien Alexopoulos, Theano Iliopoulou, Denis Istrati, Sofia Soile, Styliani Verykokou, Charalabos Ioannidis, and Demetris Koutsoyiannis

Preserving cultural heritage sites demands risk management strategies that capture site-specific vulnerabilities at fine spatial resolutions. The present study introduces a novel framework for flood risk assessments that bridges large-scale hydrological modeling and sub-meter-level hydraulic simulations to provide enhanced insights into potential impacts. Our approach employs state-of-the-art Rain-on-Grid (RoG) hydraulic simulations, targeted field data collection, and high-resolution geometric documentation using UAV imagery and GNSS ground control points to account for detailed terrain characteristics.

Within the scope of the Horizon Europe TRIQUETRA Project, we apply this framework to the Apollo temple in the archaeological site of Kolona on Aegina Island, Greece. A total of 945 vertical and 4900 oblique UAV images were processed following a multi-image photogrammetric workflow, to produce a digital surface model with a resolution of 1 cm. We then use this data to set up the RoG model and to analyze flood scenarios for various return periods to obtain sub-meter-level hydraulic parameters and evaluate how the site’s vulnerability to flood intrusion might change if its existing wall obstructions were to be extended.

The proposed methodology offers a robust means to extract high-resolution boundary conditions for advanced computational fluid dynamics simulations. Using our multi-scale workflow, relevant stakeholders can enhance their data-driven decision-making for cultural heritage protection and preservation purposes.

Acknowledgments: This work is based on procedures and tasks implemented within the project “Toolbox for assessing and mitigating Climate Change risks and natural hazards threatening cultural heritage—TRIQUETRA”, which is a Project funded by the EU HE research and innovation program under GA No. 101094818.

How to cite: Alexopoulos, M. J., Iliopoulou, T., Istrati, D., Soile, S., Verykokou, S., Ioannidis, C., and Koutsoyiannis, D.: A Multi-Scale Framework for Flood Risk Assessment in Cultural Heritage Sites: The Apollo Temple in Aegina, EGU General Assembly 2025, Vienna, Austria, 27 Apr–2 May 2025, EGU25-18452, https://doi.org/10.5194/egusphere-egu25-18452, 2025.

EGU25-18757 | Orals | CL3.2.7

The GREENART project: "green" and sustainable materials for cultural heritage conservation 

David Chelazzi, Giovanna Poggi, and Piero Baglioni

European Cultural Heritage (CH) is a crucial resource that must be maintained, preserved and made accessible, to counteract degradation enhanced by unfavorable environmental conditions and climate changes. Some of the conservation methodologies nowadays available lack sustainability and cost-effectiveness, and are typically based on energy-consuming processes or non-environmentally friendly materials. This contribution will report on the main results so-far achieved in the EU-funded project GREen ENdeavor in Art ResToration (GREENART), coordinated by the Center for Colloid and Surface Science of the University of Florence (CSGI). Coping with the imperatives of EU Green Deal, the project proposes new solutions based on green and sustainable materials and methods, to preserve, conserve and restore CH. In particular, several innovative materials have been developed and tested:  1) Protective coatings based on green materials from waste and plant proteins, with self-healing and reversibility character, possibly functionalized with organic/inorganic nanoparticles to impart VOC capture, anti-corrosion and barrier behaviors. 2) Foams and packaging materials made by biodegradable/compostable polymers from renewable sources (polyurethanes and natural fibers) to control temperature and relative humidity. 3) Consolidants based on natural polymers from renewable sources, to mechanically strengthen weak artifacts. 4) Gels and cleaning fluids inspired by the most advanced systems currently available to conservators, which will be improved according to green metrics and circular economy requirements. 5) Green tech solutions for monitoring CH assets non-invasively against pollutants and environmental oscillations. Life Cycle Assessment and modeling favor the “safe-by-design” creation of affordable solutions safe to craftspeople, operators and the environment, and minimize energy-consumption in monitoring museum environments. Such holistic approach is granted in GREENART by a multidisciplinary partnership that gathers hard and soft sciences and engineering, including academic centers, innovative industries and SMEs, conservation institutions and professionals, museums whose collections hold absolute masterpieces in need of conservation, public entities and policy makers. Innovative materials and products have been assessed at the lab scale on representative mock-ups of works of art (remedial conservation), or in simulated museum/archive environments (preventive conservation). The project intends to transfer the most promising systems to field assessment on actual artefacts and museums/archives, in cooperation with conservator partners. The best products are also fed into a GREENART open repository and an App to illustrate the new solutions and involve citizens in good preservation practices. Constant feedback from conservators (internal or external to the partnership) can stimulate iterative refinement of the products, triggering a positive loop in this methodological approach. Covering these topics, we provide here an overview of the most advanced green materials for art conservation that can be useful to end-users in this field.

How to cite: Chelazzi, D., Poggi, G., and Baglioni, P.: The GREENART project: "green" and sustainable materials for cultural heritage conservation, EGU General Assembly 2025, Vienna, Austria, 27 Apr–2 May 2025, EGU25-18757, https://doi.org/10.5194/egusphere-egu25-18757, 2025.

EGU25-19235 | Posters on site | CL3.2.7

A Smart Decision Support System for the Mitigation of Climate Change Effects on Cultural Heritage 

Vassiliki Charalampopoulou, Anastasia Anastasiou, Efthymios Magkoufis, Konstantinos Mpotonakis, and Christos Kontopoulos

Nowadays Cultural Heritage (CH) monuments face increasing effects of climate change (CC) that vitally impact their sustainability. The TRIQUETRA project, recognising the cruciality of the identification, quantification and mitigation of those CC-driven effects, aims to develop a novel Decision Support System (DSS) that leverages the existing knowledge, to efficiently provide a holistic approach for the conservation of the CH monuments.

More specifically, the TRIQUETRA project focuses on developing a comprehensive, evidence-based DSS for the identification and mitigation of the impacts of climate change on CH sites. TRIQUETRA is based on three key components i.e., Risk Identification, Risk Quantification, and Risk Mitigation. The basis for the DSS is the TRIQUETRA Knowledge Base Platform (KBP), which serves as a dynamic electronic repository equipped with advanced search functionalities and visualisation tools. The KBP concentrates a wide array of validated data regarding a wide variety of CH sites around the world, which climatic, geological and historical records, site-specific attributes, risk assessment, and mitigation strategies are provided through verified research publications.

The DSS features two distinctive modules: the a) Risk Severity Quantification module and b) the Mitigation Measure Selection and Optimisation module. The latter utilises the catalogued information of KBP to provide tailored mitigation measures for each pilot site and verify them based on project outcomes. By incorporating dynamic user stories that consistently reflect the stakeholders' needs, this module facilitates the selection of the most appropriate preservation and mitigation strategies for each site.

Moreover, to enhance functionality, the DSS integrates a search mechanism that allows users to filter results based on a series of criteria such as cost, implementation timeframe, topological effect, etc. The algorithm is adaptable to diverse user inputs and constitutes a scalable solution, leveraging the database of the KBP to identify optimal mitigation solutions, by cross-referencing the characteristics of a given CH site with those of similar sites documented in the relevant literature, providing users with a ranked list of applicable measures.

This adaptive module and the TRIQUETRA DSS as a whole aim to complement research contributing to the protection of cultural heritage against climate change, enabling tailored monitoring and preservation strategies for each pilot CH site.

How to cite: Charalampopoulou, V., Anastasiou, A., Magkoufis, E., Mpotonakis, K., and Kontopoulos, C.: A Smart Decision Support System for the Mitigation of Climate Change Effects on Cultural Heritage, EGU General Assembly 2025, Vienna, Austria, 27 Apr–2 May 2025, EGU25-19235, https://doi.org/10.5194/egusphere-egu25-19235, 2025.

EGU25-19445 | ECS | Posters on site | CL3.2.7

Wave Hazards on Underwater cultural Heritage: The Impact of Climate Change on Cadiz Bay  

Carmen Ferrero Martín, Alfredo Izquierdo, Manuel Bethencourt, Lorenzo Mentaschi, and Tomás Fernández Montblanc

The combination of future Sea level rise and changes in wave climate in coastal areas represents one of the greatest threats to the preservation of underwater cultural heritage (UCH). This study presents a new methodology to assess climate change’s impacts on UCH preservation in shallow waters, focusing on wave-induced hazards like decontextualization of archaeological object, scouring, and wear erosion caused by sediment transport. The approach uses hybrid downscaling of bias-corrected wave fields to assess the changes on this hazard and associated risk under RCP4.5 and RCP8.5 CMIP5 scenarios. The methodology was applied in the Bay of Cadiz, where an overall reduction in wave energy flux was observed. However, local increases were detected in rocky shoals and in the coastal zone, both areas with high UCH density. As a result, the shallow zones exhibited significant changes in decontextualization and scouring hazards. However, the most relevant risk changes were linked to wear erosion, particularly at sites on rocky outcrops near Cadiz. The developed methodology tested in this study is essential for identifying areas with higher risk and for evaluating UCH preservation under future climate conditions. It offers an effective tool for screening sites at risk and for conducting a long-term assessment of these risks in coastal environments affected by climate change.

How to cite: Ferrero Martín, C., Izquierdo, A., Bethencourt, M., Mentaschi, L., and Fernández Montblanc, T.: Wave Hazards on Underwater cultural Heritage: The Impact of Climate Change on Cadiz Bay , EGU General Assembly 2025, Vienna, Austria, 27 Apr–2 May 2025, EGU25-19445, https://doi.org/10.5194/egusphere-egu25-19445, 2025.

EGU25-19751 | ECS | Posters on site | CL3.2.7

CFD investigation of wave runup on coastal cliffs for impact assessment on cultural heritage 

Raouf Sobhani, Denis Istrati, Salvatore Martino, Gian Marco Marmoni, and Federico Feliziani

Wave runup plays a pivotal role in shaping the stability of coastal cliffs, as it generates hydrodynamic pressures that can compromise their structural integrity over time. These cliffs, especially those near cultural heritage (CH) sites, are vital natural structures that indirectly safeguard invaluable assets. Their destabilization, however, poses significant risks, necessitating a comprehensive understanding of the underlying processes that threaten their stability. Despite growing interest in coastal hazard assessments, there remains a paucity of quantitative studies focused on the interplay between wave runup dynamics and the structural characteristics of cliffs. Addressing this gap is essential for improving risk assessment methodologies and developing effective mitigation strategies.

Field measurements conducted in the Horizon Europe project TRIQUETRA revealed that coastal cliffs rarely conform to idealized vertical geometries. Instead, they often exhibit structural irregularities, such as varying inclinations or pre-existing damage like notches, which can exacerbate their exposure to wave-induced pressures. These variations are critical in determining the wave runup and consequently the exposed height of the cliff, which affects its stability. In this study, computational fluid dynamics (CFD) simulations using the Volume of Fluid (VOF) method were employed to model wave-cliff interactions. The analysis focused on the influence of geometric configurations and structural irregularities on the maximum wave runup and the  hydrodynamic pressure distributions, with particular attention to the behavior of steeply inclined cliffs and notched formations. The results demonstrate that wave runup is significantly amplified on near-vertical cliffs, with this effect becoming more pronounced under larger wave conditions. Conversely, notches reduce overall wave runup as their height increases, redistributing hydrodynamic forces along the cliff face and altering the pressure patterns. These findings highlight the intricate relationship between wave dynamics and structural variations, emphasizing the need for site-specific analyses when assessing cliff vulnerabilities.

By advancing the understanding of wave-cliff interactions, this research provides a valuable contribution to coastal hazard studies, offering new insights into the mechanisms driving cliff instability. The outcomes underscore the importance of integrating advanced CFD tools into risk assessments, enabling the design of targeted mitigation strategies to protect coastal regions and preserve the structural integrity of cliffs that play a critical role in safeguarding nearby CH sites.

Acknowledgments: This work is based on procedures and tasks implemented within the project “Toolbox for assessing and mitigating Climate Change risks and natural hazards threatening cultural heritage—TRIQUETRA”, which is a Project funded by the EU HE research and innovation program under GA No. 101094818.


How to cite: Sobhani, R., Istrati, D., Martino, S., Marmoni, G. M., and Feliziani, F.: CFD investigation of wave runup on coastal cliffs for impact assessment on cultural heritage, EGU General Assembly 2025, Vienna, Austria, 27 Apr–2 May 2025, EGU25-19751, https://doi.org/10.5194/egusphere-egu25-19751, 2025.

EGU25-21315 | ECS | Posters on site | CL3.2.7

Aerial and ground-based surveying and 3D modeling of cultural heritage – a case study in Messolonghi, Western Greece 

Panagiotis Tsikas, Aggeliki Kyriou, Epameinondas Lyros, Konstantinos Nikolakopoulos, and Christoforos Pappas

Digital twins of cultural heritage are urgently needed for both comprehensive documentation and digitalization of the monuments, and, also, for the efficient planning of restoration activities towards increased resilience to climatic stressors. Here, we present a workflow for geodetic field surveying followed by 3D building information modeling (BIM), to create a digital twin of an example historical building of Western Greece, the ‘Old Hatzikosta Hospital’ in Messolonghi. More specifically, a detailed point cloud was generated, based on data collected with a Terrestrial Laser Scanner. Building features not directly detectable from the ground (e.g., rooftops) were mapped with photogrammetry using an Unmanned Aerial Vehicle (UAV). The collected data were then further analysed to derive a detailed 3D model of the monument. This 3D model could serve as a baseline for future engineering applications, such as planning maintenance and restoration interventions. Moreover, the digitalization of cultural heritage could also assist in raising public’s awareness and making such historical buildings more widely visible and accessible (e.g., virtual tours, interactive geodatabases etc.).

How to cite: Tsikas, P., Kyriou, A., Lyros, E., Nikolakopoulos, K., and Pappas, C.: Aerial and ground-based surveying and 3D modeling of cultural heritage – a case study in Messolonghi, Western Greece, EGU General Assembly 2025, Vienna, Austria, 27 Apr–2 May 2025, EGU25-21315, https://doi.org/10.5194/egusphere-egu25-21315, 2025.

In recent years, the severe impact of wildfires has sharply increased due to rising temperatures and drought-like conditions. Therefore, in addition to continuous wildfire monitoring, a long-term understanding of the climate-wildfire relationship is warranted. This study has explored the climate-wildfire relationship in the southern Taiwan region over the past two millennia, focusing on the influence of climate and human activities on wildfire occurrences and their subsequent impact on lake. To achieve this, carbon, nitrogen, carbon isotopic composition of organic matter, charcoal, and diatom assemblages were analysed in the Dongyuan Lake core sediments. Wildfires occurring between 1850 and 1050 cal years BP were largely caused by drier climate conditions. However, wildfires occurring during 750-500 cal years BP and from 350 cal years BP to the present, intervals characterized by wet climate conditions, coincided with a significant number of archaeological sites near Dongyuan Lake, suggesting human-induced burning in the region. The observed wet interval during 1050-750 cal years BP in southern Taiwan attributed to the Medieval Warm Period (MWP), and dry interval during 500-350 cal years BP linked to Little Ice Age (LIA). The low carbon content in Dongyuan Lake sediments coincided with peaks of charcoal accumulation, indicating the loss of carbon due to wildfires and the dilution of sediments. The principal component analysis (PCA) of diatom data showed that PC1 and PC2 represented the lake's acidic conditions, suggesting an increase in pH from 750 to 150 cal years BP. This variation in pH appeared to be linked with wildfire intensity and frequency. PC1 and PC2 also showed strong acidic conditions during the last 150 years, plausibly due to the increase in acid rain conditions in the last century.

How to cite: Rahman, A. and Wang, L. C.: Climate-fire-human interactions and their impact on the limnology conditions of the Dongyuan Lake, Southern Taiwan during the last 1800 cal years BP, EGU General Assembly 2025, Vienna, Austria, 27 Apr–2 May 2025, EGU25-593, https://doi.org/10.5194/egusphere-egu25-593, 2025.

EGU25-1579 | ECS | Posters on site | BG1.4

Prioritizing Areas for Post-Fire Restoration in Greece Using Mixed-Methods Spatial Analysis 

Elena Palenova, Sander Veraverbeke, Themistoklis Kontos, and Karin Ebert

The frequency and severity of wildfires are projected to increase in the Mediterranean region. Greece currently lacks a developed standardized system for identifying and prioritizing burnt areas in relation to their restoration needs. Prioritization of areas for post-fire restoration efforts using geographic information system (GIS) and remote sensing (RS) can be useful in decision-making. However, this approach is often insufficient in effectively integrating perspectives from multiple stakeholders and socio-ecological criteria. Combining qualitative methods such as interviews with GIS and RS methods can enhance the understanding of nuances in a local context. 

We designed an approach to identify high-priority areas for post-fire restoration. The identification was based on interviews with stakeholders and the application of GIS and RS. We conducted 15 interviews with stakeholders working on post-fire issues and selected criteria for the prioritization analysis based on their views. The expert interviews revealed perceptions regarding the necessity of vegetation restoration and rehabilitation efforts and helped to identify the key characteristics respondents consider essential for prioritizing burnt areas for restoration. These insights established an analysis using GIS and RS to select areas based on the identified characteristics. 

We selected the areas for restoration based on fire history, slope, and designation as part of the protected areas. The outcomes of the analysis helped to highlight three areas that potentially need special attention. We propose a prioritization system that considers the natural regeneration potential of the Mediterranean and on-the-ground socio-ecological limitations, and can help government agencies, local foresters, private consultancies, and NGOs plan restoration actions and optimize the effectiveness of restoration programs in Greece.

How to cite: Palenova, E., Veraverbeke, S., Kontos, T., and Ebert, K.: Prioritizing Areas for Post-Fire Restoration in Greece Using Mixed-Methods Spatial Analysis, EGU General Assembly 2025, Vienna, Austria, 27 Apr–2 May 2025, EGU25-1579, https://doi.org/10.5194/egusphere-egu25-1579, 2025.

EGU25-1986 | Orals | BG1.4

Forest fire size amplifies postfire land surface warming 

Chao Yue, Jie Zhao, Jiaming Wang, Stijn Hantson, Xianli Wang, Binbin He, Guangyao Li, Liang Wang, Hongfei Zhao, and Sebastiaan Luyssaert

Climate warming has caused a widespread increase in extreme fire weather, making forest fires longer-lived and larger. The average forest fire size in Canada, the USA and Australia has doubled or even tripled in recent decades. In return, forest fires feed back to climate by modulating land–atmospheric carbon, nitrogen, aerosol, energy and water fluxes. However, the surface climate impacts of increasingly large fires and their implications for land management remain to be established. Here we use satellite observations to show that in temperate and boreal forests in the Northern Hemisphere, fire size persistently amplified decade-long postfire land surface warming in summer per unit burnt area. Both warming and its amplification with fire size were found to diminish with an increasing abundance of broadleaf trees, consistent with their lower fire vulnerability compared with coniferous species. Fire-size-enhanced warming may affect the success and composition of postfire stand regeneration as well as permafrost degradation, presenting previously overlooked, additional feedback effects to future climate and fire dynamics. Given the projected increase in fire size in northern forests, climate-smart forestry should aim to mitigate the climate risks of large fires, possibly by increasing the share of broadleaf trees, where appropriate, and avoiding active pyrophytes.

How to cite: Yue, C., Zhao, J., Wang, J., Hantson, S., Wang, X., He, B., Li, G., Wang, L., Zhao, H., and Luyssaert, S.: Forest fire size amplifies postfire land surface warming, EGU General Assembly 2025, Vienna, Austria, 27 Apr–2 May 2025, EGU25-1986, https://doi.org/10.5194/egusphere-egu25-1986, 2025.

EGU25-2126 | ECS | Orals | BG1.4

Meteorological impacts on long-range spotting of firebrands 

Alberto Alonso Pinar, Jean-Baptiste Filippi, and Alexander Filkov

Firebrands, small pieces of burning vegetation, can be detached and transported far away from the main fire front during intense fires. The process of firebrand generation, transport and ignition of a fuel bed is known as spotting. Spotting can start new fires and plays an important role in wildfire spread, presenting critical challenges for containment strategies and risk management. This study utilizes a series of high-resolution simulations to evaluate the influence of wind speed, topographic features, fire intensity and atmospheric stability on firebrand transport and fuel ignition. By coupling a fire-atmosphere modeling with combustion and firebrand transport models, we analyze key processes affecting firebrand trajectories and ignition potential.

To obtain realistic conditions of an intense fire, we use the cloud resolving weather model MesoNH coupled with the fire propagation model ForeFire. Such coupled fire-atmosphere simulations are designed to have a computational domain of the same scale of large wildfires, here 80m resolution for 14 km wide, 28 km length and 16 km high. This coupled fire atmosphere model is run for 36 different conditions:

  • Three reference wind speeds (5, 10 and 15m.s-1)
  • Three head fire heat flux (40, 80 and 120 kW.m-2)
  • Three topographies (a flat terrain, a hill and a canyon)
  • Two atmospheric conditions: stable and unstable

Firebrands are modelled as point masses with three degrees of freedom (three translations), with a set of aerodynamic coefficients and a combustion model. By combining high-resolution LES simulations with detailed firebrand trajectory and combustion processes, we expect to obtain realistic firebrand trajectories.

The resulting different ground patterns distributions of potentially still burning firebrands show that high wind speeds significantly increase firebrand lofting and horizontal transport distances of up to several kilometers. The maximum spotting distance is increased when topographic elements, such as hills or canyons, are added to the simulation. Furthermore, atmospheric stability exerts a critical influence on firebrand behavior: unstable conditions encourage turbulent mixing, vortices, and upward lofting with increased maximum heights reached by the firebrands.

Our results also emphasize the interaction between fire intensity, terrain-driven wind patterns, and atmospheric conditions. This should allow to identify thresholds where long-range spotting becomes most likely. As a result, this research provides valuable insights into the mechanisms driving firebrand dynamics, advancing predictive wildfire modeling and improving hazard mitigation strategies.


These results contribute to the broader understanding of wildfire behavior and have practical implications for fire management, evacuation planning, and the development of tailored mitigation measures to address the growing threats posed by wildfires in a changing climate.

How to cite: Alonso Pinar, A., Filippi, J.-B., and Filkov, A.: Meteorological impacts on long-range spotting of firebrands, EGU General Assembly 2025, Vienna, Austria, 27 Apr–2 May 2025, EGU25-2126, https://doi.org/10.5194/egusphere-egu25-2126, 2025.

EGU25-2854 | ECS | Posters on site | BG1.4

Detecting Burned Area Anomalies with Isolation Forest in the Tropics: A Focus on Madagascar  

Shrijana Poudel, Robert Parker, Heiko Balzter, Tristan Quaife, and Douglas Kelley

Tropical forests are at high risk of dieback due to human-induced disturbances including forest fires, agricultural expansion, and logging. These disturbances can degrade the ecosystems, slow forest recovery, and disrupt the global carbon cycle, leading to irreversible changes or ‘tipping point’ in the Earth’s climate system – the point at which disruption to the climate potentially becomes irreversible. Early warning signals of tipping points for the Amazon rainforest and Greenland ice sheet have already been detected. Monitoring these forest ecosystems is crucial to mitigate future long-term consequences. In order to analyse the response of vegetation to disturbances, we must first identify such disturbances, ideally across the entire tropics over a long period of time. We must also carefully consider what we mean by a “disturbance” and it is not necessarily just the largest fire event. It may be that a significant disturbance is a modest fire event but in a region that does not typically experience burning or a fire event outside of the typical fire season. In both of those instances, we might expect the vegetation response to have different characteristics to those from regular, large burns.

In this study, we applied Isolation Forest (IF) algorithm to detect Burned Area (BA) anomaly and apply it to ESA FireCCI51 dataset (2001-2020) over IPCC AR6 defined land regions, with Madagascar as a case study region. IF identifies anomalies by considering how easily they can be isolated from the main distribution and allows us to introduce features beyond just the burned area itself (e.g., time and location of the fire). Explainable AI (SHAP) analysis was also performed to further understand the predicted BA anomaly. A higher number of BA anomalies were mostly linked to larger values of BA over the Tropics and in Madagascar, however, anomalies in BA are also affected by temporal and geographical factors other than the magnitude of BA. IF detected a high number of anomalies (>20) in the northern region of Madagascar which comparatively had lower BA values which could indicate deviation from seasonal fire patterns. These results were further explained by SHAP analysis which showed that BA was the main factor influencing prediction of BA anomaly but that time and location could play a significant role in some anomaly detections. This suggests that deviation from the typical fire seasonality was another factor contributing to anomaly detection. The high number of anomalies in these specific areas highlights the need for targeted fire management strategies so that policymakers can anticipate the long-term effects of climate change and human activity on tropical forests, guiding sustainable land use, conservation, and climate adaptation efforts in vulnerable regions.

How to cite: Poudel, S., Parker, R., Balzter, H., Quaife, T., and Kelley, D.: Detecting Burned Area Anomalies with Isolation Forest in the Tropics: A Focus on Madagascar , EGU General Assembly 2025, Vienna, Austria, 27 Apr–2 May 2025, EGU25-2854, https://doi.org/10.5194/egusphere-egu25-2854, 2025.

EGU25-4358 | ECS | Posters on site | BG1.4

Human Exposure to Wildfires in Mediterranean Environments: A Case Study from Catalonia (1992–2021) 

Miguel Ángel Torres-Vázquez, Matteo Dalle Vaglie, Nicholas Kettridge, Federico Martellozzo, Gonzalo Miguez-Macho, Antonello Provenzale, Dominic Royé, Filippo Randelli, and Marco Turco

The Mediterranean region is one of Europe’s most fire-prone and vulnerable areas, facing compounding risks from urban expansion and wildfire activity. This study examines the evolution of human exposure to wildfires in Catalonia, northeastern Spain, over three decades (1992–2021). Using high-resolution geospatial data, including fire perimeters, nighttime light (NTL) intensity as a proxy for human activity, population data, and historical settlement patterns, we analyze trends in exposure per unit of burned area (BA). Results reveal a 77% increase in human exposure per unit BA, driven by population redistribution and urban expansion into fire-prone areas, despite a non-significant decrease in BA of −0.43 km²/year.

A novel aspect of this research is the integration of NTL data to capture dynamic changes in human activity and exposure, validated against population and settlement datasets. Exposure trends were assessed using counterfactual scenarios to isolate the impact of population dynamics. Findings underscore the critical need to account for human activity changes in wildfire risk assessments, highlighting the increasing vulnerability of expanding urban landscapes in Mediterranean regions. These insights are essential for developing adaptive and proactive wildfire management strategies to mitigate future risks.

This methodology provides a replicable framework for assessing wildfire exposure in diverse geographical contexts, emphasizing the value of integrating population dynamics with environmental datasets.

This work is currently in preparation.

Acknowledgements:
This work was supported by the project ‘Climate and Wildfire Interface Study for Europe (CHASE)’ under the 6th Seed Funding Call by the European University for Well-Being (EUniWell). M.T. acknowledges funding by the Spanish Ministry of Science, Innovation and Universities through the Ramón y Cajal Grant Reference RYC2019-027115-I. M.A.T-V and M.T acknowledge funding through the project ONFIRE, Grant PID2021-123193OB-I00, funded by MCIN/AEI/10.13039/501100011033 and by “ERDF A way of making Europe”. AP acknowledges the support of the EU H2020 project “FirEUrisk”, Grant Agreement No. 101003890. The authors thank the Generalitat de Catalunya for access to fire perimeter data and Xavier Castro from the Forest Fire Prevention Service of the Generalitat de Catalunya for the helpful discussions on the matter.

How to cite: Torres-Vázquez, M. Á., Dalle Vaglie, M., Kettridge, N., Martellozzo, F., Miguez-Macho, G., Provenzale, A., Royé, D., Randelli, F., and Turco, M.: Human Exposure to Wildfires in Mediterranean Environments: A Case Study from Catalonia (1992–2021), EGU General Assembly 2025, Vienna, Austria, 27 Apr–2 May 2025, EGU25-4358, https://doi.org/10.5194/egusphere-egu25-4358, 2025.

It is becoming increasingly important to understand how ecosystems will recover from wildfires, which are increasing in frequency, severity and size, especially in coniferous forests. Megafires—defined as wildfires burning exceptionally large areas—are thought to have more negative effects on ecosystems than smaller fires. However, the effects of megafires vary substantially, and one hypothesis is that intra-fire heterogeneity of burn patches can dictate the recovery of ecosystems. We evaluated the role of spatial configuration of burn patches within megafires using remote sensing data of fires and vegetation at 30x30 m resolution across 36 years and field-survey data of forest recovery in the western USA. Megafires contributed 62% of total burned area, with their frequency explaining 83% of the variation in the inter-annual burned area from 1984-2020. However, megafire size alone did not inherently result in severe ecosystem transitions, with megafires that experienced large contiguous patches of severely burned forest taking longer to recover. Field surveys illustrated delayed recovery resulted from a tree dispersal-limitation threshold of ca. 150 m, such that increasing distance from intact coniferous forest significantly delayed recovery. Machine learning image classification revealed that the rate of recovery in the severely burned areas has declined by ca. 50% from 1984-2020, with distance from seed source being more important than all climate variables analysed. Consequently, spatial configuration of high-severity burn patches within fires—which have become both larger and more compact through time—are key for assessing the effect of megafires on forest resilience.

How to cite: Pellegrini, A. and Schoenecker, J.: Spatial configuration of severely burned patches within megafires explains ecosystem resilience , EGU General Assembly 2025, Vienna, Austria, 27 Apr–2 May 2025, EGU25-4739, https://doi.org/10.5194/egusphere-egu25-4739, 2025.

EGU25-5629 | Posters on site | BG1.4

An enhanced NHI algorithm configuration for fire detection and mapping 

Giuseppe Mazzeo, Alfredo Falconieri, Carolina Filizzola, Nicola Genzano, Nicola Pergola, and Francesco Marchese

The devastating fire events occurring during the intense fire season of 2023 have shown the importance of developing efficient fire detection methods capable of supporting the fire management activities. An enhanced configuration of the Normalized Hotspot Indices (NHI) algorithm has been developed in this direction to improve the fire mapping by satellite through near infrared (NIR) and short-wave infrared (SWIR) data (up to 20 m spatial resolution) from the Operational Land Imager (OLI/OLI2) and the Multispectral Instrument (MSI) aboard Landsat-8/9 (L8/9) and Sentinel-2 (S2) satellites, respectively. In this work, we show the results achieved by investigating the fire events occurring in California, Hawaii islands (USA), Yellowknife (Canada), Tenerife islands (Spain), Greece and Australia also through comparison with information from operational Landsat Fire and Thermal Anomaly (LFTA) product. Results of an extended validation analysis performed using information from well-established databases show that the enhanced NHI algorithm configuration enabled an accurate mapping of fire fronts with a very number of omission and commission errors. Moreover, the algorithm flagged up to 99% of fire pixels from the LFTA product over California and detected up to 70% of additional fire pixels, in night-time conditions, which better detailed the fire fronts and provided unique information about small-fire outbreaks. The effective integration of S2 (daytime) and L8/9 (daytime/night-time) observations, demonstrates that the enhanced NHI algorithm configuration may be used with success to analyse the dynamic evolution of flaming fronts by assessing/complementing information from satellite products at high-temporal/low-spatial resolution. The next implementation of the algorithm on from the Sea and Land Surface Temperature Radiometer (SLSTR) aboard Sentinel-3 satellite and the Flexible Combined Imager (FCI) of the Meteosat Third Generation (MTG) opens some interesting perspectives also regarding its usage for the near-real time monitoring of wildfires

How to cite: Mazzeo, G., Falconieri, A., Filizzola, C., Genzano, N., Pergola, N., and Marchese, F.: An enhanced NHI algorithm configuration for fire detection and mapping, EGU General Assembly 2025, Vienna, Austria, 27 Apr–2 May 2025, EGU25-5629, https://doi.org/10.5194/egusphere-egu25-5629, 2025.

EGU25-6292 | ECS | Orals | BG1.4

Overestimating Fire Weather Trends: Challenges in Using Daily Climate Data 

Alberto Moreno, Aurora Matteo, Sixto Herrera, Cesar Azorin-Molina, Joaquín Bedia, Antonello Provenzale, Robert J. H. Dunn, Ginés Garnés-Morales, Yann Quilcaille, Miguel Ángel Torres Vázquez, Francesca Di Giuseppe, and Marco Turco

The Fire Weather Index (FWI) is a widely used metric for assessing wildfire danger, relying on sub-daily meteorological data, typically recorded at local noon. However, most climate models and observational datasets only provide daily-aggregated variables, which can introduce biases in fire weather assessments under climate change. This study evaluates how approximating noon-specific calculations impacts the trends of extreme fire weather days (FWI95d), defined as the annual number of days exceeding the 95th percentile of daily FWI values (FWI95d).

Using global data from ERA5 for 1980–2023, we find that FWI95d have increased by 65% over 44 years, corresponding to an average of 11.66 additional extreme fire weather days per year. Daily approximations consistently overestimate this trend by 5–10%, with the largest differences observed in fire-prone regions such as the western United States, southern Africa, and parts of Asia. Among the tested proxies, the combination of daily mean values for air temperature, relative humidity, precipitation, and wind speed exhibits the lower biases, while proxies involving minimum relative humidity tend to overestimate trends more significantly.

Our findings emphasize the importance of sub-daily meteorological data for accurate wildfire risk projections. In its absence, we recommend prioritizing daily mean approximations over other proxies as the least-biased alternative in the absence of noon-specific data. These results underscore the potential for misrepresentation of future fire weather risks in climate models, particularly if systematic biases introduced by daily approximations are not addressed. Future climate model intercomparison projects should prioritize the inclusion of sub-daily meteorological outputs to enhance the reliability of fire weather assessments globally.

Acknowledgements
M.T. acknowledges funding by the Spanish Ministry of Science, Innovation and Universities through the Ramón y Cajal Grant Reference RYC2019-027115-I and through the project ONFIRE, Grant PID2021-123193OB-I00, funded by MCIN/AEI/10.13039/501100011033 and by “ERDF A way of making Europe”. This work was supported by the project ‘Climate and Wildfire Interface Study for Europe (CHASE)’ under the 6th Seed Funding Call by the European University for Well-Being (EUniWell).


How to cite: Moreno, A., Matteo, A., Herrera, S., Azorin-Molina, C., Bedia, J., Provenzale, A., Dunn, R. J. H., Garnés-Morales, G., Quilcaille, Y., Ángel Torres Vázquez, M., Di Giuseppe, F., and Turco, M.: Overestimating Fire Weather Trends: Challenges in Using Daily Climate Data, EGU General Assembly 2025, Vienna, Austria, 27 Apr–2 May 2025, EGU25-6292, https://doi.org/10.5194/egusphere-egu25-6292, 2025.

Haralamb Georgescu was a Romanian architect who fleed the communist rule and settled in the USA. After a brief period in the Eastern part, he settled in Los Angeles where not only did he build his most iconic buildings, but also was featured for futuristic utopic designs. Within the Romanian funded project "Future on the past" (featured at EGU 2023), which used digital humanities methods to develop innovative mapping techniques, including ontologies, for earthquake, flood and fire, also the buildings of Haralamb Georgescu were studied. This happened in conjunction with another Romanian sister project (both ended with the PNIII framework programme on the 31.12.2024) which focused on Romanian-American relationships in the interwar time in a publication of which first results were published. Haralamb Georgescu started his career in the interwar time in Romania. 2-7 January 2025 I visited Mangalia where is his last building built in Romania. Some others built in Bucharest were mapped before, and so were those in the USA, including Los Angeles. Materials on Los Angeles were available from two sources: the Getty archives and a book of drawings of building projects, catalogue of a past exhibition at the "Ion Mincu" University of Architecture and Urbanism, which was done after the rediscovery of Haralamb Georgescu following the restoration of the Pasinetti house, the most emblematic one, featured in a magazine of the time. The mapping in Google Maps of the buildings of Haralamb Georgescu was exported and imported in arcGIS online Living Atlas, the map on US current wildfires. This way three buildings of Haralamb Georgescu were identified (Bucharest restaurant next to the Eaton forest, Lark Arrow apartments in the same area, Rinaldi convalescent hospital) next to wildfires and one on a wildfire and this was the Pasinetti House in Beverly Hills. Unfortunately searching the news confirmed the mapping as the CBS reported dogs being rescued from the lost house of Pasinetti. Besides, during the project in frame of work for COST CA18135 - Fire in the Earth System: Science & Society (FIRElinks), as working group member of group 5 Socio-economic aspects of fire and fire risk management, an ontology of fire was developed and published. This contribution will test how the findings fit into this ontology. Current work is being done in the Climate change adaptation working group of ICOMOS ISCARSAH related to the structures of monuments which includes the effects of wildfire. The architecture of Haralamb Georgescu is Modernist architecture related in typology to that of the Cyclades, and the publication from the COST action also covered the relationship to fires in Greece, specifically Paros in 2022. Some more insights on this will be included after more site visits. This is in line with the research question of the project on how vernacular architecture may render Modernist buildings which include elements inspired by it more safe, through so-called local culture, extensively studied so far for seismic events and started for flood events, but scarcely so for wildfires. The ontology in computer science understanding helps this.

How to cite: Bostenaru Dan, M.: The impact of the January 2025 Southern California fires on the buildings of Haralamb Georgescu in Los Angeles, EGU General Assembly 2025, Vienna, Austria, 27 Apr–2 May 2025, EGU25-7664, https://doi.org/10.5194/egusphere-egu25-7664, 2025.

EGU25-8889 | Posters on site | BG1.4

Hydrological impacts of wildfires on a global scale: An analysis based on the fire-enabled models of ISIMIP. 

Manolis Grillakis and Apostolos Voulgarakis

Wildfires can significantly alter the hydrological regime of a watershed until vegetation is reestablished and the hydrological cycle returns to its pre-disturbance state. These wildfire-induced changes can disrupt flow patterns by reducing rainfall interception and evapotranspiration due to vegetation loss. Additionally, wildfires can affect soil permeability, either through ash deposition or, in boreal regions, by facilitating permafrost thaw.

Land surface models play a critical role in understanding and predicting interactions between the Earth's surface the atmosphere. They enable detailed assessments of water, energy, and carbon cycling, which are essential for climate modeling, ecosystem management, and policy development.

In this study, we analyze surface runoff simulated by six fire-enabled ISIMIP3a land surface models for the period 1850–2019. We identify changes in the runoff coefficient between the most fire-active and least fire-active decades in the timeseries. To isolate the role of long-term climatic trends, we utilize counterfactual simulation outputs driven by detrended observational climate data, where the signal of global warming has been removed.

Our preliminary results reveal consistent patterns between the modeled results and observed runoff changes reported in other studies, though substantial variability exists among the different land surface models. This work aims to assess the ability of state-of-the-art land surface models to represent a complex interaction on the land surface, while also enhancing our understanding of the hydrological impacts of wildfires and contributing to improving the representation of fire-hydrology processes in modeling frameworks.

This work is supported by Leverhulme Centre for Wildfires, Environment, and Society through the Leverhulme Trust, grant number RC-2018-023.

How to cite: Grillakis, M. and Voulgarakis, A.: Hydrological impacts of wildfires on a global scale: An analysis based on the fire-enabled models of ISIMIP., EGU General Assembly 2025, Vienna, Austria, 27 Apr–2 May 2025, EGU25-8889, https://doi.org/10.5194/egusphere-egu25-8889, 2025.

EGU25-9817 | ECS | Posters on site | BG1.4

Causal Attribution of Arctic Wildfire Events in the 21st Century to Anthropogenic Forcing 

Lukas Fiedler, Armineh Barkhordarian, Victor Brovkin, and Johanna Baehr

As an imprint of its rapid climatic transformation over the last two decades, the pan-Arctic region has experienced increasingly extreme fire events. However, a systematic and regionally comprehensive assessment of the recent extreme fire events in the pan-Arctic and the role played by human emissions is still pending. In this study, we employ an extreme event-attribution framework to assess the extent to which anthropogenic forcing affects the magnitude (Burned Area) and likelihood of favourable conditions of extreme fire events (Canadian Forest Fire Weather Index) in the pan-Arctic region throughout the 21st century. Therefore, we utilise large ensemble simulations conducted with the Community Earth System Model version 2 (CESM2), which are capable of isolating anthropogenic external climate forcings and observations from distinct remote sensing products as well as reanalysis data. Our results indicate that the presence of anthropogenic forcing throughout the 21st century was necessary to enable the observed extreme fire events in the pan-Arctic region. We find less than a 20% chance, that the extreme wildfire events occurred during recent fire seasons could have happened in the absence of human-induced external forcings. We can state that such wildfires have become 5 to 10 times more likely in comparison to pre-industrial climatic conditions. Furthermore, our findings indicate that the impact of anthropogenic forcings has significantly elevated the risk of high-latitudes experiencing severe fire-weather conditions by up to an order of magnitude. However, our study reveals the recent elevation in human-induced external forcings does not appear to be enough to explain the occurrence of observed extreme pan-Arctic wildfire events throughout the 21st century. We further explore the underlying mechanisms that drive changes in extreme fire-weather risk. We identify the relative contribution of maximum temperature, precipitation, relative humidity, and surface wind speed on the changes in extreme fire-weather risk.

How to cite: Fiedler, L., Barkhordarian, A., Brovkin, V., and Baehr, J.: Causal Attribution of Arctic Wildfire Events in the 21st Century to Anthropogenic Forcing, EGU General Assembly 2025, Vienna, Austria, 27 Apr–2 May 2025, EGU25-9817, https://doi.org/10.5194/egusphere-egu25-9817, 2025.

EGU25-10833 | ECS | Posters on site | BG1.4

Large-scale impacts of the 2023 Canadian wildfires on the Northern Hemisphere atmosphere 

Iulian-Alin Rosu, Matt Kasoar, Rafaila-Nikola Mourgela, Eirini Boleti, Mark Parrington, and Apostolos Voulgarakis

The study of wildfires is crucial to understanding the Earth system, as severe wildfire events can lead to intense degradation of nature and property. The record-breaking 2023 Canadian wildfire event best represents this, with approximately 5% of the total forest area of Canada burned [1] [2], resulting in biomass burning (BB) emissions quantitatively comparable to the annual fossil fuel emissions of large nations [3], and with the highest Canadian carbon emissions on record [4]. Increased mean temperatures along with decreased humidity in the region due to climate change are considered responsible for this record series of wildfires [5], as increasing mean temperatures along with decreasing humidity in the region led to increased fire risk.

Large amounts of carbonaceous aerosols can exert substantial atmospheric radiative forcing, thus it is important to study the consequences of these emissions on large-scale atmospheric composition and meteorological behavior. In this work, global and local atmospheric impacts of this historic wildfire event are analyzed using the EC-Earth3 earth system model [6] in its standard AerChem configuration. BB emissions from the Copernicus Atmosphere Monitoring Service (CAMS) Global Fire Assimilation System (GFAS) were used as input in the model to produce two 10-member ensembles simulations, with and without the 2023 Canadian wildfire emissions. The results are analyzed, and the differences in various modelled atmospheric quantities between the two ensembles are spatially cross-correlated to determine connections between atmospheric anomalies and wildfire intrusions.

Modelled monthly changes in radiative effects, cloud cover, large-scale circulation, and temperature patterns throughout the North Hemisphere and Canada are found as a result of the 2023 BB emissions, and the mechanisms via which these can be caused are discussed and explained. These changes include the long-range transport of the BB pollutants in the troposphere and the stratosphere with marked impacts on cloud cover and on temperatures at low and high altitudes, differential cooling over the Canadian region due to a dual influence of direct and indirect effects of AOD increases, and even large-scale circulation anomalies which led to cooling as far as in Eastern Siberia. We find that the modelled temperature anomalies between the two ensembles caused by the wildfire-generated aerosols can be as intense as -5.44 °C locally, while the modelled average hemispheric temperature anomaly is equal to -0.91 °C.

[1] "Fire Statistics". Canadian Interagency Forest Fire Centre. Retrieved January 4, 2024.

[2] “The State of Canada’s Forests: Annual Report”. 2022. Canadian Minister of Natural Resources.

[3] Byrne, Brendan, et al. "Carbon emissions from the 2023 Canadian wildfires" Nature. 2024 835-839.

[4] “Copernicus: Emissions from Canadian wildfires the highest on record – smoke plume reaches Europe”. Atmosphere Monitoring Service, Copernicus. Retrieved January 4, 2024.

[5] Barnes, Clair, et al. "Climate change more than doubled the likelihood of extreme fire weather conditions in eastern Canada" 2023.

[6] Döscher, Ralf, et al. "The EC-earth3 Earth system model for the climate model intercomparison project 6." Geoscientific Model Development Discussions. 2021 1-90.

How to cite: Rosu, I.-A., Kasoar, M., Mourgela, R.-N., Boleti, E., Parrington, M., and Voulgarakis, A.: Large-scale impacts of the 2023 Canadian wildfires on the Northern Hemisphere atmosphere, EGU General Assembly 2025, Vienna, Austria, 27 Apr–2 May 2025, EGU25-10833, https://doi.org/10.5194/egusphere-egu25-10833, 2025.

EGU25-12890 | Posters on site | BG1.4

Assessing the Impact of Climate Change on Forest Fire Weather Index Using Downscaled Climate Model Data 

Anton Laakso, Meeri Palokangas, Taijin Park, Antti Lipponen, Laura Utriainen, and Tero Mielonen

In recent years, fire activity at high latitudes has reached unprecedented levels, driven in part by global warming, which increases fire danger. Climate projections of fire risk rely on indices like the Canadian Forest Fire Weather Index (FWI), which are often derived from coarse-resolution climate models. Thus, there is the need for finer-scale fire weather projections to enable more effective planning and resource allocation as wildfire threats grow. High-resolution climate projections can be achieved through various methods, including dynamical and statistical downscaling, each potentially yielding different estimates of FWI and its future changes. We calculated the FWI based on HCLIM - Nordic Convection Permitting Climate Projections (NorCP) over Fennoscandia. The simulations include 12 x 12 km resolution models using HCLIM-ALADIN and convection-permitting simulation at 3 x 3 km resolution with HCLIM-AROME, covering both historical and future periods under the RCP8.5 scenario. Results were compared against FWI estimates from other climate datasets, such as CORDEX and statistically downscaled NASA Earth Exchange Global Daily Downscaled Projections (NEX-GDDP).


As expected, all the simulations indicate that the annual and summer mean FWI indices will increase significantly in warmer future climates, along with an increase in days with moderate and high fire weather risk. However, the magnitude of the risk depends heavily on the climate dataset used. For instance, HCLIM-AROME simulations generally show higher FWI values in the historical period even when compared to the future projections of HCLIM-ALADIN, due to generally lower summer precipitation in the former model. Additionally, there are notable regional disparities between the HCLIM simulations, with the highest FWI values observed in coastal areas of southern Finland and Sweden. According to the HCLIM-AROME simulations under the RCP8.5 scenario, these regions experience a moderate fire risk (FWI > 11) on roughly one out of three summer days, whereas HCLIM-ALADIN simulations indicate an average of 7–20 days per summer with such risk. There are also differences in the magnitude and regional distribution of FWIs calculated from HCLIM, NEX-GDDP, and CORDEX simulations. However, all future FWI predictions consistently indicate that, without effective mitigation of global warming, conditions for forest fires will worsen in the future.

How to cite: Laakso, A., Palokangas, M., Park, T., Lipponen, A., Utriainen, L., and Mielonen, T.: Assessing the Impact of Climate Change on Forest Fire Weather Index Using Downscaled Climate Model Data, EGU General Assembly 2025, Vienna, Austria, 27 Apr–2 May 2025, EGU25-12890, https://doi.org/10.5194/egusphere-egu25-12890, 2025.

Each year brings new stories of extreme wildfires and megafires, highlighting the tragic loss of lives, destruction of homes and livelihoods, reduced air quality over vast regions, economic disruption, and cascading impacts on ecosystems and the services they provide. Science has an essential role to play in addressing these challenges, offering tools for better prediction, preparedness, mitigation, and management.
 
As I write this, wildfires in Los Angeles have captured public attention and dominated the news over the past week. Amidst the coverage, it is worth noting that scientific tools enabled warning of these events to be issued up to a week in advance. This is a clear example of the potential for science to reduce harm and save lives.
 
Once the flames settle, science also plays a key role in understanding the factors driving such events, including the contributions of climate change, land use, and management practices. These studies are crucial for highlighting the actions at both global and local scales that can help to mitigate wildfire risk to society and the environment. The quick turnaround of such studies increasingly allows scientists to provide timely insights to policymakers and other stakeholders while the events are still in the public memory.
 
This invited talk will introduce an exciting session on recent advances in understanding extreme wildfire characteristics, drivers, prediction, impacts, and mitigation strategies. I will summarise recent compelling evidence for changes in fire behaviour, including shifts towards the extreme end of historic fire regimes and differences between trends in forested and non-forested regions. I will also discuss attribution studies, which often—but not always—identify climate change as a key factor in extreme fire events. I will highlight breakthroughs in fire observation and modelling that show great potential to generate a step-change in our ability to predict extreme wildfires at the global scale.
 
Finally, I will discuss the ambitions of the State of Wildfires project to deliver annual reports that retrospectively dissect the extremes of the prior fire season globally, to keep the issue prominent in public and policy discussions, and to encourage action on climate and land use policies.

How to cite: Jones, M.: Navigating the Era of Extreme Wildfires: Scientific Solutions and Future Directions, EGU General Assembly 2025, Vienna, Austria, 27 Apr–2 May 2025, EGU25-13652, https://doi.org/10.5194/egusphere-egu25-13652, 2025.

EGU25-13730 | Orals | BG1.4

Canadian wildfire in a changing climate from the 2023 wildfire season to the 2100s 

Salvatore Curasi, Joe Melton, Vivek Arora, Elyn Humphreys, and Cynthia Whaley

Wildfire influences the carbon cycle and impacts property, harvestable timber, and public health. The year 2023 saw a record area burned of 14.9 Mha in Canada, compared to an average of ~2 Mha between 1959 and 2015. Boreal wildfire is a critical process that is difficult to represent in land surface models. To enhance our understanding of historical and future wildfire regimes in Canada and their impact on carbon cycling we implement two methods of representing boreal wildfire in the Canadian Land Surface Scheme Including Biogeochemical Cycles (CLASSIC). These include a new dynamic wildfire model that represents fire weather and lightning ignitions as well as a fire model which is forced by historical observations of burned area. We find that in 2023 simulated wildfire emissions were eight times their 1985 - 2022 mean with consequences for the annual net carbon balance in Canada. Moving into the future we find that climate change below a 2°C global target (shared socioeconomic pathway [SSP] 126) yields burned area near modern (2004 - 2014) norms by end-century (2090 - 2100). However, under rapid climate change (SSP370/585), the end-century mean annual burned area increases 2 - 4 times, compared to present-day values, approaching the burned area seen in Canada in 2023. This work illustrates the historical implications of Canadian wildfires on the carbon cycle and the future implications of climate change for area burned in Canada.

How to cite: Curasi, S., Melton, J., Arora, V., Humphreys, E., and Whaley, C.: Canadian wildfire in a changing climate from the 2023 wildfire season to the 2100s, EGU General Assembly 2025, Vienna, Austria, 27 Apr–2 May 2025, EGU25-13730, https://doi.org/10.5194/egusphere-egu25-13730, 2025.

EGU25-13777 | ECS | Posters on site | BG1.4

The Intensifying Threat of Wildfires in the Mediterranean: Quantifying the Role of Climate Change in Extreme Fire Weather Events from the Past, Present to the Future 

Zhongwei Liu, Jonathan Eden, Bastien Dieppois, Matthew Blackett, and Robert Parker

Wildfires are an increasing environmental and societal threat across the Mediterranean region. While the widespread incidence of fires during recent summers has raised significant public concern, the impact of climate change on such events is challenging to quantify, and the evolving nature of extreme wildfires in general remains underexplored. Recent work has shed light on the link between extreme fire weather and climate change, particularly with respect to diagnosing uncertainties and sensitivities, but there are few studies directly linking individual wildfire events to the changing climate and its future implications.

This study employs an established statistical method applied to a large ensemble of climate model simulations as part of a seamless probabilistic approach to quantify how past, present and future risk in extreme fire weather has and will continue to change in the future. Using climate model projections to quantify the trends of likelihoods at different global warming levels offers great potential to support probabilistic assessment of future wildfire risks in a warmer world. Results reveal that fire weather conditions associated with the particularly damaging 2022 wildfires at ten independent locations across the Mediterranean regions of southern Europe and northern Africa have collectively become 80% more likely to occur compared to a century ago due to externally-forced warming temperatures. Further increases in likelihood of 60% and 80% are projected under +1.5°C and +2°C global warming levels, respectively, with the most pronounced increases observed in Spain and southern France. The findings emphasize the profound influence of climate change on the 2022-type wildfire events, manifesting the urgency of combining individual attribution studies further with future risk assessment to help enhance post-disaster resilience to the fire-prone regions.

How to cite: Liu, Z., Eden, J., Dieppois, B., Blackett, M., and Parker, R.: The Intensifying Threat of Wildfires in the Mediterranean: Quantifying the Role of Climate Change in Extreme Fire Weather Events from the Past, Present to the Future, EGU General Assembly 2025, Vienna, Austria, 27 Apr–2 May 2025, EGU25-13777, https://doi.org/10.5194/egusphere-egu25-13777, 2025.

EGU25-13787 | ECS | Posters on site | BG1.4

Probabilistic Analysis of Extreme Wildfire events in Italy Using Data-Cube Technology 

Farzad Ghasemiazma, Andrea Trucchia, Giorgio Meschi, Nicolo Perello, Marj Tonini, Silvia Degli Esposti, and Paolo Fiorucci

Wildfires are a critical component of natural ecosystems, contributing to biodiversity by shaping habitat structures and promoting species adaptation, but also posing significant risks to human life, infrastructure, and air quality. Wildfires can be characterized by both their impact and the drivers of their occurrence. Historical data exploration is essential for researchers to build data-driven models for wildfire risk assessment and also to capture the characteristics of extreme wildfire events (EWE). Such data may include fire perimeter records, weather observations, vegetation types, and topographic details, all of which contribute to understanding the conditions that lead to extreme fire behavior. 

The first step toward achieving this goal involves establishing a comprehensive data-cube that integrates all relevant datasets for wildfire risk assessment. A data-cube framework simplifies data exploration and querying by organizing static and dynamic data (in terms of time varying) in a structured format. The data-cube stores multi-dimensional arrays, allowing for efficient analysis of spatial and temporal variations in complex datasets. Static data (e.g., digital elevation model) represent constant landscape features, while dynamic data (e.g., relative humidity or temperature) capture temporal variations. Cloud storage solutions are vital for managing the high memory requirements of data-cube structures, enabling cheaper storage and open-source availability.  

The primary aim of this study is to utilize available data-cubes to identify the conditions that characterize EWE across historical records. By analyzing spatial and temporal dynamic data related to both wildfire occurrences and predisposing meteorological factors, we want to find patterns and signatures of extreme wildfires. Furthermore, additional datasets from various domains and resolutions will be structured into a similar data-cube format for broader analysis.  

Focus will be on the Italian peninsula, leveraging on climatic data at a 3 km spatial resolution with hourly temporal intervals (Chapter Dataset, https://doi.org/10.25927/0ppk7-znk14) allowing for detailed capture of conditions surrounding extreme wildfire events. The outcomes of this study will contribute to the development of probabilistic risk assessment models, providing valuable insights for wildfire risk management and mitigation strategies. 

Keywords: Extreme Wildfire Events, Probabilistic Wildfire Risk Assessment, Data-Cube, Meteorological indices in Wildfire Risk Assessment 

How to cite: Ghasemiazma, F., Trucchia, A., Meschi, G., Perello, N., Tonini, M., Degli Esposti, S., and Fiorucci, P.: Probabilistic Analysis of Extreme Wildfire events in Italy Using Data-Cube Technology, EGU General Assembly 2025, Vienna, Austria, 27 Apr–2 May 2025, EGU25-13787, https://doi.org/10.5194/egusphere-egu25-13787, 2025.

EGU25-14597 | Orals | BG1.4

Who dies in wildfires? Common denominators of fatal wildfires in the US 

Crystal Kolden and John Abatzoglou

In the United States, catastrophic wildfires have killed hundreds of people in recent years, including two high fatality events in the 2018 Camp Fire in California and the 2023 Lahaina Fire in Hawaii. These disasters were astounding not only because so many died so quickly, but also because they represent a shift in understanding of who dies in contemporary wildfires. For much of the 20th century, the primary lives lost in wildfires were the front line firefighters at the greatest risk. Over the last two decades, however, climate change has increased the extremity of wildfire behavior and resulted in numerous catastrophic wildfire events globally where dozens of civilians were killed. Here we evaluate both the biophysical drivers of fatal wildfires in the US and the social characteristics of wildfire fatalities. Downslope winds during drought conditions at the wildland-urban interface are the primary indicators of civilian fatalities, particularly in specific forest-shrubland interface Mediterranean fuel types and in complex terrain. Social vulnerability of the resident population was also a key driver of fatalities, as older populations with lower levels of mobility struggled to evacuate with no advanced notice. Fires that killed civilians stood in stark contrast to fires that killed firefighters, which occur primarily during peak fire season during extreme heat events and in rural, relatively forested areas. These differences highlight a critical gap in understanding how to mitigate civilian wildfire fatalities.

How to cite: Kolden, C. and Abatzoglou, J.: Who dies in wildfires? Common denominators of fatal wildfires in the US, EGU General Assembly 2025, Vienna, Austria, 27 Apr–2 May 2025, EGU25-14597, https://doi.org/10.5194/egusphere-egu25-14597, 2025.

EGU25-17607 | Orals | BG1.4

Global Data-Driven Prediction of Fire Activity 

Joe McNorton

In recent years, newly available observations, and modelling systems as well as advancements in machine learning have transformed the capabilities of fire danger prediction systems. The European Centre for Medium-Range Weather Forecasts (ECMWF) has set out to forecast wildfire probability on a global scale up to a week in advance. A key milestone was the development of the SPARKY-Fuel Characteristics dataset, released in 2024, which provides the first long-term, high-resolution record of real-time fuel status.

This study evaluates ECMWF’s operational data-driven fire prediction system over its first year. Through analysis of major wildfire events, including the extensive fires in Canada in 2023 and the fires in Los Angeles in 2025, we demonstrate the potential of data-driven methods to outperform traditional fire danger metrics. The results highlight the role of dynamic, global fuel assessments and machine learning in improving the accuracy and timeliness of fire probability forecasts.

Our findings underscore the importance of integrating both innovative data-driven approaches and key variables into operational forecasting systems, providing critical support for fire management and mitigation efforts worldwide.

How to cite: McNorton, J.: Global Data-Driven Prediction of Fire Activity, EGU General Assembly 2025, Vienna, Austria, 27 Apr–2 May 2025, EGU25-17607, https://doi.org/10.5194/egusphere-egu25-17607, 2025.

EGU25-18268 | ECS | Posters on site | BG1.4

Poleward transport of smoke aerosol from extreme boreal wildfires 

Swetlana Paul and Bernd Heinold

In recent decades, surface air temperatures in the Arctic increased faster than average global temperatures. At the same time, weather conditions that favor wildfires became more frequent globally and will likely continue to do so in a warming climate. This might lead to an increase in fire activity in most areas of the world, but particularly in regions with moderate moisture supply that are rich in biomass, such as North American temperate forests and boreal forests.

Extreme wildfires potentially emit large quantities of smoke that can be elevated as high as to the stratosphere, thereby possibly leading to a long-lasting atmospheric perturbation. Smoke aerosol is mostly composed of black carbon (BC) and organic carbon (OC). While BC mainly impacts the climate by heating the atmosphere through absorption of solar radiation, OC particles are important as cloud condensation nuclei, affecting cloud and precipitation formation. In light of the rapid Arctic warming, it is crucial to understand the role of smoke aerosol from wildfires in the Arctic climate system.

Using multidecadal simulations with the global aerosol-climate model ECHAM6.3.0-HAM2.3., it is analyzed on which pathways BC and OC emitted during extreme boreal wildfire events are transported towards the Arctic and how their transport patterns differ from those of smoke particles originating from moderate boreal wildfires. The contribution from the wildfire aerosol to the total poleward aerosol flux is calculated, and it is quantified which fraction of boreal wildfire aerosol reaches the Arctic region in the course of extreme fires. Transport heights, the accurate representation of which still poses a challenge to current climate models, are compared to height-resolved measurements of smoke aerosol.

How to cite: Paul, S. and Heinold, B.: Poleward transport of smoke aerosol from extreme boreal wildfires, EGU General Assembly 2025, Vienna, Austria, 27 Apr–2 May 2025, EGU25-18268, https://doi.org/10.5194/egusphere-egu25-18268, 2025.

EGU25-18657 | ECS | Orals | BG1.4

Burning In Pantanal Driven By Wetland Degradation And Lower Precipitation 

Maria Barbosa, Douglas Kelley, Chantelle Burton, Renata Libonati, Renata Da Veiga, Igor Ferreira, and Liana Anderson

The Brazilian Pantanal, renowned for its rich ecosystems and biodiversity, is under increasing threat from more frequent and intense fires. These wildfires endanger the region's ecology, wildlife, and critical role as a carbon sink. The catastrophic fires of 2020, which burned approximately 4 million hectares, highlighted the pressing need to better understand the Pantanal’s fire vulnerability and to develop effective strategies for protecting its ecosystems and carbon storage capacity.

Using the FLAME model, we evaluated the Pantanal’s fire susceptibility in the context of climate and land cover changes. Our analysis identified shifting precipitation patterns as a key driver of fire activity. Wetland cover emerged as a mitigating factor, with regions exhibiting a doubled wetland extent requiring half as much rainfall to avoid extreme burning levels. However, reducing wetland areas due to agricultural expansion and water management has significantly increased the region's fire vulnerability. The extreme fires of 2020 were linked to a critical threshold of reduced wetland extent and precipitation; without prior wetland degradation, the fires would likely have been less severe.

Our findings emphasize the necessity of integrating wetland cover dynamics and climate extremes into the Pantanal's fire management and conservation planning. This approach is vital for bolstering the region's resilience to fire and climate change, preserving its ecological integrity, and maintaining its carbon storage potential. The FLAME model facilitates the rapid assessment of burning scenarios, providing valuable insights for early preparedness and response strategies to protect this unique and irreplaceable ecosystem.

How to cite: Barbosa, M., Kelley, D., Burton, C., Libonati, R., Da Veiga, R., Ferreira, I., and Anderson, L.: Burning In Pantanal Driven By Wetland Degradation And Lower Precipitation, EGU General Assembly 2025, Vienna, Austria, 27 Apr–2 May 2025, EGU25-18657, https://doi.org/10.5194/egusphere-egu25-18657, 2025.

EGU25-19519 | Posters on site | BG1.4

The State of Wildfires report: an annual review of fire activity and extreme events  

Douglas I Kelley, Matthew W Jones, Chantelle Burton, and Francesca Di Giuseppe and the State of Wildfires Report Co-authors

The 2023/24 fire season was marked by record-breaking burnt areas and carbon emissions in Canada, deadly blazes in Hawaii, extreme drought and smoke in the Amazon, burning in the Pantanal wetlands, and Europe's largest wildfire on record.  These events exemplify extreme wildfires' growing prevalence and far-reaching impacts on societies, ecosystems, and global climate systems. Each year, the emergence of such events raises urgent questions from policymakers, fire management agencies, and the public:

  •   How much was climate to blame?
  •   Was it caused by humans?
  •   Who is affected?
  •   How does this year compare to previous years?
  •   Will we see more fires like this in the future?
  •   What can we do to prevent or prepare for them?

The inaugural State of Wildfires report addresses these questions by systematically analysing extreme fire events from the March 2023–February 2024 fire season. It links anomalies in burned area and emissions to drivers such as high fire weather and fuel abundance. Attribution analyses revealed that climate change amplified burned area by up to 40%, 18%, and 50% in Canada, Greece, and Amazonia, respectively. The report also projects an increasing risk of future extreme fires, even under ambitious emissions pathways aimed at limiting warming to 1.5–2°C. However, impacts at these emission levels are still projected to be less severe than those in higher warming scenarios. In Canada, for example, projections suggest that fires like those of 2023 could become 6–11 times more frequent by the end of the century under medium–high emissions scenarios.

Here, we present the main insights from the report, celebrate advances in fire science that are helping to meet the challenge of extreme fires, and invite feedback from the scientific community. We seek perspectives on missing analyses, overlooked impacts, and underexplored regions to enhance future reports.

How to cite: Kelley, D. I., Jones, M. W., Burton, C., and Di Giuseppe, F. and the State of Wildfires Report Co-authors: The State of Wildfires report: an annual review of fire activity and extreme events , EGU General Assembly 2025, Vienna, Austria, 27 Apr–2 May 2025, EGU25-19519, https://doi.org/10.5194/egusphere-egu25-19519, 2025.

EGU25-19925 | Posters on site | BG1.4

Assessing the influence of climate on wildfire impacts across Mediterranean Europe 

Luiz Galizia, Christelle Castet, and Marcos Rodrigues

Wildfires occurring under warmer and drier conditions are likely to be destructive to infrastructure causing economic losses and affecting population. While climate, represented through fire weather, has been shown to be the dominant driver of wildfires there is still a lack of analyses exploring to what extent climate influences wildfire impacts. Here we examine the statistical relationship between fire weather conditions and wildfire impacts at an interannual scale across Mediterranean Europe. To do so, we combined Fire Weather Index (FWI) with burned area from the European Forest Fire Information System, as well as wildfire economic losses and affected population extracted from the EM-DAT disaster database over the period 2000–2023. Overall, most of the wildfire impacts were dominated by a few iconic events that have occurred during extreme fire seasons. Nearly 90% of the affected population and economic losses occurred when the FWI aggregated over the fire season exceeded 23 and 30 respectively. Additionally, the analysis highlighted the FWI as the main driver of burned area, showing strong positive correlations in all analyzed countries. FWI also showed moderate positive correlations with wildfire economic losses and population affected, yet these relationships varied by country. Countries more severely impacted by wildfires, such as Portugal, Spain, and Greece, exhibited stronger correlations than those less affected. These results emphasized the importance of climate variability in enabling wildfire activity and influencing impacts across Mediterranean countries. 

How to cite: Galizia, L., Castet, C., and Rodrigues, M.: Assessing the influence of climate on wildfire impacts across Mediterranean Europe, EGU General Assembly 2025, Vienna, Austria, 27 Apr–2 May 2025, EGU25-19925, https://doi.org/10.5194/egusphere-egu25-19925, 2025.

EGU25-2354 | ECS | Posters on site | CL3.2.9

Discrepancies in lacustrine bacterial lipid temperature reconstructions explained by microbial ecology 

Haichao Xie, Jie Liang, Juzhi Hou, and Ulrike Herzschuh

Bacterial lipid branched glycerol dialkyl glycerol tetraethers (brGDGTs) are a valuable tool for reconstructing past temperatures. However, a gap remains regarding the influence of bacterial communities on brGDGT profiles. Here, we identified two distinct patterns of brGDGTs from the surface sediments of 38 Tibetan Plateau lakes using an unsupervised clustering technique. Further investigation revealed that salinity and pH significantly change bacterial community composition, affecting brGDGT profiles and causing brGDGT-based temperatures to be overestimated by up to 2.7 ± 0.7 °C in haloalkaline environments. We subsequently used the trained clustering model to examine the patterns of bacterial assemblages in the global lacustrine brGDGT dataset, confirming the global applicability of our approach. We finally applied our approach to Holocene brGDGT records from the Tibetan Plateau, showing that shifts in bacterial clusters amplified temperature variations over timescales. Our findings demonstrate that microbial ecology can robustly diagnose and constrain site-specific discrepancies in temperature reconstruction.

How to cite: Xie, H., Liang, J., Hou, J., and Herzschuh, U.: Discrepancies in lacustrine bacterial lipid temperature reconstructions explained by microbial ecology, EGU General Assembly 2025, Vienna, Austria, 27 Apr–2 May 2025, EGU25-2354, https://doi.org/10.5194/egusphere-egu25-2354, 2025.

Lakes are widespread on the Tibetan Plateau, which play a crucial role in reconstructing past climate, environment, ecology, and human activities on the plateau. In the past decades, hundreds of paleolimnological records, employing various proxy indicators, have been reported, promoting our understanding the mechanism of climate changes. However, interpretations of the some paleolimnological records are conflicting, even for the records from the same lake. In this presentation, I will discuss several fundamental scientific issues in the study of paleolimnology and paleoclimatology on the Tibetan Plateau, including 1) the thermodynamic classification of plateau lakes, 2) the transition between open and closed states of lakes, 3) the implication of the proxy indicators, and 4) the issue of dating lake sediments. These issues not only affect the interpretation of proxy indicators in lake sediments but also impact the comparison of records from different proxy indicators within the same lake or the same proxy indicators from different lakes.

How to cite: Hou, J.: Fundamental questions in paleolimnology and paleoclimatology on the Tibetan Plateau, EGU General Assembly 2025, Vienna, Austria, 27 Apr–2 May 2025, EGU25-3366, https://doi.org/10.5194/egusphere-egu25-3366, 2025.

EGU25-3914 | ECS | Posters on site | CL3.2.9

Responses of Tibetan antelope population to environment changes during the Holocene 

Zhuo Wang, Qiang Qu, and Juzhi Hou

Tibetan antelope (Chiru, Pantholops hodgsonii), an endemic species of the Tibet Plateau, inhabits the open alpine and desert steppe areas ranging 3250 to 5500 m altitude. In the past decades, the antelope population has been significantly affected by human activities, including massive illegal hunting, followed by strict protection policies and establishments of natural reserves. Various techniques have been devoted to monitor antelope population changes and study their habitat, but these are limited to the past several decades and can only provide limited information on past changes in antelope population. We reconstructed antelope population changes during the Holocene using sediment cores at Lake Zonag, one of the most important calving grounds for Tibetan antelope. We measured the content of 24-ethyl-coprostanol and 24-ethyl-epicoprostanol, signature fecal sterols of herbivores, as a proxy for the antelope population. The fecal sterols captured the sudden decrease in antelope population due to illegal hunting in 1980s, as well as the recent recovery because of protection, giving us confidence in using fecal sterol as the proxy for population changes of the Tibetan antelope. The results show the antelope population in Lake Zonag region fluctuated significantly during the past 9000 years, with clearly low population at 5.1-4.5 and 4.1-3.7 ka. Fluctuation of antelope in the Lake Zonag catchment show strong response to environment changes during the Holocene. When the environment was relatively humid with dense vegetation cover, the antelope population increased, and vice versa. Over the past 400 years, the changes in the population size of Tibetan antelope have been affected by human activities.

Our study was the first to identify the signature fecal sterols to represent the population changes of the Tibetan antelope. Understanding how the population size of Tibetan antelopes responded to environment changes in the past would provide scientific basis for long-term conservation policies for Tibetan antelopes.

How to cite: Wang, Z., Qu, Q., and Hou, J.: Responses of Tibetan antelope population to environment changes during the Holocene, EGU General Assembly 2025, Vienna, Austria, 27 Apr–2 May 2025, EGU25-3914, https://doi.org/10.5194/egusphere-egu25-3914, 2025.

Investigating the spatiotemporal variations in hydroclimate is essential for addressing the challenges posed by future climate change. The Asian drylands, encompassing Arid Central Asia (ACA) and West Asia (WA), are regions where water vapor transport is predominantly governed by the westerlies. These regions have exhibited a dipole pattern in precipitation variations over recent decades and throughout the Holocene. However, whether this pattern persisted during the past millennium remains uncertain. Our study reveals that both proxy records and PMIP4 models consistently identify a dipole precipitation pattern between ACA and WA on centennial scales over the past millennium. This pattern is attributed to inconsistent seasonal precipitation changes. During the Medieval Warm Period, ACA experienced decreased winter-spring precipitation, while WA observed increased summer rainfall. This trend reversed during the Little Ice Age. The seasonal shifts in precipitation are likely driven by the migration of the westerlies, influenced by internal variability within the Earth's system, particularly the North Atlantic Oscillation (NAO). These findings provide valuable insights for policymakers aiming to address water management challenges in Asia's drylands, offering a foundation for strategies to mitigate and adapt to the impacts of future climate change.

How to cite: Ma, S., Ding, G., and Chen, S.: Characteristics and physical mechanisms of the dipole precipitation variations in the Asian drylands over the past millennium based on proxy-model comparisons, EGU General Assembly 2025, Vienna, Austria, 27 Apr–2 May 2025, EGU25-6095, https://doi.org/10.5194/egusphere-egu25-6095, 2025.

EGU25-7870 | ECS | Orals | CL3.2.9

Near and Mid-Term Climate Change in Central Asia in the 21st Century from High-Resolution WRF Simulations 

Jiewei Zhou, Jianbin Huang, Yao Yao, Wen Shi, Huihui Yuan, Chen Qiao, and Yong Luo

The Central Asian region, characterized by its arid climate and fragile ecological environment, is highly sensitive to climate change, necessitating focused research on its future climate. This study utilizes two global climate model (MPI-ESM1.2-HR and BCC-CSM2-MR) simulations from the sixth Coupled Model Intercomparison Project (CMIP6) to drive the regional climate model WRF for high-resolution (25 km) simulations within the Coordinated Regional Downscaling Experiment (CORDEX) program. These simulations target future climate changes under both low and high emission scenarios, SSP1-2.6 and SSP5-8.5. The historical simulation (1995-2014) was evaluated, indicating that the WRF models can reproduce better spatial and temporal patterns of temperature and precipitation in Central Asia compared to global models, with reduced mean biases and more detailed topography insights especially in mountainous regions. Future climate projections (2021-2060) indicate a significant temperature increase across Central Asia, correlating with rising greenhouse gas concentrations. The most pronounced warming is expected in north-central Kazakhstan. Under SSP1-2.6, the average annual temperature rise for 2041-2060 is projected at 1.37°C, and under SSP5-8.5, it could reach 2.36°C. Winter warming is most rapid, especially in the western regions, while the eastern high-altitude areas experience less warming. In contrast, summer temperatures show an opposite trend. The study also predicts an overall increase in average annual precipitation, with the most significant rise in the southwestern region and a decrease in the northeast. Both SSP1-2.6 and SSP5-8.5 scenarios project a precipitation increase of about 0.50 mm/month (3-4%) during 2041-2060. Precipitation is expected to rise in winter and spring, but decrease in summer, with winter seeing an increase across Central Asia and summer showing a varied pattern of increase in the west and decrease in the east.

How to cite: Zhou, J., Huang, J., Yao, Y., Shi, W., Yuan, H., Qiao, C., and Luo, Y.: Near and Mid-Term Climate Change in Central Asia in the 21st Century from High-Resolution WRF Simulations, EGU General Assembly 2025, Vienna, Austria, 27 Apr–2 May 2025, EGU25-7870, https://doi.org/10.5194/egusphere-egu25-7870, 2025.

Flooding and warfare were important challenges to the development of human societies in the Late Holocene, especially in flood-prone areas, including the Bailongjiang Basin in the northeastern Tibetan Plateau. It is not clear how ancient societies in this region fought against flooding and war, and its study is an important way to explore the patterns of human-environment interactions. In response to these questions, a detailed survey of ancient cities in the upper Bailongjiang River during the historical period was carried out, and 42 dating samples were collected from six ancient cities and one site. The results showed that these ancient cities were mainly built during the Tang and Qing dynasties. Among them, a unique three-dimensional defence system was discovered for the first time in the investigation and research in the area of the ancient city of Diezhou, including city walls and water retaining walls from the Sui and Tang dynasties, as well as enclosure walls and beacon flints from the Qing dynasty. A combination of geomorphological surveys, historical documents, and paleoclimatic data suggests that ancient humans constructed the three-dimensional defence system in this area mainly in response to high-frequency flooding triggered by climate change, as well as wars between the Tang and Tubo, and between the Qing and the Heshuit Khanates. This study provides a typical example of human-water-war interactions during the historical period in the high mountain valley area of the northeastern Tibetan Plateau, which is of great academic value for the in-depth understanding of the process and mechanism of the evolution of human-earth relations in the high mountain valley area.

How to cite: Zhang, S.: Human struggled against floods and wars in mountain-gorge of NE Tibetan Plateau: unique city-wall system evidence, EGU General Assembly 2025, Vienna, Austria, 27 Apr–2 May 2025, EGU25-9695, https://doi.org/10.5194/egusphere-egu25-9695, 2025.

EGU25-11465 | ECS | Orals | CL3.2.9

Hypothesis of yak domestication based on archaeological and ancient DNA evidence 

Shungang Chen, Ningbo Chen, Yu Gao, Xiaoyan Yang, and Fahu Chen

Yak (Bos grunniens) has a strong adaptability to the alpine ecological environment, and is also known as the "boat of the plateau" and "omnipotent livestock". The domestication of yaks has provided an important survival basis for human beings from seasonal migration to permanent nomadic habitation on the Qinghai-Tibetan Plateau (QTP). However, there are still many controversies and unresolved issues regarding the domestication history of yaks, especially the time, location, and pathway of yak domestication. This study conducted Carbon-14 dating and ancient DNA analysis on 37 cattle (Bos taurus) and yak bone remains excavated from 13 archaeological sites on the QTP. The ancient genomes dating from 40 to 0.14 thousand years ago (Kya) was obtained, and population genetic analysis was conducted based on species identification. The results show that cattle have been introduced to the QTP before 4 Kya, and the hybridization between cattle and wild yaks started before 3.4 Kya. The domestication of yaks occurred after cattle were introduced to the QTP. All ancient domesticated yaks discovered so far are no earlier than 2.6 Kya. In the nearly 1 thousand years from the beginning of hybridization between cattle and wild yaks until the emergence of domesticated yaks, genes related to docility have been introgressed into yak population from cattle population by interspecific hybridization, promoting prehistoric humans successfully domesticate wild yaks. Unlike the three known animal domestication pathways (commensal pathway, prey pathway and directed pathway), yak domestication is more in line with the hybridization pathway. No earlier than 3 Kya, wild yaks were successfully domesticated and cattle gradually adapted to the alpine and hypoxic environment, leading to the formation of yak-cattle husbandry on the QTP. This study is the first case of ancient DNA research focused on yaks, demonstrating that prehistoric Trans-Eurasia exchange not only promoted the spread of livestock, but also facilitated the domestication of related species, changed the livelihood patterns of humans on the QTP, and thus facilitated permanent human occupation of the QTP.

Keywords: yak; domestication; archaeology; genetics; ancient DNA

How to cite: Chen, S., Chen, N., Gao, Y., Yang, X., and Chen, F.: Hypothesis of yak domestication based on archaeological and ancient DNA evidence, EGU General Assembly 2025, Vienna, Austria, 27 Apr–2 May 2025, EGU25-11465, https://doi.org/10.5194/egusphere-egu25-11465, 2025.

EGU25-12026 | ECS | Posters on site | CL3.2.9

Ineffective actions on water scarcity exacerbate the water crisis in West Asia 

Yanan Su, Shengqian Chen, Min Feng, and Fahu Chen

Climate change and water availability in arid West Asia are critical to understanding human adaptation to long-term environmental changes. While droughts are well-documented, water availability remains insufficiently quantified. Using high-resolution satellite imagery and deep learning, we examined water bodies across West Asia, revealing long-term changes and their drivers from 1990 to 2020. By 2020, 12,725 water bodies covering 32,860 km2 were identified, with 94% being previously unreported artificial bodies. Despite a 42% increase in artificial water area and the addition of 3,400 new reservoirs since 1990, water resources in West Asia have declined by 140 km2 annually, primarily due to the shrinking of natural lakes like Lake Urmia, driven by the effects of reservoirs. Our findings indicate that ineffective water management, especially overreliance on infrastructure, has aggravated water imbalances, leading to severe shortages. With predicted droughts and rising demand, Lake Urmia may dry up by 2090, and the regional water crisis is projected to worsen, underscoring the urgent need for effective water resource management.

How to cite: Su, Y., Chen, S., Feng, M., and Chen, F.: Ineffective actions on water scarcity exacerbate the water crisis in West Asia, EGU General Assembly 2025, Vienna, Austria, 27 Apr–2 May 2025, EGU25-12026, https://doi.org/10.5194/egusphere-egu25-12026, 2025.

Atmospheric dust has important influences on atmospheric circulation, global biogeochemical cycles, and hydrological processes. However, understanding the history of dust storms on the Tibetan Plateau (TP) remains challenging due to the lack of suitable geological archives. Lakes in dust-influenced regions act as dust repositories, offering the opportunity to trace the history of dust emissions and eolian activity. Here we present a synthesis of eolian activity on the eastern TP covering the past 15,000 years. It is based on records of grain size and n-alkanes from a sediment core from Gahai lake, which we combined with published pollen and other records from the same core, to reconstruct variations in surface runoff and eolian activity in this region. Our results indicate a correlation between vegetation conditions and eolian activity during different periods. Increased eolian activity occurred during the transition from the last deglaciation to the early Holocene, due to suboptimal vegetation conditions. Between 7.5 and 3.5 cal ka BP (ka), higher moisture levels resulted in the dominance of arboreal vegetation, which suppressed eolian activity. However, after 3.5 ka a sustained intensification of eolian activity occurred in the Gahai area, which was linked to decreasing vegetation cover, reduced regional humidity, and growing human impacts, especially in the eastern plateau, in southern Gansu. In recent decades, human interventions have suppressed eolian activity. Additionally, a ~1435-year cyclicity in our record, and other regional records, suggests a link between increased eolian activity on the eastern TP and ice-rafting events in the North Atlantic. Generally, Holocene eolian dynamics were primarily influenced by the regional vegetation and climatic conditions which were controlled by the atmospheric circulation. However, in the late Holocene, climatic shifts and human influences had a synergistic effect which intensified the eolian activity, highlighting the important role of humans on recent dust dynamics in this region.

How to cite: Hou, X.: Lake sediment record of eolian activity on the eastern Tibetan Plateau since 15 cal ka BP, EGU General Assembly 2025, Vienna, Austria, 27 Apr–2 May 2025, EGU25-14084, https://doi.org/10.5194/egusphere-egu25-14084, 2025.

EGU25-14089 | ECS | Orals | CL3.2.9

The Hydroclimate Change on the Northeast Tibetan Plateau Recorded by Stalagmite from an Open Cave 

Jin Zhang, Huiru Tang, and Liangcheng Tan

The semi-arid region on the Northeast Tibetan Plateau is characterized by insufficient water resources, sparse vegetation coverage, and fragile ecology, making it highly vulnerable to hydroclimate change. However, the long-term hydroclimate changes in this region and the correlation with ecology change are unclear. Here, we present a highly resolved multi-proxy stalagmite record from an open cave (Yanwu Cave), Northeast Tibetan Plateau, for the past ~1300 years. The antiphased relationship between stalagmite isotope (δ18O and δ13C) records with trace elements (Sr/Ca, Mg/Ca, and Ba/Ca) from Yanwu Cave and regional stalagmite δ18O records indicate a significant influence of kinetic isotope effects on δ18O and δ13C. Utilizing the trace elements records, we reconstruct long-term hydroclimate change on the Northeast Tibetan Plateau. Our records suggest that the increased amplitude of decadal-scale hydroclimate variability during the Little Ice Age (LIA) increased the frequency of extreme climate events. Natural hydroclimatic conditions rather than human activity could have regulated regional vegetation composition change at the transition from Medieval Warm Period to LIA, although human activity has significantly enhanced over the past millennium.

How to cite: Zhang, J., Tang, H., and Tan, L.: The Hydroclimate Change on the Northeast Tibetan Plateau Recorded by Stalagmite from an Open Cave, EGU General Assembly 2025, Vienna, Austria, 27 Apr–2 May 2025, EGU25-14089, https://doi.org/10.5194/egusphere-egu25-14089, 2025.

Lakes on the Tibetan Plateau (TP) play a major role in the regional hydrological cycle and underpin vital ecosystem services. However, the long-term lake evolution and underlying mechanisms, especially on the exorheic southern TP, remain unclear. Here, we reconstructed the lake level variations of Mabu Co and Gala Co on the southern TP through detailed paleo-shoreline dating using post-infrared infrared stimulated luminescence (pIRIR) signals of K-feldspar single grains, and explored the driving forcings based on a comparison of paleoclimate records and geomorphological analysis. The results show that a unified paleolake at Mabu Co and Gala Co at a level ~20 m above the modern level (a.m.l.) of Mabu Co developed during the late MIS 3 (35.9±1.9-29.1±1.4 ka) in response to increased glacial meltwater and Indian summer monsoon (ISM) rainfall. Under intensive glacier melting, the paleolake reached its maximum level (~29 m a.m.l.) and area (190 km2, ~22 times larger than the modern areas of Mabu Co and Gala Co) during the last deglacial (16.8±1.0-13.6±0.7 ka) and began to outflow, which triggered incision and lowering of the spill-point. The lake level showed an overall decreasing trend since the last deglacial largely influenced by the lowering of the spill-point. During the last deglacial-early Holocene (12.7±0.6-9.8±0.6 ka), a high-stand lower than that in the previous stage (~24 m a.m.l.) was maintained by the strengthened ISM and glacial meltwater. In the mid-Holocene (8.7±0.9-4.1±0.3 ka), the paleolake experienced two rapid lake level drops in response to the weakening events of the ISM. The exposed shoreline terrace between the two lakes following the lake level drop after ~6 ka provided an ideal living surface for the inhabitants at the Mabu Co site during 4.5-4.0 ka. We found that glacial meltwater and lake spillover processes, apart from the ISM, have exerted great impacts on the hydrological history of Mabu Co and Gala Co. The paleolakes have provided critical resources for humans at the Mabu Co site living in the alpine anoxic environment. Additionally, we suggest that lakes with low spill-points adjacent to exorheic basins on the southern TP should be given more attention regarding flooding hazard risks against increasing precipitation and glacial meltwater in the future.

How to cite: Zhang, S.: Late Quaternary lake level variations of Mabu Co-Gala Co, southern Tibetan Plateau, and the impacts on early inhabitants, EGU General Assembly 2025, Vienna, Austria, 27 Apr–2 May 2025, EGU25-14138, https://doi.org/10.5194/egusphere-egu25-14138, 2025.

EGU25-14241 | Orals | CL3.2.9

Two types of heavy precipitation in the southeastern Tibetan Plateau  

Dianbin Cao, Xuelong Chen, Deliang Chen, Yu Du, Yuhan Luo, Yang Hu, Qiang Zhang, Yaoming Ma, and Fahu Chen

The southeastern Tibetan Plateau (SETP) is the preeminent summer heavy precipitation region within the Tibetan Plateau (TP). However, the large-scale circulation types and dynamics driving summer heavy pre- cipitation in the SETP remain inadequately elucidated. Using the hierarchical clustering method, two dis- tinctive atmospheric circulation patterns associated with heavy precipitation were identified: the Tibetan Plateau vortex type (TPVT, constituting 56.6 % of the events) and the mid-latitude trough type (MLTT, 43.4 %). A comprehensive examination of the two atmospheric circulation patterns reveals a clear nexus between the occurrences of summer heavy precipitation and positive vorticity anomalies, moisture con- vergence, as well as the southeastward displacement of the westerly jet core. Specifically, TPVT events are characterized by the eastward and dry-to-wet potential vorticity progression processes, while MLTT events are linked to the intrusion of a deep extratropical trough into the SETP. This study advances our understanding of the complex mechanisms governing the summer heavy precipitation in the SETP, shedding light on critical meteorological processes in the region.

How to cite: Cao, D., Chen, X., Chen, D., Du, Y., Luo, Y., Hu, Y., Zhang, Q., Ma, Y., and Chen, F.: Two types of heavy precipitation in the southeastern Tibetan Plateau , EGU General Assembly 2025, Vienna, Austria, 27 Apr–2 May 2025, EGU25-14241, https://doi.org/10.5194/egusphere-egu25-14241, 2025.

EGU25-14436 * | Orals | CL3.2.9 | Highlight

Trans-Eurasia Exchange and Silk Road Civilization Development 

Fahu Chen, Michael Meadows, Jürg Luterbacher, Juzhi Hou, and Likun Ai

The Silk Road (Chinese: 丝绸之路), first popularized by the German geographer Ferdinand von Richthofen in 1877, refers to a network of trade routes that stretched from central China to the Pamir, through central Asia and Arabia to India and Rome. The oasis routes have been active for 4000 years though precursors of the Silk Road date back nearly 5000 years and extended to the northern steppes of Central Eurasia. Meanwhile, the Silk Road played a key role in facilitating exchanges in religions, arts, culture, science and technology between East and West. Early trans-Eurasia exchanges and the historical Silk Road reshaped the development of civilizations in Eurasia.

The Silk Road was an exceptional landmark of continental-scale exchanges throughout human history, spanning thousands of years across the vast landscapes of the Gobi Desert, oases, mountains, basins, forests, and steppes in Eurasia. The mechanisms of early human migrations in the paleolithic periods, agriculture origin and early farming diffusion, and civilization development along the Silk Road have attracted high interest from both natural and social scientists. In 2019, the Association for Trans-Eurasia Exchange and Silk Road Civilization Development (ATES) was established to fill the gaps of ongoing Silk Road Study.

The vision of ATES aims to deepen understanding of the interactions between environmental changes, long-term trans-Eurasia exchanges and Silk Road civilizations, by promoting interdisciplinary research of natural sciences, social sciences, and humanities across Eurasia. The main scientific issues of ATES include: 1) Routes and driving forces of ancient human migrations across Eurasia in the Paleolithic; 2) Agriculture origin and prehistoric trans-Eurasian diffusion of early farming and herding; 3) Mechanisms of establishment, shift and demise of routes and key towns along the ancient Silk Road; 4) Pattern and trajectory of knowledge production and dissemination of scientific and technical knowledge and their impact on the multiethnic societies along the Silk Road; 5) Effects of environmental changes on the development of the Silk Road civilization related to trans-Eurasia exchanges in terms of economy, technology and culture.

As of right now, ATES has involved over 200 scientists from more than 50 research institutes across more than 20 countries. There are six working groups established with distinct objectives in ATES. Through the ATES platform, we hope to develop cooperative research and education centers/laboratories with institutes and scientists from all over the world, as well as co-host activities such as young scientist training, collaborative research, conferences, workshops and exhibitions. Currently, ATES-branded activities include the ATES Silk Road Civilization Forum, the ATES Open Science Conference, the ATES Workshop, and the ATES Lecture, among others.

How to cite: Chen, F., Meadows, M., Luterbacher, J., Hou, J., and Ai, L.: Trans-Eurasia Exchange and Silk Road Civilization Development, EGU General Assembly 2025, Vienna, Austria, 27 Apr–2 May 2025, EGU25-14436, https://doi.org/10.5194/egusphere-egu25-14436, 2025.

EGU25-14480 | Posters on site | CL3.2.9

The Quina techno-complex in southwestern China and implications for human environmental adaptation   

Hao Li, Qijun Ruan, Peiyuan Xiao, Davide Dalpiano, Marco Peresani, and Fahu Chen

The Middle Paleolithic is a hotly debated issue in China, in particular with the intriguing findings in recent years in both northern and southern China. Here we present a new Middle Paleolithic site named the Longtan site located in the Heqing couty, Yunnan Province. The age of Longtan has been dated to ca. 60-50 ka. Lithic assemblage excavated from the site shows distinct technological and morphological features, with the Quina retouch being the most representative feature. Results show that Quina scrapers at the site were mainly made on thick and big-sized flake blanks and the functional edges exhibit scaled and invasive retouching scars. Resharpening flakes have also been identified, suggesting the existence of rejuvenation behavior and the lengthy use-life of Quina scrapers at Longtan. The finding of Quina-type lithic assemblage at the Longtan site provides key evidence for our understanding of the diversity and complexity of the Middle Paleolithic techno-complexes in China and relevant human environmental adaptations in the region.  

How to cite: Li, H., Ruan, Q., Xiao, P., Dalpiano, D., Peresani, M., and Chen, F.: The Quina techno-complex in southwestern China and implications for human environmental adaptation  , EGU General Assembly 2025, Vienna, Austria, 27 Apr–2 May 2025, EGU25-14480, https://doi.org/10.5194/egusphere-egu25-14480, 2025.

EGU25-14508 | Posters on site | CL3.2.9

Tree-Ring Reconstruction of Changes in Surface Vegetation Cover in west Asia since AD 1943 

Yajun Wang, Shengqian Chen, Haichao Xie, Yanan Su, Shuai Ma, and Tingting Xie

Vegetation is sensitive to climate change, and the Normalized Difference Vegetation Index (NDVI) is an important indicator in studies of changes in surface vegetation coverage. However, observed NDVI data only became available in the 1980s, and thus reconstructing long-term changes in NDVI on the Earth's surface has become an important topic in paleoclimate reconstruction. In this study we established a tree-ring width index chronology for Juniperus excelsa in the western Elburz Mountains in west Asia; we then analyzed the correlation between the tree-ring width index and NDVI, and reconstructed the vegetation dynamics in response to climate change in this region since 1943. Our findings show that the tree-ring width index effectively represented the changes in NDVI from April to August. The NDVI changes reconstructed from the tree-ring width index show that fluctuations in the vegetation cover since the 1990s were more pronounced compared to the 1940s–1980s. Notably, periods of low vegetation cover occurred in the early 21st century, while high vegetation cover occurred in the early 2020s. Overall, our study integrates dendrochronology and remote sensing techniques to develop a methodology for the long-term reconstruction of the vegetation dynamics in the study region, and the results contribute to an improved understanding of the vegetation dynamics in west Asia and their response to climate change.

How to cite: Wang, Y., Chen, S., Xie, H., Su, Y., Ma, S., and Xie, T.: Tree-Ring Reconstruction of Changes in Surface Vegetation Cover in west Asia since AD 1943, EGU General Assembly 2025, Vienna, Austria, 27 Apr–2 May 2025, EGU25-14508, https://doi.org/10.5194/egusphere-egu25-14508, 2025.

EGU25-15021 | Posters on site | CL3.2.9

‘‘Mega-sandwich pattern” of interdecadal precipitation variations and itsregional manifestation in the Asian summer precipitation region 

Fahu Chen, Lingxin Huang, Dianbin Cao, Jie Chen, Shengqian Chen, Shuai Ma, and Tianjun Zhou

The Tibetan Plateau (TP) is an important link between the South Asian monsoon region, the East Asian monsoon region, and the drylands of Central Asia. Climate changes within these regions are dominated by both the monsoon and the westerlies with precipitation primarily concentrated in the summer. Although previous research has examined the characteristics of interdecadal precipitation variations in these regions, the interconnectivity among these variations remain underexplored. Here, we summarize the current understanding on precipitation variations, with the aim of elucidating the interconnections among regional interdecadal precipitation variations from the perspective of the Asian summer precipitation region. Recent research has identified a "North-South dipole pattern” of precipitation variations across the TP over the past few decades, characterized by increased precipitation in the northern TP and decreased precipitation in the southern TP. This regional pattern is a manifestation of a broader "Mega-sandwich pattern" of interdecadal precipitation variations in Asian summer precipitation. The "Mega-sandwich pattern" includes the North-South dipole pattern in High Mountain Asia, the "Westerlies-dominated climatic regime" in mid-latitude Asia, and the "South Flood (Drought) and North Drought (Flood)" pattern in the East Asian monsoon region. This pattern not only exists at the present day under rapid global warming, but also that it may have occurred throughout the Holocene. Future research on the "Mega-sandwich pattern" of precipitation changes in the Asian summer monsoon region should focus on larger spatial and longer temporal scales, leveraging extensive paleoclimate records, modern observational data, and high-resolution climate models to deepen our understanding of its characteristics and underlying mechanisms.

How to cite: Chen, F., Huang, L., Cao, D., Chen, J., Chen, S., Ma, S., and Zhou, T.: ‘‘Mega-sandwich pattern” of interdecadal precipitation variations and itsregional manifestation in the Asian summer precipitation region, EGU General Assembly 2025, Vienna, Austria, 27 Apr–2 May 2025, EGU25-15021, https://doi.org/10.5194/egusphere-egu25-15021, 2025.

Traditional GIS-based statistical models are intended to extrapolate patterns of settlements and their interactions with the environment. They contribute significantly to our knowledge of past human–land relationships. Yet, these models are often criticized for their empiricism, lopsided specific factors, and for overlooking the synergy between variables. Though largely untested, machine learning and artificial intelligence methods have the potential to overcome these short-comings comprehensively and objectively. The northeastern Tibetan Plateau (NETP) is character-ized by diverse environments and significant changes to the social system from the Neolithic to Bronze Age. In this study, this area serves as a representative case for assessing the complex re-lationships between settlement locations and geographic environments, taking full advantages of these new models. We have explored a novel modeling case by employing GIS and random forests to consider multiple factors, including terrain, vegetation, soil, climate, hydrology, and land suitability, to construct classification models identifying environmental variation across different cultural periods. The model exhibited strong performance and a high archaeological prediction value. Potential living maps were generated for each cultural stage, revealing distinct environ-mental selection strategies from the Neolithic to Bronze Age. The key environmental parameters of elevation, climate, soil erosion, and cultivated land suitability were calculated with high weights, influencing human environmental decisions synergistically. Furthermore, we conducted a quan-titative analysis of temporal dynamics in climate and subsistence to understand driving mecha-nisms behind environmental strategies. These findings suggest that past human environmental strategies were based on the comprehensive consideration of various factors, coupled with their social economic scenario. Such subsistence-oriented activities supported human beings in over-coming elevation limitation, and thus allowed them to inhabit wider pastoral areas. This study showcases the potential of machine learning in predicting archaeological probabilities and in in-terpreting the environmental influence on settlement patterns.

How to cite: Li, G.: GIS and Machine Learning Models Target Dynamic Settlement Patterns and Their Driving Mechanisms from the Neolithic to Bronze Age in the Northeastern Tibetan Plateau, EGU General Assembly 2025, Vienna, Austria, 27 Apr–2 May 2025, EGU25-15070, https://doi.org/10.5194/egusphere-egu25-15070, 2025.

Pacific Walker Circulation (PWC) is one of the most active components of tropical atmospheric circulation. Current studies have mainly focused on PWC changes over recent decades and the near future, while less effort has been devoted to long-term PWC variability. In this study, we examine PWC variability over the last millennium (LM) based on the Community Earth System Model Last Millennium Ensemble (CESM-LME). The simulated PWC variations show no significant trend but do reveal decadal fluctuations during the LM, which underestimate the strengthened LIA-MCA PWC differences indicated by proxy records. A quantitative estimation of the contributions made to PWC variability from internal variability and external forcing is conducted by using multiple linear regression (MLR) analysis. The Interdecadal Pacific Oscillation (IPO) accounts for approximately 40% of the PWC variability at the decadal time scale. Volcanic forcing is also an important contributor to PWC variability during the LM. The positive IPO-like SST anomalies are associated with a weakened Indo-Pacific SLP gradient. The low-level wind change is characterized by enhanced westerlies in the tropical western Pacific, which is consistent with a weakened PWC. A significant PWC weakening appears during the first post-eruption year and returns to normal conditions thereafter. This east‒west contrast in equatorial Pacific SSTs, occurring in conjunction with strengthened surface westerly winds, has been suggested to be responsible for the change in PWC strength following large volcanic eruptions.

How to cite: Man, W., Wang, S., and Zhou, T.: The relative contributions of internal variability and external forcing to Pacific Walker Circulation over the last millennium, EGU General Assembly 2025, Vienna, Austria, 27 Apr–2 May 2025, EGU25-16956, https://doi.org/10.5194/egusphere-egu25-16956, 2025.

EGU25-17473 | ECS | Posters on site | CL3.2.9

Ancient DNA of millets shed new lights for its spread in northern China and Tibetian plautue 

Zihao Huang, Xiaolan Sun, and Yucheng Wang

Ancient DNA (aDNA) analysis offers valuable insights into the domestication and spread of foxtail millet (Setaria italica) across northern China and the Tibetan Plateau. This study leverages advanced genomic techniques to reconstruct the evolutionary history and adaptation of this crucial crop.
To overcome the limitations of ancient environmental DNA (aeDNA) in paleoecology and evolutionary studies, we developed eProbe, a flexible toolkit for designing, assessing, and validating hybridization capture probes. Benchmarking a foxtail millet probe set generated by eProbe demonstrated a 455-fold increase in target DNA recovery and high genome coverage, enabling detailed population and evolutionary genetic analyses.
Using these custom-designed probes, we enriched foxtail millet aDNA from archaeological and lake sediment samples across the Tibetan Plateau and northern China. This approach provides unprecedented insights into the spread and adaptation of foxtail millet as it ascended the plateau and underwent domestication. Combined with data from ancient seed enrichment, this dual analysis offers a comprehensive understanding of foxtail millet's evolutionary history and its role in high-altitude agricultural adaptation.
By integrating data from both ancient seed enrichment and environmental samples, this study offers critical insights into the complex processes of foxtail millet domestication and its impact on ancient agricultural systems in East Asia. Furthermore, these findings provide valuable context for understanding how ancient trade networks, such as the Silk Road, may have facilitated the exchange and adaptation of staple crops, influencing agricultural development and cultural interactions across Eurasia.

How to cite: Huang, Z., Sun, X., and Wang, Y.: Ancient DNA of millets shed new lights for its spread in northern China and Tibetian plautue, EGU General Assembly 2025, Vienna, Austria, 27 Apr–2 May 2025, EGU25-17473, https://doi.org/10.5194/egusphere-egu25-17473, 2025.

EGU25-17697 | ECS | Orals | CL3.2.9

Evolution of alpine biodiversity across various altitude gradients in the southeastern Tibetan Plateau over the past 3000 years, as revealed by sedaDNA in lakes 

Haoran Dong, Yucheng Wang, Jifeng Zhang, Xiaoping Feng, Shuai Shao, Duo Wu, and Juzhi Hou

Loss of alpine biodiversity under global warming poses a serious threat to biodiversity conservation and ecosystem services, yet few studies have addressed the discrepancies in alpine biodiversity across multiple altitude gradients over the millennia timescale. Here, our study selected three sites (Buqun Lake, Gongka Lake, and Shusong Co) at varying altitudes in the southeastern Tibet Plateau to reconstruct the evolution of vegetation communities during ~3500-0 cal BP using environmental metagenomics in lake sediment. The results suggest: 1) the biodiversity index increased rapidly at low altitude (~1500 m a.s.l) but decreased slowly at median altitude (3500 m a.s.l) and high altitude (4400 m a.s.l) during ~3500-2000 cal BP; 2) the biodiversity index at all three sites remained stable between 0.7 and 0.9 with slight fluctuations during ~2000-0 cal BP; 3) the biodiversity index at low altitude became more similar to those at median and high altitudes over the past millennium, despite differing community compositions among the sites at the three altitude gradients. Considering climate change and internal community interactions, our study primarily interprets that continuous regional warming during ~3500-2000 cal BP contributed to an increase in woody taxa with wide ecological niches (e.g., Salix, Populus, and Quercus) across multiple altitude gradients, further leading to a loss of diversity in alpine shrub-grassland. Meanwhile, these woody taxa with wide ecological niches were able to help resist further impacts from climate change after 2000 cal BP. Our study provides a new perspective on how internal community interactions can influence alpine biodiversity from a millennia-scale environmental metagenomics viewpoint.

How to cite: Dong, H., Wang, Y., Zhang, J., Feng, X., Shao, S., Wu, D., and Hou, J.: Evolution of alpine biodiversity across various altitude gradients in the southeastern Tibetan Plateau over the past 3000 years, as revealed by sedaDNA in lakes, EGU General Assembly 2025, Vienna, Austria, 27 Apr–2 May 2025, EGU25-17697, https://doi.org/10.5194/egusphere-egu25-17697, 2025.

Sedimentary ancient DNA (sedaDNA) extracted from sediment samples at the high-altitude Marbuco site (4400 meters above sea level) provides critical insights into human-environment interactions. With increasing climate impacts on high-altitude human activities, the Marbuco site offers valuable information on early subsistence strategies, species utilization, pastoralism, trade practices, and responses to climate change. The sedaDNA analysis revealed genetic signatures from various species, including those closely linked to pastoralism, such as goat (Capra), sheep (Ovis), and cattle (Bos), with strong signals indicating the importance of these animals in the site’s pastoral activities. Additionally, DNA from aquatic species, including cormorant (Phalacrocorax), golden-line carp (Sinocyclocheilus), and Tibetan loach (Triplophysa), was also prevalent, corresponding to numerous bone tools and fish remains, suggesting the site's residents actively utilized aquatic resources. Beyond domesticates and aquatic species, the sediment also contained abundant DNA from wild animals, highlighting the diverse resource use at the site. Common wild species included the Mongolian gerbil (Meriones), Tibetan gazelle (Procapra), wild rabbit (Lepus), and eagle (Aquila). The genetic signals from these species suggest that ancient residents likely relied on hunting and foraging for these wild animals, which may have been used for food or other necessities. The presence of the Mongolian gerbil and Tibetan gazelle further suggests hunting activities in the high-altitude environment, as well as the role these wild species played in the subsistence strategies of the settled population. Crop DNA, particularly from wheat (Triticum) and barley (Hordeum), was also detected, providing direct evidence of trade activities at Marbuco. The presence of crop DNA supports the hypothesis of early trade practices, possibly involving exchanges with Southeast Asia.

This study underscores the potential of constructing a comprehensive sedaDNA database to provide higher-resolution insights into the species utilized by the ancient residents of Marbuco. By analyzing the DNA signatures of different species, the study highlights the role of sedaDNA in understanding how climate change influenced subsistence strategies, particularly in extreme high-altitude environments. These findings contribute valuable evidence for understanding the diverse livelihoods, pastoral activities, wild species utilization, and adaptation strategies of high-altitude settled populations.

How to cite: Cai, Y., Yang, X., Chen, F., Gao, Y., and Wang, Y.: Sedimentary Ancient DNA Reveals Further Evidence of Early Settlement Strategies, Pastoralism, and Trade Practices of High-Altitude Populations at the Mabu Co Site on the Tibetan Plateau, EGU General Assembly 2025, Vienna, Austria, 27 Apr–2 May 2025, EGU25-20018, https://doi.org/10.5194/egusphere-egu25-20018, 2025.

EGU25-6169 | ECS | Orals | NH11.4

Importance of exposure data quality versus uncertainty in vulnerability and hazard for catastrophe modelling 

Georgios Sarailidis, Francesca Pianosi, and Kirsty Styles

Catastrophe (cat) models are widely used to combine information on the probability distribution of hazard intensity, exposure location, and exposure vulnerability to quantify risk, usually expressed in terms of financial loss. While substantial attention has been paid to improving hazard and vulnerability components (including incorporating climate change), exposure data often lags in terms of quality and detail and may vary widely in granularity and reliability. For instance, reinsurers frequently receive aggregated portfolios from insurers, which may lead to loss of critical information about location-specific risks. This lack of detail undermines the precision of loss estimates, even if hazard and vulnerability components are highly refined. This raises an important question: how influential is the level of detail exposure information on risk estimates with respect to uncertainties in vulnerability and climate change model?

In this presentation we will answer this question via a global sensitivity analysis (GSA) of the JBA flood cat model. GSA is a methodology to systematically investigate the propagation of input uncertainties through mathematical models and quantify the relative importance of those uncertainties on the variability of model outputs. Differently from local sensitivity analyses, in GSA all input uncertainties are varied simultaneously within their plausible variability ranges, instead of being varied one at the time from a baseline. This enables us to capture interaction effects between uncertain inputs and ensure that sensitivity results are not conditional on the chosen baseline. In our application, the three input uncertainties are hazard (including climate change), vulnerability, and exposure data and we quantify their relative influence on financial loss estimates.

Overall, the analysis and the results will highlight how hazard, vulnerability and exposure data quality impact loss estimates guiding cat model developers to prioritize their efforts on model improvement and reinsurers to leverage better quality exposure data.

How to cite: Sarailidis, G., Pianosi, F., and Styles, K.: Importance of exposure data quality versus uncertainty in vulnerability and hazard for catastrophe modelling, EGU General Assembly 2025, Vienna, Austria, 27 Apr–2 May 2025, EGU25-6169, https://doi.org/10.5194/egusphere-egu25-6169, 2025.

EGU25-6304 | ECS | Posters on site | NH11.4

Using an ensemble of flood catastrophe models to explore the interplay of loss variability and the catastrophe model calibration process 

Conor Lamb, Malcolm Haylock, Oliver Wing, and Olivia Sloan

Catastrophe (cat) models are tools, typically used in the (re)insurance industry, that evaluate the risks to a given portfolio by modelling the impact of thousands of years of synthetic hazard events. Of particular interest to users is an evaluation of the low probability (tail) risks. This includes asking questions such as, “what is the worst loss event that will be exceeded, on average, every 200 years?” 

An assessment of tail risks is inherently uncertain. This is compounded by a large number of uncertain or free parameters throughout the modelling chain which may be set via expert (subjective) judgement or via a process of calibration. The calibration process would take a given portfolio with known historical losses and adjust some of the free parameters to match the historical losses. This process may be reframed as creating a structured ensemble of catastrophe models with a range of each of the free or uncertain parameters. The process would then compare the modelled losses from each of the ensemble members to the known historical record and select the model that best represents the historical losses. 

A major limitation of the ensemble approach to catastrophe model calibration is the short historical record from which to select the most representative model. This work uses a flood catastrophe model ensemble to explore the calibration process by creating a short synthetic loss record from a single ensemble member and examining the downstream effects of using this loss record for model selection. 

How to cite: Lamb, C., Haylock, M., Wing, O., and Sloan, O.: Using an ensemble of flood catastrophe models to explore the interplay of loss variability and the catastrophe model calibration process, EGU General Assembly 2025, Vienna, Austria, 27 Apr–2 May 2025, EGU25-6304, https://doi.org/10.5194/egusphere-egu25-6304, 2025.

EGU25-7007 | Orals | NH11.4 | Highlight

Insured Losses from European Natural Catastrophes: Is there a trend over time? 

Charlotte Milner and Kelsey Mulder

Diagnosing the drivers of changing insured losses year on year is an important component of developing a sustainable insurance portfolio. The common assumption is that losses for most perils are increasing year on year. However, there are many factors that could drive the change in losses: economic versus insured losses, impacts of inflation, changes in societal wealth over time, movement toward riskier property locations as well as potential changes in the frequency and severity of European wind and flood events. This presentation will quantify each of the above factors to determine the drivers of changes in insured losses over time.

How to cite: Milner, C. and Mulder, K.: Insured Losses from European Natural Catastrophes: Is there a trend over time?, EGU General Assembly 2025, Vienna, Austria, 27 Apr–2 May 2025, EGU25-7007, https://doi.org/10.5194/egusphere-egu25-7007, 2025.

EGU25-7030 | Posters on site | NH11.4

Disaster Risk Reduction through innovative insurance solutions  

Francesco Lo Conti, Glauco Gallotti, Antonio Tirri, Antonio Santoro, Guido Rianna, Valentina Bacciu, and Michele Calvello

The HuT (The Human-Tech Nexus) project aims at finding effective strategies to manage the risks associated with extreme climate events by means of specific demonstrators over the European territory in which different Disaster Risk Reduction strategies are prototyped and tested. In this context, we show here two distinct innovative insurance prototypes to cope with risks associated with wildfires and landslides over two peculiar areas in Sardinia and Campania regions (Italy). While the hazard posed by the two perils show distinct characteristics and origins, in both cases an insurance product can play a crucial role in the aftermath of the events for communities and private stakeholders. Since the risk assessment is crucial both in terms of financial structure and pricing strategies of a natural hazard insurance product, prototypes are developed through a Nat Cat modeling-based hazard assessment, while the vulnerability and finance considerations are related to the specific characteristics of the area of interest. Eventually, two prototypes are fully developed: “Landslide First Rescue”, a semi-parametric product designed to cope with the immediate economic needs after a landslide events; and “Fire Safe Community”, proposed as a community-based efficient tools to restore the economic losses related to wildfires. The prototypes present specific discounts if the policy holders are willing to implement risk reduction solutions to cope with the specific natural hazard. Results prove that the final premium associated with the products would be affordable and several consultations with interested stakeholders have shown how these kinds of products could also play a role in the development of nature-based solutions over broader regions.

How to cite: Lo Conti, F., Gallotti, G., Tirri, A., Santoro, A., Rianna, G., Bacciu, V., and Calvello, M.: Disaster Risk Reduction through innovative insurance solutions , EGU General Assembly 2025, Vienna, Austria, 27 Apr–2 May 2025, EGU25-7030, https://doi.org/10.5194/egusphere-egu25-7030, 2025.

EGU25-9693 | Posters on site | NH11.4

First results from the implementation of a new fire-spread model in FireHUB platform 

Nikolaos S. Bartsotas, Themistocles Herekakis, Stella Girtsou, and Charalampos Kontoes

To mitigate the growing intensity, duration, and frequency of wildfires in recent years, leveraging the latest forecasting tools and maximizing their capabilities is essential. The FireHUB platform, provided by Beyond Operational Unit of the National Observatory of Athens, has been a reliable decision-support system utilized by numerous decision-makers and public bodies. It is also a continuously evolving platform. The most recent enhancement, implemented under the framework of the MedEWSa project, involves the deployment of a brand-new fire-spread model, offering several comparative advantages that are presented in this study.

A variety of atmospheric and soil parameters (e.g., wind, air/soil temperature and humidity, fuel density) are necessary to accurately predict fire spread information. Many of these factors are influenced by local topographical features, making high-resolution forecasts crucial. Additionally, the ability of a fire-spread model to ingest and process spatiotemporally variable fields is critical. Deploying the ForeFIRE code in combination with finer grid scales from our atmospheric operational forecasts (2-km resolution) demonstrated significant strengths over the existing system. In a series of simulated fire episodes, predictions from the old model and the new model are compared against satellite-derived burnt scar maps to evaluate their performance. The new system is expected to operate in a pseudo-operational mode alongside the existing service during the 2025 fire season and to fully replace the operational fire-spread model by 2026.

How to cite: Bartsotas, N. S., Herekakis, T., Girtsou, S., and Kontoes, C.: First results from the implementation of a new fire-spread model in FireHUB platform, EGU General Assembly 2025, Vienna, Austria, 27 Apr–2 May 2025, EGU25-9693, https://doi.org/10.5194/egusphere-egu25-9693, 2025.

EGU25-9897 | Posters on site | NH11.4

Modelling Freeze Hazard for the North American Winters  

Mubashshir Ali, Farid Ait-Chaalal, Alison Dobbin, and Juergen Grieser

Freeze hazard represents the costliest peril associated with winter weather in the United States (US). This study focuses on the development and validation of a Freeze Index (FI) to model the impact of freeze effectively. The FI integrates both the intensity and duration of freeze events, offering a more accurate modelling of freeze hazards. The updated FI is used to select US-wide events targeting mainly the spatial scale of cold air outbreaks (CAOs). Validation of the hazard footprints is performed against historical data, including the December 2022 CAO and the Texas freeze of 2021. The findings underscore the importance of considering both temperature and duration in freeze hazards to model the damages accurately.

The freeze events obtained above are used to investigate trends in duration and FI, using 2-metre temperature (T2M) from the reanalysis data (1950 – 2024) and compared with the events from the detrended T2M. In the detrended set, no significant trend is observed in the duration of events from 1950 onwards. The average FI obtained from the footprints of each event also did not show a significant trend. The freeze events obtained from the non-detrended T2M also do not show a significant trend in duration and average FI for the events. However, there is a clear decrease in the occurrence of long-duration events with only four events greater than 10 days from 1990 onwards compared to thirteen events in the 1950 – 1985 period.

How to cite: Ali, M., Ait-Chaalal, F., Dobbin, A., and Grieser, J.: Modelling Freeze Hazard for the North American Winters , EGU General Assembly 2025, Vienna, Austria, 27 Apr–2 May 2025, EGU25-9897, https://doi.org/10.5194/egusphere-egu25-9897, 2025.

EGU25-9927 | ECS | Orals | NH11.4

Quantifying the Impact of Recent Climate Trends on North Atlantic Hurricane Activity and Losses 

Benjamin Hohermuth, Juner Liu, Carmen Steinmann, and David N. Bresch

North Atlantic hurricanes rank among the costliest natural catastrophes globally, fuelled by high sea-surface temperatures (SST) in the main development region (MDR) and neutral to positive El Niño Southern Oscillation (ENSO). Record-high SSTs and a predicted shift to positive ENSO ahead of the 2024 season have raised concerns about a “hurricane season from hell”. A key issue is that catastrophe models used to estimate insured loss in practice are calibrated with observations dating far back and may not adequately reflect hurricane risk in today’s climate. Many scientific models focus long term climate change and are thus not fully fit to assess recent climate trends or are not openly accessible for commercial use. Therefore, we built a simplified, physically-based model conditioned on climate variables to quantify changes in hurricane risk from 1980 to today.

The model uses the physical proxies potential intensity (PI) and cyclone genesis index (CGI) calculated from ERA5, as well as hurricane observations. The number of tropical cyclones is modelled as Poisson process with mean equal to the CGI in the MDR. Locations of lifetime maximum intensities (LMI) are drawn from historical observations conditioned on MDR SST and ENSO. LMI is determined based on PI and historical LMI to PI ratios and translated into landfall activity using a statistical method. The model adequately reproduces observed basin and landfall activity when forced with historical climate conditions. By detrending each grid cell using Theil-Sen regression, we project the climate inputs to any specified year to assess climate driven risk changes.

Our results indicate a 17% increase in hurricane landfalls under the 2020 climate compared to historical forcing from 1980 to 2020, with major hurricanes potentially increasing by 22%. Adjusting landfall rates in a vendor catastrophe model accordingly leads to an increase of around 20% in average annual loss. This increase comes mainly from an increased frequency predicted by the CGI, in line with observations. Keeping CGI constant while incorporating PI increases results in fewer lower-category storms, but more categories 4 and 5 storms. Our approach has limitations, notably in translating basin to landfall activity, where we do not simulate the full tracks but rely on historical ratios to determine the landfall intensity. Consequently, shear and steering effects along the track are only implicitly considered, potentially yielding a conservative risk assessment.

Nevertheless, our results highlight a material increase in hurricane risk in the current climate relative to 1980-2020. Given the lag in most catastrophe models, modelled losses may not fully reflect today’s risk. Our methodology can also be used to extrapolate to 2050, to assess climate change impacts, an area of ongoing research.

How to cite: Hohermuth, B., Liu, J., Steinmann, C., and Bresch, D. N.: Quantifying the Impact of Recent Climate Trends on North Atlantic Hurricane Activity and Losses, EGU General Assembly 2025, Vienna, Austria, 27 Apr–2 May 2025, EGU25-9927, https://doi.org/10.5194/egusphere-egu25-9927, 2025.

Due to its intrinsic exposure to the climate, agriculture is one of the economic sectors most directly affected by climate change. Although long-term average precipitation in Switzerland is sufficient to ensure crop production, summer drought is increasingly posing problems to the agricultural sector, as evidenced by the drought events of 2003, 2011, 2015, 2018, 2020, 2022 and again 2023. It is therefore not surprising that insurance companies in Switzerland and other European countries have added coverage to drought-induced crop yield losses to their product portfolio. However, defining viable insurance strategies for the future, from both an agronomic and economic perspective, depends on knowing the potential level of losses.


In this study, we assessed how climate change is likely to impact the yields of summer crops (maize and potatoes) in the four most important cropland regions in in Switzerland. Our analysis is based on the current Swiss climate scenarios (CH2018) targeting the mid-century (2050-2070) and the end of the century (2089-2099). It focuses on a representative concentration pathway (RCP) that does not envisage mitigation measures (RCP 8.5) and considers only one of the most extreme scenarios within the ensemble of available model chains. In this extreme scenario, the summer period presents a drastically negative climatic water balance (‑500 mm by the end of the century), and mean dry spell duration increasing in duration by around 50%. In the Western Plateau, these conditions entail a factor-of-two yield reduction in 60% of the years for maize and in 30% of the years for potatoes. Results further indicate that yield stability is likely to substantially decrease for both crops, as indicated by an increase in the coefficient of variation by a factor of more than two. In general, our findings stress the importance of summer crops as target of future drought-related insurance products.

How to cite: dos Reis Martins, M. and Calanca, P.: Risks from climate change for Swiss cropping systems: assessing the impacts of summer droughts on crop yields and yield stability for informing future insurance strategies, EGU General Assembly 2025, Vienna, Austria, 27 Apr–2 May 2025, EGU25-10036, https://doi.org/10.5194/egusphere-egu25-10036, 2025.

EGU25-10365 | Posters on site | NH11.4

Modeling cyclone risk variations in Australia by ENSO phases. 

Vishal Bongirwar, Lijo Abraham Joseph, Rabi Ranjan Tripathy, Daniel Martin Kalbermatter, Tathagata Roy, and Peipei Yang

Historical cyclone data indicate significant variations in cyclone activity during different phases of the El Niño-Southern Oscillation (ENSO). However, the impact of these variations on cyclone risk and damage has not been thoroughly investigated due to limited historical loss record. Understanding these variations could be crucial for effective risk management.

This study examines the variation in cyclone risk associated with ENSO phases, utilizing the cyclone risk assessment model by Impact Forecasting for Australia. The model employs a stochastic event set of cyclones, representing about forty-two thousand years of basin-wide activity, developed using environmental data from reanalysis and machine learning techniques. Our analysis demonstrate that the stochastic event set accurately reflects the seasonal variation in cyclone activity due to ENSO phases, making it a reliable tool for risk assessment.

To evaluate risk by ENSO phases, we segregated the stochastic event set using the Oceanic Nino Index and estimated wind-driven losses for each phase. The model results shows a significant variation in cyclone risk in Australia during El Niño and La Niña. However, the risk during the Neutral phase is found to be comparable with the long-term average. Annual average losses (AAL) during La Niña increases by 40%, while El Niño phases show a 37% reduction compared to the long-term average. Additionally, a one-in-hundred-year event during La Niña can result in 21% higher losses, whereas losses are 28% lower during El Niño compared to the long-term average.

The modeled loss variations across ENSO phases are consistent with observed changes in cyclone activity in Australia and are supported by the historical loss records.

How to cite: Bongirwar, V., Abraham Joseph, L., Ranjan Tripathy, R., Martin Kalbermatter, D., Roy, T., and Yang, P.: Modeling cyclone risk variations in Australia by ENSO phases., EGU General Assembly 2025, Vienna, Austria, 27 Apr–2 May 2025, EGU25-10365, https://doi.org/10.5194/egusphere-egu25-10365, 2025.

EGU25-10429 | ECS | Posters on site | NH11.4

How drought risk evolution impacts crop weather insurance loss ratio in France? 

Léa Laurent, Albin Ullmann, and Thierry Castel

Climate change has modified climatic hazards features and requires to reconsider agro-climatic risks. Among these, drought is one of the risks with the strongest impact on both crop production and crop weather insurance performance (Brisson et al., 2010). Understanding the effects of climate change on agro-climatic risks at regional to local scale is therefore a major challenge for the agricultural sector, specifically for insurers offering crop weather insurance policies. This work, resulting from a collaboration between an insurer and a research laboratory, focuses on the development of a drought index that well explain the evolution of crop weather insurance loss ratio. As maize is a major crop in the company's portfolio, the study focuses on this crop in particular. The aim of this work is to find the optimal set of parameters that maximizes the correlation between the drought index and the drought-related losses on crop weather insurance.

The Safran-Isba-Modcou reanalysis produced by Météo France provides spatially and temporally continuous climate data over metropolitan France of relevant interest to address this topic (Le Moigne et al., 2020; Soubeyroux et al., 2008). At the regional scale, these data allow us to quantify the evolution of climate hazards related to the water cycle from 1960 to present day. Taking into account the vulnerability of the crop of interest through the use of a simplified two reservoirs water balance model provides an opportunity to assess changes in maize water stress (Jacquart and Choisnel, 1995). The definition of a water stress threshold leads to the development of an annual drought index (Laurent et al., under review). The correlation with the crop weather insurance loss ratio due to drought is tested at various spatial scales (municipality, production basin), for different varieties, different sowing dates and different stress thresholds.

Our results indicate that climate change has affected the frequency and intensity of drought risk on maize crops in France, depending on the French production area studied. The significance of the correlation depends on maize variety, sowing date and hydric stress threshold. It seems that using drought index computed with low stress thresholds and analyzing correlations at large spatial scales gives the best results.

For non-irrigated maize area at production basin scale, our drought index can explain a significant part of drought-related losses in crop weather insurance. The results suggest that such an index may be relevant to improve the actuarial loss model of the insurer. However, further analysis is required in areas where correlations are weaker, particularly in production basins with high irrigation levels.

References:

Brisson et al., 2010. Field Crops Res. 119, 201–212. https://doi.org/10.1016/j.fcr.2010.07.012
Jacquart, Choisnel, 1995. La Météorologie 8ème série, 29–44. https://doi.org/10.4267/2042/51939
Laurent et al., under review. J. Agric. For. Meteorol.
Le Moigne et al., 2020. Geosci. Model Dev. 13, 3925–3946. https://doi.org/10.5194/gmd-13-3925-2020
Soubeyroux et al., 2008. La Météorologie 8, 40. https://doi.org/10.4267/2042/21890

How to cite: Laurent, L., Ullmann, A., and Castel, T.: How drought risk evolution impacts crop weather insurance loss ratio in France?, EGU General Assembly 2025, Vienna, Austria, 27 Apr–2 May 2025, EGU25-10429, https://doi.org/10.5194/egusphere-egu25-10429, 2025.

EGU25-11503 | Posters on site | NH11.4

Analysis of the insurance impacts of storm clusters: a case study with Generali France 

Laura Hasbini, Pascal Yiou, and Laurent Boissier

Clusters of storms are defined as sequences of multiple storms occurring within a short time frame and a limited spatial extent. In this study, storm clusters are identified using a Lagrangian approach combined with an absolute frequency metric within a 96-hour time window, reflecting reinsurance contract specifications for an insurance company. Compound storms are further constrained to affect a common area, determined by the intersection of their footprints. Those footprints can be delineated using various radii of different sizes, depending on the desired granularity for compounding analysis.

The motivation for this definition stems from the potentially severe impacts of such events on the insurance sector. Storms are known to be among the costliest events for Insurance in Europe, with an average annual insured loss of €217 billion [Copernicus, 2023]. The repetition of such intense wind and strong precipitation events is no exception. The successive storms Lothar and Martin in December 1999 remain the costliest events observed in France with an estimated loss of €17 billion [EEA, 2023]. Despite the substantial risks associated with these compound events, few studies have investigated their role in amplifying both the hazard and the vulnerability.

We apply this approach to Generali, an Italian insurance company with approximately 5% market share in France. Using Generali’s historical claims data from 1998 to 2024, we propose a novel methodology linking high-resolution claims to individual storm events. This approach represents a significant advance in understanding loss drivers. Applied to storm clusters, the methodology distinguishes the relative contribution of each storm in a cluster to the total observed loss. By comparing the findings with Generali’s portfolio from 2018 to 2024, we identify key factors contributing to the additional damages caused by storm clusters. These insights are crucial for enhancing risk prevention and adapting current insurance strategies to better address compound storm events.

How to cite: Hasbini, L., Yiou, P., and Boissier, L.: Analysis of the insurance impacts of storm clusters: a case study with Generali France, EGU General Assembly 2025, Vienna, Austria, 27 Apr–2 May 2025, EGU25-11503, https://doi.org/10.5194/egusphere-egu25-11503, 2025.

EGU25-16606 | Orals | NH11.4

Tropical Cyclone Rapid Intensification & it’s Impact for (Re)insurers 

Andrew Robson and Iain Willis

The rapid intensification (RI) of tropical cyclones (whereby the maximum sustained wind increases by 30 kt (15.4 m s−1) or over in a 24-period) has garnered particular attention in recent years, with insurers and risk managers increasingly concerned that warmer ocean basins are fuelling increasingly intense landfalling hurricanes (Kaplan et al 2010).

RI was a notable characteristic of both Hurricanes Helene and Milton during the 2024 North Atlantic Hurricane Season. These two storms caused 78bn and 35bn in economic losses respectively (Gallagher Re), with Helene undergoing explosive RI of 55mph in the 24-hours ahead of landfall, increasing its windspeed upon impacting the Florida coast to 140mph, classifying it as a category 4 storm (Saffir-Simpson scale).

In this study, key trends have been analysed in the pattern of RI of Tropical Cyclones globally over the period 1990-2023, including the response of different ocean basins as well as the critical impact of teleconnection patterns such as the El Nino Southern Oscillation (ENSO) in modulating the geographic dispersion of intensifying cyclones. The study shows that while most Tropical Cyclones (>90%) in recent decades have exhibited some form of RI in their development prior to landfall, there is a clear upward trend in recent years in some ocean basins towards a pattern of so-called ‘Explosive’ Rapid Intensification (whereby a storm intensifies at a rate >50 kt in 24 hours).

With the most extreme Tropical Cyclones undergoing explosive RI and potentially landfalling with greater intensity than in previous decades, this research studies the potential economic and (re)insured loss implications for global risk management. Particular focus is given to the North Atlantic as well as the strong signal of RI occurrence changes under ENSO and over the study period in the North-West and Eastern Pacific basins.

Kaplan, J., DeMaria, M., & Knaff, J. A. (2010). A revised tropical cyclone rapid intensification index for the Atlantic and eastern North Pacific basins. Weather and forecasting25(1), 220-241.

How to cite: Robson, A. and Willis, I.: Tropical Cyclone Rapid Intensification & it’s Impact for (Re)insurers, EGU General Assembly 2025, Vienna, Austria, 27 Apr–2 May 2025, EGU25-16606, https://doi.org/10.5194/egusphere-egu25-16606, 2025.

EGU25-17961 | Posters on site | NH11.4

Designing representative European storm surge scenarios for insurance risk assessment: challenges, results, and limitations 

Anyssa Diouf, Ignatius Ryan Pranantyo, Mathis Joffrain, and Nicolas Bruneau

Storm surge, a coastal flooding phenomenon driven by high-speed winds pushing water onshore poses a significant natural hazard across the globe. In recent decades, Europe has experienced several destructive extratropical cyclones that have severely impacted coastal communities and economies, such as Eunice (2022), David (2018), or Xaver (2013). Storm Xynthia in 2010 was especially notable, with substantial fatalities and material losses in France, highlighting the need for accurate storm surge risk assessment for societies and the (re)insurance industry involved. Yet, current modelling solutions are limited. Main commercial models only provide partial coverage of the risk in Europe, with a primary focus on the United Kingdom. To address this gap, AXA proposes a scenario-based approach to assess storm surge risk across North-Western Europe. Using the SCHISM 2D hydrodynamic model, we reproduced 10 significant historical events notably affecting France, Germany, and the United Kingdom, then perturbed them along three parameters: wind speeds, storm sizes and tide timings, generating 480 scenarios. The study presents the challenges of scenario selection and variability representation. It further provides findings on the modelling results by parameter and country, and on the estimation of the loss potential using a representative North-Western Europe insured market portfolio. Finally, key limitations are discussed, related to unmodelled defences and Digital Elevation Model accuracy. The approach provides valuable insights for AXA’s risk assessment and is a crucial step towards building a robust understanding of our risk.

How to cite: Diouf, A., Pranantyo, I. R., Joffrain, M., and Bruneau, N.: Designing representative European storm surge scenarios for insurance risk assessment: challenges, results, and limitations, EGU General Assembly 2025, Vienna, Austria, 27 Apr–2 May 2025, EGU25-17961, https://doi.org/10.5194/egusphere-egu25-17961, 2025.

EGU25-18013 | Posters on site | NH11.4

Evaluating the relationship between wind and storm surge risk in the Philippines and Hong-Kong, an insurance industry perspective. 

Mathis Joffrain, Ignatius Ryan Pranantyo, and Nicolas Bruneau

Due to intense destructive winds and heavy rainfall associated with storm surges, large waves and flooding, tropical cyclones are one of the most damaging natural catastrophes. They are a major threat to human lives and properties across the globe. When travelling over the ocean and approaching shallow water regions, tropical cyclones generate storm surge and waves that can devastate coastal communities and local economies.

In the recent years, Typhoons Hato (2017) and Mangkhut (2018) produced material surge damages to insurers in the Northwest Pacific basin, and therefore raised the need for accurate natural catastrophe models. Cat models consist of very large catalogues of synthetic but realistic events also called “event sets”. These event sets are consistent with experienced historical data but allow extrapolation beyond what was observed. 

In this study, we focus in winds and surges on the Philippines and Hong Kong regions. Driven by an existing tropical cyclone wind event set, over 10k full-physic simulations of storm surge and waves are computed for each region to estimate the complete distribution of coupled wind and surge losses over an exposure dataset. Due to computationally expensive dynamical simulations of storm surges and waves,  we first rank and select a subset of events (10k) based on an IKE (Integrated Kinetic energy) index. For each of these 10k event, the Semi-implicit Cross-scale Hydroscience Integrated System Model (SCHISM; Zhang & Baptista, 2008, Zhang et al., 2016) is forced by atmospheric winds and pressure fields to derive wave and surge footprints.

Second, we use adjusted Hazus (FEMA) damage functions to convert the water heights and windspeeds from the simulated events into damage factors. These factors are then multiplied to the considered exposure to derive losses. Third, we study the relationship between the wind and the surge modeled losses based on two criteria, (i) the event level correlation between IKE and surge losses, to ensure this index stands as a robust risk representation, and (ii) the event level proportion of surge losses out of the wind losses, which provides a set of reusable inter perils correlation factors.

How to cite: Joffrain, M., Pranantyo, I. R., and Bruneau, N.: Evaluating the relationship between wind and storm surge risk in the Philippines and Hong-Kong, an insurance industry perspective., EGU General Assembly 2025, Vienna, Austria, 27 Apr–2 May 2025, EGU25-18013, https://doi.org/10.5194/egusphere-egu25-18013, 2025.

EGU25-18168 | Posters on site | NH11.4

Development of a climate-driven stochastic event catalogue for Wildfire in Europe 

Frédéric Azemar, Marie Shaylor, Nicolas Bruneau, Thomas Loridan, Daniel Swain, and Mathis Joffrain

Recent years have seen wildfires causing widespread environmental and economic damage as well as numerous fatalities globally. With record breaking yearly burnt areas, longer fire seasons, and more extreme events, wildfire is emerging as a growing concern for populations, governments and the private sector alike. In Europe, destruction and disruption have been historically more prominent in southern countries where key sectors of the economy like tourism, forestry, and agriculture can remain severely affected for years in the aftermath of catastrophic events.  

Over the last 30 years, catastrophe modelling solutions have been crucial in aiding the understanding of the economic impacts of natural risks like wildfire, making them essential tools for the (re)insurance industry for managing their exposure and quantifying potential losses. Such solutions typically involve the development of large scale and physically-based probabilistic models. 

We present here a climate-driven stochastic event catalogue for wildfire in Europe. The model allows us to expand on the limited historical records by generating millions of synthetic event footprints. For this, we first consider how climate conditions drive spatio-temporal patterns of wildfire activity in terms of yearly burnt area (fire activity module). In a second step, events are sampled via an ignition module that leverages machine learning algorithms and draws correlations between anthropogenic and bio-climate factors, and historical events. Finally, a propagation module generates event footprints given the local topography, fuel data, and meteorological conditions. The stochastic catalogue consists of 50K synthetic years and about 25M unique footprints at 100m resolution. This allows us to estimate hazard metrics like event frequency, event size, and tail risk over the whole continent as well as performing impact analyses. Lastly, we present an evaluation of structures at risk in France by intersecting our catalogue with a representative dataset of buildings. 

How to cite: Azemar, F., Shaylor, M., Bruneau, N., Loridan, T., Swain, D., and Joffrain, M.: Development of a climate-driven stochastic event catalogue for Wildfire in Europe, EGU General Assembly 2025, Vienna, Austria, 27 Apr–2 May 2025, EGU25-18168, https://doi.org/10.5194/egusphere-egu25-18168, 2025.

EGU25-18838 | ECS | Posters on site | NH11.4

Development of a Globally Connected, Climate-Driven, Stochastic Drought Model for Hazard Assessment using Machine Learning Techniques 

Marie Shaylor, Nicolas Bruneau, Frédéric Azemar, and Thomas Loridan

With global temperatures continuing to rise year on year, drought conditions are becoming increasingly frequent and severe, across all continents. More and more, the negative effects of these worsening drought conditions are being experienced by people across the world both directly, through damage to agricultural systems, water scarcity or damage to homes from subsidence, as well as indirectly, through cascading effects on other perils such as heatwaves and wildfires, which in turn may devastate communities and drive great economic losses. For these reasons, drought is of growing concern to the (re)insurance industry, as an emerging peril. It is therefore essential that reinsurers have access to tools which can aid in their understanding of drought hazard and risk in a changing climate. One such tool we present here – a climate driven, globally connected stochastic drought hazard model, which responds dynamically to the climate of any given year, enabling this understanding of how drought conditions change with the climate.

In this presentation, we describe the novel methodology applied to generate this globally connected and climate-driven stochastic drought model. The model is generated in two stages, the first addressing global variability in drought trends and teleconnections, and the second looking at continental scale patterns. In the first instance, we apply a dimensionality reduction to a selection of historical drought indexes over different time scales, allowing extraction of the key modes of variability of drought at the global scale. We then condition the top key modes of variability to the climate state using reanalysis (ERA5) data, allowing us to drive our stochastic set at the global scale, based on the global climate state.

Once these global patterns have been determined, we use the residual drought signal to condition a regional (continental) model using similar reduction and conditioning techniques. This regional layer is then effectively layered onto the global model, allowing us to recreate globally and regionally consistent drought variability in the stochastic set. A Bayesian framework is used to sample a range of realistic drought conditions, aligned with the climate of any given year. Global and regional drought conditions are then combined in order to generate >100K stochastic years of global drought severity as well as duration of drought for three severity levels (moderate, severe, extreme). This framework can also be applied to any other climate model data (for example, CESM LENS2) to generate a stochastic event set up to the year 2100. Here we present initial results from this stochastic catalogue, showcasing the spatial and temporal variation in drought hazard from 1950 – 2100, return periods, and comparisons to historical records. This work also builds upon a previous, continental only version of the drought model.

How to cite: Shaylor, M., Bruneau, N., Azemar, F., and Loridan, T.: Development of a Globally Connected, Climate-Driven, Stochastic Drought Model for Hazard Assessment using Machine Learning Techniques, EGU General Assembly 2025, Vienna, Austria, 27 Apr–2 May 2025, EGU25-18838, https://doi.org/10.5194/egusphere-egu25-18838, 2025.

EGU25-19732 | ECS | Orals | NH11.4

Country-level energy demand for cooling using CMIP6 and world population projections 

Albert Martinez-Boti, Lorenzo Sangelantoni, Daniele Peano, Silvio Gualdi, Stefano Tibaldi, and Enrico Scoccimarro

Cooling Degree Days (CDD) are commonly used to quantify energy demand for cooling and recent works highlighted the importance of population weighting to better represent energy load distribution. This study builds on the work of Scoccimarro et al. (2023), who assessed country-level cooling demand from 2000 to 2020 using both standard dry CDDs and humid CDDs (CDDhum), corrected with population weighting (CDD values are averaged at the national level, weighted by population). The humidity correction uses perceived temperature, which combines both temperature and humidity effects, rather than relying on temperature only. This adjustment offers a more accurate representation of cooling needs, as humidity plays a significant role in human stress and the demand for cooling.

This study aims to assess future cooling demand by utilising a selection of CMIP6 global climate models (GCMs), combined with country-level population projections from the United Nations World Population Prospects 2024. We analyse future trends (2015–2100) for the two mentioned metrics—standard cooling degree days (CDD) and humidity-adjusted cooling degree days (CDDhum) — both weighted by country-level population projections. Temporal evolution of these two metrics is assessed according SSP1-2.6 and SSP5-8.5 societal/emission scenarios, applying a consistent population weighting for both. GCM biases affecting population-weighted CDD and CDDhum are also assessed by considering ERA5 as reference product.

Preliminary results —calculated over Europe during the reference period 1971-2000 and without the application of humidity correction or population weighting — show that, despite some biases in the trend magnitude, the CMIP6 GCMs generally capture the spatial pattern of ERA5 CDD showing a general increasing trend in the energy required for cooling buildings during summer season. In particular, the Mediterranean Basin is projected to experience the most significant increase in CDDs, with considerable inter-model variability. In contrast, some northern European regions, such as the Scandinavian Peninsula and Iceland, show no trend in CDDs.

This work is based on ERA5 and CMIP6 data, collected and tailored as part of the H2020 BlueAdapt project (Grant agreement action Number 101057764), and on analysis codes developed under the Copernicus-funded contract (C3S2_520).

How to cite: Martinez-Boti, A., Sangelantoni, L., Peano, D., Gualdi, S., Tibaldi, S., and Scoccimarro, E.: Country-level energy demand for cooling using CMIP6 and world population projections, EGU General Assembly 2025, Vienna, Austria, 27 Apr–2 May 2025, EGU25-19732, https://doi.org/10.5194/egusphere-egu25-19732, 2025.

We present a novel method to construct a 10,000-year event set for European weather using expired ensemble forecasts from ECMWF [1]—requiring no additional computational effort. Derived from the same numerical model underlying ERA5, this approach naturally extends it more than two orders of magnitude, whilst inherently overrepresenting the climates of the 2010s and 2020s. Hence, it provides a valuable resource for quantifying risks in today’s already-warmed climate

Our evaluation focuses on extreme wind speeds from extra-tropical cyclones impacting major European cities. With a rigorous order statistics framework, we confirm that this dataset replicates the statistical tails of ERA5 for return periods up to RP40 and extends exceedance probability (EP) curves up to RP10,000. Crucially, its physical consistency enables robust analysis of joint distributions across space and time, offering precise insights into compound and correlated risks. Using empirical copulas, we quantify critical conditional probabilities, such as P(Paris = RP100 London = RP50), a task infeasible with only the weather record beyond RP5.

This method leverages years of historical computational investments by ECMWF, that created a vast global low-bias source of simulated weather data, fully interchangeable with ERA5 for seamless integration into existing pipelines. Following two years of archive extraction efforts, we compiled a subset of surface variables (t2m, 10m/100m wind, runoff,...) and make it widely available to the community [2]. 

[1] European Centre for Medium-Range Weather Forecasts (ECMWF) __Atmospheric Model Ensemble extended forecast__ https://www.ecmwf.int/en/forecasts/datasets/set-vi
[2] Dolezal P., Expired ECMWF ENSemble Extended forecasts and Reforcasts for Renewable power in Europe. NERC EDS Centre for Environmental Data Analysis,
https://catalogue.ceda.ac.uk/uuid/7783f79c7080456088d98a34ca238bfa

How to cite: Dolezal, P. and Shuckburgh, E.: Spatial Coincidence of Extreme Wind Across European Cities: Evidence from 10,000 Years of Expired ECMWF Forecasts, EGU General Assembly 2025, Vienna, Austria, 27 Apr–2 May 2025, EGU25-19805, https://doi.org/10.5194/egusphere-egu25-19805, 2025.

EGU25-20119 | Orals | NH11.4

Projected Impacts of Climate Change on High Temperatures for Tomato Cultivation 

Ana Maria Tarquis, Alfredo Rodriguez, Esther Hernández-Montes, Ernesto Sanz, Andres F. Almeida-Ñauñay, and Alberto Garrido

Climate change poses significant challenges to agricultural systems worldwide, including increased agroclimatic risks that threaten crop productivity and sustainability. This study investigates how climate change will influence the agroclimatic risk of high temperatures on tomato cultivation in Malta, a region already experiencing Mediterranean climatic pressures. Using climate projections under different greenhouse gas emission scenarios, we analyzed temperature trends, heat stress events, and their potential impacts on key growth stages of tomatoes, including flowering and fruit development. The results indicate a marked increase in the frequency and intensity of high-temperature events, particularly during critical phenological phases, which could significantly reduce yields and quality. Our findings also reveal spatial variability in risk levels across Malta, emphasizing the need for localized adaptation strategies. To mitigate these risks, we propose targeted interventions such as selecting heat-tolerant tomato varieties, optimizing irrigation schedules, and implementing shading techniques. This research underscores the urgency of integrating climate-resilient practices into tomato production systems to ensure sustainable agricultural productivity in Malta amidst a changing climate.

How to cite: Tarquis, A. M., Rodriguez, A., Hernández-Montes, E., Sanz, E., Almeida-Ñauñay, A. F., and Garrido, A.: Projected Impacts of Climate Change on High Temperatures for Tomato Cultivation, EGU General Assembly 2025, Vienna, Austria, 27 Apr–2 May 2025, EGU25-20119, https://doi.org/10.5194/egusphere-egu25-20119, 2025.

Land use and land cover change dynamics in the Niger Delta region from 1986 to 2024

Abstract

Understanding the effects of land use and land cover change (LULCC) is crucial for developing land management strategies that can reduce adverse effects on the hydrological cycle and the environment. This study examines the dynamics of LULCC in the Niger Delta of Nigeria, considering its implications for hydrological hazards. The study documents how the LULCC in the Niger Delta has changed from 1986 to 2024. A supervised maximum likelihood classification was applied to five land use classes (water bodies, rainforest, built-up, agriculture, and mangrove) derived from Landsat 5 TM and 8 OLI images from 1986, 2015, and 2024. The built-up and agriculture land classes record the greatest increase, about 8,229 and 6,727 sq. km (561.54% and 79.38%) respectively, while mangroves and rainforests showed the biggest decrease - 14,350 and 10,844 sq. km (-54.51 and -42.88%) respectively. Delta, Cross River, and Rivers States experienced the highest decrease in rainforest compared to other states, 64.0%, 49.49%, and 38.26% (5,711.0 sq km, 3,554.0 sq km and 1,297.0 sq km) respectively. The decreasing mangrove and rainforest cover impact on the hydrological functioning of the NDR resulting in flooding and increased risks and impacts associated with hydrological hazards. The study shows that multiple stakeholders, including the Nigerian government, need to manage LULCC and support forest and mangrove restoration and protection, particularly in Delta, Cross River, and Rivers States, to address rapid changes in the land use with impacts of hydrological functioning of the Niger Delta

 Obroma O Agumagu

 PhD
 Department of Environment and Geography
  University of York

 obroma4u@yahoo.com, oa824@york.ac.uk


How to cite: Agumagu, O.: Land use and land cover change dynamics in the Niger Delta region from 1986 to 2024 , EGU General Assembly 2025, Vienna, Austria, 27 Apr–2 May 2025, EGU25-84, https://doi.org/10.5194/egusphere-egu25-84, 2025.

EGU25-823 | ECS | Orals | BG3.2

Long-term Impacts of 1.5 °C Global Climate Pledges on China's Land Systems 

Peichao Gao, Changqing Song, Sijing Ye, Yifan Gao, Jiaying Lv, Yuanhui Wang, Haoyu Wang, and Fang Li

Global warming is a critical global challenge, and at the 26th Conference of the Parties to the UNFCCC in 2021, nations committed to limiting the global temperature rise to within 1.5°C by 2100. As a signatory, China has introduced ambitious climate targets, including carbon peaking and neutrality goals, which will significantly influence its land system changes. This study, focusing on China, integrates data from the Global Change Assessment Model (GCAM) with an enhanced CLUMondo model to simulate land system changes under two scenarios: a 1.5°C warming scenario and a reference scenario without updated emissions measures. The results show high simulation accuracy and highlight that, under the 1.5°C scenario, ecosystems improve, with shrubland, wetland, and forest areas projected to grow significantly, especially in southern and coastal regions. However, cropland is expected to decrease, with up to 35% converted to wetlands and forests by 2100, particularly in key grain-producing regions, raising food security concerns. These findings underscore the profound impacts of 1.5°C climate pledges on China’s land systems, offering crucial insights for climate risk mitigation and sustainable development.

How to cite: Gao, P., Song, C., Ye, S., Gao, Y., Lv, J., Wang, Y., Wang, H., and Li, F.: Long-term Impacts of 1.5 °C Global Climate Pledges on China's Land Systems, EGU General Assembly 2025, Vienna, Austria, 27 Apr–2 May 2025, EGU25-823, https://doi.org/10.5194/egusphere-egu25-823, 2025.

EGU25-1393 | ECS | Posters on site | BG3.2

Exploring the Climate Mitigation Potential of Afforestation in Europe using Species-Specific Modelling 

Tyler Houston and Marcus Breil

Afforestation in the mid-latitudes exhibits uncertain climate benefits due to dominating biogeophysical effects. While forestation is an important carbon sink, the balance of increased albedo and evapotranspiration remains the primary factor dictating the net climate benefit of afforestation in the region. We aim to formulate optimal strategies for afforestation in Europe and discover if a positive climate benefit can be achieved. We are performing idealised afforestation simulations with ICON-ESM while incorporating species-specific information into the included JSBACH land-surface model. This has been gathered through a tree species data inventory, resulting in the parameterisation of the following variables for eight European tree species: Vegetation Height, Maximum LAI, Maximum Surface Roughness, Maximum Woody Carbon, and Albedo (VIS/NIR). By incorporating this information into existing JSBACH PFTs, we create new species-specific PFTs with which to simulate the effects of monospecific afforestation. This idealised afforestation will be carried out for each species across Europe. The local climate effects will then be compared on a cell-by-cell basis to determine the most beneficial species for afforestation in each region. This focus on the comparison of inter-species differences will elicit the trees species locally best-suited for climate mitigation, allowing optimized afforestation strategies to be developed. Results from these experiments will be presented and initial conclusions drawn regarding such strategies.

How to cite: Houston, T. and Breil, M.: Exploring the Climate Mitigation Potential of Afforestation in Europe using Species-Specific Modelling, EGU General Assembly 2025, Vienna, Austria, 27 Apr–2 May 2025, EGU25-1393, https://doi.org/10.5194/egusphere-egu25-1393, 2025.

EGU25-1640 | ECS | Orals | BG3.2

Land Structure Change and Ecological Effects Under Future Development Scenarios in Tarim River Basin, Central Asia 

Yifeng Hou, Yaning Chen, Yupeng Li, Fan Sun, and Xueqi Zhang

Land is important in the productive life of human societies, as the ecological environment has been shown to be closely related to societal advancement. Currently, the dynamics of land use and cover change (LUCC) have emerged as a focal point in global change studies, playing a key role in urbanization development, regional climate, agricultural production, and ecological sustainability. Driven by the global context of increasing population, the human-land conflict is deepening issues around resource utilization and environmental problems. Soil and water matching in a land basin is important for securing land demand, alleviating human-land conflicts, and promoting sustainable development in the region. The Tarim River Basin (TRB) is the largest inland river basin in China and primarily sustains an agricultural economy centered around oases. 

Over the past half-century, global warming and carbon emissions have become a serious threat to the sustainable development of society. It is therefore critically important to find viable solutions to the structural layout of land use that will promote current and future ecological security in the southern Xinjiang region. The aim in conducting the present study is to explore options for safeguarding the demand for land in the TRB and to promote the synergistic development of regional socio-economic and ecological environments. Using remote sensing data, the study will employ the PLUS model to simulate the evolution of spatial and temporal land-use patterns in the basin under different future scenarios while also considering the ecological value of land-use types. The connection between land development and the ecological environment is examined through the lens of relative ecological value and ecological impact. This study provides a strong scientific foundation for future land management and ecological sustainable development in the TRB.

How to cite: Hou, Y., Chen, Y., Li, Y., Sun, F., and Zhang, X.: Land Structure Change and Ecological Effects Under Future Development Scenarios in Tarim River Basin, Central Asia, EGU General Assembly 2025, Vienna, Austria, 27 Apr–2 May 2025, EGU25-1640, https://doi.org/10.5194/egusphere-egu25-1640, 2025.

EGU25-1898 | Orals | BG3.2

Exploring land-based ecosystem carbon sources and sinks 

Zhangcai Qin, Josep Canadell, Philippe Ciais, Min Chen, Susan Cook-Patton, Tingting Li, Umakant Mishra, Shilong Piao, Pete Smith, Yijie Wang, Wenping Yuan, and Yakun Zhu

Our understanding of regional net carbon flux from land-based ecosystems and land-use changes has been evolving and improving as more data and advanced models become available. However, the size and attribution of carbon sources and sinks related to existing and potential land-use and land-use change (LUC) activities are still often debated, especially in the context of climate change mitigation and carbon neutrality. In this presentation, we aim to convey several key messages derived from our recent findings based on updated data and newly developed models (mechanistic and machine learning-based).   Using a new bookkeeping model (i.e., LUCE), we demonstrate that LUC has contributed to global net CO2 emissions, with forest-related activities (e.g., deforestation, reforestation) dominating changes in carbon fluxes. LUC could shift from a net carbon source to a net carbon sink in some regions with extensive gains in forest area particularly due to reforestation and afforestation. However, upon further examination of future land-use scenarios, we find that the large potential of carbon sequestration estimated from newly grown forests should be scrutinized from both ecological and socioeconomic perspectives. The role of the land sector in the global carbon budget could change over time and space, but an urgently needed positive change (from a carbon source to a sink) relies heavily on what we can and decide to do next.

How to cite: Qin, Z., Canadell, J., Ciais, P., Chen, M., Cook-Patton, S., Li, T., Mishra, U., Piao, S., Smith, P., Wang, Y., Yuan, W., and Zhu, Y.: Exploring land-based ecosystem carbon sources and sinks, EGU General Assembly 2025, Vienna, Austria, 27 Apr–2 May 2025, EGU25-1898, https://doi.org/10.5194/egusphere-egu25-1898, 2025.

EGU25-2235 | ECS | Orals | BG3.2

Mapping Land Use Transformations in the Eastern part of the EMMENA Region in the last two decades. Addressing Food Security from a Land Use Perspective. 

Dimitris Koumoulidis, Ioannis Varvaris, Christos Theocharidis, Diofantos Hadjimitsis, and Charalampos Kontoes

Arable land and its quality are the principal sources of food supplies and fundamental determinants of food security. They underpin essential ecosystem services and food provisioning. The Food and Agriculture Organization (FAO)[1] identifies four critical dimensions—availability, access, utilization, and stability—that support food security. Ensuring the integrity of these dimensions is of the utmost importance.

Preserving agricultural productivity is crucial; nonetheless, adverse policies and practices, such as repurposing fertile land for urban expansion, overgrazing, deforestation, and ineffective irrigation methods, play a significant role in land quality and productivity degradation. Furthermore, when these issues are coupled with environmental and climatic modifications, they can impact numerous domains, including water management, public health, transportation, ecosystems, biodiversity, and human-induced hazards such as forest fires.

The EMMENA (East Mediterranean, Middle East and North Africa) spans diverse countries from Morocco to Yemen and Saudi Arabia, varying politically, economically, culturally, and environmentally. The region includes twenty-two countries covering approximately 12 million Km2. Multiple criteria guided the choice of this study area, given that the EMMENA region is characterized by marked social disparities. The region’s populations are vulnerable to climate and suffer the most from climate change effects, particularly as far as extreme heat occurrences and water scarcity combined with agriculture and ecosystem losses are concerned. Additionally, projections indicate that the population of the region’s expansive eastern part will surpass 1 billion by 2100. This demographic surge in areas with restricted agricultural land and limited water resources creates substantial socio-economic challenges and environmental effects. In the eastern area of the EMMENA region, limited and unevenly distributed water resources often create a dissonance between the demands of human communities and the necessity for environmental sustainability. Ultimately, according to FAO[2], the eastern segment of the region (Middle East) is witnessing frequent violent incidents across several countries. Jordan and Lebanon, which accommodate most refugees in the area, as well as the current instability in Syria, are experiencing substantial challenges in the stewardship of their natural resources, particularly land and water.

This study uses satellite imagery from the Landsat Thematic Mapper to investigate land-use alterations from 2000 to 2020 in Jordan, Syria, Lebanon, and Cyprus. The analysis incorporates the GlobeLand30 dataset, developed and sourced from the Global Land Discovery & Analysis[3] website provides global land cover data at a resolution of 30m to accurately depict the area’s land cover characteristics. ArcGIS maps from 2000, 2005, 2010, 2015, and 2020 were scrutinized to evaluate net land-use changes across ten classes, including grasslands, cultivated areas, forests, water bodies, and artificial surfaces.

The findings indicate a notable agricultural land abandonment in Syria, with a lesser degree observed in Lebanon. Every country has a discernible increase in the proliferation of built-up environments, particularly close to substantial residential areas. In Cyprus and Lebanon, forested regions characterized by tall vegetation have been devastated by wildfires, while in Jordan, minor land-use modifications are evident due to the desert landscape, the country's flat topography, and the arid climatic conditions.


[1] The State of Food and Agriculture 2006

[2] https://openknowledge.fao.org/server/api/core/bitstreams/766356ba-d028-4f06-b9b8-04d65bd8149c/content

[3] GLAD Global Land Analysis & Discovery

How to cite: Koumoulidis, D., Varvaris, I., Theocharidis, C., Hadjimitsis, D., and Kontoes, C.: Mapping Land Use Transformations in the Eastern part of the EMMENA Region in the last two decades. Addressing Food Security from a Land Use Perspective., EGU General Assembly 2025, Vienna, Austria, 27 Apr–2 May 2025, EGU25-2235, https://doi.org/10.5194/egusphere-egu25-2235, 2025.

EGU25-2311 | ECS | Orals | BG3.2

Future land carbon removals in China consistent with national inventory 

Yue He, Shilong Piao, Philippe Ciais, Hao Xu, and Thomas Gasser

China’s commitment to carbon neutrality by 2060 relies on the Land Use, Land-Use Change, and Forestry (LULUCF) sector, with forestation targets designed to enhance carbon removal. However, the exact sequestration potential of these initiatives remains uncertain due to differing accounting conventions between national inventories and scientific assessments. Here, we reconcile both estimates and reassess LULUCF carbon fluxes up to 2100, using a spatially explicit bookkeeping model, state-of-the-art historical data, and national forestation targets. We simulate a carbon sink of −0.24 ± 0.03 Gt C yr−1 over 1994–2018 from past forestation efforts, aligned well with the national inventory. Should the official forestation targets be followed and extended, this could reach −0.35 ± 0.04 Gt C yr−1 in 2060, offsetting 43 ± 4% of anticipated residual fossil CO2 emissions. Our findings confirm the key role of LULUCF in carbon sequestration, but its potential will decline if forestation efforts cease, highlighting the necessity for emission reductions in other sectors to achieve carbon neutrality.

How to cite: He, Y., Piao, S., Ciais, P., Xu, H., and Gasser, T.: Future land carbon removals in China consistent with national inventory, EGU General Assembly 2025, Vienna, Austria, 27 Apr–2 May 2025, EGU25-2311, https://doi.org/10.5194/egusphere-egu25-2311, 2025.

EGU25-2580 | ECS | Posters on site | BG3.2

The rough reality: How forests reshape tropical circulation and hydroclimate 

Nora L. S. Fahrenbach, Steven J. De Hertog, and Robert C. Jnglin Wills

While afforestation and avoided deforestation are important strategies for climate change adaptation and mitigation, their effects on atmospheric circulation and hydroclimate remain underexplored. Here, we use future afforestation simulations in an SSP1-2.6 and SSP3-7.0 world from seven CMIP6 models from the Land Use Model Intercomparison Project (LUMIP). Our results reveal robust increases in precipitation and evapotranspiration, coupled with widespread decreases in net moisture flux (i.e., decreases in precipitation minus evaporation) in the tropics, particularly over Africa. The moisture flux changes are driven by opposing effects of afforestation on upper and lower-tropospheric circulation: The increase in surface roughness significantly slows down the moisture-laden surface winds from the ocean, reducing moisture transport and suppressing topographically-induced precipitation. However, the concurrent increase in near-surface moist static energy strengthens convection and thus the upper-tropospheric circulation. These findings underscore the significant role of surface roughness changes and land-atmosphere interactions in shaping tropical hydroclimate, and highlight the need for careful consideration of the hydroclimate impacts of land-based climate strategies.

How to cite: Fahrenbach, N. L. S., De Hertog, S. J., and Jnglin Wills, R. C.: The rough reality: How forests reshape tropical circulation and hydroclimate, EGU General Assembly 2025, Vienna, Austria, 27 Apr–2 May 2025, EGU25-2580, https://doi.org/10.5194/egusphere-egu25-2580, 2025.

EGU25-3441 | ECS | Posters on site | BG3.2

Overlooked deforestation from global mining activities in the 21st century 

Xiaoxin Zhang, Bin Chen, Jiafu An, and Chen Lin

Mining is a major driver of deforestation. However, quantitatively estimating its full impact on natural forests and the associated carbon emissions is challenging due to incomplete global data on mining activities. Here, we compiled a comprehensive inventory of global mining activities, including 236,028 mining areas with an overall accuracy of 87.37% to analyze deforestation within mining areas and the associated forest carbon emissions from 2001 to 2023. Our results reveal that deforestation directly caused by mining activities is two to three times higher than previously estimated from widely used mining datasets, accounting for 19,765 km2 of deforestation and 0.75 Pg CO2 of carbon emission in the 21st century. Notably, 50.29% of this deforestation is linked to undocumented mining activities. This study highlights the significant deforestation directly caused by mining activities on a global scale, and particularly underscoring the environmental impact of informal mining.

How to cite: Zhang, X., Chen, B., An, J., and Lin, C.: Overlooked deforestation from global mining activities in the 21st century, EGU General Assembly 2025, Vienna, Austria, 27 Apr–2 May 2025, EGU25-3441, https://doi.org/10.5194/egusphere-egu25-3441, 2025.

EGU25-3551 | ECS | Orals | BG3.2

A globally consistent negative effect of edge on aboveground forest biomass 

Gayoung Yang, Thomas W. Crowther, Thomas Lauber, Constantin M. Zohner, and Gabriel Reuben Smith

Because of widespread forest fragmentation, 70% of the world’s forest area lies within 1 km of an edge. Forest biomass density near edges often differs markedly from biomass density in the interior. In some biomes, these “edge effects” are responsible for significant reductions in forest carbon storage. However, there is little consensus on the sign and magnitude of edge effects on forest biomass across the globe, which hampers their consideration in forest carbon stock accounting. Here, we examined eight million forested locations to quantify variability in edge effects at a global scale. We found negative edge effects across 97% of examined areas, with aboveground biomass density lower near edges than in interior forests. Higher temperature, precipitation, and proportion of agricultural land are linked to more negative edge effects. Along with differences in the spatial scale of analysis, this variation can explain contrasting observations among previous studies. We estimate that edge effects have reduced the total aboveground biomass of forests by 9%, equivalent to a loss of 58 Pg. These findings underscore the substantial impact of forest fragmentation on global biomass stocks and highlight the critical need to account for edge effects in carbon stock assessments.

How to cite: Yang, G., Crowther, T. W., Lauber, T., Zohner, C. M., and Smith, G. R.: A globally consistent negative effect of edge on aboveground forest biomass, EGU General Assembly 2025, Vienna, Austria, 27 Apr–2 May 2025, EGU25-3551, https://doi.org/10.5194/egusphere-egu25-3551, 2025.

EGU25-4057 | ECS | Orals | BG3.2

SCISSOR: a Spectral ClImate Signal SeparatOR to assess complex climate responses to land cover changes 

Felix Jäger, Jonas Schwaab, Mona Bukenberger, Steven J. de Hertog, and Sonia I. Seneviratne

While large-scale afforestation and reforestation are heavily discussed as strategies for nature-based climate change mitigation and adaptation, massive deforestation is ongoing. Such widespread land use and land cover changes (LULCCs) not only alter the global climate through biomass carbon uptake or release but also through biogeophysical (BGP) processes related to changes in surface roughness, evaporation, transpiration, and albedo. These BGP effects act as local forcing to land-atmosphere interactions and lead to in situ climate responses. Caused by advection and spatio-temporal land-atmosphere-ocean interaction, they also generate nonlocal climate responses that occur remotely from the LULCC.

The non-local partition of climate response signals, and how it occurs at spatial scales different from the forcing, is still the subject of ongoing research. Here, we present a spectral perspective on climate responses to surface forcing from LULCC that aids in achieving a systematic and mechanistic understanding of the arousal and robustness of large-scale BGP effects.

We introduce spectral decomposition of forcing and response fields into a sum of signals with different wavelengths based on spherical harmonics to compare the two fields across spatial scales. Building on this approach, we define the ’cross-scale’ response signal based on the difference of response and forcing spectra. With our novel tool SCISSOR, a Spectral ClImate Signal SeparatOR, we determine the cross-scale signal of BGP-driven temperature response to deforestation, which strongly resembles the nonlocal signal as estimated by established methods such as moving window regression and checkerboard interpolation.

We further show that SCISSOR and other spectral tools can be used to analyze consistent and divergent characteristics of climate responses to LULCC between Earth System Models. We discuss the assumptions, advantages and limitations of both SCISSOR and the established signal separation methods and assess their potential use for future analysis of the complex interaction between climate and land surface changes.

How to cite: Jäger, F., Schwaab, J., Bukenberger, M., de Hertog, S. J., and Seneviratne, S. I.: SCISSOR: a Spectral ClImate Signal SeparatOR to assess complex climate responses to land cover changes, EGU General Assembly 2025, Vienna, Austria, 27 Apr–2 May 2025, EGU25-4057, https://doi.org/10.5194/egusphere-egu25-4057, 2025.

EGU25-4303 | ECS | Orals | BG3.2 | Highlight

Agent-based modelling of alternative futures in the German land system: What are the socioecological impacts of land-based Carbon Dioxide Removal? 

Karina Winkler, Mohamed Byari, Maximilan Witting, Felix Gulde, and Mark Rounsevell

To achieve net-zero greenhouse gas emissions in the future, carbon dioxide removal (CDR), also known as negative CO2 emissions, is likely to become an essential part of the climate mitigation portfolio. In Germany, land-based CDR options such as bioenergy with carbon capture and storage (BECCS), agroforestry, forest management, and afforestation/reforestation are increasingly being discussed and integrated into potential future scenarios. However, it remains unclear how these options will affect future land use in Germany and what impacts this will have on ecosystem service provision.

Depending on future socioeconomic development and the progression of climate change, Germany can follow different paths for implementing CDR in the land system. We use a set of stakeholder-developed qualitative and quantitative CDR visions and Shared Socioeconomic Pathways (SSPs) combined with climate change scenarios to simulate the future land use change in Germany concerning afforestation/reforestation, forest management, agroforestry, and BECCS. For this, we develop CRAFTY-DE, a new agent-based model of the German land system that integrates a wide range of available land use/cover data and operates at a 1 km² resolution. Here, the demand for ecosystem services drives a range of interrelated land use agents with different productivities and dependencies on changing socio-economic and environmental conditions.

With CRAFTY-DE, we simulate the conditions under which CDR targets can be achieved in the German land system. In particular, we investigate the role of selected policy measures. Our research addresses the following questions: Which scenarios offer favourable conditions for which CDR measures and thus synergies between ecosystem services? How can specific policy measures support this? What are the trade-offs and land use conflicts associated with CDR measures?

Identifying possible pathways of land use change and the resulting synergies and trade-offs associated with CDR will become an important knowledge base for policymakers, industry, and stakeholders regarding the scope for action in the development of land-based CDR in Germany.

How to cite: Winkler, K., Byari, M., Witting, M., Gulde, F., and Rounsevell, M.: Agent-based modelling of alternative futures in the German land system: What are the socioecological impacts of land-based Carbon Dioxide Removal?, EGU General Assembly 2025, Vienna, Austria, 27 Apr–2 May 2025, EGU25-4303, https://doi.org/10.5194/egusphere-egu25-4303, 2025.

EGU25-4384 | ECS | Orals | BG3.2 | Highlight

Developing land use strategies in Europe under climate change and legislative constraints 

Konstantin Gregor, Christopher P.O. Reyer, Thomas A. Nagel, Annikki Mäkelä, Andreas Krause, Thomas Knoke, and Anja Rammig

Land use, land management, and land cover change (LULCC) play a pivotal role in shaping ecosystems, influencing global and local climate, biodiversity, and the provision of resources.
Therefore, effective land use strategies need to consider the trade-offs between these often competing objectives. 

Legislative frameworks, including the EU Biodiversity Strategy, EU Forest Strategy, and national policies, aim to protect natural landscapes, enhance ecosystem services, and leverage resources for climate mitigation and the bioeconomy. However, reconciling these objectives poses a critical challenge for policymakers, land managers, and conservation stakeholders.

Using process-based ecosystem modeling and robust multi-criteria optimization, we analyzed how portfolios of forest management strategies could sustain multiple ecosystem services across diverse climate scenarios. The study incorporated strict constraints, such as protecting 10% of Europe’s land area and maintaining stable harvest levels under all climate scenarios. Results revealed significant trade-offs: limited flexibility due to the constraints led to low-diversity portfolios that compromised multi-functionality and increased regional risks. Moreover, productive northern regions would need to prioritize timber provision to compensate for declining harvests elsewhere, conflicting with targets for increasing forest carbon sinks in those regions. The uneven distribution of protected areas also introduced disparities in conservation efforts.

Our findings underscore the need for coordinated European land use strategies that address these conflicts. Complementary measures to the EU strategies are essential to achieve goals for carbon sequestration, resource availability, and ecosystem services under a changing climate. While the analysis focused on forests, the approach can be adapted to other land use types.

How to cite: Gregor, K., Reyer, C. P. O., Nagel, T. A., Mäkelä, A., Krause, A., Knoke, T., and Rammig, A.: Developing land use strategies in Europe under climate change and legislative constraints, EGU General Assembly 2025, Vienna, Austria, 27 Apr–2 May 2025, EGU25-4384, https://doi.org/10.5194/egusphere-egu25-4384, 2025.

In the future, agricultural land use is expected to continue expanding to meet the increasing food demand driven by population and economic growth. However, policy actions aimed at addressing climate change and biodiversity loss may impose constraints this expansion, leading to a triple land-use conflict. By linking land conservation priority data with the global economic land-use model (GLOBIOM), this study assesses the climate mitigation potential, biodiversity benefits, and food security risks under land-based climate mitigation and biodiversity conservation measures. The results indicate that dual measures could contribute to a cumulative carbon reduction of 242 Gt between 2020 and 2050, while maintaining global biodiversity integrity at 2020 levels by 2050. However, this would require a reduction in agricultural land use before mid-century, leading to a 57% increase in global food prices by 2050 compared to the baseline scenario and an additional 368 million people at risk of undernurishment, compared to 257 million under only climate mitigation measures. This is primarily due to the significant amplification effect of BECCS on food security under the land protection expansion scenario. Extensive scenario simulations based on Monte Carlo sampling reveal a nearly linear relationship between the carbon reduction potential of land-based measures and the resulting additional undernurishment risks, while the marginal biodiversity benefits decrease, further highlighting the "impossible trinity" of climate mitigation, biodiversity conservation, and food security arising from land-use conflicts. Although this study suggests that global food aids or agricultural subsidies could address the side effect at a cost of around 0.39% of GDP, the actual potential for food assistance remains limited.

How to cite: Ma, X. and Dai, H.: Joint action for climate mitigation and biodiversity conservation may undermine global food security, EGU General Assembly 2025, Vienna, Austria, 27 Apr–2 May 2025, EGU25-4654, https://doi.org/10.5194/egusphere-egu25-4654, 2025.

Forestation significantly affects local temperatures, yet its effects on land surface temperature (LST) are complex and context-dependent. While much research has focused on the cooling effects of forestation globally by latitudes, less attention has been given to regional, seasonal and class-specific variations in LST.

This study examines how forestation changes daytime LST using a percentile-based approach and identifies climatic drivers of forest greenness through random forest regression across India's diverse forest types, including tropical, temperate, montane, alpine, and sub-alpine, which are further divided into 14 classes. It finds that forestation has both cooling and warming effects depending on forest class and percentiles, with cooling observed in 9 out of 14 forest classes, ranging from -4.1°C in mangroves to warming by 4.8°C in montane dry temperate forests. Forestation cools areas between 12–25°N but warms regions outside this range. Monthly temperature variations are substantial, with Class 13 warming during JJAS and MAM season and Class 5 cooling year-round. Greening variation is primarily driven by latent heat, which explains over 70% of the variation in Classes 4, 5, and 6, and by net photosynthesis, which accounts for up to 69.4% in Class 14. Other factors, such as precipitation, PDSI, and soil moisture, influence forest-specific LAI regulation.The study highlights the importance of spatial and temporal heterogeneity in assessing forestation’s effects on LST, providing valuable insights for climate adaptation and forest management, while suggesting future research to explore microclimatic feedbacks and long-term ecosystem impacts.

Keywords: Forestation, Land Surface Temperature, Climatic Drivers, Greenness,  Seasonal Variation

How to cite: Sharma, J. and Kumar, P.: Quantification of Potential Forestation induced change in Daytime Land Surface Temperature in India, EGU General Assembly 2025, Vienna, Austria, 27 Apr–2 May 2025, EGU25-5008, https://doi.org/10.5194/egusphere-egu25-5008, 2025.

Dryland ecosystems provide a wide range of ecological services essential to human well-being, but the poor soils of drylands make them highly vulnerable to damage from human activities, with far-reaching economic and social consequences. Therefore, the study of human-nature interactions in drylands is important for sustainable development. However, the economic and social impacts of different forms of human-nature interactions vary widely. Traditional land cover-based studies of indicators of human-nature interactions in drylands have failed to adequately distinguish between these impacts. Therefore, based on the Google Earth Engine cloud platform, this study extracted and mapped the distribution of WUIs in China's drylands for the period 1990 to 2020 by combining a variety of data, including GHL-S building area and land cover data. In addition, the study quantitatively analyses the relationships between spatial and temporal changes, landscape-scale changes, and regional GDP and population changes in the WUIs of China's drylands.


The results show that the WUI area in China's drylands has increased by about 15.9% over the past 30 years, and this expansion trend is particularly concentrated near large urban agglomerations.The WUI areas in the landscape are characterised by diversity, fragmentation, homogeneity and edge simplicity, which indicate a complex spatial pattern. To further explore the relationship between WUI expansion and regional GDP and population changes, this study used the Pearson correlation coefficient at the scale of 486 dryland counties. The results show a strong relationship between WUI expansion and economic and population growth, suggesting that human-nature interactions in China's drylands have been increasing over the past three decades and that the associated risks are growing.


In particular, the expansion of the WUI has significantly changed the socio-economic structure of these areas, leading to more frequent natural disasters and public health events that seriously threaten the survival and development of human communities. The study highlights that increasing human activities in drylands can exacerbate problems such as ecological degradation, land desertification and water scarcity, making it particularly urgent to implement scientific landscape planning and sustainable development strategies in these regions. Such planning not only helps to mitigate the negative impacts of human activities on the environment, but also strikes a balance between economic development and ecological conservation, and promotes the harmonious coexistence of society and nature.


This study provides important quantitative data and insightful analytical perspectives for understanding WUI changes in China's drylands and their impacts on economic and social development. In the future, as data technology and analytical methods continue to advance, similar studies will play an increasingly important role in the sustainable development of the world's drylands. An in-depth study of the interactions between human activities and the natural environment can help policy-makers address the challenges facing drylands and ensure that the ecological, economic and social systems in these areas can achieve long-term sustainable development.

How to cite: Xu, S. and Liu, Y.: Intensifying Human-Nature Interaction on China’s Dryland Landscape: An Evidence from Wildland–urban Interface, EGU General Assembly 2025, Vienna, Austria, 27 Apr–2 May 2025, EGU25-5568, https://doi.org/10.5194/egusphere-egu25-5568, 2025.

EGU25-5786 | ECS | Orals | BG3.2

Regional climate modelling for a comprehensive understanding of forest management-induced biogeophysical climate impacts in Europe 

Yi Yao, Petra Sieber, Jonas Schwaab, Felix Jäger, and Sonia I. Seneviratne

Forests play a crucial role in European climate policy, owing to their potential for carbon sequestration, climate adaptation, biodiversity conservation, and other ecosystem services. Forest management directly changes land surface properties, e.g., albedo and roughness, and therefore has biogeophysical (BGP) impacts locally and potentially remotely due to advection and circulation. Previous studies investigating BGP climate impacts of forests focused on af/de-forestation, neglecting other types of forest management, like species change, tree health improvement, etc. To fill this gap, we employ the regional climate model COSMO-CLM, coupled with a land surface model with elaborate forest representation, CLM5, to perform simulations under multiple forest management scenarios. These scenarios vary in forest coverage, forest composition, and forest health (represented by leaf area index and canopy height), which allow us to detect the changes in climate induced by different forest management types and their combinations. The first results show that forest management-induced impacts have substantial spatial- and temporal- heterogeneity. Key findings include (i) both deforestation and broadleaf trees afforestation can decrease summer daily maximum temperature; (ii) broadleaf trees also increase winter daily minimum temperature in mid-latitude areas compared to needleleaf trees; (iii) afforestation increases precipitation in coastal regions of West Europe; and (iv) needleleaf trees afforestation decreases precipitation in the inland of Europe, but broadleaf trees afforestation increases it, etc. In our ongoing work, we will focus on understanding the mechanism behind these impacts by investigating changes in energy fluxes, water fluxes, wind speeds and other relevant variables.

How to cite: Yao, Y., Sieber, P., Schwaab, J., Jäger, F., and Seneviratne, S. I.: Regional climate modelling for a comprehensive understanding of forest management-induced biogeophysical climate impacts in Europe, EGU General Assembly 2025, Vienna, Austria, 27 Apr–2 May 2025, EGU25-5786, https://doi.org/10.5194/egusphere-egu25-5786, 2025.

Land consolidation (LC) is an important land use activity in China. Especially under the background of global climate change and national carbon neutrality strategy, it is particularly important to study the relationship between LC and carbon cycle. Existing studies lack the carbon effects analysis of the whole process and the exploration of low-carbon optimization strategies. Therefore, from the perspective of the whole life cycle, this study applied Life Cycle Assessment (LCA) method to construct a research framework and accounting system for carbon footprint assessment of LC, and then explored the decision-making optimization path of low-carbon LC construction based on the ISM model. Results showed that: (a) The carbon effect of the project area was characterized as carbon sink during the whole life cycle of LC, with the amount of 492tCE. (b) Carbon effect varied among different stages of LC. The Restoration Period (RP) and the Benefit Period (BP) were characterized as carbon sink, while all the other stages were manifested as carbon emission. Among them, as to the carbon emission, the Construction Period (CP) played a decisive role with the most proportion, followed by DP, and the carbon effect of PP was negligible. (c) Based on the calculation of ISM model, 17 low-carbon measures were divided into three levels. The analysis results show that measures such as improving the quality of cultivated land and protecting the Ecological Redline would play a decisive role in the low-carbon development of LC. This study contributes to providing certain theoretical guidance and method reference for the realization of Low-Carbon LC project planning.

How to cite: Shan, W.: Study on the carbon effects of land consolidation and optimization path of low-carbon decision-making from the perspective of life cycle, EGU General Assembly 2025, Vienna, Austria, 27 Apr–2 May 2025, EGU25-5812, https://doi.org/10.5194/egusphere-egu25-5812, 2025.

EGU25-6052 | ECS | Orals | BG3.2

Future Forests: estimating biogenic emissions from net-zero aligned afforestation pathways in the UK 

Hazel Mooney, Stephen Arnold, Ben Silver, Piers Forster, and Cat Scott

Woodlands sequester carbon dioxide from the atmosphere, which could help mitigate climate change. As part of an effort to reach net-zero greenhouse gas emissions by the year 2050, the UK’s Climate Change Committee (CCC) recommend increasing woodland cover from a UK average of 13% to 17-19%. Woodlands also have the potential to affect air quality, in part due to the emission of biogenic volatile organic compounds (BVOCs) which are precursors to major atmospheric pollutants, ozone (O3) and particulate matter (PM). This study presents for the first-time estimates of BVOC emissions that are consistent with net-zero aligned afforestation in the UK. The BVOC emission scenarios consider suitability of tree species for the UK coupled with regionally appropriate emissions potentials. We quantify the potential emission of BVOCs from five afforestation experiments using the Model of Emissions of Gases and Aerosols from Nature (MEGAN) (v2.1) in the Community Land Model (CLM) (v4.5) for the year 2050. Experiments were designed to explore the impact of the variation in BVOC emissions potentials between and within plant functional types (PFTs) on estimates of BVOC emissions from UK land cover, to understand the scale of change associated with afforestation to 19% woodland cover by the year 2050.  

Our estimate of current annual UK BVOC emissions is 40 kt yr-1 of isoprene and 46 kt yr-1 of total monoterpenes. Broadleaf afforestation results in a change in UK isoprene emission of between -4% and +131%, and a change in total monoterpene emission of between +6% and +52%. Needleleaf afforestation leads to a change in UK isoprene emission of between -3% and +20%, and a change in total monoterpene emission of between +66% and +95%.   

Our study highlights the potential for net-zero aligned afforestation to have substantial impacts on UK BVOC emissions, and therefore air quality, but also demonstrates routes to minimising these impacts through consideration of the emissions potentials of tree species planted. We show that incorporating regionally appropriate emissions factors, information about present day abundance of tree species, and the likely role of different species in the UK’s future forests, can substantially alter estimates of emissions. This study highlights an important interaction between the land and the atmosphere, for climate change mitigation options, specifically afforestation, to hold the potential to impact air quality. 

How to cite: Mooney, H., Arnold, S., Silver, B., Forster, P., and Scott, C.: Future Forests: estimating biogenic emissions from net-zero aligned afforestation pathways in the UK, EGU General Assembly 2025, Vienna, Austria, 27 Apr–2 May 2025, EGU25-6052, https://doi.org/10.5194/egusphere-egu25-6052, 2025.

EGU25-6225 | ECS | Posters on site | BG3.2

Attributing gridded land use change carbon emissions to crop and grass production from 2000 to 2020. 

Belen Benitez, Carole Dalin, and Bertrand Guenet

Food systems are responsible for one-third of global greenhouse gas (GHG) emissions, and these emissions are predominantly driven by land-based and land-use change (LUC) emissions linked to agricultural production (Crippa, M. et al., 2021). Incorporating all sources of GHG emissions, including those from land-use change, is essential for fully assessing the sustainability of agricultural production and enabling informed decision-making. However, many studies either overlook LUC-related emissions, do not account for diverse land-use change scenarios, neglect to accurately differentiate the agricultural commodities driving the change, or focus on aggregated subnational scales (Halpern, B.S. et al., 2024; Singh, C., & Persson, 2022; Lam, W. Y. et al., 2021). Our research addresses these gaps by providing high-resolution (5 arc-minute), global-scale estimates of LUC emissions attributed to crop and livestock production from 2000 to 2020. We quantify LUC emissions and attribute them to specific crops and pasture established on newly converted lands, providing crop- and grass-specific carbon emission intensities, which represent the carbon emissions generated per ton of production. Additionally, our study integrates emissions resulting from new pasture areas into livestock GHG emission intensity data from previous research, providing a more detailed livestock emission assessment. This approach offers a comprehensive evaluation of the carbon footprint of crop and livestock production and reveals the spatial and temporal dynamics of LUC-related emissions, thus providing valuable insights into the environmental impact of agricultural expansion.

How to cite: Benitez, B., Dalin, C., and Guenet, B.: Attributing gridded land use change carbon emissions to crop and grass production from 2000 to 2020., EGU General Assembly 2025, Vienna, Austria, 27 Apr–2 May 2025, EGU25-6225, https://doi.org/10.5194/egusphere-egu25-6225, 2025.

EGU25-6375 | ECS | Orals | BG3.2

Water and land management scenarios for addressing land subsidence in the Netherlands 

Muhannad Hammad, Kim Cohen, Gilles Erkens, and Esther Stouthamer

Land subsidence is a wicked problem that presents significant challenges to both urban and rural areas in the Netherlands. With annual subsidence rates reaching up to 10 mm in urban areas and over 30 mm in rural polder areas, the increasing damage caused by subsidence represents a long-term economic burden at both regional and national levels. Additionally, the land subsidence process contributes to greenhouse gas (GHG) emissions, further exacerbating environmental challenges. Addressing the persistent losses and emissions associated with land subsidence is a complex task that requires a holistic approach.

This study explores the role of integrated water and land management in mitigating land subsidence and the associated impacts on both society and the Earth system, using our backcasting approach developed within the Living on Soft Soils research programme [nwa-loss.nl]. This approach begins by formulating alternate long-term objectives for 2050, focusing on minimizing subsidence rates, reducing subsidence-related GHG emissions, and mitigating associated economic damage. These objectives were explicitly defined for both rural and urban contexts, with input from scientists and stakeholders. The three alternate objectives reflect varying levels of ambition and feasibility, with continued unaltered management practises, representing the business-as-usual scenario, serving as a baseline for comparison. Next, preparing the backcasting approach requires to define and select the water and land management measure sets that simulation modelling may select to alter land subsidence and the associated impacts from business as usual. Between rural and urban areas, the water management strategies of reducing the groundwater level lowering are fairly similar, but for the land management strategies there are strong context differences. In some rural areas, to reach the long-term objective one may opt for drastic land use changes, e.g. changing established agriculture into paludiculture, or reallocating land to forests or wetlands (in tandem with raising groundwater tables, serving GHG reduction and ecosystem restoration goals), while maintaining established agricultural use in other rural areas with higher groundwater levels and less drastic water management measures or less reducing the groundwater level lowering. In urban areas, land management strategies focus on soil stabilization, blue-green infrastructure, and district-level interventions to mitigate subsidence while enhancing urban resilience to climate change.

The modelling steps in this study explore the solution space and develops land subsidence management scenarios towards the three sustainable long-term objectives. Model runs using the water and land management strategies either individually or in different combinations. The performance of scenarios is evaluated based on their ability to reduce subsidence and the associated socioeconomic cost terms. With the performance analysed, the outcomes are lined up to introduce sustainable pathways for implementing measure sets, allowing stakeholders and decision-makers to make informed decisions and choose the most feasible and sustainable options, ensuring that these interventions are tailored to the local context and conditions, and also that these interventions contribute to broader Earth system sustainability.

In conclusion, this study highlights the role of integrating water and land management strategies in addressing land subsidence via a framework provides scenarios and pathways toward achieving sustainable land subsidence management in the Netherlands.

How to cite: Hammad, M., Cohen, K., Erkens, G., and Stouthamer, E.: Water and land management scenarios for addressing land subsidence in the Netherlands, EGU General Assembly 2025, Vienna, Austria, 27 Apr–2 May 2025, EGU25-6375, https://doi.org/10.5194/egusphere-egu25-6375, 2025.

EGU25-6588 | ECS | Orals | BG3.2

Blue in green: forestation turns blue water green, mitigating heat at the expense of water availability 

Olivier Asselin, Martin Leduc, Dominique Paquin, Nathalie de Noblet-Ducoudré, Diana Rechid, and Ralf Ludwig

In order to meet a stringent carbon budget, shared socioeconomic pathways (SSPs) aligned with the Paris Agreement typically require substantial land-use changes (LUC), such as large-scale forestation and bioenergy crop plantations. What if such a low-emission, intense-LUC scenario actually materialized? In this contribution, we quantify the biophysical effects of LUC under SSP1-2.6 using an ensemble of regional climate simulations over Europe. We find that LUC projected over the 21st century, primarily broadleaf-tree forestation at the expense of grasslands, reduce summertime heat extremes significantly over large swaths of continental Europe. In fact, cooling from LUC trumps warming by greenhouse gas (GHG) emissions, resulting in milder heat extremes by 2100 for about half of the European population. Forestation brings heat relief by shifting the partition of turbulent energy fluxes away from sensible and towards latent heat fluxes. Impacts on the water cycle are then assessed. Forestation enhances precipitation recycling over continental Europe, but not enough to match the boost of evapotranspiration (green water flux). Run-off (blue water flux) is reduced as a consequence. Some regions experience severe drying in response. In other words, forestation turns blue water green, bringing heat relief but compromising water availability in some already-dry regions.

How to cite: Asselin, O., Leduc, M., Paquin, D., de Noblet-Ducoudré, N., Rechid, D., and Ludwig, R.: Blue in green: forestation turns blue water green, mitigating heat at the expense of water availability, EGU General Assembly 2025, Vienna, Austria, 27 Apr–2 May 2025, EGU25-6588, https://doi.org/10.5194/egusphere-egu25-6588, 2025.

High-resolution land use and land cover change (LULCC) products have become increasingly important in climate impact modelling. Simulating LULCC patterns on a fine scale enables us to uncover the intricate interconnections and heterogeneous characteristics inherent to terrestrial carbon and water cycles, as well as broader climate dynamics in the Anthropocene. Here, we present our recent advances in developing high-resolution LULCC datasets across multiple scales and their applications in various domains of climate impact modelling. By capturing the spatial heterogeneity of global and regional LULCC patterns, we illustrate how their spatiotemporal dynamics may evolve under diverse warming scenarios and the impacts of land-use changes on carbon sequestration, soil conservation, and land-atmosphere interactions. The outcomes highlight the critical role of spatially explicit LULCC datasets for advancing climate impact research and informing land-based adaptation strategies.

How to cite: Wu, X. and Cheng, C.: Developing high-resolution land use and land cover datasets to support climate impact modelling in the Anthropocene, EGU General Assembly 2025, Vienna, Austria, 27 Apr–2 May 2025, EGU25-7040, https://doi.org/10.5194/egusphere-egu25-7040, 2025.

EGU25-7051 | Orals | BG3.2

Exploring Climate Implications of Land-Cover Change in Europe Through High-Resolution Climate Modeling   

Luca Caporaso, Matteo Piccardo, Georgios Blougouras, Gregory Duveiller, Caspar Roebroek, Mirco Migliavacca, and Alessandro Cescatti

Afforestation and deforestation have profound and diverse biophysical and biogeochemical impacts on the climate system, especially in Europe, a region characterized by different climatic and ecological zones. As tree planting is often considered a viable way to increase carbon removal from the atmosphere, understanding these impacts is crucial for achieving the goals of the European Green Deal. This study aims to quantify the climate consequences of forest cover changes, evaluating both local and broader non-local biophysical interactions.

We use advanced regional climate modeling with a 5 km spatial resolution, using the Regional Climate Model (RegCM5) coupled with the Community Land Model (CLM4.5). Simulations include a baseline scenario and two scenarios representing afforestation and deforestation, covering 2004–2014. 

Key variables such as surface energy fluxes, air temperature, and radiative balances are analyzed to reveal the local and spillover effects of land use change. The high-resolution modelling approach captures spatial heterogeneity and provides detailed insights into temperature dynamics and energy flux variations across European landscapes.

The results reveal a marked asymmetry in the biophysical effects of afforestation and deforestation, with deforestation exerting a stronger signal than afforestation. This asymmetry depends on the initial forest cover conditions, underscoring the need for fine-scale assessments. These results underline the importance of guiding land use planning and policy formulation to ensure the development of sustainable and effective climate change strategies. This work contributes to climate adaptation and mitigation efforts by providing actionable insights for integrating advanced modelling tools into land management practices.

How to cite: Caporaso, L., Piccardo, M., Blougouras, G., Duveiller, G., Roebroek, C., Migliavacca, M., and Cescatti, A.: Exploring Climate Implications of Land-Cover Change in Europe Through High-Resolution Climate Modeling  , EGU General Assembly 2025, Vienna, Austria, 27 Apr–2 May 2025, EGU25-7051, https://doi.org/10.5194/egusphere-egu25-7051, 2025.

Terrestrial ecosystem carbon dynamics play a critical role in regulating the Earth system's carbon cycle, strongly influenced by atmospheric processes and land management policies. Climate change is transforming carbon cycling within ecosystems and their exchange with the atmosphere, while forest management policies are increasingly recognized as essential nature-based climate solutions. However, the long-term impacts of climate processes and forest management on carbon cycling—spanning historical, present, and future periods—remain poorly understood due to limitations in current modeling frameworks. This uncertainty hinders efforts to optimize forest management strategies and implement effective climate change mitigation measures.

To address these challenges, we employ the state-of-the-art compact Earth system model OSCAR to integrate carbon dynamics predictions from Dynamic Global Vegetation Models (DGVMs) and bookkeeping models. Using the GCB2023 dataset as a historical baseline, we drive the OSCAR model under a range of climate scenarios (i.e., SSP126 and SSP370) and land-use and land-cover change (LULCC) trajectories. Our analysis provides multi-scenario projections of terrestrial carbon fluxes, including regional and biome-specific annual carbon flux estimates through 2100. Additionally, we quantify the inertia of LULCC impacts and evaluate emissions from land-use changes under diverse socio-economic and forest policy pathways, and disentangle the relative contributions of environmental conditions and land-use policies to future carbon dynamics.

Our projections indicate that CO₂ concentrations drive long-term carbon sink trends, while climate variability predominately influences interannual fluctuations. In mid- to high-latitude regions, LULCC carbon balance exhibits minimal sensitivity to forest policies, acting as a modest carbon source or sink. Conversely, in low-latitude regions, robust forest policies are crucial to reversing the carbon source status associated with LULCC. Cumulative emissions from land use can be offset by carbon sinks arising from ecosystem restoration. These findings offer critical insights into the future trajectories of terrestrial carbon cycles and provide a foundation for developing targeted climate change mitigation strategies. Our dataset, which will be updated annually with the latest GCB assessments, serves as a valuable resource for global monitoring, policy evaluation, and strategy optimization.

How to cite: Zhang, D., Gasser, T., and Zheng, B.: Terrestrial Carbon Dynamics through 2100: Projections with OSCAR Highlighting Climate and Land Management Impacts, EGU General Assembly 2025, Vienna, Austria, 27 Apr–2 May 2025, EGU25-7385, https://doi.org/10.5194/egusphere-egu25-7385, 2025.


Golf courses have increasingly contributed to the economic growth of Vietnamese cities like Hanoi. However, their environmental impacts, particularly regarding land use and resource management, remain a concern. This study utilizes Sentinel-2 and Landsat satellite imagery, combined with Geographic Information Systems (GIS), to monitor golf courses in Hanoi’s metropolitan area. By evaluating two detection methods—Normalized Difference Vegetation Index (NDVI) analysis and feature recognition—we identify the strengths and limitations of these approaches in urban settings. While NDVI is constrained by similar vegetation signatures in tropical climates, feature recognition captures distinct golf course characteristics. The findings contribute to sustainable urban land use planning and highlight the potential of advanced remote sensing technologies in environmental conservation.

How to cite: Nguyen, K.-A. and Liou, Y. A.: Monitoring Hanoi's Golf Courses Using Remote Sensing and Machine Learning for Sustainable Land Use Planning, EGU General Assembly 2025, Vienna, Austria, 27 Apr–2 May 2025, EGU25-7746, https://doi.org/10.5194/egusphere-egu25-7746, 2025.

EGU25-7768 | ECS | Posters on site | BG3.2

Modeling the effects of vegetation greening on frozen ground over the Qinghai-Tibet Plateau 

Yuxuan Wang and Siqiong Luo

Vegetation greening on the Qinghai-Tibet Plateau (QTP) plays a crucial role in altering the energy balance and frozen ground conditions. As vegetation cover increases, albedo decreases, leading to surface warming. This study used high-resolution land-use datasets from different time periods to parameterize plant functional types (PFTs) on the QTP and conducted sensitivity simulations with the RegCM5.0-CLM4.5 model. By comparing land cover changes (LCC) across different years, the study evaluated the effects of vegetation greening on energy balance and frozen ground dynamics. The results show that LCC caused significant warming, with land surface temperature (LST) increasing by 0.10°C in 2000 and 0.36°C in 2020.  Soil temperature (ST) changes were observed as deep as 280 cm, with the largest variations between 2 cm and 100 cm depths, leading to increases of 0.07°C (in 2000) and 0.31°C (in 2020).  This warming intensified frozen ground thawing, expanding thawing regions and shrinking freezing areas.  Variations in LST and energy flux components were regionally dependent, influenced by meteorological factors and circulation patterns.  The findings underscore that vegetation greening, by reducing albedo, reshapes energy fluxes, increasing air temperature, LST, and ST, while accelerating thawing and reducing freezing in frozen ground regions.

How to cite: Wang, Y. and Luo, S.: Modeling the effects of vegetation greening on frozen ground over the Qinghai-Tibet Plateau, EGU General Assembly 2025, Vienna, Austria, 27 Apr–2 May 2025, EGU25-7768, https://doi.org/10.5194/egusphere-egu25-7768, 2025.

A significant portion of terrestrial surface water is returned to the atmosphere through vegetation transpiration, making vegetation dynamics—such as deforestation, reforestation, and Earth’s greening—a critical driver of land evapotranspiration and vegetation-climate feedbacks. However, Earth system models (ESMs) exhibit substantial discrepancies in simulating the direction and magnitude of vegetation effects on evaporation. These inconsistencies stem from the heterogeneity of land-cover changes and limitations in ground-based observations, which complicate the quantification of these responses. In this study, we identify key disparities among ESMs in simulating evaporation and transpiration responses to vegetation changes, which lead to divergent predictions of climate feedbacks. A central issue is the persistent underestimation of the transpiration-to-evaporation ratio (Et/E), despite observational evidence indicating that transpiration dominates terrestrial evaporation fluxes. This underestimation is further compounded by inadequate representations of groundwater processes and limited soil depth in models, which restrict the availability of water for vegetation transpiration. To address these shortcomings, we propose the integration of enhanced observation-based constraints on model sensitivity, improved transpiration parameterizations, and the explicit inclusion of groundwater processes in ESMs. These advancements are essential for reducing uncertainties in vegetation-climate feedback projections and improving the accuracy of Earth system modeling.

How to cite: Zeng, Z. and Liu, X.: Modelled Sensitivity of Evapotranspiration to Vegetation Change: Reconciling Observations and Earth System Models, EGU General Assembly 2025, Vienna, Austria, 27 Apr–2 May 2025, EGU25-7853, https://doi.org/10.5194/egusphere-egu25-7853, 2025.

EGU25-9004 | ECS | Orals | BG3.2

Forest fragmentation increased in over half of global forests during years 2000-2020 

Yibiao Zou, Thomas Crowther, Gabriel Smith, Haozhi Ma, Lidong Mo, Lalasia Bialic-Murphy, Peter Potapov, Klementyna Gawecka, Chi Xu, Pablo Negret, Thomas Lauber, Zhaofei Wu, Dominic Rebindaine, and Constantin Zohner

Deforestation leads to habitat fragmentation, which adversely affects global biodiversity. Although some studies, using a separation-focused definition, have reported a decrease in fragmentation across 75% of the world's forests over recent decades, a comprehensive and ecologically relevant understanding of global fragmentation patterns remains lacking. In this study, we analyzed global fragmentation trends from 2000 to 2020, employing metrics that emphasize connectivity, aggregation, or separation. Connectivity-focused metrics reveal that 51% of global forests, particularly in tropical regions (58%), have undergone increased fragmentation—a rate nearly double that suggested by previous separation-focused metrics. This increase is corroborated by aggregation-focused metrics, which indicate heightened fragmentation in approximately 58% of forests worldwide and across all biomes. Further analysis attributes this escalation primarily to human activities, such as shifting agriculture and logging. Importantly, tropical protected areas have exhibited reductions in fragmentation by up to 82% compared to non-protected areas, underscoring the success of conservation efforts in these regions.

How to cite: Zou, Y., Crowther, T., Smith, G., Ma, H., Mo, L., Bialic-Murphy, L., Potapov, P., Gawecka, K., Xu, C., Negret, P., Lauber, T., Wu, Z., Rebindaine, D., and Zohner, C.: Forest fragmentation increased in over half of global forests during years 2000-2020, EGU General Assembly 2025, Vienna, Austria, 27 Apr–2 May 2025, EGU25-9004, https://doi.org/10.5194/egusphere-egu25-9004, 2025.

EGU25-9338 | ECS | Orals | BG3.2

Urbanization amplifies continental- to regional-scale warming 

Tirthankar (TC) Chakraborty and Yun Qian

Urbanization has traditionally been overlooked while estimating past changes in large-scale climate and is not resolved in future climate projections. This is due to the small fraction of Earth's surface historically covered by cities, the lack of representation of urban areas in most climate and Earth system models, and observational practices that try to minimize the influence of urban heat islands on the climate signal. In this study, we integrate global land surface temperature observations, which avoid many of the sampling pitfalls of ground-based weather station data, with historical urban area estimates to reveal that the urban contribution to continental- and regional-scale warming has become more significant over time, particularly in rapidly urbanizing regions and countries in Asia. Our findings suggest that anticipated urban expansion over the next century will further amplify the urban influence on large-scale surface climate, with projections indicating an approximate increase of 0.16 K for North America and Europe under a high-emission scenario by 2100. Consequently, we propose that urbanization, akin to other forms of land use/land cover change, must be explicitly included in climate change assessments. This inclusion necessitates the integration of dynamic urban extent and biophysical processes into current-generation Earth system models, enabling the quantification of potential urban feedback on the climate system across various scales.

How to cite: Chakraborty, T. (. and Qian, Y.: Urbanization amplifies continental- to regional-scale warming, EGU General Assembly 2025, Vienna, Austria, 27 Apr–2 May 2025, EGU25-9338, https://doi.org/10.5194/egusphere-egu25-9338, 2025.

EGU25-9521 | Orals | BG3.2

Modelling land-use dynamics in Western Sahel since 1960 

Anem Dupre, Isabelle Gounand, Paul-Alain Raynal, and Caroline Pierre

Climate change and demographic growth are particularly acute in the Sahel, jeopardizing the sustainability of human land-uses. This call for research to provide relevant outputs to support policy-making in this area, especially in terms of land management and land degradation. In the Sahel, detailed observations of land use dynamics and drivers are scarce and existing global land-use models have difficulty representing it. One regional model has been developed by Stephenne and Lambin (2001) to fit the regional characteristics of Sahelian land use (SALU).

This communication explains how we adapted this model to the current state of the art to reconstruct past land-use dynamics in Senegal from 1961 to 2020. For that purpose, we warried out an extensive bibliographic search to obtain the most updated ranges for parameter values. We performed an in-depth analysis of the model's sensitivity to parameter uncertainties through delta-indices calculation. When applying the new model at national scale to Senegal, the so-obtained trends were consistent with available literature, exhibiting first agricultural expansion leading to deforestation, and then a switch to intensification in the mid-1990s, which affected both livestock forage consumption and fallow duration.

Finally, we apply the new model to a sub-region of Senegal: the Groundnut basin, that concentrates a large proportion of the national land-demand. This case-study showed the limits of the model when downscaling, as these demands were too high to be satisfied by the local production. This study thus opens perspectives for the refinement of landuse modelling in the Sahel, including for prospective scenarios addressing the future decades.

How to cite: Dupre, A., Gounand, I., Raynal, P.-A., and Pierre, C.: Modelling land-use dynamics in Western Sahel since 1960, EGU General Assembly 2025, Vienna, Austria, 27 Apr–2 May 2025, EGU25-9521, https://doi.org/10.5194/egusphere-egu25-9521, 2025.

EGU25-9934 | ECS | Posters on site | BG3.2

 Impact of Liming on Soil CO2 Emissions and Oil Palm Physiology in Tropical Peatlands 

M. B. Nicodemus Ujih, Rosazlin Abdullah, Akira Watanabe, Faustina Sangok, Nur Azima Busman, and Lulie Melling

Southeast Asia hosts the largest areas of tropical peatland in the world, with Malaysia’s contribution being significant, covering approximately 2.7 million hectares. Many of these areas have been converted to oil palm plantations and face distinctive challenges due to the high acidity of peat soil, about pH 3.3 – 3.5. Liming is implemented to decrease soil acidity and enhance soil fertility. However, the impact of liming on soil CO2 emissions and oil palm physiology in tropical peatlands remains underexplored. This study investigates the effects of liming on soil CO2 emissions and oil palm physiological variables such as assimilation rate (A), stomatal conductance (Gsw), intercellular CO2 concentration (Ci), transpiration (E), and intrinsic water use efficiency (iWUE) on tropical peat soils. The experiment was arranged in a randomized complete block design with four liming treatments: 0 (T1), 2 (T2), 4 (T3), and 8 (T4) t ha⁻¹. Soil pH increased significantly with an increase in lime application. The soil CO2 emission was significantly higher in T4 (203 g C m-2 yr-1), followed by T3 (184 g C m-2 yr-1), T2 (140 g C m-2 yr-1) and T1 (111 g C m-2 yr-1). Similarly, assimilation rate (A)exhibited significant differences across treatments, with T4 recorded the highest rate (15.1 µmol m-² s-¹), and the lowest is T1 (10.8 µmol m-² s-¹). Conversely, Gsw was higher in the T1 (0.32 mol m-² s-¹) than T4 (0.24 mol m-² s-¹). Soil CO2emissions positively correlated (p < 0.01) with soil pH, A, Ci, and chlorophyll content. In contrast, a significant negative correlation (p < 0.01) was observed with Gsw, and E. These findings highlight that liming improves soil acidity, and oil palm physiological variables but also accelerates soil carbon loss as CO2 emissions.

How to cite: Ujih, M. B. N., Abdullah, R., Watanabe, A., Sangok, F., Busman, N. A., and Melling, L.:  Impact of Liming on Soil CO2 Emissions and Oil Palm Physiology in Tropical Peatlands, EGU General Assembly 2025, Vienna, Austria, 27 Apr–2 May 2025, EGU25-9934, https://doi.org/10.5194/egusphere-egu25-9934, 2025.

EGU25-10035 | ECS | Orals | BG3.2

Trade-Offs and Synergies between Climate Change, Biodiversity, and Agricultural Economy Across Various Future Land Use Scenarios in Brazil. 

Thomas Gérard, Sietze Norder, Judith Verstegen, Jonathan Doelman, Stefan Dekker, and Floor Van der Hilst

Land-use change is a major driver of biodiversity loss and a key contributor to greenhouse gas emissions, making it crucial to mitigate climate change and preserve biodiversity. This is especially relevant for Brazil, where agricultural expansion impacts biodiversity- and carbon-rich biomes. Achieving Brazil's commitments to the Paris Agreement and the Convention on Biological Diversity requires balancing agroeconomic development with biodiversity preservation and climate change mitigation. However, more comprehensive information is needed on land-use trade-offs and synergies across varying global change contexts. To address this gap, we quantified trade-offs and synergies among these objectives through 2050 under three land-use change scenarios in Brazil. We assessed the impact of each scenario by estimating spatial changes in carbon stock, mammal distributions, and agricultural revenue. Our results confirm that agricultural growth in Brazil occurs at the expense of biodiversity preservation and climate change mitigation, and vice versa. The primary drivers of these trade-offs and synergies are changes in natural vegetation cover and agricultural land, led by global demand for agricultural products. Under a SSP3-7.0 scenario, rising demand for agricultural products from 2015 to 2050 is projected to expand agriculture into natural areas. This pathway increases Brazil's agricultural revenue by $39.7 billion USD annually but reduces land carbon stock by 4.5 Gt and shrinks mammal distribution areas by 3.4%. Conversely, the SSP1-1.9 scenario projects declining agricultural demand over the same period, driving the reconversion of agricultural land to natural vegetation. This shift increases carbon stock by 5.6 Gt and expands mammal distribution areas by 6.8%, though it would lower agricultural revenue by $19.7 billion USD annually. Our findings further highlight that containing agriculture outside biodiversity- and carbon-rich areas, along with strategic ecosystem restoration, presents opportunities to harmonize agroeconomic development with biodiversity preservation and climate change mitigation.

How to cite: Gérard, T., Norder, S., Verstegen, J., Doelman, J., Dekker, S., and Van der Hilst, F.: Trade-Offs and Synergies between Climate Change, Biodiversity, and Agricultural Economy Across Various Future Land Use Scenarios in Brazil., EGU General Assembly 2025, Vienna, Austria, 27 Apr–2 May 2025, EGU25-10035, https://doi.org/10.5194/egusphere-egu25-10035, 2025.

Forest gain in the tropics is always assumed to cool land surface as much as the warming induced by forest loss. However, the observations from multiple satellites show that the impacts of forest gain on local land surface temperature are robustly weaker than forest loss. This asymmetry comes from the contrasting changes of vegetation properties, which are verified by vegetation indices. Forest loss which is primarily caused by intense disturbances such as fire and deforestation, could result in the rapid change of biophysical processes, while forest gain is mainly related to vegetation regrowth, whose changes are not often that rapid. These asymmetric effects of forest gain and loss are not well represented in current Earth system models because of the fixed biophysical parameters used, thus could lead to the overestimation of the climatic mitigation of forestation in the future, especially in a short period. This highlights the necessity to improve the representation of forest demographic on biophysical vegetation properties for better projecting the climate benefits of future forestation.

How to cite: Zhang, Y.: Asymmetric impacts of tropical forest gain and loss on temperature due to forest growth revealed by satellite observation, EGU General Assembly 2025, Vienna, Austria, 27 Apr–2 May 2025, EGU25-10306, https://doi.org/10.5194/egusphere-egu25-10306, 2025.

EGU25-10669 | ECS | Posters on site | BG3.2

Mapping the Spatial Distribution of Anthropogenic Forest Disturbances in China from 1986 to 2020 

Yanwen Zhang and Shuangcheng Li

Forests have substantial potential to mitigate climate change through carbon sequestration and to deliver important co-benefits to society. Long-term datasets on anthropogenic forest disturbances are vital for understanding their impacts on terrestrial carbon budgets, hydrothermal balance, and climate regulation. However, there is currently no quantitative information regarding the patterns and trends of anthropogenic forest disturbances in China.

In this study, we developed a comprehensive forest disturbance dataset for China by integrating Landsat imagery with the LandTrend algorithm, thus capturing spatiotemporal changes in forest disturbances from 1986 to 2020. We then used socioeconomic and environmental satellite data and direct sources such as statistical yearbooks to identify anthropogenic forest disturbance information, applied LightGBM model to reconstruct their spatial patterns and evaluate key driving factors. Our results indicate that approximately 37% of China’s forests experienced disturbances over the past three decades. Following the implementation of national forest protection measures, increased timber imports, and logging quota management after 1990, anthropogenic forest disturbances declined markedly. Between 1990 and 2000, anthropogenic activities led to a forest loss of 4.601 × 10⁴ km2, including a notable increase in forest loss in the Pearl River Delta region as a result of urbanization. In terms of the other drivers of forest loss, more than 80% of forest losses were linked to forestry-related activities, with additional contributions from commodity-driven deforestation and shifting agriculture.

The high-resolution, systematically developed anthropogenic forest disturbance dataset presented in this study offers critical baseline data for forest ecology research particularly in the context of China. It further supports national strategies aimed at addressing climate change, enhancing the monitoring of human-induced forest disturbances, and safeguarding forest carbon sinks.

How to cite: Zhang, Y. and Li, S.: Mapping the Spatial Distribution of Anthropogenic Forest Disturbances in China from 1986 to 2020, EGU General Assembly 2025, Vienna, Austria, 27 Apr–2 May 2025, EGU25-10669, https://doi.org/10.5194/egusphere-egu25-10669, 2025.

EGU25-11170 | ECS | Posters on site | BG3.2

Evaluating soil CO2 fluxes during the transition from peat swamp forest to an oil palm plantation 

Nur Azima Busman, Muhammad Zarul Shazreen, Faustina E. Sangok, Akira Watanabe, and Lulie Melling

The conversion of tropical peat swamp forests to oil palm plantations has significant implications for soil CO2 emissions. However, the extent of these changes remains highly uncertain, particularly across different stages of land-use conversion at a single site. Therefore, in this study, we present continuous measurements of soil CO2 flux, environmental conditions, and soil chemical properties from a peat swamp forest in Malaysia undergoing conversion to an oil palm plantation. The study, conducted from January 2011 to April 2022, encompasses three distinct phases: peat swamp forest (Jan 2011–Feb 2017), land preparation involving drainage, land clearing, and mechanical compaction (Mar 2017–Apr 2018), and oil palm plantation (May 2018–Apr 2022). Soil CO2 flux was measured on a monthly basis using the manual chamber method, and variations in environmental and soil chemical properties were also measured. Drainage during land preparation lowered the groundwater level (GWL) from −6.4 cm before conversion to −83.5 cm. The GWL further dropped to −112.8 cm in the first year of planting, then gradually increased from the second to the fourth year, reaching −65.7 cm. Air and soil temperatures also increased following conversion, peaking during the second year before starting to decrease in the third year of planting, possibly due to the growing of oil palm canopy. Soil total carbon and nitrogen contents remained unchanged throughout the study period, while the degree of humification and ash content increased after planting. Soil CO2 fluxes before conversion ranged from 30 to 403 mg C m−2 h−1, with no significant changes observed during land preparation (136–397 mg C m−2 h−1). However, soil CO2 fluxes increased during the first to the third year of oil palm planting (140–619 mg C m−2 h−1), followed by a decrease in the fourth year (140–368 mg C m−2 h−1). This decline may suggest that most of the labile carbon may have been lost during the first three years after planting. However, as this trend was observed only over one year, continued monitoring should be done. Soil CO2 flux showed a negative correlation with GWL before the conversion, but no such correlation was observed after conversion. This is likely due to the smaller variation in GWL following conversion, which is maintained by plantation management practices. Overall, our long-term measurements provide valuable insights into the temporal dynamics of soil CO2 flux during the conversion of tropical peat swamp forests to oil palm plantations, allowing for a more robust evaluation of the impacts of conversion.

How to cite: Busman, N. A., Shazreen, M. Z., Sangok, F. E., Watanabe, A., and Melling, L.: Evaluating soil CO2 fluxes during the transition from peat swamp forest to an oil palm plantation, EGU General Assembly 2025, Vienna, Austria, 27 Apr–2 May 2025, EGU25-11170, https://doi.org/10.5194/egusphere-egu25-11170, 2025.

EGU25-11262 | ECS | Orals | BG3.2

Impacts of land use and land cover change on blue and green water resources availability 

Simon P. Heselschwerdt and Peter Greve

Ongoing anthropogenic climate change and other human interventions increasingly interfere with freshwater availability and its distribution. Land use, land management, and land cover change (LULCC), in particular, shapes water resources by altering the partitioning of precipitation into green and blue water. Yet, a comprehensive understanding of how LULCC influences global precipitation partitioning is lacking. We address this gap by employing the Blue-Green Water Share (BGWS) metric, which quantifies water partitioning dynamics using monthly precipitation data, while monthly runoff and transpiration data serve as proxies for blue and green water flows. Using simulations from the Land Use Model Intercomparison Project (LUMIP), a component of the Coupled Model Intercomparison Project Phase 6 (CMIP6), we evaluate how LULCC impacts precipitation partitioning. Historical land use change impacts are isolated using simulations without land use change (hist-noLu). Additionally, we assess the effects of different land use scenarios on the BGWS under the Shared Socioeconomic Pathways (SSPs) 1-2.6 and 3-7.0 (ssp370ssp126Lu and ssp126ssp370Lu). Regression analysis and variable importance computations are performed to identify key drivers of BGWS trends, comparing the relative contributions of LULCC and climatic factors to shifts in green and blue water flows. Our results highlight the critical need to understand green and blue water dynamics for sustainable water resource management in the face of changing climatic and land use conditions. By advancing our knowledge of the hydrological consequences of LULCC, this research provides actionable insights to inform land-based climate mitigation and adaptation strategies.

How to cite: Heselschwerdt, S. P. and Greve, P.: Impacts of land use and land cover change on blue and green water resources availability, EGU General Assembly 2025, Vienna, Austria, 27 Apr–2 May 2025, EGU25-11262, https://doi.org/10.5194/egusphere-egu25-11262, 2025.

Land management is a critical component of human activities; however, due to the lack of data and methodological limitations, its influence on vegetation change has been challenging to identify and quantify. Existing models are insufficient in effectively describing these processes, while observation-based comparative analyses often rely on grid-walking methods, which fail to provide a clear depiction of land management processes at the regional scale. The Paired Land Use Experiment (PLUE) theory draws inspiration from the paired watershed approach by selecting regions with significant differences in land management but consistent climate change to create a land management control experiment. This theory has undergone validation in multiple regions. This report introduces the application of the PLUE method in various case studies, highlighting the significant impact of land management on vegetation change. Moving forward, these land management processes are suggested to be integrated as submodules within models to enable broader and more systematic research.

How to cite: Chen, T. and Chen, X.: Advancements in the Paired Land Use Experiment Method for Land Management Research, EGU General Assembly 2025, Vienna, Austria, 27 Apr–2 May 2025, EGU25-12325, https://doi.org/10.5194/egusphere-egu25-12325, 2025.

EGU25-12983 | ECS | Orals | BG3.2

Biophysical impacts of afforestation over Europe on atmospheric dryness – a simulation study 

Georgios Blougouras, Luca Caporaso, Shijie Jiang, Markus Reichstein, Alessandro Cescatti, Alexander Brenning, and Mirco Migliavacca

Afforestation is widely considered as a key nature-based strategy for mitigating climate change, due to the carbon sequestration potential of forests. While much focus has been on the benefits of carbon sinks, afforestation also induces biophysical changes that can influence the energy budget and the water cycle. A key atmospheric variable potentially affected by these biophysical changes is vapour pressure deficit (VPD), which has a critical role in terrestrial ecosystem functioning, by affecting plant dynamics, growth and health. Through its role in vegetation dynamics, VPD strongly affects land-atmosphere interactions, water and carbon fluxes, and is critical to understanding how ecosystems respond to environmental changes. However, the atmospheric response of VPD to afforestation remains insufficiently explored, and depends on both temperature and absolute humidity. To this end, we performed high-resolution (5km) convection-permitting simulations over a European domain, coupling a regional climate model (RegCM5) with a land surface model (CLM4.5). We focus on the biophysical impacts of changing vegetation cover to VPD, by keeping the CO2 mixing ratio constant. We analyse the resulting VPD changes and explore how temperature and absolute humidity respond to vegetation changes, both at a local and non-local level. Counterintuitively, despite increases in the forest cover over Europe, the VPD experiences small but consistent increases. This suggests that the evapotranspiration changes from the increased forest cover cannot compensate for the higher temperature-induced capacity of the atmosphere to retain moisture, which is driven by changes in the energy budget. To assess possible negative VPD-induced influences of afforestation, we investigate the implications of the new VPD regimes for different plant functional types (PFTs) across European climate types. Our findings contribute to a more nuanced understanding of the biophysical impacts of afforestation and offer actionable insights for climate change mitigation strategies.  

How to cite: Blougouras, G., Caporaso, L., Jiang, S., Reichstein, M., Cescatti, A., Brenning, A., and Migliavacca, M.: Biophysical impacts of afforestation over Europe on atmospheric dryness – a simulation study, EGU General Assembly 2025, Vienna, Austria, 27 Apr–2 May 2025, EGU25-12983, https://doi.org/10.5194/egusphere-egu25-12983, 2025.

EGU25-14059 | ECS | Posters on site | BG3.2

Scenario Dependence of Biogeochemical and Biogeophysical Effects of Reforestation  

Koramanghat Unnikrishnan Jayakrishnan, Alexander MacIsaac, and Kirsten Zickfeld

Reforestation is a widely considered nature-based method for climate mitigation. The net effect of reforestation on the climate system has two components: i) biogeochemical and ii) biogeophysical effects. The biogeochemical effect of reforestation involves the radiative cooling from the reduction in atmospheric CO2 concentration due to additional carbon storage on land. The biogeophysical effects are due to the changes in energy and moisture balances at the surface associated with reforestation. For example, the changes in land surface albedo due to reforestation modifies the surface energy balance, and consequently, affects the climate response. We hypothesize that both the biogeochemical and biogeophysical effects of reforestation are scenario dependent. The scenario dependence of biogeochemical effects could arise from different amount of additional carbon storage on land in different scenarios (larger CO2 fertilization in higher emission scenarios could lead to larger storage of carbon on land), while differences in the climate feedbacks such as the snow albedo feedback could result in scenario dependence of biogeophysical effects. In this study, we investigate the scenario dependence of biogeochemical and biogeophysical effects of reforestation by performing three sets of simulations with an Earth system model of intermediate complexity. The first set are baseline scenarios in which fossil fuel emissions, non-CO2 greenhouse gas forcing and aerosol forcing prescribed from different SSP scenarios with land use change fixed at 2020 values. The second and third sets involve emission and concentration driven reforestation experiments (each implemented with different SSP scenarios) designed for separating the biogeochemical and biogeophysical effects of reforestation.  

We find that biogeochemical effects show strong scenario dependence (Figure 1). Further, biogeochemical effects do not increase monotonically, despite the increase in additional carbon storage on land with the increase in background emissions. The non-monotonic behavior of the biogeochemical cooling effects is because of the logarithmic dependence of radiative forcing on atmospheric CO2 concentration and the saturation of the land carbon sink at higher emission levels. Biogeophysical effects are also non-monotonic in response to the increase in background emissions, however, they exhibit less scenario dependence than biogeochemical effects (Figure 1). Our results show that the effectiveness of reforestation for climate mitigation declines under high emission scenarios. Therefore, immediate cessation of fossil fuel emissions not only stabilizes the climate but also enhances the climate mitigation potential through reforestation.

Figure 1. The a) net, b) biogeochemical and c) biogeophysical effects of reforestation in five different SSP Scenarios.

How to cite: Jayakrishnan, K. U., MacIsaac, A., and Zickfeld, K.: Scenario Dependence of Biogeochemical and Biogeophysical Effects of Reforestation , EGU General Assembly 2025, Vienna, Austria, 27 Apr–2 May 2025, EGU25-14059, https://doi.org/10.5194/egusphere-egu25-14059, 2025.

EGU25-14168 | ECS | Orals | BG3.2

Ocean dynamics amplify non-local warming effects of forestation 

Pierre Etienne Banville, Alexander MacIsaac, and Kirsten Zickfeld

Large-scale forestation, including reforestation, afforestation, and forest restoration, is prevalent in net zero climate strategies due to the carbon sequestration potential of forests. In addition to capturing carbon, forestation has biogeophysical effects, such as changes in albedo, that can influence surface temperatures locally (local effects), and at distant locations (non-local effects). Biogeophysical effects may offset the cooling benefits of carbon sequestration, hence requiring a robust understanding of their mechanisms to adequately integrate forestation into climate mitigation strategies and carbon accounting frameworks. Yet, the role of ocean dynamics, such as ocean circulation, ocean-atmosphere interactions, and ocean-sea ice interactions in driving non-local effects remains underexplored. In this study, we investigate the impact of ocean dynamics on the magnitude and geographic patterns of the non-local biogeophysical effects of large-scale forestation over a multicentury timescale using the University of Victoria Earth System Climate Model (UVic ESCM), an Earth System Model of Intermediate Complexity (EMIC). We conduct multicentury paired global forestation simulations, with the first simulation using a dynamic ocean (Dynamic Ocean Simulation) and the second using prescribed sea surface temperatures (Prescribed SST Simulation). To be able to separate local from non-local effects, we use the checkerboard approach in both simulations, alternating grid cells undergoing forestation (subject to local and non-local effects) with grid cells remaining deforested (subject to non-local effects only), and compare land surface temperature to a control simulation where all grid cells remain deforested. Using the model simulation data, we perform a surface energy balance decomposition for each simulation at multiple points in time. After a 500-year period, we find a non-local warming effect on land surface temperature in both the Dynamic Ocean Simulation and the Prescribed SST Simulation. However, these non-local warming effects are of much greater magnitude and encompass a greater geographic area, particularly at high latitudes, in the Dynamic Ocean Simulation compared to the Prescribed SST Simulation. Moreover, in the Dynamic Ocean Simulation, non-local warming effects on land continue to strengthen for multiple centuries after most of the forest has regrown and local effects have stabilized. This prolonged land surface warming is the result of a gradual increase in sea surface temperature over multiple centuries caused by ocean-atmosphere interactions combined with the ocean’s thermal inertia. Furthermore, the ocean warming is amplified by climate feedback mechanisms, including the water vapor feedback, fueled by ocean evaporation, and the sea ice-albedo feedback. Consequently, forestation has non-local warming effects that develop gradually and intensify over multiple centuries due to interactions within the Earth system. Net zero policies and carbon accounting frameworks must therefore consider the complete Earth system response over a sufficiently long timeframe to include the slow ocean’s response. Without the consideration of the full Earth system response, net zero policies relying heavily on forestation may not deliver on their climate objectives.

How to cite: Banville, P. E., MacIsaac, A., and Zickfeld, K.: Ocean dynamics amplify non-local warming effects of forestation, EGU General Assembly 2025, Vienna, Austria, 27 Apr–2 May 2025, EGU25-14168, https://doi.org/10.5194/egusphere-egu25-14168, 2025.

EGU25-14933 | ECS | Orals | BG3.2

Hydrologic Cycle Impacts of Large-Scale Reforestation at Global and Regional Scales 

Marzieh Mortezapour, Kirsten Zickfeld, and Vivek Arora

Reforestation is a key nature-based solution for mitigating climate change. However, changes in land cover through reforestation can significantly influence the climate and hydrological cycle, affecting water availability and other critical components of the Earth system. Understanding these impacts is essential for developing effective climate adaptation strategies and ensuring sustainable land management in the coming decades.

This study leverages simulations with the Canadian Earth System Model (CanESM5.1), a state-of-the-art Earth system model, to quantify hydrological responses to two large-scale reforestation scenarios. The first scenario reverses historical deforestation, restoring tree cover to pre-industrial levels by the year 2070, while the second implements a sustainable reforestation strategy by the same year. To isolate the effects of reforestation, a reference simulation with land-cover fixed at the year 2015 configuration is also conducted. The study employs a two-stage simulation framework—historical (1850–2015) and future (2015–2200)—with multiple ensemble members, using SSP1-2.6 forcing to align with the Paris Agreement’s climate goals.

Preliminary results reveal that large-scale reforestation induces statistically significant climate and hydrological responses at both regional and global scales. These findings highlight the potential for unintended consequences of land-based climate mitigation strategies, emphasizing the need for holistic assessments to guide future land management and policy decisions.

How to cite: Mortezapour, M., Zickfeld, K., and Arora, V.: Hydrologic Cycle Impacts of Large-Scale Reforestation at Global and Regional Scales, EGU General Assembly 2025, Vienna, Austria, 27 Apr–2 May 2025, EGU25-14933, https://doi.org/10.5194/egusphere-egu25-14933, 2025.

Urbanization worldwide has resulted in a substantial increase in abandoned rural settlements, presenting a unique opportunity to enhance food security and mitigate climate change. Here we quantify the potential of these underutilized lands for optimized agricultural production and carbon sequestration, using China as a compelling case study. Leveraging high-resolution Night-Time Light (NTL) data from LuoJia1-01, we identify approximately 5.66 Mha of abandoned settlements across rural China, representing 38.05% of all rural settlements. We employ a probabilistic multi-objective spatial optimization of land use (pMOLU) model to strategically allocate these lands between reclamation for agriculture and afforestation, maximizing both food production and carbon sequestration under various scenarios. The results reveal that reclaiming abandoned settlements could yield an additional 9–21 Mt of food annually, while reforestation efforts could sequester 5–14 Mt of carbon per year. Furthermore, we propose a spatial prioritization strategy for the phased implementation of consolidation across the country and evaluate its beneficial impacts on food security and climate goals.The findings underscore the untapped potential of abandoned rural settlements for promoting sustainable development and offer a robust framework for optimizing land-use decisions in China and beyond.

How to cite: Wang, T.:  Unleashing the Potential of Abandoned Rural Settlements for Optimized Food and Climate Goals, EGU General Assembly 2025, Vienna, Austria, 27 Apr–2 May 2025, EGU25-16199, https://doi.org/10.5194/egusphere-egu25-16199, 2025.

EGU25-16459 | ECS | Posters on site | BG3.2

Evaluating physical and biogeochemical climate effects of boreal forests with EC-Earth 

Laura Thölix, Tommi Bergman, Risto Makkonen, Kalle Nordling, Antti-Ilari Partanen, and Joonas Merikanto

Boreal forests are particularly important for carbon storage. A warmer climate, combined with the expansion of these forests, is expected to enhance their role as carbon sinks in the future. Deforestation, where forests are replaced by crops and pastures, strongly affects land surface albedo and transpiration, leading to substantial carbon emissions into the atmosphere—a key driver of climate change.

In this study, we investigate the impacts of boreal forests on future climate using EC-Earth with full carbon cycle and prescribed CO2 concentration. EC-Earth-Veg captures the physical effect mechanisms, while EC-Earth-CC incorporates both physical and biogeochemical effect. The biogeochemical effect can be isolated and quantified from these results.

Globally, the temperature responses to deforestation due to physical and biogeochemical effects largely cancel each other, but locally, deforestation has a large (more than 1°C in annual mean) impact on annual temperatures over deforested regions, accompanied with a marked expansion of Arctic sea ice.

How to cite: Thölix, L., Bergman, T., Makkonen, R., Nordling, K., Partanen, A.-I., and Merikanto, J.: Evaluating physical and biogeochemical climate effects of boreal forests with EC-Earth, EGU General Assembly 2025, Vienna, Austria, 27 Apr–2 May 2025, EGU25-16459, https://doi.org/10.5194/egusphere-egu25-16459, 2025.

EGU25-16490 | ECS | Orals | BG3.2

Climate Mitigation Potential of Targeted Forestation Considering Climate Change, Fires, and Albedo Effects 

Dashan Wang, Shijing Liang, and Zhenzhong Zeng

Afforestation and reforestation are widely recognized as effective strategies for mitigating anthropogenic climate change. However, satellite-based assessments of their carbon sequestration potential remain uncertain, particularly when accounting for the dynamic nature of climate conditions, vegetation-climate feedbacks, fire-related disturbances, and the trade-offs posed by surface albedo changes. Using a coupled Earth system model, we estimate that optimal global forestation could sequester 31.3-69.2 Pg C between 2021 and 2100 under a sustainable shared socioeconomic pathway. Regionally, the greatest mitigation potential is found in tropical areas, while mid- to high-latitude regions exhibit higher heterogeneity, emphasizing the need for tailored strategies and further refinement of nature-based mitigation plans. Our findings highlight the critical role of considering disturbances, such as fires, and minimizing adverse albedo effects in the estimation of carbon mitigation potential from targeted forestation. We also advocate for the development of high-resolution, consistent maps identifying suitable forestation areas, with a focus on avoiding environmentally sensitive lands and minimizing conflicts with other human activities.

How to cite: Wang, D., Liang, S., and Zeng, Z.: Climate Mitigation Potential of Targeted Forestation Considering Climate Change, Fires, and Albedo Effects, EGU General Assembly 2025, Vienna, Austria, 27 Apr–2 May 2025, EGU25-16490, https://doi.org/10.5194/egusphere-egu25-16490, 2025.

EGU25-16539 | ECS | Orals | BG3.2

How do trees impact cloud formation across Africa: the role of their spatial distribution 

Di Xie, Luca Caporaso, Markus Reichstein, Deyu Zhong, and Gregory Duveiller

Vegetation plays a crucial role in regulating climate and sustaining the hydrological cycle. Preserving and expanding tree cover is potentially vital for mitigating climate change, as both the amount and spatial distribution of trees influence surface and atmospheric processes. While the direct effects of vegetation on surface properties are relatively well-studied, the indirect biophysical impacts of trees on cloud formation—particularly from trees outside forested areas—remain less explored, with the role of tree spatial patterns often overlooked. In this study, we used a space-for-time approach, high-resolution tree cover maps, and geostationary satellite data to investigate how tree cover, including its extent and spatial configuration, affects daytime and nighttime cloud formation across Africa. Our findings reveal distinct regional and temporal patterns: during the day, increased tree cover enhances cloud cover over tropical rainforests and arid steppes but reduces it over tropical savannahs. At night, a stronger negative relationship between tree cover and cloud formation emerges during the dry season, particularly in high-elevation areas of southern Africa. Mechanistically, these patterns are closely tied to sensible heat fluxes in water-abundant regions and to moisture availability in water-limited areas during the day, while nighttime cloud effects are linked to tree-induced variations in land surface temperature, likely through enhanced condensation on cooler surfaces. Incorporating tree cover heterogeneity alongside average tree cover offers further insights: in tropical savannahs, cloud formation is enhanced by 55.2% when heterogeneity is considered, compared to using tree cover alone, while in arid steppes, this increase is 12.4%. Conversely, in tropical rainforests, increased heterogeneity amplifies the negative impact of reduced tree cover on cloud formation. These findings underscore the importance of not only the extent but also the spatial arrangement of trees in afforestation and deforestation efforts. This data-driven analysis enhances the understanding of vegetation-cloud interactions, which remain uncertain and underrepresented in Earth system models, and provides valuable insights for planning and implementing future tree restoration projects in Africa.

How to cite: Xie, D., Caporaso, L., Reichstein, M., Zhong, D., and Duveiller, G.: How do trees impact cloud formation across Africa: the role of their spatial distribution, EGU General Assembly 2025, Vienna, Austria, 27 Apr–2 May 2025, EGU25-16539, https://doi.org/10.5194/egusphere-egu25-16539, 2025.

Changes in land use and land cover (LULC) are closely linked to global warming and localized climate alterations, as urbanization significantly modifies surface and atmospheric conditions, resulting in a phenomenon known as the Urban Heat Island (UHI) effect. This study evaluates the intensity of the daytime Surface Urban Heat Island (SUHI) effect at a local scale using the landscape index (LI) proposed by Xu, which examines source and sink landscapes and their roles in SUHI intensity. The study evaluates SUHI intensity across different LULC types in districts of Kerala, India, using Land Surface Temperature (LST) data derived from Landsat 8 by single Channel algorithm technique and LULC classifications acquired from Esri Sentinel-2 for the period 2017–2023. Results reveal significant LST variations in 2019 and 2023, The districts Alappuzha, Ernakulam, Thrissur, and Thiruvananthapuram districts were more prone to SUHI Intensity.

How to cite: pk, A. and sr, R.: Land Use Land Cover Change and Surface Urban Heat Island Intensity: A Source-Sink Landscape Based Study in Kerala, India, EGU General Assembly 2025, Vienna, Austria, 27 Apr–2 May 2025, EGU25-16629, https://doi.org/10.5194/egusphere-egu25-16629, 2025.

EGU25-16746 | ECS | Orals | BG3.2

Exploring Land Management Impacts on Extreme Weather Events: Cover Cropping in ICON-MPIM 

Leonore Jungandreas, Ana Bastos, Jian Peng, and Sönke Zaehle

Cover cropping is increasingly recognized as a sustainable land management strategy with potential biophysical and biogeochemical climate implications. Although managed lands cover up to  70% of the Earth's ice-free land surface, their representation in Earth system models (ESMs) remains limited. This study integrates cover cropping into the global climate model ICON-MPIM to investigate its impacts on extreme weather events through biophysical effects on the atmosphere.

We analyze how the integration of idealized cover cropping alters surface properties, water and energy fluxes, and atmospheric processes, with a focus on extreme events such as droughts and heat waves. Preliminary results over Europe reveal a decrease in annual mean 2m air temperatures over eastern Europe but an increase over western Europe, with strong seasonal variations. Conversely, the maximum daily air temperature pattern shows the opposite trend, with increases over eastern Europe and decreases over western Europe. Moreover, remote changes, for example in 2m air temperature or maximum daily air temperature, also occur in regions where no cover crops are grown, such as in the tropics and polar regions or the ocean. These findings suggest that the climate response to cover cropping is highly heterogeneous, emphasizing the importance of considering both spatial and temporal dynamics.

This approach represents a first step toward exploring the theoretical potential of cover cropping to influence climate dynamics and extreme events while recognizing the limitations of the model's representation of agricultural management practices. By addressing land management in a generalized yet systematic manner, this study contributes to an improved understanding of the influence of land management on land-atmosphere interactions and provides a basis for future research on the role of managed lands in climate systems.

How to cite: Jungandreas, L., Bastos, A., Peng, J., and Zaehle, S.: Exploring Land Management Impacts on Extreme Weather Events: Cover Cropping in ICON-MPIM, EGU General Assembly 2025, Vienna, Austria, 27 Apr–2 May 2025, EGU25-16746, https://doi.org/10.5194/egusphere-egu25-16746, 2025.

Suburban areas undergoing rapid urbanization face significant challenges in balancing ecological and socioeconomic sustainability. Land-use changes play a crucial role in shaping the dynamics of regional ecosystem service values. This study focuses on the Lanyang River Basin in Taiwan, adjacent to the Greater Taipei Metropolitan Area, to assess the impact of land-use changes on ecosystem service values and explore strategies for sustainable development. Using Nationwide Land Use Investigation Data from 1995, 2007, and 2020, we projected land-use dynamics for 2045 under a regular growth scenario and optimized land-use allocation through linear programming. The Integrated Valuation of Ecosystem Services and Tradeoffs (InVEST) model and Geographic Information System (GIS) were employed to quantify spatial and temporal value changes in carbon storage, habitat quality, and annual water yield. Results reveal a significant decline in the value of carbon storage and habitat quality under the regular growth scenario, driven by the expansion of built-up areas. In contrast, the optimization scenario enhances these ecosystem service values by increasing grassland coverage, although trade-offs emerge, particularly with a reduced annual water yield. Notably, the impact on annual water yield is significantly constrained by regional precipitation patterns, as the Lanyang River Basin is a subtropical humid region. Our insights highlight the importance of tailored sustainable regional planning that considers land-use types, geographic characteristics, and factors such as vegetation diversity in grasslands to optimize spatial resource use. This study provides an innovative framework for integrating ecosystem service values with scenario simulation to inform sustainable land-use planning. The findings offer actionable insights for suburban sustainability in rapidly urbanizing regions. Future research should incorporate socioeconomic realities and policies to refine simulation model accuracy and enhance decision-making, supporting a balanced approach to ecological conservation and regional development.

How to cite: Chou, C.-W. and Liaw, S.-C.: Scenario Simulation of Ecosystem Service Values for Suburban Sustainability: A Case Study of the Lanyang River Basin, Taiwan, EGU General Assembly 2025, Vienna, Austria, 27 Apr–2 May 2025, EGU25-17112, https://doi.org/10.5194/egusphere-egu25-17112, 2025.

EGU25-17991 | Orals | BG3.2

A Comprehensive Assessment of Urban Forest Scenarios Using LCA and InVEST Models 

Jiangong Bi, Yoonji Kim, Yoon Jung Kim, and Junga Lee

Urban forests play a critical role in addressing various urban environmental challenges, such as mitigating climate change, enhancing biodiversity, and improving habitat connectivity. To optimize the spatial allocation and management of urban forests, it is essential to consider both environmental impacts (e.g., carbon emissions and resource consumption) and ecosystem services (e.g., carbon storage and habitat quality)(Chaplin-Kramer et al., 2017). In this context, this study employs Life Cycle Assessment (LCA) to evaluate the environmental costs associated with urban forest establishment and maintenance, and the InVEST model to assess the localized impacts on ecosystem services through spatially detailed analysis. By integrating these methodologies, a comprehensive evaluation of urban forest development strategies is conducted.

To address the environmental challenges associated with rapid urban development in Sejong City, this study evaluates two urban forest development scenarios: centralized (large-scale, contiguous forests) and decentralized (multiple, small-scale forests). Sejong City, designated in 2007 and officially launched in 2012 as Korea’s administrative capital, has undergone extensive urbanization over the past decade, resulting in significant habitat loss, degradation of ecological quality, and increased ecosystem fragmentation (Sejong City, 2024). These trends highlight the critical need for mitigation strategies, with urban forest development emerging as a promising solution.

This study employs openLCA software to quantify environmental costs, including carbon emissions, energy consumption, and resource usage, incurred during the establishment and maintenance of urban forests. Furthermore, the InVEST Carbon Storage and Sequestration model and Habitat Quality model are utilized to simulate spatially explicit changes in carbon storage and habitat quality under the two scenarios. By integrating these results, the study provides a comprehensive assessment of the environmental and ecological performance of each scenario, offering valuable insights for the formulation of sustainable land-use strategies in urban forest planning.

The analysis revealed that decentralized urban forest development, characterized by the establishment of small forests across multiple locations, effectively mitigates habitat fragmentation, provides suitable habitats for diverse species, and enhances biodiversity by strengthening ecological connectivity and increasing species richness in urban environments. In contrast, centralized urban forest development incurs higher initial environmental costs but provides greater long-term carbon storage and habitat stability through large contiguous forests.

This study demonstrates that the integration of LCA and spatial modeling provides a robust framework for comprehensively evaluating the environmental and ecological impacts of urban forest development strategies. By quantitatively assessing the trade-offs between environmental costs and ecological benefits, this research identifies the importance of balanced land-use strategies that consider both centralized and decentralized approaches.


*This work was supported by the Core Research Institute Basic Science Research Program through the National Research Foundation of Korea (NRF) funded by the Ministry of Education(NRF-2021R1A6A1A10045235).

How to cite: Bi, J., Kim, Y., Kim, Y. J., and Lee, J.: A Comprehensive Assessment of Urban Forest Scenarios Using LCA and InVEST Models, EGU General Assembly 2025, Vienna, Austria, 27 Apr–2 May 2025, EGU25-17991, https://doi.org/10.5194/egusphere-egu25-17991, 2025.

EGU25-18014 | ECS | Posters on site | BG3.2

Arctic expansion of boreal forests: can the BVOC emission impact rival the albedo effect? 

Adele Zaini, Sara M. Blichner, Jing Tang, Rosie A. Fisher, Marianne T. Lund, and Terje K. Berntsen

As global surface temperatures continue to rise, vegetation is expected to adapt, with high-latitude forests projected to migrate northward into the Arctic regions. This shift will result in significant changes in land cover, influencing the climate through various biogeophysical and biogeochemical feedback mechanisms. While many studies have shown that changes in albedo drive substantial warming, a more comprehensive evaluation of the impacts associated with changes in Biogenic Volatile Organic Compound (BVOC) emissions is needed. Some studies suggest that BVOC-related effects could significantly influence climate in these pristine regions, potentially counteracting the albedo effect. BVOCs play a crucial role in atmospheric chemistry and aerosol formation; changes in their emissions can alter aerosol properties, subsequently affecting cloud characteristics and potentially leading to a cooling effect. In this study, we use the Norwegian Earth System Model v2 (NorESM2) with projected vegetation migration, running nested experiments under current climatic conditions and warmer climate forcing scenarios to assess the radiative forcing of BVOC-related impacts, in comparison with the albedo change. Preliminary findings suggest that under current climate conditions, BVOC-related impacts are insufficient to rival the warming effect of albedo changes; however, their relative role could be significantly amplified in warmer future climates.

How to cite: Zaini, A., Blichner, S. M., Tang, J., Fisher, R. A., Lund, M. T., and Berntsen, T. K.: Arctic expansion of boreal forests: can the BVOC emission impact rival the albedo effect?, EGU General Assembly 2025, Vienna, Austria, 27 Apr–2 May 2025, EGU25-18014, https://doi.org/10.5194/egusphere-egu25-18014, 2025.

EGU25-18466 | ECS | Orals | BG3.2

Bottom-up estimate of the carbon dioxide removal potential of land-based mitigation technologies using a coupled ESM/ land-use change model framework 

Lina Teckentrup, Etienne Tourigny, Florian Wimmer, Markus Donat, Raffaele Bernadello, Isabel Cano Martínez, Francis X. Johnson, Leon Merfort, Stefan Olin, Rüdiger Schaldach, Eise Spijker, and David Wårlind

Carbon dioxide removal (CDR) strategies are critical for climate stabilisation under the Paris Agreement. All current IPCC scenarios that achieve the Paris Agreement’s objectives rely on CDR, and implementing CDR explicit representations into Earth System Models will allow the production of more realistic future scenario projections for CMIP7 and beyond. Here we present results from the LANDMARC project which aims to explore the efficiency of carbon dioxide removal as well as risks associated with land-based mitigation technologies (LMTs). We employ a coupled modeling system consisting of the EC-Earth3-CC Earth System Model with the LPJ-GUESS dynamic global vegetation model, and the LandSHIFT-G land-use model, and simulate five different LMTs, specifically i) fixing carbon in vegetation and soils by afforestation/ reforestation; increasing soil carbon by ii) no/reduced tillage agriculture and iii) combining the substitution of fossil fuels with biofuels and medium to long-term storage of carbon by iv) bioenergy and carbon capture and storage (BECCS) and biochar as well as v) reducing deforestation through agro-forestry and agro-pastoral practices. Based on two different portfolios, assuming an either moderate or high ambition to employ LMTs, we estimate the potential carbon removal through LMTs, and their impact on the average and variability in climate. We find that implementing LMTs has the potential to achieve net-negative emissions before the end of the century, and to reduce the atmospheric CO2 concentration by 47 - 62 ppm depending on the LMT portfolio investigated. The carbon removal is simulated to dampen the global increase in temperature by roughly 0.4°C by the end of the century. While this reduction alone is insufficient to meet the Paris Agreement goals, it highlights the need to invest significantly in both CDR and emissions reductions, which serve as complementary means for achieving climate stabilisation alongside sustainable development goals.

How to cite: Teckentrup, L., Tourigny, E., Wimmer, F., Donat, M., Bernadello, R., Cano Martínez, I., Johnson, F. X., Merfort, L., Olin, S., Schaldach, R., Spijker, E., and Wårlind, D.: Bottom-up estimate of the carbon dioxide removal potential of land-based mitigation technologies using a coupled ESM/ land-use change model framework, EGU General Assembly 2025, Vienna, Austria, 27 Apr–2 May 2025, EGU25-18466, https://doi.org/10.5194/egusphere-egu25-18466, 2025.

EGU25-19650 | ECS | Orals | BG3.2

Afforestation as climate change mitigation strategy in West Africa: potential impacts on the terrestrial carbon cycle 

Souleymane Sy, Joel Arnault, Jan Bliefernicht, Benjamin Quesada, Verena Huber García, Gregory Duveiller, Abdel Nassirou Yahaya Seydou, Samuel Guug, Thomas Rummler, Patrick Laux, and Harlad Kunstmann

The forest landscape in West Africa faces significant challenges from rapid population growth, agricultural expansion, and urbanization. These anthropogenic land-use and land-cover changes (LULCC), including deforestation and afforestation, impact ecosystem-climate-carbon cycle interactions through biogeochemical emissions and greenhouse gas uptake. However, the capacity of the land-based carbon sink, encompassing LULCC emissions and CO2 uptake, remains uncertain. This study employs the fully coupled WRF-Hydro system, incorporating surface and subsurface hydrology and a dynamic carbon cycle, to perform high-resolution (3 km) convection-permitting simulations for the period 2011-2022. It assesses regional impacts of idealized LULCC scenarios by comparing several land use and afforestation simulations representing specific land cover transitions in the Sudan savannah belt of Burkina Faso and Ghana.

Model performance was validated using gross primary production (GPP) data from four eddy covariance sites along a land-use gradient (pristine savanna forest, cropland, and degraded grassland) in the Sudan savannah belt of Burkina Faso and Ghana and further evaluated by comparing simulated GPP and leaf area index (LAI) with Copernicus Land Monitoring satellite products. Overall, the model showed the best performance at the pristine savanna forest site with homogeneous vegetation.

Analysing of carbon cycle variables, including GPP, NPP, NEE, carbon residence time, and soil and vegetation carbon stocks, our results reveal that deforestation reduces GPP by 60% (-1.08 ± 0.1 gC/m²), carbon stocks by 45% (-1.79 ± 0.19 kgC/m²), and carbon residence time by 25% (-3.6 ± 0.9 years). Conversely, afforestation strategies, such as converting grassland to evergreen or mixed forest, can mitigate carbon losses by significantly increasing total carbon stocks (1.6 ± 0.19 kgC/m²) through increased canopy cover. Furthermore, our results indicate that converting grassland to evergreen forest can approximately double the carbon residence time in soils and ecosystems compared to afforestation options involving woody savanna or savanna. The study also investigates the underlying physical mechanisms behind LULCC-induced terrestrial carbon cycle responses.

How to cite: Sy, S., Arnault, J., Bliefernicht, J., Quesada, B., García, V. H., Duveiller, G., Seydou, A. N. Y., Guug, S., Rummler, T., Laux, P., and Kunstmann, H.: Afforestation as climate change mitigation strategy in West Africa: potential impacts on the terrestrial carbon cycle, EGU General Assembly 2025, Vienna, Austria, 27 Apr–2 May 2025, EGU25-19650, https://doi.org/10.5194/egusphere-egu25-19650, 2025.

EGU25-20336 | ECS | Posters on site | BG3.2

On the Impact of Tree-Line Expansion: A Threat to Hydropower Resources? 

Gunnar Thorsen Liahjell

Centuries of mountain farming and forestry have caused the treeline in Norway to be situated up to hundreds of meters below its climatic potential. With climate change further raising this potential, vast areas of mountainous Norway are becoming open to tree growth. This shift in land cover significantly alters the hydrological balance, as trees typically have higher evapotranspiration rates than the vegetation they replace. Given that Norway’s power mix is largely dominated by hydropower, these changes in hydrology pose a potential threat to energy production.

To quantify the impact of this shift, we employ a high-resolution coupled atmosphere-land model (WRF-CTSM) using current and projected vegetation maps from the Natural History Museum in Oslo.

As the evapotranspiration (ET) levels in Norway are currently not well-constrained targeted fieldwork with mobile eddy covariance towers is being conducted to measure turbulent fluxes in representative areas. This data will be used to update the model's plant functional types to better represent the local vegetation.

The updated model will then be run under different SSP scenarios to provide more robust estimates of current and future ET levels in Norway and their potential impact on hydropower production.

How to cite: Thorsen Liahjell, G.: On the Impact of Tree-Line Expansion: A Threat to Hydropower Resources?, EGU General Assembly 2025, Vienna, Austria, 27 Apr–2 May 2025, EGU25-20336, https://doi.org/10.5194/egusphere-egu25-20336, 2025.

This study examines the mortality burden associated with heat and cold temperatures, compounded by poor air quality, in two Italian cities. Using a generalized linear model with Poisson regression, we quantify the mortality risk attributable to heat/cold and the air pollutants PM10 and O3 over recent years, focusing on both the general population and the most vulnerable age group. To project future mortality trends up to 2050, a regional climate model coupled with a chemistry-transport model is applied under future climate and air quality scenarios.

The results highlight the critical need to consider the effects of air pollution alongside climate factors. Vulnerable populations, particularly the elderly, are shown to be more susceptible to both extreme temperatures and air pollution. Looking ahead, future mortality patterns will be influenced by two opposing effects: an increase in mortality due to more frequent and intense warm temperatures, particularly in scenarios of climate inaction, and a decrease in cold-related mortality.

The findings underscore the urgent need to integrate climate change mitigation with air quality management to reduce the combined health risks. Effective science transfer into timely and informed policy action is essential for bridging the gap between research findings and practical, actionable solutions.

Drawing on the literature and lessons learnt from several research projects and case studies (e.g., ForestNavigator, RETURN), we demonstrate that this gap between research findings and actionable solutions requires i) engaging local stakeholders (including government authorities, public health organizations, and communities) and ii) analysing the cognitive factors - such as awareness and risk perception - that can act as either barriers or enablers in shaping adaptive capacity and resilience at both the individual and community levels.

Increasing public awareness of the risks associated with temperature extremes and air pollution, and enhancing risk perception through knowledge transfer, will empower individuals and communities to adopt protective measures. In addition to encouraging behavioural shifts, fostering resilience and improving adaptive capacity, such awareness can drive policy changes, ultimately reducing the health burden of climate-related risks.

How to cite: Michetti, M.: Climate change, Air Quality, and Public Health: Integrating Science and Policy for Urban Resilience and Adaptation, EGU General Assembly 2025, Vienna, Austria, 27 Apr–2 May 2025, EGU25-1627, https://doi.org/10.5194/egusphere-egu25-1627, 2025.

EGU25-6925 | ECS | Posters on site | EOS2.5

Exploring the potential of data-driven educational tools to engage students with climate change complexity 

Lorenzo Miani, Francesco De Zuani Cassina, and Olivia Levrini

Climate change education is essential for driving a shift toward a sustainable and decarbonised society. Environmental observatories and science labs are central to delivering impactful educational experiences by integrating real-world data from monitoring stations and satellite observations. These tools foster scientific inquiry and empower critical thinking about climate change and its effects.

This abstract introduces FyouTURES, an innovative scenario-making game designed to achieve these objectives by combining real-world data, collaborative learning, and scenario-building exercises. At the heart of the game lies the En-ROADS simulator (Energy-Rapid Overview and Decision Support), a global climate simulator developed by Climate Interactive in partnership with the MIT Sloan Sustainability Initiative and Ventana Systems (Rooney-Varga et al., 2021). En-ROADS offers an interactive platform for exploring how climate policies influence long-term outcomes. Based on a system dynamics model grounded in scientific research and calibrated with historical and projected datasets, it employs differential equations to depict the climate-energy system as a dynamic entity characterised by feedback loops, nonlinearities, and time delays. Users can simulate the effects of policies like electrification, carbon pricing, and improved agricultural practices on variables such as energy prices, global temperatures, and sea-level rise.

Using the En-ROADS simulator, FyouTURES guides players through three rounds spanning the present day to 2100, with milestones in 2030 and 2050. The game adapts the simulator’s categories into six thematic areas: conventional energy, emission control, green areas, energy efficiency, electrification, and green energy. These themes allow participants to explore diverse aspects of sustainability, including renewable energy adoption, deforestation, and CO2 removal technologies.

To enhance decision-making and incorporate uncertainties, we introduced wildcards representing possible events tied to climate and societal factors. These cards reflect different types of uncertainties related to Climate Change – epistemic, aleatoric, and reflexive (Shepherd, 2019) – and challenge players to adapt strategies dynamically, encouraging critical engagement with complex climate issues.

Observations from two game implementations demonstrated how the game helped students in dealing with complex sustainability challenges, creating scenarios that balanced environmental, social, and economic sustainability dimensions (Purvis et al., 2019). The game’s structure promoted collaborative problem framing over simplistic solutions, fostering open-ended reasoning and a deeper understanding of "wicked problems."

By integrating the scientific rigour of En-ROADS, interactive simulations, and collaborative learning dynamics, FyouTURES highlights the potential of data-driven educational tools to engage students with the complexity of climate change. This approach equips learners with critical thinking skills while challenging them to navigate uncertainty and envision pathways to sustainable futures.

Purvis, B., Mao, Y. & Robinson, D. (2019). Three pillars of sustainability: in search of conceptual origins. Sustainable Sciences, 14, 681–695. https://doi.org/10.1007/s11625-018-0627-5

Rooney-Varga, J. N., Hensel, M., McCarthy, C., McNeal, K., Norfles, N., Rath, K., Schnell, A. N., & Sterman, J. D. (2021). Building Consensus for Ambitious Climate Action Through the World Climate Simulation. Earth's Future, 9(12), e2021EF002283. https://doi.org/10.1029/2021EF002283 

Shepherd, T. G. (2019). Storyline approach to the construction of regional climate change information. Proceedings of the Mathematical, Physical and Engineering Sciences, 475(2225), 20190013. https://doi.org/10.1098/rspa.2019.0013

How to cite: Miani, L., De Zuani Cassina, F., and Levrini, O.: Exploring the potential of data-driven educational tools to engage students with climate change complexity, EGU General Assembly 2025, Vienna, Austria, 27 Apr–2 May 2025, EGU25-6925, https://doi.org/10.5194/egusphere-egu25-6925, 2025.

EGU25-6987 | Posters on site | EOS2.5

Learning and Teaching  about Climate Change, EDU4CLIMA 

Eirini Dermitzaki, Nikos Kalivitis, Athina Ginoudi, and Maria Kanakidou

Climate change is emerging as one of the most significant challenges facing our planet today, with its effects now visible and negatively impacting ecosystems, human activities, and global health. Addressing climate change and limiting its negative impacts, requires collective action and climate literacy, that encompasses being aware of climate change, its anthropogenic causes and its implications. This work concerns the presentation of the project: Learning and Teaching about Climate Change, under the acronym EDU4Clima (https://edu4clima.gr), which aims to promote the teaching of climate change in secondary education in Greece and to provide teachers and students with new knowledge  and skills to critically approach climate change, to reflect on environmental issues that arise and to develop attitudes for mitigation and adaptation to climate change. It attempts to integrate in the educational process, the scientific knowledge produced by the University of Crete and the Atmospheric Research Station at Finokalia, Crete. In this context, a Research, Innovation and Dissemination of Scientific Knowledge Hub has been established closed to Finokalia Station, where teacher training workshops are held and an educational program for students has been developed and is being implemented. The educational program is based on innovative teaching approaches and includes interactive presentations, experiments that demonstrate climate phenomena in a simple way carried out by the students, access and analysis of real atmospheric data. Additionally, a tour to the Atmospheric Research Station and interaction with scientists included in the program. All activities carried out are compatible with the curricula for Natural Sciences in Senior High School. Before each visit to the Hub, school teachers undertake preparing the students, focusing on basic prerequisite knowledge, while after the visit, the students serve as climate ambassadors and take action by disseminating the results in their school and/or their local communities.

How to cite: Dermitzaki, E., Kalivitis, N., Ginoudi, A., and Kanakidou, M.: Learning and Teaching  about Climate Change, EDU4CLIMA, EGU General Assembly 2025, Vienna, Austria, 27 Apr–2 May 2025, EGU25-6987, https://doi.org/10.5194/egusphere-egu25-6987, 2025.

EGU25-7015 | Orals | EOS2.5

The Massive Open Online Course: 'Atmospheric Research Infrastructures: Sharing the Future of Our Atmosphere' as an Innovative Tool for Atmospheric Science & Climate Change Education 

Antonia Zogka, Véronique Riffault, Stéphane Sauvage, Carole Portillo, Joel De Brito, Therese Salameh, Anna Font, Clara Strunz, and Esperanza Perdrix

As part of the ATMO-ACCESS project, an innovative two-week Massive Open Online Course (MOOC) was hosted on the FUN (France Université Numérique) MOOC platform from January 20 to February 16, 2025. 

This course offered an engaging and interactive platform for learners interested in exploring critical challenges related to air pollution and climate change. The first week provided participants with in-depth knowledge about atmospheric constituents such as reactive trace gases and greenhouse gases, aerosols and clouds, their sources, impacts, and complex interactions. The MOOC emphasised the crucial importance of data sharing and collaborative networks within the research community while showcasing advanced atmospheric research methodologies. Additionally, the second week introduced three key Atmospheric Research Infrastructures (ARIs): ACTRIS, IAGOS, and ICOS, providing participants with insights into their high-quality operational workflows. To support active learning, participants could self-assess their knowledge through several quizzes and earn an open badge by successfully completing a final quiz. 

Feedback from participants and analysis of the MOOC's concluding survey revealed valuable insights into learner expectations, which will be presented during the session. These suggestions will guide the development of future iterations of the course, aiming at delivering a more effective, impactful and engaging learning experience.

How to cite: Zogka, A., Riffault, V., Sauvage, S., Portillo, C., De Brito, J., Salameh, T., Font, A., Strunz, C., and Perdrix, E.: The Massive Open Online Course: 'Atmospheric Research Infrastructures: Sharing the Future of Our Atmosphere' as an Innovative Tool for Atmospheric Science & Climate Change Education, EGU General Assembly 2025, Vienna, Austria, 27 Apr–2 May 2025, EGU25-7015, https://doi.org/10.5194/egusphere-egu25-7015, 2025.

EGU25-8711 | ECS | Posters on site | EOS2.5

Data exploitation and visualization in the classroom. The case of CLIMADEMY's video game 

Ioannis Metaxas, Nikos Gialesakis, Maria Kanakidou, and Nikos Kalivitis

The great importance of educating the next generation of citizens in climate change drivers, impacts as well as mitigation and adaptation measures has been highlighted by many international entities like the IPCC and the European Union. Additionally, many research groups have indicated the importance of incorporating real world data in teaching about climate change. This can take the form of educational tools that are aimed at data exploitation and visualization. One initiative exploring the creation of such tools is the Erasmus + project CLIMADEMY. In CLIMADEMY a video game was developed in the Unity engine which implemented real world data (from the NOAA database) for three greenhouse gasses concentrations (CH4, CO2, N2O) as well as the concentrations of scattering and absorbing aerosols. The video game’s primary function is to calculate the planet’s average temperature by 2100 based on the radiative forcing equations of the IPCC and the five aforementioned parameters. Additionally, the game is able to process which RCP scenario the word will be in based on these five parameters. The game is highly interactive, with students able to choose if these parameters will be based on an established database or if they want to explore other RCP scenarios. Furthermore, the game allows students to input custom values for CH4, CO2, N2O and aerosols in order to observe the average temperature of the planet in 2100 as well as the RCP scenario these values lead to. Τhe open source approach, gives students the chance to modify the game and include further features according to the specific educational needs. Finally, the educational value of this game is complemented by its user interface which, due to Unity’s capabilities as an engine, has vibrant colors and themes making the game aesthetically pleasing and interesting.

How to cite: Metaxas, I., Gialesakis, N., Kanakidou, M., and Kalivitis, N.: Data exploitation and visualization in the classroom. The case of CLIMADEMY's video game, EGU General Assembly 2025, Vienna, Austria, 27 Apr–2 May 2025, EGU25-8711, https://doi.org/10.5194/egusphere-egu25-8711, 2025.

The Regional Directorate of Education (RDE) of Crete actively promotes informal
learning to enhance scientific knowledge on climate change and sustainability
through the implementation of European programmes. These initiatives place
significant emphasis on school visits and activities within research and scientific
institutions, offering students interactive and experiential opportunities to deepen
their understanding of environmental issues. Through these activities, students
develop critical thinking, environmental awareness, and collaboration skills while
fostering competencies essential for sustainable development.
Research organisations play an important role as educational hubs, connecting
theoretical knowledge with practical applications. Programmes like the innovative
Horizon 2020 CONNECT project and the Erasmus+ academy CLIMADEMY,
implemented by the RDE of Crete, exemplify this approach. These programmes
facilitate informal learning experiences, including visits to research centres, scientific
laboratories, museums, and natural environments, enabling students to learn
through hands-on activities and problem-solving exercises.
For example, schools in Crete have visited the Natural History Museum of Crete and
the atmospheric measurement station in Filokalia, Lassithi, where students engaged
in educational programmes focused on practical applications of science. Additionally,
schools across the region have implemented science-based scenarios, deepening
their understanding on critical issues such as the climate crisis, renewable energy,
and carbon footprint reduction.
These educational approaches not only bring science to life by allowing students to
work with experts but also foster autonomy, personal initiative, and creativity. By
promoting experiential learning, these programmes equip students with the skills
needed to address contemporary environmental and social challenges effectively.

How to cite: Kartsonakis, E. and Stavrakakis, E.: Supporting Informal Learning on Climate Change and Sustainability ThroughEuropean Programmes: The Case of the RDE of Crete, EGU General Assembly 2025, Vienna, Austria, 27 Apr–2 May 2025, EGU25-8879, https://doi.org/10.5194/egusphere-egu25-8879, 2025.

EGU25-9030 | ECS | Orals | EOS2.5

HydroEurope Project: Assessing uncertainties on advanced hydrological and hydraulic modelling, climate change impacts on flash floods, and accidental water pollution, in six catchments in Europe 

Gonzalo Olivares Cerpa, Frank Molkenthin, Grzegorz Sinicyn, Caspar Hewett, Nahad Rezazadeh Helmi, and Alexandre Caminada

Keywords: Europe, education, basins, uncertainty, flash flood, climate change, water pollution

Education remains one of the main driving forces in Europe, with educational institutions playing a central role in training future professionals. Strengthening educational strategies provides a comparative advantage to societies and communities facing challenges, particularly those related to natural hazards such as storms, floods and heatwaves. According to the European Environment Agency, climate-related hazards pose significant risks to human health and ecosystems, leading to considerable economic losses. In 2023, Europe experienced losses of around €43.9 billion, a figure that has increase steadily over the last 30 years. Additionally, the World Bank reports that floods alone affect on average 2 million people annually in Europe.

In response to these challenges, education and training initiatives are crucial, particularly for students nearing the end of their studies and preparing to enter the work market. One such initiative is the HydroEurope project, which tackles climate-related hazards within training for students. This innovative program combines real-world water issues with academic training, focused on six European basins. The Var-Vésubie basin in the southeast France (French Riviera), the Ahr basin in West Central Europe (border region of Belgium, Luxemburg and Germany), the Tordera basin in the north east of Spain (Catalonia), the Tervuren basin in central Belgium, the Upper Skawa in the south of Poland (border region of Czech Republic) and the Ouseburn basin in the north east of the UK). Universities in six countries are represented in the project:  Universitè Côte d’Azur, Brandenburgische Technische Universität Cottbus-Senftenberg, Universitat Politècnica de Catalunya, Vrije Universiteit Brussel, Politecnhika Warszawska, and Newcastle University.

The HydroEurope project, spanning three years, addresses three key challenges: uncertainty in hydrological and hydraulic modelling, the effects of climate change on flash flood frequency, and accidental water pollution in water bodies. By examining these issues, students gain a comprehensive understanding of the water cycle and develop skills to mitigate climate-related hazards.

The project involved extensive work by students and teachers across the six study areas, covering basins with varied weather and land conditions. They evaluated the impact of storms and extreme events in past, present, and future scenarios, assessed modelling uncertainties, and investigated water pollution. This analysis provided a broader perspective on climate-related disasters in Europe, considering the geographic diversity of the study sites. Students learned to select appropriate tools, measurements, and strategies for specific challenges, preparing them to approach water issues from a pan-European perspective.

The project achieved its objectives, producing over 18 teaching units, tutorials, guides, and other educational materials that enhanced the understanding of the study areas. Students created reports and presentations offering insights into the case studies and methodologies, which are available on the project’s website (https://hydroeurope.upc.edu/).

This article highlights the significant work done during the program, showcasing the analysis and information generated by students. The HydroEurope initiative has not only provided valuable educational experiences but also contributed to addressing critical climate-related issues through research and practical solutions.

How to cite: Olivares Cerpa, G., Molkenthin, F., Sinicyn, G., Hewett, C., Rezazadeh Helmi, N., and Caminada, A.: HydroEurope Project: Assessing uncertainties on advanced hydrological and hydraulic modelling, climate change impacts on flash floods, and accidental water pollution, in six catchments in Europe, EGU General Assembly 2025, Vienna, Austria, 27 Apr–2 May 2025, EGU25-9030, https://doi.org/10.5194/egusphere-egu25-9030, 2025.

EGU25-9644 | ECS | Orals | EOS2.5

Development of sustainability competences for analysing and narrating real-world climate data  

Veronica Ilari, Sara Moresco, Paola Fantini, and Olivia Levrini

Climate change education is crucial to equip young people with the tools to help them envision and thus achieve a carbon-free society. Incorporating climate data into school curricula fosters a personal connection to global environmental challenges and enhances scientific inquiry and systemic thinking skills.

CLIMADEMY (CLIMAte change teachers' acaDEMY) is a three-year Erasmus+ teacher training project involving four European HUBs in Finland, Germany, Greece, and Italy. It aims to integrate real-world data into educational contexts to regenerate the teaching and learning process addressing diverse curricular needs while fostering environmental as well as social and economic sustainability competences (Bianchi et al., 2022; Purvis et al., 2019).

As part of the Italian HUB, we present a project born from the intersection between the objectives of CLIMADEMY and the initiatives of a scientific high school (Liceo Scientifico ‘A. Einstein’ in Rimini), which has been collaborating for several years with the physics education research group of the University of Bologna. This project, called Salomon, involves five classes  (four grade-12 and one grade-11) and aims to develop sustainability competences described by the European GreenComp framework. Salomon encourages students to tackle global complex issues like climate change through innovative interdisciplinary approaches that cultivate problem-framing, analytical, and systemic thinking skills.

Salomon promotes collaboration between scientific and humanistic disciplines, drawing inspiration from Italo Calvino's Invisible Cities. Teachers co-design and carry out activities in classrooms and physics laboratories, emphasizing diverse disciplinary epistemologies and employing multiple languages - textual, photographic, theatrical - to convey the contents learnt. This approach allows students to engage with complexity and sustainability concepts through varied perspectives.

At the project’s conclusion, a dedicated module will delve into the topic of climate change, with the ambition that the various interdisciplinary activities carried out in the previous months will have provided not only greater knowledge and skills, but above all the attitude to consciously reflect and work on real-world data. Students will be asked to analyse, interpret and narrate climate data from local and global sources, including monitoring stations like Finokalia (University of Crete), the E3CI European Extreme Events Climate Index (IFAB foundation, Bologna), and the En-ROADS climate simulator. 

This approach fosters scientific literacy and cultivates confidence in the scientific endeavour to support evidence-based decision-making, empowering students to act as agents of sustainability in the world. Salomon offers a model that is adaptable to different educational settings that want to incorporate real data into curricula within a complexity-oriented education that aims to equip students with the thinking tools needed to address pressing environmental challenges and contribute to a decarbonised and sustainable society.

Bianchi, G., Pisiotis, U., & Cabrera Giraldez, M. (2022). GreenComp – The European sustainability competence framework. In M. Bacigalupo & Y. Punie (Eds.), European Commission, Joint Research Centre. Luxembourg: Publications Office of the European Union. https://doi.org/10.2760/13286   

Purvis, B., Mao, Y. & Robinson, D. (2019). Three pillars of sustainability: in search of conceptual origins. Sustainable Sciences, 14, 681–695. https://doi.org/10.1007/s11625-018-0627-5

How to cite: Ilari, V., Moresco, S., Fantini, P., and Levrini, O.: Development of sustainability competences for analysing and narrating real-world climate data , EGU General Assembly 2025, Vienna, Austria, 27 Apr–2 May 2025, EGU25-9644, https://doi.org/10.5194/egusphere-egu25-9644, 2025.

EGU25-9645 | Orals | EOS2.5

The Adaptation AGORA  Academy to access and use Climate Data and to monitor Climate Risks, an innovative learning tool to foster education and citizen engagement.  

Marianna Adinolfi, Andreas Hoy, Massimo Milelli, Riccardo Biondi, Paola Mercogliano, Alfredo Reder, Arianna Acierno, Marina Mattera, Marta Ellena, and Antonella Mele

Climate change education and citizen engagement are essential for advancing towards a climate-resilient society promoting institutional, regulatory and policy transformation. Informal learning tools, as digital environments, and co-development approaches play a pivotal role in addressing this challenge. In this perspective, the AGORA project contributes to the Mission on Adaptation to Climate Change by promoting best practices, innovative methods, climate change education instruments and citizen engagement to enhance community and regional engagement in climate action. A key initiative within AGORA is the development of the Community Hub, a collaborative online platform designed as an integrated discussion and learning space. This digital hub hosts two Digital Academies aimed at equipping citizens and stakeholders with open-source climate data and tools to address climate adaptation challenges and misinformation. The ambition of this work is to promote the  Digital Academy to access and use Climate Data and to monitor Climate Risks developed in the AGORA project, as an inspiring educational initiative, inviting data owners, educators, and policymakers to collaborate in transforming climate knowledge into actionable solutions. By fostering trust, enhancing education, and empowering citizens, these efforts collectively contribute to building a climate-resilient Europe. Specifically, the Digital Academy supports citizens and stakeholders to access open-source climate data for adaptation, also supporting users with guidelines on how to read, interpret and effectively use the information. By integrating existing real-world data, sources and platforms on climate data, adaptation and risk hubs with theoretical modules and guidelines, educators can provide users with both a deeper understanding of climate change and an immersive experience in climate research. The Academy is formed by inventories and modules with key scientific information on the usage of climate data at different levels of knowledge (i.e. entry, base and advanced). Then, the Academy promotes information and initiatives fostering climate adaptation supported by citizen science activities. Indeed, the Digital Academy is co-designed and co-developed in different public events, such as ECCA (www.ecca2023.eu), SISC conference 2023 (www.sisclima.it) and specific events with stakeholders and academic students. Such events allowed to connect climate adaptation practitioners with the scientific community, to gather the users’ requirements and provide suggestions and ideas for the advancements in the building up of the Digital Academy. Such an innovative learning tool provides authentic climate information, fosters scientific inquiry, and nurtures critical thinking skills.

How to cite: Adinolfi, M., Hoy, A., Milelli, M., Biondi, R., Mercogliano, P., Reder, A., Acierno, A., Mattera, M., Ellena, M., and Mele, A.: The Adaptation AGORA  Academy to access and use Climate Data and to monitor Climate Risks, an innovative learning tool to foster education and citizen engagement. , EGU General Assembly 2025, Vienna, Austria, 27 Apr–2 May 2025, EGU25-9645, https://doi.org/10.5194/egusphere-egu25-9645, 2025.

EGU25-12197 | ECS | Orals | EOS2.5

 Climate analogs for climate change communication and education: a case study with US Specialty Crops 

Supriya Savalkar, Bhupinderjeet Singh, Teal Potter, Alex Kirkpatrick, Chad Kruger, and Kirti Rajagopalan

Climate analogs for a target location are other locations whose current climate is similar to the target location’s projected future climate.  We explored using analogs as a convening tool to pair extension professionals and facilitate dialogue regarding concrete, actionable information for specialty crop climate adaptation. We aimed to build extension capacity and expertise to support climate change adaptation in U.S. specialty crops. Through an immersive training program that leverages climate analogs, we prepared agricultural educators, early-career professionals, and students using peer-to-peer learning, integrative knowledge activities, and applied projects. The goal was to use this as a means to overcome a critical climate change communication gap preventing climate change preparedness in the agricultural community. The idea that individuals will act if they receive the right “missing” climate change information and tools is an educational approach that has been shown repeatedly to be insufficient in complex situations where strategies and outcomes remain uncertain. Dialogues via analogs offer an alternative approach.  Twenty US Extension professionals are being trained. Our program evaluation features a phenomenological interview approach and qualitative analysis of participants’ lived-experiences, which provides insights beyond the typical scope of program evaluations. Preliminary interview feedback indicates that the experience has been transformative for participants, offering opportunities for autonomous learning surrounding critical adaptation concepts. We will describe the program, successes, adaptation insights obtained, and lessons learnt related to climate change communication from this unique training program.

How to cite: Savalkar, S., Singh, B., Potter, T., Kirkpatrick, A., Kruger, C., and Rajagopalan, K.:  Climate analogs for climate change communication and education: a case study with US Specialty Crops, EGU General Assembly 2025, Vienna, Austria, 27 Apr–2 May 2025, EGU25-12197, https://doi.org/10.5194/egusphere-egu25-12197, 2025.

EGU25-12206 | Orals | EOS2.5

Transregional Study of Willingness to Engage in Climate Change Actions among Youth in the Red Sea Countries 

Dheaya Alrousan, Nathalie Peutz, Alden Young, Muez Ali, Aisha Al-Sarihi, Moustapha Nour Ayeh, and Dany El-Obeid

Public perception represents a critical factor in people's engagement and support for climate change adaptation and mitigation actions. Therefore, this study aimed to investigate the perceptions of youth and their willingness to engage in climate change actions in Lebanon and another six countries in the Red Sea arena (Jordan, Djibouti, Sudan, the United Arab Emirates (UAE), Saudi Arabia (KSA), and Yemen) by integrating socio-cultural, experiential, cognitive, and sociodemographic as explanatory factors. By employing a mixed-methods approach, 2788 young people aged 18 to 35 years were surveyed using a standardized questionnaire. Key findings reveal significant inter-country differences at all levels. For instance, among the Red Sea countries, Saudi Arabia reported the lowest willingness to act, with an average score of 44.2%, while Sudan recorded the highest, with an average score of 58.7%. Youths from all countries in this study demonstrated moderate to low levels of knowledge about climate change causes, impacts, and impacts of responses, with an overall average score of 47%. The findings revealed that only 26% of participants received formal climate change education, predominantly as elective courses during their study. For the explanatory factors, value orientations were found to influence willingness to act strongly. Biospheric and socio-altruistic values were positively correlated with behavioral willingness, while egoistic values had a weaker or non-significant correlation. Social norms, particularly prescriptive norms, were found to be strong predictors of willingness, underscoring the role of societal pressure in shaping climate-related behaviors. Mitigation response inefficacy (i.e., the belief that actions are ineffective) was negatively correlated with behavioral willingness, highlighting a critical barrier to engagement. Gender, age, level of education, and receiving climate change education were significant predictors of willingness to act, with higher education levels and prior exposure to climate change education correlating with increased willingness. Experience with extreme weather events (EWEs) also shaped behavioral willingness, with those exposed to such events reporting a higher willingness to act. The study identifies critical encounters, including gaps in climate education and the influence of socioeconomic factors on willingness to engage in climate actions. It underscores the need for tailored interventions that address regional disparities and leverage value orientations and social norms to promote climate action among youth. Policies should prioritize integrating climate change education into formal curricula and fostering community-based initiatives to enhance societal and personal willingness to engage in mitigation efforts. Addressing perceived inefficacy through targeted campaigns can also bolster youth participation in climate action.

How to cite: Alrousan, D., Peutz, N., Young, A., Ali, M., Al-Sarihi, A., Nour Ayeh, M., and El-Obeid, D.: Transregional Study of Willingness to Engage in Climate Change Actions among Youth in the Red Sea Countries, EGU General Assembly 2025, Vienna, Austria, 27 Apr–2 May 2025, EGU25-12206, https://doi.org/10.5194/egusphere-egu25-12206, 2025.

EGU25-12907 | Posters on site | EOS2.5

Public perception on surface water-related ecosystem services in Romania 

Gabriela Ioana-Toroimac, Liliana Zaharia, Dana Maria Constantin (Oprea), Tsaralaza Jorlin Tsiavahananahary, and Dănuța Alessandra Mihalcea

The general aim of the study is to analyse the public perception on the ecosystem services related to surface water (rivers and lakes). A specific objective was to assess the level of knowledge of the population on hydroclimatic phenomena and related services. The study is based on a survey including 22 examples of surface water-related ecosystem services that were listed in a questionnaire grouped in three major types: provisioning services (6), cultural services (9), and regulating and supporting services (7).  A total of 254 local residents living river or lake side were interviewed face-to-face in Southern and Eastern Romania, in both urban and rural communities. The residents had to choose from the list those ecosystems services characterizing the neighbouring surface water. The answers showed that 20% of these local residents considered ecosystem services such as climate regulation (temperature, noise), air quality regulation (carbon sequestration) or flood risk control as being characteristic for their nearby environment. Among regulating and supporting services, the role of surface water on the biodiversity production and habitat appears to be more obvious (with up to 60% of answers) than local climate related effects. Moreover, regulating and supporting services were pinpointed by a lower number of residents when compared to provisioning services or even cultural services, respectively 40%, 61% and 51%. We concluded on a poor knowledge on hydroclimatic phenomena/processes and the ecosystem services they provide that should be countered by education based on scientific proofs, but also science popularisation.

How to cite: Ioana-Toroimac, G., Zaharia, L., Constantin (Oprea), D. M., Tsiavahananahary, T. J., and Mihalcea, D. A.: Public perception on surface water-related ecosystem services in Romania, EGU General Assembly 2025, Vienna, Austria, 27 Apr–2 May 2025, EGU25-12907, https://doi.org/10.5194/egusphere-egu25-12907, 2025.

EGU25-14883 | Orals | EOS2.5

Climate Change Education in Europe: Perceptions and Pathways for Transformation 

Sorin Cheval, Adina-Eliza Croitoru, Vladut Falcescu, Cristiano Franceschinis, Cătălin-Cosmin Glava, Cristian Iojă, Gabriele Quinti, Shreya Some, Mara Thiene, and Nicholas Vasilakos

The presentation delivers insights addressing the concepts fundamental to the linkages between climate change education and our societal dynamics, including examples of impacts at the European scale. European Green Deal and Education for Sustainable Development are core frameworks ensuring that education plays a pivotal role in achieving European climate adaptation, mitigation and sustainable development goals.

Climate change stands as one of the most critical challenges of our time, given the intensified impacts of extreme events on socio-ecological systems. Addressing the unprecedented challenges posed by climate risks demands both immediate action and a sustained long-term commitment from our societies and their citizens. Climate change education can respond to this dual perspective, helping people understand and face the consequences of the climate crisis, and empowering them with the knowledge, skills, values and attitudes needed to support and jointly apply mitigation and adaptation strategies. Education system is an important channel for building/enhancing climate culture not only for its direct “users”, but also for their entourage. Moreover, social and emotional learning in education is crucial for fostering resilience, coping with eco-anxiety, and promoting effective climate action.

Although the impacts of climate change and the measures required to address them vary across sectors and groups, education can serve as a powerful leverage point for driving cross-sectoral transformative change by breaking down silos and fostering collaboration across disciplines and sectors. The ongoing climate change has detrimental impacts on the education system, extended on short- and long-term, from local to national and even larger spatial scales. Extreme events, increasingly frequent and often associated with climate change, affect structures and infrastructures supporting the education services, as well as the education process itself in various ways, from disturbing the continuity of the activities to damaging the facilities. In affected areas, emerging climate events may further exacerbate barriers to education for vulnerable groups. The interconnectivity between education and other sectors and services makes education one of the keys to adapting to the changing environment in Europe, including the climate-driven, and socio-economic dynamics (i.e. migration, spillover effects, social equity and labour market).

The presentation highlights the findings of a survey exploring perceptions of climate change’s impacts on education in Europe, offering insights  into how education changes perception and action towards climate change, and supporting transformative changes to enhance the climate resilience of the education system. The bi-directional linkages between climate change and education as reflected in the national climate adaptation and education strategies are also discussed, specifically emphasising the role of strong leadership, innovative and cross disciplinary pedagogies, and collaborative partnerships to reimagine education systems for a climate-changed world.

This research received funds from the project “Cross-sectoral Framework for Socio-Economic Resilience to Climate Change and Extreme Events in Europe (CROSSEU)” funded by the European Union Horizon Europe Programme, under Grant agreement n° 101081377, and through the M100 initiative, “Climate-Neutral and Smart Cities: Planning, Piloting, Inspiring”, the second initiative developed under the M100 National Hub, funded by the EEA and Norway Grants through the Fund for Bilateral Relations.

How to cite: Cheval, S., Croitoru, A.-E., Falcescu, V., Franceschinis, C., Glava, C.-C., Iojă, C., Quinti, G., Some, S., Thiene, M., and Vasilakos, N.: Climate Change Education in Europe: Perceptions and Pathways for Transformation, EGU General Assembly 2025, Vienna, Austria, 27 Apr–2 May 2025, EGU25-14883, https://doi.org/10.5194/egusphere-egu25-14883, 2025.

EGU25-15706 | Posters on site | EOS2.5

Empowering Climate Change Education Through Remote Sensing Technology: Transforming Student Awareness into Action — The LAP/AUTh Research Lab 

Konstantinos Michailidis, Maria-Elissavet Koukouli, Katerina Garane, Daphne Parliari, and Dimitris Balis

Climate change poses a significant global challenge, with its effects increasingly evident through rising temperatures, extreme weather events, and deteriorating air quality. Educating school students about climate change is crucial to foster awareness and empower them with actionable knowledge to act responsibly. The Laboratory of Atmospheric Physics (LAP) at the Aristotle University of Thessaloniki, Greece, has been at the forefront of atmospheric monitoring since four decades, utilizing advanced remote sensing techniques through satellite and ground-based instrumentation. The location and continuous operation of the lab make it unique in the field of Atmospheric Remote Sensing throughout Southeastern Europe and the Mediterranean. Recognizing the urgent need to address the evolving climate crisis, LAP/AUTh can serve as a hub for promoting information and raising awareness among students about the ever-evolving scientific field of the Atmospheric Environment. By integrating real-world environmental data into educational frameworks, LAP/AUTh promote innovative learning activities and programs aimed at enhancing understanding of climate change, its causes, and its far-reaching impacts. Secondary school visits have been frequently organized since many years, where students participate in a series of activities, having the opportunity to be familiarized with modern cutting-edge technologies and research practices. This initiative bridges scientific research with the general public and education, creating the conditions for joint actions contributing to the understanding and development of critical thinking of environmental issues. In this direction and given that experiential learning is the most effective way to learn, our main goal is to turn awareness into action by promoting the teaching of climate change through modern educational practices.

How to cite: Michailidis, K., Koukouli, M.-E., Garane, K., Parliari, D., and Balis, D.: Empowering Climate Change Education Through Remote Sensing Technology: Transforming Student Awareness into Action — The LAP/AUTh Research Lab, EGU General Assembly 2025, Vienna, Austria, 27 Apr–2 May 2025, EGU25-15706, https://doi.org/10.5194/egusphere-egu25-15706, 2025.

EGU25-15778 | Orals | EOS2.5

Virtual Exchanges and Climate Education as a Tool for European Partnership Development for SDGs 

Alexander Mahura, Hanna K. Lappalainen, Julia Karhumaa, Laura Riuttanen, Aleksi Vauhkonen, Svyatoslav Tyuryakov, and Valeriya Ovcharuk and the & Erasmus+ CLUVEX, UnaVEx and ClimEd projects teams

The traditional model of in-person education is evolving, with distance learning becoming increasingly popular. Virtual Exchange (VE) enhances interest in distance education by adding interactive elements. The University of Helsinki (UHEL) coordinates two EU ERASMUS+ VE projects: “Climate University for Virtual Exchanges” (CLUVEX) and “Una Europa Virtual Exchanges for Sustainability” (UnaVEx), running from 2023 to 2026. These projects address climate change and sustainable development. Additionally, UHEL leads the ClimEd project, which offers online training on climate services, adaptation, and mitigation, incorporating VE elements.

CLUVEX and UnaVEx aim to engage up to 5,000 university students (BSc to PostDoc levels) in VEs over three years. CLUVEX integrates Climate University online courses, while UnaVEx builds on Una Europa Micro-Credential in Sustainability and the associated MOOCs. These projects, involving partners from Europe, Neighbourhood East, and Africa, are testing and refining VE as part of distance learning. During the COVID-19 pandemic, ClimEd successfully used VE for remote training with Ukrainian universities, focusing on advanced educational and communication technologies in climate services.

Students in CLUVEX and UnaVEx VEs collaborate in international groups to learn about climate change and sustainability. They earn ECTS credits and certificates like the Climate Messenger (CLUVEX) or Sustainability Advocate (UnaVEx). Similarly, ClimEd participants receive training certificates with ECTS credits. Feedback and motivation data are collected to improve the VE approach.

Since mid-2023, CLUVEX has developed resources like the Virtual Exchange Guidebook, Climate Literacy Guidebook, and Climate Messenger Code of Conduct, along with climate-related lectures and visualization tools. Six moderator training sessions in 2024 covered topics such as technical skills, MOOCs, soft skills, and CLUVEX handbooks. The first VE Week for students was held on October 14–18, 2024. UnaVEx began preparations in 2024, focusing on VE Week exercises. Moderator training started in late 2024, with the first VE Week scheduled for February and March 2025, featuring an “Introduction to Sustainability” exercise. ClimEd has successfully conducted five of seven planned trainings. The sixth, focusing on MOOC development, is scheduled for February 2025 in Estonia. The seventh, on using climatic information for climate-dependent industries, is planned for April 2025 in Spain.

Results from the initial VE Weeks of CLUVEX and UnaVEx will highlight how VEs enhance engagement in distance learning about climate issues. VEs foster skills like remote collaboration, technical proficiency, and teamwork. The ClimEd project’s completed VE-based trainings will also be summarized.

ACKNOWLEDGEMENTS

This work was supported by the EU funded Erasmus+ projects: via CLUVEX (No 101111959), via UnaVEx (No101139159), via ClimEd (No 619285-EPP-1-2020-1-FI-EPPKA2-CBHE-JP).

How to cite: Mahura, A., Lappalainen, H. K., Karhumaa, J., Riuttanen, L., Vauhkonen, A., Tyuryakov, S., and Ovcharuk, V. and the & Erasmus+ CLUVEX, UnaVEx and ClimEd projects teams: Virtual Exchanges and Climate Education as a Tool for European Partnership Development for SDGs, EGU General Assembly 2025, Vienna, Austria, 27 Apr–2 May 2025, EGU25-15778, https://doi.org/10.5194/egusphere-egu25-15778, 2025.

EGU25-16862 | Posters on site | EOS2.5

The public perception of the urban heat island phenomenon in Romania. Case study: Bucharest 

Dana Maria Constantin (Oprea), Elena Grigore, Gabriela Ioana-Toroimac, Adrian Amadeus Tișcovschi, Elena Bogan, and Raul Gabriel Ilea

The urban heat island (UHI), affects people’s health or can disturb their well-being and productivity. Is the urban population aware of this harmful phenomenon to which it is exposed? Our analysis focuses on the knowledge and understanding of the UHI in the perception of the citizens of Bucharest, the capital of Romania. Bucharest is a typical example of temperate continental city, located in an open plain area (60-90 m a.s.l.). The city has approx. 2.1 million inhabitants and extends on an area of approx. 240 km2 (about 81% of the building surface). The UHI intensity generated by the city of Bucharest is on annual average by 1-3°C higher than the open field. The analysis relies on a questionnaire, with closed questions with and without the Likert scale and semi-open questions with multiple possible answers, applied individually and directly. The questionnaires were applied to Bucharest residents in ten representative locations of pedestrian traffic in the center of the city. The sample size amounts 267 subjects, classified according to the socio-demographic indicators, such as age, gender and level of education. It was found that 41% of the respondents do not know the ‘urban heat island’ meaning term while 29% know about it. 66% of the interviewed persons consider that this phenomenon is felt in the study area, while 61% associate the presence of UHI with the higher air pollution in the city than in the surroundings. 64% also consider that the UHI is caused and maintained by the phenomenon of environmental pollution. 61% of the respondents consider that UHI is related to the current climate change and that this phenomenon will increase in the future. Based on the relatively low level of knowledge and understanding of the UHI in our analysis, we recommend the necessity to enhance the meteorological education of citizens in order to further implement socially accepted measures to diminish the UHI in Bucharest.

How to cite: Constantin (Oprea), D. M., Grigore, E., Ioana-Toroimac, G., Tișcovschi, A. A., Bogan, E., and Ilea, R. G.: The public perception of the urban heat island phenomenon in Romania. Case study: Bucharest, EGU General Assembly 2025, Vienna, Austria, 27 Apr–2 May 2025, EGU25-16862, https://doi.org/10.5194/egusphere-egu25-16862, 2025.

EGU25-21253 | ECS | Orals | EOS2.5

Leveraging a Living Lab Approach for Sustainable Olive Cultivation: Addressing Climate Challenges and Enhancing Agroecosystem Resilience 

Georgios Maneas, Christos Pantazis, Stavros Solomos, Ilias Fountoulakis, and Christos S. Zerefos

As climate change disrupts weather patterns, it becomes essential to evaluate its effects on olive farming and develop sustainable management strategies to safeguard this agricultural legacy. Rising temperatures, decreased rainfall, and extreme weather events such as droughts and floods endanger the delicate balance between traditional agricultural practices and environmental sustainability. In addition, intensive agricultural methods exacerbate these challenges, jeopardizing soil fertility, water resources, and biodiversity—essential components for sustaining olive farming as both an economic and ecological asset.

This study employs the living lab approach, a collaborative framework that integrates scientific research, stakeholder involvement, and practical experimentation to identify challenges, document traditional knowledge, and design sustainable solutions for olive agroecosystems that are practical, scalable, and suited to local realities. At the core of this living lab are field experiments focused on the monitoring of agrometeorological factors and the testing of sustainable farming practices, with a particular emphasis on soil and water management. These field experiments include the examination of the impact of herbicide application, natural vegetation mowing, and cover cropping on soil erosion in hilly orchards, as well as a comparison of conventional irrigation practices with phenology-based irrigation and rainfed systems to evaluate water-use efficiency. The findings of these field experiments offer valuable insights for improving soil health, enhancing plant growth, and optimizing olive oil production while minimizing environmental impact. The initiative emphasizes capacity building through regular workshops and field demonstrations, facilitating knowledge exchange and skill development among stakeholders. Farmers receive practical guidance in adopting sustainable practices, and the initiative promotes the use of digital tools and remote sensing technologies to inform and enhance soil and water management decisions.

By fostering collaboration, innovation, and the integration of local knowledge, the living lab approach offers a powerful model for addressing the challenges of olive farming. It demonstrates how participatory experimentation can bridge the gap between preserving cultural heritage and ensuring the long-term sustainability of olive cultivation, safeguarding its ecological and economic value for future generations.

How to cite: Maneas, G., Pantazis, C., Solomos, S., Fountoulakis, I., and Zerefos, C. S.: Leveraging a Living Lab Approach for Sustainable Olive Cultivation: Addressing Climate Challenges and Enhancing Agroecosystem Resilience, EGU General Assembly 2025, Vienna, Austria, 27 Apr–2 May 2025, EGU25-21253, https://doi.org/10.5194/egusphere-egu25-21253, 2025.

EGU25-2164 | ECS | PICO | EOS1.6

Communicating uncertainty in extreme event attribution to the media 

Johanna Knauf, Theresa Zimmermann, Jonas Schröter, Miriam Tivig, and Frank Kreienkamp

This work examines the extent and form in which uncertainty of Extreme Event Attribution (EEA) results is best communicated to stakeholders. To achieve this, we develop communication materials in both text and graphics and test them for accuracy and accessibility through guided interviews with scientists and stakeholders.

Extreme weather events pose significant challenges for human civilization. Climate change can influence both the intensity and probability of specific extreme weather events, such as heatwaves or heavy rainfall. EEA has become an established tool to answer public questions about the contribution of climate change to such events. However, the results of EEA studies are often accompanied by considerable uncertainties. Communication of results, including an accessible representation of uncertainty, is therefore a fundamental necessity in this field of research, extending beyond the general effort to make scientific findings accessible to the public. Media representatives, who often bridge the gap between attribution scientists and the public, are therefore key stakeholders in this research.

We present the current state of research on communicating uncertainties in this field and outline our iterative approach to working with attribution scientists and media representatives alike to determine what should be communicated and how to communicate it effectively. Finally, we evaluate which communication materials are both relevant and accessible, and we reflect on the lessons learned for future communication efforts concerning EEA results.

This study is part of ClimXchange, which aims to enhance the usability of climate science for societal stakeholders. ClimXchange is embedded within the ClimXtreme research consortium, funded by the German Federal Ministry of Education and Research (BMBF), which focuses on extreme weather events in the context of climate change.

How to cite: Knauf, J., Zimmermann, T., Schröter, J., Tivig, M., and Kreienkamp, F.: Communicating uncertainty in extreme event attribution to the media, EGU General Assembly 2025, Vienna, Austria, 27 Apr–2 May 2025, EGU25-2164, https://doi.org/10.5194/egusphere-egu25-2164, 2025.

EGU25-4471 | PICO | EOS1.6

Communicating uncertainty in weather forecasts: the role of forecast changes 

Gabriele Messori, Stephen Jewson, and Sebastian Scher

Skilful weather forecasts help users make sound decisions when faced with potentially hazardous climatic conditions. However, this beneficial result may be reduced or negated in the absence of an effective communication of forecast uncertainty. On average, forecast skill improves for shorter lead times, which implies that we expect differences between successive forecasts. While there is a vast literature on the communication and visualisation of weather forecast uncertainty, little attention has been dedicated to communicating forecast changes to non-specialist audiences. Nonetheless, this is a key dimension of forecast uncertainty, and there are several user cases in which providing information about possible future changes in weather forecasts can improve their use.

An illustrative example is the situation in which a user has to decide whether to act now or wait for the next forecast. This can be as simple as a professional deciding whether to drive or not to a client on a day for which extremely heavy rainfall is forecasted, potentially leading to flash flooding. Cancelling well-ahead of time makes rescheduling easier, yet the forecast has a larger chance of being wrong. Cancelling on short notice minimises the chance of a false alarm, but poses greater logistical challenges for both the professional and the client. Something as simple as knowing how often the later forecast is better – for example knowing that 9 times out of 10 a heavy rainfall forecast issued one day ahead is better than one issued 5 days ahead – can qualitatively help the non-specialist users in this fictitious example to make a more informed decision.

In this contribution, we consider a variety of cases in which information on forecast changes may be of value. We then present a set of easily interpretable metrics making information on such changes accessible to non-specialist users.

How to cite: Messori, G., Jewson, S., and Scher, S.: Communicating uncertainty in weather forecasts: the role of forecast changes, EGU General Assembly 2025, Vienna, Austria, 27 Apr–2 May 2025, EGU25-4471, https://doi.org/10.5194/egusphere-egu25-4471, 2025.

Whether its memories of a cold, frosty Christmas or an August bank holiday beach trip interrupted by rain, many cultural, sporting, and social events in the United Kingdom have strong associations with particular weather conditions. As the average global temperature increases, the impacts of a changing climate are likely to be felt across many aspects of British life, including in the public’s experiences of these popular events. Several recent works conducted by the UK Met Office have sought to make the local day-to-day impacts of climate change more understandable for the public by exploring likely climatic conditions of popular events by the 2050s. These works have received strong engagement from the public, demonstrating the demand for relevant and understandable climate information.

We serve this demand by using the 2018 UK Climate Projections (UKCP18) and HadUK-Grid observations data to evaluate how climate change will affect the climatology of a diverse range of British social, cultural, and sporting events. To explore and communicate the uncertainties in UKCP18 due to inherent model biases, several bias correction methods are applied to the data and the resulting data is analysed together to give an improved uncertainty range. The research will focus on assessing changes to temperature variables at global warming levels of 1.5°C and 3.0°C to illustrate these two future scenarios and the uncertainty within each scenario.

We will show that some events are likely to have a significantly altered climatology which is likely to substantially change the nature of these events or force them to change when they occur during the year to give the best chance of having favourable climatic conditions. By assessing the impact of climate change on popular British events such as the London Marathon and Glastonbury Festival the findings of this research will prove useful in communicating the impacts of climate change in a way which will resonate with the British public.

How to cite: Woods, L., Pope, J., and Fung, F.: Impacting on our Lives: Using British sports and culture to explain uncertainty in climate projections, EGU General Assembly 2025, Vienna, Austria, 27 Apr–2 May 2025, EGU25-9081, https://doi.org/10.5194/egusphere-egu25-9081, 2025.

Flood frequency analysis is a cornerstone of hydrologic studies, providing a probabilistic framework to relate the magnitude of extreme events to their frequency of occurrence. This methodology is critical for designing flood-related infrastructure, conducting economic evaluations of flood control projects, and delineating floodplains. However, its utility depends heavily on data quality, model selection, and parameter estimation, each of which introduces uncertainties that become especially significant for rare events.

This presentation will address key sources of uncertainty, including model choice, parameter inference methods, and sample size limitations. Strategies for incorporating these uncertainties into engineering practice are discussed, with an emphasis on probabilistic representations and innovative design approaches. An exceptional flood, a "black swan" event, is used to illustrate the paradox of increased uncertainty despite improved information. This case underscores the importance of expanding flood analyses through historical records, regionalization, and causal modeling, particularly in the context of a changing climate.

The presentation will be designed to foster cross-discipline exchange in the quantification of uncertainty in Earth Sciences.

How to cite: Viglione, A.: Flood Frequency Hydrology: Navigating Uncertainty in Flood Design, EGU General Assembly 2025, Vienna, Austria, 27 Apr–2 May 2025, EGU25-11466, https://doi.org/10.5194/egusphere-egu25-11466, 2025.

EGU25-13135 | PICO | EOS1.6

Visualization of uncertainties in 2D images 

Peter Dietrich, Husain Najafi, Michael Pelzer, and Solmaz Mohadjer

Two-dimensional (2D) images are often used to communicate the results of scientific investigations and predictions. Examples are weather maps, earthquake hazard maps and MRI slices. In contrast to statistical analyses of individual variables or time series, there are currently no established methods for visualizing the uncertainties in the 2D images. However, this would be necessary to make the information in the 2D images clear to scientists as well as to the non-expert public audiences in order to avoid misinterpretation and over-interpretation.

In this study, we demonstrate the challenges and approaches to uncertainty visualization using the case study of drought forecasting, which is relevant for climate adaptations and mitigations. A drought is a deviation (anomaly) from the parameter value expected from long-term data. In our case, the parameter under consideration is soil moisture, which is an important parameter for various environmental processes. The soil moisture can be used in combination with soil type to estimate the amount of water available to plants in the topsoil. If the amount of water available to plants according to the so-called percentile approach deviates significantly from the value expected from long-term data, this is referred to as an agricultural drought.

The drought forecast is based on ensemble modelling. This means that the results of various weather forecast models are used to predict the development of soil moisture for the period of the weather forecast. For each weather model used, a possible soil moisture development is predicted. Each of these is used for a drought forecast. The result of the ensemble modelling is therefore several forecasts, which can differ significantly. Due to the use of different weather models and the consideration of uncertainties in the models, the result of ensemble modelling is therefore a large number of drought forecast maps. When visualising the results, often only a map of the mean values resulting from the predictions is shown. If only the mean value is displayed, however, the information about a possible difference and thus the uncertainty of the predictions is lost. In other words: If individual cases from the ensemble predict the possibility of drought, this will not be clearly visible in the mean value map.

In this presentation, we will demonstrate and discuss different approaches to visualize the uncertainty in the prediction.

How to cite: Dietrich, P., Najafi, H., Pelzer, M., and Mohadjer, S.: Visualization of uncertainties in 2D images, EGU General Assembly 2025, Vienna, Austria, 27 Apr–2 May 2025, EGU25-13135, https://doi.org/10.5194/egusphere-egu25-13135, 2025.

EGU25-13260 | PICO | EOS1.6

Non-expert understanding of hazard maps: Insights from an online survey 

Peter Dietrich, Michelle Dietrich, Michael Pelzer, and Solmaz Mohadjer

Uncertainties are an unavoidable part of scientific research. Practical limits with regard to the number, accuracy and precision of available observations as well as limitations in terms of methodological accuracy and modelling contribute to the fact that even the most elaborate and meticulous forecasts can never be deterministic and no completely reliable and accurate predictions for decision-making can be achieved. In concrete applications, a sufficient understanding of the accuracy and reliability of scientifically based predictions is important, for example in disaster prevention or resource planning. For example, natural hazard maps are primarily intended for those who have the necessary expertise to understand them. However, they are also used in their unaltered form by non-experts for decision-making, many of whom are unfamiliar with the scientific background and implications of the map.

We address this problem using an earthquake hazard map which can be relevant to non-expert audiences when seeking advice on purchasing a house or obtaining insurance. In order to understand how non-experts perceive a scientifically compiled earthquake hazard map, we conducted an online survey with 229 participants. This was done as part of the 2024 Science & Innovation Days (a public engagement event) in Tübingen, Germany. Participants were asked about their first impression of the map in terms of information content, any need for further explanation and possible actions to take. Other questions assessed participants’ previous experiences and self-assessment of hazard perceptions.

In this presentation, we will discuss the survey results and share lessons learned when communicating information that contains uncertainty with non-expert audiences.

How to cite: Dietrich, P., Dietrich, M., Pelzer, M., and Mohadjer, S.: Non-expert understanding of hazard maps: Insights from an online survey, EGU General Assembly 2025, Vienna, Austria, 27 Apr–2 May 2025, EGU25-13260, https://doi.org/10.5194/egusphere-egu25-13260, 2025.

Working with environmental data means dealing with complex processes, limited data (in space and/or time) and the impossibility of setting up controlled experiments, leading to uncertain predictions of system behaviour.

In the field of statistical hydrology, many efforts have been made during the last decades to provide methods to quantify uncertainty, but the common practice of infrastructure design has not yet incorporated them. This may be due to several reasons, including the complexity of the methods, which are often difficult to apply in most everyday cases, and regulations that "favour" well-established requirements.

Here we present the "uncertainty compliant design flood estimator" (UNCODE) method, which accounts for aleatory uncertainty in the estimation of the design flood value. The method provides a corrected design value and is easy to use for practical purposes as simplified formulae are provided to quantify the correction factor. However, in addition to its practical application, it can also be used to compare different models with different levels of uncertainty and to highlight the "cost" of uncertainty.

Finally, its mathematical formulation allows a direct link to be made between the classical approach to hydrological design, based on a fixed hazard level (or return period), and a risk-based design approach, which is widely recognised as a more flexible method but is not usually included in regulations.

How to cite: Ganora, D.: Uncertainty in flood frequency analysis and its implications for infrastructure design, EGU General Assembly 2025, Vienna, Austria, 27 Apr–2 May 2025, EGU25-15189, https://doi.org/10.5194/egusphere-egu25-15189, 2025.

EGU25-17779 | ECS | PICO | EOS1.6

Non-Expert Understanding of Hazard Maps: An Eye-Tracking Study  

Solmaz Mohadjer, Gökce Ergün, Sebastian G. Mutz, Max Schneider, Tom Schürmann, Michael Pelzer, and Peter Dietrich

Maps are the most commonly used means of visualizing and communicating natural hazard information to support decisions about risk mitigation. They are a product of hazard assessment studies which involve different input parameters with uncertainties relevant to decision making. This process is further complicated by the subjective uncertainties that arise in the audience when confronted with the visualization of hazard information. 

Natural hazard maps are primarily designed to be used by experts, but they are also used in their unaltered form to communicate with non-experts, many of whom are unfamiliar with the map’s scientific background and implications. Previous studies focus mainly on evaluating such maps with expert groups (e.g., directly involved stakeholders and authorities), with less attention on non-experts (e.g., the public audiences) who are confronted with these maps before purchasing a house, getting insurance or making other critical decisions. 

To address this gap, our study investigates how well hazard maps are understood and interpreted by non-expert audiences. We tested two earthquake hazard maps of Germany that differ in color palettes (rainbow vs. colorblind-friendly and perception-optimized yellow-orange-red-brown color palettes) and data classification schemes (algorithmic Fisher vs. quasi-logarithmic classification schemes). We showed both maps to 20 non-expert participants during the 2024 Science & Innovation Days (a public engagement event) in Tübingen, Germany. Participants answered map-reading and hazard perception questions (e.g., participants were asked to read off the hazard level for a given city, and to compare hazard levels between for a pair of cities) while their eye movements were monitored with eye-tracking software. 

To identify if either map improved map reading and hazard perception, participants’ responses were scored, analyzed and compared using a two-sample Mann–Whitney U and Fisher’s Exact tests. In general, the differences detected in participants’ responses were not statistically significant, perhaps due to the small sample size. Still, we observed that nearly all participants who used the redesigned map (8 out of 9) correctly read the hazard level for a city while only 33% (3 out of 9 participants) who used the rainbow color map responded correctly.

Eye-tracking data were used to analyze focus-metrics. Composite heatmaps accumulating the duration of eye fixations of all participants indicate that their eye movements were focused more on the high hazard zones and the corresponding values shown on map legend when answering questions using a hazard map redesigned to use best practices for hazard perception.

To quantify these differences, the ratio of fixations on high-hazard zones to total fixations on the map were calculated for both map versions. The data were tested for normality and the statistical significance of the differences were evaluated using Independent Samples t-tests for equal variances. While the results were not statistically significant, participants viewing the redesigned map showed a greater number of fixations on high-hazard zones compared to the participants viewing the original map, with a moderate effect size. We note tendencies in the data that encourage the repetition of the experiment with a larger sample size.

How to cite: Mohadjer, S., Ergün, G., Mutz, S. G., Schneider, M., Schürmann, T., Pelzer, M., and Dietrich, P.: Non-Expert Understanding of Hazard Maps: An Eye-Tracking Study , EGU General Assembly 2025, Vienna, Austria, 27 Apr–2 May 2025, EGU25-17779, https://doi.org/10.5194/egusphere-egu25-17779, 2025.

A presentation of emerging themes and lessons learnt from examples of best practice in uncertainty quantification and communication relevant to climate services.  Drawn from existing literature and reports, and from a community engagement workshop.

  • Consider the climate risks that are of most concern to the audience. 
  • Use language the audience is familiar with (don’t say uncertainty).
  • The precision of uncertainty information should be relevant to the situation.
  • Understand existing narratives about climate uncertainty.
  • Use communication about uncertainty to build trust.
  • Be aware of deep uncertainty.

Standardised approaches to uncertainty communication should consider not only the climate science component, but also the complexities regarding socio-economic vulnerability.

Climateurope2, is a Horizon Europe project with a consortium of 33 parties from 13 countries that includes intergovernmental institutions such as the World Meteorological Organisation, social sciences, humanities and STEM expertise, assurance providers, SMEs, and standardisation bodies. Together we are building a community of practice for the standardisation and support of climate services.

How to cite: Pascoe, C., Dankers, R., Domingo, X., and Pagé, C.: Don't say uncertainty: preliminary best practices and emerging themes for uncertainty quantification and communication in climate services from the Climateurope2 project., EGU General Assembly 2025, Vienna, Austria, 27 Apr–2 May 2025, EGU25-18364, https://doi.org/10.5194/egusphere-egu25-18364, 2025.

The recent COVID-19 pandemic highlighted the need to effectively communicate forecasts and their uncertainty. This is especially important if the aim is to minimize the risk of misinformation and poorly-informed decision-making. Both the IPCC and the Sendai Framework for Disaster Risk Reduction have identified risk communication, complexity and uncertainty as major challenges to decision-making, and call for better understanding of how existing risk communication practices are perceived by those affected and those making decisions.

Despite these calls, many geoscientists, especially early career researchers, lack opportunities to discuss scientific uncertainty and explore ways to communicate uncertainty to different audiences, including the non-scientific publics. To address this demand, we organize the international training school “Understanding the Unknowns: Communicating Uncertainty as a Driving Force for Geosciences”, which is co-sponsored by the EGU and set to take place at the University of Tübingen in Germany from March 17 to 19, 2025. This in-person, three-day training school aims to equip Early Career Researchers with knowledge and skills needed to effectively account for and communicate uncertainty in geosciences with their peers as well as public audiences.

Some of the biggest challenges of training programs on uncertainty relate to the interdisciplinary nature of the concept: understanding and effectively communicating uncertainties requires knowledge and skill sets typically taught and researched across a range of diverse fields. Highlighting this interdisciplinary background, we combine insights from geoscientific uncertainty assessment and outputs (e.g., maps, interpretations, models, simulations, time series) with approaches from (visual) rhetoric, science communication, presentation research, and multimedia competence. 

Building on existing good practice, the training strives to equip geoscientists with the tools and skills they need to communicate uncertainty, help reduce misinformation, and enhance future decision-making. This will be done collaboratively through an interdisciplinary partnership between the Department of Geosciences, the Research Center for Science Communication at the Department of General Rhetoric, and Global Awareness Education at the University of Tübingen. The new approaches and exercises developed for this training will not only be practically applied in the training school, but also reflected and evaluated, including a pre-workshop survey addressing expectations and needs identified by the participants and a concluding qualitative evaluation.

In this presentation, we will discuss our multifaceted practices and strategies applied to foster skills in communicating uncertainty in geosciences, present the results of the accompanying survey and evaluation used in this training, and conclude with lessons learned and best practices recommended to further develop similar opportunities in the future.

How to cite: Pelzer, M., Dietrich, P., and Mohadjer, S.: Fostering Skills in Communicating Uncertainty in the Geosciences: a review of concepts, strategies and approaches applied in the training school “Understanding the Unknowns: Communicating Uncertainty as a Driving Force for Geosciences”, EGU General Assembly 2025, Vienna, Austria, 27 Apr–2 May 2025, EGU25-18655, https://doi.org/10.5194/egusphere-egu25-18655, 2025.

Sub-seasonal weather forecasting is notoriously difficult, particularly for the extra-tropics. Predictions must be probabilistic, and from weeks 3 or 4 onwards forecast distributions are often very close to model-climate distributions. Together, these facts make conveying a meaningful forecast to customers extremely difficult, and those forecasts are then very vulnerable to misinterpretation. Standard map-based graphical output can show little more than whether the forecast mean is for average, or above average or below average conditions – ostensibly a 3-category classification. And indeed “average” in this scheme can be interpreted variously as a genuine forecast of average, or a “no-signal” prediction, which cannot both be right.

So ECMWF is working towards a new two-layer brand of map-based sub-seasonal forecast products, that succinctly represent both the mean anomaly and the forecast uncertainty. We plan to call these “quantile-based weekly guidance maps”. The overarching aim has been to exploit much better than hitherto the information content of the sub-seasonal forecast system in a compact format. Once these first go public they will be classed as an “experimental product”. We hope for wide-ranging uptake, providing greater outreach for our forecasts than hitherto, to benefit multiple sectors of society.

The new graphical output can be summarised in a 3-by-3 matrix form where one dimension represents the mean anomaly and the other relative spread. So for example a mean anomaly around zero can either represent a high confidence, narrow distribution forecast of average conditions (a true forecast of “average”), or more commonly a no-signal forecast where forecast and climate distributions are much the same (= “we don’t know”), or less often an odd scenario in which forecast spread exceeds climate spread (= “very uncertain indeed”). The graphical versions of the new system, and the 9 classes, will be demonstrated using real ECMWF forecast examples. These will highlight how translating appropriately chosen mathematical metrics into suitable graphics, and on into plain language text, can lie at the heart of successful uncertainty communication. Clear documentation for users is another key requirement.

How to cite: Hewson, T.: Making Uncertainty in Sub-seasonal Weather Forecasts Intelligible, EGU General Assembly 2025, Vienna, Austria, 27 Apr–2 May 2025, EGU25-19375, https://doi.org/10.5194/egusphere-egu25-19375, 2025.

EGU25-21809 | ECS | PICO | EOS1.6

Immersed in Uncertainty: Discussing Uncertainty in Science in a Planetarium 

Jakub Stepanovic, Sandy Claes, and Jan Sermeus
Uncertainty is an inherent part of the nature of science (NoS), and its communication is essential to maintain scientific transparency and credibility. Yet, current teaching on the topic is insufficient, leaving many with naïve views of NoS. Following calls to integrate uncertainty as a core component of science education and support NoS instruction with real-world examples, we designed an interactive learning experience conveying uncertainties in planetary science stemming from missing data and using artificial intelligence for a planetarium lecture. We were particularly interested in how interaction in the immersive planetarium settings impacts the audience's engagement with the lecture and, thus, uncertainty in science. The experience was presented to adolescents and adults attending the planetarium, and we collected feedback from 343 participants. Here, we share insights from the development, discuss interactive methods that significantly improved the audience's engagement, and share the participants' perspectives on uncertainty in science. We conclude by examining the pillars of NoS to clarify and define the presence of uncertainty and provide considerations for science communicators and educators. 

How to cite: Stepanovic, J., Claes, S., and Sermeus, J.: Immersed in Uncertainty: Discussing Uncertainty in Science in a Planetarium, EGU General Assembly 2025, Vienna, Austria, 27 Apr–2 May 2025, EGU25-21809, https://doi.org/10.5194/egusphere-egu25-21809, 2025.

EGU25-1046 | ECS | Orals | NH9.10

Global mapping of urban climate adaptation derived from text-mining of local plans 

Sruti Modekurty, Tais Maria Nunes Carvalho, Ni Li, Christian Kuhlicke, and Mariana Madruga de Brito

Cities are increasingly faced with intensifying climate impacts and natural hazards such as floods, droughts, and wildfires. Despite ongoing adaptation efforts to improve social resilience, knowledge about adaptation progress is scattered. Municipal climate plans contain a wealth of information about local adaptation planning and policies, but are seldom studied at a large scale due to their unstructured nature. Here, we use a series of natural language processing (NLP) techniques to extract information on planned adaptation measures for 548 cities with over 1 million inhabitants worldwide. Results reveal a bias toward flood hazards, with cities in the Global South underrepresented, covering only 50% of the target cities. Using the BERTopic seeded topic model, we found that measures related to water management and nature-based solutions were predominant, with some variation across regions. This global mapping provides a starting point for understanding adaptation progress and its gaps, offering a scalable methodology for analyzing municipal adaptation efforts across diverse, multilingual contexts.

How to cite: Modekurty, S., Maria Nunes Carvalho, T., Li, N., Kuhlicke, C., and Madruga de Brito, M.: Global mapping of urban climate adaptation derived from text-mining of local plans, EGU General Assembly 2025, Vienna, Austria, 27 Apr–2 May 2025, EGU25-1046, https://doi.org/10.5194/egusphere-egu25-1046, 2025.

EGU25-2839 | ECS | Posters on site | NH9.10

Evaluating the Effectiveness and Potential of Urban Planning for Enhancing Flood Resilience in the Pearl River Delta, China 

Anqi Zhu, Wenhan Feng, Liang Yang, Yimeng Liu, Yuhan Yang, Junqi Mao, Qingsong Xu, Wenhao Wu, and Tianyi Sun

While flood adaptation measures are critical to cope with flood impacts, there is a lack of quantitative evaluations of the effectiveness and potentials of the various measures. Even in flood risk assessments that incorporate spatial attributes, the influence of adaptation planning and policies in enhancing flood resilience is often underestimated. Urban planning, including master plans, land use plans, and infrastructure plans, reflects the government’s vision for the city’s future and encompass targeted risk management strategies that will be implemented. This study explores whether and how much urban planning, when effectively implemented, can sufficiently mitigate the anticipated future flood risks. Focusing on the nine cities as a metropolitan area at the Pearl River Delta (PRD) in China, we did a comprehensive collection of  various planning schemes that modify original terrain conditions, alter natural hydrological process, store and drain flood water, as well as warn and relief people and properties in flood. Measures in the plans are integrate into a flood risk assessment model. By conducting flood simulations under various future climate scenarios, we evaluate the effectiveness of urban planning across the nine cities in PRD region. The findings indicate that flood risk in the PRD cities can be significantly reduced once the planned measures are implemented. The findings underscore the  role of urban planning as a key representative of governance tools in strengthening flood resilience, while demonstrating the potential of government-led resilience-building policies and initiatives. Combing with extensive individual actions in flood emergency, future flood loss in the PRD area may demonstrate less increase than flood risk does. This research also presents a methodological framework for incorporating planning measures into flood risk simulation to evaluate their effectiveness in enhancing flood resilience. 

How to cite: Zhu, A., Feng, W., Yang, L., Liu, Y., Yang, Y., Mao, J., Xu, Q., Wu, W., and Sun, T.: Evaluating the Effectiveness and Potential of Urban Planning for Enhancing Flood Resilience in the Pearl River Delta, China, EGU General Assembly 2025, Vienna, Austria, 27 Apr–2 May 2025, EGU25-2839, https://doi.org/10.5194/egusphere-egu25-2839, 2025.

The growing intensity of climate change has made developing countries to face mounting challenges in adapting to its multifaceted impacts. Pakistan and Bangladesh, as two of the most climate-vulnerable nations in South Asia, face increasing risks from floods, cyclones, droughts, and rising sea levels. While national policies and frameworks for climate and disaster management exist, the effectiveness of their implementation largely depends on the agility and responsiveness of bureaucratic structures. The coping capacity of bureaucracies in both countries has improved over the years, but the system’s capacity to adapt to uncertain climate challenges remains a vulnerability. The paper explores the resilience and institutional capacity of bureaucracies in Pakistan and Bangladesh to adapt to climate-induced threats. The paper analyses structural strengths, weaknesses, and reform trajectories within the bureaucracies of Pakistan and Bangladesh to assess their capacity to respond, recover and most importantly adapt to climate-induced threats. By drawing on case studies, Cyclone Amphan (Bangladesh) and Floods 2022 (Pakistan), policy analysis, and stakeholder involvement the research identifies governance bottlenecks, resource limitations, and political factors that influence institutional adaptation. The findings offer comparative insights and highlight pathways for strengthening bureaucratic resilience, fostering cross-sector collaboration, and integrating local communities into national resilience strategies. The paper concludes with policy recommendations aimed at enhancing institutional flexibility and long-term governance reforms essential for building sustainable climate resilience in both nations.

Key Words: Pakistan, Bangladesh, Cyclone, Floods, Adaptation, Resilience, Capacity, Bureaucracy

How to cite: Noor, S. and Ali, A.: Resilient Bureaucracies? Examining the Institutional Capacity for Climate Adaptation in Pakistan and Bangladesh, EGU General Assembly 2025, Vienna, Austria, 27 Apr–2 May 2025, EGU25-2892, https://doi.org/10.5194/egusphere-egu25-2892, 2025.

EGU25-5341 | ECS | Posters on site | NH9.10

Patterns of nighttime urban heat island patch in mega urban agglomerations: a case study in the Pearl River Delta, China 

Han Wang, Tengyun Yi, Yanchi Lu, Yuan Wang, and Jiansheng Wu

Urban heat islands (UHI) effects across metropolitan areas poses substantial threats to both ecosytems and local residents with the risks associated with intensifying nighttime temperature, however, the patterns and evolution of nighttime UHI remain poorly understood. Taking the Pearl River Delta (PRD) in China as a case of mega urabn agglomeration, this study first integrated geostatistical models and exponential decay models to extract the urban heat island patches (UHIP) from 2003 to 2019, then evaluated the UHI effects and spatial patterns of UHIP, and finally investigated the influencing factors of the nighttime UHI intensity (UHII). The results showed that: (1) a significant clustering pattern of nighttime UHII and an increasing trend of annual nighttime UHII were observed. (2) Patch expansion categories revealed diverse UHI evolution modes, of which the spatial-temporal dynamics were found with landscape metrics, and the UHII in enclave-type, infill-type, and edge-type patches decreased successively. (3) Socioeconomic factors showed a significant positive correlation with UHII, simultaneously, environmental and landscape factors exhibited spatially dependent impacts both within and outside the UHIP. These findings underscore the need for urban planning strategies considering the heterogeneity and dynamics of nighttime UHI towards climate adaptation and urban resilience improvement in mega agglomerations.

How to cite: Wang, H., Yi, T., Lu, Y., Wang, Y., and Wu, J.: Patterns of nighttime urban heat island patch in mega urban agglomerations: a case study in the Pearl River Delta, China, EGU General Assembly 2025, Vienna, Austria, 27 Apr–2 May 2025, EGU25-5341, https://doi.org/10.5194/egusphere-egu25-5341, 2025.

EGU25-5925 | Posters on site | NH9.10

Evolution of Social Resilience to Flood Hazards in the Tea-Horse Road Area, Southwest China 

Liang Emlyn Yang, Mei Ai, and Siying Chen

The ancient Tea-Horse Road has been a network of trade routes linking Southwest China to Tibet, Southeast Asia, and beyond for over a millennium. The regions along this route, which traverse complex terrains and diverse ecosystems, have historically been vulnerable to natural hazards, particularly floods. This study provides a millennium-scale perspective on the evolution of social resilience to flood hazards in key areas along the Tea-Horse Road, focusing on how communities have adapted to the recurring threat of floods through time. This research identifies key periods in which social resilience to floods either strengthened or weakened, linked to shifts in political governance, technological advancements, and environmental changes. During the Tang and Song dynasties, the expansion of trade along the Tea-Horse Road coincided with the construction of flood control measures such as embankments and water diversion systems. These infrastructural developments were coupled with strong local governance and communal labor systems, which enabled communities to respond collectively to flood events. However, periods of political instability, such as during the Ming and early Qing dynasties, saw a decline in these coordinated efforts, leading to increased flood vulnerability. The adaptability of these communities also manifested through agricultural diversification, with the cultivation of flood-tolerant crops and the development of terraced farming techniques that reduced soil erosion and water runoff during heavy rains. The study also explores the role of cultural factors in fostering resilience. The transmission of flood-related knowledge through oral traditions, local customs, and festivals contributed to long-term social learning, allowing communities to adjust their strategies in response to changing environmental conditions. In recent decades, strategies for flood resilience are being enhanced by the infrastructure development, urbanization, and technical innovations. This study highlights the promising potential of integrating traditional knowledge systems, community-based approaches, and modern technological solutions to enhance resilience in the face of increasing environmental uncertainties.

How to cite: Yang, L. E., Ai, M., and Chen, S.: Evolution of Social Resilience to Flood Hazards in the Tea-Horse Road Area, Southwest China, EGU General Assembly 2025, Vienna, Austria, 27 Apr–2 May 2025, EGU25-5925, https://doi.org/10.5194/egusphere-egu25-5925, 2025.

EGU25-8400 | ECS | Orals | NH9.10

Public support for flood adaptation strategies: Key findings from the Southeast Asia region 

Anh Cao, Justin Valdez, Miguel Esteban, Danh Thao Nguyen, Rukuh Setiadi, Hiroshi Takagi, Lam Huynh, and Kei Yoshimura

Coastal deltaic cities are facing increasing flood risks due to sea level rise, climate change, and socio-economic development, particularly those in Southeast Asia. In such context, public support for adaptation policies is crucial to ensure timely adaptation and to enhance societal capacity, contributing to climate resilience. However, various adaptation policies being implemented have encountered a lack of public support, leading to inefficient adaptation processes (ex., the Garuda project in Jakarta, a relocation project in the Philippines, the raising of roads in Ho Chi Minh City, or the super levee project in Tokyo). There is a lack of understanding of what leads to public support for adaptation strategies and the relationships between these factors. Cao et al. (2024) set the foundation to examine how to analyze public support for adaptation policies, proposing the Foundation of Adaptation Policy Support (FAPS) model, and using Tokyo as a case study.

The present study applies the FAPS model (Cao et al., 2024) to a number of Southeast Asian cities, including Manila, Ho Chi Minh City and Jakarta, gauging the three categories, including risk perception (perceived severity and vulnerability, climate change belief, knowledge about floods, flood experience, and issue importance), policy perception (policy awareness, perceived effectiveness, additional benefits, policy support, and preparedness and response), and psychological factors (negative feelings, social norms, trust, environmental attitudes, and place attachment). In the presentation, the authors will discuss the preliminary results of the latest fieldwork in the case study cities, discuss regional similarities and differences between countries, and highlight the key factors that determine policy support for flood adaptation strategies in Southeast Asia cities.

Reference:

Cao, A., Esteban, M., & Onuki, M. (2024). Public support for flood adaptation policy in Tokyo lowland areas. Climate Policy, 1–18. https://doi.org/10.1080/14693062.2024.2371405

How to cite: Cao, A., Valdez, J., Esteban, M., Nguyen, D. T., Setiadi, R., Takagi, H., Huynh, L., and Yoshimura, K.: Public support for flood adaptation strategies: Key findings from the Southeast Asia region, EGU General Assembly 2025, Vienna, Austria, 27 Apr–2 May 2025, EGU25-8400, https://doi.org/10.5194/egusphere-egu25-8400, 2025.

EGU25-10279 | Orals | NH9.10

An Assessment Framework of Adaptive Capacity to Multi-hazard Climate Health Risks and Its Application in China 

Congkai Hong, Shangchen Zhang, Yanqing Miao, Jing Shang, Mengzhen Zhao, Shihui Zhang, Chi Zhang, Yujuan Wang, and Wenjia Cai

Climate change has posed significant health risks to human health and stimulated global attention to climate health adaptation. Wherein, assessing climate health adaptive capacity (AC) is fundamental for designing adaptation strategies and monitoring adaptation progress. However, existing assessment frameworks mainly took into account material determinants like economic resources and infrastructure but lacked consideration of non-material ones such as adaptation institutions, climate health knowledge, and social equity. Meanwhile, the majority of assessments only focus on health risks of one specific climate hazard like heatwaves or floods, with few considering multiple hazards simultaneously. Given the different climate health risks and disparities in socioeconomic development levels among provinces, it is meaningful to carry out the assessment at the provincial level in China, where no previous study on climate health AC has been done before. We aim to design a comprehensive assessment framework on AC with considerations on multi-hazard climate health risks and non-material determinants, and apply this framework in China. We build an index-based assessment framework for AC to multi-hazard climate health risks based on six determinants: institutions, economic resources, infrastructure, science & technology, knowledge, and equity. Using the Fuzzy Comprehensive Evaluation method, we calculate AC for 31 provinces in China (excluding Hong Kong, Macao, and Taiwan) in 2012–2022 and analyze spatial-temporal patterns of AC and its determinants. We find that high-AC provinces were Beijing, Shanghai, Jiangsu, and Zhejiang–relatively affluent–while low-AC ones were Yunnan, Tibet, and Qinghai–relatively impoverished. In 2012–2022, overall AC has gradually increased, it was driven by improvements of institutions and economic resources, whereas contributions from science & technology and knowledge were limited. Spatially, AC exhibited “strong in the east, weak in the west” and “strong in the coastal, weak in the inland”. The spatial disparities have increased overall between the east and west, while decreased slightly in 2020–2022. It was caused by disparities in institutions, economic resources, and equity across provinces. Based on findings above, on the one hand, due to significant provincial disparities in climate health risks, enhancing AC highly relies on knowledge and scientific analysis of risk characteristics and local socioeconomic conditions. Thus, it is essential to leverage potential of climate health science & technology, as well as scientific and local knowledge to further enhance AC in the future. On the other hand, the provincial inequality of AC may lead to insufficient response to climate health risks in western inland provinces, and also drag the overall health adaptation process of China. Efforts should be addressed on these institutions, economic resources, and equity to promote regional coordinated enhancement of AC including environmental health risk assessments, investment in climate health adaptation, and accessibility of public health services.

How to cite: Hong, C., Zhang, S., Miao, Y., Shang, J., Zhao, M., Zhang, S., Zhang, C., Wang, Y., and Cai, W.: An Assessment Framework of Adaptive Capacity to Multi-hazard Climate Health Risks and Its Application in China, EGU General Assembly 2025, Vienna, Austria, 27 Apr–2 May 2025, EGU25-10279, https://doi.org/10.5194/egusphere-egu25-10279, 2025.

EGU25-10577 | ECS | Posters on site | NH9.10

Effects of temperature and water variability on vegetation resilience are influenced by Aridity levels in semi-arid to sub-humid region 

Yiqian Sun, Bojie Fu, Xiaoming Feng, Xutong Wu, and Zhuangzhuang Wang

The resilience of vegetated ecosystems is essential for sustaining critical ecosystem services, making its quantification crucial in addressing anthropogenic climate change. In this study, based on the concept of critical slowing down, we apply theoretical resilience metrics to remotely-sensed vegetation data in order to explore the spatial distribution of resilience across three vegetation types–forest, grassland, and cropland–on the Loess Plateau and its relationship to temperature and water. We find that forests have higher resilience than grasslands at comparable greenness levels. Resilience is lower in regions with higher temperatures for all three vegetation types, except in high-altitude regions. In the semi-arid to sub-humid zone that dominates the Loess Plateau, resilience is lower in regions with higher aridity for both forests and grasslands. In addition, in more arid regions, forests and grasslands with greater water variability and higher temperatures have higher resilience, while in more humid regions, those with lower water variability and cooler conditions have higher resilience. Forests and grasslands are more sensitive to water than to temperature. These results offer valuable insights for identifying regions at risk of vegetation resilience loss on the Loess Plateau.

How to cite: Sun, Y., Fu, B., Feng, X., Wu, X., and Wang, Z.: Effects of temperature and water variability on vegetation resilience are influenced by Aridity levels in semi-arid to sub-humid region, EGU General Assembly 2025, Vienna, Austria, 27 Apr–2 May 2025, EGU25-10577, https://doi.org/10.5194/egusphere-egu25-10577, 2025.

EGU25-13810 | ECS | Orals | NH9.10

Adapting urban water systems to climate change: best practices and insights from Europe 

Claudia Medina Montecinos, Paolo Colombo, and Luca Alberti

The approach to urban water management across European countries is being influenced by growing knowledge about the impacts of climate change. Rising temperatures, more frequent flooding, and prolonged drought periods place significant pressure on urban water systems and exacerbate existing vulnerabilities. The Interreg MAURICE project aims to introduce water management solutions for Central European cities in response to these climate-induced challenges. In this context, a literature review was conducted to analyse the best practices for climate change adaptation in urban water management across Europe. The main interest was to find integrated inter-administrative solutions involving key urban actors. Particular attention was given to comprehensive adaptation frameworks, leading to further analysis of the applicability of the local adaptation support tools promoted by the European Environment Agency. The review was drawn on a selection of case studies from recent literature and national experiences from the MAURICE partner countries, focused on groundwater management, stormwater management, and sustainable urban water management. The Key Type Measures (KTMs) classification was used to group the adaptation actions based on their characteristics.

Clear evidence was found of the direction that climate adaptation in urban water management is taking across Europe. Adaptation solutions are often based on governance and institutional measures, as well as nature-based solutions or ecosystem-based approaches combined with physical (grey) measures. In contrast, technological tools, economic and financial instruments, and initiatives for knowledge and behavioural change are less frequently applied. Good practices that reportedly enable successful adaptation are often related to flexible, locally tailored measures designed with a systemic and long-term approach that ensures effective governance structures and community engagement. Frequent gaps in adaptation planning reveal shortcomings in testing the adequacy of adaptation options, addressing economic and legal aspects of adaptation, setting up monitoring and evaluation frameworks, and dealing with uncertainties. This report provides actionable insights to drive effective adaptation of urban water systems, build climate-resilient communities, and systematically integrate scientific knowledge into policy action.

How to cite: Medina Montecinos, C., Colombo, P., and Alberti, L.: Adapting urban water systems to climate change: best practices and insights from Europe, EGU General Assembly 2025, Vienna, Austria, 27 Apr–2 May 2025, EGU25-13810, https://doi.org/10.5194/egusphere-egu25-13810, 2025.

EGU25-15956 | ECS | Orals | NH9.10

Enhancing Social Resilience through Managed Retreat: How is climate justice addressed in National Adaptation Plans? 

Bethany M. Liss, Elena M. Weinert, and Matthias Garschagen

Climate change poses significant threats to coastal communities worldwide, necessitating comprehensive adaptation strategies. This study examines the extent to which National Adaptation Plans (NAPs) incorporate managed retreat as a practical implementation measure to enhance social resilience. As climate impacts intensify, adaptation efforts must go beyond traditional infrastructure-based approaches to include transformative and forward-thinking measures which account for the uncertainty of future climate change impacts. The planned relocation of individuals and communities from high-risk coastal areas can potentially minimize non-economic loss and damage (NELD), which encompasses such intangible impacts as loss of culture, psychological distress, identity, and place attachment. However, the implementation of managed retreat raises complex issues of equity and justice that must be carefully considered in adaptation planning. This research analyzes submitted NAPs from coastal nations to assess:

  • The inclusion and framing of managed retreat as an adaptation strategy
  • Consideration of NELD in retreat planning processes
  • Incorporation of climate justice principles, including participatory approaches and attention to vulnerable groups
  • Temporal aspects, including long-term planning horizons and proactive vs. reactive approaches
  • Stakeholder engagement across government, private sector, and civil society

The study employs a qualitative approach, conducting a qualitative content analysis of NAPs with an examination of policy framing and discourse. Special attention is given to differences between Global North and South contexts, as well as variations in academic vs. practitioner perspectives on managed retreat and NELD. Preliminary findings suggest significant variation in how managed retreat is conceptualized and operationalized across NAPs. While some plans explicitly address NELD concerns in retreat strategies, many, if addressed at all, focus primarily on economic costs and benefits. Climate justice considerations are often limited, with insufficient attention to participatory planning processes and the specific needs of vulnerable populations. This research contributes to a growing body of literature on transformational adaptation and highlights the importance of integrating climate justice principles into national-level planning. By examining how NAPs can better address NELD through equitable retreat strategies, this study aims to inform more holistic and socially just approaches to enhancing social resilience in the face of climate change.

How to cite: Liss, B. M., Weinert, E. M., and Garschagen, M.: Enhancing Social Resilience through Managed Retreat: How is climate justice addressed in National Adaptation Plans?, EGU General Assembly 2025, Vienna, Austria, 27 Apr–2 May 2025, EGU25-15956, https://doi.org/10.5194/egusphere-egu25-15956, 2025.

Flooding affects more people than any other hazard and is becoming increasingly severe. The concept of flood resilience, which focuses on the ability of people to anticipate, prepare for, respond to, and recover from flood events, is gaining increasing attention. However, due to data limitations, it is often challenging to quantify flood resilience, particularly during the post-flood recovery phase. This research investigates the potential of utilizing Night-Time Light (NTL) data to enhance flood resilience analysis on a global scale. By examining 24 significant flood events from 2013 to 2018, this study aims to establish a comprehensive system for assessing flood resilience through NTL data from both the event scale and the grid-scale.

The methodology integrates flood extent mapping using MODIS satellite products for flood detection and the generation of 36 months of cloud-free, seasonally adjusted NTL time series. The research summarizes the different behaviors of NTL before, during, and after floods, and analyzes the causes of these variations. Additionally, it introduces three NTL-based quantitative metrics for measuring flood impact, recovery duration, and after-flood transformation. These metrics were applied to the 24 studied events to evaluate their effectiveness, demonstrating the utility of NTL data in capturing the immediate effects of floods and monitoring long-term recovery. Furthermore, a case study of the August 2016 Louisiana floods in the USA involved a micro-scale grid analysis to examine the relationship between NTL changes and factors such as population, coastal proximity, and economy, with the results validated using multiple vulnerability indices.

The results showed significant variation in recovery periods among the studied flood areas, ranging from 5 to 12 months, and even floods occurring within the same country could have recovery durations differing by as much as 5 months. The grid-scale case study further indicated that NTL decreases at the micro-scale are related to population and economic conditions, with communities having better economic conditions showing a lower probability of NTL decrease, while those with higher populations showing a higher probability of NTL decrease.

This study concludes that NTL data, combined with adequate remote sensing and statistical methods, presents a valuable tool for global flood resilience analysis, addressing data gaps and improving disaster management strategies.

How to cite: Zhou, J.: Enhancing Flood Resilience Analysis Through Night Time Light: A Global Perspective, EGU General Assembly 2025, Vienna, Austria, 27 Apr–2 May 2025, EGU25-16569, https://doi.org/10.5194/egusphere-egu25-16569, 2025.

EGU25-17237 | ECS | Orals | NH9.10

Towards Resilient Cities: Analyzing Climate Adaptation Strategies in Romania 

Vladut Falcescu, Sorin Cheval, Adina Eliza Croitoru, Emma Ferranti, Constantina Alina Hossu, Sarah Greenham, Cristian Iojă, and Deanne Brettle

Urban areas face increasing risks from climate change, including rising temperatures, extreme weather events, and the intensifying urban heat island effect. The derived impacts threaten critical infrastructure, socio-economic activities, and the well-being of urban communities, making climate resilience a key dimension of urban planning and governance. Addressing urban climate resilience requires a complex approach integrating local vulnerabilities, socio-economic dynamics, and adaptation frameworks.

This study examines the status and progress of climate adaptation efforts in Romanian cities, focusing on the frameworks, strategies, and implementation measures adopted to enhance local climate resilience. The results capture a wide range of urban contexts by analysing the 40 county-capital cities serving as national and regional development poles. These cities play a defining role in shaping urban development and dynamics in Romania.

The European Green Deal, culminating in the New EU Strategy on Adaptation to Climate Change, provides the foundation for harmonised adaptation efforts. Through a multi-level approach, cities are required to align with European frameworks by integrating science-based methodologies, engaging stakeholders, and implementing robust monitoring systems to strengthen urban climate resilience. Local governments play a crucial role in translating national and international climate goals into actions that address local needs. Effective adaptive strategies should foster inclusive governance and promote cross-sectoral collaboration to build resilient urban societies. Furthermore, the integration of adaptation and mitigation actions —referred to as "adaptigation"—is essential for optimising resource use, minimising trade-offs, and maximising co-benefits for enhanced urban resilience. However, tailoring actionable local strategies remains a critical challenge, particularly given resource constraints and lower institutional capacities.

While progress has been observed, significant gaps persist in the development and implementation of local adaptation actions. Inconsistencies in reporting practices, a lack of specific measures, and the absence of robust monitoring and evaluation mechanisms are challenges that warrant closer examination. These issues highlight the need for tailored approaches that address the local vulnerabilities and capacities of each city while fostering regional and national collaboration and knowledge exchange.

By conducting a comprehensive analysis of climate adaptation efforts in the Romanian cities based on relevant documents in force, this study provides valuable insights into the status and dynamics of urban climate adaptation. It offers a foundation for future research and practical interventions. By addressing existing gaps and leveraging current strengths, cities can enhance their resilience to climate impacts and contribute to broader sustainability goals. The findings aim to support policymakers, stakeholders, and researchers in developing effective strategies for urban climate resilience, ensuring that cities remain viable and sustainable in the face of emerging climate risks.

This research received funds from the project “Climate-Resilient Development Pathways in Metropolitan Regions of Europe (CARMINE)” funded by the European Union Horizon Europe Programme, under Grant agreement n° 101081377, and through the doctoral grant supported by the Babes-Bolyai University for the thesis “Adaptation Framework for Enhanced Urban Resilience in Climate Change Hotspots”.

How to cite: Falcescu, V., Cheval, S., Croitoru, A. E., Ferranti, E., Hossu, C. A., Greenham, S., Iojă, C., and Brettle, D.: Towards Resilient Cities: Analyzing Climate Adaptation Strategies in Romania, EGU General Assembly 2025, Vienna, Austria, 27 Apr–2 May 2025, EGU25-17237, https://doi.org/10.5194/egusphere-egu25-17237, 2025.

EGU25-17603 | ECS | Posters on site | NH9.10

Integrating Thermal Comfort and Social Vulnerability into Climate-Adaptive Spatial Planning for Heatwave-Resilience in Rural South Korea 

Sujeong Kang, SeongWoo Jeon, Yingnan Li, and Junga Lee

Thermal comfort indices, such as the Universal Thermal Climate Index (UTCI), are crucial for assessing outdoor thermal conditions and their impacts on human health, especially during extreme heat events (Saud Ghani et al., 2021). While UTCI has been widely used in urban studies, its application in rural areas characterized by high proportions of elderly residents, outdoor workers, and limited infrastructure remains underexplored (Park, Jongchul, et al., 2020). As heatwaves become more frequent and severe due to climate change, identifying priority areas for thermal environment improvements in rural regions is essential to enhancing outdoor comfort and resilience (Korea Rural Economic Research Institute, 2023).

The purpose of this study is to identify priority areas for improving heatwave resilience in rural areas. This study analyzed the relationship between thermal comfort indices and land cover to provide a basis for climate-adaptive spatial planning. It also assessed social vulnerability using statistical indicators that account for socio-demographic factors influencing heatwave resilience.

Using Jeollanam-do, South Korea, as a case study, this research systematically analyzed vulnerability by employing approaches to assess both thermal comfort and social vulnerability. Jeollanam-do is highly vulnerable due to its predominantly agricultural economy and significant elderly population, making it a critical region for heatwave-related research. To evaluate thermal comfort, the UTCI was calculated using ERA5 Mean Radiant Temperature (MRT) data, combined with air temperature, humidity, and wind speed data from weather stations. Social vulnerability was assessed through indicators such as the percentage of elderly population and the availability of healthcare services, which were normalized and integrated to provide a comprehensive analysis of rural heatwave vulnerability.

Research findings revealed that Gangjin-gun, a coastal region in Jeollanam-do, was identified as the most vulnerable area due to high UTCI levels and significant social vulnerabilities, including a high proportion of elderly residents and insufficient welfare infrastructure. To address these challenges, proposed strategies include expanding healthcare services, implementing welfare policies tailored to the elderly, and adopting climate adaptation measures such as cooling centers, heatwave warning systems, and smart farming. Additionally, climate-adaptive spatial planning is emphasized, focusing on green-blue infrastructure solutions such as rain gardens, wetlands, tree-lined streets, and shaded community spaces to improve outdoor comfort and strengthen long-term resilience.

These findings highlight the importance of integrating thermal comfort indices, land-use analysis, and socio-demographic factors into rural spatial planning. Tailored strategies that address environmental and social vulnerabilities can improve rural resilience to heatwaves while contributing to effective climate-adaptive spatial plans, ensuring that vulnerable communities are better prepared for future climate challenges.

  •   This work was supported by Korea Environment Industry &Technology Institute (KEITI) through "Climate Change R&D Project for New Climate Regime.", funded by Korea Ministry of Environment (MOE) (RS-2022-KE002123)
  • This work was carried out with the support of "Cooperative Research Program for Agriculture Science and Technology Development (Project No. PJ0171102022)" Rural Development Administration, Republic of Korea

How to cite: Kang, S., Jeon, S., Li, Y., and Lee, J.: Integrating Thermal Comfort and Social Vulnerability into Climate-Adaptive Spatial Planning for Heatwave-Resilience in Rural South Korea, EGU General Assembly 2025, Vienna, Austria, 27 Apr–2 May 2025, EGU25-17603, https://doi.org/10.5194/egusphere-egu25-17603, 2025.

EGU25-17942 | Posters on site | NH9.10

Towards an integrated assessment of vulnerability towards heat in urban environments – learning from a case study in Constance, Southern Germany 

Leon Scheiber, Leonie Grau, Juliane Frost, Bernd Leitl, Martina Neuburger, Thomas Pohl, Laura Schmidt, and Diana Rechid

Global warming and associated climatic changes are increasing the frequency and intensity of heat waves in large parts of Europe including Germany. Especially in urban environments, this poses a considerable health threat to vulnerable population groups, such as children, elderly people or those with pre-existing diseases. A recent national adaptation framework aims to counter this development but implementation efforts in many communities require better micro-scale information about the local impacts of current and possible future regional climatic changes in urban areas. In addition, existing risk and adaptation assessments often focus solely on the estimation of hazards but miss to involve stakeholders and the affected population to understand individual vulnerabilities which causes quantifications that deviate from on-the-ground realities.

Based on a case study in Constance, Southern Germany, the project URBANLINE addresses these shortcomings in order to develop climate services that facilitate reliable risk and vulnerability assessments and thus sustainable adaptation planning. We will assess the strengths and weaknesses of existing vulnerability indices in the literature and its practical applications in urban planning. We aim to develop a new assessment framework to integrate methods for (1) numerical modelling of the impacts of relevant regional climate change scenarios on a micro-scale and (2) participatory approaches investigating the everyday experiences with heat among inhabitants. The methods will draw on a close co-production process with a range of local stakeholders and the public. Together with its sister project, HYDROLINE, which investigates flood risk from heavy rainfall, the study explores the potential of integrating micro-scale climate projections, participatory methods and stakeholder engagement to inform and support climate-resilient development and adaptation planning in local communities in Germany and beyond.

How to cite: Scheiber, L., Grau, L., Frost, J., Leitl, B., Neuburger, M., Pohl, T., Schmidt, L., and Rechid, D.: Towards an integrated assessment of vulnerability towards heat in urban environments – learning from a case study in Constance, Southern Germany, EGU General Assembly 2025, Vienna, Austria, 27 Apr–2 May 2025, EGU25-17942, https://doi.org/10.5194/egusphere-egu25-17942, 2025.

EGU25-18000 | ECS | Orals | NH9.10 | Highlight

Mapping the role of social capital in measured community resilience over time 

Jung Hee Hyun, Romain Clercq-Roques, Johanna Passard, Stefan Velev, and Reinhard Mechler

Climate disasters, exacerbated by climate change and increasing vulnerability, pose significant threats to human health, livelihoods, and development gains, particularly for low-income communities. Building community resilience requires a holistic approach that considers not only physical infrastructure and economic resources but also social factors such as learning and collective action. The Zurich Climate Resilience Alliance (ZCRA) has dedicated the past 12 years to fostering collaborative efforts with communities and across sectors to assess and enhance resilience. A key outcome of this work is the Flood Resilience Measurement for Communities (FRMC) framework, developed in 2013 as a pioneering tool to quantify community-level flood resilience. Recognizing the critical need for a robust framework in the absence of established, empirically validated alternatives, the FRMC has been successfully applied in over 300 flood-prone communities worldwide, proving its value as a self-assessment tool for engage and empower community members to identifying areas for improvement and guiding effective intervention implementation.

For this study we use the FRMC grading of 44 sources of resilience, measured at the start and end of the Phase 2 project period (2018-2023) across 296 communities as well as the qualitative evaluations of the grade changes reported by practitioners. Conducting an in-depth thematic analysis of the qualitative evaluations on (un)realized resilience, we identify mechanisms impacting individual resilience capitals (natural, social, human, financial, physical) and create a system map to note the interactions to social capital. We find that social capital is the most interconnected capital to other capitals and that community participation, gender inclusivity, local leadership and inter-community coordination are the main mechanisms affecting social capital. We assess and compare the global mechanisms and map of social capital to contextualize the resilience dynamics and pathway of communities in Malawi, noting the distinctions in the role of social capital as an enabler, outcome and impact. Our study aims to contribute to the growing focus on social capital impacting community resilience. This research goes further by identifying how these mechanisms interact, developing a system map of community resilience. 

How to cite: Hyun, J. H., Clercq-Roques, R., Passard, J., Velev, S., and Mechler, R.: Mapping the role of social capital in measured community resilience over time, EGU General Assembly 2025, Vienna, Austria, 27 Apr–2 May 2025, EGU25-18000, https://doi.org/10.5194/egusphere-egu25-18000, 2025.

The Analysis of the Resilience of Communities to Disasters (ARC-D) methodology is an innovating tool for conducting rapid, context-specific assessments of shocks, stresses, and resilience capacities at the community level. Widely used across urban and rural contexts, ARC-D has facilitated over 300 assessments globally, enabling the identification of strategic pathways to build resilience to climate-related hazards. Endorsed as best practice by organizations including ECHO and the Grantham Research Institute, its participatory approach combines quantitative measurement and qualitative insights to inform actionable strategies.

Drawing from recent analyses of ten countries in Africa and Latin America, the presentation will share emerging findings on shared and differential drivers of risk and resilience, key components and systems underpinning resilience capacities, and priority areas for resilience building. The insights contribute to advancing practical and scalable strategies for enhancing resilience to climate-related risks.

How to cite: Pollard, A. and Sneddon, A.: Emerging Insights from the ARC-D Methodology: Advancing Community Resilience to Climate-Related Risks, EGU General Assembly 2025, Vienna, Austria, 27 Apr–2 May 2025, EGU25-19006, https://doi.org/10.5194/egusphere-egu25-19006, 2025.

The FRAMe (Flood Resilience Agent-Based Model) serves as a robust modeling framework designed to simulate flood resilience dynamics at the community level, focusing on a rural settlement in the Mekong River Basin. Integrating empirical data from extensive surveys, Bayesian networks, and hydrological simulations, the framework quantifies resilience as a trade-off between robustness (resistance to damage) and adaptability (capacity for dynamic response). Core agents include households, governments, and other actors, linked by social and governance networks that facilitate knowledge transfer, resource distribution, and risk communication. FRAMe incorporates mechanisms for flood forecasting, policy interventions (education, aid, insurance), and individual and collective decision-making, grounded in Protection Motivation Theory and MoHuB frameworks. The framework's spatially explicit design leverages GIS data, while its modular implementation supports scenario testing of governance structures and stakeholder interactions. By examining policy scenarios and agent behavior, FRAMe aims to inform adaptive flood management strategies and enhance community resilience.

How to cite: Feng, W. and Yang, E. L.: FRAMe: An Empirically Informed Agent-based Modeling Framework for Simulating Flood Resilience Dynamics, EGU General Assembly 2025, Vienna, Austria, 27 Apr–2 May 2025, EGU25-19704, https://doi.org/10.5194/egusphere-egu25-19704, 2025.

The Horn of Africa exhibits diverse topographical and climatic conditions characterized by highlands in central Ethiopia and low-lying coastal areas in Somalia and Kenya. The region is highly susceptible to environmental degradation and climate change-related disaster events. Disasters caused by heavy rain, drought, and landslides are becoming increasingly frequent. The dynamics of climate variables in this region are volatile, complicating the prediction of the onset and intensity of extreme events. In recent years, extreme weather conditions have caused havoc to the communities by impacting health facilities, water infrastructure, and the ecosystem. Floods are the most significant natural hazards in the Horn of Africa, accounting for approximately 50 percent of natural disaster events. Drought has had a severe impact on the environment and the socio-economic welfare of societies. This paper analyses the different patterns of mesoscale meteorological variables and their connection to extreme flow conditions in the Horn of Africa region. The global factors contributing to the rainfall variation in the region's rainfall patterns include the El Niño-Southern Oscillation (ENSO) and the Indian Ocean Dipole. An increase in El Niño and sea surface temperature variability significantly impacts weather patterns in the region, leading to increased rainfall and flooding in most areas while causing drought conditions in others. El Niño often triggers dry conditions in Ethiopia such as the massive drought in 2015. The frequency of El Niño and La Niña seasons can result in catastrophic extreme events. The occurrence of the Indian Ocean Dipole affects the rainfall pattern, the positive Indian Ocean Dipole intensify rainfall totals during the October–December rainy season leading to flooding in eastern Ethiopia, Kenya and Somalia. A climate change projection model of the rainfall pattern in the Blue Nile basin indicates the dynamics in the atmosphere and the nearby ocean surface such as the Indian Ocean influence the rainfall pattern through the movement of wind vectors and atmospheric humidity. These patterns are of critical importance to accomplish a variety of rainfall trends and the hydrology of the region. The weakening of the easterly Indian Ocean and Arabian Sea wind and its shift towards the northern part are found to have a direct correlation with a rainfall decrease. These patterns are suggestive of a strong impact of the Indian and Arabian monsoon on the rainfall pattern increase and westerly winds towards the decrease. The result indicates that the spatially heterogeneous nature of rainfall can significantly impact the successful implementation of adaptation strategies across different areas. It is suggested to enhance the utilization of satellite-based precipitation datasets and water storage structures for disaster risk reduction and the successful implementation of adaptation strategies. This study highlights the effective utilization and verification of satellite precipitation products require integrating local observations (data) with hydrological models to enhance their reliability and applicability.

How to cite: Tedla, M. G.: Exploring the Dynamics of Floods and Droughts: Hazards and Adaptation Strategies in the Horn of Africa , EGU General Assembly 2025, Vienna, Austria, 27 Apr–2 May 2025, EGU25-20572, https://doi.org/10.5194/egusphere-egu25-20572, 2025.

EGU25-20812 | Posters on site | NH9.10

Reimagining Rivers: A co-created and youth-informed approach to exploring river morphodynamics and flood risk 

Katie Jane Parsons, Alison Lloyd Williams, Louise Slater, Dan Parsons, and Josh Wolstenholme

Climate resilience is critical for enabling communities and ecosystems to adapt to and thrive amidst escalating climate hazards. This paper presents an interdisciplinary, co-created initiative that engaged young people in understanding and addressing river morphodynamics and flood risks through creative and participatory methods. This collaboration between academics, Global Link Development Education Centre, Girlguiding North West England and the Environment Agency, worked with a group of children aged 8 to10 with the objective of develop a transdisciplinary approach to public engagement on flooding, filling critical knowledge and action gaps. 

The project combined scientific insights from the EvoFlood program with local knowledge and participatory techniques to create workshops tailored for youth. These hands-on workshops featured drama games, science experiments, field walks, and creative activities such as crafting, fostering a deeper understanding of river systems and their role in flood risk and resilience. Young participants explored concepts such as the causes of flooding, its impacts, and ways to prepare for and adapt to these risks. The workshops culminated in the co-development of two educational resources: Flooding Mucky Dip! which is an interactive game addressing flood preparedness and recovery; and Flooding Fortune Tellers, which creatively distilled participants’ learning about flood risks into an accessible and interactive format. These resources are now integrated into a Girlguiding Badge and Challenge Pack, and on the Flood Hub website, ensuring their wide dissemination to youth and community groups across the UK.

A key strength of the project was its interdisciplinary and community-focused approach, which promoted a “bottom-up” method of engagement. Drawing on the “looping action research” framework, the project team incorporated ongoing feedback from participants, community leaders, and scientific advisors to iteratively refine the workshops and resources. This responsive methodology not only ensured that activities were engaging and relevant but also empowered participants to take ownership of their learning and apply it to real-world resilience challenges. 

This paper highlights the importance of interdisciplinary collaboration, participatory methodologies, and place-based learning in bridging the gap between scientific research and community youth-led action. By focusing on youth engagement, the project demonstrates how grassroots initiatives can inform broader strategies for climate adaptation and flood resilience building, offering a scalable model for addressing similar challenges in other contexts which are able to empower youth as agents of change in the face of growing climate risks.

How to cite: Parsons, K. J., Williams, A. L., Slater, L., Parsons, D., and Wolstenholme, J.: Reimagining Rivers: A co-created and youth-informed approach to exploring river morphodynamics and flood risk, EGU General Assembly 2025, Vienna, Austria, 27 Apr–2 May 2025, EGU25-20812, https://doi.org/10.5194/egusphere-egu25-20812, 2025.

The safety and stability of regional water resource systems (WRS) face significant challenges from climate change and human intervention. It is necessary to estimate WRS resilience and its influencing factors, which are poised to provide a solid scientific basis for integrated WRS management. In this study, we propose an integrative framework for assessing WRS resilience from its supply, demand, and support (including society, economy, institution, and ecosystem). WRS resilience is defined as a comprehensive capacity of socio-ecological systems to absorp, adapt, and transform in response to multiple disruptive events such as water scarcity, drought, flood, and pollution events. Then, we take the Hexi inland river basins (HIRBs) in northwest China as a case study to explore the spatiotemporal pattern of WRS resilience and its multiple influencing factors from 2011 to 2019. The results indicate that the resilience of WRS in the HIRBs exhibited overall fluctuating increases, with a gradual decrease from the upstream to the downstream of the main river basins, and from the west to the east of the investigated region. Institutional support capability and economic development level were identified as key factors in shaping the spatial heterogeneity of WRS resilience. Increasing temperatures were found to promote the resilience of WRS in the Shiyang and Heihe River basins, but the impact was less significant in the Shule River Basin. The lower economic development level was also evaluated as the primary obstacle to promoting WRS resilience in the HIRBs, followed by the lower water supply capacity and water use efficiency. This implies that it is crucial to harmonize economic development with environmental protection and sustainable water resource utilization. The study proposed an effective framework for assessing WRS resilience in an integrated way and had practical implications for improving the water management strategy of the HIRBs.

How to cite: Zheng, Z., Su, B., and Xiao, C.: An integrative resilience assessment of water resource systems: A case from the Hexi inland river basins, northwest China, EGU General Assembly 2025, Vienna, Austria, 27 Apr–2 May 2025, EGU25-21275, https://doi.org/10.5194/egusphere-egu25-21275, 2025.

CL4 – Climate Studies Across Timescales

EGU25-573 | ECS | Orals | CL4.2

Deep MIP Early Eocene Indian Gyre comparison   

Théo Le Hir

In this study, we analyze the outputs of the Deep-Time Model Intercomparison Project (DeepMIP) for
the Early Eocene, focusing on the representation of the southwestern Indian Ocean gyre and investigating
the sources of inter-model variability. Specifically, we address three key aspects : (1) biases associated with
resolution through a comparison of realistic reanalyses with PI (pre-industrial) simulations, (2) the impact of
paleogeography by comparing PI with x1 (Early Eocene simulations under the same CO2 concentration as PI),
and (3) the sensitivity of paleo simulations to increased CO2 through a comparison of x1 and x3 scenarios.
(1) Our findings reveal that biases in the current representation of circulation in the southwestern Indian
Ocean particularly those linked to coarse resolution—persist across the seven DeepMIP models when compared
to realistic reanalyses such as GLORYS (ocean) and ERA5 (atmosphere). While certain patterns, like the
position of fronts, are well captured by the models, others, including stratification, western boundary currents,
and Agulhas leakage, display significant inter-model variability.
(2) Next, we evaluate the present-day/paleo sensitivity of these models by comparing PI and Early Eocene
(47–56 Ma) outputs under identical CO2 concentrations (x1). Consistent with existing literature, all seven
models exhibit a weaker wind stress curl and the absence of the ACC (Agulhas Circumpolar Current). Especially
at depth, temperatures in the region are generally 0.5°C to 4°C higher (except in COSMOS), and north-south
temperature gradients are weaker. On average, the frontal positions are located 5° farther south in the Early
Eocene. The first baroclinic Rossby deformation radius shows limited changes relative to the inter-model spread.

(3) Finally, we investigate the sensitivity of Early Eocene simulations to increased CO2 levels by comparing
x1 and x3 scenarios. Across all models, higher CO2 concentrations lead to slightly weaker wind stress and
transport. Water temperatures increase by 4–8°C, depending on the model, and the Rossby deformation radius
decreases slightly at mid-to-low latitudes.

How to cite: Le Hir, T.: Deep MIP Early Eocene Indian Gyre comparison  , EGU General Assembly 2025, Vienna, Austria, 27 Apr–2 May 2025, EGU25-573, https://doi.org/10.5194/egusphere-egu25-573, 2025.

EGU25-740 | ECS | Orals | CL4.2 | Highlight

Tracing Ocean Oxygen Dynamics Through Time: A Miocene Perspective 

Alexandra Auderset, Anya V. Hess, Benjamin Petrick, Yair Rosenthal, Daniel M. Sigman, and Alfredo Martínez-García

Foraminifera-bound nitrogen isotopes (FB-δ15N) are a powerful tool for reconstructing past oxygen-deficient zones (ODZs). FB-δ15N record the strong isotopic fractionation associated with bacterial water column denitrification that occurs in oxygen-deficient environments, typically characterised by dissolved oxygen concentrations of less than ~5 µM. We applied this oxygen-sensitive proxy across multiple ocean basins during the Miocene, focusing on the Miocene Climatic Optimum (MCO) and Middle Miocene Climate Transition (MMCT), to study the expansions and contractions of tropical ODZs as a response to past global climate change.

Our multi-basin analysis indicates nuanced oxygen dynamics, including evidence of a persistent proto-ODZ in the Arabian Sea since ≥19.8 Ma. By integrating FB-δ15N with foraminiferal calcite trace element data (I/Ca, Mn/Ca), we generated the first temporal and spatial record of MMCT deoxygenation in the Arabian Sea. Combining these new data with regional palaeoceanographic proxies, we assess the roles of global climate, regional monsoonal activity, and tectonics in driving Arabian Sea hypoxia, recognising that the contributions of these factors varied in magnitude and timing.

In comparison, new preliminary data from the Atlantic and Pacific Oceans suggest synchronised yet regionally distinct ODZ responses during the MCO and subsequent cooling. Our high-resolution reconstructions of Pacific Ocean deoxygenation following the MMCT cooling indicate glacial/interglacial variations and provide critical new insights into potential marine oxygen deficient zone trajectories under future climate scenarios.

How to cite: Auderset, A., Hess, A. V., Petrick, B., Rosenthal, Y., Sigman, D. M., and Martínez-García, A.: Tracing Ocean Oxygen Dynamics Through Time: A Miocene Perspective, EGU General Assembly 2025, Vienna, Austria, 27 Apr–2 May 2025, EGU25-740, https://doi.org/10.5194/egusphere-egu25-740, 2025.

EGU25-954 | ECS | Posters on site | CL4.2

How gateways shape the world – An ocean perspective on the Eocene-Oligocene-Transition 

Hanna Knahl, Katharina Hochmuth, Lu Niu, Lars Ackermann, Gerrit Lohmann, Johann Klages, Nicholas Golledge, and Uta Krebs-Kanzow

The Eocene-Oligocene Transition (EOT) (~34.4–33.7 Ma) is not only known for its drastic shift from greenhouse to icehouse climate, but also for a dynamic ocean gateway configuration. The Southern Ocean gateways are expected to open during this period, while the Arctic Ocean likely remains largely isolated, resulting in distinct ocean circulation patterns.

Using the AWI-Earth System Model (AWI-ESM) coupled to the Parallel Ice Sheet Model (PISM), we explore the ocean dynamics under an ocean straight configuration markedly different from today’s, providing a detailed depiction of global climate during the EOT. Low-latitudinal seaways, which are absent in the present continental configuration, and opening Southern gateways change the global ocean circulation fundamentally. This also has profound impacts on the continental climate, such as the formation of deserts.

With a targeted study of the Southern Ocean, we show that deep Southern gateways alone are insufficient to allow an Antarctic Circumpolar Current (ACC). Whether the Antarctic glacial inception came before or after the onset of the ACC is broadly debated. Here we observe, the onset of the ACC is not a necessary condition for East Antarctic glaciation. Instead of the ACC, a large Weddel-Australian gyre dominates the Southern Ocean. This gyre creates mixing and deep water formation and thus influences an Atlantic Ocean that faces very different boundary conditions than today.

This study enhances our understanding of Southern Ocean dynamics prior to the establishment of a strong ACC and underscores the critical role of oceanic gateway configurations in assessing their impact on regional and global climate.

How to cite: Knahl, H., Hochmuth, K., Niu, L., Ackermann, L., Lohmann, G., Klages, J., Golledge, N., and Krebs-Kanzow, U.: How gateways shape the world – An ocean perspective on the Eocene-Oligocene-Transition, EGU General Assembly 2025, Vienna, Austria, 27 Apr–2 May 2025, EGU25-954, https://doi.org/10.5194/egusphere-egu25-954, 2025.

EGU25-2341 | ECS | Posters on site | CL4.2

Interglacial Mediterranean wetting driven by suppressed Indian Ocean convections 

Linqiang He, Michela Biasutti, and Yochanan Kushnir

The Mediterranean is widely recognized as a climate change hotspot. The Last Interglacial (~127 ka; LIG) and mid-Holocene (~6 ka; MH), characterized by increased boreal summer insolation and decreased winter insolation, provide valuable opportunities to investigate the Mediterranean climate’s response to global-scale forcings. In agreement with proxy data, multi-model simulations from the Paleoclimate Model Intercomparison Project Phase 4 (PMIP4) show that the Mediterranean experienced wetter conditions during the LIG and MH compared to the pre-industrial period. The simulated wetting is most pronounced in late winter and early spring (February to April), when the circulation anomalies are akin to a negative phase of the North Atlantic Oscillation and the North Atlantic storm tracks shift southward. Standalone atmospheric experiments emphasize the critical role of cooling and suppressed convection over the Indian Ocean, which modulate the North Atlantic climate through atmospheric teleconnections. This physical link between Mediterranean wetting and Indian Ocean drying is consistently reproduced across the inter-model spread during the LIG and might also be one factor in the spread of future climate projections in the Mediterranean.

How to cite: He, L., Biasutti, M., and Kushnir, Y.: Interglacial Mediterranean wetting driven by suppressed Indian Ocean convections, EGU General Assembly 2025, Vienna, Austria, 27 Apr–2 May 2025, EGU25-2341, https://doi.org/10.5194/egusphere-egu25-2341, 2025.

Climate condition of the Plio-Pleistocene is characterized by global cooling and intensification of the Northern Hemisphere Icesheet. During this time period, sea surface temperatures (SSTs) both at mid and high latitudes showed long-term cooling, whereas SST at the western Pacific warm pool (WPWP) showed only minor cooling, resulting in a gradual increase of latitudinal SST gradient. However, SST reconstruction at the WPWP is controversial because the SST trends from different proxies are not consistent. The long-term continuous planktonic foraminiferal Mg/Ca-based SST record in WPWP has been only available from ODP Site 806 with Trilobatus sacculifer, whose calcification depth is slightly deeper than Globigerinoides ruber. Here, we conducted Mg/Ca-based temperature reconstruction using two mixed layer species of planktonic foraminifera, G. ruber and T. trilobus, at IODP Site U1488 for the last 4 Myr. The reconstructed temperature of T. trilobus shows consistent results with previously published one by T. sacculifer at ODP 806, whereas that of G. ruber showed slightly warmer SST and different pattern from T. trilobus. The temperature difference between two species decreased between 2.0 and 1.5 Ma, which coincides with decrease in SSTs in the subarctic, subantarctic, and east Pacific upwelling regions. Because of the limited seasonality in the WPWP, the temperature difference of these species at a single site probably reflects differences in their habitat depth. Our results suggest that the upper ocean stratification in the WPWP has been closely related to the meridional and zonal SST gradients, which are associated with the Northern Hemisphere Glaciation.

How to cite: Sagawa, T., Kubota, Y., and Rosenthal, Y.: Sea surface temperature reconstructions using Mg/Ca of two mixed layer foraminifera species in the western Pacific warm pool for the last 4 Myr, EGU General Assembly 2025, Vienna, Austria, 27 Apr–2 May 2025, EGU25-3938, https://doi.org/10.5194/egusphere-egu25-3938, 2025.

EGU25-5280 | Orals | CL4.2

Paleoclimate Evidence of Significant Eastern Mediterranean Aridity During Interglacial Periods: Implications for the Projected Drying Trend 

Yochanan Kushnir, Moti Stein, Michela Biasutti, Yael Kiro, Yonaton Goldsmith, and Steve Goldstein

Extended salt deposits, indicative of pronounced aridity, are preserved in a 220,000-year sediment core from the Dead Sea in the eastern Mediterranean Levant. These arid intervals occur in the warm interglacial periods of Marine Isotope Stages (MIS) 7, 5, and in the Holocene, and coincide with maxima in the Northern Hemisphere fall precession cycle. Similar salt layers are also present during the current and penultimate deglaciations. In insolation-driven climate model simulations, the North Atlantic latitudinal surface temperature gradient intensifies in the subsequent winter when boreal fall precession reaches a maximum. A lag that is due to the inherent delay in the upper ocean response. The enhanced surface temperature gradient leads to a shift the North Atlantic eddy-driven jet stream poleward, a decrease in polar sea-level pressure and an increase subtropical sea-level pressure. A weakening in the Mediterranean winter storm track occurs and a reduction in the rainfall over the Basin. Abrupt subpolar cooling events during recent and penultimate deglaciations—driven by ice sheet melt—similarly amplify the North Atlantic latitudinal surface temperature gradient, eliciting a comparable atmospheric response and similar rainfall reductions in the eastern Mediterranean. The late Quaternary palaeohydrology of the Dead Sea thus highlights an important North Atlantic ocean-atmosphere interaction that drives eastern Mediterranean droughts. A similar link exists between the changes in the North Atlantic Basin and the eastern Mediterranean rainfall trend in recent history and helps understand CMIP6 inter-model differences in their projected eastern Mediterranean drying.

How to cite: Kushnir, Y., Stein, M., Biasutti, M., Kiro, Y., Goldsmith, Y., and Goldstein, S.: Paleoclimate Evidence of Significant Eastern Mediterranean Aridity During Interglacial Periods: Implications for the Projected Drying Trend, EGU General Assembly 2025, Vienna, Austria, 27 Apr–2 May 2025, EGU25-5280, https://doi.org/10.5194/egusphere-egu25-5280, 2025.

A warmer atmosphere holds more water vapor supporting an amplified hydrological cycle with both more intense precipitation events and droughts. Yet future climate projections are uncertain when it comes to predicting climatological changes in regional hydroclimate, particularly for subtropical and Mediterranean climates. Past warm climates in Earth's history offer an opportunity to learn how regional hydroclimate responds to global warming. Here we review insights from several studies that model and reconstruct hydroclimate during the warm climates of the Pliocene, Miocene and Eocene. A common finding is the importance of correctly predicting warming patterns and their impact on large-scale circulation, leading to circulation driven changes in climatological moisture convergence. Most notably, climate models that simulate the largest reduction in equator-to-pole temperature gradients are characterized by a reduction in subtropical moisture divergence, leading to an increase in mean annual precipitation and better agreement with proxy reconstructions.

How to cite: Burls, N.: Hydroclimate insights from the warm Pliocene, Miocene, and Eocene , EGU General Assembly 2025, Vienna, Austria, 27 Apr–2 May 2025, EGU25-5463, https://doi.org/10.5194/egusphere-egu25-5463, 2025.

EGU25-5699 | Orals | CL4.2

The influence of palaeogeographic uncertainty on the simulation of Pliocene climate 

Alan Haywood, Julia Tindall, Stephen Hunter, and Aisling Dolan

Although the Pliocene is a well-studied epoch, key sources of uncertainty remain that add significant complexity to our understanding of climate at the time. From a climate/earth system modelling perspective palaeogeography is a key source of uncertainty, especially in terms of the veracity of specified model boundary conditions. Small variations in prescribed conditions can potentially lead to different local, regional and even global simulated climate states.

Here we explore this uncertainty within the experimental framework of the 3rd phase of the Pliocene Model Intercomparison Project (PlioMIP3). Building on the foundations of PlioMIP1 and 2, PlioMIP3 outlines three experiments within the Core and Core-Extension experimental design that are capable of directly addressing some of the key sources of palaeogeographic uncertainty in models, and which are potentially relevant to our understanding of both the Early and Late Pliocene. We use the Hadley Centre Coupled Climate Model Version 3 to perform the PlioMIP3 Core and Core-Extension experiments integrated for 4000 years. This includes the control simulation for the Late Pliocene, an alternative Late Pliocene simulation incorporating minimum land/sea mask changes from present-day, as well as an additional experiment that opens the Central American Seaway, and which is used as a single possible realisation of the Early Pliocene.

We compare and contrast climate states within the Late Pliocene and between the Eary and Late Pliocene.  Palaeogeographic uncertainty within the Late Pliocene is shown to have a significant enough impact on climate conditions to influence outcomes of localised data/model comparison, but it does very little to influence model results in terms of large-scale features of climate, or the simulated global annual mean temperature. In contrast, the Central American Seaway being open in the Early Pliocene simulation leads to significant variations in the simulated climate state, and even in the global annual mean temperature with identical greenhouse gas forcing as the Late Pliocene.

This underlines the importance of continued research to better understand palaeogeographic evolution through the Pliocene, which adds new detail to the complex tapestry of what we understand to be ‘Pliocene’ climate.

How to cite: Haywood, A., Tindall, J., Hunter, S., and Dolan, A.: The influence of palaeogeographic uncertainty on the simulation of Pliocene climate, EGU General Assembly 2025, Vienna, Austria, 27 Apr–2 May 2025, EGU25-5699, https://doi.org/10.5194/egusphere-egu25-5699, 2025.

EGU25-5889 | ECS | Orals | CL4.2

Impact of mid-Pliocene boundary conditions on the Atlantic Meridional Overturning Circulation (AMOC) 

Julia Weiffenbach, Wing-Le Chan, Ayako Abe-Ouchi, and Anna von der Heyt

The mid-Piacenzian warm period (mPWP, ~3.3 – 3 Ma) is the most recent geological period with a CO2 concentration comparable to today (~400 ppm). Evidence from proxies and global climate model simulations both indicate that the Atlantic Meridional Overturning Circulation (AMOC) was stronger during the mPWP than it is now, contributing to warmer sea surface temperatures (SSTs) in the high-latitude North Atlantic. Using the coupled atmosphere-ocean model MIROC4m, we study how increased CO2 levels, reduced ice sheets, and altered orography and vegetation influenced the mPWP AMOC. Our findings indicate that higher CO2 concentrations and smaller ice sheets both weaken the AMOC with respect to the pre-industrial. The stronger mPWP AMOC is therefore a consequence of the combined orography and vegetation forcing, with closed Arctic gateways accounting for approximately 80% of this forcing.  The primary mechanism driving the AMOC strengthening was a reduction in freshwater transport from the Arctic to the North Atlantic, enhanced by a decrease in surface freshwater flux into the high-latitude North Atlantic. Additionally, we find that orography and vegetation changes explain approximately 85% of above-average SST warming in the subpolar North Atlantic during the mPWP, with nearly half  of this warming attributable to the closure of the Arctic gateways.

How to cite: Weiffenbach, J., Chan, W.-L., Abe-Ouchi, A., and von der Heyt, A.: Impact of mid-Pliocene boundary conditions on the Atlantic Meridional Overturning Circulation (AMOC), EGU General Assembly 2025, Vienna, Austria, 27 Apr–2 May 2025, EGU25-5889, https://doi.org/10.5194/egusphere-egu25-5889, 2025.

EGU25-6059 | ECS | Orals | CL4.2

Moving beyond the mean state: Jet stream variability in the Pliocene 

Abigail Buchan, Julia Tindall, Stephen Hunter, Aisling Dolan, Alan Haywood, and Daniel Hill

The mid-Piacenzian Warm Period (mPWP), specifically Marine Isotope Stage KM5c, has been the focus of many palaeoclimate studies due to its potential analogy to the future climate. The similar to modern continental configuration, higher CO2 concentrations of 400ppm, and similar to modern orbit provides the opportunity to examine the world in a warmer climate with relevance to our future.

To date, the majority of studies have focussed on changes to the mean state, however, changes to higher frequency climate variability are crucial to assess to understand both the potential for the mPWP to be used as an analogue for extremes, and to understand the distribution of data that may be recorded in the palaeo record. Here, we use data from the Pliocene Model Intercomparison Project Phase 2 and move beyond the mean state to shorter temporal scales. This aims to improve our understanding of the change in extreme events in the mPWP and the drivers of these changes.

We start broad, looking at the mean state and examining changes to the Northern Hemisphere jet stream and find that in boreal winter months, the jet stream exhibits a poleward shifted state, with a dipole pattern in the speed of the winds, in the mPWP compared with the pre-industrial control. We then move beyond the mean state analysis to consider the variability of the speed and position of the northern hemisphere jet stream in the mPWP and how these changes relate to extreme events.

To further understand the mechanisms behind these changes in the jet stream we present new forcing factorisation simulations using Hadley Centre Coupled Model version 3 (HadCM3) which aim to understand the different contributions of ice sheets, orography, and CO2 forcings to jet stream behaviour.

How to cite: Buchan, A., Tindall, J., Hunter, S., Dolan, A., Haywood, A., and Hill, D.: Moving beyond the mean state: Jet stream variability in the Pliocene, EGU General Assembly 2025, Vienna, Austria, 27 Apr–2 May 2025, EGU25-6059, https://doi.org/10.5194/egusphere-egu25-6059, 2025.

EGU25-7133 | ECS | Posters on site | CL4.2

The Impacts of Maritime Continent Topography in the Preindustrial and the Pliocene Warm Period Using HadCM3 

Xin Ren, Dan Lunt, and Erica Hendy

The Maritime Continent (MC) plays a critical role in regulating global atmospheric and oceanic circulation. This study explores the impact of MC topography on both regional and remote climate under preindustrial (PI) and mid-Pliocene warm period (mPWP) conditions using a lately tuned version of the HadCM3 climate model. Simulations are conducted by varying the topography of the northern MC (MCn) and southern MC (MCs), following the Pliocene Model Intercomparison Project (PlioMIP) Phase 2 experimental framework.

Results indicate that changes in the MCn topography during the mPWP, compared to PI conditions, lead to cooling in the northwestern Pacific, while variations of the MCs results in cooling over the eastern Indian Ocean. The MC topography variation has a large impact on the net hydrological flux (precipitation minus evaporation) over the MC and Indian Ocean, with both MCn and MCs leading to a decrease near the Timor passage region and an increase over the northern Indian Ocean. Compared to the PI, there is a westward movement of the Walker Circulation in the mPWP, and the MCs topography contributes to this westward movement. Although MC topographical changes have a limited effect on the total volume transport of the Indonesian Throughflow (ITF), variations in MCs topography substantially affect the ITF structure above 200 meters, and variations in MCn topography affect the ITF structure at depths around 1000 meters.

While the overall contribution of MC topography to global temperature changes is relatively small compared to the combination of other mPWP boundary conditions (CO2, ice sheets, soil, vegetation, lakes, and changes in topography of other regions), it plays a critical role in shaping the ITF and influencing both local and remote climate systems.

How to cite: Ren, X., Lunt, D., and Hendy, E.: The Impacts of Maritime Continent Topography in the Preindustrial and the Pliocene Warm Period Using HadCM3, EGU General Assembly 2025, Vienna, Austria, 27 Apr–2 May 2025, EGU25-7133, https://doi.org/10.5194/egusphere-egu25-7133, 2025.

The largest Cenozoic hyperthermal, the Paleocene-Eocene Thermal Maximum (PETM, 56 Ma) was associated with about 5 K global surface warming and an estimated total carbon release of several thousand Pg. The PETM is widely considered the best analog for present/future carbon release. Over the next few centuries, with unabated emissions of anthropogenic carbon dioxide (CO2), a total of several thousand Pg C may enter the atmosphere, causing CO2 concentrations to rise sharply, global temperature to warm by several degrees, and surface ocean pH to decline substantially. A carbon release of this magnitude is unprecedented during at least the past 66 million years and the outcome accordingly difficult to predict. In this regard, the geological record provides foresight to how the Earth system will respond in the future. Here, I analyze the long-term legacy of massive carbon release into the Earth's surface reservoirs, comparing the Anthropocene with the PETM and evaluating the PETM's potential as a case study for present and future anthropogenic carbon emissions. I will examine climate forcing and response, chronology, and time scales of CO2 neutralization that determine the atmospheric lifetime of CO2 in response to carbon release. I compare forcings in terms of carbon release rate, i.e., the duration of carbon release during the Anthropocene vs. PETM and the ensuing effects on climate and ocean chemistry. Importantly, I will examine proxies used to reconstruct changes in atmospheric CO2 and hence carbon input during the PETM. The analysis provides new insight into the pitfalls associated with pH and pCO2 proxies, and reconciles previous inconsistencies between carbon input, climate change, and sedimentary response. I will also discuss the conundrum that the observed duration of the PETM appears to be much longer than predicted by models that use first order assumptions. Understanding the long duration of the PETM is critical for predicting the long-term consequences of anthropogenic carbon release.

How to cite: Zeebe, R.: The Paleocene-Eocene Thermal Maximum as a Future Analog: New Insight into pCO2 reconstructions, EGU General Assembly 2025, Vienna, Austria, 27 Apr–2 May 2025, EGU25-7526, https://doi.org/10.5194/egusphere-egu25-7526, 2025.

EGU25-9895 | Orals | CL4.2

Records of vegetation and South Asian summer monsoon dynamics in the Bay of Bengal during the current and last interglacial periods 

Stéphanie Desprat, Coralie Zorzi, Charlotte Clément, Qiuzhen Yin, Albert Galy, Steven Clemens, Kaustubh Thirumalai, Srinivasan Prasad, Krishnamurthy Anupama, Qianqian Su, Anqi Lyu, Antoine Grémare, Valier Galy, Christian France-Lanord, and Philippe Martinez

While it is accepted that the tropical hydrological cycle has intensified during past interglacial periods due to changes in insolation, greenhouse gases, and ice volume, variations in the intensity and spatial distribution of rainfall in the South Asian monsoon domain, as well as the respective influence of these forcings during past warm periods, remain uncertain. Here, we present a pollen record from the Bay of Bengal (IODP Site U1446, located off the Mahanadi river exit, outside the influence of the Bengal fan) that allows reconstruction of vegetation changes in the core monsoon zone of India during two warm periods, the current and last interglacial periods. We compare the data with numerical model simulations (HadCM3 and LOVECLIM1.3) to assess the influence of different forcing mechanisms on the response of summer monsoon rainfall during past interglacials characterized by different levels of warming (Clément et al., 2024). We also present a pollen record from cores (SO93) taken at 16°N from the Ganges-Brahmaputra-Meghna (G-B-M) river-fed Bengal fan, covering the current interglacial period.

Results from IODP Site U1446 show tropical forest expansion between 11.7-5 ka and 127-120 ka, defining two Indian humid periods, with the last interglacial showing the strongest monsoon activity, consistent with salinity reconstructions. During the last five millennia of both interglacial periods, moist tropical forest largely declined in favor of savanna marking a significant decrease in summer monsoon rainfall. Although the pollen assemblages from sites SO93 and U1446 show substantial differences in Holocene vegetation cover between the basins, the maximum expansion of the evergreen component of the tropical forest is recorded contemporaneously in both sequences. This suggests a similar Holocene evolution of the summer monsoon from central to northern India. The model-data comparison highlights boreal summer insolation as the primary driver of vegetation dynamics and monsoon intensity during interglacial periods, with CO2 and ice-sheets having a limited effect. These results also show that vegetation remains unaffected by pre-industrial CO2 variations above 250 ppmv, a threshold value that characterizes most interglacials of the last million years.

Clément, C., Martinez, P., Yin, Q., Clemens, S., Thirumalai, K., Prasad, S., Anupama, K., Su, Q., Lyu, A., Grémare, A., Desprat, S., 2024. Greening of India and revival of the South Asian summer monsoon in a warmer world. Commun. Earth Environ. 5, 685.

How to cite: Desprat, S., Zorzi, C., Clément, C., Yin, Q., Galy, A., Clemens, S., Thirumalai, K., Prasad, S., Anupama, K., Su, Q., Lyu, A., Grémare, A., Galy, V., France-Lanord, C., and Martinez, P.: Records of vegetation and South Asian summer monsoon dynamics in the Bay of Bengal during the current and last interglacial periods, EGU General Assembly 2025, Vienna, Austria, 27 Apr–2 May 2025, EGU25-9895, https://doi.org/10.5194/egusphere-egu25-9895, 2025.

EGU25-11152 | ECS | Orals | CL4.2

Proxy-model comparison of EECO upper ocean temperatures using coccolith clumped isotope thermometry 

Alexander Clark, Madalina Jaggi, Stefano Bernasconi, Victoria Taylor, Nele Meckler, Xiaoqing Liu, Matthew Huber, and Heather Stoll

Inorganic carbonate proxies measured on planktic foraminifera, such as δ18O and Mg/Ca, suggest that the early Eocene Climatic Optimum (EECO; ~50 Ma) was a period characterised by extremely warm global ocean temperatures (Hollis et al., 2019). However, significant inter-proxy offsets in reconstructed absolute temperatures  exist and stem from differing sensitivities to diagenesis, uncertainties of past seawater composition, and variations in the water depth recorded by different proxy archives. Here we present clumped isotope-derived upper ocean temperature reconstructions measured on coccoliths, from a suite of globally distributed sites for an interval (50.7 Ma–50.4 Ma) representative of peak EECO conditions. Coccolith clumped isotope-derived temperatures are independent of the seawater carbonate chemistry and are species-independent (Clark et al., 2024), which allows for reliable past temperature reconstructions. We compare our results to HADCM3 and GFPL annual time series model simulations with multiple CO2 levels from the recent DeepMIP model compilation (Steinig et al., 2024). Since we consider variability across “deep” time to be minimal, we identify the depths and months our coccoliths most likely calcified at for each site, to allow for better comparison to the annual time series model simulation. This is especially important since modern coccoliths calcify at different depths across different ocean basins (Clark et al., 2024; Mejia et al., 2023).

Using the well-constrained coccolith calibration (Clark et al., 2024), we find that coccolith clumped isotope-derived temperatures generally agree well with previous surface ocean temperature reconstructions from other inorganic carbonate proxies (Hollis et al., 2019). During the EECO, we also find a similar magnitude of variability in coccolith calcification depths as observed in the modern ocean. This suggests that coccolith calcite records upper ocean temperature signals rather than solely sea surface temperature. Furthermore, the variability in overlap between the model and coccolith clumped temperatures across an annual year, in particular for the mid latitudes, further confirm that coccolith calcite captures upper ocean temperature signals largely during coccolithophore blooming months. Our coccolith clumped isotope-derived temperature data confirms the relatively flat latitudinal gradients and warm high latitudes found by other temperature proxies during the EECO, highlighting the potential of coccolith clumped isotopes as an useful tool for reconstructing past upper ocean temperatures during past warm climates.

Hollis et al., 2019, https://doi.org/10.5194/gmd-12-3149-2019 ; Mejia et al., 2023, https://doi.org/10.1016/j.epsl.2023.118313 ; Clark et al., 2024, https://doi.org/10.22541/essoar.173042174.40363194/v1 ; Steinig et al., 2024, https://doi.org/10.1038/s41597-024-03773-4

How to cite: Clark, A., Jaggi, M., Bernasconi, S., Taylor, V., Meckler, N., Liu, X., Huber, M., and Stoll, H.: Proxy-model comparison of EECO upper ocean temperatures using coccolith clumped isotope thermometry, EGU General Assembly 2025, Vienna, Austria, 27 Apr–2 May 2025, EGU25-11152, https://doi.org/10.5194/egusphere-egu25-11152, 2025.

EGU25-12153 | ECS | Posters on site | CL4.2

Southern ocean temperatures and CO2 across the onset of the Middle Miocene Climatic Optimum 

Laurine Jonk, Reto Wijker, Madalina Jaggi, Martin Ziegler, and Heather Stoll

The Middle Miocene Climatic Optimum (MMCO, ∼16.9 - 14.7 Ma), is marked by lower δ18O values in bulk and benthic suggesting a warming and/or reduction in land ice. CO2, due to its climatic influence, is suspected to be a key driver of this temperature shift. However, the climate and CO2 during the MMCO was highly variable in some records. The limited number of high-resolution temperature and CO2 reconstructions for this interval makes it difficult to characterize the temperature and CO2 change across the MMCO onset. pCO2 levels can be estimated using the fractionation factor (εp) of coccolithophores when they photosynthesize and produce alkenones as their biomass. We present a high-resolution record of sea surface temperature (SST) and εp values for 16 to 19.7 Ma, derived from alkenones at IODP Site 1168 in the Southern Ocean, providing insights into the onset of the MMCO. The data reveals an increase in temperature of approximately 4°C, from 23°C to 27°C, across the MMCO δ18O shift. There is a modest positive correlation observed between SST and bulk δ18O values. In addition, δ18Osw trends, calculated from alkenone temperature and coccolith δ18O, indicate freshening between period 16.5 to 17.5 Ma, consistent with the expected retreat of the Antarctic ice sheet during the MMCO. Orbital scale temperature variations of 2 degrees can be observed. Further analysis of εp values will help reconstruct the contribution of CO2 to this climatic transition.

How to cite: Jonk, L., Wijker, R., Jaggi, M., Ziegler, M., and Stoll, H.: Southern ocean temperatures and CO2 across the onset of the Middle Miocene Climatic Optimum, EGU General Assembly 2025, Vienna, Austria, 27 Apr–2 May 2025, EGU25-12153, https://doi.org/10.5194/egusphere-egu25-12153, 2025.

EGU25-12659 | Orals | CL4.2

Plio-Pleistocene Indian Ocean Dipole dynamics and their impact on paleoclimate 

Gerald Auer, Anna Joy Drury, Beth Christensen, Or M Bialik, and David De Vleeschowuer

The Indian Ocean Dipole (IOD) is a distinct east-west temperature gradient in the Indian Ocean, similar to the El Niño Southern Oscillation in the Pacific. Here, positive IOD (+IOD) events bring warm eastern and cool western sea surface temperatures, and vice versa for negative IOD (-IOD). This temperature seesaw brings increased seasonal rainfall to northeastern Africa while western Australia faces severe droughts during +IOD events. Conversely, -IOD states result in more droughts in Africa and increased precipitation in Australia. In addition to these immediate climatic impacts, possible IOD-driven teleconnections may impact the Australasian Monsoon system, as they (appear to) modulate summer monsoon precipitation over India, Southeast Asia, and possibly Australia.

However, despite its nature as a key climate driver in the Indian Ocean today, little data exists on changes in large-scale IOD patterns in the geologic past, especially in our past understanding of its role in ENSO dynamics. For instance, on glacial-interglacial timescales, sea level-driven exposure of the West Australian Shelf affects Pacific heat transport into the western region of the IOD. These changes were further exacerbated by the ongoing restriction and reorganization of the Indonesian Gateway since 5 Ma ago and the related changes in Pliocene to recent ENSO dynamics.

To disentangle the impact of IOD patterns in the Plio-Pleistocene climatic patterns in the Indo-Pacific region, we present new X-ray fluorescence core scanning data from Ocean Drilling Project (ODP) Site 763 between 2 – 5 Ma ago. These data provide new insights into Australian climate dynamics, which we could then relate to Indo-Pacific Warm Pool (IPWP) changes and the establishment of Late Pliocene to Pleistocene pIOD mean states. Changes in IOD and IPWP sea surface temperature patterns were constructed using a selected set of latitudinal temperature gradients through the equatorial Indo-Pacific. Temperature gradients were calculated using published SST reconstructions based on mixed layer planktonic foraminifer (Trilobatus sacculifer) Mg/Ca records from ODP Site 806 (West Pacific Warm Pool), ODP Site 763 (eastern Indian Ocean) and ODP Site 709 (western Indian Ocean).

Comparison of these data for the first time, reveals the close interconnectivity of tropical climate and oceanographic changes over the study interval. These include Plio-Pleistocene Australian and African hydroclimate trajectories and the contemporary monsoonal precipitation over Southeast Asia. We further pinpoint shifts in the Indian Ocean climate system corresponding to the tectonic restriction of the Indonesian Gateway (3.6 Ma), the Pliocene M2 glacial event (3.3 Ma), and the intensification of Northern Hemisphere glaciation (2.9- 2.7 Ma).

Our results provide insight into the importance of permanent shifts in the Indian Ocean Walker Circulation mean states for near-future climate scenarios. Our recorded IOD mean state shifts highlight the need for further detailed studies to better understand past IOD changes and their associated paleoclimatic impact in the region.

How to cite: Auer, G., Drury, A. J., Christensen, B., Bialik, O. M., and De Vleeschowuer, D.: Plio-Pleistocene Indian Ocean Dipole dynamics and their impact on paleoclimate, EGU General Assembly 2025, Vienna, Austria, 27 Apr–2 May 2025, EGU25-12659, https://doi.org/10.5194/egusphere-egu25-12659, 2025.

EGU25-13363 | ECS | Orals | CL4.2

Constraining effective radiative forcing and adjustments driving past warm intervals 

Noah Kravette and Ran Feng

Understanding the drivers of past warming climates is fundamental to reconstructing Earth’s climate history and refining projections of future climate change. Cenozoic warming intervals, including the mid-Pliocene (3–3.3 Ma), mid-Miocene (11.6–16 Ma), and early Eocene (47–56 Ma), provide analogs for present-day warming, featuring similar boundary conditions but substantially warmer climates. These intervals illustrate how variations in CO₂, ice sheets, vegetation, geography, and topography influenced global climates through radiative forcing and feedback mechanisms, offering essential insights into the climate dynamics following an intermediate warming pathway.

Despite extensive research on these intervals, the role of radiative forcings from changing boundary conditions remains poorly constrained. Here, focusing on the mid-Pliocene, we leverage three generations of the Community Earth System Model (CCSM4, CESM1.2, CESM2) to quantify radiative forcing and decompose the contributions of CO₂, vegetation and ice sheets, and topography and geography. Using published CESM radiative kernels, we diagnose radiative adjustments in atmospheric temperature, water vapor, surface albedo, and cloud properties, with a particular focus on cloud forcing and its interactions due to their critical role in modulating radiative adjustments and subsequent feedbacks.

Effective radiative forcing (ERF) is calculated as the difference in net top-of-atmosphere radiative fluxes between pre-industrial control and warming interval simulations, with prescribed sea surface temperatures specific to each interval. The simulations incorporate CO₂ levels, ice and vegetation, and geographic and topographic conditions representative of each period.

Our results show that CO₂ contributes approximately 60% of total forcing, with the strongest impacts in the tropics and Arctic. Cloud-related adjustments exhibit significant variability, with the net cloud adjustment even reversing its sign in with different radiative perturbations--emphasizing the complex interplay between radiative adjustments and the role of clouds in shaping climate responses across Cenozoic warming intervals.

We suggest that constraining radiative forcing from different perturbations of the past warm intervals is essential for understanding and decomposing drivers of past climate warmth and reducing inter-model variability in climate simulations.

How to cite: Kravette, N. and Feng, R.: Constraining effective radiative forcing and adjustments driving past warm intervals, EGU General Assembly 2025, Vienna, Austria, 27 Apr–2 May 2025, EGU25-13363, https://doi.org/10.5194/egusphere-egu25-13363, 2025.

EGU25-13508 | ECS | Orals | CL4.2

Seawater oxygen isotopes fingerprint of Atlantic Meridional Overturning Circulation patterns in mid-Miocene simulations 

Anta-Clarisse Sarr, Daeun Lee, R. Paul Acosta, and Chris J. Poulsen

Atlantic Meridional Overturning Circulation (AMOC) pattern and strength have been shown to be highly sensitive to prescribed boundary conditions across mid-Miocene simulations. Among previously published mid-Miocene studies the intensity of simulated AMOC varies from weak to vigorous, including within single model ensemble. Shifts in AMOC are known to affect, among others, North Atlantic sea surface temperatures and atmospheric circulation and hydroclimate in the tropics. Yet, the assessment of how those changes would affect the oxygen isotope ratio of seawater remains limited; so is the potential implication for model-data comparison and the understanding of Miocene climate evolution. In this contribution we used mid-Miocene simulations with the water isotopes enabled Community Earth System Model (iCESM1.2) to investigate the relation between AMOC, regional ocean and atmosphere circulations and isotopic composition of seawater. Our set of simulations includes sensitivity tests to AMOC strength and atmospheric concentration of CO2. Our analysis shows that different AMOC patterns generate strong changes in both seasonality and upper ocean structure that are fingerprinted in the isotopic signal of the Northern Hemisphere and the tropical band. Our simulations offer mechanistic understanding for changes depicted in isotopic records from the tropical basins during and after the Mid-Miocene Climate Transition (14.6-13.9Ma). 

How to cite: Sarr, A.-C., Lee, D., Acosta, R. P., and Poulsen, C. J.: Seawater oxygen isotopes fingerprint of Atlantic Meridional Overturning Circulation patterns in mid-Miocene simulations, EGU General Assembly 2025, Vienna, Austria, 27 Apr–2 May 2025, EGU25-13508, https://doi.org/10.5194/egusphere-egu25-13508, 2025.

EGU25-14361 | Posters on site | CL4.2

Westerly Jet southward shifts in response to Atlantic Meridional Overturning Circulation reductions during past interglacial periods 

Kana Nagashima, Hitoshi Hasegawa, Karen Okada, and Shin Toyoda

The Westerly Jet, locating northern boundary of the Hadley Circulation, plays a critical role in contributing mid-latitude climate by facilitating heat and moisture transport through its meandering path. Previous proxy records and numerical simulations have shown that the Jet’s path was altered in response to the repeated reduction events of the Atlantic Meridional Overturning Circulation (AMOC) during the Last Glacial period, through the modulation of Hadley Cell intensity and latitudinal position (e.g. Nagashima et al., 2011; Lee et al. 2011). Considering the possible future AMOC reduction following the global warming (Rahmstorf 2004), it is critically important to investigate the Jet's response to AMOC reduction during the warmer interglacial periods to enhance our understanding of future mid-latitude climate dynamics.

Recently, increasing evidence revealed AMOC reductions occurred even during interglacial periods, including MIS 1, 5e, 7e, 9e, and 11c (e.g. Galaasen et al. 2020). In this study, we reconstructed the Westerly Jet path over East Asia during MIS 5e and 11c through a provenance analysis of Asian dust in Japan Sea sediments (MD01-2407, KR02–06 D-GC-6, and KR07-12 PC-5, PC-8). This reconstruction utilized the electron spin resonance intensity of quartz, following Nagashima et al. (2007, 2011, 2013). Our findings, combined with previously published data (Nagashima et al., 2013), revealed southward shifts of the Westerly Jet in response to AMOC reductions during the warmer interglacial periods recorded in the North Atlantic. Given the strong relationship between changes in the Westerly Jet's path over East Asia and variations in East Asian summer monsoon precipitation, particularly its northwest-southeast spatial distribution within China, the observed southward shifts in the Westerly Jet provide important insights into potential precipitation changes in monsoon regions due to the forthcoming AMOC weakening in the near future.

How to cite: Nagashima, K., Hasegawa, H., Okada, K., and Toyoda, S.: Westerly Jet southward shifts in response to Atlantic Meridional Overturning Circulation reductions during past interglacial periods, EGU General Assembly 2025, Vienna, Austria, 27 Apr–2 May 2025, EGU25-14361, https://doi.org/10.5194/egusphere-egu25-14361, 2025.

EGU25-17458 | ECS | Posters on site | CL4.2

Impact of the Middle Eocene Climatic Optimum on Planktic Foraminiferal Resilience in the Atlantic Ocean 

Silvia Sigismondi, Valeria Luciani, Laia Alegret, and Westerhold Thomas

The Middle Eocene Climatic Optimum (MECO), occurring around 40 million years ago, is marked by a gradual decline in marine bulk and benthic carbonate δ18O values by approximately 1‰ over a span of ~400,000 years. This is typically interpreted as a global temperature increase of 3–6 °C, followed by a rapid return to pre-event conditions. The MECO event is garnering increasing scientific interest, as it serves as a natural experiment for the temperatures and pCO2 levels Earth could reach by the end of this century if anthropogenic greenhouse gas emissions are not reduced. The MECO's δ13C signal, along with biotic and paleoceanographic changes, exhibits significant geographic variability, leaving many aspects of the event unresolved. Specifically, the biotic response remains poorly understood. This study addresses this gap by focusing on planktic foraminifera, which are sensitive to oceanic physical and chemical conditions and can provide insights into marine ecosystem resilience to global warming. We analyzed Ocean Drilling Program Sites 1051, 1263, and 702, spanning different latitudes across the Atlantic Ocean. These sites provide robust age models and stable isotope data. Our results show a marked turnover in planktic foraminiferal assemblages during the MECO, mainly driven by increased surface-water temperatures affecting pelagic food webs. The warming prompted a southward migration of warm-water taxa at Site 702, also observed in calcareous nannofossils. Notably, the warm-water taxon Large Acarinina (>150 μm) showed a significant, permanent decline within ~250,000 years during the late MECO stage at Sites 1051 and 702, well before its evolutionary disappearance at the Bartonian-Priabonian boundary. This decline was also observed in the Tethys. We hypothesize that changes in microalgal symbionts may have contributed to this decline. Additionally, a drop in Chiloguembelina abundance suggests increased oxygenation in its ecological niche, the oxygen-deficient zone (ODZ). While the foraminiferal assemblages exhibited some plasticity through community shifts and latitudinal migration, they did not recover their pre-disturbance diversity, indicating low stability and a lack of resilience during the MECO.

How to cite: Sigismondi, S., Luciani, V., Alegret, L., and Thomas, W.: Impact of the Middle Eocene Climatic Optimum on Planktic Foraminiferal Resilience in the Atlantic Ocean, EGU General Assembly 2025, Vienna, Austria, 27 Apr–2 May 2025, EGU25-17458, https://doi.org/10.5194/egusphere-egu25-17458, 2025.

EGU25-18070 | ECS | Posters on site | CL4.2

Global Coiling Shifts in Morozovella and Ecological Resilience of Acarinina during the EECO 

Giulia Filippi, Silvia Sigismondi, Bridget Wade, and Valeria Luciani

The Early Eocene Climatic Optimum (EECO; ~53–49 Ma) represents the prolonged interval with the highest temperatures and CO₂ levels of the Cenozoic with superimposed transient peak warming events (hyperthermals). The geological record provides a long-term perspective to current observations of marine ecosystem response to global warming. The EECO interval offers the opportunity to evaluate how global climatic shifts have influenced the resilience of planktic foraminifera, a key component of marine ecosystem.

Planktic foraminifera morphologic traits, including shifts in coiling direction - the ability to grow their chambers either clockwise (dextral) or counterclockwise (sinistral) - serve as highly sensitive indicators of environmental changes. This underscores their pivotal role in the study of past climate conditions.  Previous studies highlighted a permanent decline in the symbiont-bearing Morozovella abundance and diversity near the EECO onset and a coiling shift from dextral to sinistral during the K/X event in the Atlantic Ocean.

Here, we extend the coiling direction record to tropical Pacific (Shatsky Rise, Sites 1209–1210), southern Pacific (Tasman Sea, Site U1510), and Indian Ocean locations (Exmouth Plateau, Hole 762C). Our results reveal that the switch to sinistral coiling in Morozovella occurred at all the studied sites thus it appears globally recorded within the last ~200 kyrs after the K/X event. This evidence emphasizes the utility of this coiling shift as a valuable biostratigraphic tool. The Morozovella species-specific analysis discloses that the dominant M. aragonensis and M. crater significantly contributed to the coiling switch in the Atlantic, tropical Pacific, and Indian Oceans. Regardless sinistral and dextral Morozovella forms indicate cryptic speciation or morphotypes within the same species, our record implies that this interval favoured sinistral forms, so that he morozovellid decline in abundance can be largely read as the decline of dextral morphotypes. Notably, Acarinina exhibits no coiling preference.

Stable isotope analysis on dextral and sinistral Acarinina and Morozovella morphotypes can shed light on the intricate ecological dynamics of planktic foraminifera during the EECO. Sinistral Morozovella have lower δ 13C values across the EECO with respect to the pre-EECO interval, with both dextral and sinistral Acarinina showing even lower values. This suggests that Acarinina occupied a deeper habitat within the mixed layer and/or had reduced symbiotic activity. This ecological strategy may have ensured the Acarinina success, allowing it to thrive during the EECO, but only partially advantaged the sinistral morozovellids forms, which survived with respect to dextral morphotypes but only in small abundance.

Within the first ~600 kyr of the EECO, morozovellids declined in abundance and changed their coiling direction. The scenario recorded in this research delineates on how planktic foraminifera adapted—or struggled— in response to extreme warmth, a crucial result for a future climatic perspective.

How to cite: Filippi, G., Sigismondi, S., Wade, B., and Luciani, V.: Global Coiling Shifts in Morozovella and Ecological Resilience of Acarinina during the EECO, EGU General Assembly 2025, Vienna, Austria, 27 Apr–2 May 2025, EGU25-18070, https://doi.org/10.5194/egusphere-egu25-18070, 2025.

EGU25-18353 | Posters on site | CL4.2

Holocene climate and environmental change in Nuup Kangerlua, southwest Greenland  

Sofia Ribeiro, Anna Kvorning, Christof Pearce, Marit-Solveig Seidenkrantz, Antoon Kuijpers, Gavin Simpson, Nicolaj Krog Larsen, Lorenz Meire, and Maija Heikkilä

The Holocene epoch offers insights into past climate variability and associated environmental changes in the Arctic region, with implications for future scenarios. We present a multi-proxy study of Nuup Kangerlua (the fjord by Nuuk), southwest Greenland, covering the past ~10,500 years. Using sediment cores and a one-year sediment trap deployment, we reconstruct environmental changes, focusing on ice-sheet dynamics, oceanography, and productivity. Following the fjord deglaciation (~10-8 ka BP), the fjord was characterised by cold, low-productivity conditions with significant ice-rafted debris, transitioning to warmer, more productive conditions by ~7.5 ka BP. The mid-to-late Holocene (6.5–3 ka BP) experienced an exceptional oceanographic regime with indication of entrainment of Subpolar Mode Water (Atlantic origin) at the time of minimum extent of the Greenland Ice Sheet. At this time, dinoflagellate cyst assemblages reveal shifts from heterotrophic dominance to autotrophic taxa, signaling increased light availability and stratification. Biogeochemical proxies (TOC, δ13C, and biogenic silica) corroborate heightened productivity during this period. Contrasts with modern conditions suggest that sustained warming could alter fjord hydrography, potentially enhancing Atlantic-derived inflows. Our study provides new knowledge on the fjord's sensitivity to climate variability and it offers baselines for understanding the interplay between the Greenland ice sheet, fjord systems, and broader oceanographic processes under changing climatic conditions.

How to cite: Ribeiro, S., Kvorning, A., Pearce, C., Seidenkrantz, M.-S., Kuijpers, A., Simpson, G., Larsen, N. K., Meire, L., and Heikkilä, M.: Holocene climate and environmental change in Nuup Kangerlua, southwest Greenland , EGU General Assembly 2025, Vienna, Austria, 27 Apr–2 May 2025, EGU25-18353, https://doi.org/10.5194/egusphere-egu25-18353, 2025.

EGU25-20469 | Orals | CL4.2

Interglacials as test bed for climate change and variability in climate models 

Gerrit Lohmann, Lars Ackermann, Xiaoxu Shi, Ruijian Gou, and Yifan Ma

Paleoclimate data play a crucial role in validating advanced coupled climate models by offering insights into past climate transitions, which can inform our understanding of potential future conditions that may diverge significantly from today's climate. By examining past warm periods, we can assess the performance of climate models during interglacials and potential future warmer climates. This talk will highlight how integrating paleoclimate records with climate model simulations helps bridge knowledge gaps, focusing on the impact of ocean circulation, extreme weather events, and spatio-temporal dynamics in a warming world. Focus will be on interglacial sea surface temperatures, The higher the resolution, the higher is the spatial heterogeneity. Additionally, our Earth system model now incorporates an interactive cryosphere component, enabling us to simulate changes in both Antarctica and the Northern Hemisphere effectively. Theses feedbacks are essential for previous interglacials and the future.

As a second related aspect, current Earth system models are limited in their ability to accurately capture climate variability across different temporal scales, particularly underestimating temperature trends, multidecadal to centennial fluctuations. In this study, we show that high-resolution climate simulations with explicitly resolved sub-mesoscale ocean eddies, reveal increased long-term variability in the tropics, while simultaneously reducing interannual variability. This shift in spectral power, from dominance by interannual to multidecadal timescales, has significant implications for understanding past climate variability, refining future climate projections, and enhancing the detection of anthropogenic climate change.

How to cite: Lohmann, G., Ackermann, L., Shi, X., Gou, R., and Ma, Y.: Interglacials as test bed for climate change and variability in climate models, EGU General Assembly 2025, Vienna, Austria, 27 Apr–2 May 2025, EGU25-20469, https://doi.org/10.5194/egusphere-egu25-20469, 2025.

EGU25-20536 | ECS | Orals | CL4.2

Increased terrestrial ecosystem disturbances during the onset of the PETM and associated carbon cycle perturbations  

Mei Nelissen, Debra Willard, Gabriel Bowen, Teuntje Hollaar, Appy Sluijs, Joost Frieling, and Henk Brinkhuis

The intensification of the hydrological cycle, driven by global warming is expected to amplify extreme weather events and associated erosion. These hydrological shifts are likely to disrupt soil stability, accelerate organic carbon mineralization, and alter terrestrial ecosystems, all of which have potential implications for carbon cycle dynamics. Such terrestrial carbon cycle feedback mechanisms remain poorly constrained. While relatively slow compared to present-day carbon cycle change, the millennial scale onset of the Paleocene-Eocene Thermal Maximum (PETM, ~56 million years ago) was similarly associated with a massive input of 13C-depleted carbon into the ocean-atmosphere system that is recorded by a negative carbon isotope excursion (CIE) in sedimentary components. The PETM marks a global temperature increase of ~5 °C and is characterized by significant associated hydrological disturbances, erosion, and vegetation changes; the precise timing, impact and spatial scale of these processes are still being debated. Here, we show vegetation shifts  at the Norwegian Margin during the CIE onset interval at centennial scale resolution. Furthermore, we show terrestrial disturbances during the CIE onset are synchronous along several continental margins globally based on organic microfossil assemblages and reworked soils (clay minerals and organic matter). These observations signal changes in terrestrial biomass, intensified oxidation of soils and weathering of fossil organic carbon, potentially acting as a positive carbon cycle feedback mechanism. Carbon cycle model simulations indicate that these shifts in terrestrial carbon storage and fluxes may have appreciably contributed to the CIE and climate change, highlighting the importance of constraining the response of terrestrial biosphere feedback mechanisms to changing weather and climate.

How to cite: Nelissen, M., Willard, D., Bowen, G., Hollaar, T., Sluijs, A., Frieling, J., and Brinkhuis, H.: Increased terrestrial ecosystem disturbances during the onset of the PETM and associated carbon cycle perturbations , EGU General Assembly 2025, Vienna, Austria, 27 Apr–2 May 2025, EGU25-20536, https://doi.org/10.5194/egusphere-egu25-20536, 2025.

EGU25-20544 | ECS | Orals | CL4.2

Late Miocene giant clam records 57 years of multi-annual, seasonal and daily weather patterns from the Indonesian Throughflow 

Iris Arndt, Miguel Bernecker, Tobias Erhardt, David Evans, Jens Fiebig, Maximilian Fursman, Jorit Kniest, Willem Renema, Vanessa Schlidt, Philip Staudigel, Silke Voigt, and Wolfgang Müller

Seasonality and extreme weather events are important aspects of Earth’s climate system. Yet few climate archives provide continuous records at suitably high-resolution (i.e. daily) and long duration (i.e. decades) to study these features in the geologic past. (Sub)tropical marine giant clams (Tridacna) are ideal for this purpose because they grow quickly (mm-cm/year) and live for up to 100 years. Their aragonitic shells capture multi-annual climate to multi-day weather patterns of tropical reefs.

We present a late Miocene multi-proxy environmental record from the Makassar Strait (East Borneo, Indonesia), which includes oxygen and carbon isotope data at sub-monthly to seasonal resolution, growth rates at daily resolution as well as elemental ratios (B, Na, Mg, Sr, Ba to Ca) at sub-daily resolution. Using our Daydacna Python script we used the daily elemental cycles from LA-ICPMS analyses to create an internal age model, which revealed a growth span of ~57 years (20,916 ± 1,220 days (2 SD)).

Our high-resolution data reveal multi-annual, seasonal and daily cycles, along with evidence of extreme weather events. We suggest that the multi-annual cycles (about three years) may indicate a global ENSO-like climate pattern in the late Miocene, while annual cycles reflect local changes in water inflow to the reef influencing seawater isotopic composition, temperature and nutrients. Seasonal changes, likely tied to the movement of the Intertropical Convergence Zone (ITCZ), reduced light and primary productivity during rainy, cloudy periods, affecting the clam’s growth. Short-term extreme weather events (e.g. storms, heavy rainfall) indicated by few days-long El/Ca peaks, potentially resulted in reduced sea surface temperatures and likely disturbed the clam’s growth as a result of increased runoff and turbidity. Moreover, dual clumped isotope measurements confirm that the clam grew in equilibrium with seawater and provide a sea surface temperature independent of seawater-δ18O of 27.9°C ± 2.4°C as well as a seawater δ18O value of -0.43 ± 0.50‰ for this late Miocene reef.

How to cite: Arndt, I., Bernecker, M., Erhardt, T., Evans, D., Fiebig, J., Fursman, M., Kniest, J., Renema, W., Schlidt, V., Staudigel, P., Voigt, S., and Müller, W.: Late Miocene giant clam records 57 years of multi-annual, seasonal and daily weather patterns from the Indonesian Throughflow, EGU General Assembly 2025, Vienna, Austria, 27 Apr–2 May 2025, EGU25-20544, https://doi.org/10.5194/egusphere-egu25-20544, 2025.

EGU25-21556 | Posters on site | CL4.2

Rates of change in past warm periods, Part 3 

Manfred Mudelsee and Thomas Felis

Following the publication of the IPCC's Fifth Assessment Report in 2013, there has been mounting evidence indicating that the social and ecological impacts of global warming are increasingly contingent on seasonal extremes, such as peak summer temperatures, rather than trends in annual averages. This phenomenon is especially evident in the tropics, where extreme events have become a major threat to ecosystems. However, there remains a paucity of data concerning the present and future rates of change in means and extremes. This dearth of knowledge can be attributed to two key factors: firstly, the paucity of high-resolution data from bygone warm climates that could serve as analogues; and secondly, the absence of sophisticated data analysis methodologies.

The SEARCH project (Seasonal Extremes and Rates of Change in Past Warm Climates: Insights from Advanced Statistical Estimations on High-Resolution Coral Proxy Records) has been developed to enhance our understanding of past climates through the utilization of a database comprising high-resolution coral proxy records, complemented by the application of sophisticated simulation techniques from the domain of statistical science. The SEARCH database contains approximately 50 existing and newly acquired (bi-)monthly resolved coral proxy records from the following periods: (a) the Anthropocene, (b) the Medieval Climate Anomaly-Medieval Warm Period, (c) the Holocene Thermal Maximum, (d) the Last Interglacial, and (e) the Mid-Pliocene Warm Period.

We explain the methodological foundations of the project: proxy calibration, nonparametric kernel estimation of the first derivative of the climate proxy series and linear regression. It is important to note that these methods take into account the typical peculiarities of palaeoclimate time series, including non-Gaussian distributions, autocorrelation, uneven spacing, and uncertain timescales.

The primary outcome of our analyses indicates that the warming rates during the Anthropocene, which approximate 0.14 ± 0.04 °C per decade, appear to be relatively indistinguishable from the rates documented in other warm periods. We proffer an explanation for this observation and propose refinements to the analytical methodology.

This work has been funded by the Deutsche Forschungsgemeinschaft (DFG, German Research Foundation), project number 468589022 (SEARCH), within the SPP 2299, project number 441832482

How to cite: Mudelsee, M. and Felis, T.: Rates of change in past warm periods, Part 3, EGU General Assembly 2025, Vienna, Austria, 27 Apr–2 May 2025, EGU25-21556, https://doi.org/10.5194/egusphere-egu25-21556, 2025.

EGU25-764 | ECS | Orals | CL4.3

Radiogenic Pb and Nd isotopic variability of fine lithic materials in weathering profiles of Deccan Trap, India 

Shivam Sahu, Satinder Pal Singh, and Kumar Batuk Joshi

Radiogenic isotopes are widely used for sediment provenance. Sedimentary processes are often neglected but may influence the radiogenic Sr isotope-based provenance [1]. This study explores the radiogenic Pb-Nd isotopic systematics in fine lithic materials from the critical zone of Deccan Basalt (Raigad, Maharashtra). An insignificant Pb and Nd isotope variability of fine lithic materials (<20 mm, <5 mm, and <2 mm) is highlighted in the soil (n=5) and saprolite (n=10) samples. The fine soil and saprolite materials also show statistically insignificant differences in CIA (Chemical Index of Alteration) irrespective of the grain size. However, the soil materials (206Pb/204Pb 17.422±0.513, 207Pb/204Pb 15.354±0.104, 208Pb/204Pb 37.843±0.409, and eNd –14.4±2.4) are isotopically different as compared to the saprolite materials (206Pb/204Pb 16.823±0.063, 207Pb/204Pb 15.219±0.013, 208Pb/204Pb 37.374±0.056, and eNd –15.7±1.0). The less radiogenic Nd isotopes suggest altered basalt as the source rock composition. Further, the mass balance suggests that one topsoil sample has a significant contribution of ~75–80 % dyke materials exposed nearby. Whereas the other soil samples show <10 % and <6 % contributions from the dyke and UCC-type materials, respectively. These data reaffirms the robust use of Pb and Nd isotopes in sediment provenance. 

Reference:

[1] Dasch, E.J., 1969. Strontium isotopes in weathering profiles, deep-sea sediments, and sedimentary rocks. Geochimica et Cosmochimica Acta, 33(12): 1521-1552.

How to cite: Sahu, S., Singh, S. P., and Joshi, K. B.: Radiogenic Pb and Nd isotopic variability of fine lithic materials in weathering profiles of Deccan Trap, India, EGU General Assembly 2025, Vienna, Austria, 27 Apr–2 May 2025, EGU25-764, https://doi.org/10.5194/egusphere-egu25-764, 2025.

EGU25-1813 | Orals | CL4.3 | Milutin Milanković Medal Lecture

Understanding Paleoclimatic Inference of Stable Water Isotopes using iTRACE Simulation 

Zhengyu Liu

Stable water isotopes (δ18O) in precipitation are one of the most abundant paleoclimate proxies and have been used to infer temperature changes at high latitude and hydrological changes in the tropics. In spite of much progress, however, fundamental questions on the paleoclimate interpretation of stable water isotopes still remain open. Combing water isotope observations and an isotope-enabled TRAnsient ClimatE simulation of the last 21,000 years (iTREACE-21), I will discuss some recent progresses towards the understanding of paleoclimatic inferences of  δ18O.

I will first discuss the δ18O for the pan-Asian monsoon region. We show that the widespread δ18O variability that is coherent over the Asian monsoon continental region is accompanied by a coherent hydroclimate footprint, with spatially opposite signs in rainfall. This footprint is generated as a dynamically coherent response of the Asian monsoon system to meltwater forcing and insolation forcing, reinforced by atmospheric teleconnections. As such, a widespread δ18O depletion in the Asian monsoon region is accompanied by a northward migration of the westerly jet and enhanced southwesterly monsoon wind, as well as increased rainfall from South Asia to northern China, but decreased rainfall in southern China. 

I will then discuss the temperature effect of polar ice core δ18O, quantitatively, in a new framework called the Unified Slope Equations (USE) that illustrates the general relationship between spatial and temporal δ18O-temperature slopes. The application of USE to the Antarctica in model simulations and observations shows that the comparable Antarctica-mean spatial slope with deglacial temporal slope in δ18O-surface temperature is caused accidentally by the compensation responses between the δ18O-inversion layer temperature relation and the inversion layer temperature itself.  This finding further leads us to propose a paleothermometer that is more accurate and robust than the spatial slope as the present day seasonal slope of -inversion layer temperature, suggesting the possibility of reconstructing past polar temperature changes using present observations.

I will finally discuss the climate interpretation of tropical alpine ice core δ18O by combining proxy records with climate models, modern satellite measurements and radiative-convective equilibrium theory. I show that the tropical ice core δ18O is an indicator of the temperature of the middle and upper troposphere, with a glacial cooling of ~7oC . Furthermore, it severs as a Goldilocks indicator of global mean surface temperature change, providing the first estimate of glacial stage cooling that is independent of marine proxies as ~6oC .


How to cite: Liu, Z.: Understanding Paleoclimatic Inference of Stable Water Isotopes using iTRACE Simulation, EGU General Assembly 2025, Vienna, Austria, 27 Apr–2 May 2025, EGU25-1813, https://doi.org/10.5194/egusphere-egu25-1813, 2025.

EGU25-1984 | Posters on site | CL4.3

Factors controlling Mg isotopes in meltwater and suspended sediments of Arctic rivers 

Jong-Sik Ryu, Hyoun Soo Lim, Hyeongseok Song, Ok-Sun Kim, Minjune Yang, and Nathalie Vigier

Enhanced chemical weathering in glacial regions, driven by climate change, is projected to increase the delivery of dissolved and particulate matter to the ocean, significantly disrupting biogeochemical cycles of critical elements which exert a strong influence on the global carbon cycle. This study investigates the elemental and Mg isotope geochemistry of meltwater, suspended particulate matter (SPM), and bedrock samples from Ny-Âlesund, Svalbard, in order to elucidate the link between glacial weathering processes and Mg isotope variations within this glacial environment. Magnesium isotopic compositions (δ26Mg) in meltwaters and SPMs exhibit significant variability, in which meltwater δ26Mg values are in isotopic equilibrium with corresponding SPM values, yielding two distinct isotope fractionation factors depending on the drainage lithology.

A global comparison of water δ26Mg values in Arctic rivers reveals that variability in waterδ26Mg can be attributed to two primary factors, which are a global isotopic equilibrium state that is consistent with what is observed in Svalbard, and an influence of drainage lithology (silicates versus dolomite). Globally, riverine Mg, on average, exhibits a consistent Mg isotopic signature that closely resembles that of the upper continental crust, regardless of the diverse environmental conditions encountered by these river systems. This observation strongly suggests that dynamic interactions between erosion and weathering processes rapidly drive the system towards isotopic equilibrium, which is well supported by this study. 

Overall, this study highlights that the difference in δ26Mg between waters and SPMs can be used as a novel indicator for predicting weathering disequilibrium induced by global warming and other factors influencing the Earth's surface evolution.

How to cite: Ryu, J.-S., Lim, H. S., Song, H., Kim, O.-S., Yang, M., and Vigier, N.: Factors controlling Mg isotopes in meltwater and suspended sediments of Arctic rivers, EGU General Assembly 2025, Vienna, Austria, 27 Apr–2 May 2025, EGU25-1984, https://doi.org/10.5194/egusphere-egu25-1984, 2025.

EGU25-3043 | ECS | Posters on site | CL4.3

Tracing sediment sources in the western Philippine Sea since 143 ka with Sr and Nd isotopes 

Wei-Chieh Wang and Yi-Wei Liu

Tracing the sources and transport pathways of marine sediments provides criticle insights into regional atmospheric and oceanic circulation patterns. Strontium (Sr) and neodymium (Nd) isotopes proxies, when applied to thick and well-dated marine sediment cores, offer a powerful tool for evaluating regional climate dynamics over glacial-interglacial cycles. In this study, we present 13 paired Sr and Nd isotope records for each of two size fractions of lithogenic sediments spanning the past 143 ka, collected from the Benham Rise in the western Philippine Sea. Our goal is to assess the contributions of Asian dust and Southeast Asian volcanogenic sediments under varying global climate conditions. Preliminary results indicate distinct isotopic signatures between size fractions. Volcanogenic Sr isotopic ratios (⁸⁷Sr/⁸⁶Sr = 0.705 to 0.707) were found in sediment grain size >20 μm, while more radiogenic strontium isotope signatures (⁸⁷Sr/⁸⁶Sr = 0.709 to 0.711) were found in sediments in the 2–20 μm fraction. The differences in Sr isotopic signatures between size fractions may partly result from the size effect. Coupled with εNd values, although with some fluctuations, we found shifts in sediment sources over the past 134 ka, indicating decreased contributions of Asian dust source towards the Las Interglacial Highstand. These findings contribute to a deeper understanding of sedimentary processes and environmental shifts in the western Pacific region, offering new perspectives on regional climate.


Keywords: Strontium and neodymium isotopes; Marine sediments; source and transport pathways, Last glacial-interglacial cycle

How to cite: Wang, W.-C. and Liu, Y.-W.: Tracing sediment sources in the western Philippine Sea since 143 ka with Sr and Nd isotopes, EGU General Assembly 2025, Vienna, Austria, 27 Apr–2 May 2025, EGU25-3043, https://doi.org/10.5194/egusphere-egu25-3043, 2025.

EGU25-3149 | Posters on site | CL4.3

Dynamics change in carbon cycle in contemporary environment in urban area in Gliwice, Poland 

Barbara Sensuła, Alicja Ustrzycka, and Adam Michczyński

The primary aim of our study is to monitor carbon dioxide concentrations and carry out advanced analyses of the carbon cycle through mass spectrometry-based research in the biosphere within an urban environment in the southern region of Poland. Sampling sites within urban agglomerations are crucial for examining both the similarities and differences between urban areas, including the levels of CO2 and their sources. Preliminary findings (Sensuła et al., 2023) suggest that continuous monitoring is essential, and incorporating additional research on carbon isotopes in the air may significantly contribute to understanding the carbon cycle in the studied areas.

In 2022, a new laboratory setup was established in Gliwice (Silesia, Poland) to monitor CO2 levels, enabling precise measurement of CO2 concentrations in the atmosphere. This system allows for high-time-resolution measurements of the CO2 molar fraction, as well as the collection and analysis of air samples. Furthermore, the extraction of CO2 from these samples, followed by 14C analysis via the MICADAS system, provides valuable data on the isotopic composition of both atmospheric and biospheric samples.

This study presents initial results in the form of a database documenting the molar fraction of CO2 and 14CO2 in atmospheric air samples from the urban area of Gliwice, Poland, covering the period from August 2023 to April 2025. CO2 concentrations have been measured using a low-cost system (CARBOCAP GMP-343), while 14C concentrations were determined through the MICADAS technique. Our observations in 2024 indicate that the 14C values in the air samples ranged from -55‰ to -24‰, while the monthly CO2 molar fraction varied between 428 and 469 ppm, depending on seasonal changes.

Additionally, since 2019 till 2024 we have investigated pine needles as potential archives of radiocarbon in contemporary environments. This examination focused on the radiocarbon concentration variations in pine needles of different ages, with thirty needle samples collected seasonally in Gliwice. The 14C concentrations in these samples were determined using a liquid scintillation counter, revealing a mean 14C fraction of 99.83 (69) pMC.

In January 2025, we began calibrating a new system based on the CRDS (cavity ring-down spectrometer) technique to analyze the stable isotopic composition of atmospheric gases (CO2 and CH4).

This work was supported by the following contracts and grants: the Initiative of Excellence – Research University programme implemented at the Silesian University of Technology, in the years 2022-2024 as part of a grant for cutting-edge research grant no.: 14/020 / SDU / 10-21- 03; project title: Analysis of CO2 changes in the atmospheric air: construction of a new module to monitor CO2 concentration in the air; EU funds FSD - 10.25 Development of higher education focused on the needs of the green economy European Funds for Silesia 2021-2027 : The modern methods of
the monitoring of the level and isotopic composition of atmospheric CO2 (project no.FESL.10.25-IZ.01-06C9/23-00) implemented at the Silesian University of Technology (2024-2026).

How to cite: Sensuła, B., Ustrzycka, A., and Michczyński, A.: Dynamics change in carbon cycle in contemporary environment in urban area in Gliwice, Poland, EGU General Assembly 2025, Vienna, Austria, 27 Apr–2 May 2025, EGU25-3149, https://doi.org/10.5194/egusphere-egu25-3149, 2025.

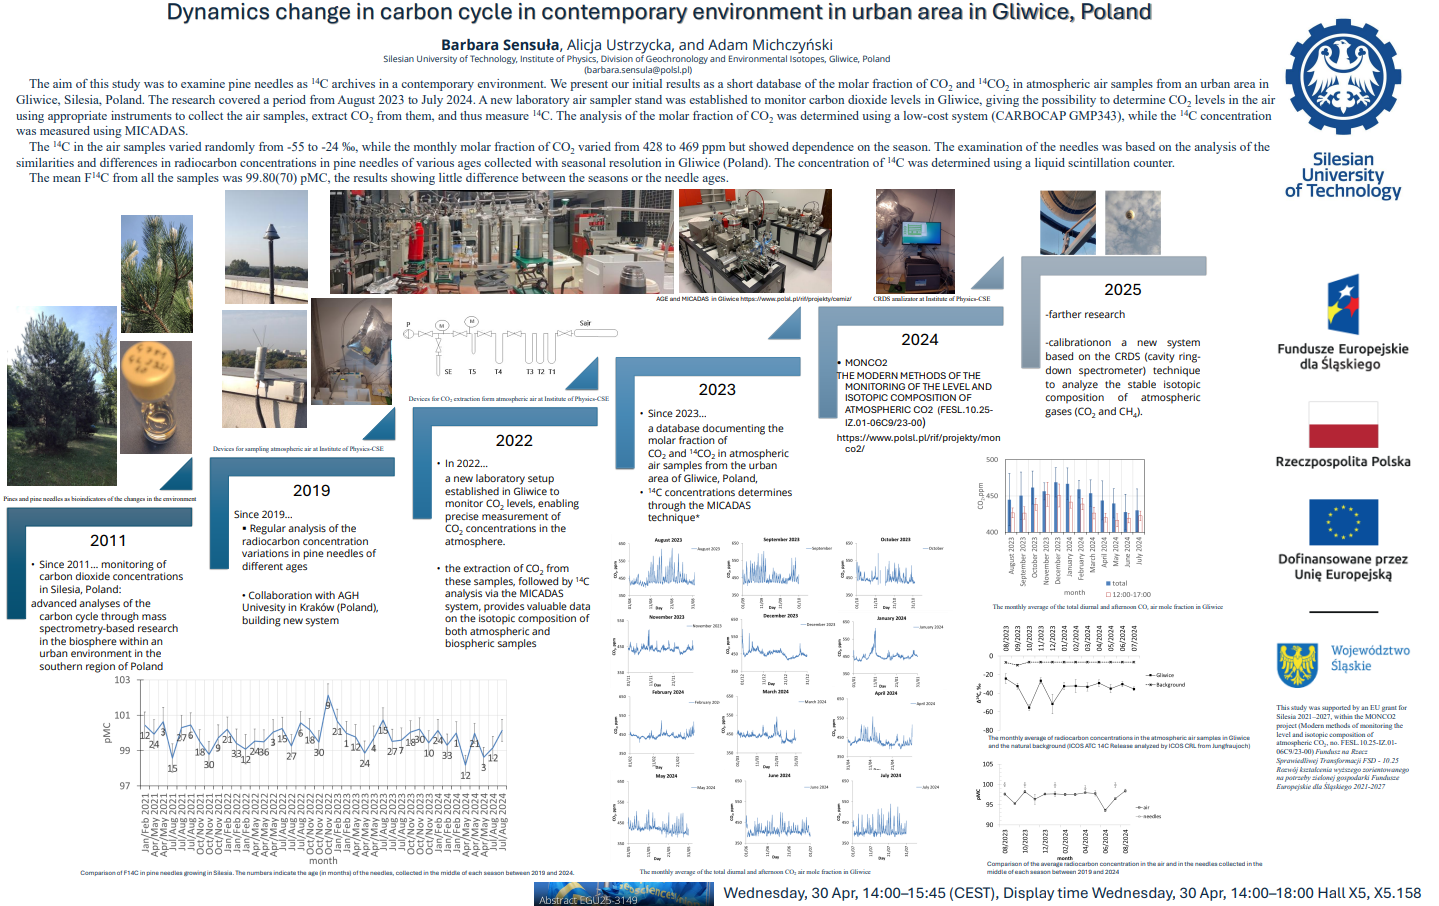
EGU25-3260 | Posters on site | CL4.3

Chironomid-based Holocene summer temperature dynamics from southern Spain  

Gonzalo Jiménez-Moreno, Narcís Prats, Oliver Heiri, Antonio García-Alix, R. Scott Anderson, Francisco J. Jiménez-Espejo, and Carmen Pérez-Martínez

This study presents a reconstruction of Holocene mean July air temperatures based on chironomid assemblages preserved in the sedimentary record of Laguna de la Mosca (LdlMo), an alpine lake in the Sierra Nevada of southern Spain. The LdlMo record reveals that the highest temperatures occurred during the Early and early-Middle Holocene, between 8500 and 7000 cal yr BP, followed by a significant cooling event. During the Middle Holocene, temperatures stabilized, but a second major cooling event occurred at approximately 4200 cal yr BP, possibly associated with the 4.2 kyr event. Throughout the Late Holocene, temperatures generally remained low, punctuated by warming episodes between 2300–1600 cal yr BP during the Iberian Roman Humid Period (IRHP) and around 1000 cal yr BP during the Medieval Climate Anomaly (MCA). The lowest temperatures were recorded at the end of the Little Ice Age (LIA), circa 1800 CE. Since ~1955 CE, a rapid and pronounced warming trend of 2.5°C has been observed, driven by anthropogenic climate change. This study shows the amplification of recent warming at high elevations, highlighting the vulnerability of these fragile and unique alpine environments to the impact of climate change.

This work was funded by grants BIOD22_001 and BIOD22_002, funded by Consejería de Universidad, Investigación e Innovación and Gobierno de España and Unión Europea – NextGenerationEU and PID2021-125619OB-C21 funded by the Ministerio de Ciencia e Innovacion of Spain, the Agencia Estatal de Investigacion and the Fondo Europeo de Desarrollo Regional FEDER MCIN/AEI/10.13039/501100011033/FEDER, UE

How to cite: Jiménez-Moreno, G., Prats, N., Heiri, O., García-Alix, A., Anderson, R. S., Jiménez-Espejo, F. J., and Pérez-Martínez, C.: Chironomid-based Holocene summer temperature dynamics from southern Spain , EGU General Assembly 2025, Vienna, Austria, 27 Apr–2 May 2025, EGU25-3260, https://doi.org/10.5194/egusphere-egu25-3260, 2025.

EGU25-4264 | ECS | Posters on site | CL4.3

Does the Largest Recorded Negative Carbon Isotope Excursion from the Neoproterozoic Krol Formation (India) Represent a Globally Synchronous Diagenetic Event? 

Debashish Pradhan, Melinda Kumar Bera, Ankita Nandi, and Ravikant Vadlamani

The "Shuram Excursion (SE)" stands as the largest known negative carbon isotope excursion (CIE) in geological history and is thought to represent the largest carbon cycle perturbation, possibly pivotal in the evolution of complex life forms and, thereafter, the Cambrian biotic explosion. Apart from the Shuram Formation at its type locality in Oman (the maximum depleted stable carbon isotopic ratio [δ13C value] in carbonate [peak δ13CCarbonate] of ~ –12 ‰), comparable negative CIE of similar ages has also been documented from different parts of the globe, among which the well constrained globally recognized SE sections are the Wonoka Formation of Australia (peak δ13CCarbonate of ~ −10 ‰), the Doushantuo Formation of South China (peak δ13CCarbonate of ~ −14 ‰), and the Rainstorm Member in the Johnnie Formation of Death Valley, California (peak δ13CCarbonate of ~ −11‰). Considering the inherent problem with the exact depositional age estimation for sedimentary rocks, although all the global locations show similar CIE patterns, the peak δ13CCarbonate values, and stratigraphic thicknesses vary from section to section. Because of these disparities, two distinct perspectives exist regarding the origin of the SE. While one group argues that a globally synchronous diagenetic event is responsible for the SE CIE, the other suggests it is a record of the temporal variation in the primary δ13C composition of the seawater dissolved inorganic carbon (DIC) and, hence, represents the actual carbon cycle perturbation. Based on the preliminary data obtained by other studies from the late Neoproterozoic Lesser Himalayan Krol Formation, previous workers tentatively suggested that the succession may contain the SE. However, because of the composite nature of the studied sections and the large spread in carbonate δ13C values in lithologically correlative stratigraphic (temporal) intervals, the proposition was not confirmed. So, the current study tries to recognize the possible SE CIE in the Lesser Himalayan Krol Formation, India, by studying continuously measured structurally undisturbed sections by employing vigorous fieldwork, detailed high-resolution carbonate δ13C data, and Pb-Pb dating of the carbonates after careful thin section and cathodoluminescence (CL) based screening for any possible diagenetic alterations. The transmitted light and CL-based petrographic observation, along with bulk and fabric-specific (micro-sampling) carbonate δ13C data, suggests the presence of distinct negative CIE with a peak δ13CCarbonate value of ~ –10.7 ‰ (CIE magnitude of ~10.7 ‰) in the Lesser Himalayan Krol Formation. The depositional age of ~560 ± 12 Ma, estimated by Pb-Pb dating of the carbonate across this CIE, further suggests the possible presence of SE CIE in the investigated section.

How to cite: Pradhan, D., Bera, M. K., Nandi, A., and Vadlamani, R.: Does the Largest Recorded Negative Carbon Isotope Excursion from the Neoproterozoic Krol Formation (India) Represent a Globally Synchronous Diagenetic Event?, EGU General Assembly 2025, Vienna, Austria, 27 Apr–2 May 2025, EGU25-4264, https://doi.org/10.5194/egusphere-egu25-4264, 2025.

EGU25-4937 | ECS | Orals | CL4.3

41Ca dating of marine deposits from Middle and Late Pleistocene 

Wei-Wei Sun, Michael Bender, En-Qing Huang, Huang Huang, Wei Jiang, Zheng-Tian Lu, Jun Tian, Tian Xia, Yu-Zhen Yan, Gun-Min Yang, and Hui-Min Zhu

41Ca (half-life = 99 ka) is a cosmogenic radionuclide that has long been proposed as a promising dating tracer for geological and archaeological samples from Middle and Late Pleistocene [1]. Calcium is abundant and has a residence time of 800 ka in the oceans, much longer than the half-life of 41Ca. This has led to the expectation of a uniform distribution of 41Ca/Ca ratios in oceans around the globe. Ocean deposits acquire the global seawater value of 41Ca/Ca upon the initial formation. Since ocean deposits are shielded from cosmic rays by overlying seawater, no cosmogenic 41Ca is produced as deposits grow older. These conditions are ideal for 41Ca dating of marine deposits.

However, the 41Ca/Ca ratio is typically less than 1015 in the environment, posing significant challenges for their measurements. Recent advances in Atom Trap Trace Analysis (ATTA) [2] have enabled the detection of 41Ca in geological samples [3]. The lowest 41Ca/Ca ratio measured so far is 3 × 10⁻¹⁸, found in a foraminifer sample from the Pacific Ocean.

We measured the 41Ca/Ca ratios in seawater samples from various depths in oceans around the world and mapped the spatial distribution of 41Ca. This work identifies the critical initial 41Ca/Ca value for 41Ca dating of marine deposits. Building on these findings, we performed 41Ca dating on foraminifera and coral samples from the Pacific, South China Sea, and Southern Ocean, and compared the results with those obtained from other dating methods. Meanwhile, we are exploring the feasibility of applying 41Ca dating to other geological and archaeological samples.


References:

[1] Raisbeck, G., Yiou, F. Possible use of 41Ca for radioactive dating. Nature 277, 42–44 (1979).

[2] A Primer on Atom Trap Trace Analysis (ATTA). http://atta.ustc.edu.cn/en-us/events/attaprimer.html

[3] Xia, TY., Sun, WW., Ebser, S. et al. Atom-trap trace analysis of 41Ca/Ca down to the 10–17 level. Nat. Phys. 19, 904–908 (2023)

How to cite: Sun, W.-W., Bender, M., Huang, E.-Q., Huang, H., Jiang, W., Lu, Z.-T., Tian, J., Xia, T., Yan, Y.-Z., Yang, G.-M., and Zhu, H.-M.: 41Ca dating of marine deposits from Middle and Late Pleistocene, EGU General Assembly 2025, Vienna, Austria, 27 Apr–2 May 2025, EGU25-4937, https://doi.org/10.5194/egusphere-egu25-4937, 2025.

EGU25-5402 | Orals | CL4.3

Basin-scale environmental changes in the Okhotsk Sea over the last 30,000 years 

Jianjun Zou, Qingchao Wang, and Xuefa Shi

The Sea of Okhotsk, situated at the northern boundary of the East Asian summer monsoon's domain, represents the southernmost region in the Northern Hemisphere where perennial sea ice develops year-round. It serves as a critical source of ventilation for modern North Pacific Intermediate Water and is highly sensitive to global climate change, making it an ideal natural laboratory for studying environmental changes. Despite its importance, our understanding of the basin-scale environmental evolution of the Sea of Okhotsk remains limited. This study addresses these gaps by compiling paleoenvironmental records from several sediment cores in the Sea of Okhotsk. We recalibrated the age models of these cores to reconstruct the histories of sea surface temperature (SST), sea ice activity, surface productivity, and intermediate water ventilation since 30 ka. Based on the reconstruction, we propose the conceptual modes of environmental evolution: the "glacial type," dominated by sea ice, and the "interglacial type," controlled by both sea ice and ocean currents. During the Last Glacial period (30 - 18 ka), the Sea of Okhotsk experienced low SSTs, extensive sea ice coverage, weak intermediate water ventilation, and reduced surface productivity. In contrast, the Late Holocene (< 6 ka) was characterized by higher SSTs, diminished sea ice, robust intermediate water ventilation, and increased surface productivity, with siliceous ooze being the dominant sediment component. Notably, during the Bølling-Allerød (14.7 - 13 ka) and Preboreal (11 - 9.7 ka) warm periods, the marine environment resembled the "interglacial type" but featured anoxic intermediate waters. During Heinrich Stadial 1 (18 - 14.7 ka) and the Younger Dryas (13 - 11.7 ka), environmental regimes were generally similar to the "glacial type" but with enhanced intermediate water ventilation. Since 30 ka, the evolution of environmental factors in the Sea of Okhotsk has been shaped by external forcings, internal feedbacks, and climate processes at both high and low latitudes, underscoring the complex interplay of factors influencing this dynamic region.

How to cite: Zou, J., Wang, Q., and Shi, X.: Basin-scale environmental changes in the Okhotsk Sea over the last 30,000 years, EGU General Assembly 2025, Vienna, Austria, 27 Apr–2 May 2025, EGU25-5402, https://doi.org/10.5194/egusphere-egu25-5402, 2025.

EGU25-5723 | Orals | CL4.3

Visualizing and quantifying biomineral preservation in fossils 

Živilė Žigaitė-Moro, Matthew Cowen, Marc de Rafélis, Loïc Ségalen, Benjamin Kear, and Maïtena Dumont

Palaeoclimatic reconstructions rely heavily on accurate interpretation of isotopic signal, retrieved primarily from fossil biominerals. Evaluating whether these geochemical proxies reflect original environment is often a challenge. In our recent study we have attempted to illustrate fossil vertebrate dental tissue geochemistry and, by inference, its extent of diagenetic alteration, using quantitative, semi-quantitative and optical tools to evaluate bioapatite preservation. Here we present visual comparisons of elemental compositions in fish and plesiosaur dental remains ranging in age from Silurian to Cretaceous, based on a combination of micro-scale optical cathodoluminescence (CL) observations (optical images and scanning electron microscope) with in-situ minor, trace and rare earth element (REE) compositions (EDS, maps and REE profiles), as a tool for assessing diagenetic processes and biomineral preservation during fossilization of vertebrate dental apatite. Tissue-selective REE values have been obtained using laser ablation-inductively coupled plasma-mass spectrometry (LA-ICP-MS), indicating areas of potential REE enrichment, combined with cathodoluminescence (CL) analysis. Energy dispersive X-ray spectroscopy (EDS) mapping was also used to identify major elemental components and identify areas of contamination or diagenetic replacement. We conclude that the relative abilities of different dental tissues to resist alteration and proximity to the exposure surface largely determine the REE composition and, accordingly, the inferred quality of preserved bioapatite.

How to cite: Žigaitė-Moro, Ž., Cowen, M., de Rafélis, M., Ségalen, L., Kear, B., and Dumont, M.: Visualizing and quantifying biomineral preservation in fossils, EGU General Assembly 2025, Vienna, Austria, 27 Apr–2 May 2025, EGU25-5723, https://doi.org/10.5194/egusphere-egu25-5723, 2025.

EGU25-6511 | Posters on site | CL4.3

Can shallow marine carbonate faithfully preserve the true signal of carbon cycle perturbation? 

Trupti Dadabhau Raskar, Arpita Samanta, and Melinda Kumar Bera

The carbon cycle perturbations in geological history are preserved in the form of changes in stable carbon isotope ratios (δ13C values) in different carbon-bearing sedimentary archives. The carbon cycle perturbation that occurred across the Paleocene-Eocene boundary (~56 Ma) is known as the Paleocene Eocene thermal Maximum (PETM). After more than three decades of research, the exact magnitude of the negative carbon isotope excursion (CIE) is still fuzzy. The shallow marine sedimentary archive, deposited far above the lysocline, is considered to be the best archive to quantify the carbon cycle perturbation because the deep marine (carbonate) was likely to be affected by carbonate dissolution and terrestrial sedimentary records influenced by different climatic parameters. However, different biotic and abiotic processes could influence the magnitude of the CIE during the perturbed carbon cycle-climate state in a shallow marine environment. For this reason, the present study investigated the early Paleogene marine carbonate rocks deposited in the eastern Tethyan Sea (Ladakh, NW India) to check the possible presence of the PETM CIE and test whether shallow marine carbonate is a good archive for measuring the CIE magnitude. The presence of age-diagnostic larger benthic foraminifera and detailed micro-facies analysis indicates the investigated shallow marine carbonate rocks were deposited during the ~56 to 54 Ma (Shallow Benthic Zone - 4 to 7) and are likely to hold the PETM CIE. The secular variation in the δ13C values of unaltered bulk carbonate, screened through the cathodoluminescence microscopic study, reveals a PETM CIE magnitude of -3.6 ‰.  The observed CIE magnitude is similar to the globally accepted CIE magnitude (-4 ± 0.4 ‰) for PETM and suggests that shallow marine carbonate can be used to assess the magnitude of PETM and other carbon cycle perturbations.

How to cite: Dadabhau Raskar, T., Samanta, A., and Kumar Bera, M.: Can shallow marine carbonate faithfully preserve the true signal of carbon cycle perturbation?, EGU General Assembly 2025, Vienna, Austria, 27 Apr–2 May 2025, EGU25-6511, https://doi.org/10.5194/egusphere-egu25-6511, 2025.

EGU25-8827 | Posters on site | CL4.3

Ursus spelaeus (Rosenmüller, 1794) during the MIS 3: temporal population distributions and relationship with climatic fluctuations 

Ana-Voica Bojar, Victor Barbu, Natalia Piotrowska, Hans-Peter Bojar, Andrei Smeu, Fatima Pawełczyk, and Ovidiu Guja

Ursus spelaeus, the Late Pleistocene a cave bear is known from numerous accumulations found in the fossil sector of caves situated in the Carpathian and Apuseni Mountains. In this study, we present approximate population variation in time using the temporal distribution and interval frequencies of radiocarbon ages from literature. Most of the dated skeletons were preserved in caves. The data suggest that, during the entire Marine Isotope Stage 3 (MIS 3) interval,  caves were serving as a shelter for U. spelaeus, with the oldest dated bone indicating ages over 60,000 and the youngest ones less than 30.000 years cal BP. Histogram plots of over 110 radiocarbon data from different caves of the Carpathian and Apuseni Mountains as Cioclovina Uscată, Peștera (Cave) cu Oase, Peștera Muierii, or Peștera Urșilor, respectively, show a maximum expansion of the cave bear population between 50,000 and 40,000, a decline between 40,000 and 35,000 and a partial recovery from 35,000–30,000 years cal BP. Radiocarbon data of Homo sapiens remains, younger than 35,000 years cal BP, support the fact that H. sapiens accessed the same caves where the cave bear persisted to hibernate. Besides general cool conditions and restricted food sources, the presence of H. sapiens constituted an additional stress factor driving the cave bear to extinction (Bojar et al., 2024).

References

Ana-Voica Bojar, Natalia Piotrowska, Victor Barbu, Hans-Peter Bojar, Fatima Pawełczyk, Andrei Smeu & Ovidiu Guja: Ursus spelaeus (Rosenmüller, 1794) during the MIS 3: new evidence from the Cioclovina Uscată Cave and radiocarbon age overview for the Carpathians, Isotopes in Environmental and Health Studies, DOI: 10.1080/10256016.2024.2376730

How to cite: Bojar, A.-V., Barbu, V., Piotrowska, N., Bojar, H.-P., Smeu, A., Pawełczyk, F., and Guja, O.: Ursus spelaeus (Rosenmüller, 1794) during the MIS 3: temporal population distributions and relationship with climatic fluctuations, EGU General Assembly 2025, Vienna, Austria, 27 Apr–2 May 2025, EGU25-8827, https://doi.org/10.5194/egusphere-egu25-8827, 2025.

EGU25-9061 | Orals | CL4.3

Ancient speleothem giant preserved in a high-Alpine cave (Dolomites, N Italy): rare insights into the Neogene 

Christoph Spötl, Gabriella Koltai, Robert Scholger, Jian Wang, Maria Knipping, and Hai Cheng

Conturines cave opens at 2775 m a.s.l. in the Dolomites (Northern Italy), hundreds of meters above the modern tree line. The cave is about 200 m long and comprises a single ascending paleophreatic conduit. The entrance of the cave is located at the base of the headwall of a former glacial cirque, testifying its pre-Pleistocene origin. Large parts of the cave floor are covered by an extensive (up to 3.5 m thick) flowstone and large stalagmite formations are present in the inner part of the passage, where the flowstone starts. All these large formations are inactive, partly corroded and dissected by fractures. The catchment area is a sharp ridge devoid of vegetation and soil, and the dripping water in the cave is undersaturated with respect to calcite, leading to the slow demise of these large speleothems.


Several drill cores covering the entire stratigraphy of the flowstone were obtained along the course of the gallery, the longest reaching bedrock at 3.5 m depth. Multi-proxy analyses of the two longest cores drilled approximately 5 m apart in the proximal part of the flowstone replicate well. Multiple magnetic reversals are preserved in the flowstone stratigraphy. According to preliminary U-Pb dating, speleothem deposition began ca. 5.5 - 5.0 Ma ago, likely coincident with the end of the Messinian Salinity Crisis in the Mediterranean, and continued intermittently until around 3 Ma. This uplifted ancient speleothem record provides a rare window into the Neogene at high resolution.

How to cite: Spötl, C., Koltai, G., Scholger, R., Wang, J., Knipping, M., and Cheng, H.: Ancient speleothem giant preserved in a high-Alpine cave (Dolomites, N Italy): rare insights into the Neogene, EGU General Assembly 2025, Vienna, Austria, 27 Apr–2 May 2025, EGU25-9061, https://doi.org/10.5194/egusphere-egu25-9061, 2025.

EGU25-10131 | Orals | CL4.3

Comparative analysis of gypsum from four different deposits of Badenian age in Romania 

Delia-Georgeta Dumitras, Octavian G. Duliu, Peter Istvan Luffi, Stefan Marincea, Doina Smaranda Sirbu Radasanu, Aurora Maruta Iancu, and Diana Persa

LA-ICP-MS, and XRD were used to investigate representative samples of gypsum collected from four deposits, all of them of Badenian age: Cheia (Transilvanian Basin, Cluj county), Ivancauti (Moldavian Platform, Botosani county), Negresti (Moldavide, Neamt county) and Moinesti (Moldavide, Bacau county) deposits were selected. The main objective of this study consisted of a geochemical, crystallo-chemical and economical potential detailed characterization of these deposits.

Accordingly, the LA-ICP-MS permitted determining the mass fractions of 21 elements including 10 REE (La, Ce, Nd, Sm, Eu, Gd, Er, Yb and Lu), as well as of Mg, P, Ti, Fe, Ni, Sr, Y, Ba, Pb, Th and U. Their content was interpreted considering their presence in the upper continental crust (UCC), sea water and chondrites.

Concerning the investigated elements, excepting for the REE ones, the LA-ICP-MS determinations evidenced in the case of Sr and U contents comparable with the UCC ones. It worth mentioning the presence of Sr of which mass fractions of 930 ± 47 and 545 ± 100 mg/kg in the Ivancauti and Cheia samples exceeded the UCC one of 330 mg/kg by a factor up to three, in good agreement with reported data concerning the lagunar Mediterranean gypsum.

At its turn, the U showed mass fractions varying between 1.76 ± 0.94 mg/kg in the case of Moinesti deposit and 2.93 ± 0.8 mg/kg for the Cheia samples, having the same order of magnitude as the UCC one of 2.7 mg/kg. On contrary, the maximum value of Th mass fraction of 68 ± 31 mg/kg was 155 times smaller than the value reported for UCC one. By comparing the ratio of the mass fractions of Th and U in investigated samples with the same ration of the sea water, the gypsum samples ratio of 0.02 significantly overpasses the sea water ratio of 0.0015, suggesting rather a terrigenous origin.

The great variability of the mass fractions of the investigated 11 elements makes possible the discriminant analysis of their distribution by considered elements as variable and deposits as cases. Indeed, a Root 2 vs. Root 2 bi-plot evidenced the presence of four clusters, the Negresti and Moinesti ones relatively closer and differing by the Ivancauti and Cheia ones with respect of Root 1, while Root 2 discriminates only the Cheia one with respect with the other three, i.e. Ivancauti, Negresti and Moinesti.

Likely, the investigated REE distribution showed for all of them mass fractions lower with one order of magnitude and more than the corresponding UCC values, e.g., varying from 5.59 ± 2.82 mg/kg for Yb in Ivancauti samples to 0.21 ± 0.04 mg/kg in the case of Lu in Moinesti gypsum. A peculiarity which we observed for all samples consisted of positive Ce and Eu anomalies. If the Ce anomaly could be associated to an oxidative depositional medium, the positive Eu anomaly could be associated to an increased content of Sr, but these facts need more investigations to be elucidated, especially as this anomaly was evidenced for all investigated samples, regardless the deposit.

How to cite: Dumitras, D.-G., Duliu, O. G., Luffi, P. I., Marincea, S., Sirbu Radasanu, D. S., Iancu, A. M., and Persa, D.: Comparative analysis of gypsum from four different deposits of Badenian age in Romania, EGU General Assembly 2025, Vienna, Austria, 27 Apr–2 May 2025, EGU25-10131, https://doi.org/10.5194/egusphere-egu25-10131, 2025.

EGU25-11318 | ECS | Orals | CL4.3

Late Holocene Climate Contrasts in NW Iberian Lakes 

Uxía Fernández-Pérez, Roberto Bao, Enno Schefuß, Teresa Rodrigues, Alberto Sáez, Pedro Raposeiro, Ricardo Prego, Rafael Carballeira, and Armand Hernández

This study explores Late Holocene climate variability and environmental transitions in the NW Iberian Peninsula by analyzing organic biomarkers (n-alkanes) and their isotopic signatures (δ¹³C and δD) from two contrasting lake systems: Lake Ocelo, a mountain lake (1517 m a.s.l.) located at a crucial point between the Atlantic and Mediterranean bioclimatic regions, and Lake Doniños, a coastal back-barrier perched lake (2.5 m a.s.l.) within the sub-Atlantic climatic domain. Lakes at varying altitudes provide complementary paleoenvironmental records that capture diverse ecosystem responses to past climate changes across vertical gradients.

In both Lake Ocelo and Lake Doniños, δD values reflect hydrological variability. In Ocelo, long-chain n-alkanes indicate terrestrial vegetation as the main source of organic matter. δD values (~-190‰ to ~-160‰) reflect wetter and cooler conditions during the Older Subatlantic (OSA; ca. 800-200 BCE), the Dark Ages (DA; ca. 300-750 CE) and Little Ice Age (LIA; ca. 1300-1900 CE), contrasted with warmer and drier conditions during the Roman Warm Period (RWP; ca. 200 BCE-300 CE), Medieval Climate Anomaly (MCA; ca. 750-1100 CE) and the Industrial Era (IE; ca. 1850 CE-present). Similary, in Doniños, δD values during the MCA became more positive, suggesting drier conditions. The MCA-LIA transition (ca. 1100–1300 CE) in Ocelo shows a shifts to wetter and cooler conditions, with δD and δ¹³C values declining. In Doniños, between 1200 CE and 1585 CE, δD became more positive, suggesting episodic drying and marine influence, likely linked to increased storminess. Also, δ¹³C rose sharply between 1400 CE and 1550 CE, during the LIA, possibly indicating increased nutrient input associated with climatic fluctuations or marine incursions. After a hiatus spanning 1585-1700 CE, δD stabilized at its most positive levels, marking reduced hydrological variability and arid conditions. Post-1850 CE, δD and δ¹³C trended toward more negative levels, reflecting increased meteoric water input due to wetter climate conditions or anthropogenic watershed. Additionally, the lowering of δ¹³C values during the IE may also reflect the Suess effect from fossil fuel combustion.

In Ocelo, δ¹³C data align with δD trends, reflecting shifts in vegetation composition and water stress, with relative enrichment in δ¹³C during the RWP and MCA suggesting warmer and drier conditions, while more negative δ¹³C during the LIA and DA reflects cooler and wetter conditions.

These findings emphasize the utility of biomarkers in reconstructing regional climate variability and the contrasting responses of mountain and coastal lakes to Late Holocene transitions. Despite their geographical proximity (185 km), both lakes reflect different climatic influences: Lake Ocelo records broader fluctuations linked to its bioclimatic position, while Lake Doniños is influenced by local processes, including marine intrusions and anthropogenic impacts. Similarities include drier conditions during the RWP and MCA in both lakes, while differences emerge during the LIA, where marine influence and storminess played a larger role in Lake Doniños. 

This work is supported by Grants PID2019-107424RB-I00 and PID2022-139775OB funded by MCIN/AEI/10.13039/501100011033, with the latter also co-funded by “ERDF A way of making Europe”. Xunta de Galicia also supports this work through projects ED431F 2022/18 and ED431B 2024/03.

How to cite: Fernández-Pérez, U., Bao, R., Schefuß, E., Rodrigues, T., Sáez, A., Raposeiro, P., Prego, R., Carballeira, R., and Hernández, A.: Late Holocene Climate Contrasts in NW Iberian Lakes, EGU General Assembly 2025, Vienna, Austria, 27 Apr–2 May 2025, EGU25-11318, https://doi.org/10.5194/egusphere-egu25-11318, 2025.

EGU25-11350 | Posters on site | CL4.3

High precision stable isotope analysis of carbonate and water samples for paleoclimate applications using the Elementar iso DUAL INLET 

Mike Seed, Calum Preece, Kathrin Rosenthal, and Sam Barker

Paleoclimate research is important for understanding past, current and future climate, providing the data needed to model and predict current and future climate change scenarios. Stable isotope analysis provides an essential tool for gathering past climate information from natural archives such as waters including ice-cores, ground waters, and biological waters; and carbonate materials such as foraminifera and other fossilized carbonates. Due to the often limited and small sample sizes available for stable isotope analysis it is vital that highly precise and accurate analysis can be carried out on the smallest of sample sizes.

Dual inlet technology remains the most precise, accurate and sensitive technique for pure gas, carbonate and water analysis. The Elementar iso DUAL INLET is a valuable tool for paleoclimate applications, enabling the analysis of pure gas samples within an incredibly compact footprint via our powerful lyticOS software suite. The 14-ultra low dead volume valves with bodies machined from a single block of high purity stainless steel and dedicated turbomolecular pump for the changeover valve guarantees zero residual memory effects between reference and sample gas.

The iso DUAL INLET can be optionally enhanced for the automated analysis of carbonate and water samples. With the iso AQUA PREP enhancement, up to 180 water samples can be analysed achieving δ18O precision better than 0.05‰ (1σ, n=10) and δD precision better than 1‰ (1σ, n=10), for any environmental water sample. The iso CARB PREP enhancement enables automated analysis of up to 180 micro-fossil samples for 13C and 18O down to 20μg sample size. For the highest productivity, both carbonate and water analysis can be performed with the iso MULTI PREP enhancement with switching between modes needing simply a change of needle. The IRMS collector configuration can also be upgraded for “clumped isotope analysis” of carbonate materials.

We will highlight the performance of the iso DUAL INLET with carbonate and water functionality across a range of sample types for paleoclimate applications, supporting researchers building a detailed understanding of the past to better inform policy makers for the future.

How to cite: Seed, M., Preece, C., Rosenthal, K., and Barker, S.: High precision stable isotope analysis of carbonate and water samples for paleoclimate applications using the Elementar iso DUAL INLET, EGU General Assembly 2025, Vienna, Austria, 27 Apr–2 May 2025, EGU25-11350, https://doi.org/10.5194/egusphere-egu25-11350, 2025.

EGU25-11461 | Orals | CL4.3

Heightened instability in lake circulation triggered by mid-Holocene warmth; insights from the varved sediments of Lake Nautajärvi, southern Finland  

Paul Lincoln, Rik Tjallingii, Emilia Kosonen, Antti Ojala, Ashley Abrook, and Celia Martin-Puertas

Future climate projections are expected to have a substantial impact on boreal lake circulation regimes, with warmer climates and higher organic loads leading to intensified thermo-stratification and brownification. Understanding lake sensitivity to warmer climates is therefore critical for mitigating potential ecological and societal impacts. The Holocene Thermal Maximum (HTM; ca 7-5 ka BP) provides a valuable analogue to investigate lake responses to warmer climates devoid of major anthropogenic influences.

In this presentation we present high-resolution micro-X-ray core scanning profiles (μ-XRF) of the annually laminated (varved) sediments from Lake Nautajärvi (NAU-23) in southern Finland to elucidate changes in lake circulation and sedimentation patterns. Principal component analysis (PCA) identifies two key components in the μ-XRF data associated with the nature of the sediments, i.e. detrital vs organic sedimentation (PC1), and hypolimnetic oxidation (PC2). Using these results, we will show that during the HTM, the lake became more sensitive to changes in oxygenation and mixing intensity. These changes were triggered by a warmer climate, which increased organic matter and redox sensitive metal solute concentrations in the water column, strengthening lake stratification and weakening dimictic circulation patterns. Superimposed on HTM weakened circulation are distinct phases of increased oxidation and iron-rich varve formation that do not happen when the background conditions are cooler (i.e. the early and late Holocene). This is driven by temporary strengthening of the mixing regime in response to climatic variability and storminess cycles across southern Scandinavia. These findings demonstrate that whilst warmer conditions weaken boreal lake circulation regimes, they can also make them increasingly vulnerable to short term oscillations in prevalent climatic conditions and weather patterns, which could have significant impacts on lake water quality and aquatic ecosystems. These findings underscore the non-stationary nature of lake sensitivity to short-term climatic variability and emphasize the potential for similar shifts to occur under future warming scenarios.

How to cite: Lincoln, P., Tjallingii, R., Kosonen, E., Ojala, A., Abrook, A., and Martin-Puertas, C.: Heightened instability in lake circulation triggered by mid-Holocene warmth; insights from the varved sediments of Lake Nautajärvi, southern Finland , EGU General Assembly 2025, Vienna, Austria, 27 Apr–2 May 2025, EGU25-11461, https://doi.org/10.5194/egusphere-egu25-11461, 2025.

EGU25-11502 | ECS | Orals | CL4.3

Seasonal bias in temperature-sensitive biomarkers: a multi-proxy assessment of branched GDGT suitability for Holocene climate reconstruction 

Ashley Abrook, Peter Langdon, Gordon Inglis, Achim Brauer, Paul Lincoln, Antti Ojala, and Celia Martin-Puertas

Understanding the evolution of Holocene climate is key for predicting what different futures may look like. However, global proxy and model-based climate reconstructions disagree on the general evolution of climate over the past 11.7 thousand years. Proxy-based reconstructions demonstrate a Holocene Climatic Optimum in the mid-Holocene, whilst model-based approaches show a trend of increasing temperatures throughout. This disagreement is largely believed to relate to seasonal biases within the proxy-based reconstructions, although model based-reconstructions are not without their flaws. Here we use a series of annually laminated (varved) lake sediment records from Europe (Diss Mere, United Kingdom; Meerfelder Maar, Germany; Lake Nautajärvi, Finland) to explore whether organic proxies are seasonally biased. To achieve this, we generate high-resolution (multi-decadal) branched glycerol dialkyl glycerol tetraether (brGDGT) lipid reconstructions of mean temperature of months above freezing (MAF; approximating MAAT in temperate locations) across the Holocene including the last 200-years and the mid-Holocene. We contrast our biomarker data with chironomid-inferred July summer temperature estimates from the same sample horizons within each lake to ascertain whether summer signals have an important imprint on the GDGT data. We show that brGDGTs are likely produced in situ within lake waters and that the varved nature of each lake does not impede brGDGT based climate reconstruction. We show that 1) GDGT-based temperatures record dominant climate variability at each site; 2) the mid-Holocene is warmer than present and pre-industrial mean annual temperatures; 3) biomarker and chironomid reconstructions from Diss Mere and Meerfelder Maar are more closely aligned than Nautajärvi suggesting location specific complexities; and 4) that biomarker and chironomid temperatures converge and diverge at various points in each record. Each of these results suggest seasonal biases exist within the GDGT-based climate reconstructions which may be non-stationary. Our data therefore reveals the need to generate multiple proxy-proxy assessments of climate from different archives to ascertain the influence of mean annual versus summer climate parameters. 

How to cite: Abrook, A., Langdon, P., Inglis, G., Brauer, A., Lincoln, P., Ojala, A., and Martin-Puertas, C.: Seasonal bias in temperature-sensitive biomarkers: a multi-proxy assessment of branched GDGT suitability for Holocene climate reconstruction, EGU General Assembly 2025, Vienna, Austria, 27 Apr–2 May 2025, EGU25-11502, https://doi.org/10.5194/egusphere-egu25-11502, 2025.

EGU25-11588 | ECS | Orals | CL4.3

Potentials and limitations of using cosmogenic Beryllium isotopes for the synchronization of marine sediment and ice cores 

Julia Loftfield, Norbert Nowaczyk, Lester Lembke-Jene, Thomas Frederichs, Johannes Lachner, Frank Lamy, Georg Rugel, Konstanze Stübner, and Florian Adolphi

Variations in the atmospheric production rate of cosmogenic 10Be lead to global changes in 10Be depositional fluxes. This may serve as a powerful tool for synchronizing various paleoclimate archives. For a robust synchronization, however, it is essential to understand the pathways of 10Be from its production in the upper atmosphere to its deposition in sediments and ice. While 10Be is deposited in ice within one to two years after production, its deposition in marine sediments is less direct, complicating its use for synchronization. To address this issue, we investigate the response of the authigenic 10Be/9Be ratio in marine sediments to a rapid increase in atmospheric 10Be production. We analyzed the 10Be/9Be ratios of three sediment cores from the Southern Ocean, all under the depositional regime of the Antarctic Circumpolar Current (ACC). We compared these records that encompass the period of the geomagnetic field minimum around the Laschamps excursion (~41 ka BP) to 10Be records from ice cores. All cores show an increase in the 10Be/9Be ratio during the Laschamps excursion. However, the marine records exhibit site-specific differences in amplitude and response time. We discuss the causes of these discrepancies and the roles of local residence time of Be in the water column, bioturbation of sediments, diagenetic Be fluxes, re-mobilization of sediments, and varying terrestrial Be sources. We argue that the attainable precision of a 10Be-based synchronization depends on the prior knowledge of these factors. Especially, the marine residence time of 10Be sets an upper limit on the achievable resolution from marine sediment 10Be/9Be records and leads to a temporal shift of the recorded 10Be/9Be changes relative to the increase in atmospheric 10Be-production. Additionally, terrestrial input of 10Be can lead to non-production influences on the 10Be/9Be ratio in sediments, even in pelagic settings. Nevertheless, under ideal conditions, marine sediments can capture 10Be/9Be signals that closely align with those in ice cores, highlighting the potential of 10Be/9Be ratios as a future chronostratigraphic tool for the synchronization of marine sediment records with other paleoclimate archives, e.g. ice cores.

How to cite: Loftfield, J., Nowaczyk, N., Lembke-Jene, L., Frederichs, T., Lachner, J., Lamy, F., Rugel, G., Stübner, K., and Adolphi, F.: Potentials and limitations of using cosmogenic Beryllium isotopes for the synchronization of marine sediment and ice cores, EGU General Assembly 2025, Vienna, Austria, 27 Apr–2 May 2025, EGU25-11588, https://doi.org/10.5194/egusphere-egu25-11588, 2025.

Recent retrogressive thaw slump activity in the Richardson Mountains (northwestern Canada), induced by climate warming, has exposed a stratigraphic record of landscape evolution and permafrost development since the last glaciation. Horizontal profiles of five relict ice wedges and one rejuvenation-stage (ca. modern) ice wedge were collected from the headwalls of four thaw slumps in the Willow Creek area of the Richardson Mountains to study post-glacial changes in winter climate. The ice wedges contain vertically elongated bubbles, indicating a likely snowmelt origin. δ2H and δ18O measurements, sampled every ~1.5 cm across the profiles (n = 325), fall well within the range of local winter precipitation values, thereby confirming winter precipitation as the probable source water. Detrital plant macrofossils from several pristine ice samples were AMS 14C dated (n = 16) and confirm at least 2 generations of relict wedge ice dating to the Younger Dryas (YD) and Late Holocene; this is only the second study from the Western Arctic to document YD wedge ice. YD wedge ice is ~2.2‰ more negative in δ18O compared to Late Holocene wedge ice, which could be explained by one or a combination of plausible factors: (i) winter temperatures were up to ~5°C colder on average (e.g., assuming a δ18Oprecip-T sensitivity of 0.41‰·°C-1); (ii) a greater proportion of snow fell during the coldest winter months; or (iii) the moisture source region varied in response to changing atmospheric circulation, moderated by the collapse of the last ice sheet. However, no significant difference is observed in dexcess between YD and Late Holocene wedge ice, which may suggest the precipitation seasonality and moisture source region were comparable. Conversely, the rejuvenation-stage wedge ice, which likely formed in the last few decades, is 1.7‰ more positive in δ18O than Late Holocene wedge ice, while dexcess is statistically indifferent. The strong increase in δ18O in modern wedge ice relative to Late Holocene wedge ice reflects the impact of recent Arctic warming, especially in winter, a pattern that has been previously observed in other ice wedge records from the Canadian and Siberian Arctic. In summary, this study provided insights on winter climate variability in the northwestern Canadian Arctic, with a focus on the YD, Late Holocene and recent times, and demonstrates the potential to use ice wedges to further our knowledge of cold-season climate dynamics in the circum-Arctic more broadly.

How to cite: Porter, T., Changulani, A., Opel, T., and Meyer, H.: Younger Dryas and Holocene winter conditions in the Richardson Mountains, Canadian Arctic, reconstructed from precipitation isotopes in relict ice wedges, EGU General Assembly 2025, Vienna, Austria, 27 Apr–2 May 2025, EGU25-13380, https://doi.org/10.5194/egusphere-egu25-13380, 2025.

EGU25-13426 | ECS | Orals | CL4.3

Clumped isotope constraints on formation environment of Triassic carbonates in Makhtesh Ramon 

Shlomit Cooper-Frumkin, Hagit Affek, Yael Ebert, and Uri Ryb

Despite prolonged research, the formation environments of dolomite remain debated. Previous studies have associated the apparent decrease in dolomite abundance during the Cenozoic with a global transition in marine carbonate depositional environments leading from warm, saline, shallow platforms in which dolomite formation was possibly mediated by microbial activity, to deeper and cooler environments in which dolomite formation was largely inhibited. Others suggested that large volumes of pre-Cenozoic dolomites reflect dolomitization at elevated burial temperatures of these rocks, whereas most Cenozoic carbonate platforms did not reach sufficient thermal maturity. A third, hybrid model suggests that Mg-rich dolomite precursor minerals precipitated in shallow environments and later underwent deep diagenesis to a more ordered and stoichiometric dolomite. The combination of carbonate oxygen (δ18O) and clumped (TΔ47) isotope analysis can be used to constrain and distinguish among these formation environments.

Here, we combine δ18O and TΔ47 measurements in marine carbonate rocks from the Triassic Ramon Gr. in Makhtesh Ramon, southern Israel, to constrain their formation environments. The studied section records a transition from a carbonate platform, dominated by fossil-rich limestone (top Gvanim and Saharonim Fm.), to a shallow saline evaporitic lagoon (Mohila Fm.) dominated by alterations of laminar dolomite and evaporitic gypsum, with much sparser fossils relative to top Gvanim and Saharonim Fm. Calcite samples in the Gvanim and Saharonim Fm. recorded δ18O and TΔ47 values from -8.41 to -2.17 ‰ VPDB, and from 29 to 98 °C, respectively. Two calcite samples recorded TΔ47 values of 152-231 °C, associated with isotopic solid-state reordering in response to local heating near igneous intrusions. Dolomite samples at the top Saharonim and Mohila Fms. recorded δ18O and TΔ47 values from -4.77 to -1.59 ‰ VPDB and from 36 to 74 °C, respectively. These results indicate that carbonate minerals recrystallized in burial-diagenetic environments in an open system with respect to δ18O. The observation that dolomite, associated by stratigraphic context and texture with deposition at (or near) the surface, has been recrystallized at depth, supports a multi-step dolomite formation process, in which carbonates were first enriched in Mg2+ in the lagoon and later recrystallized in high-temperature, deep-diagenetic environment. 

How to cite: Cooper-Frumkin, S., Affek, H., Ebert, Y., and Ryb, U.: Clumped isotope constraints on formation environment of Triassic carbonates in Makhtesh Ramon, EGU General Assembly 2025, Vienna, Austria, 27 Apr–2 May 2025, EGU25-13426, https://doi.org/10.5194/egusphere-egu25-13426, 2025.

Marine ferromanganese polymetallic crusts and nodules are an important mineral resource widely distributed on the seafloor. They are regarded as strategic reserve resources and have attracted much attention. During the mineralization process, the iron-manganese oxide/hydroxide colloids generated by the oxidation of Fe2+ and Mn2+ in the ambient seawater adsorb metal ions and oxidize the metal ions to a high valence state or form metal complexes to be enriched in iron-manganese minerals. They grow slowly at a rate of several mm/Myr, recording and preserving important information on paleo-ocean and paleoclimate changes. They are ideal objects and response media for studying global ocean evolution and environmental changes and are also helpful in exploring the source-sink process of marine substances. Therefore, based on the precise chronology of polymetallic crusts and nodules from the South China Sea (SCS), this study used in-situ Pb isotope analysis technology to analyze the variation characteristics of Pb isotope composition of polymetallic crusts and nodules, to reveal the growth and mineralization history and environmental evolution of crusts and nodules in the study area. 

The results show that: (1) The growth ages of SCS polymetallic crusts and nodules are about 1.16-3.46 Ma and an average growth rate of 3.19-6.07 mm/Myr using the 10Be/9Be isotope method. (2) The Pb isotope characteristics of SCS polymetallic crusts and nodules are related to their growth area: the Pb source of crusts and nodules growing in the northern SCS is mainly affected by the input of terrigenous materials; the crusts and nodules growing in the central SCS are less affected by terrigenous materials and are gradually affected by the weathering/alteration of seamount substrates and the input of volcanic activities. (3) Through the coupling of the mineralization chronology framework of SCS polymetallic crusts and nodules with the Pb isotope compositions of their profiles, it is found that the rapid formation and large-scale expansion of the northern hemisphere ice sheet around 3.5 Ma caused the deep water of the SCS to become extremely oxidized, thus promoting the mineralization of SCS crusts and nodules. The tectonic activities in the SCS since 2.8 Ma have had a greater impact on the SCS polymetallic crusts and nodules. Events such as the closure of the Lehe Waterway and the successive closure of the Taitung Waterway have led to the strengthening of the closure of the SCS, the lack of ventilation, and the reduction of oxidation of the seawater, which has slowed the growth rate of polymetallic crusts and nodules. In addition, the uplift of Taiwan and the subsidence of the northern SCS have led to an increase in the input of terrigenous materials, which has led to a decrease in the content of metal elements in the mineralization of polymetallic crusts and nodules. Therefore, the mineralization of SCS polymetallic crusts and nodules is subject to joint control of the tectonic evolution of the SCS and changes in the marine environment such as global climate change.

How to cite: Guan, Y., Ren, Y., Feng, A., and Zhou, X.: Metallogenic environment evolution of the polymetallic crusts and nodules from the South China Sea: Insights from in-situ Pb isotopes and elemental geochemistry, EGU General Assembly 2025, Vienna, Austria, 27 Apr–2 May 2025, EGU25-14366, https://doi.org/10.5194/egusphere-egu25-14366, 2025.

EGU25-15151 | ECS | Posters on site | CL4.3

Modern isotope dynamics in lakes of semiarid regions: A framework for interpreting lacustrine paleoclimate archives  

Claudia Voigt, Fernando Gázquez, Miguel Rodríguez-Rodríguez, Hana Jurikova, Lucía Martegani, Jorge Cañada-Pasadas, and Elvira Ruíz-Caballero

The isotope composition of lake sediments, including gypsum, carbonate, and biogenic silicate, provides a powerful means to reconstruct past hydrological and climatic changes. Triple oxygen isotope measurements in such minerals are an emerging tool for quantitative paleoclimate reconstructions in lacustrine environments. However, robust interpretations of these archives require a detailed understanding of the processes driving lake water isotope variability and mineral formation. Long-term changes in climate and hydrological conditions, especially in semiarid and arid regions, often challenge the interpretation of lacustrine records. Here, we synthesize key findings from multiple studies on the processes controlling triple oxygen and hydrogen isotope variability in semiarid lakes. The presented data include results from several Andalusian wetlands and artificial salt pans in Spain. We explore how factors such as groundwater connectivity, transitions between permanent and ephemeral stages, lake water salinity, climate seasonality, and seasonal and interannual variations in mineral formation influence the isotope composition of lake water and discuss their implications for paleoclimate reconstructions. Our findings provide a framework for interpreting lacustrine archives in complex hydrological settings.


Acknowledgements:

This research was supported by the European Commission (Marie Curie postdoctoral fellowship, grant no. 101063961) and the project PID2021-123980OA-I00 (GYPCLIMATE), funded by the Ministerio de Ciencia e Innovación of Spain, the Agencia Estatal de Investigación and the Fondo Europeo de Desarrollo Regional FEDER.

How to cite: Voigt, C., Gázquez, F., Rodríguez-Rodríguez, M., Jurikova, H., Martegani, L., Cañada-Pasadas, J., and Ruíz-Caballero, E.: Modern isotope dynamics in lakes of semiarid regions: A framework for interpreting lacustrine paleoclimate archives , EGU General Assembly 2025, Vienna, Austria, 27 Apr–2 May 2025, EGU25-15151, https://doi.org/10.5194/egusphere-egu25-15151, 2025.

EGU25-15935 | ECS | Posters on site | CL4.3

Exploring Fossil-Bound Nitrogen Isotopes in Modern and Paleozoic Sea Urchins: A New Window into Benthic Ecosystems 

Alexandra Auderset, Aaron L. Bieler, Alfredo Martínez-García, and Jeffrey R. Thompson

Nitrogen isotopic composition (δ¹⁵N) measured on organic matter within biominerals (fossil-bound) is an emerging proxy for reconstructing marine trophic conditions in deep time. While previously applied to foraminifera, diatoms, corals, shark teeth, and fish otoliths, the application of δ¹⁵N to other shallow-water marine taxa has been relatively limited. To evaluate the potential of sea urchins as a new model for paleoenvironmental and paleoecological reconstructions, we herein investigate fossil-bound δ¹⁵N in modern and fossil sea urchin biominerals and, for extant samples, its relationship to tissue δ¹⁵N.

Our findings indicate a δ¹⁵N difference of up to 3 ‰ between plates and spines within an individual sea urchin, with an observed nitrogen isotope gradient from the aboral surface to oral surface in both test plates and spines. In addition, we directly compare the δ¹⁵N signature of the gonads, gut content and body wall tissue with the biomineral-bound δ¹⁵N of the teeth, hemipyramids, rotulae, compasses, perignathic girdle, plates and spines. We suggest that biomineral-bound δ¹⁵N preserves trophic signals while also capturing internal isotopic gradients.

Extending this method, we analysed δ¹⁵N in various echinoid genera from the Carboniferous (Mississippian and Pennsylvanian) across multiple localities spanning the globe as a means of understanding their, previously poorly-defined, role in Paleozoic ecosystems. This study is a first step towards the application of fossil-bound nitrogen isotopes to this diverse group, providing new insights into trophic conditions and ecological structures in Paleozoic marine benthic ecosystems.

How to cite: Auderset, A., Bieler, A. L., Martínez-García, A., and Thompson, J. R.: Exploring Fossil-Bound Nitrogen Isotopes in Modern and Paleozoic Sea Urchins: A New Window into Benthic Ecosystems, EGU General Assembly 2025, Vienna, Austria, 27 Apr–2 May 2025, EGU25-15935, https://doi.org/10.5194/egusphere-egu25-15935, 2025.

EGU25-16107 | ECS | Orals | CL4.3

North Atlantic Freshening and Abrupt Cooling During the Last Glacial Maximum and Deglaciation recorded by Iberian Speleothem 

Laura Endres, Carlos Pérez-Mejias, Ruza Ivanovic, Lauren Gregoire, Anna Hughes, Hai Cheng, and Heather Stoll

The last deglaciation represents a valuable test case for understanding abrupt climate events as it triggers cascading feedback among Earth system components, particularly involving the ice sheets. Constraining the timing, magnitude, and order of these events within the critical North Atlantic realm remains challenging.

Here, we present a new U-Th-dated stalagmite from northwestern Iberia spanning the Last Glacial Maximum (LGM) and the entire last deglaciation (24-12 ka BP). Given its coastal and moisture-replete cave location, stable isotopes (δ18O, δ13C) capture both the influence of the Northern Hemisphere ice sheet’s meltwater inflow on surface ocean chemistry, and regional surface air temperature changes via their effects on local vegetation.  Since both stable isotopes are measured on the exact same samples, this allows a direct and high-resolution study of the temporal relationship between Northern Hemisphere meltwater ocean in-flux and temperature change in the North Atlantic realm, advancing speleothem applications in ocean and cryosphere studies.

We have compared our results to meltwater histories derived from the ice sheet model GLAC-1D, and our findings confirm/reveal gradual meltwater inflow during the LGM and early deglaciation (~20.8-18.2 ka BP), followed by a set of abrupt increases in meltwater starting at 18.04±0.16, 16.22±0.24 and 15.44±0.19 ka BP. In our record, abrupt cooling begins at 17.18±0.16 ka BP, indicating that the peak weakening of deep Atlantic convection lagged the first abrupt meltwater pulse by ~850 years. This suggests a non-linear connection between surface ocean freshening and the consequential disruption to the early deglacial Atlantic meridional overturning circulation. In contrast, a brief cooling phase, synchronous with a response in global archives, aligns with the meltwater pulse at 16.22 ka BP, whereas no cooling is associated with the 15.44 ka BP pulse. The transition into the Bølling-Allerød period, featuring two warm phases, is marked by rapid warming starting at 14.78±0.12 ka BP concurrent with a decline in meltwater anomalies, likely related to the re-strengthening of deep Atlantic convection. Remarkably, our record does not show a freshwater signal coincident with the classically cited onset of MWP 1a (~14.6 ka BP), suggesting that this event happened earlier or that the freshwater anomaly was rapidly advected out of the surface North Atlantic by a strong AMOC.

How to cite: Endres, L., Pérez-Mejias, C., Ivanovic, R., Gregoire, L., Hughes, A., Cheng, H., and Stoll, H.: North Atlantic Freshening and Abrupt Cooling During the Last Glacial Maximum and Deglaciation recorded by Iberian Speleothem, EGU General Assembly 2025, Vienna, Austria, 27 Apr–2 May 2025, EGU25-16107, https://doi.org/10.5194/egusphere-egu25-16107, 2025.

EGU25-16395 | Orals | CL4.3

South Asian summer and winter monsoon evolution during the last deglaciation 

Igor Obreht, Andreas Lückge, Mahyar Mohtadi, Petra Zahajská, Enno Schefuß, Denis Scholz, Lars Wörmer, Florian Adolphi, Martin Grosjean, and Kai-Uwe Hinrichs

The South Asian monsoon (SAM) system significantly influences the hydroclimate of the Indian subcontinent, affecting nearly two billion people. However, much of our paleoclimate knowledge is centered on the summer monsoon (SASM), while the winter monsoon (SAWM) remains poorly understood. This study investigates seasonal monsoon variability during the last deglaciation, focusing on abrupt climate transitions that provide natural experiments for understanding past monsoon dynamics. We analyzed sediment core SO130-289KL from the Northeastern Arabian Sea, a region sensitive to both the SASM and the SAWM. Laminated sediments deposited during the Bølling–Allerød Interstadial (~14,690–12,890 years BP) offer a rare high-resolution archive for reconstructing past climate variability at ~decadal timescales.

To overcome the limitations of traditional analytical techniques, we employed mass spectrometry imaging and hyperspectral imaging, achieving micrometer-scale spatial resolution. SST reconstructions rely on two independent biomarkers: the alkenone-based UK’37 index and the GDGT-based Crenarchaeol-Caldarchaeol Tetraether (CCaT) index. Hyperspectral imaging quantified chloropigments-a as a proxy for primary production, while leaf wax hydrogen (δD C31) and carbon (δ¹³C31) isotopes provide insights into atmospheric moisture and terrestrial vegetation dynamics in lower resolution.

Our results reveal distinct seasonal responses of the SAM system to deglacial climate changes. Alkenone-based SSTs, which are more sensitive to change in SAWM winds, show a progressive weakening of the northeastern boreal winter winds during the Allerød, aligning with a progressive cooling trend in the Southern Hemisphere. This weakening likely reflects a boreal winter (austral summer) northward shift of the Intertropical Convergence Zone (ITCZ) towards the equator driven by decreasing Southern Hemisphere austral summer temperatures. In contrast, CCaT-derived SSTs, linked to SASM wind strength, closely correlate with Northern Hemisphere temperature proxies, demonstrating that SASM variability was primarily controlled by boreal summer conditions.

Seasonal precipitation patterns reconstructed from leaf wax isotopes highlight hydroclimatic changes during the Bølling-Allerød. Lower δD C31 values during the Bølling indicate increased summer precipitation, while the early Allerød more positive δD C31 suggest decrease in precipitation. Following concurrent decreases in δ¹³C31 and δD C31 values during the mid to late Allerød suggest reduced seasonality with enhanced precipitation in both summer and winter.

The reconstructed seasonal evolution of SASM and SAWM has significant implications for other paleoclimate archives, such as speleothem δ¹⁸O values, traditionally interpreted as summer monsoon proxies. Our findings suggest that speleothem δ¹⁸O values reflect a combined signal of summer and winter precipitation. During the Bølling-Allerød, depleted δ¹⁸O values may indicate an increased contribution from isotopically lighter winter precipitation associated with subtropical westerly jets, rather than solely stronger summer monsoon rainfall. The observed decrease in δ¹⁸O values during the late Allerød likely reflects enhanced winter precipitation from isotopically depleted far-distance moisture sources.

Our findings underscore the dual hemispheric influence on the SAM. SASM strength was directly linked to Northern Hemisphere forcing, particularly shifts in Atlantic Meridional Overturning Circulation and associated ITCZ migrations, while SAWM variability was modulated by both Northern and Southern Hemisphere climate changes.

How to cite: Obreht, I., Lückge, A., Mohtadi, M., Zahajská, P., Schefuß, E., Scholz, D., Wörmer, L., Adolphi, F., Grosjean, M., and Hinrichs, K.-U.: South Asian summer and winter monsoon evolution during the last deglaciation, EGU General Assembly 2025, Vienna, Austria, 27 Apr–2 May 2025, EGU25-16395, https://doi.org/10.5194/egusphere-egu25-16395, 2025.

EGU25-18756 | ECS | Orals | CL4.3

Hydroclimatic variability during the onset of the Last Interglacial in Lake Van and Iimplications for the Eastern Mediterranean  

Anaïs Urban, Cecile Blanchet, Dirk Sachse, Birgit Schröder, Sylvia Pinkerneil, Markus Schwab, Rebecca Kearney, Ola Kwiecien, Achim Brauer, and Rik Tjallingii

The Mediterranean region is highly sensitive to climate change and warms faster than the global average. Models forecast a pronounced drying trend, coupled with an increase in the frequency and intensity of extreme rainfall events. Past Interglacials can be used as analogues to better understand and estimate regional hydroclimatic responses to global warming.

The Lake Van (Eastern Anatolia, Turkey) sediment record, ICDP site 5034, serves as a key archive to reconstruct hydrological changes in the Eastern Mediterranean. This terminal lake is the largest soda lake in the world and has experienced significant lake-level changes over Glacial-Interglacial transitions (~105 m above modern lake levels during MIS5e). Sediments covering the transition from MIS6 to MIS5e are finely laminated and, in parts, even annually laminated or varved. Therefore, these sediments enable detailed analyses of hydroclimatic variability during Termination II through XRF, microfacies analysis, stable isotope analysis, and δD on leaf wax biomarkers.

Within MIS5e, first results show a significant increase in the bulk organic δ13C signal over a period of several hundred years during a stage associated with higher lake levels. This shift aligns with a change in alkenone composition and precedes a change in stratification, as suggested by a transition from varved to non-varved lithology. The external and internal drivers of these changes are further investigated by XRF core scanning, element mapping, and comprehensive biomarker analyses to explore this proxy behavior.

Ultimately, the data obtained will be compared to other lacustrine records, such as the ICDP Core 5017 from the Dead Sea, to contribute to a more comprehensive understanding of regional variations in the hydroclimatic response during this warming phase in the Eastern Mediterranean.

How to cite: Urban, A., Blanchet, C., Sachse, D., Schröder, B., Pinkerneil, S., Schwab, M., Kearney, R., Kwiecien, O., Brauer, A., and Tjallingii, R.: Hydroclimatic variability during the onset of the Last Interglacial in Lake Van and Iimplications for the Eastern Mediterranean , EGU General Assembly 2025, Vienna, Austria, 27 Apr–2 May 2025, EGU25-18756, https://doi.org/10.5194/egusphere-egu25-18756, 2025.

EGU25-19988 | Posters on site | CL4.3

Chronological and seasonal constraints for the Holocene S1 tephra in the Eastern Mediterranean 

Markus J. Schwab, Rebecca J. Kearney, Katharina Pflug, Cecile Blanchet, Ina Neugebauer, Valby van Schijndel, Oona Appelt, Rik Tjallingii, and Achim Brauer

The eastern Mediterranean region experienced large hydroclimatic shifts throughout the Holocene (11.6 ka to present). The region is located between the contrasting humid Mediterranean climate and the Saharo-Arabian desert belt. The important palaeoclimatic record of the Dead Sea (Levant) ICDP Dead Sea Deep Drilling Project (DSDDP) core provides detailed reconstructions into the hydroclimatic variability during this time. However, chronological uncertainties have prevented detailed insight into the regional climatic (a)synchronies with other palaeoclimatic records in the region. The use of tephra horizons as time-synchronous markers can provide insight into the spatial and temporal environmental response of this region to past abrupt climatic change. The identification of a widely dispersed volcanic ash from a volcanic eruption is a particularly powerful chronological tool to be used, as seen with the S1 tephra from Mt. Erciyes (Turkey). 

            Here, we present the identification of a microtephra layer, visible only in thin section analysis, within varved sediments of the Dead Sea DSDDP record. Using major, minor and trace element analysis, this tephra has been identified as the S1 tephra. Though the S1 tephra has been found in the Dead Sea Ein Gedi shallow water core before (Neugebauer et al., 2017), this is the first time a ‘visible’ tephra layer has been found in the deep ICDP sediment lake record. Through thin section micro facies and XRF analysis, we can now confirm the season of the S1 eruption from Mt. Erciyes happened during the winter. The discovery of the S1 tephra in the well-dated part of the DSDDP record and at other sites across the Mediterranean, we have used Bayesian age-modelling to refine the age for this key tephrostratigraphic marker. As a result, this will enable further detailed insights into the timing of the African Humid period across the eastern Mediterranean region during the early Holocene.

How to cite: Schwab, M. J., Kearney, R. J., Pflug, K., Blanchet, C., Neugebauer, I., van Schijndel, V., Appelt, O., Tjallingii, R., and Brauer, A.: Chronological and seasonal constraints for the Holocene S1 tephra in the Eastern Mediterranean, EGU General Assembly 2025, Vienna, Austria, 27 Apr–2 May 2025, EGU25-19988, https://doi.org/10.5194/egusphere-egu25-19988, 2025.

Hydroclimatic variations on the Tibetan Plateau since the Last Glacial Maximum (LGM) are still debated. Here, we reconstruct climatic and hydrological variability in the southwestern Tibetan  Plateau since the late LGM using climate proxies based on molecular distributions of n-alkanes, hydrogen and carbon isotopic composition of terrestrial n-alkanes and δ18Ocarbonate at Lake Zabuye. Our findings indicate that the δD-nC31 signal in this lake was primarily influenced by temperature from late the LGM to early deglaciation period, shifting to a predominance of precipitation influence from the Heinrich event 1 (H1) to the Holocene period. In contrast, the carbonate δ18O was found to be primarily governed by evaporative processes. Through comprehensive analysis of all proxies, we suggest that Lake Zabuye was dominated by the mid-latitude Westerlies with cold and moist conditions from late LGM to early deglaciation. The H1 and Younger Dryas (YD) periods were characterized by low temperature and reduced precipitation due to the influence of the moderately intensified Westerlies. The Indian Ocean Summer Monsoon (IOSM) intensified during the Bølling/Allerød (B/A) period, and its strength was comparable to that of the Westerlies, resulting in plentiful rainfall and high evaporation. The IOSM was dominant during the Holocene, characterized by abundant rainfall and high evaporation.     

How to cite: Ling, Y., Tian, L., and Bendle, J.:  Hydroclimatic Evolution of the Southwestern Tibetan Plateau Since the Last Glacial Maximum Inferred from Multi-Proxy Data in Lake Zabuye, EGU General Assembly 2025, Vienna, Austria, 27 Apr–2 May 2025, EGU25-21525, https://doi.org/10.5194/egusphere-egu25-21525, 2025.

EGU25-957 | ECS | Posters on site | CL4.4

Exploring Dynamics of Climate and Atmosphere Employing the Temperature Indices Using Bias-Corrected GCMS and Ensemble Model Approach 

Gupta Abhishek Rajkumar, Manish Kumar Nema, and Deepak Khare

Urban areas significantly influence planetary processes by altering heat, moisture and chemical budgets and it plays a pivotal role in modifying planetary processes through their unique interactions with the environment. The reduction in natural vegetation and permeable surfaces limits evapotranspiration and alters the hydrological balance, often leading to increased surface runoff, reduced groundwater recharge and changes in local humidity levels. The current study evaluates the spatial and temporal variation of temperature extremes for the historical period (1951–2014) and the future scenarios of two Shared Socioeconomic Pathways; SSP245 and SSP 585 for the future periods of 2015-2100, divided into two periods; near future (2015-2050) and far future (2051-2100) for the major tributary of The River Godavari; The Wainganga Basin, India. The temperature data for the basin is sourced from five General Circulation Models (GCMs) and an ensemble model derived from them. The ensemble model incorporates climate forecasts and accounts for anticipated space-weather-related atmospheric perturbations, resulting in a more complete knowledge of fluctuations in temperature in the Wainganga River Basin. The temperature variation due to climate change is evaluated using the extreme climate indices influenced by minimum and maximum temperature, recommended by the Expert Team on Climate Change Detection and Indices (ETCCDI) and Expert Team on Sector-Specific Climate Indices (ET-SCI). These indices provide a standardized framework for assessing the impacts of driving forces of dynamic temperature and atmospheric processes. The findings will showcase the impact of changes in temperature and their effects temporally, and spatially on the sub-basin level also address the change in atmosphere strongly with the type of driver, time, and location. As global urbanization continues, insights from studies like this are crucial for developing and evaluating adaptive strategies. Conclusively, findings can inform policies aimed at climate resilience, drawing parallels with urban climate adaptation efforts. 

How to cite: Rajkumar, G. A., Nema, M. K., and Khare, D.: Exploring Dynamics of Climate and Atmosphere Employing the Temperature Indices Using Bias-Corrected GCMS and Ensemble Model Approach, EGU General Assembly 2025, Vienna, Austria, 27 Apr–2 May 2025, EGU25-957, https://doi.org/10.5194/egusphere-egu25-957, 2025.

Understanding future changes in temperature variability and extremes is an important scientific challenge. Here, the response of daily near-surface temperature distributions to warming is explored using an idealised global climate model.  Simulations of a wide range of climate states are performed with a slab-ocean aquaplanet configuration and with a simple land continent using a bucket-style model for hydrology. In the tropics, the responses of temperature extremes (i.e., high percentiles of daily near-surface temperature) to climate change contrast strongly over land and ocean. Over land, warming is amplified for hot days relative to the average day. But over ocean, warming is suppressed for hot days, implying a narrowing of the temperature distribution. 

Previous studies have developed theories based on convective coupling to interpret changes in temperature extremes over land. Building on this work, here the contrasting temperature distribution responses over land and ocean are investigated using a new theory based on strict convective equilibrium, which assumes moist adiabatic lapse rates. The theory highlights four physical mechanisms with the potential to drive differential warming across the temperature distribution: hot-get-hotter mechanism, drier-get-hotter mechanism, relative humidity change mechanism, and the free tropospheric temperature change mechanism.  Hot days are relatively dry over land due to limited moisture availability, which drives the drier-get-hotter mechanism and  amplified warming of the warm tail of the distribution. This mechanism is the dominant factor explaining the contrasting responses of hot days over land and ocean to climate change. An extended version of the theory, which relaxes the strict convective equilibrium assumption, is introduced and applied to the simulations to understand the influence of convective available potential energy (CAPE) on changes in the temperature distribution. 

How to cite: Duffield, J. and Byrne, M.: Tropical temperature distributions over a range of climates: theory and idealised model simulations, EGU General Assembly 2025, Vienna, Austria, 27 Apr–2 May 2025, EGU25-1397, https://doi.org/10.5194/egusphere-egu25-1397, 2025.

EGU25-1648 | ECS | Orals | CL4.4

Different Roles of Land-atmosphere Coupling in Compound Drought-heatwave Events 

Donghyuck Yoon, Jan-Huey Chen, Hsin Hsu, and Kirsten Findell

Droughts and heatwaves are inherently linked through land-atmosphere (L-A) coupling, where the interactions between surface energy and water availability play critical roles in their evolution. In energy-limited regimes, anomalously high surface air temperature (T) intensifies evapotranspiration (ET), leading to rapid depletion of soil moisture (SM). Conversely, in water-limited regimes, reduced SM suppresses ET, exacerbating surface warming. The transition between these two regimes, characterized by critical soil moisture thresholds, governs the progression of compound drought-heatwave events.

This study analyzed the spatiotemporal variability of L-A coupling mechanisms during six extreme compound drought-heatwave events. In all cases, SM exhibited a consistent negative temporal correlation with T, declining from the onset to the peak of the heatwave and recovering during the decay phase. However, the behavior of ET varied, with SM-ET coupling dominating in some cases and T-ET coupling prevailing in others. These distinctions in coupling regimes demonstrated regional heterogeneity, even within individual events. As regimes shifted from T-ET to SM-ET coupling, evaporative fraction (EF) on heatwave peak days significantly decreased, underscoring that the drivers of drought-heatwave interactions differ spatially. Furthermore, correlation analysis between SM and EF revealed that critical soil moisture thresholds are key determinants of these coupling behaviors. This highlights the role of critical soil moisture in modulating L-A feedbacks and controlling the transition between coupling regimes.

Using the GFDL SHiELD global 13-km model configuration, we evaluated the predictability of two prominent events in 2022 and 2023, which displayed contrasting dominant regimes. SHiELD effectively captured the spatial distribution and temporal evolution of L-A coupling regimes in both cases. Notably, the SM-ET coupling-dominated 2023 event demonstrated superior forecast skill for SM and TMAX compared to the T-ET coupling-dominated 2022 event. This result emphasizes the importance of soil moisture memory in water-limited regions for enhancing predictability in compound drought-heatwave scenarios.

How to cite: Yoon, D., Chen, J.-H., Hsu, H., and Findell, K.: Different Roles of Land-atmosphere Coupling in Compound Drought-heatwave Events, EGU General Assembly 2025, Vienna, Austria, 27 Apr–2 May 2025, EGU25-1648, https://doi.org/10.5194/egusphere-egu25-1648, 2025.

EGU25-1850 | ECS | Orals | CL4.4

Nonlinear interactions amplify the most extreme midlatitude heatwaves  

Yinglin Tian, Jiangong Liu, Yu Huang, Pierre Gentine, and Kai Kornhuber

Recent occurrences of record-breaking heat extremes and their profound societal impacts on health, infrastructure, food systems, and the energy sector underscore the urgent need to improve our physical understanding and modeling capacities for future projections. In mid-latitude regions, persistent high-pressure systems and dry soils have been identified as key contributors to heatwave severity. Moreover, non-linear interactions between these two drivers and temperature have been suggested to play a critical role in some of the most extreme recent heat events, such as the 2021 Pacific-North America heatwave (Bartusek et al., Nat. Clim., 2022). However, the universality and regional significance of such non-linear interactions remain largely unquantified.

Using an explainable machine learning approach, we quantitatively decompose surface air temperature anomalies during heat extremes into three components: direct contributions from (i) geopotential height anomalies, (ii) soil moisture deficits, and (iii) the interaction between the two. Our analysis reveals that non-linear interactions make statistically significant contributions across 19% of the land area in the northern hemisphere mid-latitudes (40°N–60°N). In these regions, the interactive contribution increases with temperature at a rate of 0.1 K/K when temperatures exceed a critical threshold of 4.0 K above the local summer mean. Hotspots of such behavior are especially pronounced in Central Europe, where 40% of the land area exhibits significant non-linear interactions, amplifying the most extreme heatwave events by up to 13%.

Furthermore, we identify a 2.4-fold increase in the regional mean non-linearity of interactions in Central Europe over the past 45 years, accompanied by a 25% expansion in the affected area. This accounts for 18% of the observed widening in the temperature distribution’s upper tail reported in other studies (Kornhuber et al., PNAS, 2024). Additionally, our findings show that CMIP6 climate models underestimate the non-linearity of extratropical interactions by 80%, contributing to biases in projections of extreme heat changes. Our findings underscore the critical role of these non-linear physical processes in amplifying extreme heatwave events, emphasizing the need to account for these processes in climate models to better anticipate and mitigate the impacts of climate extremes in current and future climates.

How to cite: Tian, Y., Liu, J., Huang, Y., Gentine, P., and Kornhuber, K.: Nonlinear interactions amplify the most extreme midlatitude heatwaves , EGU General Assembly 2025, Vienna, Austria, 27 Apr–2 May 2025, EGU25-1850, https://doi.org/10.5194/egusphere-egu25-1850, 2025.

EGU25-2239 | ECS | Orals | CL4.4

A simple complementary framework for evaluating evaporation base on land-atmosphere coupling 

Zhuoyi Tu, Yuting Yang, Michael Roderick, and Tim McVicar

Evaporation (E) is a key process in land-atmosphere water and energy exchanges. Among the evaporation methods, the complementary relationship (CR) approach builds upon the dynamic feedbacks of water and heat fluxes between the land-atmosphere interface, providing a straightforward framework for estimating evaporation using basic meteorological inputs, without relying on complex land surface information. Although CR is a simple and effective method, traditional CR mechanisms/models still face two main challenges. First, the wet boundary condition of CR is inaccurately characterized. When the land surface is not water-limited, evaporation is defined as potential evaporation (Epo). However, Epo estimates using conventional methods often do not align with its fundamental definition, as meteorological variables observed under real conditions differ from those over a hypothetical wet surface. Here, we estimate Epo using the maximum evaporation approach (Epo_max) that does follow the original Epo definition. Our findings show that using Epo_max significantly reduces the asymmetry in the CR. Second, traditional CR mechanisms focus on the feedback between water vapor and temperature in the land-atmosphere system, while overlooking the impact of these changes on radiation. As the surface transitions from dry to wet, enhanced actual evaporation and reduced sensible heat flux lead to cooler and wetter air above the surface, reducing the vapor pressure deficit and further decreasing atmospheric evaporative capacity (or apparent potential evaporation, Epa). Building on this, we found temperature reduction overall increases the radiation term in Epa and partially offsets the traditional view that water vapor weakens the aerodynamic term. Based on the above modifications, we developed a physically-based, calibration-free CR model, which requires few input variables and thus facilitates evaporation estimation. More importantly, the CR method, grounded in land-atmosphere coupling, offers a simpler framework for studying the feedback of evaporation on climate, making it a promising tool compared to complex coupled climate models.

How to cite: Tu, Z., Yang, Y., Roderick, M., and McVicar, T.: A simple complementary framework for evaluating evaporation base on land-atmosphere coupling, EGU General Assembly 2025, Vienna, Austria, 27 Apr–2 May 2025, EGU25-2239, https://doi.org/10.5194/egusphere-egu25-2239, 2025.

Tropical regions have undergone extensive deforestation in recent decades, significantly impacting local, regional, and global water cycles; however, detailed studies on their hydroclimatic effects remain limited. This study employs a regional climate model coupled with a water vapor tracking tool to investigate the effects of deforestation on local and regional precipitation from 2000 to 2020 in three major tropical deforestation hotspots: the Amazon, Africa, and Southeast Asia. Results indicate that deforestation affects precipitation with distinct scale-dependent and seasonal variations. In the Amazon, contrasting precipitation responses to deforestation were observed between wet and dry seasons (Yingzuo Qin et al., Nature, 2025, in press). During the wet season, deforested areas exhibited a notable increase in precipitation (0.96 mm month-1 per percentage point of forest loss), primarily due to enhanced mesoscale atmospheric circulation (i.e., nonlocal effects). These nonlocal effects weakened with distance from deforested areas, resulting in significant precipitation reductions beyond 60 km. Conversely, during the dry season, precipitation decreased in deforested areas and across all analysis buffers, with local effects from reduced evapotranspiration (ET) dominating. In Africa, due to the dispersibility of deforestation across the continent, the scale-dependency and seasonality of precipitation effects caused by deforestation are influenced by elevation and deforestation patch size. In Southeast Asia, under the strong influence of oceanic water vapor, deforestation-induced positive precipitation effects prevail throughout the year. These findings underscore the complex interplay between local and nonlocal effects in driving tropical deforestation-precipitation responses across different seasons and scales, highlighting the urgent need to address the rapid and extensive loss of forests in tropical regions to mitigate their nonnegligible climatic impacts.

How to cite: Qin, Y.: Tracking tropical deforestation impacts on local and regional hydroclimate, EGU General Assembly 2025, Vienna, Austria, 27 Apr–2 May 2025, EGU25-2431, https://doi.org/10.5194/egusphere-egu25-2431, 2025.

EGU25-3078 | Orals | CL4.4

Soil moisture controls on convective initiation across the diverse landscapes and hydro-climates of Africa 

Christopher Taylor, Cornelia Klein, and Emma Barton

A wealth of studies exist analysing the feedback between soil moisture and convective precipitation across a broad range of time and space scales, encompassing theoretical, numerical modelling and observational approaches. A critical step in this feedback is an understanding of how soil moisture, via its control on sensible and latent heat fluxes, influences the initiation of deep convective clouds. Knowledge of where soil moisture conditions favour triggering of new storms is also important for short-term weather forecasting. Whilst many analyses consider how soil moisture affects the vertical profiles of temperature and humidity (1-D perspective), other studies examine the role of spatially-varying soil moisture on convective initiation via surface-induced mesoscale circulations. Here we use a 20-year observational dataset of convective initiations across sub-Saharan Africa to draw more general conclusions about how soil moisture impacts convective initiation and subsequent rainfall across a diversity of hydro-climatic, topographic and wind conditions.

We use cloud-top temperature data from the geostationary Meteosat Second Generation (MSG) series of satellites to identify afternoon convective initiations for the period 2004-2023 and relate these to pre-storm observations of land surface state (land surface temperature from MSG, and surface soil moisture from the Advanced Scatterometer). Both datasets reveal a consistent Africa-wide picture of initiations favoured at the downwind end of elliptical dry soil structures, as found in previous analyses over the Sahel (Taylor et al, Nature Geoscience, 2011). The soil moisture signal weakens with stronger topographic variability, and in wetter climates and times of year, but outside of the Congo Basin and East African Highlands, the signal of initiation over locally dry soils is clear. Moreover, we show that the along-wind length scale of the dry soil feature increases with low-level wind speed. Our results, valid on scales of up to ~200km, fit with understanding of mesoscale circulations driven by soil moisture heterogeneity, and cannot be explained by 1-D consideration of thermodynamic profiles alone. We also show how the overall soil moisture-precipitation feedback from these events is influenced by wind conditions at storm steering level. In regions (including the Sahel) where winds at low and steering levels are in opposing directions, the feedback is strongly negative. Alternatively, when low and mid-level winds are aligned, the negative feedback weakens, and can become positive.

How to cite: Taylor, C., Klein, C., and Barton, E.: Soil moisture controls on convective initiation across the diverse landscapes and hydro-climates of Africa, EGU General Assembly 2025, Vienna, Austria, 27 Apr–2 May 2025, EGU25-3078, https://doi.org/10.5194/egusphere-egu25-3078, 2025.

The vegetation-temperature feedback significantly influences local climate variability. While previous studies have assessed the responses of local temperature to vegetation biomass changes, they often suffer from the mix of long-term global warming trends and localized vegetation-temperature interactions. More importantly, the temporal evolutions of this feedback remain elusive. Here, we use a novel approach to analyze spatiotemporal variations of this local feedback while controlling for global warming trends. Our findings reveal a weakening role of vegetation in cooling the earth over the past four decades, with a nonlinear feedback change modulated by background climatologic conditions. Furthermore, an evaluation of state-of-the-art climate models shows a systematic overestimation of vegetation cooling effects, particularly in densely vegetated regions. This overly optimistic bias contributes to a significant underestimation of global warming, highlighting the need to improve the representation of vegetation-climate interactions in climate models.

How to cite: Liu, Z., Peng, X., and He, X.: Spatiotemporal dynamics in vegetation-temperature feedback and overly optimistic representations in climate models, EGU General Assembly 2025, Vienna, Austria, 27 Apr–2 May 2025, EGU25-3628, https://doi.org/10.5194/egusphere-egu25-3628, 2025.

EGU25-4252 | Orals | CL4.4

Soil moisture–precipitation feedbacks in Central Europe: Fully coupled WRF-Hydro simulations evaluated with cosmic-ray neutron soil moisture measurements 

Joël Arnault, Benjamin Fersch, Martin Schrön, Heye Reemt Bogena, Harrie-Jan Hendricks Franssen, and Harald Kunstmann

The skill of regional climate models partly relies on their ability to represent land–atmosphere feedbacks in a realistic manner, through the coupling with a land surface model. However, these models often suffer from insufficient or erroneous information on soil hydraulic parameters. In this study, the fully coupled land–atmosphere model WRF-Hydro driven with ERA5 reanalysis is employed to reproduce the regional atmospheric conditions over Central Europe with a horizontal resolution of 4 km for the period 2017–2020. Simulated soil moisture is compared with data from cosmic-ray neutron sensors (CRNS) at three terrestrial environmental observatories of the TERENO network. Soil hydraulic parameters from the European digital soil dataset EU-SoilHydroGrids, together with hydraulic conductivity functions from the Campbell and van Genuchten–Mualem models, are used to test the impact of different representations of soil infiltration on modeled land–atmosphere feedbacks. An updated method to disentangle the proportion of convective precipitation being favored over wet, dry and mixed soils is provided, in order to shed more light on the soil moisture–precipitation feedback mechanism. It is found that WRF-Hydro with van Genuchten–Mualem and EU-SoilHydroGrids best reproduces CRNS soil moisture daily variations, in association with enhanced soil moisture in the root zone and a larger proportion of convective precipitation favored over wet soils. This study demonstrates the importance of adequately considering infiltration processes to realistically reproduce land–atmosphere feedbacks.

How to cite: Arnault, J., Fersch, B., Schrön, M., Bogena, H. R., Hendricks Franssen, H.-J., and Kunstmann, H.: Soil moisture–precipitation feedbacks in Central Europe: Fully coupled WRF-Hydro simulations evaluated with cosmic-ray neutron soil moisture measurements, EGU General Assembly 2025, Vienna, Austria, 27 Apr–2 May 2025, EGU25-4252, https://doi.org/10.5194/egusphere-egu25-4252, 2025.

EGU25-4419 | ECS | Posters on site | CL4.4

Identification of climatic extremes by multi-fractal analysis of long climate data series 

Carl Tixier, Pierre-Antoine Versini, and Benjamin Dardé

Shrinking and swelling of clays (SSC), occur as a result of water content fluctuations in expansive clayey soils, governed by seasonal cycles of precipitation and drought. This hazard causes ground movement, which can affect foundations and infrastructures. In France, where 54% of constructions are exposed to this hazard, SSC is the second largest category for natural disaster compensation.

With climate change, modification in the intensity and frequency of droughts, heat waves and precipitation are likely to exacerbate this phenomenon. In this context, further research is needed to anticipate the influence of climatic changes on the evolution of the SSC hazard and its impact on constructions in the next decades.

In particular, it is crucial to understand soil-atmosphere interactions on some appropriate spatial and temporal scales, but also through scales. Climate impact studies use hydrological or agricultural models, fed by global climate data adapted locally by statistical adjustments or downscaling. These methods improve local accuracy but increase bias and uncertainty, as they are often based on stationarity assumptions, which are not always valid in the context of climate change. The modeling of extreme values, essential for risk management, thus becomes more complex.

In response to the difficulties of climate models in representing extreme events at high spatio-temporal resolutions, and in understanding hydro-climatic interactions with clay soil, several geostatistical approaches are proposed.

An in-depth study of the existing literature has enabled us to compare the various downscaling methods. This state of the art is complemented by the study of data (extreme meteorological phenomena, humidity, soil displacements, etc.) acquired by various organizations concerned by the SSC problem (sources: BRGM, INRAE, SNCF, Météo-France, etc.).

This presentation will include the results of geostatistical analyses based on (multi)fractals conducted on this data (spatiotemporal variability, scale breaks, estimation of extreme values, spectral analysis, etc.). The data analyzed will cover the main parameters influencing soil moisture, i.e., precipitation and temperature.

These analyses may reveal the statistical signatures of climatic extremes. By identifying them, it will then be possible to research the different climate scenarios, and thus represent the extremes with precision. This step is essential to understanding SSC phenomena.

The final objective of this research work is to propose a soil-atmosphere interaction model, capable of generating the input data required for a numerical SSC behavior model. This model will take into account the various hydro-climatic parameters mentioned above, focusing mainly on evaporation and infiltration processes, as well as soil heterogeneity.

How to cite: Tixier, C., Versini, P.-A., and Dardé, B.: Identification of climatic extremes by multi-fractal analysis of long climate data series, EGU General Assembly 2025, Vienna, Austria, 27 Apr–2 May 2025, EGU25-4419, https://doi.org/10.5194/egusphere-egu25-4419, 2025.

Tibetan Plateau has been experiencing profound warming and slight wetting over recent decades, which have contradictive effects on soil organic carbon by enhancing plant growth and thereafter carbon input into the soil and increasing the soil organic carbon (SOC) decomposition rate. In this study, we developed a SOC model (WetlandC model) for wetlands, considering also the process of litterfall decomposition and parameterizing the effect of grazing on SOC accumulation. We also established a modelling framework to combine WetlandC model with TEM (Terrestrial Ecosystem Model) model to simulate the changes in SOC of the alpine wetlands on the Tibetan Plateau from 2000 to 2018. Results showed that spatially, the soil organic carbon density (SOCD) of alpine wetlands was higher in the southeast and lower in the northwest, ranging from 1358.22 to 22571.81 g C m-2. The SOCD spatial pattern coincided with the northernmost and southernmost northern boundary of Asian summer monsoon. The SOCD was higher in region with precipitation ranging from 450 to 900 mm, suggesting that the precipitation played an important role in regulating the spatial heterogeneity of SOCD. The temporal trends of SOCD varied from -55.84 to 407.59 g C m-2 yr-1 over the plateau, and 97.98% of the wetland area was accumulating SOC. Temperature, precipitation and actual livestock carrying capacity, as the top influencing factors of the temporal trend of SOCD, accounted for 35.06%, 34.52% and 30.41% of the area in the alpine wetlands, respectively. The 0–30 cm SOC stock of the alpine wetlands on the Tibetan Plateau increased from 518.06 Tg C in 2000 to 607.67 Tg C in 2018. Surface soil in the alpine wetlands acts as a carbon sink of 4.98 Tg C yr-1. Our results indicated that in the context of climate change, additional soil carbon sequestration in the alpine wetlands was facilitated by enhanced plant growth, in spite that grazing consumed the above-ground biomass. Future climate warming and wetting is likely to benefit the SOC accumulation in the alpine wetlands on the Tibetan Plateau if not overgrazed.

How to cite: Zhang, Q.: Effects of climate change and grazing on soil organic carbon stock of alpine wetlands on the Tibetan Plateau, EGU General Assembly 2025, Vienna, Austria, 27 Apr–2 May 2025, EGU25-4887, https://doi.org/10.5194/egusphere-egu25-4887, 2025.

Soil moisture (SM) is a crucial factor in land-atmosphere interactions and climate systems, affecting surface energy, water budgets, and weather extremes. In the Three Rivers Source Region (TRSR) of China, rapid climate change necessitates precise SM monitoring. This study employs a novel UNet-Gan model to integrate and downscale SM data from 17 CMIP6 models, producing a high-resolution (0.1◦) dataset called CMIP6UNet−Gan. This dataset includes SM data for five depth layers (0-10 cm, 10-30 cm, 30-50 cm, 50-80 cm, 80-110 cm), four Shared Socioeconomic Pathways (SSP1-2.6, SSP2-4.5, SSP3-7.0, SSP5-8.5). The UNet-Gan model demonstrates strong performance in data fusion and downscaling, especially in shallow soil layers. Analysis of the CMIP6UNet−Gan dataset reveals an overall increasing trend in SM across all layers, with higher rates under more intense emission scenarios. Spatially, moisture increases vary, with significant trends in the western Yangtze and northeastern Yellow River regions. Deeper soils show a slower response to climate change, and seasonal variations indicate that moisture increases are most pronounced in spring and winter, followed by autumn, with the least increase observed in summer. Future projections suggest higher moisture increase rates in the early and late 21st century compared to the mid-century. By the end of this century (2071-2100), compared to the Historical period (1995-2014), the increase in SM across the five depth layers ranges from: 5.5% to 11.5%, 4.6% to 9.2%, 4.3% to 7.5%, 4.5% to 7.5%, and 163.3% to 6.5%, respectively.

How to cite: Luo, S. and Li, Z.: Trend Analysis of High-Resolution Soil Moisture Data Based on GAN in the Three River Source Region During the 21st Century, EGU General Assembly 2025, Vienna, Austria, 27 Apr–2 May 2025, EGU25-5586, https://doi.org/10.5194/egusphere-egu25-5586, 2025.

The representation of snow in land surface models is critical for accurate seasonal forecasting, yet traditional single-layer snow schemes fail to capture the full insulating properties of deep snowpacks. These limitations result in pronounced seasonal biases, including excessive winter cooling and springtime warming. This study explores the impact of introducing a multi-layer snow scheme within the Global Seasonal Forecast System (GloSea) to address these biases. Using 24 years of retrospective forecasts (1993–2016), we compare the latest version, GloSea6, incorporating the multi-layer scheme, with GloSea5, which relies on a single-layer approach. The multi-layer snow scheme in GloSea6 improves the onset of snowmelt, delaying it by approximately two weeks. This delay moderates spring soil moisture depletion, promoting greater latent heat flux and surface evaporative cooling. The wetter surface reduces the overestimation of water-limited processes and mitigates near-surface warming biases during summer. Additionally, the enhanced representation of snow improves the simulation of precipitation, particularly in snowmelt-driven regions such as the Great Plains, Europe, and South and East Asia, leading to substantial error reductions. These findings highlight the critical role of a multi-layer snow scheme in advancing seasonal forecast accuracy, not only for temperature and precipitation during snowmelt but also for subsequent summer climatic conditions through improved land-atmosphere feedback processes.

How to cite: Seo, E. and Dirmeyer, P.: Unveiling the influence of multi-layer snowpack in seasonal forecast system on model climatological bias, EGU General Assembly 2025, Vienna, Austria, 27 Apr–2 May 2025, EGU25-5714, https://doi.org/10.5194/egusphere-egu25-5714, 2025.

EGU25-5959 | ECS | Orals | CL4.4

Recurring and Co-Occurring Climate Extremes in Eastern Africa. A Normalcy? 

Peter K. Musyimi, Tamás Weidinger, Tímea Kalmár, Lucia Mumo, and Balázs Székely

Recurring and co-occurring extreme climate events exacerbate adverse effects on human livelihoods, regional and local economy, and the environment. Previous studies have extensively researched on the frequency, intensity, and duration of single climate extremes. However, recurring and co occurrence compound extremes remain scantly addressed in the East Africa Region. Here, we examine spatial variations of the precipitation and temperature extremes events from 1991 to 2022 (32 years) in East Africa, where agriculture is the main economic mainstay. We used high-resolution (0.25° x 0.25°) precipitation and temperature ERA5-reanalysis data. Three agriculturally relevant precipitation events: consecutive dry days (CDD), consecutive wet days (CWD), annual total precipitation that is wet-days annual amount (RR ≥ 1 mm)(PRCPTOT),  and three core temperature metrics: summer days with temperature > 25°C (SU25), extremely hot days with maximum temperature > 35°C (SU35) and diurnal temperature range (DTR) are examined. Our results show that the mean annual CDD ranges between 0 and 240 days in DR Congo, Uganda, Kenya, and the Ethiopian Highlands. The CWD annual averages were the longest, and the maximum was observed in some parts of DR Congo, Ethiopian, and Kenya highlands (365 days). However, minimum CWD events were experienced in the whole of Somalia and arid and semi-arid lands (ASALs) of Kenya, Southern Sudan, and Tanzania. The highest PRCPTOT was experienced in high altitudes and rainforest biomes. Mean annual SU25 were low, predominating in mountainous regions with less than 100 days. Most parts of Kenya show the annual DTR between 10 °C to 12 °C, and few areas with values between 8 °C to 10 °C and between 12 °C and 15 °C. Rwanda and Burundi had values between 8 °C and 10 °C while Tanzania experienced values between 8 °C to 10 °C and between 10 °C and 12 °C. These agriculturally relevant climate extremes threaten people’s livelihood, which is highly dependent on rainfed agriculture. Therefore, contextual-specific adaptation strategies are imperative in minimizing socioeconomic loss and damaging adverse effects in the agriculture and water sectors. Early warning systems should be enforced over East Africa to minimize compounded climate risks.

Keywords: Climate Extremes; East Africa region; ERA5; Precipitation; Temperature.

How to cite: Musyimi, P. K., Weidinger, T., Kalmár, T., Mumo, L., and Székely, B.: Recurring and Co-Occurring Climate Extremes in Eastern Africa. A Normalcy?, EGU General Assembly 2025, Vienna, Austria, 27 Apr–2 May 2025, EGU25-5959, https://doi.org/10.5194/egusphere-egu25-5959, 2025.

EGU25-7299 | ECS | Orals | CL4.4

Land climate under warming in radiative-convective equilibrium simulations 

Tara Gallagher and Kaighin McColl

A simple way to model Earth’s climate is to assume radiative-convective equilibrium (RCE), where surface fluxes transport heat and water vapor away from the surface, and radiative cooling balances this energy in the atmosphere. This framework has provided basic insight into the effect of warming on climate over oceans with both fixed and interactive surface temperatures, but it is seldom applied over land. Unlike oceans, land surfaces have a limited water supply and a small heat capacity, and may respond quite differently given these features. Here, we run a suite of cloud-permitting simulations in RCE over land both with interactive soil moisture and fixed at saturation. In contrast to the most relevant previous studies, our simulations span a wide range of climates, obtained by varying the top-of-atmosphere insolation and atmospheric CO2 concentrations. Several notable patterns emerge as surface temperatures rise including non-monotonic trends in precipitation and steady declines in soil moisture, neither of which can be explained with existing theory. The results demonstrate distinctions between land and ocean responses to warming, with implications for land climate sensitivity and hydrological sensitivity.

How to cite: Gallagher, T. and McColl, K.: Land climate under warming in radiative-convective equilibrium simulations, EGU General Assembly 2025, Vienna, Austria, 27 Apr–2 May 2025, EGU25-7299, https://doi.org/10.5194/egusphere-egu25-7299, 2025.

EGU25-7752 | ECS | Orals | CL4.4

Causal Dynamics of Land–Atmosphere Coupling under Compound Dry–Hot Events 

Yikui Zhang, Daniel Hagan, Diego G. Miralles, Klaus Goergen, and Stefan Kollet

The increasing frequency and magnitude of compound dry–hot events (CDHEs) pose significant risks to natural and managed systems. While the role of land–atmosphere coupling in determining the magnitude and evolution of CDHEs has been highlighted, the causal interactions between variables within the coupled system under external forcing remain poorly understood. This study investigates the causal relationships between soil moisture and 2m air temperature, as well as between absorbed shortwave solar radiation and 2m air temperature during CDHEs, based on information flow theory. Using two fully coupled simulations with the Terrestrial Systems Modeling Platform (TSMP), one with and one without irrigation, the information flow analysis provides an interpretable framework to characterize the spatiotemporal variability of the land–atmosphere coupling strength in response to the perturbations such as CDHEs and irrigation. 

The results show that concurrent dry and hot conditions are characterized by temporal shifts in the evaporative regime towards increased soil moisture–temperature information flow driven by the shift in surface energy partitioning, such that decreases in soil moisture lead to increased temperatures. Meanwhile, irrigation can significantly reduce the frequency and magnitude of CDHEs by directly increasing soil moisture variability and indirectly affecting surface energy fluxes, and thus altering land–atmosphere coupling. However, the impact of irrigation in Europe is predominantly local and limited by the volumes applied. These findings highlight the potential of targeted, region-specific irrigation strategies to attenuate dry and hot extremes. In addition, the information flow framework provides a robust and interpretable tool for diagnosing the functional performance of regional climate models under perturbations, offering new insights for analyzing the impacts of human interventions on the climate system and enhancing our understanding of extreme hydroclimatic events in future studies.

How to cite: Zhang, Y., Hagan, D., Miralles, D. G., Goergen, K., and Kollet, S.: Causal Dynamics of Land–Atmosphere Coupling under Compound Dry–Hot Events, EGU General Assembly 2025, Vienna, Austria, 27 Apr–2 May 2025, EGU25-7752, https://doi.org/10.5194/egusphere-egu25-7752, 2025.

EGU25-8597 | ECS | Orals | CL4.4

Dynamic Impacts of Eurasian Spring Snowmelt on Summer Heat Extremes in Northern East Asia 

Yulong Yang, Qinglong You, and Taylor Smith

Eurasian spring snowmelt (ESS) significantly influences climate, yet its effects on climate extremes and their dynamic variations remains poorly understood. This study investigates the dynamic impact of ESS on summer heat extremes in Northern East Asia (NEA) during 1979–2018 and examines the underlying mechanisms driving long-range links between snowmelt and temperature anomalies. We find that ESS has a notable positive impact on NEA summer heat extremes, primarily driven by snow-hydrological effects (soil-moisture). Increased ESS drives positive local soil-moisture anomalies in summer, which cool the near-surface atmosphere, facilitating the eastward propagation of anomalous wave patterns. This process strengthens the anomalous anticyclone over NEA, amplifying summer heat extremes. We also find that the Atlantic Multidecadal Oscillation modulates this impact, with its positive phase significantly enhancing the ESS effect by altering atmospheric circulation, strengthening the coupling between spring snowmelt and summer soil moisture, and intensifying NEA heat extremes. This study underscores the critical role of ESS in driving atmospheric circulation over wide regions, and highlights the coupled impacts of multi-scale and multi-temporal climate variability.

How to cite: Yang, Y., You, Q., and Smith, T.: Dynamic Impacts of Eurasian Spring Snowmelt on Summer Heat Extremes in Northern East Asia, EGU General Assembly 2025, Vienna, Austria, 27 Apr–2 May 2025, EGU25-8597, https://doi.org/10.5194/egusphere-egu25-8597, 2025.

EGU25-8944 | ECS | Posters on site | CL4.4

How shallow and deep groundwater impact environmental parameters correlated with global heatwaves 

Anastasia Vogelbacher, Mehdi H. Afshar, Milad Aminzadeh, Kaveh Madani, Amir AghaKouchak, and Nima Shokri

Heatwaves present serious challenges to ecosystems, human health, and a wide range of socioeconomic activities. As the frequency and intensity of heatwaves increase, understanding the mechanisms driving their dynamics and interactions with land surface processes become more important. While extensive research has investigated the influence of various land and atmospheric parameters on heatwaves, less is known about how groundwater depth influences heatwave dynamics through their effects on soil moisture and surface evaporative fluxes (Vogelbacher et al., 2024, Sadeghi et al., 2012). To address this knowledge gap, we investigated how the groundwater depth affects the key parameters controlling heatwave dynamics on a global scale. Specifically, we developed more than 200,000 localized Artificial Intelligence (AI) models to represent the spatial distribution of heatwave frequency over the past 21 years across the world. For each model, a radius of 1.5 degrees (approximately 149 neighboring pixels) is considered in the computation to identify key parameters contributing to heatwaves in that region. We analyzed surface fluxes, as well as atmospheric, hydrological, and local environmental variables, to understand their correlation to heatwaves. Our findings suggest that geopotential height representing atmospheric drivers, is the key predictor of heatwave events in regions with deep groundwater tables (>100 m). In contrast, in areas with shallow groundwater (<10 m), surface fluxes emerge as important contributor to the onset of heatwaves. These findings highlight the less-discussed impact of groundwater depth on atmospheric processes and the important role of soil in linking groundwater and the atmosphere. Our results have important implications for water and land management, emphasizing the need for integrated approaches to understand and address the increasing risks posed by heatwaves.


References:
Sadeghi, M., Shokri, N., Jones, S.B. (2012). A novel analytical solution to steady-state evaporation from porous media. Water Resour. Res., 48, W09516, https://doi.org/10.1029/2012WR012060

Vogelbacher, A., Aminzadeh, M., Madani,K., Shokri, N. (2024). An analytical framework to investigate groundwater‐ atmosphere interactions influenced by soil properties. Water Resour. Res., 60, e2023WR036643. https://doi.org/10.1029/2023WR036643

How to cite: Vogelbacher, A., Afshar, M. H., Aminzadeh, M., Madani, K., AghaKouchak, A., and Shokri, N.: How shallow and deep groundwater impact environmental parameters correlated with global heatwaves, EGU General Assembly 2025, Vienna, Austria, 27 Apr–2 May 2025, EGU25-8944, https://doi.org/10.5194/egusphere-egu25-8944, 2025.

The global land carbon sink is reduced by climate change, in particular by extreme events such as droughts, heatwaves, and fires1,2. Soil moisture, including its feedback on atmospheric conditions (SA), was identified as one of key drivers of these climate extremes3-6 and contributes to the negative climate effects on the land carbon uptake7,8. However, the extent to which the total climate impact on land carbon uptake can be explained by SA feedback remains unknown. Here, we develop an analytical framework utilizing multiple factorial model experiments to show that SA feedback contributes more than half (–61.6 ± 10.4%) of the total climate effect on land carbon uptake at a global scale during 1981–2014, with the largest contributions from hot and dry regions. The strengthened SA feedback has shifted the climate impact on land carbon uptake from near-neutral during 1981–1997 to largely negative during 1998–2014, primarily by weakening photosynthesis. By the end of the twenty-first century, projected reductions in land carbon uptake caused by the SA feedback could even double under a high emission scenario relative to the historical period, driven by increased soil moisture variability. Our findings highlight that SA feedback will potentially dominate the response of long-term land carbon uptake to climate change.

How to cite: Zeng, Z.: Soil moisture-atmosphere feedback controls more than half of total climate effects on land carbon uptake, EGU General Assembly 2025, Vienna, Austria, 27 Apr–2 May 2025, EGU25-10175, https://doi.org/10.5194/egusphere-egu25-10175, 2025.

EGU25-12031 | ECS | Orals | CL4.4

Buffering of climate extremes within riparian forest corridors: a theoretical study with practical applications 

Myrtille Grulois, Sylvain Dupont, Caroline Bidot, Rémi Lemaire-Patin, and Jérôme Ogée

Riparian forests in tropical and temperate regions often act as climatic microrefugia for many species and taxa, buffering climate extremes relative to their surroundings. For example, during a summer heatwave, maximum air temperatures can vary by several degrees between the edge and the core of the riparian forest understory. This buffering of climate extremes within riparian corridors is well documented, but the processes behind it are not well understood because they involve complex turbulent air flows throughout the convective atmospheric boundary layer interacting with the forest canopy and landscape microtopography. To better understand how forest cover and microtopography influence the microclimate within and above riparian corridors, we performed in silico experiments using a 3-dimensional Large Eddy Simulation (LES) vegetation-atmosphere model to simulate air flows and microclimate below and above the trees, and across the entire convective boundary layer. Simulations were performed for different atmospheric stability conditions, and for different corridor widths. The tree species composition in the riparian corridor and its microtopography (slope, aspect) were chosen to be representative of an old-growth temperate riparian forest known to act as a climate refugium for European beech in south-west France. In this context, we first investigated the effect of microtopography alone on the air flows below and above the forest canopy during a typical summer heatwave. We also investigated the impact of replacing maritime pine plantations on the plateau with a strip of deciduous trees extending beyond the riparian corridor, with the aim to evaluate the minimum strip size required to mitigate climate extremes in the riparian understory.

How to cite: Grulois, M., Dupont, S., Bidot, C., Lemaire-Patin, R., and Ogée, J.: Buffering of climate extremes within riparian forest corridors: a theoretical study with practical applications, EGU General Assembly 2025, Vienna, Austria, 27 Apr–2 May 2025, EGU25-12031, https://doi.org/10.5194/egusphere-egu25-12031, 2025.

EGU25-12438 | Orals | CL4.4

Identifying regional drivers shaping daily maximum temperatures and their extremes   

Sarosh Alam Ghausi and Axel Kleidon

Daily maximum air temperatures (Tmax) are shaped by radiation, advection, atmospheric circulation, and land-surface processes, all interacting through complex feedbacks but essentially reflecting changes in the local surface energy budget. Here, we use a land-atmosphere systems approach to derive an analytical expression for daily maximum temperatures that depends solely on observed radiative and surface-evaporative conditions, requiring no additional parameters. We do this by accounting for the surface energy balance, heat storage variations within the lower atmosphere and explicitly constrain vertical turbulent exchange using the thermodynamic limit of maximum power. This approach reproduces observations very well with residual errors comparable to the reanalysis data. We then applied it to understand variations in Tmax and found that its day-to-day variability is predominantly shaped by shortwave cloud radiative effects and longwave water-vapor emissivity in the humid tropics, while heat advection and storage effects are the primary contributors in drier subtropics and high latitudes. Hot extremes, however, are mostly shaped by anomalies in land-surface characteristics including soil water stress and turbulent fluxes, with secondary contributions from heat advection and radiative effects. Both variability and extremes in the tropics were linked to changes in moisture, while the heat-storage and advective effects dominate in dry subtropics and high-latitude regions. These findings reveal the regional radiative and hydrological drivers of temperature variations within the thermodynamic energy budget and provide a baseline for understanding biases and inter-model variability in climate models. It can further help in assessing first-order changes in daily maximum temperatures due to various aspects of global change.

How to cite: Ghausi, S. A. and Kleidon, A.: Identifying regional drivers shaping daily maximum temperatures and their extremes  , EGU General Assembly 2025, Vienna, Austria, 27 Apr–2 May 2025, EGU25-12438, https://doi.org/10.5194/egusphere-egu25-12438, 2025.

EGU25-12862 | Orals | CL4.4

Tailoring Land Use, Land-Use Change, and Forestry (LULUCF) Impacts for Stakeholder-Centric Climate Policy 

Julia Pongratz, Suqi Guo, Felix Havermann, Michael Windisch, Steven De Hertog, Amali Amali, Fei Luo, Iris Manola, Quentin Lejeune, and Carl-Friedrich Schleussner

The land sector plays an important role in addressing global climate change: Land use, land-use change, and forestry (LULUCF) is currently responsible for about 10-15% of annual anthropogenic CO2 emissions, including the only notable origins of negative emissions to date; both emissions and removals aspects make LULUCF a key focus of future climate mitigation policies. However, LULUCF also acts via changing albedo, roughness and other surface properties and thus impacts the surface energy balance and water fluxes (the biogeophysical (BGP) effects). Through the BGP effects, LULUCF has a direct impact on local climate and may counteract global warming through local cooling and mitigate extreme weather events like heatwaves and droughts. LULUCF thus also plays a role in helping communities adapt to its effects.

However, decision-makers often focus only on direct emissions and carbon storage from LULUCF. These are called local biogeochemical (BGC) effects. To make sound climate policies, it is important to consider other processes of LULUCF as well: (i) Local BGP effects, which are BGP effects acting at the site the LULUCF happens; (ii) nonlocal BGP effects, which are remote climate changes caused by advection and large-scale changes in atmospheric circulation; (iii) nonlocal BGC effects, which are remote changes in carbon storage driven by the climate changes from nonlocal BGP effects.

The complexity of these LULUCF effects, with their different spatial scales and mechanisms, often prevents stakeholders from fully incorporating them into decision-making. In this study, we create a system that helps tailor the assessment of LULUCF effects to the specific concerns of different stakeholders. This system makes it possible to distinguish the combinations of LULUCF effects that should be considered in decision-making of different purposes: For example, the interest of a farmer will focus more on the local changes in climate (predominantly influenced by BGP effects) and additionally, if farmers get credits for emission reductions or CO2 removals, on local BGC effects. International negotiations under the UNFCCC, by contrast, focus predominantly on the combined local and nonlocal BGC effects.

In our study, we carefully identify different combinations of LULUCF effects exemplarily for 5 key stakeholders’ perspectives. We analyze model results from three advanced Earth system models to give an idea of how important the negligence or incorporation of one or the other LULUCF effect is. We do so for stylized large-scale scenarios of three common forms of LULUCF: global cropland expansion, global cropland expansion with irrigation, and global afforestation. We show that the answer to whether or not a LULUCF change brings desirable effects to climate and may help mitigation and/or adaptation is very much dependent on the perspective, with our system providing a tool to translate between the different perspectives.

This study gives a detailed look at how LULUCF affects both climate and the carbon cycle, providing a foundation for incorporating these impacts into policy at different levels. It helps guide climate action that balances land use with the Sustainable Development Goals, especially considering the growing interest in nature-based solutions for future climate strategies.

How to cite: Pongratz, J., Guo, S., Havermann, F., Windisch, M., De Hertog, S., Amali, A., Luo, F., Manola, I., Lejeune, Q., and Schleussner, C.-F.: Tailoring Land Use, Land-Use Change, and Forestry (LULUCF) Impacts for Stakeholder-Centric Climate Policy, EGU General Assembly 2025, Vienna, Austria, 27 Apr–2 May 2025, EGU25-12862, https://doi.org/10.5194/egusphere-egu25-12862, 2025.

EGU25-13001 | ECS | Orals | CL4.4

The delayed onset of South American monsoon under global warming in convection-permitting regional climate simulations. 

Jerry B Samuel, Marcia T Zilli, Neil C G Hart, and Fran Morris

Under a warmer scenario, several monsoon regimes are projected to have a delayed onset
of the rainy season. We employ state-of-the-art convection permitting regional climate
model (CPRCM) simulations performed at the UK Met Office to explore potential drivers of
this projected delay over South America. The simulations correspond to a present-day
climate (CPRM-PD) and an RCP8.5 scenario (CPRCM-2100). CPRCM-PD is downscaled
from an atmospheric general circulation model (AGCM) simulation forced with sea surface
temperatures (SSTs) for the period 1998-2007. CPRCM-2100 is driven by an AGCM
simulation forced with SSTs and greenhouse gas concentrations corresponding to an
RCP8.5 scenario. In CPRCM-2100, the onset of the rainy season is delayed, with several
regions exhibiting a delay of up to one month. The rainfall during September and October
shows approximately 50% decline over Central East Brazil, accompanied by coherent
changes in atmospheric thermodynamics. A larger relative increase in near-surface moist
static energy (MSE) is required of atmospheric destabilization in the RCP8.5 scenario, which
however, crosses the necessary threshold for significant rainfall to begin only in late
October/early November. The increase in MSE is primarily due to low-level moisture
enhancement during the onset phase which is also found to be delayed in the RCP8.5
scenario. Precipitation-moisture relationship over the region during the onset phase
indicates a 20% increase (relative to present-day) in near-surface specific humidity
requirement for a daily rainfall rate of 5 mm/day in the RCP8.5 scenario. However, there is a
substantial reduction in evapotranspiration during September and October, in addition to
the absence of any significant changes in moisture flux convergence. This hampers the
moisture build-up and delays the transition to the rainy season in these months. The decline
in evapotranspiration is despite larger soil moisture content in the soil column which
suggests reduced plant transpiration. An increase in stomatal closure in the future
environmental conditions leads to this decline in the RCP8.5 simulation. These changes are
also accompanied by changes in both surface and top of the atmosphere energy fluxes. The
results call for the urgency to develop land use policies to mitigate climate change effects,
given the increasing intensity of droughts in Brazil during recent times. The findings also
highlight the role of local processes in modulating climate projections and the necessity to
improve their representation in climate models.

How to cite: Samuel, J. B., Zilli, M. T., Hart, N. C. G., and Morris, F.: The delayed onset of South American monsoon under global warming in convection-permitting regional climate simulations., EGU General Assembly 2025, Vienna, Austria, 27 Apr–2 May 2025, EGU25-13001, https://doi.org/10.5194/egusphere-egu25-13001, 2025.

EGU25-13687 | Orals | CL4.4

What is the compound effect of re/af-forestation and extreme heat on summer land-atmosphere coupling across Europe?    

Rita M. Cardoso, Luana C. Santos, Elena García Bustamante, Daniela C.A. Lima Lima, Pedro MM Soares, Carlos da Camara Camara, Diana Rechid, and Ana Russo and the Lucas Team

Through soil moisture and vegetation exchanges, land-atmosphere coupling contributes significantly to the evolution of extreme events. Land use/land cover changes (LUC) modify local land surface properties that control the land-atmosphere mass, energy, and momentum exchanges. The Flagship Pilot Study LUCAS (Land Use & Climate Across Scales) provides a coordinated effort to study LUC using an ensemble of 11 regional climate models (RCMs). In the first phase of the project, three reanalyses-driven experiments were performed for continental Europe: eval (with each RCM using its standard land use / land cover distribution), forest (maximised forest cover), and grass (trees replaced by grassland. An analysis of the impact on the coupling between temperature and evapotranspiration is performed using the usual correlation metric, while a new coupling metric based on the product of normalised variables was developed to analyse the coupling between extreme heat (TX90p) or heat wave (TX90p for at least five consecutive days) and evapotranspiration (LH) or soil moisture (TX90p*LH or TX90p*SMOIS). Whenever its values are lower than -1, then LH (SMOIS) is concurrently in deficit, and soil is uncoupled from the atmosphere. Conversely, when its values are greater than 1, then land-atmosphere coupling occurs.

For all RCMs, a positive correlation between near-surface maximum temperature and latent heat prevails over northern Europe, while the negative correlation dominates over southern and southeastern Europe. Forestation (forest-grass) will lead to higher correlations between latent heat and near-surface maximum temperature due to the different transition zone belt locations and weaker correlations in the grass experiment.

Extreme heat and evapotranspiration are positively coupled in forests across the whole continent except in the Mediterranean.  In the grass experiment, the Mediterranean areas are negatively coupled in most models, whilst northern Europe is positively coupled. This coupling (positive/negative) is amplified under heat wave events. Overall, forestation induces increased coupling in central Europe.  In the forest experiment, extreme temperature and soil moisture are negatively coupled across Europe, indicating that the increase in evapotranspiration is associated with the ability of the trees to source water from deeper soil layers.  In the grass experiment, the ensemble mean shows very weak un/coupling in central/ southern Europe, indicating the inability of grasses to source water in deeper soil layers and a broadening of the transition zone.


Acknowledgements

The authors wish to acknowledge the financial support  from the Portuguese Fundação para a Ciência e Tecnologia, (FCT, I.P./MCTES) through national funds (PIDDAC): UID/50019/2025 and LA/P/0068/2020 (https://doi.org/10.54499/LA/P/0068/2020), DHEFEUS (https://doi.org/10.54499/2022.09185.PTDC), and through project references https://doi.org/10.54499/UIDB/00239/2020, https://doi.org/10.54499/UIDP/00239/2020 ,  LS, RMC, AR, and DCAL are supported by FCT, financed by national funds from the MCTES through grant UI/BD/154675/2023, and https://doi.org/10.54499/2021.01280.CEECIND/CP1650/CT0006, https://doi.org/10.54499/2022.01167.CEECIND/CP1722/CT0006, and https://doi.org/10.54499/2022.03183.CEECIND/CP1715/CT0004, respectively

How to cite: Cardoso, R. M., Santos, L. C., García Bustamante, E., Lima, D. C. A. L., Soares, P. M., Camara, C. D. C., Rechid, D., and Russo, A. and the Lucas Team: What is the compound effect of re/af-forestation and extreme heat on summer land-atmosphere coupling across Europe?   , EGU General Assembly 2025, Vienna, Austria, 27 Apr–2 May 2025, EGU25-13687, https://doi.org/10.5194/egusphere-egu25-13687, 2025.

EGU25-13907 | ECS | Posters on site | CL4.4

How do land-use changes shape the occurrence of extreme temperatures across Europe?    

Luana Santos, Rita Cardoso, Elena García Bustamante, Daniela C.A. Lima, Pedro MM Soares, Carlos da Camara, Diana Rechid, and Ana Russo and the Lucas Team

In recent years, an increase in the frequency of occurrence of heatwaves and in the number of hot days in Europe is undeniable. Hence, there is an increased need to understand the feedback mechanisms relevant to their development. Due to their localised impact and although they modify local land surface properties that control the land-atmosphere mass, energy, and momentum exchanges, the influence of land use/land cover changes (LUC) at regional scales still needs to be better represented in coordinated downscaling experiments. The Flagship Pilot Study LUCAS (Land Use & Climate Across Scales) provides a coordinated effort to study LUC using an ensemble of 11 regional climate models (RCMs). In the first phase of the project, three experiments were performed for continental Europe: eval (current climate), grass (trees replaced by grassland), and forest (grasses and shrubs replaced by trees). Heat events can be defined using percentiles, and heat waves are periods of consecutive hot days where temperatures exceed a certain percentile. Here, we use P85, P90 and P95 for maximum temperature thresholds and consider durations of 5, 7, and 10 days.  To facilitate the comparison of the intensity of these extreme events and their evolution over time, we normalise the daily maximum temperature, latent heat and soil moisture using a seasonal interquartile range. An analysis of frequency, magnitude, duration and extension is performed for the three percentiles and for the different land covers.

The results suggest that model responses to afforestation and deforestation exhibit some variability, particularly during summer months. While a substantial proportion of the models indicate a potential enhancement in the intensity and magnitude of heat extremes under forest scenarios, others demonstrate more muted or contrasting effects. The objective of the present analysis is to understand these discrepancies among models and their implications for land-atmosphere interactions under various land use scenarios. The findings will be discussed in terms of their relevance to climate extremes, providing insights into the role of LUC in modulating heat events across Europe.

How to cite: Santos, L., Cardoso, R., García Bustamante, E., Lima, D. C. A., Soares, P. M., Camara, C. D., Rechid, D., and Russo, A. and the Lucas Team: How do land-use changes shape the occurrence of extreme temperatures across Europe?   , EGU General Assembly 2025, Vienna, Austria, 27 Apr–2 May 2025, EGU25-13907, https://doi.org/10.5194/egusphere-egu25-13907, 2025.

EGU25-14418 | Posters on site | CL4.4

Estimating the impact of irrigation and groundwater pumping on regional hydroclimate using an Earth System Model 

Yusuke Satoh, Yadu Pokhrel, Hyungjun Kim, Tomohiro Hajima, and Tokuta Yokohata

Irrigation is a significant anthropogenic forcing to the Earth system, altering water and heat budgets at the land surface and inducing changes in regional hydro-climate conditions across various spatiotemporal scales. These impacts of irrigation are expected to intensify in the future due to growing food demand and the pervasive effects of climate change. Therefore, it is imperative to better understand its nature, extent, and mechanisms through which irrigation affects the Earth system. However, despite its increasing importance, irrigation remains an emerging component in Earth system modeling community, necessitating further advancements in modeling approaches and a deeper understanding.

Our research aims to improve the quantitative understanding of how irrigation and groundwater use, as anthropogenic drivers, affect regional climate and environmental changes. To achieve this, we developed an enhanced Earth system modeling framework based on MIROC-ES2L (Hajima et al., 2020, GMD), integrated with hydrological human-activity modules (Yokohata et al., 2020, GMD). This framework enables simulations of coupled natural-human interactions, including hydrological dynamics associated with irrigation processes. Using this Earth system model, we carried out numerical experiments at T85 spatial resolution with an AMIP-style setup. Our large ensemble simulations allow statistical quantification of irrigation impacts, statistically distinguishing them from uncertainties arising due to natural variability.

Our investigation identified specific regions and seasons where irrigation exerts notable influences on regional hydro-climate. In particular, our results reveal substantial disparities—comparable to or exceeding inter-annual variability—between simulations with and without irrigation processes, especially in heavily irrigated regions such as Pakistan and India. Our model demonstrates that artificially wet soils due to irrigation alter the land surface hydrological balance, which consequently impacts the overlying atmosphere. However, significant uncertainties remain in the impact estimates for several variables in some regions, even those heavily irrigated, including the central United States and eastern China. This highlights the necessity of employing appropriate statistical approaches to evaluate irrigation impacts, accounting for inherent natural variability.

Additionally, our study estimates regional variations in the contributions of groundwater and surface water use to irrigation impacts. Our estimate indicates that approximately two-fifths of global irrigation water depend on groundwater resource, while this groundwater dependency ratio may still be underestimated. By emphasizing the importance of understanding regional and seasonal characteristics, our study underscores the importance of comprehending the complex interactions between irrigation-related human activities and the Earth's climate system. Nevertheless, we may still underestimate the full impacts of irrigation because irrigation water demand estimated by our coupled simulations is lower than that derived from preceding offline simulations or reported statistics. In this presentation, we will discuss this challenge as well.

How to cite: Satoh, Y., Pokhrel, Y., Kim, H., Hajima, T., and Yokohata, T.: Estimating the impact of irrigation and groundwater pumping on regional hydroclimate using an Earth System Model, EGU General Assembly 2025, Vienna, Austria, 27 Apr–2 May 2025, EGU25-14418, https://doi.org/10.5194/egusphere-egu25-14418, 2025.

Human activities have a significant impact on the climate by altering vegetation types and modifying surface properties, resulting in more frequent and intense extreme weather events, which pose a threat to the sustainable development of the environment. However, the specific effects of vegetation change on extreme temperature events are not fully understood. To address this gap, we conducted evaluations with both in-situ observations and the regional climate model to determine the contributions of different vegetation transitions to extreme temperature changes over China. Our findings indicate that vegetation plays an important role in local heatwaves. Cropland have a stronger heating effect than grassland and forests in lifting the daily maximum temperature but present shorter hot day durations. Uncertainties are high in grassland than those of forest due to more diverse background climatic conditions of grassland sites. Numerical simulations revealed a decrease in extreme temperatures such as a 0.85℃ decrease in the daily maximum temperature and 2.65 fewer hot days, which can be attributed to changes of cloud radiation and sensible heat flux resulting from large-scale deforestation in the southern region and cropland expansion in central China. Converting forests to woody savannas led to a significant reduction in leaf area index and latent heat flux in the southern and northeastern regions. Changes in surface property have a stronger relationship with the average temperature changes than with extreme temperature changes. Overall, our study quantitatively evaluates the impact of different vegetation types and their property changes on regional extreme temperature changes, which have important implications for ecological protection and policy-making in China.

How to cite: Dong, N. and Liu, Z.: Comparing responses of summer extreme temperature to vegetation changes in China between satellite observations and numerical simulations, EGU General Assembly 2025, Vienna, Austria, 27 Apr–2 May 2025, EGU25-14702, https://doi.org/10.5194/egusphere-egu25-14702, 2025.

EGU25-15325 | ECS | Posters on site | CL4.4

Role of Pre-Monsoon Showers in the Evolution of Indian Heatwaves 

Manali Saha, Vishal Dixit, and Karthikeyan Lanka

Heatwaves constitute one of the most lethal weather phenomena, presenting substantial risks to millions of individuals. Characterized by extended periods of extreme temperatures, these events significantly impact ecosystems, economies, and human mortality rates. When coupled with high humidity, these events pose high heat stress over the heatwave domain. India, being one of the significant hotspots, experiences heatwaves during the pre-monsoon season. These heatwaves are associated with both moist and dry mechanisms. Moist heatwaves have high wet bulb temperatures and cause high fatalities among humans and mammals. With high population loading and the context of climate change, the origin or source of these moist heat waves has not been examined thoroughly till now. 

In the study, we investigate the precursors of the moist and dry heat waves in the Indo-Gangetic Plains using the Eulerian temperature decomposition equation to find out the dominant processes responsible for the formation of these events. The past literature says that advection is the major component in triggering these events, but our analysis proves that the effect of advection is minimal and supports the weak temperature gradient (WTG) theory in the tropics. To study the precursors, we extend our analysis from the pre-heatwave time to the onset of the heatwaves. Our analysis shows that pre-monsoon showers are responsible for forming moist heat waves. These showers are associated with nighttime low-level clouds that trap the outgoing long-wave radiation, further accumulating the heat content and causing the temperatures to rise. Further, these rainfall activities must be supported by the mid-tropospheric dryness (MTD) for it to be sustained throughout the period. The MTD helps the low-level clouds resulting from shallow convection remain as they are and does not promote deep convection. We emphasize the importance of local atmospheric conditions along with large-scale activities (that trigger anticyclones in the upper troposphere) in sustaining the heatwave intensity. The findings of this study will help in developing heatwave early warning systems at localized scales.

Keywords: Moist heatwaves, Pre-Monsoon showers, Mid Tropospheric Dryness, Weak Temperature Gradient, Advection

How to cite: Saha, M., Dixit, V., and Lanka, K.: Role of Pre-Monsoon Showers in the Evolution of Indian Heatwaves, EGU General Assembly 2025, Vienna, Austria, 27 Apr–2 May 2025, EGU25-15325, https://doi.org/10.5194/egusphere-egu25-15325, 2025.

EGU25-15489 | ECS | Orals | CL4.4

Revisiting the link between soil moisture deficits and heatwaves 

Dominik L. Schumacher, Emanuele Bevacqua, Mathias Hauser, and Sonia I. Seneviratne

Severe heatwaves tend to strike during drought conditions, primarily considered a consequence of persistent, often quasi-stationary anticyclonic circulation. A key mechanism for heatwave intensification is the positive feedback between rapidly desiccating soils through elevated atmospheric evaporative demand and the associated enhanced surface sensible heating. The effect of such enhanced sensible heating is often quantified by comparing the evolution of heatwaves in climate model simulations with freely evolving soil water to additional simulations in which soil moisture is kept at climatological levels, and can reach up to several degrees Celsius. With this approach, one can gauge the effect of deviations from present-day average soil moisture, but this becomes increasingly hypothetical as we shift away from climatological norms and toward a future marked by widespread projected increases in agro-ecological drought during summer months. In such a climate change context, a general key question to address is: How does heatwave intensity depend on the initial state of soil moisture? To investigate this, we re-simulate historical heatwaves using CESM2, a state-of-the-art global Earth System Model, and examine how these events would have unfolded under different land surface conditions. We also explore the long-noted — yet never fully quantified — effect of soil drought on anticyclonic circulation itself.

How to cite: Schumacher, D. L., Bevacqua, E., Hauser, M., and Seneviratne, S. I.: Revisiting the link between soil moisture deficits and heatwaves, EGU General Assembly 2025, Vienna, Austria, 27 Apr–2 May 2025, EGU25-15489, https://doi.org/10.5194/egusphere-egu25-15489, 2025.

EGU25-16332 | Orals | CL4.4

How much does afforestation’s impact on local land surface temperature vary in space, in time, and during dry and hot extreme events?  

Gregory Duveiller, Daniel E. Pabon-Moreno, Luca Caporaso, Daniel Loos, Di Xie, Melanie Weynants, Alexander J. Winkler, and Alessandro Cescatti

Changing the properties of the land surface may be one of the most direct ways to modulate local (and possibly non-local) land-atmosphere interactions, which in turn is of great interest for designing proper land-based climate mitigation and adaptation strategies. When we change the type of vegetation across a landscape, the biophysical properties of that land surface will change, potentially altering both radiative and non-radiative fluxes. Land surface temperature (LST), as measured from remote sensing satellites, provides a useful diagnostic, integrating the effects of these changes in fluxes. When combined with space-for-time substitution approaches, it is possible to derive data-driven estimations of what a given land cover transition could lead to in terms of LST before the actual land cover change occurs. However, the interannual variability of such biophysical effects of land use and land cover change is still understudied, which is an important prerequisite to understand the role these effects may have in alleviating or aggravating the occurrence and impacts of extreme events. 

In this study we present a global analysis of potential afforestation on local afternoon clear-sky LST across the MODIS Aqua record (from 2002 until 2024). This allows us to explore the interannual variability of local increases in forest cover on local LST, which in turns helps us estimate the sensitivity of the effects of afforestation in a changing climate. By combining these results with a dedicated dataset identifying hot and dry extremes from ERA5, we further explore how the effect of afforestation on LST changes under extreme conditions, which the trees would be increasingly more susceptible to encounter once they reach maturity.

Additionally, we take the opportunity to present the processing pipeline that has been developed within the Open-Earth-Monitor cyberinfrastructure (OEMC) project to make such analysis possible and reproducible. This includes improvements to better handle local topographic effects and testing the capacity to run the entire pipeline within a Discrete Global Grid System (DGGS) framework that preserves area and neighbourhood properties within the space-for-time moving window. We expect that these tools will facilitate data integration and model evaluation, thereby assisting research in land-atmosphere interactions and climate extremes.

How to cite: Duveiller, G., Pabon-Moreno, D. E., Caporaso, L., Loos, D., Xie, D., Weynants, M., Winkler, A. J., and Cescatti, A.: How much does afforestation’s impact on local land surface temperature vary in space, in time, and during dry and hot extreme events? , EGU General Assembly 2025, Vienna, Austria, 27 Apr–2 May 2025, EGU25-16332, https://doi.org/10.5194/egusphere-egu25-16332, 2025.

EGU25-16372 | Orals | CL4.4

On the definition of extreme evaporation events 

Yannis Markonis

Even though evaporation is a crucial component of the energy and water cycles, its extremes remain largely unexplored. To address this gap, this study introduces a statistical framework defining Extreme Evaporation Events (ExEvEs) as individual events with onset and termination. Despite their statistical definition, ExEvEs are shown to have a physical basis, as they relate to radiation and/or precipitation—the main energy and water sources for land evaporation. By applying this methodological approach over Czechia, we can see that ExEvEs tend to form clusters of heightened evaporation lasting several days which fluctuate differently than the average evaporation resulting to significant implications for water availability and regional water cycle's acceleration. The proposed event-based framework provides a systematic way to detect, characterize, and analyse evaporation extremes, which helps to improve our understanding of their drivers and impacts.

How to cite: Markonis, Y.: On the definition of extreme evaporation events, EGU General Assembly 2025, Vienna, Austria, 27 Apr–2 May 2025, EGU25-16372, https://doi.org/10.5194/egusphere-egu25-16372, 2025.

EGU25-16413 | Posters on site | CL4.4

A Holistic Multi-Index Approach to Quantify Land Feedback Strength Across Evapotranspiration Regimes 

Sandipan Paul and Karthikeyan Lanka

Soil moisture (SM) is a critical Earth system variable that regulates the cyclicity of water, energy, and carbon, through which SM determines the evolution and thermodynamic state of the atmosphere. Land and atmospheric is tightly coupled in the water-limited regime (WLR), while the coupling strength diminishes in the energy-limited regime (ELR). Specifically, in response to progressive SM drying in the WLR, SM fractionates the net insolation into a greater proportion of sensible heat flux (SHF) and a smaller amount of latent heat flux (LHF), owing to the depletion of moisture. This phenomenon results in reduced land surface cooling, increased air temperature, expansion of the boundary layer, and subsequently enhances the land-atmosphere feedback. Further continuation of SM depletion leads to dry hydroclimatic extremes such as droughts and heatwaves. Consequently, understanding regime-specific coupled water-energy dynamics is fundamental to comprehending such extremes.

We propose a new metric called Land Feedback Strength (LFS) that combines three indices: sensitivity index (SI), variability index (VI) and regime persistence index (RPI). This formulation over the past attempts facilitates to effectively characterise the important components of LFS, which holistically quantify the terrestrial leg of land-atmospheric coupling. SI quantifies the responsiveness of SM to surface energy partitioning and is defined as the slope between SM and EF (LHF/LHF+SHF) in the WLR. Specifically, we observe higher SM sensitivity in semi-arid and sub-humid regions than in wet regions, indicating that the landscape rapidly responds to SM losses and begins influencing the atmosphere instantaneously. In addition, VI quantifies the sufficiency of SM to act as a dominant forcing and is calculated as the ratio of the standard deviation of SM in the WLR to WLR and ELR. While strong coupling is expected where higher sensitivity and sufficient SM variation are present, the coupling strength is exacerbated with the increasing persistence of the WLR. Thus, the RPI is formulated to indicate the likelihood of a landscape remaining in the WLR within a certain period. Furthermore, to quantify the LFS, we initially delineate global regimes using the coverability of SM and EF data pairs during drydowns.

This study’s findings indicate the following: (1) the highest sensitivity is observed during the dry seasons, whereas sensitivity is lowest during the summer; (2) SM variability is predominantly confined to WLR during winter and spring, with approximately equal variability in both regimes noted during autumn, and variability predominantly occurring in ELR during summer; (3) ELR is prevalent during summer in response to precipitation pulses, WLR and ELR demonstrate comparable likelihood in autumn, and WLR becomes predominant during winter and spring; (4) consequently, LFS is at its lowest during summer, increases in autumn, and further intensifies in winter; (5) LFS has facilitated the identification of two groups of strong coupling hotspots – with relatively higher intensity over the western USA and Austrian shrubland, African and Brazilian savannah, and lower intensity over Sahelian grassland, and peninsular India (6) LFS is found to be higher in semi-arid and sub-humid regions or savanna and grassland areas than forested or humid regions.

How to cite: Paul, S. and Lanka, K.: A Holistic Multi-Index Approach to Quantify Land Feedback Strength Across Evapotranspiration Regimes, EGU General Assembly 2025, Vienna, Austria, 27 Apr–2 May 2025, EGU25-16413, https://doi.org/10.5194/egusphere-egu25-16413, 2025.

EGU25-16565 | ECS | Orals | CL4.4

Expanding Amazon dry-hot season under anthropogenic climate change 

Mengxin Pan, Shineng Hu, Mark M. Janko, Benjamin F. Zaitchik, and William K. Pan

The Amazon rainforest, a crucial global carbon sink, plays a vital role in the global climate system. As ongoing climate change and local deforestation push the Amazon toward a critical tipping point, understanding the region's changing climate patterns becomes increasingly important. In this study, we reveal a significant expansion of the dry-hot season across the Amazon rainforest from 1980-2022, creating prolonged adverse climate conditions for the ecosystem and local communities. A machine learning clustering algorithm is used to define the dry-hot season automatically by considering the temperature, precipitation, and soil moisture simultaneously.

The land-atmosphere interaction predominates the dry-hot season expansion in the Amazon. During the dry season (Aug-Oct), the daily maximum temperature has warmed by ~1 degree per decade, much faster than that in the wet seasons (~0.4 degree per decade). By the surface heat budget analysis, we found that intensive dry-season warming is predominantly driven by reduced evapotranspiration, leading to decreased surface latent heat flux and increased shortwave radiation due to diminished cloud cover. The declining evapotranspiration rates stem from a combination of increasing soil moisture deficits and local deforestation.

By large-ensemble climate model simulations, we further demonstrate that this dry-hot season expansion is highly unlikely to occur without anthropogenic climate change and this expansion will exacerbate under future warming scenarios. By single-forcing experiment, we further confirm the critical role of local deforestation in amplifying this expansion. These findings emphasize the urgent need for targeted mitigation and adaptation strategies to protect this vital ecosystem from the compounding effects of climate change and deforestation.

How to cite: Pan, M., Hu, S., Janko, M. M., Zaitchik, B. F., and Pan, W. K.: Expanding Amazon dry-hot season under anthropogenic climate change, EGU General Assembly 2025, Vienna, Austria, 27 Apr–2 May 2025, EGU25-16565, https://doi.org/10.5194/egusphere-egu25-16565, 2025.

EGU25-16957 | Orals | CL4.4

Heat capacity, cooling efficiency and drought stress of vegetated surfaces 

Matteo Zampieri, Matteo Piccardo, Guido Ceccherini, Marco Girardello, Ibrahim Hoteit, and Alessandro Cescatti

Drought stress has profound impacts on ecosystems and societies, particularly in the context of climate change. Traditional drought indicators, which rely on integrated surface water budget anomalies at various time scales and thresholds derived from past climate variability, provide valuable insights but often fail to deliver clear and direct real-time assessments of drought stress on vegetation.

This study introduces the Cooling Efficiency Factor (CEF), a novel metric derived from geostationary satellite observations, to detect drought stress by analyzing daytime surface warming anomalies. The CEF is based on the principle that dry surfaces warm more rapidly than wet ones under identical radiative forcing due to reduced evapotranspiration caused by soil moisture limitation and by stomatal closure, altering the effective heat capacity of the land surface.

By leveraging high-frequency, high-resolution retrievals of land surface temperature (LST) and radiation data from geostationary satellites, this study demonstrates the CEF's ability to assess drought stress conditions. The CEF correlates strongly with evapotranspiration anomalies from established datasets, including GLEAM, ERA5-Land, and TerraClimate. Results underscore the CEF's sensitivity to vegetation type, soil moisture variability, and environmental conditions, illustrating its effectiveness in identifying drought stress compared to traditional indicators.

The CEF represents a promising tool for real-time drought monitoring and integration into early warning systems, particularly for arid and semi-arid regions. By complementing existing drought assessment methods, the CEF paves the way for advancements in land-surface process studies and improved drought risk management.

How to cite: Zampieri, M., Piccardo, M., Ceccherini, G., Girardello, M., Hoteit, I., and Cescatti, A.: Heat capacity, cooling efficiency and drought stress of vegetated surfaces, EGU General Assembly 2025, Vienna, Austria, 27 Apr–2 May 2025, EGU25-16957, https://doi.org/10.5194/egusphere-egu25-16957, 2025.

EGU25-17114 | ECS | Orals | CL4.4

Increases in extreme ET leading to a higher risk of flash droughts 

Marius Egli, Vincent Humphrey, Sebastian Sippel, and Reto Knutti

Evapotranspiration (ET) is a crucial process liking the surface energy balance, the hydrological and the carbon cycles. However, ET often remains underexplored due to climate model limitations as well as sparse and poor observational coverage.

While mean ET projections of CMIP6 models are highly uncertain, we explore whether climate models are in clearer agreement in terms of extreme ET, similar to what has been shown for mean versus extreme precipitation. We first define extreme ET (ETxx) as the annual 7-day ET maximum and investigate the physical drivers behind such events in a mid-latitude region (Central Europe). Typically, extreme ET events are characterized by high temperatures and incoming surface radiation, characteristic of a heat wave.  

We find an increase in extreme ET during the recent historical period and throughout scenario SSP5-8.5 in most CMIP6 models, together with a shift of these extremes from summer towards spring. We also find a higher degree of climate model agreement in the ET extremes, partially due to constraints in the boundary conditions of such an event, meaning that the drivers behind an extreme ET event are better constrained than the drivers of annual mean ET. This is a somewhat expected result due to the increase in vapor pressure deficit with higher temperature. The agreement also extends to all considered observational products, which agree on an increase in extreme ET, however the magnitude of this increase remains uncertain across observations-based products. We find that the observed trends lie outside the likely range of trends found in unforced climate simulations, indicating that the recent shift in observed extreme ET is attributable to climate change. We further find that records in extreme ET have been disproportionally set in more recent years, compared to what would be expected in a stationary climate in both observations and CMIP6 models.

Overall, mean ET projections and trends are complex and notoriously uncertain. Here we show that extreme ET events are better constrained than mean ET projections, making them a natural target for more robust inference from observations, attribution studies and emergent constraints. Our findings indicate an elevated risk for flash drought due to higher evaporative demand. The fact that future changes in peak water demand are less uncertain than changes in the mean demand is a highly relevant information for decision-makers and for the design of future water supply infrastructure (such as irrigation systems).

How to cite: Egli, M., Humphrey, V., Sippel, S., and Knutti, R.: Increases in extreme ET leading to a higher risk of flash droughts, EGU General Assembly 2025, Vienna, Austria, 27 Apr–2 May 2025, EGU25-17114, https://doi.org/10.5194/egusphere-egu25-17114, 2025.

EGU25-18334 | ECS | Posters on site | CL4.4

Assessing soil moisture-induced changes in land carbon sink projections of CMIP6 models 

Lea Gabele, Petra Sieber, Mathias Hauser, Martin Hirschi, and Sonia Seneviratne

The terrestrial biosphere absorbs about one third of anthropogenic carbon dioxide emissions and thereby dampens human-induced climate change. However, its capacity to act as a carbon sink depends on climate conditions, including temperature and water availability. Uncertainties in both future climate conditions and the response of the terrestrial biosphere lead to greatly diverging projections of the land carbon sink among state-of-the-art Earth System Models (ESMs).

Previous research identified soil moisture (SM) as a critical factor that can restrict land carbon uptake through water limitation and the intensification and prolongation of heat extremes. Green et al. (2019) demonstrated the severe negative impact of reduced SM on long-term land carbon sink projections of the 5th Coupled Model Intercomparison Project (CMIP5) using dedicated experiments isolating the effects of SM.

Here, we use equivalent experiments performed with four ESMs participating in CMIP6 to investigate the impact and uncertainty of SM-induced changes in land carbon sink projections by the end of the century (2070-2099). Our results demonstrate a substantial reduction in the negative impact of SM on the global land carbon sink compared to the previous model generation. Models agree on a SM-induced reduction in land carbon uptake in summer, consistent with an overall SM decline across models, while intermodel uncertainty remains high in spring, particularly regarding the effects of SM variability at mid-to-high latitudes. Additionally, high uncertainty in SM-induced impact on annual carbon uptake persists in the tropics and northern mid-latitudes, driven by differences in the sensitivity of carbon uptake to SM but also disagreement in SM projections across models.

We extend our analysis to a larger ensemble of CMIP6 models that have not performed the SM experiments. To this end, we employ the methods of Schwingshackl et al. (2018), which utilize the distinct link between SM and the evaporative fraction in the different SM regimes. Using this relationship we emulate the impact of SM on the land carbon sink in regions where land carbon uptake is controlled by SM.

The study aims to gain insights into SM-induced impacts and related uncertainties in land carbon sink projections of CMIP6 models, highlighting the ongoing challenge of accurately projecting SM-induced changes in the land carbon sink.


References:


Green, J. K., Seneviratne, S. I., Berg, A. M., Findell, K. L., Hagemann, S., Lawrence, D. M., & Gentine, P. (2019). Large influence of soil moisture on long-term terrestrial carbon uptake. Nature, 565(7740), 476-479. https://doi.org/10.1038/s41586-018-0848-x 

Schwingshackl, C., Hirschi, M., & Seneviratne, S. I. (2018). A theoretical approach to assess soil moisture–climate coupling across CMIP5 and GLACE-CMIP5 experiments. Earth System Dynamics, 9(4), 1217-1234. https://doi.org/10.5194/esd-9-1217-2018

How to cite: Gabele, L., Sieber, P., Hauser, M., Hirschi, M., and Seneviratne, S.: Assessing soil moisture-induced changes in land carbon sink projections of CMIP6 models, EGU General Assembly 2025, Vienna, Austria, 27 Apr–2 May 2025, EGU25-18334, https://doi.org/10.5194/egusphere-egu25-18334, 2025.

EGU25-19778 * | ECS | Orals | CL4.4 | Highlight

Observed and projected increase of extreme precipitation events on dry soils 

Damián Insua Costa, Chiara M. Holgate, and Diego G. Miralles

Dry soils are associated with low infiltration capacity and increased runoff due to surface crust formation. Therefore, the occurrence of heavy rainfall on dry soils poses a higher risk of flooding. In recent years, abrupt changes from extremely dry to extremely wet conditions have attracted the attention of researchers, and terms such as precipitation whiplash or precipitation volatility have gained currency to refer to these phenomena. Most studies have focused on investigating these episodes on seasonal or annual scales, i.e. changes from very dry to very wet seasons or years. Here, we focus on analysing these events on a daily scale, i.e. the change from very dry to very wet conditions from one day to the next. For this purpose, dry conditions are detected using a threshold in soil moisture and not the rainfall deficit, which would be meaningless on a daily scale. We argue that this approach is more closely related to flash flood risk. Our results based on reanalysis data show that the global frequency of extreme precipitation events on dry soils has increased dramatically in recent decades, at a rate higher than predicted by historical climate model simulations. Furthermore, we show that this trend will continue to increase based on future projections. Specifically, we estimate that the global probability of such an event will more than double by the end of the present century compared to the pre-industrial era under a high-emissions scenario. Finally, we shed light on whether this trend is dominated by an increase in the probability of occurrence of extreme precipitation and dry soils independently, or rather is related to an increase in the probability of concurrence of both, which could be indicative of a negative soil moisture–precipitation feedback.

How to cite: Insua Costa, D., M. Holgate, C., and G. Miralles, D.: Observed and projected increase of extreme precipitation events on dry soils, EGU General Assembly 2025, Vienna, Austria, 27 Apr–2 May 2025, EGU25-19778, https://doi.org/10.5194/egusphere-egu25-19778, 2025.

Sea surface temperature anomalies (SSTAs) over the North Atlantic (NA) have a significant impact on the weather and climate in both local and remote regions. This study first evaluated the seasonal prediction skill of NA SSTA using the North American multi-model ensemble and found that its performance is limited across various regions and seasons. Therefore, this study constructs models based on the long short-term memory (LSTM) network machine learning method to improve the seasonal prediction of NA SSTA. Results show that the seasonal prediction skill can be significantly improved by LSTM models since they show higher capability to capture nonlinear processes such as the impact of El Nin ̃o-Southern Oscillation on NA SSTA. This study shows the great potential of the LSTM model on the seasonal prediction of NA SSTA and provides new clues to improve the seasonal predictions of SSTA in other regions.

How to cite: Yan, X. and Tang, Y.: Seasonal prediction of North Atlantic sea surface temperature anomalies using the LSTM machine learning method , EGU General Assembly 2025, Vienna, Austria, 27 Apr–2 May 2025, EGU25-153, https://doi.org/10.5194/egusphere-egu25-153, 2025.

EGU25-3747 | Orals | CL4.6

Bridging paleoclimate and seasonal climate prediction: The case of European summer climate 

Martin Wegmann and Stefan Brönnimann

Understanding monthly-to-annual climate variability is essential for improving climate forecast products as well as adapting to future climate extremes. Previous studies show, that European summer climate, including temperature and precipitation extremes, is modulated by hemispheric large-scale circulation patterns, which themselves are connected to Earth system components such as sea surface temperature across temporal scales. Nevertheless, it remains unclear as to how stationary these teleconnections are and if their predictive power is potent across multiple centuries and background climates. By combining d18O isotopes from a European tree ring network with independent paleo-climate reanalyses, we highlight precursors and atmospheric dynamics behind European summer climate over the last 400 years.

We further present evidence that centennial ensemble seasonal climate forecasts capture the causality of the atmospheric
dynamics behind these teleconnections in the 20th century. Our results suggest that tropical sea surface temperature anomalies trigger specific precipitation and diabatic heating patterns which are dynamically connected to extratropical Rossby wave trains and the formation of a circumglobal teleconnection pattern weeks later.

How to cite: Wegmann, M. and Brönnimann, S.: Bridging paleoclimate and seasonal climate prediction: The case of European summer climate, EGU General Assembly 2025, Vienna, Austria, 27 Apr–2 May 2025, EGU25-3747, https://doi.org/10.5194/egusphere-egu25-3747, 2025.

EGU25-3839 | ECS | Posters on site | CL4.6

Causal Links Between North Atlantic SSTs and Summer East Atlantic Pattern Predictability: Implications for Seasonal Forecasting 

Julianna Carvalho Oliveira, Giorgia Di Capua, Leonard F. Borchert, Reik V. Donner, and Johanna Baehr

We use causal effect networks to assess the influence of spring North Atlantic sea surface temperatures (NA-SSTs) on summer East Atlantic (EA) pattern predictability during 1908–2008. In the ERA-20C reanalysis, a robust causal link is identified for 1958–2008, where the spring meridional SST gradient causes a 0.2 standard deviation change in the summer EA. Additionally, the spring meridional SST index has an estimated negative causal effect (~−0.2) on summer 2m air temperatures over northwestern Europe. However, both links are absent when analysing the full period and are sensitive to interannual variability.

Analysis of the Max Planck Institute Earth System Model in mixed resolution (MPI-ESM-MR) shows that historical simulations fail to reproduce the observed causal links, while initialised ensembles occasionally capture them but underestimate their strength. Predictive skill assessments conditioned on these causal links indicate limited overall impact but suggest potential local improvements for European summer climate forecasts. These findings underscore the value of causal approaches for refining seasonal predictability.

How to cite: Carvalho Oliveira, J., Di Capua, G., Borchert, L. F., Donner, R. V., and Baehr, J.: Causal Links Between North Atlantic SSTs and Summer East Atlantic Pattern Predictability: Implications for Seasonal Forecasting, EGU General Assembly 2025, Vienna, Austria, 27 Apr–2 May 2025, EGU25-3839, https://doi.org/10.5194/egusphere-egu25-3839, 2025.

EGU25-5880 | Orals | CL4.6

Intermittency of seasonal forecast skill for the wintertime North Atlantic Oscillation and East Atlantic Pattern  

Laura Baker, Len Shaffrey, Antje Weisheimer, and Stephanie Johnson

The wintertime North Atlantic Oscillation (NAO) and East Atlantic Pattern (EA) are the two leading modes of North Atlantic pressure variability and have a substantial impact on winter weather in Europe. The year-to-year contributions to multi-model seasonal forecast skill in the Copernicus C3S ensemble of seven prediction systems are assessed for the wintertime NAO and EA, and well-forecast and poorly-forecast years are identified. Years with high NAO predictability are associated with substantial tropical forcing, generally from the El Niño Southern Oscillation (ENSO), while poor forecasts of the NAO occur when ENSO forcing is weak. Well-forecast EA winters also generally occurred when there was substantial tropical forcing, although the relationship was less robust than for the NAO. These results support previous findings of the impacts of tropical forcing on the North Atlantic and show this is important from a multi-model seasonal forecasting perspective.

How to cite: Baker, L., Shaffrey, L., Weisheimer, A., and Johnson, S.: Intermittency of seasonal forecast skill for the wintertime North Atlantic Oscillation and East Atlantic Pattern , EGU General Assembly 2025, Vienna, Austria, 27 Apr–2 May 2025, EGU25-5880, https://doi.org/10.5194/egusphere-egu25-5880, 2025.

EGU25-6006 | ECS | Orals | CL4.6

 Investigating the sensitivity of 20th century seasonal hindcasts to tropospheric aerosol forcing 

Matthew Wright, Antje Weisheimer, Tim Woollings, Retish Senan, and Timothy Stockdale

Previous studies have identified multi-decadal variations in the skill of winter seasonal forecasts of large-scale climate indices, including ENSO, the PNA, and NAO. Forecast skill is significantly lower in the middle of the 20th century (1940—1960) than at the start or end of the century. We hypothesise that tropospheric aerosol forcing, which is spatially and temporally heterogeneous and poorly constrained in the hindcasts used in previous studies, contributes to this low skill mid-century period.

This study assesses the sensitivity of ECMWF’s state-of-the-art seasonal forecasting model to tropospheric aerosol forcing, using a newly developed aerosol forcing dataset based on CEDS emissions data. We analyse DJF hindcasts initialised every November from 1925—2010, each with 21 ensemble members. For each year, we run hindcasts with ‘best guess’, doubled, and halved aerosol forcing (perturbing both anthropogenic and natural aerosols). All experiments exhibit similar multi-decadal variability in skill for large-scale climate indices. Aerosol forcing has no significant impact on forecast skill but some impacts on mean biases, suggesting other factors drive the mid-century skill minimum.

Aerosol forcing has large regional impacts. Increasing aerosol forcing leads to cooler 2m temperature and SSTs globally, with amplified cooling in regions with large aerosol forcings, such as northern India and North Africa. Dynamical responses include an ‘anti-monsoon’ circulation over Africa, with a weakening of the trade winds and Atlantic Walker circulation, and local southwards shift of the ITCZ. The magnitude of the response increases when ocean initial conditions are perturbed to represent the cumulative impact of aerosol forcing, suggesting that coupling enhances the atmospheric response.

These results highlight the model’s sensitivity to tropospheric aerosols, with large differences in bias and mean state after four months, despite limited impact on skill. The circulation changes over Africa warrant further investigation, with implications for future aerosol scenarios. Planned experiments will explore the impact in summer and quantify the timescale of the response to aerosols.

How to cite: Wright, M., Weisheimer, A., Woollings, T., Senan, R., and Stockdale, T.:  Investigating the sensitivity of 20th century seasonal hindcasts to tropospheric aerosol forcing, EGU General Assembly 2025, Vienna, Austria, 27 Apr–2 May 2025, EGU25-6006, https://doi.org/10.5194/egusphere-egu25-6006, 2025.

This study shows a close relationship between winter Arctic sea ice concentration (WASIC) anomalies in the Barents-Greenland Seas and the subsequent autumn Indian Ocean Dipole (IOD) based on the observational analysis and numerical simulations. Particularly, more (less) WASIC in the Barents-Greenland Seas tends to lead to a positive (negative) IOD in the following autumn. Above-normal WASIC in the Barents-Greenland Seas results in reduction of the upward turbulent heat flux and induces tropospheric cooling over the Arctic. This tropospheric cooling triggers an atmospheric teleconnection extending from the Eurasian Arctic to the subtropical North Pacific. Numerical experiments with both the linear barotropic model and atmospheric general circulation model can well capture the atmospheric teleconnection associated with the WASIC anomalies. The subtropical atmospheric anomalies generated by the WASIC anomalies then result in subtropical sea surface temperature (SST) warming, which sustains and expands southward to the equatorial central Pacific during the following summer via a wind-evaporation-SST feedback. The resulting equatorial central Pacific SST warming anomalies induce local atmospheric heating and trigger an anomalous Walker circulation with descending motion and low-level anomalous southeasterly winds over the southeastern tropical Indian Ocean. These anomalous southeasterly winds trigger positive air-sea interaction in the tropical Indian Ocean and contribute to the development of the IOD. The close connection of the WASIC anomalies with the subsequent IOD and the underlying physical processes can be reproduced by the coupled climate models participated in the CMIP6. These results indicate that the condition of WASIC is a potential effective precursor of IOD events.

How to cite: Xin, C.: Influence of winter Arctic sea ice anomalies on the following autumn Indian Ocean Dipole development, EGU General Assembly 2025, Vienna, Austria, 27 Apr–2 May 2025, EGU25-6176, https://doi.org/10.5194/egusphere-egu25-6176, 2025.

EGU25-7163 | Orals | CL4.6

Robust decadal predictability of cold surge frequency in Taiwan and East Asia through teleconnection of North Atlantic Oscillation 

Wan-Ling Tseng, Yi-Chi Wang, Ying-Ting Chen, Yi-Hui Wang, Huang-Hsiung Hsu, and Chi-Cherng Hong

This study investigates the decadal predictability of cold surge frequency (CSF) in East Asia, including Korea, Japan, and Taiwan, through the lens of the North Atlantic Oscillation (NAO) index. The findings suggest that extreme events such as cold surges can be predicted on decadal timescales when the teleconnection mechanism is robustly established. The study revisits and consolidates the dynamical mechanisms underlying wave propagation and the teleconnection between the NAO and the East Asian trough, highlighting their role in creating a winter environment conducive to cold surges in Taiwan and East Asia. The study demonstrates the skill of climate models in capturing the NAO's decadal variability, and develops a statistical-dynamical hybrid approach. This method integrates decadal prediction datasets with a statistical model to enhance the prediction of extreme cold surge occurrences on a multi-annual timescale. The results of the study underscore the scientific significance of merging climate dynamical mechanisms with decadal prediction systems for extreme events, and introduce a hybrid framework that combines numerical decadal climate predictions with statistical regression models. This addresses the challenges posed by biases in climate prediction models and advances the capability to predict regional extreme events such as cold surges.

How to cite: Tseng, W.-L., Wang, Y.-C., Chen, Y.-T., Wang, Y.-H., Hsu, H.-H., and Hong, C.-C.: Robust decadal predictability of cold surge frequency in Taiwan and East Asia through teleconnection of North Atlantic Oscillation, EGU General Assembly 2025, Vienna, Austria, 27 Apr–2 May 2025, EGU25-7163, https://doi.org/10.5194/egusphere-egu25-7163, 2025.

EGU25-8693 | ECS | Orals | CL4.6

Decadal prediction for the European Energy Sector 

Benjamin Hutchins, David Brayshaw, Len Shaffrey, Hazel Thornton, and Doug Smith

The timescale of decadal climate predictions, from a year-ahead up to a decade, is an important planning horizon for stakeholders in the energy sector. With power systems transitioning towards a greater share of renewables, these systems become more vulnerable to the impacts of both climate variability and climate change. As decadal predictions sample both the internal variability of the climate and the externally forced response, these forecasts can provide useful information for the upcoming decade. 

There are two main ways in which decadal predictions can benefit the energy sector. Firstly, they can be used to try to predict how a variable of interest, such as average temperature, may evolve over the coming year or decade. Secondly, a large ensemble of decadal predictions can be aggregated into a large synthetic event set to explore physically plausible extremes, such as winter wind droughts. 

We find predictive skill at decadal timescales for surface variables over Europe during both winter (ONDJFM) and summer (AMJJAS). Although this skill is patchy, there are regions of relevance to the energy sector, such as over the UK for temperature, where this skill emerges. We find significant skill when using pattern-based (e.g., NAO) approaches to make predictions of European energy indicators during the extended winter, including Northern Europe offshore wind generation, Spanish solar generation, and Scandinavian precipitation. For predicting UK electricity demand, we find significant skill when directly using the model predictions of surface temperature. Our results highlight the potential for operational decadal predictions for the energy system, with potential benefits for both the planning and operation of the future power system. 

How to cite: Hutchins, B., Brayshaw, D., Shaffrey, L., Thornton, H., and Smith, D.: Decadal prediction for the European Energy Sector, EGU General Assembly 2025, Vienna, Austria, 27 Apr–2 May 2025, EGU25-8693, https://doi.org/10.5194/egusphere-egu25-8693, 2025.

EGU25-8904 | Orals | CL4.6

On the predictive skill for warm spells in Germany across seasons  

Fabiana Castino, Tobias Geiger, Alexander Pasternack, Andreas Paxian, Clementine Dalelane, and Frank Kreienkamp

Intense warm spells, such as heatwaves, can significantly impact human health, the environment, and socio-economic systems. Although heatwaves are typically associated with summer, the occurrence of warm spells during cold seasons can also have profound effects on various sectors. While some effects, such as reduced cold-related mortality, can be considered beneficial, the long-term consequences, e.g. on ecosystems, forests, and agriculture, are concerning. Warm spells during the cold seasons can alter the natural dormancy cycles of plants, causing premature sprouting, flowering, or growth and negatively affecting crop yield and quality. In addition, cold season warm spells can reduce snow accumulation in mountainous regions, potentially affecting downstream water availability. As climate change drives increases in the frequency, intensity, and duration of warm spells, their impacts are becoming more severe and far-reaching. This makes predicting such events a key priority for climate science and risk management.

Climate forecast models offer the potential to predict extreme events like warm spells weeks to months in advance, becoming increasingly relevant for decision-making across various socio-economic sectors. This study examines the predictive skill of the downscaled German Climate Forecast System Version 2.1 (GCFS2.1) for warm spells in Germany on a seasonal scale, encompassing both warm seasons (spring and summer) and cold seasons (autumn and winter).  The analysis relies on hindcast data from the 1991-2020 base period, statistically downscaled to 5 km resolution. It evaluates multiple extreme temperature climate indices, as for example the Warm Spells Duration index, and applies various statistical metrics to assess the predictive skill. The findings reveal high heterogeneity in the ability of the (downscaled) GCFS2.1 to forecast warm spells across seasons, with higher predictive skill during the cold seasons but more limited for the warm seasons.

How to cite: Castino, F., Geiger, T., Pasternack, A., Paxian, A., Dalelane, C., and Kreienkamp, F.: On the predictive skill for warm spells in Germany across seasons , EGU General Assembly 2025, Vienna, Austria, 27 Apr–2 May 2025, EGU25-8904, https://doi.org/10.5194/egusphere-egu25-8904, 2025.

EGU25-8980 | ECS | Orals | CL4.6

Predicting North Atlantic Temperature Trends with the Analogue Method using the MPI CMIP6 Grand Ensemble 

Lara Heyl, Sebastian Brune, and Johanna Baehr

The analogue method is a powerful and efficient tool for climate predictions, particularly in regions like the North Atlantic, where impacts of climate change have been relatively modest. While climate projections effectively estimate global mean surface temperature trends over a century, decadal trends in the North Atlantic diverge from the global trend. Here, we leverage on the similar evolution of analogous patterns on a decadal time scale by comparing SST patterns in observed data with patterns from an existing simulation ensemble. We apply this method to ten-year SST trend reconstructions in the North Atlantic using the MPI CMIP6 grand ensemble. In addition, we assess the impact of volcanic eruptions on the quality of the SST trend reconstruction for the time period 1960-2019. We also provide a prediction for 2020–2029. We find that the analogue method delivers high correlation of SST trend reconstructions with observed trends for the MPI CMIP6 grand ensemble. Volcanic influence can be accounted for by trimming the time series to those times unaffected by volcanic eruptions, which results in a higher correlation. Our results suggest that the decadal predictions of SST trends might also be achieved without the need for new, computationally expensive simulations.

How to cite: Heyl, L., Brune, S., and Baehr, J.: Predicting North Atlantic Temperature Trends with the Analogue Method using the MPI CMIP6 Grand Ensemble, EGU General Assembly 2025, Vienna, Austria, 27 Apr–2 May 2025, EGU25-8980, https://doi.org/10.5194/egusphere-egu25-8980, 2025.

EGU25-9006 | Posters on site | CL4.6

Is the winter mean NAO white noise? Models and observations. 

Bo Christiansen and Shuting Yang

The NAO is a dominant mode of variability in the Northern Hemisphere with strong impacts on temperature, precipitation, and storminess. The predictive skill of the NAO on annual to decadal scales is therefore an important topic, which is often studied using, e.g., (initialized) climate models. The temporal structure is closely related to the predictability, and on inter-annual time scales the observed NAO is frequently described to have power at 2-7 years and sometimes with a distinct peak around 7 or 8 years.  However, the observational record is brief, and such estimations have high uncertainty.

Here, we present a thorough study to answer the questions: is the winter mean NAO different from white noise and is the observed NAO different from the NAO in historical experiments with contemporary climate models (CMIP6)? To this end we use a range of statistical tools in both the temporal and spectral domain: Power-spectra, wavelet-spectra, autoregressive models, and various well-known time-series statistics.

Overall, we find little evidence to reject that the NAO is white noise. For observations, the peak in the power-spectrum at 8 years is, taken individually, significant in the period after 1950 but not before. However, considering the complete spectrum, significant peaks will often occur at some frequency, even for white noise.  The large CMIP6 multi-model ensemble is statistically very similar to an ensemble of similar size of white noise, e.g., the ensemble averages of the power spectrum and the wavelet spectra are completely flat.  Furthermore, for both observations and the model ensemble the tests based on autoregressive modelling and time-series statistics do not reject the null-hypothesis of white noise.

How to cite: Christiansen, B. and Yang, S.: Is the winter mean NAO white noise? Models and observations., EGU General Assembly 2025, Vienna, Austria, 27 Apr–2 May 2025, EGU25-9006, https://doi.org/10.5194/egusphere-egu25-9006, 2025.

EGU25-10305 | ECS | Posters on site | CL4.6

Towards improved forecast initialisations with an observation-informed ocean grid 

Marlene Klockmann, Kai Logemann, Sebastian Brune, and Johanna Baehr

For climate forecasts it is crucial to initialise the ocean state from observations because they rely on the memory of the ocean. If, however, the initialised ocean state is far away from the model’s own preferred mean state, predictive skill will suffer due to model drift. We are testing whether an ocean grid with variable resolution - designed to represent sparse and well-observed regions with appropriate resolution - has advantages over an ordinary grid with uniform resolution. The locally high resolution could lead to an improved mean ocean state through a better representation of mesoscale processes. The observation-informed grid will allow for high-resolution data assimilation in well-observed areas, which will potentially lead to improved initial conditions and predictive skill.  

We developed such a grid for the ocean component of the coupled ICON model designed for seamless predictions (ICON-XPP). The grid resolution varies from 40 to 10km, depending on the observation density in the EN4 database from 1960 to 2023. The local refinement in well-observed areas leads to a better representation of ocean features such as fronts and western boundary currents. We assess the effect of these improvements on the mean climate state by comparing to a reference simulation with a uniform 20km ocean resolution. 


How to cite: Klockmann, M., Logemann, K., Brune, S., and Baehr, J.: Towards improved forecast initialisations with an observation-informed ocean grid, EGU General Assembly 2025, Vienna, Austria, 27 Apr–2 May 2025, EGU25-10305, https://doi.org/10.5194/egusphere-egu25-10305, 2025.

EGU25-10747 | Posters on site | CL4.6

Ocean–atmosphere feedbacks key to NAO decadal predictability 

Panos J. Athanasiadis, Casey Patrizio, Doug M. Smith, and Dario Nicolì

Recent studies using initialised large-ensemble re-forecasts have shown that the North Atlantic Oscillation (NAO) exhibits significant decadal predictability, which is of great importance to society given the significant climate anomalies that accompany the NAO. However, the key physical processes underlying this predictability, including the role of ocean–atmosphere interactions, have not yet been pinned down. Also, a critical deficiency in the representation of the associated predictable signal by climate models has been identified in recent studies (the signal-to-noise problem), still lacking an explanation.

In this study, the decadal prediction skill for the NAO and the interactions of the associated atmospheric circulation anomalies with the underlying ocean are assessed using retrospective forecasts from eight decadal prediction systems and observation-based data. We find considerable spread in the NAO skill across these systems and critically, that this is linked to differences in the representation of ocean–NAO interactions across the systems. Evidence is presented that the NAO skill depends on a direct positive feedback between subpolar sea surface temperature anomalies and the NAO, which varies in strength across the prediction systems, yet may still be too weak even in the most skillful systems compared to the observational estimate. This positive feedback is opposed by a delayed negative feedback between the NAO and the ocean circulation that also contributes to disparities in the NAO skill across systems. Our findings therefore suggest that North Atlantic ocean–atmosphere interactions are central to NAO decadal predictability. Finally, it is suggested that errors in the representation of these interactions may be contributing significantly to the signal-to-noise problem.

How to cite: Athanasiadis, P. J., Patrizio, C., Smith, D. M., and Nicolì, D.: Ocean–atmosphere feedbacks key to NAO decadal predictability, EGU General Assembly 2025, Vienna, Austria, 27 Apr–2 May 2025, EGU25-10747, https://doi.org/10.5194/egusphere-egu25-10747, 2025.

EGU25-10815 | Posters on site | CL4.6

Planktonic foraminifera as a tool of past seasonality reconstruction 

Zhoufei Yu, Baohua Li, and Shuai Zhang

Seasonal changes in seawater temperature leave large imprints on the stable oxygen isotope composition (δ18O) of planktonic foraminiferal tests, based on which the past seasonal changes can be reconstructed. However, there are still problems needed to be figured out in regard to this new method, to improve the reliability of seasonality reconstruction. For example, the selected foraminiferal species, the used size fraction, and the sample area. As a result, by analyzing planktonic foraminiferal test δ18O from the sediment trap samples deployed in the South China Sea, we found that foraminiferal seasonal δ18O signal is strongly distorted (amplified or damped) by seasonal variations in their habitat depth, particularly for the species living in low latitude. Furthermore, Globigerinoides ruber of 300-355 um can record the most comprehensive seawater seasonality information. This study provides strong support to the reconstruction of past seawater seasonal temperature by using individual planktonic foraminifera.

How to cite: Yu, Z., Li, B., and Zhang, S.: Planktonic foraminifera as a tool of past seasonality reconstruction, EGU General Assembly 2025, Vienna, Austria, 27 Apr–2 May 2025, EGU25-10815, https://doi.org/10.5194/egusphere-egu25-10815, 2025.

EGU25-11024 | ECS | Orals | CL4.6

Skill assessment of a multi-system ensemble of initialized 20-year predictions 

Dario Nicolì, Sebastiano Roncoroni, Wolfgang A. Mueller, Holger Pohlmann, Sebastian Brune, Markus Donat, Rashed Mahmood, Steve Yeager, William J. Merryfield, Reinel Sospedra-Alfonso, and Panos J. Athanasiadis

Decadal predictions have advanced greatly in recent years: not only have they become operational worldwide and have been demonstrated to be skillful in various aspects of climate variability, including predicting changes in the atmospheric circulation and in the occurrence of extremes several years ahead, but —as such— they are also being used increasingly in climate services. Climate adaptation and policy making, however, also require climate predictions that go beyond the 10-year horizon. For climate information beyond 10 years into the future, uninitialized climate projections, which completely miss any predictability stemming from internal variability, have been the only available product. Trying to account for this lack of information in climate projections regarding any predictable components of internal variability, methods to constrain climate projections using information from large ensembles of initialized decadal predictions have been developed and have been shown to reduce the uncertainty and increase the skill of climate projections, even beyond the 10-year horizon. The demonstrated benefits of such indirect methods to account for predictable internal variability indicate that the latter remains significant beyond the 10-year limit of decadal predictions. Hence, directly harnessing this predictability through running initialized 20-year predictions emerges as a strategic endeavour.
In this study a novel, multi-system ensemble of initialized extended-decadal predictions is assessed. These predictions consist of a grand ensemble of 71 members derived from 6 forecast systems. They are initialized every 5 years from 1960 onward and run ahead for 20 years. Our analysis uses an elaborate drift- and bias-correction method that accounts for the correct representation of trends. Importantly, we show significant skill against observations for a number of variables (fields and indices), even in the second decade of the forecasts. The origin of such predictability is discussed together with the limitations of these 20-year predictions. The respective experimental protocol was defined in the framework of the ASPECT EU project and has been proposed as a tier-2 Decadal Climate Prediction Project (DCPP) protocol for the Coupled Model Intercomparison Project phase 7 (CMIP7).

How to cite: Nicolì, D., Roncoroni, S., Mueller, W. A., Pohlmann, H., Brune, S., Donat, M., Mahmood, R., Yeager, S., Merryfield, W. J., Sospedra-Alfonso, R., and Athanasiadis, P. J.: Skill assessment of a multi-system ensemble of initialized 20-year predictions, EGU General Assembly 2025, Vienna, Austria, 27 Apr–2 May 2025, EGU25-11024, https://doi.org/10.5194/egusphere-egu25-11024, 2025.

EGU25-11166 | ECS | Orals | CL4.6

Multidecadal variability of the ENSO teleconnection to Europe in early-winter and implications for seasonal forecasting 

Pablo Fernández-Castillo, Teresa Losada, Belén Rodríguez-Fonseca, Diego García-Maroto, Elsa Mohino, and Luis Durán

El Niño-Southern Oscillation (ENSO) is the leading mode of global climate variability. Through its associated teleconnections, ENSO can impact the climate of numerous regions worldwide at seasonal timescales, highlighting its role as the main source of seasonal predictability. Numerous studies have demonstrated a significant influence of ENSO on the climate of the Euro-Atlantic sector, but the impacts and mechanisms of the teleconnection in early-winter (November-December) remain unclear. Besides, in early-winter, ENSO teleconnections involve tropospheric pathways, which may change in response to different background states of the ocean. Thus, a crucial research question to address is whether the early-winter teleconnection to the Euro-Atlantic sector has changed under the different background states of sea surface temperature (SST) over the Pacific Ocean. 


This work aims to analyse the ENSO early-winter teleconnection to the Euro-Atlantic sector from a nonstationary perspective. Specifically, the teleconnection is analysed under different background states of SST over the Pacific Ocean, related to changes in the phase of the Pacific Decadal Oscillation (PDO). Using observational and reanalysis datasets for the period 1950-2022, results reveal that the tropospheric pathways of the teleconnection change under the different Pacific SST background states, leading to distinct responses of the North Atlantic atmospheric circulation to ENSO. We also confirm that these distinct responses in the North Atlantic entail significantly different impacts of ENSO on the surface climate across Europe, particularly on surface air temperature. Furthermore, the teleconnection is analysed in the SEAS5 state-of-the-art dynamical seasonal prediction model. The analysis within the model is also conducted from a nonstationary perspective, and aims to determine whether the model successfully reproduces a shift in the teleconnection in the late 1990s identified in reanalysis and observations. Results show that the model accurately captures the spatial pattern of the teleconnection impacts across Europe after the late 1990s, but not before. In turn, significant changes in the skill of seasonal forecasts are observed between before and after the late 1990s. However, skill after the late 1990s is just moderate due to a significant underestimation of the teleconnection impacts. 


The results of this study shed light on the nonstationary behaviour of the early-winter teleconnection to the Euro-Atlantic sector and have important implications on seasonal predictability in Europe. Particularly, the nonstationarity of the teleconnection gives rise to the emergence of windows of opportunity for seasonal forecasting, in which forecast skill may be greater than initially expected from a stationary analysis.

How to cite: Fernández-Castillo, P., Losada, T., Rodríguez-Fonseca, B., García-Maroto, D., Mohino, E., and Durán, L.: Multidecadal variability of the ENSO teleconnection to Europe in early-winter and implications for seasonal forecasting, EGU General Assembly 2025, Vienna, Austria, 27 Apr–2 May 2025, EGU25-11166, https://doi.org/10.5194/egusphere-egu25-11166, 2025.

EGU25-11511 | Orals | CL4.6

Constraining near-term climate projections by combining observations with decadal predictions 

Rémy Bonnet, Julien Boé, and Emilia Sanchez

Reducing the uncertainty associated with internal climate variability over the coming decades is crucial, as this time frame aligns with the strategic planning needs of stakeholders in climate-vulnerable sectors. Three sources of information are available: non-initialized ensembles of climate projections, initialized decadal predictions, and observations. Non-initialized ensembles of climate projections span seamlessly from the historical period to the end of the 21st century, encompassing the full range of uncertainty linked to internal climate variability. Initialized decadal predictions aim to reduce uncertainty from internal climate variability by initializing model simulations with observed oceanic states, phasing the simulated and observed climate variability modes. However, they are usually limited to 5 to 10 years, with small added value after a few years, and they are also subject to drift due to the shock from the initialization. Finally, we can also use observations that can provide information to constrain the climate evolution over the next decades. Providing the best climate information at regional scale over the next decades is therefore challenging. Previous methods addressed this challenge by using information from either the observations or the decadal predictions to constrain uninitialized projections. In this study, we propose a new method to make use of the different sources of information available to provide relevant information about near-term climate change with reduced uncertainty related to internal climate variability. First, we select a sub-ensemble of non-initialized climate simulations based on their similarity to observed predictors with multi-decadal signal potential over Europe, such as Atlantic multi-decadal variability (AMV). Then, we further refine this sub-ensemble of trajectories by selecting a subset based on its consistency with decadal predictions. We present a case study focused on predicting near-term future surface temperatures over Europe. To evaluate the effectiveness of this method in providing reliable climate information, we conduct a retrospective analysis over the historical period.

How to cite: Bonnet, R., Boé, J., and Sanchez, E.: Constraining near-term climate projections by combining observations with decadal predictions, EGU General Assembly 2025, Vienna, Austria, 27 Apr–2 May 2025, EGU25-11511, https://doi.org/10.5194/egusphere-egu25-11511, 2025.

EGU25-12107 | Orals | CL4.6

Overcoming the spring predictability barrier with a supermodel 

Noel Keenlyside, Tarkeshwar Singh, Ping-Gin Chiu, Francois Counillon, and Francine Schevenhoven

Climate models suffer from long-standing biases that degrade climate prediction skills. While radically increasing resolution offers promise, we are still many years away from being able to perform operational climate predictions with models that can explicitly resolve the most important physical processes. Here we demonstrate that supermodelling can enhance climate predictions through better using the current generation of models. A supermodel connects different models interactively so that their systematic errors compensate. It differs from the standard non-interactive multi-model ensembles, which combines model outputs a-posteriori. We have developed an ocean-connected Earth System model using NorESM, CESM, and MPIESM in their CMIP5 versions. The model radically improves the simulation of tropical climate, strongly reducing SST and double ITCZ biases. We perform seasonal predictions for the period 1990-2020, initialized through (EnOI) data assimilation of SST. We have performed one forecast per season but are currently extending the ensemble size to ten members. The supermodel shows marked improvement in prediction skill for forecasts started before boreal spring, significantly overcoming the spring predictability barrier. Initial investigation indicates the skill enhancement is connected to better simulation of ocean-atmosphere interaction during the first part of the year, which also leads to improved initial conditions. Our results indicate the importance of better representing the signal-to-noise in the western and central Pacific during boreal spring.

How to cite: Keenlyside, N., Singh, T., Chiu, P.-G., Counillon, F., and Schevenhoven, F.: Overcoming the spring predictability barrier with a supermodel, EGU General Assembly 2025, Vienna, Austria, 27 Apr–2 May 2025, EGU25-12107, https://doi.org/10.5194/egusphere-egu25-12107, 2025.

EGU25-12143 | Posters on site | CL4.6

Probabilistic climate outcomes from prediction aggregation 

Robin Lamboll, Sofia Palazzo Corner, and Moritz Schwarz

Currently, much of the literature around the Paris Agreement, Paris Compliance and manging the transition to net zero requires heavy use of integrated assessment models (IAMs). IAMs provide economic projections of future emissions, conditional on idealised scenarios. However, for most adaptation and cost-benefit analysis, policymakers require predictions, which IAMs do not even attempt to provide. How can we use aggregated estimates of emissions and resulting climate change to give probability distributions of climate impacts? We outline why human computation likely out-performs other prediction methods and present a flexible method to collect intended predictions from a variety of people to effectively estimate future emissions, temperatures and climate impacts via prediction aggregation platforms. These can subsequently be used to inform estimates of climate impacts. It can also highlight deficiencies in the IAM scenarios literature and indicate relative probabilities of scenarios. We estimate all-uncertainty temperatures in 2050 and outline extensions of the work.

How to cite: Lamboll, R., Palazzo Corner, S., and Schwarz, M.: Probabilistic climate outcomes from prediction aggregation, EGU General Assembly 2025, Vienna, Austria, 27 Apr–2 May 2025, EGU25-12143, https://doi.org/10.5194/egusphere-egu25-12143, 2025.

EGU25-12247 | ECS | Orals | CL4.6

Forecasting monthly-to-seasonal sea surface temperatures and marine heatwaves with graph neural networks and diffusion methods 

Varvara Vetrova, Ding Ning, Karin Bryan, and Yun Sing Koh

Knowing future sea surface temperature (SST) patterns play a crucial role not only in industries such as fisheries, shipping and tourism but also in conservation of marine species . For example, DNA of endangered species can be sampled prior to anticipated marine heatwaves to preserve marine biodiversity. Overall, availability of SST forecasts allows to mitigate potential adverse impacts of extreme events such as marine heatwaves. 

There is a strong interest in accurate forecasts of SST and their anomalies on various time scales. The commonly used approaches include physics-based models and machine learning (ML) methods. The first approach is computationally intensive and limited to shorter time scales. While several attempts have been made by the community to adapt ML models to SST forecasts several challenges still remain. These challenges include improving accuracy for longer lead SST anomaly forecasts. 

Here we present an integrated deep-learning based approach to the problem of SST anomalies and MHW forecasting. On one hand, we capitalise both on inherent climate data structure and recent advances in the field of geometric deep learning. We base our approach on a flexible architecture of graph neural networks, well suited for representing teleconnections. From another hand, we adapt the diffusion method to increase lead time of the forecasts.  Our integrated approach allows marine heatwave forecasts up to six months in advance.

How to cite: Vetrova, V., Ning, D., Bryan, K., and Koh, Y. S.: Forecasting monthly-to-seasonal sea surface temperatures and marine heatwaves with graph neural networks and diffusion methods, EGU General Assembly 2025, Vienna, Austria, 27 Apr–2 May 2025, EGU25-12247, https://doi.org/10.5194/egusphere-egu25-12247, 2025.

The expansion of and increasing dependency on renewable energy that exploit climate variables, such as wind and precipitation, are highly sensitive to climate variability and weather extremes. Climate Futures is a Center of Research-based Innovation that aims to “co-produce new and innovative solutions for predicting and managing climate risks from sub-seasonal-to-seasonal (S2S) and seasonal-to-decadal (S2D) time scales with a cluster of partners in climate- and weather-sensitive sectors, including the renewable energy sector, through long-term cooperation between businesses, public organizations and research groups.

The aim of the cross-sectoral collaboration is for renewable energy companies to integrate improved climate predictions into their decision making. The long-term implications are a more resilient energy sector and stable power production. Examples of ongoing projects within the center include (1) using large ensemble climate model simulations to estimate near-future changes in precipitation variability, and (2) estimating future wind power production and variability using state-of-the-art decadal climate predictions. These results are important for future wind- and hydropower operations and infrastructure planning.

How to cite: Svendsen, L.: Climate services for and with the renewable energy sector in Norway, EGU General Assembly 2025, Vienna, Austria, 27 Apr–2 May 2025, EGU25-12574, https://doi.org/10.5194/egusphere-egu25-12574, 2025.

EGU25-13076 | Posters on site | CL4.6

Usage of seasonal forecasts in Tropical Cyclone risk models 

Rudy Mustafa, Ulysse Naepels, Hugo Rakotoarimanga, Rémi Meynadier, and Clément Houdard

Tropical cyclones (TCs) pose significant risks to lives, infrastructure and economies, especially in coastal areas.

AXA has been developing stochastic natural hazard models (also called natural catastrophe or NatCat models) to quantify the impact of events such as TCs on its portfolios. However, NatCat models tend to model the average annual risk for a given peril. NatCat models do not consider the present state of the atmosphere and therefore are not conditioned with respect to the current tropical cyclone season.

Information about the TC risk in the upcoming weeks or months of a season could be crucial for an insurer, especially regarding its reinsurance coverage, but also for better risk mitigation through reinforced and more efficient prevention systems.

Previous studies have demonstrated that ensemble seasonal forecasts have skill in predicting TC occurrence several weeks in advance. We explore the ability of ensemble seasonal forecasts to provided skilled information on the general activity of the season to come for various lead-times (number of occurrences, number of landfalls, ACE…) and how can NatCat models be adapted to provide a more dynamic vision of the TC risk.

How to cite: Mustafa, R., Naepels, U., Rakotoarimanga, H., Meynadier, R., and Houdard, C.: Usage of seasonal forecasts in Tropical Cyclone risk models, EGU General Assembly 2025, Vienna, Austria, 27 Apr–2 May 2025, EGU25-13076, https://doi.org/10.5194/egusphere-egu25-13076, 2025.

EGU25-13668 | Orals | CL4.6

Forecasting the annual CO2 rise at Mauna Loa 

Richard Betts, Chris Jones, Jeff Knight, John Kennedy, Ralph Keeling, Yuming Jin, James Pope, and Caroline Sandford

For the last 9 years, the Met Office has issued forecasts of the annual increment in atmospheric carbon dioxide measured at Mauna Loa, accounting for both anthropogenic emissions and the effects of El Niño Southern Oscillation (ENSO) on natural carbon sinks and sources. The first forecast was produced when the 2015-2016 El Niño was emerging, and correctly predicted the largest annual CO2 increment on record at the time. In most years, the inclusion of ENSO provides a more skilful forecast than just considering emissions alone, except for 2022-2023 when La Niña conditions in late 2022 were followed by an early emergence of El Niño conditions in the second quarter of 2023. The impacts of interannual differences in emissions on the CO2 rise are usually smaller than those of ENSO variability, except in 2020 when the emergence of an unexpected large drop in global emissions due to societal responses to the COVID-19 pandemic required the forecast to be re-issued with a new estimate of the annual profile of emissions. Our forecast methodology also provides a simple means of tracking the changes in anthropogenic contributions to the annual atmospheric CO2 rise against policy-relevant scenarios. The Met Office forecast for 2023-2024 predicted a relatively large annual CO2 rise, but the observed rise was even larger, with exceptional wildfires in the Americas a likely contributor to the additional increase. Even without the effects of El Niño and other climatic influences on carbon sinks, the human-driven rise in CO2 in 2023-2024 would have been too fast to remain compatible with IPCC AR6 scenarios that limit global warming to 1.5°C with little or no overshoot. While the 2024-2025 rise is predicted to be smaller than 2023-2024, it will still be above these 1.5°C scenarios.

How to cite: Betts, R., Jones, C., Knight, J., Kennedy, J., Keeling, R., Jin, Y., Pope, J., and Sandford, C.: Forecasting the annual CO2 rise at Mauna Loa, EGU General Assembly 2025, Vienna, Austria, 27 Apr–2 May 2025, EGU25-13668, https://doi.org/10.5194/egusphere-egu25-13668, 2025.

EGU25-13771 | Posters on site | CL4.6

Seasonal forecasting of East African short rains 

Giovanni Liguori, Agumase Kindie Tefera, William Cabos, and Antonio Navarra

The variability of East African Short Rains (October-December) has profound socioeconomic and environmental impacts on the region, making accurate seasonal rainfall predictions essential. We evaluated the predictability of East African short rains using model ensembles from the multi-system seasonal retrospective forecasts from the Copernicus Climate Change Service (C3S). We assess the prediction skill for 1- to 5-month lead times using forecasts initialized in September for each year from 1993 to 2016. Although most models exhibit significant mean rainfall biases, they generally show skill in predicting OND (October-December) precipitation anomalies across much of East Africa. However, skill is low or absent in some northern and western parts of the focus area. Along the East African coasts near Somalia and over parts of the western Indian Ocean, models demonstrate skill throughout the late winter (up to December-February), likely due to the persistence of sea surface temperature anomalies in the western Indian Ocean. Years when models consistently outperform persistence forecasts typically align with the mature phases of El Niño Southern Oscillation (ENSO) and/or Indian Ocean Dipole (IOD). This latter mode, when tracked using the Dipole Mode Index, is generally able to predict the sign of the rainfall anomaly in all models. Despite East Africa's proximity to the west pole of the IOD, the correlation between short rains and IOD maximizes when both east and west are considered. This finding confirms previous studies based on observational datasets, which indicate that broader-scale IOD variability associated with changes in the Walker Circulation, rather than local SST fluctuations, is the primary driver behind East African rainfall.     

How to cite: Liguori, G., Tefera, A. K., Cabos, W., and Navarra, A.: Seasonal forecasting of East African short rains, EGU General Assembly 2025, Vienna, Austria, 27 Apr–2 May 2025, EGU25-13771, https://doi.org/10.5194/egusphere-egu25-13771, 2025.

EGU25-13847 | ECS | Posters on site | CL4.6

Decadal Predictions with Diffusion Models: Combining Machine Learning and Earth System Modelling 

Simon Lentz, Johanna Baehr, Christopher Kadow, Johannes Meuer, Felix Oertel, and Bijan Fallah

In the past years, decadal prediction systems have started to fill the gap between seasonal forecasts and long-term climate projections. Despite huge progress in predictive skill and decadal predictions outperforming climate projections in almost all forecast tasks, decadal predictions still possess large rooms for improvement. Machine learning based forecast systems have already outperformed traditional weather forecast systems in recent years. Similarly, machine learning has successfully transformed or assisted in data assimilation or climate data reconstruction tasks. Despite its success in the climate sciences, machine learning methods have not yet been successfully integrated in decadal prediction systems.

Combining machine learning and numerical modeling, we attempt to produce decadal climate predictions utilizing Diffusion Models, essentially probabilistic neural networks. We use such a neural network to predict global 2m-air temperatures by training it on the historical MPI-ESM-LR Grand Ensemble and finetuning it on the MPI-ESM-LR decadal predictions and on ERA5 reanalyses. The resulting predictions are qualitatively comparable to the standard MPI-ESM-LR decadal prediction system, surpassing their predictive skill for leadyears 1 and 2. With diffusion models still new to climate predictions, we expect this result to stand only at the beginning of further machine learning integration into climate predictions in general and decadal predictions in particular.

How to cite: Lentz, S., Baehr, J., Kadow, C., Meuer, J., Oertel, F., and Fallah, B.: Decadal Predictions with Diffusion Models: Combining Machine Learning and Earth System Modelling, EGU General Assembly 2025, Vienna, Austria, 27 Apr–2 May 2025, EGU25-13847, https://doi.org/10.5194/egusphere-egu25-13847, 2025.

EGU25-15772 | Orals | CL4.6

A perfect-model perspective on the signal-to-noise paradox in initialized decadal climate predictions 

Markus G. Donat, Rashed Mahmood, Francisco J. Doblas-Reyes, and Etienne Tourigny

Initialized climate predictions are skillful in predicting regional climate conditions in several parts of the globe, but also suffer from different issues arising from imperfect initializations and inconsistencies between the model and the real world climate and processes. In particular, a so-called signal-to-noise paradox has been identified in recent years. This ‘paradox’ implies that the models can predict observations with higher skill than they predict themselves, despite some physical inconsistencies between modeled and real world climate. This is often interpreted as an indicator of model deficiencies.

Here we present a perfect-model decadal prediction experiment, where the predictions have been initialized using climate states from the model's own transient simulation. This experiment therefore avoids issues related to model inconsistencies, initialization shock and the climate drift that affect real-world initialized climate predictions. We find that the perfect-model decadal predictions are highly skillful in predicting the near-surface air temperature and sea level pressure of the reference run on decadal timescales. Interestingly, we also find signal-to-noise issues, meaning that the perfect-model reference run is predicted with higher skill than any of the initialized prediction members with the same model. This suggests that the signal-to-noise paradox may not be due just to model deficiencies in representing the observed climate in initialized predictions, but other issues that affect the statistical properties of the predictions. We illustrate that this signal-to-noise problem is related to analysis practices that concatenate time series from different discontinuous initialized simulations, which introduces inconsistencies compared to the continuous transient climate realizations and the observations. In particular, the concatenation of predictions initialized independently into a single time series breaks the auto-correlation of the time series.

How to cite: Donat, M. G., Mahmood, R., Doblas-Reyes, F. J., and Tourigny, E.: A perfect-model perspective on the signal-to-noise paradox in initialized decadal climate predictions, EGU General Assembly 2025, Vienna, Austria, 27 Apr–2 May 2025, EGU25-15772, https://doi.org/10.5194/egusphere-egu25-15772, 2025.

EGU25-18643 | Orals | CL4.6

Extending the Lead Time for European Winterstorm Activity Predictions 

Gregor C. Leckebusch, Kelvin S. Ng, Ryan Sriver, Lisa Degenhardt, Eleanor Barrie, and Elisa Spreitzer

The most dangerous and costly meteorological hazards in Europe are extreme extra-tropical cyclones and associated windstorms (EUWS) in winter. Recent studies have shown that seasonal prediction systems can skilfully predict the seasonal frequency of EUWS with a one-month lead time using November initialisations. Given that many seasonal prediction systems produce seasonal forecasts at the start of each month, this raises the question whether pre-November initialised seasonal forecasts could provide usable information in predicting seasonal activity of EUWS.

In this study, we will present preliminary results of an approach aimed at extending the predictive horizon of seasonal EUWS activity. While the direct outputs of the pre-November initialised seasonal predictions of EUWS do not have the sufficient skill, skilful predictions of seasonal EUWS activity can be obtained by an approach that utilises the information of the upper ocean mean potential temperature from seasonal prediction systems. Based on our approach, skilful predictions of seasonal EUWS activity becomes possible as early as October.

How to cite: Leckebusch, G. C., Ng, K. S., Sriver, R., Degenhardt, L., Barrie, E., and Spreitzer, E.: Extending the Lead Time for European Winterstorm Activity Predictions, EGU General Assembly 2025, Vienna, Austria, 27 Apr–2 May 2025, EGU25-18643, https://doi.org/10.5194/egusphere-egu25-18643, 2025.

Long-range winter predictions over the Euro-Atlantic sector have demonstrated significant skill but suffer from systematic signal-to-noise errors. Here, we examine sources of early winter seasonal predictability in across state-of-the-art seasonal forecasting systems. As in previous studies, these systems demonstrate skill in the hindcasts of the large-scale atmospheric circulation in early winter, associated with the East Atlantic pattern. The predictability is strongly tied to the ENSO teleconnection to the North Atlantic, though the systems' response to ENSO is systematically too weak. The hindcasts of the East Atlantic index exhibit a substantial signal-to-noise errors, with the systems' predicted signal generally being smaller than would be expected for the observed level of skill, though there is substantial spread across systems. The signal-to-noise errors are found to be strongly linked to the strength of the ENSO teleconnection in the systems, those with a weaker teleconnection exhibit a larger signal-to-noise problem. The dependency on modelled ENSO teleconnection strength closely follows a simple scaling relationship derived from a toy model. Further analysis reveals that the strength of the ENSO teleconnection in the systems is linked to climatological biases in the behaviour of the North Atlantic jet. 

How to cite: O'Reilly, C.: Signal-to-noise errors in early winter Euro-Atlantic predictions linked to weak ENSO teleconnections and pervasive North Atlantic jet biases, EGU General Assembly 2025, Vienna, Austria, 27 Apr–2 May 2025, EGU25-18821, https://doi.org/10.5194/egusphere-egu25-18821, 2025.

EGU25-21570 | ECS | Posters on site | CL4.6

Predicting climate indicators at the decadal scale using a hybrid prediction system: application to SUEZ water management plans over France 

Joanne Couallier, Ramdane Alkama, Charlotte Sakarovitch, and Didier Swingedouw

As climate change reshapes hydrological cycles, workers in water management face unprecedented challenges in ensuring resource availability, mitigating flood risks, and maintaining resilient infrastructure. Nowadays, water utilities and authorities rely on long-term climate projections to plan for challenges extending through the end of the century. However, critical gaps persist in actionable information for shorter timescales, such as the decadal scale, which better aligns with political and operational decision-making. In this context, decadal climate predictions can be pivotal to address the needs of the water management sector and develop efficient climate services. However, their added values as compared to projections remained limited up to now.
To better understand user requirements, we collaborate with various teams from SUEZ, a company specializing in water management. Through interviews, we have identified the demand for specific indicators based on climate variables (e.g., precipitation, temperature) and corresponding spatio-temporal scales. Building on this understanding, we also develop in IPSL-EPOC decadal prediction team a new hybrid approach to improve our forecasts. This approach includes identifying a climate index (e.g., NAO, WEPA) derived from Sea Level Pressure (SLP) that correlates with the climate variable of interest. Using all the available decadal climate predictions from the DCPP project, we evaluate the predictability of this index, which is usually high for NAO and WEPA. This index is then employed to subsample a few of member CMIP6 climate projections that are in phase with the prediction of the DCPP ensemble. This latter step allows to inflate the amplitude of the predictable signal, resolving the limitation coming from the signal-to-noise paradox. It is also allowing to perform a proper statistical downscaling, used to refine these forecasts, ensuring their usability for identified needs. The resulting forecasts are designed to integrate seamlessly into SUEZ’s water sector models.
Preliminary work has identified diverse parameters of interest for water management, such as daily precipitation (resource availability forecasting), extreme precipitation events at fine temporal resolution (Combined Sewer Overflows modeling), and the number of very cold or very hot days (linked to risks of water mains and service lines failures, respectively). Early findings also suggest that, for the average precipitation over France, the WEPA index exhibits the largest correlations, unlike the NAO, which has greater influence for other European regions. The production of forecasts is currently underway, and their performance regarding the initially identified parameters will be presented.

How to cite: Couallier, J., Alkama, R., Sakarovitch, C., and Swingedouw, D.: Predicting climate indicators at the decadal scale using a hybrid prediction system: application to SUEZ water management plans over France, EGU General Assembly 2025, Vienna, Austria, 27 Apr–2 May 2025, EGU25-21570, https://doi.org/10.5194/egusphere-egu25-21570, 2025.

EGU25-2059 | ECS | Orals | CL4.7

Coupling techniques in the new high resolution SHiELD + MOM6 model for extreme weather prediction 

Joseph Mouallem, Kun Gao, Lauren Chilutti, Brandon Reichl, Lucas Harris, Rusty Benson, Niki Zadeh, and Cheng Zhang

We present a new model that couples GFDL’s FV3-based weather model SHiELD, GFDL’s ocean model MOM6, and NCEP’s wave model WAVEWATCH III. This model is specifically designed for high-resolution simulations of air-sea interactions during extreme coastal weather events. It aims to address the critical need for accurate representation of fine-scale processes in air-sea interactions, which are not resolved in current-generation global  models. By combining SHiELD, MOM6, and WAVEWATCH III, we seek to capture the complex dynamics of atmosphere, ocean, and wave interactions at kilometer-scale resolutions.

We will discuss the methodology and present the infrastructure used to seamlessly couple these models, ensuring efficient data exchange and synchronization among the atmospheric, oceanic, and wave components. The coupling technique leverages GFDL’s in-house Flexible Modeling System (FMS) infrastructure which is employed for GFDL's suite of world-leading coupled climate models and those developed for kilometer-scale modeling of extreme weather events, enhancing the model's ability to accurately simulate the feedback mechanisms between the ocean surface and the atmosphere. We believe this new model will be a valuable tool for researchers and meteorologists, improving disaster preparedness and response strategies for coastal communities.

How to cite: Mouallem, J., Gao, K., Chilutti, L., Reichl, B., Harris, L., Benson, R., Zadeh, N., and Zhang, C.: Coupling techniques in the new high resolution SHiELD + MOM6 model for extreme weather prediction, EGU General Assembly 2025, Vienna, Austria, 27 Apr–2 May 2025, EGU25-2059, https://doi.org/10.5194/egusphere-egu25-2059, 2025.

EGU25-2254 | Orals | CL4.7

Spectral Causal Analysis of Air-Sea Coupling Feedbacks through the Mesoscale 

Aaron Wienkers, Dian Putrasahan, and Nicolas Gruber

Ocean–atmosphere interactions play a crucial role in global climate & weather dynamics, yet our understanding of the interplay between mesoscale thermal and current air–sea feedbacks remains incomplete. The strength of this coupling influences heat and kinetic energy fluxes at different length-scales and locations across the global oceans. Eddy-parameterising climate models can resolve the large-scale energy input into the ocean, which is then transferred into eddy kinetic energy through parameterised hydrodynamic instabilities. These models, however, struggle to accurately capture the spatial patterns of energy transfer, both kinetic and thermal, back into the atmosphere from the ocean mesoscales. Here, we present insight from a mesoscale-resolving global coupled climate model that elucidates the physical mechanisms driving air–sea current and thermal feedbacks at the mesoscale, in comparison to the large-scale air–sea coupling. Spectral analysis further reveals how these feedbacks are suppressed when either the ocean or atmosphere fails to resolve a local critical coupling length-scale. Extending beyond these traditional regression-based methods, we employ a novel causal analysis framework to uncover a hybrid thermal–current mesoscale feedback which enhances kinetic energy injection directly into ocean mesoscales. This mechanism involves localised heat fluxes enhancing vertical convection and downward momentum transport within the atmospheric boundary layer, leading to increased local wind stress and consequently wind work into eddy kinetic energy. These results highlight the critical role of mesoscale air–sea coupling in accurately representing the energetic ocean mesoscales, which in turn influence the global oceanic circulation and climate. 

How to cite: Wienkers, A., Putrasahan, D., and Gruber, N.: Spectral Causal Analysis of Air-Sea Coupling Feedbacks through the Mesoscale, EGU General Assembly 2025, Vienna, Austria, 27 Apr–2 May 2025, EGU25-2254, https://doi.org/10.5194/egusphere-egu25-2254, 2025.

EGU25-4489 | ECS | Posters on site | CL4.7

Quantifying Ensemble Divergence in Large-Domain Convective-Scale Simulations over Africa 

Fran Morris, Marcia Zilli, Neil Hart, and Jerry Samuel

Evidence indicates that since convective-scale simulations can explicitly resolve motion around deep convection, they may improve representation of coupling between small-scale moist convection and upscale modes of atmospheric variability.  Prior studies indicate that there can be a shift in the mean state of large-scale tropical circulations in convective-scale simulations relative to models with parameterised deep convection. However, it is uncertain whether this shift is systematic in convective-scale simulations or simply the response in a single model realisation.

To resolve this uncertainty, we run a 9-member ensemble of simulations over tropical southern and eastern Africa, using the Met Office Unified Model on a 2.2km grid with no deep convection parameterisation. ERA5 forces the lateral boundaries and simulations use FLake, a lake scheme to reduce over-lake biases in precipitation. The ensemble will be compared to a similar configuration which uses a deep convection parameterisation and a 12km grid.

Our ensemble experiments quantify the internal variability associated with varying initial conditions in the tropics and subtropics, relative to the variability induced by lateral boundary forcings. The ensemble divergence will be compared for the simulations with and without convection parameterisations to explore implications of ensemble design for high-resolution simulations of large domains. Furthermore, the hypothesis that there is a systematic mean-state shift in large-scale tropical circulations in kilometre-scale simulations relative to coarser GCMs will be evaluated using the two ensembles.

Effects of incorporating FLake and the role of soil moisture in initialisations will also be discussed, as well as their implications for predictability in kilometre-scale simulations. Model outputs will be compared to in-situ observations over northwest Zambia obtained during the 2022 DRYCAB field campaign, and we will outline how these results inform the design of planned further simulations to investigate monsoon onset predictability on subseasonal-to-seasonal timescales.

How to cite: Morris, F., Zilli, M., Hart, N., and Samuel, J.: Quantifying Ensemble Divergence in Large-Domain Convective-Scale Simulations over Africa, EGU General Assembly 2025, Vienna, Austria, 27 Apr–2 May 2025, EGU25-4489, https://doi.org/10.5194/egusphere-egu25-4489, 2025.

EGU25-4874 | Orals | CL4.7

High-Resolution Simulations with the Community Earth System Model (CESM): An Update 

Gokhan Danabasoglu, Ping Chang, Fred Castruccio, Dan Fu, Teagan King, Xue Liu, Nan Rosenbloom, Justin Small, Xiaoqi Wang, Gaopeng Xu, Steve Yeager, Qiuying Zhang, Andreas Prein, and Julio Bachmeister

As impacts of climate change are being felt by the society through sea level rise, increased intensity and occurrences of heat waves, droughts, extreme rainfall events and / or tropical cyclones (TCs), just to list a few, decision makers and stakeholders need reliable weather and climate information at increasingly finer spatial and temporal scales. Beyond such actionable aspects, there are numerous science questions regarding representation of and changes in importance of various processes with increased model resolution as well as their interactions with each other such as how TCs and oceanic mesoscale eddies interact with each other and with large-scale circulations. It is generally anticipated that with less reliance on uncertain parameterizations and their parameter choices, high-resolution models will represent various processes and coupled interactions of the Earth system with increased fidelity. To address these needs and challenges, we have made significant advances in high-resolution global climate modeling and predictions. Specifically, we have performed an unprecedented set of simulations at a TC-permitting and ocean-eddy-rich horizontal resolution using the Community Earth System Model (CESM 1.3), with additional modifications and improvements (hereafter referred to as CESM-HR). CESM-HR uses a 0.25° grid in the atmosphere and land and a 0.1° grid in the ocean and sea-ice components. These simulations include: a 500-year pre-industrial control simulation; 150-year 1%CO2 per year increase and 4xCO2 simulations; a 10-member ensemble of historical simulations; 10-member ensembles each of RCP8.5 and RCP6.0 future scenario simulations; 1 member each of RCP4.5 and RCP2.6 future scenario simulations; all HighResMIP coupled and AMIP simulations; and 10-member ensembles of 5-year decadal prediction simulations for the 1980-2023 period with May and November start dates for each year. The presentation will introduce these simulations and provide a few highlights from our extensive analysis. In general, high‐resolution simulations show significant improvements in representing global-mean surface temperature, oceanic heat uptake, sea level changes, extreme events such as TCs and winter-time extreme precipitation, and recent cooling and expanding sea-ice trends in the Southern Ocean. There are also improvements in prediction skill for several fields of interest. Our analysis shows that the projected increase in daily extreme precipitation over global land by the end of this century under the business-as-usual scenario is nearly double in the high-resolution simulations compared to its low-resolution counterpart, suggesting that current low-resolution models may significantly underestimate the future threat. Moreover, high-resolution simulations suggest that future precipitation intensifications arise from both moisture and circulation changes. This finding is in contrast with low-resolution simulations which primarily attribute such changes to increased moisture with warming. While not a panacea to address all the biases, these high-resolution simulations certainly offer promising potential to reduce model biases and uncertainties in comparison with their low-resolution counterparts and to improve our understanding of processes. Datasets from many of these simulations are now available to the broader community.

How to cite: Danabasoglu, G., Chang, P., Castruccio, F., Fu, D., King, T., Liu, X., Rosenbloom, N., Small, J., Wang, X., Xu, G., Yeager, S., Zhang, Q., Prein, A., and Bachmeister, J.: High-Resolution Simulations with the Community Earth System Model (CESM): An Update, EGU General Assembly 2025, Vienna, Austria, 27 Apr–2 May 2025, EGU25-4874, https://doi.org/10.5194/egusphere-egu25-4874, 2025.

EGU25-5848 | ECS | Posters on site | CL4.7

Improvement of large-scale circulation simulation in an ocean-sea ice model with high-resolution 

Yiwen Li, Hailong Liu, Pengfei Lin, Mengrong Ding, and Zipeng Yu

The impact of the resolution on the large-scale features in an ocean-sea ice coupled model is represented in this paper through three aspects. Firstly, refined resolution accelerates temperature and salinity drifts at a basin-averaged scale by facilitating exchanges among basins, subsequently reducing global-averaged drifts. This amplification of basin-scale exchanges is associated with an accelerated large-scale circulation, leading to a more rapid equilibration of temperature and salinity above 300 meters. Secondly, the refined resolution yields improved simulations of large-scale temperature, salinity, and currents, particularly evident in regions such as the Gulf Stream and its extension. Enhanced current simulations and corresponding temperature distributions contribute to more accurate representations of wind stress through ocean currents and sea surface temperature feedback. This feedback, in turn, influences wind-driven currents, establishing positive feedback loops. Despite little impact on the temporal variability of phenomena such as ENSO, IOD, PDO, and AMO, the refined resolution enhances the strengths of their variabilities. However, spatial patterns of PDO and AMO do not exhibit improvement with refined resolution, potentially attributed to the coarse resolution of the reference dataset.

How to cite: Li, Y., Liu, H., Lin, P., Ding, M., and Yu, Z.: Improvement of large-scale circulation simulation in an ocean-sea ice model with high-resolution, EGU General Assembly 2025, Vienna, Austria, 27 Apr–2 May 2025, EGU25-5848, https://doi.org/10.5194/egusphere-egu25-5848, 2025.

EGU25-6699 | Posters on site | CL4.7

Multi-year simulations at kilometre scale with the Integrated Forecasting System coupled to FESOM2.5 and NEMOv3.4 

Thomas Rackow, Tobias Becker, Rohit Ghosh, Aleksei Koldunov, Xabier Pedruzo-Bagazgoitia, and Daisuke Takasuka

We report on the first multi-year kilometre-scale global coupled simulations using ECMWF's Integrated Forecasting System (IFS) coupled to both the NEMO and FESOM ocean–sea ice models, as part of the H2020 Next Generation Earth Modelling Systems (nextGEMS) project. We focus mainly on an unprecedented IFS-FESOM coupled setup, with an atmospheric resolution of 4.4 km and a spatially varying ocean resolution that reaches locally below 5 km grid spacing. A shorter coupled IFS-FESOM simulation with an atmospheric resolution of 2.8 km has also been performed. A number of shortcomings in the original numerical weather prediction (NWP)-focused model configurations were identified and mitigated over several cycles collaboratively by the modelling centres, academia, and the wider nextGEMS community. The main improvements are (i) better conservation properties of the coupled model system in terms of water and energy budgets, which also benefit ECMWF's operational 9 km IFS-NEMO model; (ii) a realistic top-of-the-atmosphere (TOA) radiation balance throughout the year; (iii) improved intense precipitation characteristics; and (iv) eddy-resolving features in large parts of the mid- and high-latitude oceans (finer than 5 km grid spacing) to resolve mesoscale eddies and sea ice leads. New developments at ECMWF for a better representation of snow and land use, including a dedicated scheme for urban areas, were also tested on multi-year timescales. We provide first examples of significant advances in the realism and thus opportunities of these kilometre-scale simulations, such as a clear imprint of resolved Arctic sea ice leads on atmospheric temperature, impacts of kilometre-scale urban areas on the diurnal temperature cycle in cities, and better propagation and symmetry characteristics of the Madden–Julian Oscillation.

How to cite: Rackow, T., Becker, T., Ghosh, R., Koldunov, A., Pedruzo-Bagazgoitia, X., and Takasuka, D.: Multi-year simulations at kilometre scale with the Integrated Forecasting System coupled to FESOM2.5 and NEMOv3.4, EGU General Assembly 2025, Vienna, Austria, 27 Apr–2 May 2025, EGU25-6699, https://doi.org/10.5194/egusphere-egu25-6699, 2025.

Tropical waves are key drivers of weather and climate variability, yet their accurate simulation remains challenging due to the complexities of moist convection. This study investigates the impact of model resolution and convection treatment on tropical wave representation in a global non-hydrostatic model. Six simulations, with resolutions of 3.75 km, 15 km, and 120 km and convection treatments ranging from fully explicit to fully parameterized, are analyzed for their ability to capture wave-induced rainfall and three-dimensional wave structures. Results indicate that explicit convection outperforms parameterized convection in replicating rainfall anomalies, dynamic and thermodynamic wave structures, and rainfall-wind coupling. The 3.75-km explicit convection simulation performed best overall, indicating that explicit convection requires high resolution for optimal performance. A 15-km simulation using an alternative cumulus scheme produced wave signals nearly as accurate as the 3.75-km run, but with a significant rainfall bias, suggesting that the right results can sometimes be obtained for the wrong reasons. The study concludes that high resolution and explicit convection are essential for accurate tropical wave representation, with profound implications for weather forecasting and climate projections.

How to cite: Judt, F. and Rios-Berrios, R.: Sensitivity of Tropical Wave Structure to Resolution and Convection Treatment in a Global Non-Hydrostatic Model, EGU General Assembly 2025, Vienna, Austria, 27 Apr–2 May 2025, EGU25-7071, https://doi.org/10.5194/egusphere-egu25-7071, 2025.

EGU25-7755 | ECS | Posters on site | CL4.7

Convergent Response in Aquaplanet Climate Change Experiments with Increasing Horizontal Resolution  

Angel Peinado Bravo, Daniel Klocke, and Bjorn Stevens

General Circulation Models (GCMs) are widely used to understand our climate and to simulate and predict the effects of global warming. They have shown persistent biases in the large-scale features of the general circulation and basic climate statistics, which are attributed mainly to parameterizations, especially the convection parameterization. To address this, Global storm-resolving models (GSRMs) provide an alternative approach to parameterization by explicitly resolving convection and its interaction with other processes through the refinement of the horizontal gridIn a prior study, we showed the physical convergence of the tropical and general circulation structure at a horizontal grid spacing of 2.5 km using aquaplanets. However, questions linger: Does the response to climate warming converge in a simplified framework as aquaplanets? 


We will present the effect of increasing horizontal grid spacing on the convergence of the climate change response in aquaplanet experiments. We will focus on the convergence of the storm tracks and jet stream in terms of their location and intensity using the global storm-resolving model ICON. Control runs, and idealized climate change experiments (increasing sea-surface temperature by 4 Kelvin) were conducted at horizontal grid spacing from 160 km to 2.5 km using an aqua-planet configuration. We adopt an aquaplanet configuration to focus on atmospheric phenomena, specifically convection and cloud feedback while reducing the effect of complex interaction with land, topography, sea ice, and seasons. We will discuss the convergence rate of the large-scale circulation, the eddy-driven jet, the subtropical jet, and the storm track and their response to climate warming, characterized by the location, width, and intensity.

How to cite: Peinado Bravo, A., Klocke, D., and Stevens, B.: Convergent Response in Aquaplanet Climate Change Experiments with Increasing Horizontal Resolution , EGU General Assembly 2025, Vienna, Austria, 27 Apr–2 May 2025, EGU25-7755, https://doi.org/10.5194/egusphere-egu25-7755, 2025.

EGU25-8534 | ECS | Posters on site | CL4.7

Storm-Resolving Model ICON at the Air-Sea Interface: Insights into Momentum Dynamics and Parameterization Challenges 

Marius Winkler, Juan Pedro Mellado, and Bjorn Stevens

Storm-resolving models, such as the ICON model at 5 km resolution, are transforming our understanding of the Earth’s climate system by explicitly resolving key small-scale processes. This study highlights the dual nature of this modeling revolution: the advantages of improved representation of subgrid-scale dynamics and the challenges posed by existing parameterizations in capturing air-sea interactions.
On the one hand, a detailed momentum analysis of equatorial boundary layer winds using the coupled storm-resolving model ICON reveals dynamics that deviate from traditional assumptions. We identify two persistent wind patterns—zonal and meridional—governed by SST-driven pressure gradients, vertical turbulent flux, and horizontal momentum transport. These transport terms, largely overlooked in conventional models, and resolving the fine-scale interaction between SST gradients and boundary layer dynamics play a decisive role in shaping surface winds. A revised wind model, incorporating these findings, demonstrates strong agreement with storm-resolving model outputs.
On the other hand, storm-resolving models expose limitations in parameterizations of small-scale processes at the air-sea interface. For instance, the surface exchange coefficients—such as drag (cD) and heat exchange (cH)—are shown to be inadequate under low-wind regimes, leading to biases in surface pressure distribution and convection patterns. Using the ICON atmosphere-land-only "OptiFlux" configuration, we demonstrate that even small adjustments to these coefficients can substantially improve the representation of surface fluxes, strengthen pressure gradients, and enhance atmospheric dynamics.
These two aspects of this study illustrate the transformative potential and pressing challenges of storm-resolving models in further research.

How to cite: Winkler, M., Mellado, J. P., and Stevens, B.: Storm-Resolving Model ICON at the Air-Sea Interface: Insights into Momentum Dynamics and Parameterization Challenges, EGU General Assembly 2025, Vienna, Austria, 27 Apr–2 May 2025, EGU25-8534, https://doi.org/10.5194/egusphere-egu25-8534, 2025.

EGU25-9092 | Orals | CL4.7

An overview of findings from km-scale simulations of the Destination Earth Climate Adaptation Digital Twin: successes, limitations and future challenges  

Paolo Davini, Jost von Hardenberg, Matteo Nurisso, Silvia Caprioli, Natalia Nazarova, Supriyo Ghosh, Ingo Wagner, Nuno Rocha, Marc Battle, Pablo Ortega, Leo Arriola, Rene Redler, Daniel Klocke, Jenni Kontkanen, and Sebastian Milinski

The Destination Earth Climate Adaptation Digital Twin represents a groundbreaking initiative aimed at achieving operational kilometer-scale global climate simulations for climate adaptation. During Phase 1 (Oct 2022 - Apr 2024), significant technological and scientific advancements have been made, resulting in the production of high-resolution historical (1990-2019, at 10 km) and SP370 scenario (2020-2039, at 5 km) datasets using two state-of-the-art models: IFS-NEMO and ICON.

These high-resolution simulations have demonstrated positive results in capturing extreme precipitation events and provide a realistic representation of the mean climate. The historical simulations outperform the CMIP6 model ensemble across various metrics, as assessed by the Reichler and Kim (2008) Performance Indices. In particular, IFS-NEMO exhibits well-defined precipitation patterns and vertical zonal wind structures, despite a persistent cold temperature bias. Meanwhile, ICON’s simulations - while showing more realistic temperature patterns - are characterized by an overly marked warming rate.

Both ICON and IFS-NEMO biases have been traced to suboptimal initialization strategies and oceanic tuning, both of which are being addressed in preparation for Phase 2. The ongoing efforts aim to refine these models further, enhancing their accuracy and reliability for climate adaptation policies.

How to cite: Davini, P., von Hardenberg, J., Nurisso, M., Caprioli, S., Nazarova, N., Ghosh, S., Wagner, I., Rocha, N., Battle, M., Ortega, P., Arriola, L., Redler, R., Klocke, D., Kontkanen, J., and Milinski, S.: An overview of findings from km-scale simulations of the Destination Earth Climate Adaptation Digital Twin: successes, limitations and future challenges , EGU General Assembly 2025, Vienna, Austria, 27 Apr–2 May 2025, EGU25-9092, https://doi.org/10.5194/egusphere-egu25-9092, 2025.

EGU25-9160 | ECS | Posters on site | CL4.7

Mediterranean extreme precipitation events in storm-resolving NextGEMS Earth System Models 

Paolo Lanteri and Simona Bordoni

This study evaluates the ability of global storm-resolving simulations in reproducing extreme precipitation events (EPEs) over the Mediterranean basin, with a specific focus on the Italian peninsula. We use multi-decadal simulations provided by two coupled models, ICON and IFS-FESOM, both developed under the EU’s Horizon 2020 Next Generation Earth Modelling Systems (NextGEMS) project. Thanks to the synergy between large-scale circulation patterns and km-scale atmospheric dynamics, it is expected that such models better represent precipitation distribution and intensity.

In this work we apply a classification of EPEs based on a set of thermodynamic parameters representative of the regional-scale environmental conditions, following  Grazzini et al. (2020), to classify EPEs over central-northern Italy in three main categories, based on the main uplift mechanism. 

We validate model simulations against the results of Grazzini et al. (2020) based on ArCIS/ERA5 data over central-northern Italy. The analysis is then extended to other Mediterranean regions, providing insights into the models’ capabilities and limitations in capturing extreme events under different large-scale conditions. 

How to cite: Lanteri, P. and Bordoni, S.: Mediterranean extreme precipitation events in storm-resolving NextGEMS Earth System Models, EGU General Assembly 2025, Vienna, Austria, 27 Apr–2 May 2025, EGU25-9160, https://doi.org/10.5194/egusphere-egu25-9160, 2025.

EGU25-9386 | ECS | Posters on site | CL4.7

Scientific developments of IFS-NEMO for Destination Earth’s Climate Adaptation Digital Twin 

Nuno Rocha, Pablo Ortega, Marc Batlle, Ingo Wagner, Kai Keller, Charles Pelletier, Xabier Pedruzo, Thomas Rackow, Tobias Becker, Dmitry Sidorenko, Matteo Nurisso, Silvia Caprioli, Natalia Nazarova, Supriyo Ghosh, and Sebastian Milinski

The Climate Adaptation Digital Twin within the Destination Earth project represents an innovative initiative aimed at achieving operational kilometer-scale global climate simulations to support climate adaptation efforts. Three state-of-the-art Earth System Models (ESMs) are used separately and we are focusing on the scientific advancements and simulation results of the IFS-NEMO model throughout the project's duration.

During the first phase of the project, two main simulations were produced: a historical experiment (1990–2019) at 10 km resolution, and a SSP3-7.0 scenario (2020–2039) at 5 km resolution. Phase 2 aims to enable the operationalization of these simulations. Analysis of phase 1 IFS-NEMO results revealed a notable cold bias in the model’s mean state. To address this issue, a newly tuned version of the model was developed, significantly reducing the cooling trends. Key adjustments to achieve this improvement, first tested at a 25 km resolution version of the model, included refinements to sea-ice parameterization within the NEMO model,  and the introduction of MACv2-SP forcings in IFS, which enabled the representation of time-varying aerosols in the future scenarios. Additional enhancements were made to couple the river runoff to the ocean.

The outcomes of these efforts highlight the potential for substantial advancements in global climate modeling. Looking ahead, the integration of kilometer-scale simulations into operational workflows promises to deliver unprecedented detail and accuracy in climate projections. This will enable more precise assessments of climate impacts and provide critical insights for policymakers and stakeholders striving to implement effective climate adaptation strategies. The continued refinement of the IFS-NEMO model and its components will play a pivotal role in achieving these ambitious goals.

How to cite: Rocha, N., Ortega, P., Batlle, M., Wagner, I., Keller, K., Pelletier, C., Pedruzo, X., Rackow, T., Becker, T., Sidorenko, D., Nurisso, M., Caprioli, S., Nazarova, N., Ghosh, S., and Milinski, S.: Scientific developments of IFS-NEMO for Destination Earth’s Climate Adaptation Digital Twin, EGU General Assembly 2025, Vienna, Austria, 27 Apr–2 May 2025, EGU25-9386, https://doi.org/10.5194/egusphere-egu25-9386, 2025.

EGU25-10848 | ECS | Posters on site | CL4.7

Assessing the impact of anthropogenic aerosols in a kilometer-scale Earth system model 

Philipp Weiss and Philip Stier

Aerosols influence Earth's climate directly by scattering or absorbing radiation and indirectly by serving as nuclei for cloud droplets or ice crystals. Earth system models have significantly improved our understanding of aerosols, clouds, and radiation. The resolution of these models has increased from above 100 kilometers to below 10 kilometers in recent years. With that, important atmospheric processes like deep convective motions are explicitly resolved.

To perform kilometer-scale (km-scale) simulations with the Earth system model ICON-MPIM, we developed the one-moment aerosol module HAM-lite. In HAM-lite, aerosols are represented as an ensemble of log-normal modes with prescribed properties. There are two pure modes, one composed of dust and one composed of sea salt, and two internally mixed modes, both composed of organic carbon, black carbon, and sulfate. The first mixed mode includes aerosols from biomass burning emissions and the second mixed mode includes aerosols from anthropogenic and volcanic emissions. The four modes are transported through the atmosphere and are coupled with various processes such as radiation, convection, and precipitation.

To assess the impact of anthropogenic aerosols, we performed two km-scale simulations over one year with different emission scenarios. The present-day scenario is based on emissions from the Community Emissions Data System (CEDS) and the Global Fire Assimilation System (GFAS). The pre-industrial scenario is based on the historic biomass burning emissions for CMIP6 (BB4CMIP). In both simulations, the sea surface temperature and sea ice are prescribed with the boundary conditions of AMIP, and the initial conditions of the atmosphere and land are derived from the operational analysis of ECMWF. Based on these two scenarios, we analyze how anthropogenic aerosols interact with radiation and clouds over one year. 

How to cite: Weiss, P. and Stier, P.: Assessing the impact of anthropogenic aerosols in a kilometer-scale Earth system model, EGU General Assembly 2025, Vienna, Austria, 27 Apr–2 May 2025, EGU25-10848, https://doi.org/10.5194/egusphere-egu25-10848, 2025.

Mesoscale convective systems are a crucial feature in Sahel, a water vulnerable semi-arid region in West Africa. Observational studies have shown that they are responsible for bringing approximately 90% of the rainfall during the summer monsoon season, and play an especially important role in extreme rainfall events. Despite of their important impacts on society and climate, traditional general circulation models, with their coarse horizontal resolution and parameterized convection schemes, struggle to properly simulate these organized convective systems. However, the newer generation of km-scale convection-permitting climate models have been shown to much more accurately capture the characteristics of mesoscale convective systems, showing great potential for studies of future climate change in vulnerable regions such as the Sahel.

In this study we analyze the latest simulations run with IFS and ICON within the NextGEMS project, with a horizontal resolution up to 9 km. Using a lagrangian tracking algorithm to identify the mesoscale convective systems, we investigate how they and their related weather are represented in the models, how well they scale in strength with known amplifying factors and if any trends can be identified in the simulation.

How to cite: Berntell, E.: Representation of West African mesoscale convective systems in NextGEMS km-scale simulations, EGU General Assembly 2025, Vienna, Austria, 27 Apr–2 May 2025, EGU25-10993, https://doi.org/10.5194/egusphere-egu25-10993, 2025.

EGU25-11001 | ECS | Orals | CL4.7

Unveiling global haboob behavior with a kilometer-scale aerosol-climate model 

Rumeng Li, Philipp Weiss, Andreas Baer, Carlos Pérez García-Pando, Philip Stier, and Martina Klose

Haboob dust storms, formed by the cold pool outflow from moist convection, play a significant role in global dust emissions. However, they are largely absent in current global climate models, as most do not explicitly resolve convection processes, leading to considerable inaccuracies in modeling global dust and its impacts. Therefore, the global influence of haboobs on the dust cycle and the Earth system remains poorly understood. With the advent of kilometer-scale Earth system models, there is a unique opportunity to unveil the global haboob behavior and advance our understanding of their impacts.

In this study, we implemented physics-based dust emission schemes in the ICON-HAM-lite model, a new kilometer-scale Earth system model developed in the nextGEMS project. A one-year model simulation was conducted globally at a 5 km resolution including online dust simulation. A haboob detection algorithm was developed and applied to track haboobs, allowing us to analyze their global characteristics and variability. This includes their spatial distribution, seasonal and diurnal cycles, duration, and size. Additionally, the contribution of haboobs to global dust emissions was evaluated.

This study provides what is, to our knowledge, the first comprehensive analysis of haboobs on a global scale based on the current literature, shedding light on their critical role in the global dust cycle. These findings highlight the benefits of using global kilometer-scale models, specifically emphasizing their potential to improve dust simulation accuracy in climate models by explicitly including convection.

How to cite: Li, R., Weiss, P., Baer, A., Pérez García-Pando, C., Stier, P., and Klose, M.: Unveiling global haboob behavior with a kilometer-scale aerosol-climate model, EGU General Assembly 2025, Vienna, Austria, 27 Apr–2 May 2025, EGU25-11001, https://doi.org/10.5194/egusphere-egu25-11001, 2025.

EGU25-11145 | ECS | Posters on site | CL4.7

Assessing the impacts of climate change in Iberian mountains using the NextGEMS km-scale global climate simulations 

Diego García-Maroto, Luis Durán, Elsa Mohino, and Álvaro González-Cervera

Mountain areas play a pivotal role in the hydrological cycle of vast regions of the world, largely due to local processes such as orographic precipitation and the presence of seasonal or permanent snow cover. In the context of climate change, some of these processes are expected to be disrupted causing significant impacts to local ecosystems and nearby populations. This is particularly relevant for regions like the Iberian Peninsula, where the development of a persistent winter-spring snowpack confined to the various medium sized mountain ranges is key to offsetting water deficits during the dry summer season. Knowing the future climate of these mountains is therefore vital both for water resource management and for economic interests.

However, these mountain ranges are often characterized by medium heights and a small horizontal extent, making them very difficult to represent in most conventional coarse resolution global climate models and demanding thus the use of regional to local dynamical and statistical downscaling methods. Considering this, the new km-scale global climate simulations developed in the context of the European H2020 NextGEMS project and other similar initiatives may open up unprecedented opportunities to readily study future impacts of climate changes on these regions. These models allow the representation of local and regional processes while retaining the benefits of homogeneous global simulations. 

The present study firstly evaluates the capacity of historical km-scale simulations (1990-2019) to represent the climate of the main mountainous areas of the Iberian Peninsula, with a particular emphasis on variables impacting seasonal snow cover which are compared with different historical data sources, including local observations, reanalyses and satellite observations. We show a fairly acceptable agreement between the model climatology and regional reanalysis products specially for the annual number of days with snow cover. Regarding snow depth, however, the model shows a small positive bias in all regions except Sierra Nevada, where it has a negative bias. Following the assessment of potential model biases, the differences between the historical climatology and a 2020-2049 projection under scenario SSP3-7.0 are analysed. Among others, we show that in the projection significant decreasing trends are present in most snow cover metrics for all the considered mountain regions, even though they are more extreme at Sierra Nevada, where a significant reduction of total winter precipitation is also present. 

How to cite: García-Maroto, D., Durán, L., Mohino, E., and González-Cervera, Á.: Assessing the impacts of climate change in Iberian mountains using the NextGEMS km-scale global climate simulations, EGU General Assembly 2025, Vienna, Austria, 27 Apr–2 May 2025, EGU25-11145, https://doi.org/10.5194/egusphere-egu25-11145, 2025.

EGU25-11236 | ECS | Posters on site | CL4.7

The ICON-ParFlow coupling: Integrating a continental-scale hydrological model into an Earth system model 

Jan Weinkaemmerer, Reiner Schnur, Klaus Goergen, and Stefan Kollet

3D prognostic groundwater flow on a global scale is currently lacking in Earth system models. In order to prepare Earth system models for kilometer-scale simulations with integrated continental hydrology, the ParFlow hydrological model has been coupled to the land model of the ICON modelling framework. Global simulations of atmosphere and land were conducted with a two-way coupling between ParFlow and the soil hydrological scheme of ICON-Land over the Pan-European region. In this first configuration, ParFlow and ICON-Land exchange surface moisture fluxes and liquid soil water. Analyzing simulations covering the extended summer months, it is found that the coupling with ParFlow significantly reduces the soil-water variability in the deeper soil layers by resolving actual shallow aquifers. In ParFlow, surface runoff and infiltration are more physical resulting in a more realistic response of soil moisture to weather patterns on longer time scales. Correlations of soil moisture with surface latent heat flux and atmospheric moisture transport show that this results regionally in an increased land-atmosphere coupling strength. Also, the lateral flow of near-surface groundwater, which is intrinsically linked to the formation of river networks, influences atmospheric variables related to cloud formation by increasing their horizontal heterogeneity. Apart from these results, which demonstrated the importance of an integrated hydrological model for shallow groundwater in Earth system modelling, first results of high-resolution coupled simulations with an extended ParFlow coverage on a latitude belt over the tropical zone at 1 km resolution are presented. 

How to cite: Weinkaemmerer, J., Schnur, R., Goergen, K., and Kollet, S.: The ICON-ParFlow coupling: Integrating a continental-scale hydrological model into an Earth system model, EGU General Assembly 2025, Vienna, Austria, 27 Apr–2 May 2025, EGU25-11236, https://doi.org/10.5194/egusphere-egu25-11236, 2025.

EGU25-11601 | Orals | CL4.7

Are global km-scale climate models becoming indistinguishable from observations? 

Lukas Brunner, Rohit Ghosh, Leopold Haimberger, Cathy Hohenegger, Dian Putrasahan, Thomas Rackow, Reto Knutti, Aiko Voigt, and Jana Sillmann

Simulating global climate has been a challenge and aspiration ever since the advent of numerical modeling. Today, global climate models have become essential tools to understand the climate system, project future changes, and inform mitigation and adaptation decisions. In that, they build on a long history of development, from the first attempts to couple atmospheric and ocean models in the late 1960s, to the emergence of Earth system models in the 2000s, and the development of the first km-scale models today.

In this talk, we show that the latest models provide global climate information with previously unprecedented accuracy. The two next-generation km-scale models included in our analysis (ICON Sapphire and IFS) even simulate temperature fields indistinguishable from observation-based references for the first time. We place this step-change in model fidelity in the context of nine observation-based datasets (20CR, ERA40, ERA-Interim, ERA5, JRA55, MERRA, MERRA2, NCAR-NCEP) and over 150 global climate models developed over the past three decades (from CMIP2 to CMIP6) in an extensive model evaluation. Based on this comparison, we discuss emerging challenges for model evaluation as the choice of the reference dataset starts to dominate model error for the latest models. 


How to cite: Brunner, L., Ghosh, R., Haimberger, L., Hohenegger, C., Putrasahan, D., Rackow, T., Knutti, R., Voigt, A., and Sillmann, J.: Are global km-scale climate models becoming indistinguishable from observations?, EGU General Assembly 2025, Vienna, Austria, 27 Apr–2 May 2025, EGU25-11601, https://doi.org/10.5194/egusphere-egu25-11601, 2025.

Here we investigate tropical precipitation biases in the novel kilometer-scale Earth system models (ICON and IFS) developed by the EU-funded H2020 nextGEMS project. Despite the much higher resolution, these km-scale models still feature biases that are common to CMIP models: first, tropical precipitation is systematically overestimated. Second, the double ITCZ (Intertropical Convergence Zone) bias is not ameliorated, with too little rain falling close to the Equator and too much rain in the southern branch relative to the northern branch. The double ITCZ bias is consistent with Hadley circulations that feature secondary cells close to the equator. Third, both the northern and the southern ITCZ branches are displaced poleward relative to observations. 

Focusing on the tropical precipitation distribution, we more explicitly quantify existing biases through a symmetric and an antisymmetric precipitation index. Leveraging the well-established atmospheric energy balance framework, we show how hemispherically symmetric biases are positively corellated with biases in the equatorial net energy input (NEI), once any residual in its global average is removed. In both models, equatorial NEI biases primarily arise from surface latent heat fluxes. Hemispherically antisymmetric biases are instead negatively correlated with the cross-equatorial atmospheric energy transport, which is in turn linked to biases in the NEI hemispheric asymmetry. The leading sources of asymmetric biases are top-of-atmosphere radiative fluxes in IFS and surface radiative fluxes in ICON.

Finally, although we find that notorious GCM precipitation biases are not mitigated when employing km-scale grids, we also see that the atmospheric energy balance holds great potential for improving tropical precipitation patterns. In this regard key candidates for improving the energy balance are surface flux schemes, particularly for latent heat over the oceans, and cloud-radiative effects. 

How to cite: Müller, S. K. and Bordoni, S.: Understanding tropical precipitation biases in kilometer-scale global climate models using the atmospheric energy balance framework, EGU General Assembly 2025, Vienna, Austria, 27 Apr–2 May 2025, EGU25-11818, https://doi.org/10.5194/egusphere-egu25-11818, 2025.

EGU25-12756 | ECS | Posters on site | CL4.7

Comparing biases in the earth system model ICON-ESM-ER with its predecessor MPI-ESM-ER 

Chathurika Wickramage, Jürgen Kröger, and Fabian Wachsmann

The resolution of climate models significantly influences their ability to simulate physical processes and reduce biases, especially in oceanic and atmospheric systems. The Eddy-Rich Earth System Models (EERIE) project focuses on developing next-generation Earth System models at kilometer-scale resolution. In this study, we compare the control simulations of one of the EERIE models, the ICOsahedral Non-hydrostatic Earth System Model (ICON-ESM-ER), with those of its eddy-rich predecessor, the Max Planck Institute Earth System Model (MPI-ESM-ER). The ICON-ESM-ER features a 5 km ocean resolution coupled with a 10 km atmospheric resolution, while the MPI-ESM-ER employs a 10 km ocean resolution and a 100 km atmospheric resolution. Additionally, the ICON-ESM-ER uses an unstructured icosahedral grid, whereas the MPI-ESM-ER is based on a tripolar curvilinear grid. As models gradually move to finer spatial resolution, we naturally expect to improve simulations of atmospheric and oceanic flows. However, things become particularly interesting when new thresholds are crossed, as it enables the explicit simulation of previously unresolved phenomena. This can also introduce new complexities and challenges. The analysis reveals distinct differences in biases between the two models. For instance, focusing on the Southern Ocean, ICON-ESM-ER exhibits overall warmer biases than its predecessor MPI-ESM-ER and shows very large positive dynamic sea level biases. Additionally, ICON-ESM-ER produces large positive zonal surface wind biases in this region. On a more positive note, the sea surface salinity biases in the South Atlantic and Indian Ocean are negligible in ICON-ESM-ER. The ICON-ESM-ER does not outperform MPI-ESM-ER and, in some cases, introduces larger biases in key climate variables. Understanding these biases, particularly in comparison to its predecessor, is essential to guide future model development and improve the representation of critical processes in the Earth system.

How to cite: Wickramage, C., Kröger, J., and Wachsmann, F.: Comparing biases in the earth system model ICON-ESM-ER with its predecessor MPI-ESM-ER, EGU General Assembly 2025, Vienna, Austria, 27 Apr–2 May 2025, EGU25-12756, https://doi.org/10.5194/egusphere-egu25-12756, 2025.

EGU25-13120 | ECS | Posters on site | CL4.7

Discovering convection biases in global km-scale climate models using computer vision 

Lilli Freischem, Philipp Weiss, Hannah Christensen, and Philip Stier

Convective clouds are a key component of the climate system, impacting the hydrological cycle, and leading to the redistribution of heat, moisture, and momentum. Traditional low-resolution climate models rely on parameterisations to represent convection and thus struggle to realistically capture convective processes. In contrast, km-scale models can directly simulate deep convection, improving the accuracy of cloud and precipitation fields. However, significant uncertainties remain, due to parameterisations of remaining unresolved subgrid-scale processes, which must be addressed.

Traditional model evaluation methods rely on aggregated spatial and temporal statistics, which overlook the fine-grained details critical to understanding the physical processes underlying convection. In addition, conventional dimensionality reduction techniques (e.g., principal component analysis) cannot capture the non-linear relationships of small-scale physical processes.

To address these limitations, we use computer vision models to learn meaningful low-dimensional embeddings of outgoing longwave radiation (OLR) fields and evaluate km-scale models in this new embedding space. More specifically, we use contrastive learning, a self-supervised technique that trains machine learning models to distinguish between similar and dissimilar data points, to train a deep neural network to generate compact representations of OLR fields.

We present results from a case study evaluation of two km-scale models, the Integrated Forecasting System (IFS) and the Icosahedral Nonhydrostatic Model (ICON), developed as part of the nextGEMS project. The simulations are compared to observations from the Geostationary Operational Environmental Satellites (GOES-16). We quantitatively assess the realism of km-scale models by comparing the embedding distributions of models and observations using vector quantisation. Finally, we use explainability methods to identify key factors influencing the accuracy of simulated convection. Our results highlight the value of our approach in understanding and improving the performance of high-resolution climate models, contributing to more reliable climate projections at finer spatial scales.

How to cite: Freischem, L., Weiss, P., Christensen, H., and Stier, P.: Discovering convection biases in global km-scale climate models using computer vision, EGU General Assembly 2025, Vienna, Austria, 27 Apr–2 May 2025, EGU25-13120, https://doi.org/10.5194/egusphere-egu25-13120, 2025.

EGU25-15682 | Orals | CL4.7

Tales of Storms: Climate Storylines of Extreme Precipitation Events in Autumn 2024 

Thomas Jung, Amal John, Sebastian Beyer, Marylou Athanase, Antonio Sanchez Benitez, Helge Gößling, and Jan Wehner

The autumn of 2024 witnessed a series of extreme precipitation events that caused widespread impacts, highlighting the importance of investigating the role of climate change in impacting these phenomena. This study employs novel kilometre-scale (km-scale) storyline simulations using the IFS-FESOM coupled climate model to examine three major events—Hurricane Helene in the United States, severe flooding in Valencia, Spain, and Storm Boris that brought extreme precipitation to Central and Eastern Europe—under preindustrial, present-day, and future climate forcings. By nudging the evolution of large-scale atmospheric dynamics to ERA5, the storyline approach isolates thermodynamic changes due to anthropogenic warming while maintaining consistency with the observed event structures. The km-scale resolution enables a detailed representation of topographical influences, local-scale processes such as moisture convergence, and convective dynamics, providing critical insights into how the intensity, spatial distribution, and other characteristics of heavy precipitation may unfold in different climates. This study lays the foundation for a comprehensive set of storylines of high-impact extreme precipitation events, offering actionable information for decision-makers and increasing public understanding of the impact of climate change on extreme weather risks.

How to cite: Jung, T., John, A., Beyer, S., Athanase, M., Sanchez Benitez, A., Gößling, H., and Wehner, J.: Tales of Storms: Climate Storylines of Extreme Precipitation Events in Autumn 2024, EGU General Assembly 2025, Vienna, Austria, 27 Apr–2 May 2025, EGU25-15682, https://doi.org/10.5194/egusphere-egu25-15682, 2025.

EGU25-17342 | Orals | CL4.7

A global-regional hierarchy approach to exploring upscale processes in km-scale Earth System models 

Huw Lewis, Richard Jones, Sally Lavender, Claudio Sanchez, Dasha Shchepanovska, and Calum Scullion

Exploitation of more powerful supercomputers has unlocked the potential to run kilometre-grid scale global simulations. Reaching convection-permitting resolution has been highlighted as a means to both transform local-scale weather prediction and reduce long-standing biases in global climate models. The dynamical downscaling benefits of delivering convection-permitting predictions, have been long established for weather and climate applications. Explicitly representing many of the key dynamical convective processes leads to better representation of several aspects of the mesoscale phenomena that lead to high impact weather than is achievable in coarser grid-scale models which require convection to be fully parametrized. GSRM potentially unlock representation of this upscale interaction within models, not currently simulated in global models in which the influence of convection is parametrized, or in nested limited-area models in which smaller scales do not feedback onto the general circulation. By doing so, it is hypothesized that long-standing model biases, such as in large-scale circulations and their effect on global precipitation patterns, might be resolved or reduced.

In the UK, Met Office and university partner K-Scale research has been focussed on assessment of this upscale hypothesis. A traceable global-regional model hierarchy has therefore been established, exploiting the Unified Model seamless modelling framework and model development foundations. The hierarchy spans global and limited area atmosphere-only simulations across a range of grid resolutions and model physics. We exploit the hierarchy to demonstrate the influence of upscale processes on the predicted strength and variability of upper-level winds. Enabling upscale growth in our simulations results in a relative strengthening of the tropical easterly jet. Over S. America, there is evidence of a weakening of the westerly jet over the eastern Pacific and stronger easterlies over the tropical Atlantic in vicinity of the Atlantic ITCZ. Over SE Asia, there is a general strengthening of upper-level easterly winds.

We describe the further evaluation of the hierarchy, including its sensitivity to model physics choices, in the context of new year-long simulations adopting the DYAMOND3 protocol, and discuss plans and challenges of how the Met Office is looking to apply Earth system models at km-scale in the context of evolving operational NWP, climate research and machine learning capability and service development.

How to cite: Lewis, H., Jones, R., Lavender, S., Sanchez, C., Shchepanovska, D., and Scullion, C.: A global-regional hierarchy approach to exploring upscale processes in km-scale Earth System models, EGU General Assembly 2025, Vienna, Austria, 27 Apr–2 May 2025, EGU25-17342, https://doi.org/10.5194/egusphere-egu25-17342, 2025.

As the climate continues to warm, hydrometeorological extremes are extracting a greater toll from society both economically and socially. The need for accurate extreme event projections during acute dry spells was recently highlighted by the January 2025 devastating wildfires in the Los Angeles region. Current CMIP-style global climate models broadly project an increasing frequency and intensity of heavy precipitation and drought. However, the relatively coarse resolution, lack of ocean-atmosphere coupling, and parameterization of convection means they do not capture the spatial heterogeneity and mesoscale processes of complex coasts and topography relevant for simulating extreme events which often introduces model biases.

The ongoing H2020 Next Generation Earth Modelling Systems (nextGEMS) project aims to address these issues with the development of convection-permitting, fully-coupled, Earth-system models. Using the ECMWF Integrated Forecast System (IFS) and Icosahedral Nonhydrostatic Weather and Climate Model (ICON), we examine detailed dry spell characteristics in the Mediterranean region of Europe and then expand our analysis globally. These results are compared against a suite of observations (station and satellite based), reanalysis datasets, and CESM2 simulations.

Using ICON and IFS with about 6 km and 4 km spatial resolution, respectively over a five-year period in the Mediterranean, we find the increased resolution and hybrid/explicit representation of convection improves the representation of dry hour frequency and alleviated the long-standing drizzle bias observed in many GCMs, here illustrated for CESM2. For simulating the maximum length of dry spells over land, switching off the convective parameterization scheme in ICON improves accuracy with similar dry spell lengths as observations and reanalysis. However, the annual maximum length of dry spells over the sea for both ICON and IFS is excessive by 30-50 days. The depiction of dry spells in the Mediterranean region is representative of the nextGEMS’ models performance across the whole mid-latitudes. Ongoing research using recently developed 30-year transient ICON and IFS simulations (2020-2050) looks to investigate how dry extremes evolve globally in a warming world.

How to cite: Wille, J. and Fischer, E.: Dry spell representation on regional and global scale using convection-permitting models within the nextGEMS project, EGU General Assembly 2025, Vienna, Austria, 27 Apr–2 May 2025, EGU25-17833, https://doi.org/10.5194/egusphere-egu25-17833, 2025.

EGU25-18012 | ECS | Posters on site | CL4.7

4.4-km global climate projections with IFS-FESOM 

Sebastian Beyer, Thomas Rackow, Dmitry Sidorenko, Nikolay Koldunov, Amal John, Rohit Ghosh, Jan Streffing, Suvarchal Kumar Cheedela, Maqsood Mubarak Rajput, Miguel Andrés-Martínez, Mohammed Hussam Al Turjman, Razvan Aguridan, Matteo Nurisso, Jan Wehner, and Thomas Jung

We present the current IFS-FESOM model configuration of the Destination Earth (DestinE) project, which we used to compute a coupled climate projection (SSP-3.70) from 2020 to 2040 with unprecedented storm-resolving resolution. The atmospheric resolution of 4.4 km allows us to replace previously necessary parametrizations with explicitly resolved atmospheric dynamics. The unstructured NG5 ocean mesh, which locally reaches below 5 km resolution, resolves mesoscale ocean eddies and sea ice leads.

IFS-FESOM consists of the Integrated Forecasting System (IFS, developed by ECMWF) coupled to the Finite Volume Sea Ice-Ocean Model FESOM2. It utilizes the IO-server and post-processing toolkit multIO, providing hourly outputs and statistical processing of numerous variables. It also takes advantage of recent improvements to the IFS, including enhanced representations of snow and land use, as well as a dedicated scheme for urban areas and cities worldwide.

We present initial results from analyzing the simulation, addressing technical challenges and scientific questions related to running km-scale simulations over multiple decades.

How to cite: Beyer, S., Rackow, T., Sidorenko, D., Koldunov, N., John, A., Ghosh, R., Streffing, J., Cheedela, S. K., Rajput, M. M., Andrés-Martínez, M., Al Turjman, M. H., Aguridan, R., Nurisso, M., Wehner, J., and Jung, T.: 4.4-km global climate projections with IFS-FESOM, EGU General Assembly 2025, Vienna, Austria, 27 Apr–2 May 2025, EGU25-18012, https://doi.org/10.5194/egusphere-egu25-18012, 2025.

EGU25-18760 | Orals | CL4.7

Eddy activity in the high-latitude Southern Ocean and its response to climate change 

Nathan Beech, Thomas Rackow, Tido Semmler, and Thomas Jung

Eddy activity in the high-latitude Southern Ocean is linked to critical drivers of the global climate such as Antarctic Bottom Water (AABW) formation, seasonal sea ice cover, and shoreward heat transport. Yet, no comprehensive description of eddy activity poleward of the Antarctic Circumpolar Current (ACC) exists and the mesoscale processes in the region are missing from virtually all major projections of climate change. Using a high-resolution ocean model and cost-reducing simulation design, eddy activity in the high southern latitudes is characterized with unprecedented detail, including 3-dimensional spatial distribution and characteristics, unobstructed information beneath sea ice, and projections of future conditions after prolonged anthropogenic warming. A rich mesoscale field is detected, with eddy activity closely linked to large-scale circulation features like gyres and the Antarctic Slope Current. Eddy activity exhibits a strong seasonal cycle in which the presence of sea ice decreases the eddy population and increases the proportion of anticyclones. Anthropogenic warming is projected to increase the eddy population, particularly in winter. Projected impacts of climate change are regionally diverse; ACC eddy activity shifts poleward, Antarctic Slope Current eddy activity intensifies, and the seasonal cycle affecting the eddy population and rotational direction is reduced.

How to cite: Beech, N., Rackow, T., Semmler, T., and Jung, T.: Eddy activity in the high-latitude Southern Ocean and its response to climate change, EGU General Assembly 2025, Vienna, Austria, 27 Apr–2 May 2025, EGU25-18760, https://doi.org/10.5194/egusphere-egu25-18760, 2025.

EGU25-20426 | Posters on site | CL4.7

Regionally focused aerosol-climate modelling at kilometer scale 

Anne Kubin, Bernd Heinold, Philipp Weiss, Philip Stier, and Ina Tegen

Aerosol particles from natural and anthropogenic sources play an important role in the Earth's climate through their interactions with radiation and clouds. However, the underlying mechanisms and their climate impacts remain poorly understood. Kilometer-scale high-resolution climate simulations provide a powerful tool to tackle these uncertainties and reveal new details about the effects of aerosols, e.g., on moist convective clouds and fine-scale atmospheric dynamics. Recently, the reduced-complexity aerosol module HAM-lite was developed for global simulations within the ICON-MPIM Earth system model. While based on the proven but complex aerosol module HAM, HAM-lite represents aerosols as a group of logarithmic-normal modes with predefined sizes and compositions. It uses one mode each for pure dust and sea salt particles, and two internally mixed modes with organic carbon, black carbon, and sulfate. Now, this coupled model system has been further advanced to support limited-area mode (LAM) applications, enabling faster, targeted simulations of specific source and target regions and their associated aerosol processes.

We showcase the enhanced capability of ICON-MPIM and HAM-lite through LAM case studies. Regional simulations are performed at a resolution of approximately 2.5 kilometers over several months, using AMIP boundary conditions for sea surface temperature and sea ice. Initial and lateral boundary conditions for the atmosphere are sourced from ECMWF operational analysis, while aerosol boundary data are derived from either the Copernicus Atmosphere Monitoring Service reanalysis (EAC4 CAMS) or global ICON-MPIM-HAM-lite simulations. In this study, we present LAM applications for case studies of air pollution in Central Europe and Eastern Australia, densely populated regions with extensive aerosol measurement networks for model evaluation in the northern and southern hemispheres, respectively. Further analyses include aerosol processes at high-latitudes in the Fram Strait-Svalbard Arctic region, investigating the effects of sea ice on sea-spray emissions and polar air mass exchange; and low-latitude events in West Africa, focusing on the transport and impacts of dust and biomass burning smoke on regional climate and air quality.

How to cite: Kubin, A., Heinold, B., Weiss, P., Stier, P., and Tegen, I.: Regionally focused aerosol-climate modelling at kilometer scale, EGU General Assembly 2025, Vienna, Austria, 27 Apr–2 May 2025, EGU25-20426, https://doi.org/10.5194/egusphere-egu25-20426, 2025.

EGU25-872 | ECS | Posters on site | CL4.8

A new orographic drag parameterization package for the GLOBO model: implementation and evaluation  

Guido Davoli, Daniele Mastrangelo, Annalisa Cherchi, and Andrea Alessandri

Orography plays a fundamental role in shaping the atmospheric circulation and affects key atmospheric processes. Therefore, weather and climate models must adequately represent its effects to obtain accurate predictions. Since all orographic scales are found to influence the atmospheric flow, the parameterization of unresolved orographic drag has been recognized as crucial to simulate a realistic mid-latitude circulation. Moreover, in the last few years, it has become clear that orographic gravity wave drag (OGWD) and turbulent orographic form drag (TOFD) parameterization schemes play a crucial role in reducing some of the long-standing circulation biases affecting climate models. However, they are still considered a potential source of errors, due to the uncertainties which affect some poorly constrained physical parameters. Furthermore, these schemes need boundary conditions suitable to characterize the physical features of sub-grid orography. The strategies for the generation of such boundary conditions can vary a lot between different modelling centres, and it has been shown to be an important source of uncertainty. 

GLOBO is a global atmospheric general circulation model developed at the Institute for Atmospheric Science and Climate of the Italian National Research Council (ISAC-CNR). It is currently in use within many operational frameworks, including a global monthly probabilistic forecast system that contributes to the Subseasonal-to-seasonal (S2S) project database. In an effort to improve and modernize the model, we implemented a novel orographic drag parameterization package, based on state-of-the-art OGWD and TOFD schemes. Simultaneously with the development of the orographic drag parameterizations, we developed a novel software package, OROGLOBO (OROGraphic ancillary files generator for GLOBal atmospheric mOdels) designed for the generation of the orographic boundary conditions. This unique open-source tool is designed to exploit a state-of-the-art, high resolution global Digital Elevation Model to generate boundary conditions for OGWD and TOFD schemes, gathering the main algorithms and techniques available in the literature in a single software. 

Here, we present the results of this model update. A new set of retrospective forecasts was performed, consisting of an 8-members ensemble, initialized every 5 days and integrated for 35 days, during the period 2001-2020, including the developments in orographic physical parameterization and boundary conditions. This set of simulations is compared to the corresponding hindcasts set performed with the standard model configuration and used to calibrate the operational ensemble of global sub-seasonal probabilistic forecasts. We evaluate the impact of the improved representation of unresolved orographic drag on the simulation and prediction of the Northern Hemisphere mid-latitudes circulation. We assess the change in prediction skill for atmospheric blocking events and associated extreme temperature and wind conditions. 

How to cite: Davoli, G., Mastrangelo, D., Cherchi, A., and Alessandri, A.: A new orographic drag parameterization package for the GLOBO model: implementation and evaluation , EGU General Assembly 2025, Vienna, Austria, 27 Apr–2 May 2025, EGU25-872, https://doi.org/10.5194/egusphere-egu25-872, 2025.

EGU25-1040 | ECS | Orals | CL4.8

Understanding Soil Modulation of Drought Persistence in CMIP6 Models 

Marco Possega, Emanuele Di Carlo, Vincenzo Senigalliesi, and Andrea Alessandri

 Drought persistence is a critical factor in assessing water availability and its impacts on agriculture, ecosystems, and society. In this respect, poorly constrained soil properties in climate models such as field capacity – i.e. the maximum water a soil can retain after drainage of excess moisture – may strongly affect severity and persistence of simulated soil drought conditions. This study examines for the first time the regulating role of soil properties, particularly of field capacity, in shaping drought memory and its broader impacts. Using the CMIP6 multi-model ensemble and observations, we analyze drought dynamics across various phases of the hydrological cycle applying non-parametric standardized indices: Standardized Precipitation Index (precipitation deficits), Standardized Precipitation-Evapotranspiration Index (precipitation-evapotranspiration balance), Standardized Soil Moisture Index (soil moisture deficits), and Standardized Runoff Index (reduced runoff). Our analysis investigates the persistence between hydrological drought indicators, showing that soils with greater field capacity sustain drought conditions longer, emphasizing the importance of accurately modeling soil properties to capture drought persistence effectively. The historical CMIP6 simulations are compared with observational datasets, including GLEAM and CRU, to assess the deviation between model outputs and observed climate conditions. The future scenarios (SSP126, SSP245, SSP370, SSP585) are also examined, revealing significant regional differences in projected drought behavior depending on the degree of radiative-forcing increase during 21st century. High-emission scenarios project prolonged drought conditions due to increased temperatures and evapotranspiration feedback, while low-emission pathways are effective in preserving more stable hydrological dynamics. Our results show that, in water limited and transition areas such as the Euro-Mediterranean region, the persistence of droughts and its projected change considerably depend on the modeled field capacity. This study highlights the essential role of field capacity and other soil characteristics in regulating the variability and the persistence of drought events. By bridging historical validation with future projections, it provides a comprehensive understanding of drought dynamics and trends, also identifying observational constraints for the Earth System Models. These findings are crucial for refining predictions of agricultural and hydrological drought impacts and for guiding adaptation strategies in water-limited regions that are vulnerable to drought exacerbation under climate change.

How to cite: Possega, M., Di Carlo, E., Senigalliesi, V., and Alessandri, A.: Understanding Soil Modulation of Drought Persistence in CMIP6 Models, EGU General Assembly 2025, Vienna, Austria, 27 Apr–2 May 2025, EGU25-1040, https://doi.org/10.5194/egusphere-egu25-1040, 2025.

EGU25-1545 | Posters on site | CL4.8

Sub-seasonal to Seasonal Arctic Summer Sea Ice Forecasts Using Dynamical Downscaling with the Regional Arctic System Model 

Younjoo Lee, Wieslaw Maslowski, Anthony Craig, Jaclyn Clement Kinney, and Robert Osinski

The Arctic region has been warming at a rate significantly faster than the global average, leading to an accelerated decline in sea ice. This trend is expected to continue, potentially resulting in a "low-ice regime," which could make sea ice conditions more unpredictable. Anticipating changes in Arctic sea ice and climate states is therefore crucial for guiding various human activities, from natural resource management to risk assessment decisions. While global climate and Earth system models project continuous sea ice decline over decadal time scales, achieving reliable seasonal forecasts remains challenging. To address this, we apply dynamical downscaling with the state-of-the-art Regional Arctic System Model (RASM), which enables us to forecast Arctic sea ice on time scales ranging from weeks to six months. RASM is a fully coupled regional climate model that integrates components for the atmosphere, ocean, sea ice, and land, interconnected through the flux coupler of the Community Earth System Model. In our study, we simulate RASM at a horizontal resolution of 1/12 degree (approximately 9 km) for both the ocean and sea ice, with 45 vertical levels in the ocean and five thickness categories for sea ice. The atmosphere is configured on a 50-km grid with 40 vertical levels, dynamically downscaled from the NOAA/NCEP Climate Forecasting System version 2 (CFSv2) at 72-hour intervals for the upper half of the atmosphere. Monthly ensemble forecasts extending up to six months are generated using initial conditions derived from a fully-coupled RASM hindcast simulation without bias correction and assimilation. This presentation highlights results for September sea ice predictions initialized on April 1, May 1, June 1, July 1, August 1, and September 1, covering pan-Arctic and regional sea ice spatio-temporal conditions from 2012 to 2021. Specifically, we examine how lead time and initial conditions affect the quantitative skill of seasonal predictability for Arctic sea ice and demonstrate skillful predictions of September sea ice up to six months in advance. Overall, our study underscores that enhancing model physics and obtaining more realistic initial conditions are crucial for achieving skillful sub-seasonal to seasonal predictions.

How to cite: Lee, Y., Maslowski, W., Craig, A., Clement Kinney, J., and Osinski, R.: Sub-seasonal to Seasonal Arctic Summer Sea Ice Forecasts Using Dynamical Downscaling with the Regional Arctic System Model, EGU General Assembly 2025, Vienna, Austria, 27 Apr–2 May 2025, EGU25-1545, https://doi.org/10.5194/egusphere-egu25-1545, 2025.

EGU25-1847 | Orals | CL4.8

AI deep learning for climate forecasts 

Jing-Jia Luo

AI deep learning for climate science has attracted increasing attentions in recent years with rapidly expanded applications to many areas. In this talk, I will briefly present our recent progresses on using various deep learning methods for seasonal-to-multi-seasonal predictions of ENSO, the Indian Ocean Dipole (IOD), summer precipitation in China and East Africa, Arctic sea ice cover, ocean waves, as well as the bias correction and downscaling of dynamical model’s forecasts. The results suggest that many popular deep learning methods, such as convolutional neural networks, residual neural network, long-short term memory, ConvLSTM, multi-task learning, cycle-consistent generative adversarial networks and vision transformer, can be well applied to improve our understanding and predictions of climate. In addition, a brief introduction of AI large models for ensemble weather-subseasonal-seasonal-decadal forecasts, together with the perspective on the future development of AI methods, will also be presented.

How to cite: Luo, J.-J.: AI deep learning for climate forecasts, EGU General Assembly 2025, Vienna, Austria, 27 Apr–2 May 2025, EGU25-1847, https://doi.org/10.5194/egusphere-egu25-1847, 2025.

EGU25-2210 | ECS | Posters on site | CL4.8

The role of Pacific Tropical Instability Wave in Sub-Seasonal SST predictability  

Li Tianyan, Yu Yongqiang, and Zhen Weipeng

Tropical Instability Waves (TIWs) play a crucial role in modulating Sea Surface Temperature (SST) variability in tropical oceans, yet their representation in current forecast systems remains challenging. This study investigates the relationship between TIWs and sub-seasonal SST predictability while evaluating the performance limitations of the Licoms Forecast System. Through comprehensive analysis of observational data and model outputs, we demonstrate that TIWs provide significant potential for enhancing sub-seasonal SST forecast skill through their regular wave patterns and predictable evolution characteristics. However, our findings reveal that the current Licoms forecast systems systematically underestimate both TIW intensity and wavelength. Critical examination of error sources indicates that these deficiencies primarily originate from initialization fields rather than model physics or dynamics. 

How to cite: Tianyan, L., Yongqiang, Y., and Weipeng, Z.: The role of Pacific Tropical Instability Wave in Sub-Seasonal SST predictability , EGU General Assembly 2025, Vienna, Austria, 27 Apr–2 May 2025, EGU25-2210, https://doi.org/10.5194/egusphere-egu25-2210, 2025.

EGU25-3974 | Orals | CL4.8

Increased multi-year ENSO predictability under greenhouse gas warming accounted by large ensemble simulations and deep learning 

Young-Min Yang, Jae-Heung Park, June-Yi Lee, Soon-Il An, Sang-Wook Yeh, Jong-Seoung Kug, and Yoo-Geun Ham

The El Niño/Southern Oscillation (ENSO) is the primary internal climatic driver shaping extreme events worldwide1,2,3. Its intensity and frequency in response to greenhouse gas (GHG) warming has puzzled scientists for years, despite consensus among models about changes in average conditions4-16. Recent research has shed light on changes not only in ENSO variability5,7,8,10,13, but also in the occurrence of extreme5,6,11,12,13,14 and multi-year El Niño4,15, and La Niña9,11,16 events under GHG warming. Here, we investigate potential changes in ENSO predictability associated with changes in ENSO dynamics in the future by using long-range deep-learning forecasts trained on extensive large ensemble simulations of Earth System Models under historical forcings and the future high GHG emissions scenario. Our results show a remarkable increase in the predictability of ENSO events, ranging from 35% to 65% under the high GHG emissions scenario due to reduced ENSO irregularity, supported by a broad consensus among multi-models. Under GHG warming, an El Nino-like warming flattens the thermocline depth with upper ocean stratification. This flattening of the thermocline depth leads to an increased transition frequency between El Niño and La Niña events, driven by strengthened recharge-discharge oscillation with enhanced thermocline feedback and SST responses to zonal wind stress. As a result, ENSO complexity would reduce with increased regularity and reduced skewness, increasing ENSO predictability. These results imply that the future social and economic impacts of ENSO events may be more manageable, despite an expected increase in the frequency of extreme ENSO events.

How to cite: Yang, Y.-M., Park, J.-H., Lee, J.-Y., An, S.-I., Yeh, S.-W., Kug, J.-S., and Ham, Y.-G.: Increased multi-year ENSO predictability under greenhouse gas warming accounted by large ensemble simulations and deep learning, EGU General Assembly 2025, Vienna, Austria, 27 Apr–2 May 2025, EGU25-3974, https://doi.org/10.5194/egusphere-egu25-3974, 2025.

EGU25-5233 | Orals | CL4.8

Standardisation of equitable climate services by supporting a community of practice 

Francisco Doblas-Reyes, Asun Lera St Clair, Marina Baldissera Pacchetti, Paula Checchia, Joerg Cortekar, Judith E.M. Klostermann, Werner Krauß, Angel Muñoz, Jaroslav Mysiak, Jorge Paz, Marta Terrado, Andreas Villwock, Mirjana Volarev, and Saioa Zorita

Climate services are essential to support climate-sensitive decision making, enabling adaptation to climate change and variability, and mitigate the sources of anthropogenic climate change, while considering the values and contexts of those involved. The unregulated nature of climate services can lead to low market performance and lack of quality assurance. Best practices, guidance, and standards serve as a form of governance, ensuring quality, legitimacy, and relevance of climate services. The Climateurope2 project (www.climateurope2.eu) addresses this gap by engaging and supporting an equitable and diverse community of climate services to provide recommendations for their standardisation. Four components of climate services are identified (the decision context, the ecosystem of actors and co-production processes, the multiple knowledge systems involved, and the delivery and evaluation of these services) to facilitate analysis. This has resulted in the identification of nine key messages summarising the susceptibility for the climate services standardisation. The recommendations are shared with relevant standardisation bodies and actors as well as with climate services stakeholders and providers.

How to cite: Doblas-Reyes, F., Lera St Clair, A., Baldissera Pacchetti, M., Checchia, P., Cortekar, J., Klostermann, J. E. M., Krauß, W., Muñoz, A., Mysiak, J., Paz, J., Terrado, M., Villwock, A., Volarev, M., and Zorita, S.: Standardisation of equitable climate services by supporting a community of practice, EGU General Assembly 2025, Vienna, Austria, 27 Apr–2 May 2025, EGU25-5233, https://doi.org/10.5194/egusphere-egu25-5233, 2025.

EGU25-7271 | ECS | Posters on site | CL4.8

Impact-Based Forecasting Model for Flood Hazard Mitigation in Java, Indonesia 

Dendi Rona Purnama, Simon F. B. Tett, Ruth Doherty, and Ida Pramuwardani

Flooding is the most frequent and damaging hydrometeorological disaster in Indonesia, with Java being especially vulnerable due to its dense population and rapid urbanization. This study aims to refine the Impact-Based Forecasting (IBF) model to improve flood hazard predictions and mitigation efforts. Using Global Precipitation Measurement (GPM-IMERG) rainfall data as the hazard component combined with vulnerability and capacity datasets from InaRISK, this research focuses on enhancing the precision and reliability of impact assessments.

Initial analyses highlight the potential of impact-based rainfall thresholds and assessment probabilistic impacts to refine the IBF model and reduce subjectivity in impact assessments. By linking calculated impact values and disaster magnitudes for the 2014 – 2023 period, this study shows a promising skill for significant and severe flood events, although improvements are needed for minor and minimal disaster classifications.

This research lays the groundwork for a more robust and scalable IBF model tailored to Java’s unique challenges. The findings aim to support BMKG’s operational needs, enabling the delivery of more actionable early warnings and targeted disaster preparedness measures. By addressing critical gaps in existing IBF systems, this study contributes to bridging the divide between hazard-impact forecasts and societal resilience, ultimately mitigating the impacts of floods in Indonesia.

How to cite: Purnama, D. R., Tett, S. F. B., Doherty, R., and Pramuwardani, I.: Impact-Based Forecasting Model for Flood Hazard Mitigation in Java, Indonesia, EGU General Assembly 2025, Vienna, Austria, 27 Apr–2 May 2025, EGU25-7271, https://doi.org/10.5194/egusphere-egu25-7271, 2025.

EGU25-9933 | Orals | CL4.8

Hydroclimate services are more than just providing data 

Jean-Philippe Vidal, Eric Sauquet, Louis Héraut, Sonia Siauve, Guillaume Evin, Jean-Michel Soubeyroux, Flore Tocquer, Audrey Bornançin-Plantier, Claire Magand, and Maud Berel

The concept of hydroclimate services is predominantly recognised as web portals dedicated to the dissemination of data to potential users. However, the scope of climate services extends beyond the sole provision of data. This communication presents a comprehensive ecosystem of tools and resources associated with the development of an updated national hydrological projection dataset in France. The ecosystem was brought to life through a close collaboration between scientists and water managers in two joint projects: Explore2 and LIFE Eau&Climat. Tools and resources were thus developped with and for water resource managers, and designed to enhance the comprehension of both the conceptual framework and the data itself, facilitating utilisation in accordance with best practices for climate change adaptation.

The project websites serve as gateways to the ecosystem and the tools: the Explore2 website contains interviews with the scientific contributors, and the LIFE Eau&Climat website is hosted by the national website dedicated to water managers. A summary of the joint final public event accompanies the replay of the one-day conference and debates on a dedicated website. A compendium of antecedent research projects on climate change impacts on hydrology has been collated to summarise the state of the art prior to the two projects. A MOOC has been developed in conjunction with scientists to facilitate the comprehension of the Explore2 project, its design, and its application in adaptation studies.

Moreover, the Explore2 dataverse (https://entrepot.recherche.data.gouv.fr/dataverse/explore2) brings together a variety of products in an organised and searchable way, including thematic scientific reports, GIS layers, and other key metadata. It also contains three types of station datasheets aimed at locally contextualising outputs: hydrological model performance datasheets, projection results datasheets, and uncertainty quantification datasheets. The MEANDRE interactive data visualisation tool (https://meandre.explore2.inrae.fr/) offers a guided tour of the salient take-home messages and a comprehensive exploration of the Explore2 hydrological projection dataset. This multi-model dataset (GCMs/RCMs/bias correction methods/hydrological models) is made available through the DRIAS-Eau portal (https://drias-eau.fr/), which functions as a water mirror of the established DRIAS-Climat portal. The utilisation of this dataset for local climate change impact studies is facilitated by a methodological guide written as an adventure gamebook (https://livreec.inrae.fr/) and based on real-life studies carried out by water managers during the LIFE Eau&Climat project. Furthermore, experiments of sonification of hydrological projections offer a novel approach to apprehending future changes (https://explore2enmusique.github.io/).

This ecosystem has been met with great anticipation and acclaim by local to national-scale water managers, paving the way for ongoing local prospective studies. These will be able to confront future resources with the ecological needs of aquatic environments and human water usage.

This work is funded by the EU LIFE Eau&Climat project (LIFE19 GIC/FR/001259).

How to cite: Vidal, J.-P., Sauquet, E., Héraut, L., Siauve, S., Evin, G., Soubeyroux, J.-M., Tocquer, F., Bornançin-Plantier, A., Magand, C., and Berel, M.: Hydroclimate services are more than just providing data, EGU General Assembly 2025, Vienna, Austria, 27 Apr–2 May 2025, EGU25-9933, https://doi.org/10.5194/egusphere-egu25-9933, 2025.

EGU25-11600 | ECS | Orals | CL4.8

Windows of Opportunity for Seasonal Prediction of droughts: the case of the Middle East 

Thomas Dal Monte, Andrea Alessandri, Annalisa Cherchi, Markus Donat, and Marco Gaetani

Drought warnings are vital to sectors like agriculture and water management, especially at the seasonal time scale. Identifying the sources of drought predictability in regions where a prediction system demonstrated potential for useful applications of the forecasts, represents an important step toward building confidence in the predictions and refining the seasonal predictions. To better identify higher forecast skill in this context, one possible approach is to focus on specific “windows of opportunity”. The approach aims to identify periods when persistent anomalies occurring in the ocean, the atmosphere or the land surface may positively precondition the predictive ability of the seasonal forecast. In the case of SPI3, a high potential for preconditioned predictive skill is identified in the Middle East region, as suggested by a robust relationship with large-scale climate modes. Building on these results, this study explores the contributions of individual years to the skill for the region during the autumn season and in the hindcast period 1993-2016. We used a Multi Model Ensemble (MME) of eight seasonal prediction systems (SPSs) provided by the Copernicus Climate Data Store (CDS) and observations from the Climate Research Unit (CRU) to calculate the SPI3 time series and the values of the Pacific and Indian teleconnection indices, the Oceanic Nino Index (ONI) and the Dipole Mode Index (DMI), respectively. A novel methodology is implemented to cluster the year-by-year MME contributions to the Pearson correlation coefficient (PCC) that are preconditioned by the large-scale teleconnections. 

Results indicate that years with extreme high or low values of ONI and DMI are the main contributors to the forecasting skill of the MME drought predictions over the Middle East. In particular, a window of opportunity is identified in four (out of 24) years that show significantly high contribution to overall skill. These years are robustly preconditioned by El Niño or La Niña events. Among the years with higher contributions, 1994 stands out as being more influenced by the DMI, thus driven primarily by SST anomalies in the Indian Ocean rather than the Pacific Ocean.  The methodological approach developed in this study successfully highlighted the potential windows of opportunity for seasonal prediction in the Middle East region, and could be applied extensively to develop early warnings for the coming seasons to serve agriculture and water management operations.

How to cite: Dal Monte, T., Alessandri, A., Cherchi, A., Donat, M., and Gaetani, M.: Windows of Opportunity for Seasonal Prediction of droughts: the case of the Middle East, EGU General Assembly 2025, Vienna, Austria, 27 Apr–2 May 2025, EGU25-11600, https://doi.org/10.5194/egusphere-egu25-11600, 2025.

EGU25-11821 | Orals | CL4.8

Seamless seasonal to multi-annual climate predictions by constraining transient (CMIP6) climate model simulations 

Juan C. Acosta Navarro, Alvise Aranyossy, Paolo De Luca, Markus G. Donat, Arthur Hrast Essenfelder, Rashed Mahmood, Andrea Toreti, and Danila Volpi

Seamless climate predictions combine information across different timescales to deliver information potentially useful for sectors like agriculture, energy, and public health. Seamless operational forecasts for periods spanning from sub-annual to multi-annual timescales are currently not available throughout the year. We show that this gap can be closed by using a well-established climate model analog method. The method consists in sampling model states from the CMIP6 transient simulation catalog based on their similarity with the observed sea surface temperature as a means of model initialization. 

Here we present the methodology and basic skill evaluation of the analog-based temperature and standardized precipitation index retrospective predictions with forecast times ranging from 3 months up to 4 years. We additionally compare these predictions with the non-initialized CMIP6 ensemble and with two operational benchmarks produced with state-of-the-art dynamical forecasts systems: one on seasonal timescales and the other on annual to multi-annual timescales.

The analog method provides skillful climate predictions across the different timescales, from seasons to several years, offering temperature and precipitation forecasts comparable to those from state-of-the-art initialized climate prediction systems, particularly at the annual to multi-annual timescales. However, unlike operational decadal prediction systems that provide only one or two initializations per year, the analog-based system can generate seamless predictions with monthly initializations, offering year-round climate information. Additionally, analog predictions are computationally inexpensive once the multi-model transient climate simulations have been completed. We argue that these predictions are a valuable complement to existing operational prediction systems and may improve regional climate adaptation and mitigation strategies. 


How to cite: Acosta Navarro, J. C., Aranyossy, A., De Luca, P., Donat, M. G., Hrast Essenfelder, A., Mahmood, R., Toreti, A., and Volpi, D.: Seamless seasonal to multi-annual climate predictions by constraining transient (CMIP6) climate model simulations, EGU General Assembly 2025, Vienna, Austria, 27 Apr–2 May 2025, EGU25-11821, https://doi.org/10.5194/egusphere-egu25-11821, 2025.

EGU25-13385 | Posters on site | CL4.8

Representation of Temporal Variations of Vegetation in Reanalysis and Climate Predictions: Diverging Soil-Moisture Response in Land Surface Models 

Andrea Alessandri, Marco Possega, Emanuele Di Carlo, Annalisa Cherchi, Souhail Boussetta, Gianpaolo Balsamo, Constantin Ardilouze, Gildas Dayon, and Fransje van Oorschot

Vegetation plays a crucial role in the land surface water and energy balance modulating the interactions and feedback with climate at the regional to global scale. The availability of unprecedented Earth observation products covering recent decades (and extended up to real-time) are therefore of paramount importance to better represent the vegetation and its time evolution in the land surface models (LSMs) used for offline analysis/initialization and for the seasonal-to-decadal predictions. 

Here, we integrate realistic vegetation Leaf Area Index (LAI) variability from latest generation satellite campaigns, available through Copernicus Land Monitoring Service (CLMS), in three different LSMs that conducted the same coordinated set of offline land-only simulations forced by hourly atmospheric fields derived from the ERA5 atmospheric reanalysis. The experiment implementing realistic interannually-varying LAI (SENS) is compared with simulations utilizing a climatological LAI (CTRL) to quantify the vegetation feedback and the effects on the simulation of near-surface soil moisture.

The results show that the inter-annually varying LAI considerably affects the simulation of near-surface soil moisture anomalies in all three models and over the same water-limited regions, but surprisingly the effects diverge among models: compared with ESA-CCI observations, the near-surface soil moisture anomalies significantly improve in  one of the three LSMs (HTESSEL-LPJGuess) while the other two (ECLand and ISBA-CTRIP) display opposite effects with significant worsening of the anomaly correlation coefficients. It is found that the enhanced simulation of near-surface soil moisture is enabled by the positive feedback that is activated by the effective vegetation cover (EVC) parameterization, implemented only in HTESSEL-LPJGuess. The EVC parameterization works such that the effective fraction of the bare soil being covered by vegetation does vary with LAI following an exponential function constrained by available satellite observations. The increased (reduced) soil-moisture limitation during dry (wet) periods produces negative (positive) LAI and therefore EVC anomalies, which in turn generate a dominating positive feedback on the near-surface soil moisture of HTESSEL-LPJGuess by exposing more (less) bare soil to direct evaporation from the sub-surface layer. On the other hand, in the EC-Land and ISBA-CTRIP models, EVC is fixed in time as it cannot vary with LAI and so the positive feedback described cannot be activated. The only feedback on near-surface soil moisture anomalies that operates  in these two models is negative and comes from the reduced (increased) transpiration related to the negative (positive) LAI anomalies.

Simply prescribing observed vegetation data into LSMs does not guarantee the introduction of the correct coupling and feedback on climate. In this respect, this multi-model comparison experiment demonstrates the fundamental role of the inclusion of the underlying vegetation processes in LSMs. Ignoring the proper representation of the vegetation processes could lead to unrealistic (and even the opposite effects compared with observations) behaviour in reanalysis and climate predictions.

How to cite: Alessandri, A., Possega, M., Di Carlo, E., Cherchi, A., Boussetta, S., Balsamo, G., Ardilouze, C., Dayon, G., and van Oorschot, F.: Representation of Temporal Variations of Vegetation in Reanalysis and Climate Predictions: Diverging Soil-Moisture Response in Land Surface Models, EGU General Assembly 2025, Vienna, Austria, 27 Apr–2 May 2025, EGU25-13385, https://doi.org/10.5194/egusphere-egu25-13385, 2025.

EGU25-14900 | ECS | Posters on site | CL4.8

Psychological Drivers of Climate Silence: A Challenge to Indonesia's Climate Action 

Anggi Dewita and Balgis Inayah

Despite growing awareness of climate change, many Indonesians remain climate-silent, posing a significant challenge to the country's efforts to mitigate its impacts. This study aims to analyze the factors contributing to climate silence in Indonesia, using psychological theories related to climate science denial. A rapid systematic review was conducted to gather evidence, revealing five key drivers of climate denial: limited cognitive abilities, ideological beliefs, sunk costs, perceived risks, and discredence. These barriers are further shaped by factors such as government policies, economic conditions, religious influences, and insufficient environmental education.
This skepticism towards climate change undermines adaptation and mitigation efforts by disrupting community engagement and participation. The findings highlight the importance of government support in addressing the root causes of climate skepticism. Employing the concept of inoculation through a misconception-based learning approach—integrated into religion and education—can help reshape mindsets. Enhancing public understanding of climate change is essential to fostering community involvement and support for effective climate mitigation initiatives.

Keywords: climate silence, climate denial, psychological drivers, Indonesia.

How to cite: Dewita, A. and Inayah, B.: Psychological Drivers of Climate Silence: A Challenge to Indonesia's Climate Action, EGU General Assembly 2025, Vienna, Austria, 27 Apr–2 May 2025, EGU25-14900, https://doi.org/10.5194/egusphere-egu25-14900, 2025.

EGU25-15251 | Posters on site | CL4.8

Assessment of the skill of seasonal probabilistic hydrological forecasts with ParFlow/CLM over central Europe 

Alexandre Belleflamme, Suad Hammoudeh, Klaus Goergen, and Stefan Kollet

In recent years, alternating drought and extreme precipitation events have highlighted the need for subseasonal to seasonal forecasts of the terrestrial water cycle. In particular, predictions of the impacts of dry and wet extremes on subsurface water resources are crucial to provide stakeholders in agriculture, forestry, the water sector, and other fields with information supporting the sustainable use of these resources.

In this context, we release an experimental Water Resources Bulletin (https://adapter-projekt.de/bulletin/index.html) four times per year, offering probabilistic forecasts of the total subsurface water storage (TSS) anomaly at a 0.6 km resolution, from the surface down to 60 m depth, for the upcoming seven months across Germany. These seasonal forecasts are generated using the integrated, physics-based hydrological model ParFlow/CLM, forced by 50 ensemble members of the SEAS5 seasonal forecast from the European Centre for Medium-Range Weather Forecasts (ECMWF).

To evaluate our forecasts, we evaluated six 7-months probabilistic forecasts covering the vegetation period (March to September) for the years 2018 to 2023 with a reference long-term historical time series based on the same ParFlow/CLM setup. The forecast skill was assessed by comparing these seasonal forecasts to a climatology-based 10-member pseudo-forecast over the 2013–2023 period (using the leave-one-out method), extracted from the reference time series.

The monthly Continuous Ranked Probability Skill Score (CRPSS), which evaluates the ensemble distribution based on daily TSS data, indicates that the probabilistic forecast outperforms the climatology-based pseudo-forecast in most regions, except in 2018 and, to a lesser extent, in 2020 and 2022. This can be attributed to an under-representation of extremely dry members in the ensemble, combined with the memory effect of the initial conditions at increasing soil depths. For example, while March 2018 started with a slightly above-average TSS and experienced a strong meteorological drought leading to an agricultural drought, the initial TSS anomaly in March 2019 was already negative, with a less pronounced precipitation deficit during the vegetation period. This resulted in a much higher forecast skill, because of the memory effect accurately simulated with the physics-based model. Notably, the forecast skill only slightly decreases with increasing lead time, both for precipitation and TSS.

The analysis of the Relative Operating Characteristic Skill Score (ROCSS) for the lower quintile of the TSS distribution assesses whether negative TSS anomalies (i.e., droughts) are adequately represented within the probabilistic forecast ensemble. The results are consistent with those of the CRPSS, showing lower skill in 2018. Nevertheless, the ROCSS analysis overall indicates moderate to high skill for the probabilistic forecast, while the climatology-based pseudo-forecast demonstrates no skill. This confirms that the dry conditions experienced in central Europe in recent years were captured within the probabilistic forecast, underlining the added value of these forecasts and their usefulness in the experimental Water Resources Bulletin.

How to cite: Belleflamme, A., Hammoudeh, S., Goergen, K., and Kollet, S.: Assessment of the skill of seasonal probabilistic hydrological forecasts with ParFlow/CLM over central Europe, EGU General Assembly 2025, Vienna, Austria, 27 Apr–2 May 2025, EGU25-15251, https://doi.org/10.5194/egusphere-egu25-15251, 2025.

EGU25-15484 | ECS | Posters on site | CL4.8

From Policy to Action: Empowering Women to Lead Climate Resilience in Indonesia 

Asri Rachmawati and Anggi Dewita

Women face disproportionate impacts from climate change due to significant barriers to accessing education and protection. In Indonesia, women often lack access to essential resources and opportunities, particularly in urban informal settlements. However, women also hold a pivotal position in the community in advancing climate literacy. Despite progressive regulations supporting women’s rights, gaps in implementation persist, highlighting the need for targeted initiatives to enhance women’s understanding of climate issues and their capacity to lead resilience efforts. Indonesia has established strong policies for gender equality and climate action, such as Presidential Regulation No. 59/2017 and the National Action Plan for Climate Change Adaptation (RAN-API), which emphasize gender-responsive strategies. However, translating these policies into real-world actions remains a challenge, highlighting the need to better connect scientific research and community insights to effective governance and implementation. This study identifies a critical gap in urban climate literacy and proposes empowering women as a solution. By leveraging women’s social network in Indonesia, the project disseminates climate knowledge and fosters collective action. Key initiatives include training women in climate literacy, introducing sustainable practices such as urban gardening, and developing accessible educational tools like songs, games, and visual materials. These programs are designed to position women as trusted leaders within their communities. Structured monitoring and evaluation methods, including annual surveys and peer-led literacy programs, ensure continuous improvement and scalability. Preliminary findings demonstrate that women-led climate literacy initiatives significantly enhance community resilience and resource allocation. Empowered women influence their families and peers, creating a ripple effect that strengthens societal adaptability. This scalable model integrates women-centered initiatives into governance frameworks, building pathways for sustainable, inclusive development. By empowering women, we transform vulnerability into strength, paving the way for a resilient future.

How to cite: Rachmawati, A. and Dewita, A.: From Policy to Action: Empowering Women to Lead Climate Resilience in Indonesia, EGU General Assembly 2025, Vienna, Austria, 27 Apr–2 May 2025, EGU25-15484, https://doi.org/10.5194/egusphere-egu25-15484, 2025.

EGU25-15694 | Orals | CL4.8 | Highlight

The Use of Social Media on Weather and Climate Information Dissemination To Support Effective Climate Action 

Radjab Achmad Fachri and Achmad Ezra Reynara

Timely and fast dissemination are some of the key factors for the effective climate information services in order to support effective climate action. Various mean of communication channel has been used by an authoritative agency to disseminate their climate information, including social media. Currently, social media become one of the most effective chanel to disseminate of weather and climate information. Social media is not only a powerfull tools to ensure the timely, fast, massive dissemination of weather and climate information, but it is also easy to use and access by the general public. Social media also can be optimized public outreach and public education in order to raising awareness and mobilizing an effective climate action. Through it’s real time response tools, social media also can be used to strengthen the engagement between meteorological and hydrological services with their users. Our research will describe the effectiveness of social media to disseminate weather and climate information in order to support climate action in Indonesia.

How to cite: Achmad Fachri, R. and Ezra Reynara, A.: The Use of Social Media on Weather and Climate Information Dissemination To Support Effective Climate Action, EGU General Assembly 2025, Vienna, Austria, 27 Apr–2 May 2025, EGU25-15694, https://doi.org/10.5194/egusphere-egu25-15694, 2025.

EGU25-19049 | Posters on site | CL4.8

The Role of Afforestation in Modulating Arid Climate 

Thang M. Luong, Matteo Zampieri, and Ibrahim Hoteit

Afforestation and greening initiatives are increasingly considered viable strategies for mitigating climate change, particularly in arid regions. In this study, we assess the climate impacts of large-scale afforestation in the Arabian Peninsula (AP). The afforestation is represented by replacing sandy bare soil with woody savanna vegetation, assumed to be naturally sustained by rainfall, in the absence of overgrazing. Using a 30-year regional climate model simulation, we prescribe afforestation within a circular area of 4.5° radius (approximately 71.9 million hectares) centered at 24.2°N, 44.3°E. The afforestation modifies surface characteristics, including darker albedo (0.25 vs. 0.38 for bare soil), a green fraction of 0.3, and a leaf area index (LAI) of 0.1.

Our results show that the afforestation slows down near-surface winds and due to darker surface, increases sensible heat flux, leading to enhanced warming of the atmosphere over vegetated areas. Despite these warming effects, the additional vegetation promotes higher rainfall due to increased moisture availability and reduction of subsidence. This study underscores the dual role of afforestation in modulating regional climate, serving as both a climate mitigation measure and a potential warming source, depending on regional conditions. These findings highlight the importance of considering water availability and local climate factors when designing greening policies for arid regions.

How to cite: Luong, T. M., Zampieri, M., and Hoteit, I.: The Role of Afforestation in Modulating Arid Climate, EGU General Assembly 2025, Vienna, Austria, 27 Apr–2 May 2025, EGU25-19049, https://doi.org/10.5194/egusphere-egu25-19049, 2025.

EGU25-19889 | Orals | CL4.8

Progresses and Challenges for Subseasonal to Interdecadal Prediction 

Ángel G. Muñoz, William J. Merryfield, and Debra Hudson

Subseasonal to decadal predictions provide essential information that bridges the gap in timescales between weather forecasts and long-term climate projections. The science and practice of making such predictions using global climate models initialized with observational data has advanced considerably in recent years, and as a result operational subseasonal, seasonal and decadal prediction services are now a reality. Nonetheless, important remaining challenges must be overcome if these predictions are to more fully realize their potential value for society. This talk highlights five key challenges recommended as targets for focused international research; these are set against a backdrop of wider challenges encompassing climate modelling and services across time scales.

How to cite: Muñoz, Á. G., Merryfield, W. J., and Hudson, D.: Progresses and Challenges for Subseasonal to Interdecadal Prediction, EGU General Assembly 2025, Vienna, Austria, 27 Apr–2 May 2025, EGU25-19889, https://doi.org/10.5194/egusphere-egu25-19889, 2025.

EGU25-21425 | Orals | CL4.8

A large ensemble of decadal predictions using MIROC6 

Takahito Kataoka, Hiroaki Tatebe, Hiroshi Koyama, and Masato: Mori

The climate fluctuates on various timescales and in various patterns, giving rise to extreme events over the globe. Skillful predictions of such climate variations would therefore benefit society, and there have been substantial efforts. For the CMIP6 Decadal Climate Prediction Project (DCPP), we performed decadal predictions with ten ensemble members using the Model for Interdisciplinary Research on Climate version 6 (MIROC6). However, since models tend to underestimate signal-to-noise ratio in some sectors, such as the Atlantic, a large ensemble size appears to be required for skillful predictions of those variations. To better understand the predictability on timescales out to a season to a decade, we have prepared a set of initialized predictions using MIROC6 that consists of 10-year-long hindcasts starting every November between 1960-2021, with 50 ensemble members. Compared to the original 10-member ensemble hindcast, both seasonal and decadal prediction skills are broadly improved (e.g., SAT and SLP over southeast China and Scandinavia for the first winter, North and South Pacific SSTs for decadal prediction). Regarding the decadal prediction skill, the impact of initialization is seen up to lead year 7-10 for the North and eastern tropical Pacific Oceans.
Also, building on our experience with decadal climate predictions, we have been working on decadal carbon predictions in recent years. Our efforts on earth system predictions will be introduced as well.

How to cite: Kataoka, T., Tatebe, H., Koyama, H., and Mori, M.: A large ensemble of decadal predictions using MIROC6, EGU General Assembly 2025, Vienna, Austria, 27 Apr–2 May 2025, EGU25-21425, https://doi.org/10.5194/egusphere-egu25-21425, 2025.

EGU25-2725 | Orals | CL4.9

Tropical Radiation-Precipitation Relationship and Future Extreme Precipitation Constraint 

Yuanyuan Huang, Zhijian Yang, and Xiaoming Shi

Over the tropics, a robust statistical relationship between radiation and precipitation underscores the convection conversion efficiency associated with the cloud-radiative effect in a certain climate state. In this study, we define an "RP ratio", a metric derived from outgoing longwave radiation and precipitation anomalies, for linearly estimating the radiation-precipitation relation (RP relation). The RP ratio exhibits significant disparities across global climate models (GCMs), with the majority overestimating it relative to the observation.

Since the RP ratio and future extreme precipitation (EP) are found to be highly correlated over the tropics, an emergent constraint (EC) on the hydrological cycle projections is applied based on this correlation. The EC in this study shows its novelty due to the first application of the RP relation on hydrological cycle projections. According to the EC results, we find the fractional increase in the 99.9th percentile of EP by the end of the 21st century is lowered from 28% to 14% (from 16% to 5%), with the uncertainty reducing by 22% (12%), under the high-emission scenario (median-emission scenario). Overall, the GCMs underestimate the future tropical EP while overestimating its fractional increase. The results provide valuable insights for model improvement and better climate adaptation planning.

How to cite: Huang, Y., Yang, Z., and Shi, X.: Tropical Radiation-Precipitation Relationship and Future Extreme Precipitation Constraint, EGU General Assembly 2025, Vienna, Austria, 27 Apr–2 May 2025, EGU25-2725, https://doi.org/10.5194/egusphere-egu25-2725, 2025.

EGU25-3483 | ECS | Posters on site | CL4.9

General atmospheric circulation and precipitation evaluation of next-generation Earth System Models 

Andreas Karpasitis, Panos Hadjinicolaou, and George Zittis

Climate model evaluation is an essential part of model development because it offers a thorough understanding of the strengths and limitations of specific model components. One of the challenges climate models face is accurately representing precipitation spatial patterns and intensity. This is mainly due to their relatively coarse resolution and the parameterization of various processes, such as atmospheric convection and cloud microphysics. Additionally, the representation of general atmospheric circulation can be incorrect, leading to issues like the misplacement of the Intertropical Convergence Zone (ITCZ) and storm tracks in higher latitudes. In this study, we evaluate the performance of two next-generation Earth System Models (ESMs) developed through the OptimESM project, focusing on how well these models represent precipitation patterns both in tropical regions and on a global scale. Our analysis includes the historical simulations of several ensemble members of the EC-Earth3-ESM-1 and UKESM1.2 ESMs. We compare these models with their CMIP6 ensemble counterparts to determine whether significant improvements have been made and to identify where these enhancements occur around the globe. By utilizing the zonally averaged mass stream function, we identify the main atmospheric circulation cells and assess how effectively the models represent general atmospheric circulation while interpreting the associated precipitation biases.

How to cite: Karpasitis, A., Hadjinicolaou, P., and Zittis, G.: General atmospheric circulation and precipitation evaluation of next-generation Earth System Models, EGU General Assembly 2025, Vienna, Austria, 27 Apr–2 May 2025, EGU25-3483, https://doi.org/10.5194/egusphere-egu25-3483, 2025.

EGU25-3675 | ECS | Orals | CL4.9

How much carbon is allocated to leaves? 

Boya Zhou and Colin Prentice

Carbon allocation is a critical process that helps to optimize plant growth and significantly impacts ecosystem structure and function, with immediate implications for the global carbon cycle. Since leaves are the primary organs regulating the exchange of CO₂, energy, and water between terrestrial ecosystems and the atmosphere, accurate simulation of leaf carbon allocation is important. However, most land surface models (LSMs) lack detailed consideration of the leaf economics spectrum, which is represented by the coordination of leaf mass per area (LMA) and leaf longevity (LL) and how their relationship varies with the growth environment. Instead, LSMs commonly predict the proportion of biomass allocated to leaves either directly from the environment based on resource limitation theories, or from their functional relationships with other organs. A new theory based on eco-evolutionary optimality principles successfully predicts changes in LMA and LL with the environment by maximizing the average net carbon gain over the leaf life cycle. In addition, a prognostic, globally applicable Leaf Area Index (LAI) model has been developed recently, using climate data alone to capture LAI dynamics across biomes on the principle that the annual cycle of leaf display is closely related to the cycle of potential primary production by those leaves. Here, combining these two theoretical developments, we provide a universal expression for the proportion of biomass allocated to leaves. We successfully predict foliar carbon allocation as measured on a site basis and capture the plasticity of foliar carbon allocation with environmental change. The global average fraction of biomass production allocated to leaves is estimated as 0.31. The model also accounts for the different regulatory mechanisms of leaf carbon allocation by deciduous and evergreen plants.

How to cite: Zhou, B. and Prentice, C.: How much carbon is allocated to leaves?, EGU General Assembly 2025, Vienna, Austria, 27 Apr–2 May 2025, EGU25-3675, https://doi.org/10.5194/egusphere-egu25-3675, 2025.

EGU25-3911 | Posters on site | CL4.9

Enhancing the PCMDI Metrics Package for Comprehensive Evaluation of Earth System Models in CMIP 

Jiwoo Lee, Ana Ordonez, Paul Ullrich, Peter Gleckler, Bo Dong, Kristin Chang, Elina Valkonen, Julie Caron, Ije Hur, and Changhyun Yoo

Earth System Models (ESMs) are essential for understanding climate dynamics and informing policy decisions. This presentation focuses on the PCMDI Metrics Package (PMP), an open-source, Python-based framework designed for objective "quick-look" comparisons and benchmarking of ESMs against the latest observational data. The PMP has been instrumental in systematically evaluating thousands of simulations from Coupled Model Intercomparison Projects (CMIPs), with a primary focus on physical climate with atmospheric mean and variability.

As we prepare for the upcoming CMIP7, our ongoing work aims to enhance the PMP's capabilities to support modeling groups throughout their development cycles. The PMP offers a diverse suite of evaluation metrics, including large- to global-scale climatology, annual cycle, and variability characteristics associated with ENSO, MJO, and numerous extra-tropical modes, and also includes key measures of simulated sea-ice and ocean states. Notably, the PMP provides a database of pre-calculated statistics for CMIP6 models, facilitating easier comparisons for modeling centers as they assess their results against established benchmarks.

Current ongoing enhancements include the evaluation of the Quasi-Biennial Oscillation (QBO) and its teleconnections to the MJO, atmospheric blocking, and atmospheric river patterns using Machine Learning algorithms. Additionally, we are implementing planetary-scale assessments through Hadley cell expansion metrics. The PMP is also evolving to accommodate higher-resolution simulations from HighResMIPs, cloud-resolving E3SM experiments, and regionally downscaled products.

This presentation will highlight the importance of routine model evaluation, introduce the latest advancements in the PMP, and discuss opportunities for community engagement and collaboration. We invite feedback and suggestions from the community to further enhance our tools and methodologies.

How to cite: Lee, J., Ordonez, A., Ullrich, P., Gleckler, P., Dong, B., Chang, K., Valkonen, E., Caron, J., Hur, I., and Yoo, C.: Enhancing the PCMDI Metrics Package for Comprehensive Evaluation of Earth System Models in CMIP, EGU General Assembly 2025, Vienna, Austria, 27 Apr–2 May 2025, EGU25-3911, https://doi.org/10.5194/egusphere-egu25-3911, 2025.

The Korea Institute of Atmospheric Prediction Systems (KIAPS) is committed to enhancing the accuracy and reliability of weather forecasts, especially for periods extending beyond the conventional two-week timeframe. To support this goal, we are developing an innovative and comprehensive model that seamlessly integrates various components of the Earth system, including oceans, sea ice, waves, and river systems. This integrated approach is crucial because, while short-term weather predictions typically focus on atmospheric variables, they often overlook the significant role that rivers play in the global hydrological cycle. However, as the forecasting window extends into extended-medium range, the contribution of rivers to the Earth’s water balance becomes increasingly important. To address this, the project employs a specialized model designed to accurately estimate the volume of freshwater that rivers discharge into the oceans, which in turn influences a range of oceanic and atmospheric processes.

In this study, we have integrated the Catchment-based Macro-scale Floodplain (CaMa-Flood) model with the Korean Integrated Model (KIM) Numerical Weather Prediction (NWP) system. The CaMa-Flood model is specifically designed to simulate river discharge and floodplain dynamics on a global scale, making it a valuable tool for enhancing the realism of hydrological processes in weather prediction models. By coupling CaMa-Flood with the KIM, we aim to improve the representation of riverine processes within the broader context of Earth system modeling.

To evaluate the effectiveness of this integration, we conducted a series of validation analysis. These involved comparing river discharge data generated by the coupled KIM/CaMa-Flood model with observational data from various sources, as well as reanalysis datasets. The objective is to assess the model’s ability to accurately reproduce the spatial distribution and seasonal variability of river discharge across different regions. Additionally, the study explores the impact of freshwater influx from rivers on key oceanographic parameters such as sea surface temperature, salinity, and sea ice concentration, particularly in the Arctic region. A significant focus of the research is the Arctic, where the interactions between river discharge, sea ice, and atmospheric conditions are especially complex and influential on global climate variabilities. We are conducting an in-depth analysis of the relationships among sea ice extent, surface air temperatures, and upper atmospheric dynamics in the Kara-Barents Sea region of the Arctic. The findings from this study are expected to provide valuable insights into the role of riverine processes in Arctic climate dynamics and contribute to the development of more accurate and reliable long-term forecasts.

How to cite: Cho, M.-H.: mpact of River Discharge on Arctic Atmosphere: Coupling a River Routing Model , EGU General Assembly 2025, Vienna, Austria, 27 Apr–2 May 2025, EGU25-3933, https://doi.org/10.5194/egusphere-egu25-3933, 2025.

Observational constraints are widely used to reduce uncertainty in multi-model projections and have been proven to be effective. Implementations of constraints vary widely, ranging from using temperature trends over different time periods to incorporate the full evolution of the historical climate time series and even a range of covariates. In this study we consider two Bayesian approaches to developing a constraint on future global warming, using the historical time evolution of global mean surface temperature (GMST) in one case, and historical GMST trends during recent decades in another. We also consider which period in the historical GMST record provides the most effective constraint on future projections. We conduct our studying using large ensemble simulations from climate models with different sensitivities.  When using a time series of annual GMST values, we find an effective constraint only becomes possible when data from the recent period of rapid transient climate change are included in the analysis. Furthermore, incorporating the full transition from a quasi-equilibrium pre-industrial state to the recent strong transient response results in a better constrain. Using a simple linear warming trend from recent decades does improve upon unconstrained projections but to a lesser extent than using the full time series for the same period. Accounting for the intercept obtained in linear trend estimation, which provides information about the warming that occurred before the trend estimation period and thus how represents the Earth system transitioned from a quasi-stationary state to its current state of rapid transient response, improves the skill of trend based constraints. Nevertheless, a constraint based on both the trend (the recent rate of warming) and intercept (the accumulated warming prior to the trend period) does not perform as well as a constraint that uses the entire historical GMST record from 1850 to present.

How to cite: Li, T., Zwiers, F., and Zhang, X.: How much of the historical global mean surface temperature record is needed to well constrain projections of future warming?, EGU General Assembly 2025, Vienna, Austria, 27 Apr–2 May 2025, EGU25-4023, https://doi.org/10.5194/egusphere-egu25-4023, 2025.

The sixth assessment report (AR6) issued by the Intergovernmental Panel on Climate Change (IPCC) projects that 1 in 50 years, heat waves become about 8 times more frequent, and 1 in 10 years, extreme precipitation events become twice as frequent in a 1.5-degree warmer climate compared to the pre-industrial period. We need to prepare and adapt to those changes in our global climate. The current best way to do this is to use Earth System Models (ESMs) to project the next 50 to 100 years of our climate, employing Greenhouse-gas (GHG) emission and anthropogenic aerosol-based scenarios. The most prominent initiative dedicated to this aim is the Coupled Model Intercomparison Project (CMIP). Reproducibility is important in this collaborative effort, tracing back simulations to specific configurations, model versions, and compilation flags to reproduce the same simulation in the same environment again, achieving identical results. Equally important is replicability, achieving “identical” results when performing the same experiment configuration using different clusters, computing environments, or compilers. Achieving replicable results is much more difficult, and in practice, bit-to-bit replicability can almost never be achieved. However, results can be replicable in the sense that the model's climate in one computing environment is statistically indistinguishable compared to results from simulations performed in another environment. Due to the large number of simulations conducted in CMIP, the simulations are usually distributed on different clusters.

How do we ensure the model’s climate is replicable? It has been demonstrated that the non-linearity of the models leads to significantly different trajectories, even for a different set of compiler flags. If replicability does not hold, differences between contrasting projection scenarios performed on different clusters cannot be interpreted exclusively in terms of the changes in external forcing. Built on state-of-the-art replicability verification methods, we developed a methodology to evaluate the statistical power and sensitivity of current replicability methods and made improvements based on our results. One of our findings is that the power of the current methods is poor when the effective differences are subtle. For instance, the standard threshold of 80% of the statistical power of a prominent method (Massonnet et al., 2020, https://doi.org/10.5194/gmd-13-1165-2020) is only met if the ensemble means of the evaluation metric are more than two standard deviations apart. However, we observed differences in biomass burning emission (BMB) forcing in the CESM2 Large Ensemble Community Project (LENS2), which changes the model’s climate, only show effective differences of about 0.5 standard deviations.

Our new methodology provides (1) new metrics capable of resolving the differences in the data better, meaning increasing the effect size, and (2) new statistical tests that trigger smaller effect sizes. We will present our new methodology evaluating the LENS2 ensemble, based on the period affected by the different BMB forcing, and analyzing different perturbation schemes of the control ensemble initialized in 1850. Additionally, we will present a recent study that we performed on IFS-NEMO simulations, using a double, single, and mixed precision NEMO implementation. 


How to cite: Keller, K., Alerany, M., and Acosta, M.: Earth system model replicability - Statistical validation of a model's climate under a change of computing environment, EGU General Assembly 2025, Vienna, Austria, 27 Apr–2 May 2025, EGU25-4259, https://doi.org/10.5194/egusphere-egu25-4259, 2025.

EGU25-9002 | ECS | Orals | CL4.9

Advancing Earth System Model Evaluation with AQUA: A Modular Framework for Quality Assessment 

Matteo Nurisso, Jost von Hardenberg, Silvia Caprioli, Supriyo Ghosh, Maqsood Mubarak Rajput, Natalia Nazarova, Marco Cadau, and Paolo Davini

The diversity of the Earth System Model (ESM) ecosystem, with output data varying in format, grids and metadata, pose significant challenges for effective intercomparison and evaluation. Additionally, the comparison with observational dataset and the rapid development of Artificial Intelligence techniques to progress ESM representations may introduce additional complexity, with the need of a fast integration of them in a uniform and standardized evaluation pipeline.

AQUA, an Application for QUality Assessment, is a python package developed in the context of Destination Earth Climate Digital Twin, a major initiative by the European Commission. AQUA is designed to overcome these challenges by standardizing variables and metadata across different models and observations. Additionally, it provides a simple and unified interface to open and process different data formats and support different APIs (netCDF, GRIB, FDB, Zarr, Parquet) to access data. It leverages the power of Dask, Xarray and Intake libraries, for a lazy data access to all the supported formats.

AQUA offers the possibility to add any dataset in a catalog, a series of yaml files describing the path or the API needed to open data. The code can accommodate a hierarchy of needs, from simple access to complex data structure, going through extensive usage of the processing capabilities such as metadata conversion, data regrid and integrated area weighting as an extension of Xarray, or eventually by exploiting the integrated suite of diagnostics for model evaluation.

Additionally, the code provides diagnostics that can exploit lazy access to high-resolution data, a suite for uncertainty quantification of the diagnostics output and provides the backend capabilities for the development of project dashboards.

Finally, the code supports the possibility to develop other diagnostics and to have them integrated in the model evaluation along with the others.

How to cite: Nurisso, M., von Hardenberg, J., Caprioli, S., Ghosh, S., Rajput, M. M., Nazarova, N., Cadau, M., and Davini, P.: Advancing Earth System Model Evaluation with AQUA: A Modular Framework for Quality Assessment, EGU General Assembly 2025, Vienna, Austria, 27 Apr–2 May 2025, EGU25-9002, https://doi.org/10.5194/egusphere-egu25-9002, 2025.

EGU25-9455 | Posters on site | CL4.9

Evaluation of  the impact of the Atlantic Ocean on the atmospheric circulation using the  EC-Earth3-ESM-1 model 

Shiyu Wang, Klaus Wyser, Torben Koenigk, Mehdi Pasha Karami, and René Gabriel Navarro Labastida

The Atlantic Ocean plays a crucial role in regulating regional and global climate variability, particularly as the Atlantic meridional overturning circulation (AMOC) is weakening and on course to reach a critical tipping point in a rapidly warming climate. As a key tipping component of the climate system, the AMOC influences other Atlantic climate phenomena, e.g. the Atlantic Multidecadal Oscillation (AMO), and impacts global atmospheric circulation through air-sea interaction. Therefore, it is essential that the global Earth system models correctly capture or represent these interactions. This study aims to assess the impact of Atlantic climate phenomena on atmospheric circulation, based on historical and pre-industrial experiments conducted using the newly developed EC-Earth3-ESM-1 model under the framework of the EU project OptimESM. We focus particularly on evaluating the interaction between AMOC, AMO, and prominent large-scale atmospheric circulation patterns (e.g. the North Atlantic Oscillation (NAO), Hadley, and Walker circulation) using Empirical Orthogonal Function (EOF) and maximum covariance analysis methods. Our first results show that the EC-Earth3-ESM-1 model can reasonably capture the spatiotemporal relationship between the atmospheric circulation modes and AMOC/AMO compared to observation/reanalysis datasets. Additionally, we also investigate potential atmospheric circulation mode changes due to increasing CO2 concentration using idealized experiments. More detailed analyses will be further explored in this study.

How to cite: Wang, S., Wyser, K., Koenigk, T., Karami, M. P., and Navarro Labastida, R. G.: Evaluation of  the impact of the Atlantic Ocean on the atmospheric circulation using the  EC-Earth3-ESM-1 model, EGU General Assembly 2025, Vienna, Austria, 27 Apr–2 May 2025, EGU25-9455, https://doi.org/10.5194/egusphere-egu25-9455, 2025.

EGU25-10017 | ECS | Orals | CL4.9

Representation of the terrestrial carbon cycle in CMIP6 

Bettina K. Gier, Manuel Schlund, Pierre Friedlingstein, Chris D. Jones, Colin Jones, Sönke Zaehle, and Veronika Eyring

Simulation of the carbon cycle in climate models is important due to its impact on climate change, but many weaknesses in its reproduction were found in previous models. Improvements in the representation of the land carbon cycle in Earth system models (ESMs) participating in the Coupled Model Intercomparison Project Phase 6 (CMIP6) include the interactive treatment of both the carbon and nitrogen cycles, improved photosynthesis, and soil hydrology. To assess the impact of these model developments on aspects of the global carbon cycle, the Earth System Model Evaluation Tool (ESMValTool) is expanded to compare CO2-concentration- and CO2-emission-driven historical simulations from CMIP5 and CMIP6 to observational data sets. A particular focus is on the differences in models with and without an interactive terrestrial nitrogen cycle. Overestimations of photosynthesis (gross primary productivity (GPP)) in CMIP5 were largely resolved in CMIP6 for participating models with an interactive nitrogen cycle but remain for models without one. This points to the importance of including nutrient limitation in models. Simulating the leaf area index (LAI) remains challenging, with a large model spread in both CMIP5 and CMIP6. The global mean land carbon uptake (net biome productivity (NBP)) is well reproduced in the CMIP5 and CMIP6 multi-model means. This is the result of an underestimation of NBP in the Northern Hemisphere, compensated by an overestimation in the Southern Hemisphere and the tropics. Models from modeling groups participating in both CMIP phases generally perform similarly or better in their CMIP6 version compared to their CMIP5 version. Emission-driven simulations perform just as well as the concentration-driven models, despite the added process realism. Due to this, we recommend that ESMs in future Coupled Model Intercomparison Project (CMIP) phases perform emission-driven simulations as the standard so that climate–carbon cycle feedbacks are fully active. The inclusion of the nitrogen limitation led to a large improvement in photosynthesis compared to models not including this process, suggesting the need to view the nitrogen cycle as a necessary part of all future carbon cycle models. Overall, a slight improvement in the simulation of land carbon cycle parameters is found in CMIP6 compared to CMIP5, but with many biases remaining, further improvements of models in particular for LAI and NBP is required. Due to the inclusion of the study in ESMValTool, the analysis can easily be repeated on the upcoming CMIP7 models to evaluate the progress from CMIP6.

How to cite: Gier, B. K., Schlund, M., Friedlingstein, P., Jones, C. D., Jones, C., Zaehle, S., and Eyring, V.: Representation of the terrestrial carbon cycle in CMIP6, EGU General Assembly 2025, Vienna, Austria, 27 Apr–2 May 2025, EGU25-10017, https://doi.org/10.5194/egusphere-egu25-10017, 2025.

EGU25-10347 | ECS | Posters on site | CL4.9

Model evaluation for km-scale simulations within the Climate Adaptation Digital Twin: the AQUA approach 

Silvia Caprioli, Jost von Hardenberg, Matteo Nurisso, Paolo Davini, Natalia Nazarova, Supriyo Ghosh, Marco Cadau, Maqsood Mubarak Rajput, Aina Gaya-Àvila, and Janos Zimmermann

High-resolution climate simulations at the km-scale present significant challenges for data processing and analysis due to the massive data flow, memory bottlenecks, and scaling limitations. These demands exceed the capabilities of traditional data processing pipelines, requiring the development of innovative approaches to handle and analyze the data efficiently.

The Climate Adaptation Digital Twin, part of the European Commission’s Destination Earth initiative, addresses these challenges with a unified end-to-end workflow. This workflow integrates the full chain, from global km-scale climate simulations to real-world applications in sectors most affected by climate change (such as energy, hydrometeorology, wildfire management etc.)

Embedded within the Climate-DT framework, AQUA (Application for QUality Assessment) is a Python-based tool designed for the scientific evaluation of these simulations, featuring a core engine optimized for efficient access to high-resolution data and modular diagnostics suite that ensure consistent and scalable analysis. It runs within a containerized environment on high-performance computing (HPC) systems, ensuring portability and compatibility across different machines and computational infrastructures.

AQUA evaluates climate model outputs through key diagnostics (such as model biases, timeseries, top-of-the-atmosphere energy balance, ocean circulation metrics etc.) while also providing innovative diagnostics to analyze tropical rainfall, cyclone structures, and other km-scale processes traditionally challenging to study.

Within the Climate-DT workflow, AQUA enables real-time monitoring, systematic comparisons, and quality control of ongoing simulations, building confidence in model results for climate adaptation decisions. The pipeline automatically generates intake catalog entries for new data and creates a low-resolution archive derived from high-resolution data, allowing for more efficient execution of default diagnostics. As each new simulation year is generated, analyses are automatically performed and the results are published on a dedicated website and dashboard, offering visualizations and actionable insights based on real-time data.

How to cite: Caprioli, S., von Hardenberg, J., Nurisso, M., Davini, P., Nazarova, N., Ghosh, S., Cadau, M., Mubarak Rajput, M., Gaya-Àvila, A., and Zimmermann, J.: Model evaluation for km-scale simulations within the Climate Adaptation Digital Twin: the AQUA approach, EGU General Assembly 2025, Vienna, Austria, 27 Apr–2 May 2025, EGU25-10347, https://doi.org/10.5194/egusphere-egu25-10347, 2025.

EGU25-10697 | ECS | Orals | CL4.9

Vertical profiles of tropical temperature trends: comparing satellite-based radio occultation data with CMIP6 climate models 

Vitus Woge Nielsen, Bo Christiansen, Shuting Yang, Hans Gleisner, and Kent Bækgaard Lauritsen

In the tropics, the upper troposphere warms faster than the lower troposphere and the surface in response to increased greenhouse gas concentrations. This differential warming is a robust feature in climate models. High-quality observational datasets confirm the stronger warming at higher altitudes, but limitations in the observing systems have made it difficult to accurately characterize the vertical structure of observed temperature trends in the tropics. Additionally, the low vertical resolution of most satellite-based data records with a global coverage further complicate the comparison of climate models and observations.

We have analyzed the vertical structure of tropical temperature trends using satellite-based Radio Occultation (RO) data from EUMETSAT’s RO Meteorology Satellite Application Facility (ROM SAF) for the period from 2002 to 2024. These data are compared with the CMIP6 ensemble of about 250 members from more than 30 models using combined historical and scenario runs under SSP2-4.5. The RO data provides a stable climate reference, combining global coverage with high vertical resolution, and has only recently reached the length necessary for trend analysis. Our comparison confirms the warming biases in the CMIP6 models previously reported in the literature – the models warm faster than the observations in the upper troposphere. In contrast, they cool faster in the stratosphere than the RO data. Furthermore, we demonstrate that there are substantial differences in the vertical trend structure between the CMIP6 models and the RO data: the models show peak trends in the middle to upper troposphere around 250-300 hPa, while the RO data have maximum trends in the lower stratosphere, around 50-100 hPa. In this presentation, we describe the characteristics of the RO climate data records and discuss the significance of the RO-CMIP6 differences, considering the uncertainties of the observations and the spread amongst the CMIP6 models.

How to cite: Nielsen, V. W., Christiansen, B., Yang, S., Gleisner, H., and Lauritsen, K. B.: Vertical profiles of tropical temperature trends: comparing satellite-based radio occultation data with CMIP6 climate models, EGU General Assembly 2025, Vienna, Austria, 27 Apr–2 May 2025, EGU25-10697, https://doi.org/10.5194/egusphere-egu25-10697, 2025.

EGU25-11493 | ECS | Posters on site | CL4.9

Benchmarking Global Ocean Carbon Cycle models: Uncertainties in anthropogenic CO2 uptake estimation  

Sreeush Mohanan Geethalekshmi, Özgür Gürses, Nathan Collier, and Judith Hauck

The ocean carbon cycle plays a crucial role in the uptake and storage of atmospheric carbon dioxide. The Global Carbon Budget (GCB) provides annual estimates of this oceanic carbon sink, with the latest estimate for 2022 indicating a net uptake of 2.8 ± 0.4 Gt C yr-1 (Friedlingstein et al., 2023). However, the estimates by global ocean biogeochemistry models (GOBMs, 2.5 ± 0.4 Gt C yr-1 ) are substantially lower than the estimates based on upscaled observations (3.1 Gt C yr-1 [2.5, 3.3]) and the range of the sink estimates covered by the GOBMs is substantial (1.1 Gt C yr-1 ). Biases and uncertainties in the GOBM estimates of the ocean carbon sink may be due to imperfections in the representation of physical (e.g., transport, mixing) and biogeochemical processes, as well as in the forcing fields.

To address these uncertainties, we employ the International Ocean Model Benchmarking (IOMB) system to evaluate the performance of GCB models against state-of-the-art observations. IOMB is a Python-based open-source software package that is used to evaluate the performance of Earth System Models and the counterpart to ILAMB that is used to evaluate the dynamic vegetation models for the land sink in the GCB. Using IOMB, we analyze the physical (upper ocean temperature, vertical temperature gradient, mixed layer depth, salinity) and biogeochemical (nutrients, chlorophyll, oxygen, total alkalinity, dissolved inorganic carbon (DIC), anthropogenic DIC) variables of interest. but all the variables in the current version of IOMB evaluate the general performance of the ocean biogeochemistry models, not specifically the ocean carbon uptake.The addition of new targeted metrics such as AMOC, stratification indices, CFCs and Revelle factor will help to reduce the source of uncertainty in these models. IOMB evaluates the model performances using statistical measures such as bias, root mean square error (RMSE), annual cycle phase, spatial distribution, interannual variability and a score will be estimated for each model, providing a benchmark for the current state of GCB models and highlighting the areas for further model development.

The goal is to improve the accuracy and reliability of ocean carbon uptake estimates, which are essential for informing climate policy. Through this process, IOMB will provide valuable feedback to the modeling community, offering guidance on how to improve ocean biogeochemical simulations and better constrain the oceanic carbon sink in the context of global carbon budgets. This is a necessary first step towards weighting GCB models in estimating the ocean carbon sink.

How to cite: Mohanan Geethalekshmi, S., Gürses, Ö., Collier, N., and Hauck, J.: Benchmarking Global Ocean Carbon Cycle models: Uncertainties in anthropogenic CO2 uptake estimation , EGU General Assembly 2025, Vienna, Austria, 27 Apr–2 May 2025, EGU25-11493, https://doi.org/10.5194/egusphere-egu25-11493, 2025.

EGU25-12909 | ECS | Orals | CL4.9

Filtered future projections in the Western Mediterranean: atmospheric circulation patterns and climate extremes 

Matias Olmo, Pep Cos, Diego Campos, Ángel Muñoz, Albert Soret, and Francisco Doblas-Reyes

The Western Mediterranean (WMed) has been pointed out as a hotspot region for both warming and drying signals. However, there is still large uncertainty in future projections due to model uncertainty and misrepresentation of specific processes. Thus, the need for a better understanding of the future climate of the WMed becomes evident. Improved climate indicators for decision-making can benefit from a deeper insight on future climate extremes and their related atmospheric circulation, taking into account the spread in model performances over the WMed region. 

The present work is based on the analysis of future projections of rainfall and temperature extremes from a set of CMIP6 global climate models (GCMs) during 2070-2100, according to their representation of the dominant synoptic circulation patterns (CPs). CPs are defined using daily mean sea level pressure (SLP) using hierarchical clustering and data reduction through empirical orthogonal functions. The ERA5 reanalysis during 1950-2022 was considered as the reference to evaluate the historical GCMs simulations, constructing the CPs with SLP and analyzing their link to surface variables including precipitation, maximum and minimum temperatures. To assess the future synoptic circulation, the clustering algorithm is replicated and future CPs are compared to the historical ones in terms of frequency, shape and intensity changes in the CPs.

Based on the historical CPs, a model ranking is generated using a combination of spatial and temporal reproduction metrics for the SLP patterns and the associated surface conditions. GCMs manage to reproduce the annual cycle of the CPs frequency, with a dominant summer CP enhancing warm and dry conditions. However, the correct timing of this pattern and the transitional CPs (that is, during the autumn and spring seasons) still need to be more accurate. The analysis of the associated surface patterns shows good model performance, better for temperature than for rainfall, particularly in the transition seasons, for which the GCMs spread in their skill score increases. This process-based evaluation leads to a model ranking that is used to construct multiple model ensembles, considering different weighting strategies based on model performance, spread and independence. 

In terms of climate extremes, the uncertainty in future projections of the indices ─including the expected increases in the frequency of warm days and dry spells─ can be reduced by selecting specific subsets of GCMs, according to the process-based ranking. In particular, the warming and drying signals over areas such as the northeastern Iberian Peninsula are clearer in the best-performing GCMs ensemble. This constraining procedure shows more clear results in summer than in winter, when natural variability has a larger role in modulating the WMed changing climate.

These changes in temperature and rainfall extremes were related to the changing frequency of the CPs driving the specific extremes. CPs present some differences in their seasonal distribution for the late 21st century compared to their historical records, while the centroids of the CPs often present changes, evidencing modifications in the intra-pattern variability. Altogether, the projected future extremes can be associated with differences in future climate variability, given a context of global warming.

How to cite: Olmo, M., Cos, P., Campos, D., Muñoz, Á., Soret, A., and Doblas-Reyes, F.: Filtered future projections in the Western Mediterranean: atmospheric circulation patterns and climate extremes, EGU General Assembly 2025, Vienna, Austria, 27 Apr–2 May 2025, EGU25-12909, https://doi.org/10.5194/egusphere-egu25-12909, 2025.

EGU25-13114 | Orals | CL4.9

First steps towards paleoclimate constraints for climate prediction and projections with the ICON model 

Kira Rehfeld, Julia Brugger, Muriel Racky, Jean-Philippe Baudouin, Johann Jungclaus, Fanni Dora Kelemen, Stephan Lorenz, Sebastian Wagner, and Martin Köhler

Anthropogenic emissions are changing Earth’s global mean temperature towards levels unseen over the observational period. During the Last Interglacial (LIG) warm period, 129-116 thousand years ago, global mean temperature reached up to 1-2 degrees above preindustrial conditions, forced primarily by changes in Earth’s orbit. Both the Greenland and Antarctic Ice sheet were smaller, with sea level at least 5m, potentially up to 10m, above present levels.

The seasonal distribution of solar insolation during the LIG was characterized by higher eccentricity, obliquity, and precession leading to increased Northern, and decreased Southern Hemisphere summer insolation. Most Earth System Models included in the Palaeoclimate Model Intercomparison Project phases 3 and 4 have shown a temperature anomaly of -0.5 up to around 0.5 degrees, far lower than what has been suggested from reconstructions [Otto-Bliesner et al., 2021].

Here, we show first results from idealized equilibrium simulations with a configuration of ICON for climate prediction and projections [ICON-xpp, Müller et al 2025], varying the planetary orbit using Kepler’s solutions [Roeckner et al 2003]. We investigate the impact of different orbital forcing on global and regional temperature and precipitation mean state and variability, and discuss the impact of the choice of the land model (JSBACH vs. TERRA).

Simulating climate conditions during past warm periods, and evaluating how they compare to palaeoclimate reconstructions, improves our understanding of the Earth System, and can enhance the robustness of future projections. Our initial characterization and evaluation of orbital impacts on climate variability in ICON-xpp is therefore a crucial step towards simulating and then evaluating model performance for longer timescales, or deeper-time periods such as the Eocene, Miocene or Pliocene warmth. Moreover, using higher-resolution ICON paleoclimate simulations could provide a better basis for upcoming model-proxy data comparisons and forward modeling approaches on regional-to-local scales.


References

Otto-Bliesner, Bette L., et al. “The PMIP4 Contribution to CMIP6 - Part 2: Two Interglacials, Scientific Objective and Experimental Design for Holocene and Last Interglacial Simulations.” Geoscientific Model Development 10, no. 11 (2017): 3979–4003. https://doi.org/10.5194/gmd-10-3979-2017.

Roeckner, E., Bäuml, G., Bonaventura, L., Brokopf, R., Esch, M., Giorgetta, M., et al. (2003).The atmospheric general circulation model ECHAM 5. PART I: Model description. Report / Max-Planck-Institut für Meteorologie, 349.

Müller, W.; Lorenz, S., 2024, "Source code and scripts for publication 'The ICON-based coupled Earth System Model for Climate Predictions and Projections (ICON XPP)'", https://doi.org/10.17617/3.UUIIZ8

How to cite: Rehfeld, K., Brugger, J., Racky, M., Baudouin, J.-P., Jungclaus, J., Kelemen, F. D., Lorenz, S., Wagner, S., and Köhler, M.: First steps towards paleoclimate constraints for climate prediction and projections with the ICON model, EGU General Assembly 2025, Vienna, Austria, 27 Apr–2 May 2025, EGU25-13114, https://doi.org/10.5194/egusphere-egu25-13114, 2025.

EGU25-13494 | Orals | CL4.9

The systematic biases of CMIP6 climate models: remote connections and impacts 

Shuting Yang, Bo Christiansen, Chuncheng Guo, Rashed Mahmood, and Tian Tian

Despite tremendous efforts made to improve model performance over the past several decades, climate models exhibit systematic errors or biases in the simulation of many aspects and regions of the climate system. These systematic biases indicate the misrepresentations of physical processes in the models, which can be amplified by feedbacks among different processes and/or climate components. The magnitude of the model biases is often similar to the magnitude of the climate change that have been observed in the past several decades in some regions and for some parameters. This gives rise to large uncertainties in the climate predictions and projections. Furthermore, using climate models with such biases for assessing future climate change implies an assumption that these biases are stationary over time. However, the assumption may not be justified due to the internal variability and the evolving background state of the climate system.

In this study, we investigate model biases of key climate variables with the aim of understanding their links with biases of the same or other variables at remote locations. We analyze the multi-model multi-member ensemble (MME) of CMIP6 historical runs. We first focus on the model bias of the Atlantic meridional overturning circulation (AMOC) and its links with remote oceanic biases (e.g., sea surface temperature, sea surface salinity), North Atlantic deep water formation, etc.) and sea ice extent, as well as the atmospheric biases. We assess to what extent these linkages may affect the AMOC change. We further explore the representations of the circulation modes (e.g., North Atlantic Oscillation) in the CMIP6 MME relative to the observations, with emphasis on understanding how the internal variability influences the representation of the circulation modes and their relationship with other climate variables, and how these relationships in turn impact the climate predictability.

How to cite: Yang, S., Christiansen, B., Guo, C., Mahmood, R., and Tian, T.: The systematic biases of CMIP6 climate models: remote connections and impacts, EGU General Assembly 2025, Vienna, Austria, 27 Apr–2 May 2025, EGU25-13494, https://doi.org/10.5194/egusphere-egu25-13494, 2025.

EGU25-13706 | ECS | Posters on site | CL4.9

Coupling model of human-earth system to explore global climate and carbon emission changes 

Weixing Zhao, Jieming Chou, and Zhiqiang Cui

Against the backdrop of global climate change, Earth System Models (ESM) are widely used in the projection of future climate change. With the continuous development and evolution of Earth System Models, in addition to the inherent errors of the models themselves, the dynamic changes in future human activities also bring extremely significant uncertainties to the projection of climate change. At a time when the impact of human activities on climate change is continuously intensifying, Integrated Assessment Models are being more and more widely applied in the projection of future human social development.

In view of this, we set about coupling the two types of models, Earth System Models and Integrated Assessment Models, to explore the changing trends of future human society and the climate system. Specifically, first, we use an optimized climate change loss function to make the output results of the Integrated Assessment Model more reliable. As a result, the obtained future global CO2 emission data can also better fit the actual development situation of future human society. Secondly, new carbon dioxide emission data is used to drive the Community Earth System Model (CESM). Finally, the experimental results after coupling the Earth System Model and the Integrated Assessment Model are compared with the CMIP6 simulation experimental results to further explore the future climate change in 12 global regions after comprehensively considering human activities. The research results clearly show that the high-value areas of future climate change losses are concentrated in India and Southeast Asia. Moreover, extreme high-temperature and extreme precipitation events in the regions near the equator will increase significantly in the future.

This research not only helps to conduct scientific and rigorous assessments of regional climate change losses and accurately predict future CO2 emission paths, but also greatly enriches the content related to the impact of human activities in Earth System Models and has extremely important promoting significance for the scientific assessment of future climate change.


How to cite: Zhao, W., Chou, J., and Cui, Z.: Coupling model of human-earth system to explore global climate and carbon emission changes, EGU General Assembly 2025, Vienna, Austria, 27 Apr–2 May 2025, EGU25-13706, https://doi.org/10.5194/egusphere-egu25-13706, 2025.

EGU25-13866 | Orals | CL4.9

Berkeley Earth Climate Model Synthesis 

Robert Rohde and Devin Rand

The global cimate models (GCMs) included in the CMIP6 compilation provide critical insights into global warming but often exhibit biases at local and regional scales. While bias-correction and downscaling are common, existing methods rarely incorporate multi-model ensembles or extend their applicability to a global field. We present a downscaled and bias-corrected CMIP6 synthesis that spans the full range of CMIP6 projections to enhance the accuracy of future climate projections, facilitate adaptation efforts, and increase climate resilience. 

Our new work synthesizes a bias-corrected and downscaled surface temperature product derived from 45 GCMs and 374 runs across five shared socioeconomic pathways. We employ a robust bias-correction framework that compares historical model runs against reanalysis data (ERA5: 1940-present) and observation-based data (Berkeley Earth: 1850-present). Each grid cell is decomposed into three components: (1) long-term trends, (2) annual seasonality, and (3) short-term weather variability.  Trends and seasonality are calculated with a LOESS fit with Gaussian weighting.  Residual daily variability is represented using evolving probability distributions with explicitly modeled extremes through generalized Pareto formalism to enable accurate estimation of rare events.  The resulting fields are then statistically downscaled to 0.25° x 0.25° latitude-logitude resolution using predictive regressions derived from high resolution historical observations.  Further, each component is bias corrected and scaled to match the mean and trends observed in the historical period.

This analysis results in bias corrected and downscaled verions of each of the input GCMs.  These bias corrections, based on constraints over the historical period, significantly reduce the spread in model projections of the future, and by extension the implied uncertainty in long-term warming scenarios.

The corrected models are then further synthesized into a unified dataset, with model selection and weighting guided by historical accuracy.  This provides easy access to local changes, consistently representing both past temperature changes and expected future changes.  Data is provided both for long-term trends as well as daily extremes with measures of uncertainty guided by the remaining variations across models.  Further, this approach makes it easy to calculate changes in temperature derived variables, such as cooling-degree days or heat wave indices.

The Berkeley Earth climate model synthesis will deliver detailed probabilities of extreme climate events for each shared socioeconomic pathway.  The initial focus is on surface temperature changes, with an additional synthesis of precipitation changes planned for the next phase of this work.  This product aims to support future academic research, inform policy and adaptation strategies, and provide actionable climate risk insights for asset management and decision-making.

How to cite: Rohde, R. and Rand, D.: Berkeley Earth Climate Model Synthesis, EGU General Assembly 2025, Vienna, Austria, 27 Apr–2 May 2025, EGU25-13866, https://doi.org/10.5194/egusphere-egu25-13866, 2025.

EGU25-13903 | Orals | CL4.9

Advancing Ocean Biogeochemistry in the ICON-XPP Earth System Model for CMIP7 Contribution 

Fatemeh Chegini, Jiajun Wu, and Tatiana Ilyina

We present an evaluation of ocean biogeochemistry simulations in a newly developed Earth System model configuration: ICON XPP. ICON XPP is an outcome of a national effort to develop an Earth system model configuration within the ICON architecture, serving as a baseline for next-generation climate predictions and projections. This model will underpin the German contribution to CMIP7. 

The ocean biogeochemistry in ICON XPP is represented by the HAMburg Ocean Carbon Cycle model (HAMOCC; Ilyina et al. 2013), with novel developments over its predecessor in the MPI-ESM CMIP6 version. HAMOCC has already been implemented in the previous configurations of the ICON-based models (Jungclaus et al. 2022; Hohenegger et al. 2023). Recent key advancements include integrating a prognostic calculation for marine aggregate sinking speeds (Maerz et al. 2020), providing an improved distribution of particulate organic carbon fluxes critical to the biological pump. Additionally, the model incorporates an enhanced nitrogen cycle, enabling a more comprehensive representation of nutrient dynamics and N2O fluxes.

Here we discuss the HAMOCC model performance within the higher-resolution ICON XPP configuration, capturing finer-scale oceanographic processes. The framework features horizontal grid spacing of approximately 80km with 130 vertical levels in the atmosphere, and 20km with 72 vertical levels for the ocean, running in concentration-driven mode. We detail the ocean biogeochemistry model tuning steps and show that the simulated present-day distributions of biogeochemical fields compare well with observations, demonstrating the robustness of the ICON XPP configuration for next-generation Earth system modeling.

How to cite: Chegini, F., Wu, J., and Ilyina, T.: Advancing Ocean Biogeochemistry in the ICON-XPP Earth System Model for CMIP7 Contribution, EGU General Assembly 2025, Vienna, Austria, 27 Apr–2 May 2025, EGU25-13903, https://doi.org/10.5194/egusphere-egu25-13903, 2025.

EGU25-14075 | ECS | Orals | CL4.9

Improving Carbon Cycle Feedbacks in Simple Climate Models: Adding Wetland Methane to MAGICC 

Trevor Sloughter, Zebedee Nicholls, Gang Tang, and Joeri Rogelj

Simple climate models (SCMs) can emulate many of the trends and processes found in ESMs allowing for much faster runs, but among other trade-offs, they can be limited by what is already available in ESMs. In the case of natural methane emissions, there remains a high degree of uncertainty even among larger scale models over the next century and beyond, particularly in regards to wetlands. Many of the models which do exist show a strong linear relationship between global temperatures and methane emissions from wetlands. The simple climate model MAGICC, meanwhile, had previously not included a dynamic natural methane response. A linear model of wetlands methane as a function of global temperature was calibrated to output data from existing models and incorporated into MAGICC. This new version of MAGICC draws from a distribution of parameters in line with the wide spread of estimates available from existing models and informed by the available observational data. The C1, C2, C3, and C4 scenarios from AR6 were run through the new model, all experiencing a wider spread of projected temperatures. While many uncertainties remain in this simplified approach, this raises concerns about 2°C targets in these scenarios.

How to cite: Sloughter, T., Nicholls, Z., Tang, G., and Rogelj, J.: Improving Carbon Cycle Feedbacks in Simple Climate Models: Adding Wetland Methane to MAGICC, EGU General Assembly 2025, Vienna, Austria, 27 Apr–2 May 2025, EGU25-14075, https://doi.org/10.5194/egusphere-egu25-14075, 2025.

EGU25-14085 | Posters on site | CL4.9

Two-way coupling between an LSM and an IAM for assessing the future global water stress 

Tetsuya Fukuda, Yuichi Muto, Hiroaki Kawata, Tomoko Nitta, Roman Olson, and Kei Yoshimura

In recent years, water shortages have become increasingly apparent, and it is hoped that by predicting where and to what extent water shortages will occur in the future and reflecting this in water use planning, we can contribute to the sustainable development of society. Future changes in water resources are calculated using an Earth System Model (ESM) and a Land Surface Model (LSM) within the ESM, and economic and social changes are calculated using an Integrated Assessment Model (IAM). We have therefore achieved a realistic water balance model between the environment and the economy/society in land areas by two-way coupling between an ESM/LSM and an IAM. We used ILS [1] as the LSM and GCAM [2] as the IAM. When passing the amount of water resources from ILS to GCAM, we did not pass the raw values but the deviation. The constant values that GCAM originally had were rewritten by the values modified using the deviation. The deviation was calculated by comparing the average values for the past 10 years and the average values for the past 5 years from the time steps when the data exchange occurred, and evaluating the ratio of how much the 5-year average was larger/smaller than the 10-year average. The coupling from GCAM to ILS was achieved by passing the land use changes downscaled using Demeter [3]. When the definition of land use types differed between Demeter and ILS, the type of Demeter’s output was converted to that of the input of ILS by carrying out the method developed in [4]. Using this coupled system, we present the results of annual and seasonal evaluations of water stress from 2020 to 2100. In addition, the assessment results of the population exposed to high water stress are also presented.


[1] Nitta, Tomoko, et al. "Development of integrated land simulator." Progress in Earth and Planetary Science7.1 (2020): 1-14.

[2] Calvin, Katherine, et al. "GCAM v5. 1: representing the linkages between energy, water, land, climate, and economic systems." Geoscientific Model Development12.2 (2019): 677-698.

[3] Vernon, Chris R., et al. "Demeter–a land use and land cover change disaggregation model." Journal of Open Research Software 6.PNNL-SA-131044 (2018).

[4] Fushio, Keigo, et al. “Water stress assessment by coupled simulation of Integrated Land Simulator (ILS) and Integrated Assessment Model (IAM).”, SEISAN KENKYU75.2 (2023): 135-140.

How to cite: Fukuda, T., Muto, Y., Kawata, H., Nitta, T., Olson, R., and Yoshimura, K.: Two-way coupling between an LSM and an IAM for assessing the future global water stress, EGU General Assembly 2025, Vienna, Austria, 27 Apr–2 May 2025, EGU25-14085, https://doi.org/10.5194/egusphere-egu25-14085, 2025.

EGU25-14629 | Orals | CL4.9

New Coupling Capabilities in the Energy Exascale Earth System Model (E3SM) 

Robert Jacob, Iulian Grindeanu, Vijay Mahadevan, and Danqing Wu

To improve the computational efficiency and scientific productivity, efforts have been made to transition the coupling infrastructure of the current E3SM model from the Model Coupling Toolkit (MCT) to a topology-aware library, the Mesh Oriented datABase (MOAB). Unlike MCT, MOAB provides a comprehensive description of the topology for each submodel in E3SM and exposes interfaces to seamlessly query and serialize field data directly on mesh entities.  With complete mesh representations, the new E3SM coupler can now compute and apply optimal decompositions, generate traditional conservative (first and high-order) mapping weights using TempestRemap and apply the weights to compute field projections that are essential in coupled simulations.  MOAB's purely local memory model without the use of O(p) data structures, provides good scaling and its C++ code base provides multiple avenues to exploit fine-grained parallelism with GPUs.   Simultaneously, E3SM is adding new coupling pathways for dynamic ice sheets and surface wave models.  We will present the new infrastructure and its performance in comparison to MCT for representative cases.

How to cite: Jacob, R., Grindeanu, I., Mahadevan, V., and Wu, D.: New Coupling Capabilities in the Energy Exascale Earth System Model (E3SM), EGU General Assembly 2025, Vienna, Austria, 27 Apr–2 May 2025, EGU25-14629, https://doi.org/10.5194/egusphere-egu25-14629, 2025.

EGU25-14773 | Orals | CL4.9 | Highlight

The CMIP Rapid Evaluation Framework (REF) for automated and systematic benchmarking of coupled models 

Forrest Hoffman, Birgit Hassler, Jared Lewis, Bouwe Andela, Nathan Collier, Jiwoo Lee, Ana Ordonez, Briony Turner, Paul Ullrich, and Min Xu and the CMIP Climate Model Benchmarking Task Team

The goal of the Coupled Model Intercomparison Project (CMIP) is to better understand past, present, and future changes in the Earth system in a multi-model context. In an effort to increase the project’s scientific and societal relevance, improve accessibility, and widen participation, the CMIP Panel advocated for establishing a number of Task Teams aimed at supporting the design, scope, and definition of the next phase of CMIP, as well as the evolution of infrastructure for and operationalization of CMIP activities. 

An important prerequisite for providing credible information about the Earth system from models is to understand their capabilities and limitations. Thus, systematic and comprehensive assessment of models in comparison with best-available observational and reanalysis data is essential. For CMIP7 new model evaluation challenges stemming from higher resolution, enhanced complexity, and machine learning components need to be rigorously addressed. The Climate Model Benchmarking Task Team aims to provide a vision and concrete guidance for establishing a systematic, open, and rapid performance evaluation of the expected large number of models participating in CMIP7, including a variety of performance metrics and informative diagnostics. The Task Team designed a plan for a community Rapid Evaluation Framework (REF) that would leverage and integrate existing open source community model evaluation tools for benchmarking the performance of CMIP simulations contributed by participating modeling centers.

Based on community input, an initial set of metrics and diagnostics were identified to be applied to Intergovernmental Panel on Climate Change (IPCC) Seventh Assessment Report (AR7) Fast Track simulations. With co-sponsorship from the US Department of Energy (DOE) and the European Space Agency (ESA), the development of the REF was launched in November 2024. The REF delivery team will integrate evaluation tools and a workflow system that will be deployed at two or more primary Earth System Grid Federation (ESGF) node sites to provide automated production of diagnostic information for CMIP model developers, data users, and stakeholders. The REF is expected to evolve to provide additional metrics and diagnostics and to use more data products in the future through the guidance of a community panel or consortium that will be formed in the coming year.

How to cite: Hoffman, F., Hassler, B., Lewis, J., Andela, B., Collier, N., Lee, J., Ordonez, A., Turner, B., Ullrich, P., and Xu, M. and the CMIP Climate Model Benchmarking Task Team: The CMIP Rapid Evaluation Framework (REF) for automated and systematic benchmarking of coupled models, EGU General Assembly 2025, Vienna, Austria, 27 Apr–2 May 2025, EGU25-14773, https://doi.org/10.5194/egusphere-egu25-14773, 2025.

EGU25-16600 | ECS | Orals | CL4.9

AWI-CM3 to AWI-ESM3: Expanding Degrees of Freedom in Kilometer-Scale Climate Modeling 

Jan Streffing, Laszlo Hunor Hajdu, Paul Miller, Lars Nieradzik, Martin Lindahl, Philippe le Sager, Uwe Fladrich, Gerrit Lohmann, and Thomas Jung

Earth system modeling is vital for understanding the Earth's complex processes and predicting climate change impacts. These models require high degrees of freedom to accurately represent interactions and feedbacks among the atmosphere, oceans, and biosphere. This complexity is essential for generating reliable climate projections, informing policy, and developing adaptation strategies.
In this context, the recent development of the AWI-CM3, a coupled atmosphere-ocean general circulation model (AOGCM), marks a significant advancement in climate modeling, addressing the need for improved accuracy and resolution. The AWI-CM3 outperforms CMIP6 standards at low resolution (~100 km) and demonstrates impressive capabilities for high-resolution simulations, with global coupled models evaluated at resolutions of 31 km and 9 km, and a 4.5 km resolution model currently running. 
Our ongoing efforts further reflect this commitment to complexity and precision. Here, we present results from the recent upgrade to OpenIFS 48r1, integrating cutting-edge features from NWP/ECMWF to improve core atmospheric processes. This upgrade strengthens the model’s capacity to simulate weather extremes, atmospheric dynamics, and precipitation patterns with greater fidelity. Additionally, we evaluate the first major step in the evolution from AWI-CM3 to AWI-ESM3: enhancing the model through dynamic vegetation coupling with LPJ-Guess 4.1.2. This integration allows for more realistic simulations of vegetation feedbacks, and land-atmosphere interactions, which are essential for accurately capturing long-term climate trends and ecosystem changes.
Looking ahead, the incorporation of ice sheet dynamics using the Parallel Ice Sheet Model (PISM) will extend the capabilities of our Earth System Model, AWI-ESM3, enabling more comprehensive climate projections. Parallel work is ongoing to couple the ocean biogeochemistry model FESOM2/RECOM with the atmospheric carbon cycle, providing a more holistic representation of the carbon-climate feedbacks. Additionally, integrating CMIP7 forcing datasets will further align the model with the latest climate modeling standards, reinforcing its role in advancing both regional and global climate assessments.

How to cite: Streffing, J., Hajdu, L. H., Miller, P., Nieradzik, L., Lindahl, M., le Sager, P., Fladrich, U., Lohmann, G., and Jung, T.: AWI-CM3 to AWI-ESM3: Expanding Degrees of Freedom in Kilometer-Scale Climate Modeling, EGU General Assembly 2025, Vienna, Austria, 27 Apr–2 May 2025, EGU25-16600, https://doi.org/10.5194/egusphere-egu25-16600, 2025.

EGU25-16927 | ECS | Orals | CL4.9

Guidelines for Working with Multi-Model Ensembles in CMIP 

Anja Katzenberger, Nina Črnivec, Punya Puthukulangara, Evgenia Galytska, Keighan Gemmell, Christine Leclerc, Jhayron S. Perez-Carrasquilla, Indrani Roy, Arianna Varuolo-Clarke, and Milica Tošić

Earth System Models (ESMs) are the key tool for studying the climate under changing conditions. Over recent decades, it has been established to not only rely on projections of single models, but to combine various ESMs in multi-model ensembles (MMEs) to improve robustness and quantify the uncertainty of the projections. The data access for MME studies has been fundamentally facilitated by the World Climate Research Programme’s Coupled Model Intercomparison Project (CMIP) - a collaborative effort bringing together ESMs from modelling communities all over the world. Despite the CMIP standardisation processes, addressing specific research questions using MMEs requires unique ensemble design, analysis, and interpretation choices. Based on our collective expertise of the Fresh Eyes on CMIP initiative, we have identified common issues and questions encountered while working with climate MMEs. In this project we aim to provide a comprehensive literature review giving an overview over the considerations that have to be taken into account for these decisions. In detail, we provide statistics tracing the development of the field throughout the last decades, we outline guidelines synthesising existing studies regarding model evaluation, model dependence, weighting methods and uncertainties. We summarize a collection of tools and other useful resources for MME studies, we furthermore review common questions and strategies, and finally, we outline emerging trends, such as the integration of machine learning techniques, single model initial-condition large ensembles (SMILES), and computational resource considerations.

How to cite: Katzenberger, A., Črnivec, N., Puthukulangara, P., Galytska, E., Gemmell, K., Leclerc, C., Perez-Carrasquilla, J. S., Roy, I., Varuolo-Clarke, A., and Tošić, M.: Guidelines for Working with Multi-Model Ensembles in CMIP, EGU General Assembly 2025, Vienna, Austria, 27 Apr–2 May 2025, EGU25-16927, https://doi.org/10.5194/egusphere-egu25-16927, 2025.

EGU25-17809 | ECS | Orals | CL4.9

Evaluation of EURO-CORDEX Regional Climate Models: Model Subselection for Switzerland 

Lilja Steinunn Jónsdóttir, Anna Merrifield Könz, Erich Fischer, and Reto Knutti

Accurate projections of regional climate change are crucial for understanding future risks and formulating effective adaptation strategies. Switzerland's complex topography and diverse climate pose challenges to obtaining reliable modeling of its future climate. This study evaluates the EURO-CORDEX regional climate models (RCMs) to identify a subset of models best suited for temperature and precipitation projections in Switzerland. The evaluation focuses on their ability to capture trends, climatological means, and variability, while ensuring the models do not produce unrealistic or physically implausible results. Using both qualitative and quantitative methods, we address the challenges of model sub-selection within the context of Switzerland's complex terrain.

We evaluate model performance using observational datasets, including high-resolution gridded climatologies and in situ measurements. Statistical metrics such as bias, root mean square error (RMSE), and correlation coefficients are used to assess the agreement between model outputs and observations. Additionally, we evaluate projected future changes by examining their consistency with established physical principles and observed climate trends.

Our analysis demonstrates that the selected subset of models captures a large fraction of the uncertainty in projections from the full ensemble while aligning more closely with observed trends. Furthermore, using a transient time-resampling approach, we show that this subset provides robust information on climate change at different Global Warming Levels. This method can be readily applied to other regions and helps mitigate biases in warming projections caused by time-invariant aerosol forcing.

How to cite: Jónsdóttir, L. S., Merrifield Könz, A., Fischer, E., and Knutti, R.: Evaluation of EURO-CORDEX Regional Climate Models: Model Subselection for Switzerland, EGU General Assembly 2025, Vienna, Austria, 27 Apr–2 May 2025, EGU25-17809, https://doi.org/10.5194/egusphere-egu25-17809, 2025.

EGU25-18233 | ECS | Orals | CL4.9

Improved climate projections by combining CMIP6 models according to their local multivariate performance 

Lucas Schmutz, Soulivanh Thao, Mathieu Vrac, Denis Allard, and Gregoire Mariethoz

In many applications, it is desirable to aggregate climate model projections by combining multiple models into a single projection that aims to leverage their collective strengths, often resulting in improved performance compared to individual models. While climate models exhibit varying levels of global average bias, their local performance often displays significantly larger biases—sometimes by an order of magnitude—with each model showcasing distinct strengths and weaknesses in different regions. Aggregating models without accounting for these spatial differences can degrade the quality of projections by diluting strong regional signals from high-performing models. While many approaches ranging in complexity have been developed, including the commonly used Multi-Model Mean (MMM) and weighted MMM, these methods typically apply a global weighting to the models, overlooking the fact that certain models may excel only in specific regions.

To date, the Graph Cut optimization method (Thao et al., 2022) stands out as one of the few techniques effectively leveraging the local capabilities of different models across multi-decadal periods to produce global projections. This method involves selecting the best performing model for each grid point while also ensuring the spatial consistency of the resulting fields. Despite its promising results, which surpass those of other ensemble combination techniques, it is restricted to optimizing for a single variable. This limitation causes inconsistent model selection across variables in multivariate scenarios. This leads to a loss of the multivariate relationships captured in the models. Furthermore, this technique was limited to multi-decadal averages, and is thus unable to capture the distributional characteristics of climate variables, including extreme and compound events.

Here, we present significant enhancements to the Graph Cut optimization method, enabling the combination of distributions of daily values. This approach preserves multivariate relationships, better capturing the complete span of climate dynamics. By employing the Hellinger distance to assess model performance, we can identify, at each grid point, the model that most accurately represents the multivariate distribution of target variables (e.g., temperature, pressure, and precipitation), minimizing the emergence of unrealistic discontinuities in the combined fields.

To demonstrate the use of our method, we combine 22 models from CMIP6 using three variables: temperature, precipitation, and sea level pressure, achieving better reproduction of ERA5 reanalysis compared to the Multi-Model Mean (MMM). Additionally, a perfect model experiment was conducted to evaluate the robustness and stability of the methodology under high climate change scenarios, such as SSP8.5, and over extended timescales reaching the end of the century. These results highlight the method's ability to maintain reliable performance and spatial consistency in challenging future conditions.

REFERENCES 

Thao, S., Garvik, M., Mariethoz, G. et al. Combining global climate models using graph cuts. Clim Dyn 59, 2345–2361 (2022). https://doi.org/10.1007/s00382-022-06213-4

How to cite: Schmutz, L., Thao, S., Vrac, M., Allard, D., and Mariethoz, G.: Improved climate projections by combining CMIP6 models according to their local multivariate performance, EGU General Assembly 2025, Vienna, Austria, 27 Apr–2 May 2025, EGU25-18233, https://doi.org/10.5194/egusphere-egu25-18233, 2025.

EGU25-18434 | ECS | Orals | CL4.9

Forming a robust estimate of the climate state through a model ensemble weighting approach 

Britta Grusdt, Mahé Perrette, and Alexander Robinson

Ensembles of output from Earth System Models (ESMs) are available in databases such as CMIP6 that can help us learn about the climate. Most work until today has focused on temperature and precipitation for the historical period and future projections. However, a wealth of other information is available, including for different time slices in the past, such as the Last Glacial Maximum or the mid Holocene, and for different physical variables like 3D ocean temperatures and sea-ice extent. Here, we would like to show results from our efforts to build a framework for making probabilistic estimates of the climate state. Our inferences are based on a variety of ESM-data, comprising various time periods and climate variables, and the application of model-weights following recent approaches that take into account model skill and the inter-dependency among models within multi-model ensembles like CMIP6. In this way, we aim to be able to combine multiple possible evaluations to arrive at a final weighting for a given model ensemble. We present the framework – implemented as a Julia package to facilitate data selection and further analysis – and its capabilities, and then analyze how the weighting based on different time periods influences our estimates of the climate state for a given time slice, as well as for future projections.

How to cite: Grusdt, B., Perrette, M., and Robinson, A.: Forming a robust estimate of the climate state through a model ensemble weighting approach, EGU General Assembly 2025, Vienna, Austria, 27 Apr–2 May 2025, EGU25-18434, https://doi.org/10.5194/egusphere-egu25-18434, 2025.

In recent years, the accelerated impacts of global climate change on sensitive regions have drawn increasing attention. This study focuses on the Upper Yangtze River Basin, evaluating the performance of CMIP6 models in simulating precipitation and temperature during the historical period (1980–2014), providing different insights for future climate studies.

Seventeen commonly used CMIP6 models were selected and systematically evaluated at both annual and monthly scales for their ability to simulate precipitation and temperature. Performance evaluation employed multiple metrics, including bias, standard deviation, root mean square error (RMSE), and correlation coefficients. The Comprehensive Rating Index (CRI) was introduced to quantify the overall performance of each model. Additionally, F-tests and T-tests were conducted to analyze the statistical significance of differences between model simulations and observational data: F-tests assessed the homogeneity of variances between model outputs and observations, while T-tests evaluated differences in means.

Building on this assessment, a single evaluation metric derived from the historical period (1980–2014) is utilized to compute model rankings and a Composite Rating Index (CRI). Subsequently, a rank-based weighting (RBW) method is applied to assign weights to each model at both annual and monthly scales. This approach considers skill differences among models and provides insights for weighted multi-model ensemble (MME) analysis.

The results indicate that most models tend to underestimate annual mean temperature, with CESM2 performing relatively better than other models (CRI = 0.94), while annual cumulative precipitation is generally slightly overestimated, with FGOALS_g3 showing better performance (CRI = 0.89). On a monthly scale, CESM2 performs better in more months for temperature simulation, and FGOALS_g3 similarly performs better in more months for precipitation simulation. However, differences between monthly and annual performance are observed: certain models, such as IPSL_CM6A_LR and INM_CM5_0, which perform less effectively on an annual scale, exhibit relatively better performance in specific months. These findings highlight the variability in model performance across temporal scales and the importance of assessing models on both annual and monthly basis. Additionally, different models exhibit varying simulation capabilities at low-altitude, mid-altitude, and high-altitude observations. This underscores the heterogeneity in model performance across temporal and spatial scales, emphasizing the necessity of rigorous evaluations at both annual and monthly resolutions, as well as across varying spatial scales.

This study provides a comprehensive analysis of the applicability of CMIP6 models in the Upper Yangtze River Basin using multi-scale and multi-altitude approaches, incorporating CRI and RBW methods. The findings emphasize the importance of multi-metric analyses, significance testing, and weighting approaches in optimizing model selection and advancing the understanding of climate change impacts.

How to cite: Han, X. and Bocchiola, D.: Comprehensive Performance Evaluation of CMIP6 Models in Simulating Precipitation and Temperature: A Multi-Scale and Altitude-Based Analysis in the Upper Yangtze River Basin, EGU General Assembly 2025, Vienna, Austria, 27 Apr–2 May 2025, EGU25-19816, https://doi.org/10.5194/egusphere-egu25-19816, 2025.

EGU25-796 | ECS | Orals | CL4.10

Evaluating the influence of Land Cover transformation on Coastal Land and Sea Surface Temperature Dynamics in Indian Peninsula 

Dyutisree Halder, Pritipadmaja Pritipadmaja, and Rahul Dev Garg

Understanding the dynamics of land surface temperature (LST) and sea surface temperature (SST) in coastal regions is crucial for addressing climate change impacts. This study investigates 20 years of MODIS-derived LST and SST data to assess the influence of land cover transformations on temperature patterns in the Indian Peninsula. Contrary to the prevailing emphasis on urbanization, our analysis reveals that shifts from forested areas to agricultural or barren lands have a more significant impact on temperature dynamics. Using geospatial techniques, we identify long-term trends and quantify the relative contributions of various land cover types to LST and SST variations. The findings highlight the critical role of non-urban land use changes in coastal temperature dynamics, challenging traditional perspectives. This study provides actionable insights for sustainable land management and climate adaptation strategies in coastal regions, emphasizing the need for integrated land use planning to mitigate thermal vulnerabilities in the face of global climate change.

How to cite: Halder, D., Pritipadmaja, P., and Garg, R. D.: Evaluating the influence of Land Cover transformation on Coastal Land and Sea Surface Temperature Dynamics in Indian Peninsula, EGU General Assembly 2025, Vienna, Austria, 27 Apr–2 May 2025, EGU25-796, https://doi.org/10.5194/egusphere-egu25-796, 2025.

EGU25-979 | Orals | CL4.10

Explaining climate change in South America 

Alice M Grimm and Dayane Padoan

Projections from a CMIP6 multimodel ensemble show weak signal of climate change in annual and seasonal precipitation over most of South America (SA), with low agreement among models as to the sign of the change over most of the continent. Besides, climate change information from different analyses frequently seems confusing for the public and decision makers. Since climate has a crucial influence on important economic sectors in SA, such as hydroelectric power generation and agriculture, and natural disasters associated with extreme events of drought and excessive rainfall have become more frequent and intense, the future climate behavior should be more clearly described, and supported by a dynamical framework able to explain it, so as to better serve decision-makers in planning actions and adopt effective policies for climate adaptation.

Although weak and with low agreement between models, the climate change projected by the CMIP6 multimodel ensemble for SA shows similarity with the seasonal impacts of El Niño (EN) events on precipitation. Since model projections of future SST indicate an El Niño-like warming pattern in the central-east equatorial Pacific, it is reasonable to hypothesize that changes in precipitation over South America would have the patterns of EN impact and would be mainly due to the strengthening of an EN-type SST anomaly pattern in the Pacific Ocean.

Therefore, to clearly determine the future climate changes, it is necessary to select models that not only simulate well the SA climatology, but also the El Niño-Southern Oscillation (ENSO) and its teleconnections with SA, since ENSO is responsible for most of the climate variability in SA. The assessment covered 31 models that provided at least three runs from the present  (1979-2014) to the future climate (2065-2100). Based on relevant and comprehensive criteria, the models were classified according to both assessments (climatology and ENSO), and four best-performing models were selected.

The changes projected by the ensemble of best models indicate a more EN-like future climate, in which the main climate changes projected for SA resemble the observed EN impacts, remarkably including the tendency to spring-summer reversal of precipitation anomalies in Central-East SA, from dryer spring to wetter summer. While the total monsoon precipitation shows little or no change in this region, there is reduction (enhancing) of early (peak) monsoon rainfall, resulting in a delay and shortening of the monsoon season. The spring response in this region is due to the dynamical effect of the EN-like SST changes via teleconnection, and the reversal in summer is triggered by surface-atmosphere interactions. Also coherently with EN impacts, drier conditions prevail in central-northern-eastern Amazon throughout the monsoon season thanks to changes in the Walker circulation, while in southeast SA, precipitation increases due to tropics-extratropics teleconnection.

The changes projected by the all-model ensemble are much weaker and confusing. This clear description of climate change and its dynamical connection with intensified EN effects give coherence to the different changes throughout different seasons, which otherwise seem incomprehensible and can lead to discrepant interpretations if not understood within a correct dynamic context.

How to cite: Grimm, A. M. and Padoan, D.: Explaining climate change in South America, EGU General Assembly 2025, Vienna, Austria, 27 Apr–2 May 2025, EGU25-979, https://doi.org/10.5194/egusphere-egu25-979, 2025.

Accurate and reliable future climate information is key for successful implementation of climate change adaptation plans especially on regional scales. Predicting the winter climate over Eurasia is challenging as both the initialized predictions and uninitialized climate projections show limited skill in reproducing observed variability on multi-annual to decadal timescales. It has been long recognized that the climate over Eurasia is strongly influenced by the North Atlantic Oscillation (NAO), especially in winter. The observed NAO indices show strong year to year variations that can be associated with climate conditions in Europe and Asia.  Numerous efforts have been made to use NAO as one of the major predictors for European climate. However,  the strength and spatial patterns of the NAO-related teleconnections vary with time, for example on multi-annual to decadal timescales, resulting in limited success in predictions on these time scales.

This study presents a novel approach to constrain variability in projection simulations over Eurasia by exploiting the teleconnection between the North Atlantic Oscillation (NAO) and the surface air temperature in the northern hemisphere. The constrained ensemble shows significantly higher skill and added value in predicting the multi-annual winter surface air temperature over Eurasia as compared to both the unconstrained ensemble of historical simulations and the initialized decadal predictions. The sensitivity analysis suggests that the constraining based on teleconnection during the previous 15 to 20 winter seasons is optimum for skillful predictions of multi-annual to decadal mean winter climate over Eurasia.

How to cite: Mahmood, R., Yang, S., and G. Donat, M.: Skillful predictions of Eurasian winter climate by constraining variability in CMIP6 simulations using NAO-temperature teleconnections, EGU General Assembly 2025, Vienna, Austria, 27 Apr–2 May 2025, EGU25-1485, https://doi.org/10.5194/egusphere-egu25-1485, 2025.

EGU25-3808 | ECS | Posters on site | CL4.10

Bayesian uncertainty quantification of internal climate variability 

Vincent Verjans and Markus Donat

Dimensionality reduction techniques are powerful for extracting modes of climate variability from observational data sets and climate model output. Over the past decades, multiple studies have shown that dominant climate patterns can be identified, and that climate evolution can be approximately linearized in such subspaces. In this work, we apply novel dimensionality reduction techniques to global climate data sets. In particular, we optimize such methods for finding patterns that maximize their inherent predictability on multi-annual time scales. We develop a fully Bayesian framework. The record of high-quality climate data sets (20-100 years) is relatively short compared to our predictability time scales of interest (1-10 years). This necessarily causes large uncertainty in data-driven analyses of internal climate variability due to sampling variability and biases. In a Bayesian analysis, we are able to rigorously quantify the uncertainty in observed internal climate variability: both in the spatial patterns, and in their dynamic time evolution.


We use linear inverse modeling to represent the climate dynamics in a subspace that optimizes predictability measures. We then use advanced Bayesian methods to calibrate the parameters of the linear model. The resulting uncertainty analysis allows to identify which climate modes – and interactions between modes – are well- or poorly-constrained within the observational record. This novel method further allows to explore if climate models can reproduce the linearized dynamics within observational uncertainties, or if they fail in representing some specific modes of climate variability.

While still in its early stages, this research is aimed at addressing key climate predictability challenges, in particular identifying the factors that contribute to accurate and reliable multi-annual climate predictions.

How to cite: Verjans, V. and Donat, M.: Bayesian uncertainty quantification of internal climate variability, EGU General Assembly 2025, Vienna, Austria, 27 Apr–2 May 2025, EGU25-3808, https://doi.org/10.5194/egusphere-egu25-3808, 2025.

The summer climate in the Northern Hemisphere during recent decades has shown distinct trend patterns, with warming hotspots that spatially match with the ridges of a circumpolar atmospheric wave pattern. The drivers behind this wave-like trend and warming pattern are not yet well understood. On the one hand, the CMIP6 multi-model ensemble mean presents a high degree of spatial pattern correlation over some regions but at a very small magnitude relative to observations. When considering individual single-model ensembles, however, we find: (i) a substantial spread in the forced response across models and (ii) a large spread in pattern similarity across the different ensemble members of the same models. This suggests that a combination of both forcing and internal climate variability may have contributed to the observed changes in atmospheric circulation. In ongoing work we are aiming to better understand the specific roles of forcing and climate variability, e.g., by investigating specific composites of those simulations most closely resembling the observed trends or by constraining ocean temperature variability patterns.

How to cite: Marcet-Carbonell, G., Donat, M. G., and Delgado-Torres, C.: Understanding the recent changes in summer atmospheric circulation on the Northern Hemisphere: the roles of external forcing and sea surface temperature variability., EGU General Assembly 2025, Vienna, Austria, 27 Apr–2 May 2025, EGU25-3999, https://doi.org/10.5194/egusphere-egu25-3999, 2025.

EGU25-5784 | ECS | Posters on site | CL4.10

Attribution of flood event: a case study of the April/May 2024 floods in Southern Brazil 

Luiza Vargas-Heinz, Chen Lu, and Erika Coppola

The flood event of April/May 2024 that hit the Southernmost State of Brazil, Rio Grande do Sul, broke local records, with rivers reaching their highest level in recorded history. Around 2.4 million people are estimated to have been affected by the flood, with hundreds of thousands displaced and/or without access to potable water and electricity in their homes. Extreme precipitation, linked to a negative surface pressure anomaly, as suggested in the ERA5 dataset, was the primary driver. 

While attributing extreme precipitation events is an established practice, less work has been done to directly attribute river flood events to climate change, often due to a lack of long-term data in the region of interest. This study explores the feasibility of employing the existing attribution framework for attributing extreme discharge events.

We analyzed daily precipitation and river discharge data from over 40 stations (1960–2023, <10% missing) using two approaches. First, a "factual" distribution was developed using all the data available. A “counterfactual” distribution was obtained by fitting a distribution with the global mean surface temperature as covariate and a constant dispersion parameter, and then deriving the distribution assuming a 1.2°C cooler world.  Second, the data was divided into two separate periods: 1960-1991 (“past”) and 1992-2023 (“present”).  In both cases, differences in extreme values between these distributions were statistically assessed. Additionally, the surface pressure anomaly in ERA5 was used for analog attribution study, to assess the significance of the changes in surface pressure, precipitation, temperature, and discharge fields, between the “past” and “present” time periods.

Hydrological simulations performed with the CETEMPS Hydrological Model (CHyM) coupled with the CORDEX (Coordinated Downscaling Experiment)-CORE models output, both for a historical period and under the rcp85 scenario, were also used.  The model validation done for the historical period, comparing CHyM outputs against discharge station data, showed quite good agreement between the two for several statistics. Both the hydrological simulations and the regional climate CORDEX-CORE simulations were used in the analog attribution study to confirm the attribution of the event to global warming. This analysis investigates the potential of integrating hydrological modeling and observational discharge data to advance the attribution of extreme flood events to climate change.

How to cite: Vargas-Heinz, L., Lu, C., and Coppola, E.: Attribution of flood event: a case study of the April/May 2024 floods in Southern Brazil, EGU General Assembly 2025, Vienna, Austria, 27 Apr–2 May 2025, EGU25-5784, https://doi.org/10.5194/egusphere-egu25-5784, 2025.

EGU25-6337 | Orals | CL4.10

Research opportunities for combining climate models with moisture tracking 

Ruud van der Ent, Imme Benedict, Victoria Deman, Damián Insua-Costa, Peter Kalverla, Hilde Koning, Gerbrand Koren, Chiel Lokkart, Bart Schilperoort, Arie Staal, Lan Wang-Erlandsson, Chris Weijenborg, and Ke Yang

Global warming as well as human modification of the Earth’s surface profoundly affects the water cycle in regional climates. A key question for ecosystem health and humanity in general is how exactly water resources and water-induced hazards will be affected. Atmospheric moisture tracking methods have the potential to help unravel the mechanisms of changes in precipitation patterns.

In the climate we had around the year 2000, moisture tracking tools have shown that about 40% of the rainfall on land originated from the land itself and 60% was supplied by the oceans. Several studies have also indicated that due to the land being water-limited for evaporation, the relative importance of the oceans will increase in a warming climate. For more detailed moisture tracking studies into past and future climates, however, the provided data from climate model intercomparison projects is often a limiting factor.

In this presentation, we present a position paper that aims to unlock the potential of addressing novel research questions by combining climate modelling and moisture tracking. First, we review the state-of-the-art regarding moisture tracking with climate models. Second, we present the data requirements for moisture tracking models, which typically consist of a limited set of surface and atmospheric variables, but have specific requirements regarding temporal, horizontal and vertical resolution. Third, we evaluate typical uncertainties in moisture tracking that may arise from working with suboptimal resolutions. Fourth, we analyze to what extent some climate models are already providing sufficient data to perform moisture tracking studies. data request. Fifth, we map potentially interesting research avenues linked to specific Model Intercomparison Projects (MIPs) within the ongoing CMIP6 to illustrate how more synergies could be created.

In conclusion, we systematically evaluated the current research interest, limitations and potential for moisture tracking studies with climate model output. With this presentation we hope to stimulate CMIP7 and other climate data providers to work together with the moisture tracking community to align the supply and demand side of climate variables. Doing so, would allow us to tap the now largely untapped potential of using moisture tracking to gain more insight into past and future water cycle changes.

How to cite: van der Ent, R., Benedict, I., Deman, V., Insua-Costa, D., Kalverla, P., Koning, H., Koren, G., Lokkart, C., Schilperoort, B., Staal, A., Wang-Erlandsson, L., Weijenborg, C., and Yang, K.: Research opportunities for combining climate models with moisture tracking, EGU General Assembly 2025, Vienna, Austria, 27 Apr–2 May 2025, EGU25-6337, https://doi.org/10.5194/egusphere-egu25-6337, 2025.

EGU25-6554 | Orals | CL4.10

New look at humidity trends 

Cathy Hohenegger, Sarah Warnau, Tiffany Shaw, and Sarah Kang
Past studies have revealed a discrepancy between observed and simulated humidity trends in the satellite era. Especially over arid and semi-arid land regions, no trend in specific humidity is discernible in observations, whereas both uncoupled and coupled climate model simulations from the last CMIP exercise show a moistening trend. We revisit trends in specific humidity using global simulations that were conducted at a grid spacing of 10 km over multi decades. We consider two different models (IFS and ICON) as well as coupled and AMIP-type simulations. The coupled historical IFS simulation shows a moistening trend over the semi-arid and arid regions, similar to the result of the past coarse-resolution climate models. In contrast, the AMIP ICON simulation shows no discernable trend, in agreement with observations. One key difference between the two models is that IFS still uses parameterizations for shallow and partly deep convection, whereas ICON does not. Using the output of the two models, we further explore reasons for this distinct trend behavior between the two models.

How to cite: Hohenegger, C., Warnau, S., Shaw, T., and Kang, S.: New look at humidity trends, EGU General Assembly 2025, Vienna, Austria, 27 Apr–2 May 2025, EGU25-6554, https://doi.org/10.5194/egusphere-egu25-6554, 2025.

EGU25-6885 | ECS | Posters on site | CL4.10

Using an explainable neural network to identify tropical drivers of the Northern Hemisphere wave-5 trend pattern 

Rikke Stoffels, Dim Coumou, and Vera Melinda Galfi

The recent trend in the Northern Hemisphere summer atmospheric circulation resembles a Rossby wave with wave number 5. These quasi-stationary circumglobal Rossby waves are associated with extreme events, such as heatwaves, droughts, and floods, that can have catastrophic societal impacts. Therefore, understanding the drivers of these Rossby waves and evaluating their representation in climate models is a key scientific challenge. However, identifying the drivers of such patterns can be difficult because traditional approaches such as simple correlation analysis may not capture the complex, nonlinear interactions inherent in atmospheric teleconnections. To address this, explainable artificial intelligence (XAI) offers a promising alternative. 

In this study, we test the hypothesis that the observed trend is partially driven by changes in the tropical oceans, which can influence midlatitude weather patterns through tropical-extratropical teleconnections. Using an explainable neural network approach, we aim to identify key tropical regions that drive the midlatitude wave-5 pattern on subseasonal timescales. The methodology is composed of two steps. First, the neural network is trained to predict the wave-5 pattern using tropical outgoing longwave radiation (OLR) fields as input. Next, we apply layer-wise relevance propagation, an explainability technique, to identify which input features are most important for accurate predictions. This process generates heat maps highlighting tropical regions that are important for the generation of a wave-5 pattern. Subsequently, changes in sea surface temperatures (SSTs) and OLR in the identified regions can be assessed as well as their correlation to the trend in the Northern Hemisphere circulation. We will present some preliminary outputs of this analysis.

How to cite: Stoffels, R., Coumou, D., and Galfi, V. M.: Using an explainable neural network to identify tropical drivers of the Northern Hemisphere wave-5 trend pattern, EGU General Assembly 2025, Vienna, Austria, 27 Apr–2 May 2025, EGU25-6885, https://doi.org/10.5194/egusphere-egu25-6885, 2025.

EGU25-7065 | Orals | CL4.10

Lessons from the ‘hiatus‘ controversy for the 2023/2024 warming spike 

Karsten Haustein, Nadine Theisen, and Sebastian Sippel

Global mean annual temperature in 2023 did end up much warmer than anticipated, stirring up a lively debate as to what the potential reasons might be. 2024 continued that trend with another record warm year on top, exceeding 1.5°C globally for the first time in all temperature data sets on an annual basis.

Here we argue (1) that 2023 is entirely compatible with our understanding of the climate system and (2) that the so-called ‘hiatus‘ controversy from the early 2010s should be used as a reminder to be rather cautious with claims that suggest something puzzling might be going on.

We present results from statistical and model based analysis, demonstrating that the magnitude of the new September and annual temperature record in 2023 lies within the range of possible record margins under current warming / forcing conditions. We also show that random shifts in large scale circulation patterns led to record warm conditions in the North Atlantic and Antarctica, contributing to the 2023 and 2024 outcome (in addition to anthropogenic factors as well as El Niño).

We also discuss whether or not these shifts are partially attributable (directly or indirectly) to the 2022 Hunga Tonga eruption or the regulation-induced sulphur emissions reduction in the global shipping sector.

How to cite: Haustein, K., Theisen, N., and Sippel, S.: Lessons from the ‘hiatus‘ controversy for the 2023/2024 warming spike, EGU General Assembly 2025, Vienna, Austria, 27 Apr–2 May 2025, EGU25-7065, https://doi.org/10.5194/egusphere-egu25-7065, 2025.

Uneven economic impacts of climate change have been caused by differentiated warming rates across different geographical regions, threatening the well-being of millions to billions of people. Region-dependent historical and future warming rates are often obtained from global climate models, which, however, exhibit wide spreads in both global mean temperature change and regional deviates. While the multi-model spread in global mean warming rate has been widely reported in past literature, the multi-model spread in terms of global warming pattern and its temporal evolution remain unclear. Here we show that the multi-model spread in the simulated global warming pattern is dependent on the level of warming. We find that the simulated global warming pattern deviates substantially among CMIP6 models before 1985. The multi-model consistency rises afterwards, as the greenhouse gases level and global mean warming rate increase. Furthermore, the consistency of model-predicted future warming pattern varies by emission scenario. Models predict highly consistent warming patterns under the high emission scenario during the entire 21st century; whereas under low and intermediate emission scenarios, future warming patterns diverge among these models around middle of the 21st century. While our study detects the anthropogenic signal in the temporal evolution of multi-model consistency in the global warming pattern, the physical mechanisms underlying such varying multi-model consistency in the warming pattern merits further investigation.

How to cite: Meng, Y., Yu, Y., and Nie, J.: Reduced spread of simulated global warming patterns among CMIP6 models with accelerated pace of warming, EGU General Assembly 2025, Vienna, Austria, 27 Apr–2 May 2025, EGU25-8252, https://doi.org/10.5194/egusphere-egu25-8252, 2025.

EGU25-8966 | ECS | Orals | CL4.10

Influence of Global Warming on Extreme Sea Level Events Along European Coasts 

Maria Mulet, Marta Marcos, Angel Amores, and Miguel Agulles

Coastal sea level extremes are among the potentially most hazardous events for the densely populated coastal regions. Changes in extreme sea levels, combined with rising mean sea level, increase coastal vulnerability, and will continue to do so in the future. It is thus necessary to understand and quantify the role of global warming in the likelihood and intensity of extreme sea levels. In this study, we aim at testing whether the probability of extreme sea levels has changed in any way due to global warming. To do so, we analyse annual sea level maxima of a large ensemble of hydrodynamic simulations along the European coasts forced with the outputs of state-of-the-art climate models, simulating a total of nearly 1800 years of data that are representative of the climate of the past 6 decades, as well as 2500 years of data that are representative of the pre-industrial climate. The data have been bias-corrected to improve their reliability and accuracy in representing local sea level variations. We rely on the largely extended dataset to compute the Fraction of Attributable Risk (FAR) for different sets of sea level extremes along the entire European coastline. The results reveal that present-day regional climate conditions are altering the probability of likelihood of extreme sea levels along a large fraction of the European coastlines.

How to cite: Mulet, M., Marcos, M., Amores, A., and Agulles, M.: Influence of Global Warming on Extreme Sea Level Events Along European Coasts, EGU General Assembly 2025, Vienna, Austria, 27 Apr–2 May 2025, EGU25-8966, https://doi.org/10.5194/egusphere-egu25-8966, 2025.

Historical changes in the North Atlantic atmospheric and oceanic circulation are re-evaluated using output from the Large Ensemble Single Forcing Model Intercomparison Project (LESFMIP). We focus on five of the single forcing experiments included in Phase 1 of the LESFMIP protocol: hist-GHG, hist-aer, hist-volc, hist-solar, and hist-totalO3. For each of these five, at least 10 ensemble members have been simulated over the period 1850 to 2020 by ~10 models. This dataset offers an unprecedented view of how these forcings have affected surface climate and the tropospheric and oceanic circulation, and their associated extremes. Specifically, the large-ensemble allows for isolating weak signals that otherwise would be buried under internal variability, while also offering a testbed for methods to extract predictable signals with correct amplitude.
Preliminary work shows a clear effect of greenhouse gases and aerosols on jets. In June-August, the influence of aerosols is as strong as that of greenhouse gases. Furthermore, the inter-model spread in the NH vortex responses dominates the intermodel spread in the NAO response. Ongoing work is aimed at formulating emergent constraints to sort out intermodel differences in the forced response of the polar vortex to historical forcings. Ongoing work is also aimed at understanding the impacts on surface temperature and precipitation. This is a community effort from the WCRP's APARC LEADER and EPESC projects.

How to cite: Avisar, D., Kuchař, A., Garfinkel, C., and Simpson, I.: Understanding historical changes in the North Atlantic atmospheric and oceanic circulation: insights from the Large Ensemble Single Forcing Model Intercomparison Project , EGU General Assembly 2025, Vienna, Austria, 27 Apr–2 May 2025, EGU25-9609, https://doi.org/10.5194/egusphere-egu25-9609, 2025.

EGU25-10729 * | ECS | Orals | CL4.10 | Highlight

Combination of Internal Variability and Forced Response Reconciles Observed 2023 Warming 

Gergana Gyuleva, Reto Knutti, and Sebastian Sippel

The record-breaking global mean surface temperature (GMST) in 2023 came as a surprise to the scientific community, raising the question whether 2023 provides evidence for a recent and abrupt increase in the global warming rate. Here, we quantify the variability and forced contribution to annual GMST by training a statistical learning model on surface temperature anomalies from historical and future climate model simulations. Our method presents a novel approach to separting variability from forced changes in GMST, providing a computationally simple and powerful alternative to existing atmospheric Green’s function approaches. We find that more than half of the 2023 jump in GMST is explained by internal variability, largely owing to anomalously cool conditions in 2022. An unlikely combination of strong but not unprecedented forced and internal contributions occurring simultaneously appears to have led to the extreme jump in 2023 GMST, with North Atlantic warming being a key contributor. When adjusting for variability, we find a steady increase in forced warming rate over the past decades, consistent with previous studies. There is insufficient evidence for an acceleration of forced warming in 2023 and 2024 beyond the expected increase from continued carbon dioxide emissions and decreasing aerosol forcing in the past decades. Our results highlight the role of internal variability for short-term GMST fluctuations and call for an improved understanding of the Atlantic warming observed in 2023. 

How to cite: Gyuleva, G., Knutti, R., and Sippel, S.: Combination of Internal Variability and Forced Response Reconciles Observed 2023 Warming, EGU General Assembly 2025, Vienna, Austria, 27 Apr–2 May 2025, EGU25-10729, https://doi.org/10.5194/egusphere-egu25-10729, 2025.

EGU25-10906 | ECS | Orals | CL4.10

Attributing changes in extreme precipitation across the Northeast U.S. under different climate scenarios  

Bor-Ting Jong, Thomas Delworth, Zachary Labe, William Cooke, and Hiroyuki Murakami

The Northeast United States has experienced the most rapidly increasing occurrences of extreme precipitation within the U.S. over recent decades, particularly during the warm season. This trend is primarily linked to events associated with tropical cyclones. Understanding the drivers leading to long-term trends in regional extreme precipitation under different future climate scenarios is critical to adaptation and mitigation planning.

New simulations with the fully-coupled 25-km GFDL (Geophysical Fluid Dynamics Laboratory) SPEAR (Seamless System for Prediction and EArth System Research) model and its 10 ensemble members, present a unique opportunity to study changes in regional extreme precipitation and relevant physical processes. Under the SSP5-8.5 scenario, SPEAR projects top 1% extreme precipitation events over the Northeast U.S. to increase by up to 2.4% by the end of the 21st century. The projected increase is driven by higher anthropogenic radiative forcing and is distinguishable from natural variability by the mid-century. From the meteorological perspective, the occurrences of warm season extreme precipitation related to both atmospheric rivers and tropical cyclones are projected to increase, even though the frequency of tropical cyclones in the North Atlantic is projected to decrease in the model.

The SSP5-8.5 scenario, however, represents a highly unlikely trajectory, prompting the scientific community to explore scenarios with rapid reductions in greenhouse gas (GHG) concentrations through various climate mitigation efforts. Using the SSP5-3.4OS overshoot scenario from the SPEAR model—where GHG emissions decline sharply after 2040 and reach net-negative levels by 2070—we assess the impact of mitigation on extreme precipitation over the Northeast U.S. Our results show that extreme precipitation frequency over the Northeast U.S. is projected to decrease as GHG concentrations decline. However, the timing of this reversal is seasonally dependent: warm-season trends reverse shortly after global mean surface temperature starts to decline, while cold-season trends lag by approximately 15 years. These results suggest that the response of extreme precipitation to GHG reductions may depend on the underlying mechanisms driving these events. For example, cold-season extremes are more often associated with large-scale extratropical cyclones, where dynamical processes play a significant role. Our study underscores the urgent need for a deeper understanding of the physical processes governing regional climate extremes in response to GHG mitigation. Such insights are essential for informing adaptation strategies and policymaking for effective climate risk management.

How to cite: Jong, B.-T., Delworth, T., Labe, Z., Cooke, W., and Murakami, H.: Attributing changes in extreme precipitation across the Northeast U.S. under different climate scenarios , EGU General Assembly 2025, Vienna, Austria, 27 Apr–2 May 2025, EGU25-10906, https://doi.org/10.5194/egusphere-egu25-10906, 2025.

While the influence of well-mixed greenhouse gas emissions on global warming is well-documented and robustly attributed through multiple lines of evidence, regional attribution remains more challenging and dependent on the performance and resolution of climate models. This study proposed an observational-based statistical analysis utilizing the real-time Global Warming Index (GWI) to investigates the extent to which observed regional temperature trends are attributable to global-scale anthropogenic factors, mainly the direct effects of CO2, aiming to differentiate the portion of the change attributable to regional-scale drivers (such as regional industrial aerosols, black carbon aerosols, and land-use/land-cover change, etc).

To quantify the contribution of global– and regional–scale climate drivers to observed temperature change, I performed regression analyses using the HadCRUT4 temperature data and the Global Warming Index (GWI). The GWI, calculated through a least squares method, correlates observed global average temperatures with expected responses to global radiative forcing series. 

Results indicate that in certain regions — specifically West Asia, East N. America, West Africa, and the Amazon basin — 62±7%, 61±13%, 58±7%, and 61±10% of the warming observed over 1991-2020 can be attributed to global anthropogenic warming, primarily the direct effects of CO2. The remaining portion, which represents 22±8%, 21±16%, 27±9%, 23±14% of the observed warming, is attributable to regional climate drivers. The Mediterranean showcases high sensitivity, with regional drivers contributing 31±13% of the observed 1.2°C warming, amplifying the warming attributed to global anthropogenic drivers. The Arctic Ocean along with the Russian-Arctic region exhibits a substantial contribution from regional drivers and local feedback mechanisms to the observed warming amplification, quantified at 43±15% of the 3°C warming over 1991-2020. Regional cooling drivers, however, are significant in East Asia and the Tibetan Plateau, with the latter experiencing a cooling contribution of -42±17% (with a ±95% uncertainty due to internal variability derived from control simulations).

The novel approach presented in this study helps in understanding how different scales of climate change drivers contribute to local temperature change. This understanding can foster more effective, localized mitigation strategies that complement global efforts to address climate change.

How to cite: Barkhordarian, A.: Disentangling Regional Climate Change: Assessing the contribution of global– and regional–scale anthropogenic drivers to observed regional warming, EGU General Assembly 2025, Vienna, Austria, 27 Apr–2 May 2025, EGU25-11006, https://doi.org/10.5194/egusphere-egu25-11006, 2025.

EGU25-12604 | Orals | CL4.10

Minimal impact of methane on satellite-era climate change 

Tiffany Shaw, Masaki Toda, and Sarah Kang

The attribution of global and regional climate change to anthropogenic greenhouse gases (GHGs) is well appreciated. Existing estimates based on radiative forcing studies suggest CO2 dominates global warming since 1850 with CH4 the second largest contribution (33-66% of CO2). However, radiative forcing studies involve several assumptions and GHG attribution beyond global-mean warming is unknown. Here we quantify the impact of individual GHGs on global warming indicators and regional climate change using single-forcing historical experiments of CO2, CH4, and other GHGs. CO2 is shown to dominate global warming in the satellite era with CH4 only 20% of the CO2 contribution, smaller than the amplitude of internal variability. Methane is also a small contribution for other global warming indicators, including Arctic Sea ice loss, extreme temperatures and continental scale warming. The results demonstrate that, on multi-decadal or longer time scales, CO2 is the dominant control knob and the contribution of CH4 to regional climate change is very small, undistinguishable from noise. Thus, CH4 mitigation may not be as effective as previously thought, particularly for regional scale impacts.  

How to cite: Shaw, T., Toda, M., and Kang, S.: Minimal impact of methane on satellite-era climate change, EGU General Assembly 2025, Vienna, Austria, 27 Apr–2 May 2025, EGU25-12604, https://doi.org/10.5194/egusphere-egu25-12604, 2025.

EGU25-15359 | Orals | CL4.10

Anticipating Hot Summer Nights 

Johanna Baehr, Leonard Borchert, Sebastian Brune, Mrunali Damania, Moritz Drupp, Andreas Lange, Enrico Longo, Shivanshi Asthana, and Grischa Perino

Summer heat waves pose health threats to the general population, in particular, vulnerable groups. The skill for seasonal prediction of such heat waves has recently advanced. Yet, whether forecast information on this time scale, a time scale at which individual preparedness could still be improved, might be taken up by the general population, has—so far—not been investigated. Here, we present results from a large-scale online experiment with a general population sample in Germany (N = 4,251) to test how households respond to risk assessments for the number of heat events in their regions for the summer of 2024. Heat events are the number of tropical nights, i.e., with a temperature minimum of at least 20°C, during summer 2024 (June 1st – August 31st). As a risk assessment we use the 75percentile of an ensemble with 30 members originating from the operational seasonal forecasts with the German Climate Forecast System (GCFS2.1, Deutscher Wetterdienst, DWD). Participants were exposed in May 2024 to forecast information for the number of heat events in their region of residence, and in addition were provided with the typical summer in the absence of anthropogenic climate change. We present the consequential choices for self-interested and altruistic preventive adaptation measures, as well as for support for mitigation efforts participants demonstrated. Our results identify the impact of ’forward attribution’ to climate change, i.e., information on how the risk assessments would have differed for a world without anthropogenic climate change. We also check whether the perceived reliability of the seasonal prediction spills over to the perceived reliability of long-term climate predictions.

How to cite: Baehr, J., Borchert, L., Brune, S., Damania, M., Drupp, M., Lange, A., Longo, E., Asthana, S., and Perino, G.: Anticipating Hot Summer Nights, EGU General Assembly 2025, Vienna, Austria, 27 Apr–2 May 2025, EGU25-15359, https://doi.org/10.5194/egusphere-egu25-15359, 2025.

EGU25-17291 | Orals | CL4.10

Representation of tropical and extratropical trends in ECMWF seasonal hindcasts 

Michael Mayer, Daniel Befort, and Antje Weisheimer

Climate trends represent one source of predictability for climate forecasts. Hence, it is important for seasonal prediction systems to reproduce observed trends in the climate system. This contribution presents an assessment of trends in seasonal hindcasts from the European Centre for Medium-Range Weather Forecasts (ECMWF). We investigate trends in the tropics and extratropics, as well as potential links between those.

In the tropics, the focus is on processes related to El Nino – Southern Oscillation (ENSO). The hindcasts exhibit a spurious sea surface warming trend in the equatorial Pacific (i.e., a tendency towards El Nino in more recent years), which is mainly related to an underestimation of the atmospheric circulation response to the observed strengthening of the equatorial Pacific zonal sea surface temperature gradient. The trend errors are most pronounced for boreal summer and autumn (independent of start date). Furthermore, the trend errors are similar to those found in free coupled climate model simulations and suggest a biased response of the atmospheric model to changes in the anthropogenic forcing.

In the extratropics, we focus on summer-time upper tropospheric circulation and surface temperature. The ensemble mean completely misses the clear observed circulation trends (resembling a wave-5 pattern) and the associated centers of enhanced surface warming. Possible implications and causes of the missed trends will be discussed.

How to cite: Mayer, M., Befort, D., and Weisheimer, A.: Representation of tropical and extratropical trends in ECMWF seasonal hindcasts, EGU General Assembly 2025, Vienna, Austria, 27 Apr–2 May 2025, EGU25-17291, https://doi.org/10.5194/egusphere-egu25-17291, 2025.

EGU25-17493 | Posters on site | CL4.10

Quantifying changes in seasonal temperature variations using a functional data analysis approach 

Eva Holtanová, Lukas Brunner, and Jan Koláček

Ever-worsening climate change increases near-surface air temperatures for almost the entire Earth and threatens living organisms and human society. While annual mean changes are frequently used to quantify past and expected future changes, the increase is actually rarely uniform throughout the year. 

The shape of the annual cycle and its changes differ significantly between regions around the globe. Therefore, performing a global analysis implies the necessity to focus on diagnostics that can be evaluated for all these different shapes (e.g., single and double waves, different timing of seasons, etc.). Many previous studies relied on Fourier-transform-based methods, which assume a sinusoidal shape of the mean annual cycle. Here, we introduce an innovative approach based on functional data analysis. The evolution of the mean annual cycle is estimated from daily long-term mean temperature values, which are converted to functional form. This way, we can assess arbitrary shapes of the annual cycle. We concentrate on diagnostics that evaluate the change in absolute temperature, its seasonal slope, and the position of the maximum. We analyze two reanalysis datasets (coupled CERA20C and atmospheric ERA5) and a subset of CMIP6 Earth system models (ESMs). Recent changes in the second half of the 20th century are assessed, and the ability of ESMs to represent them is evaluated. Then, the changes projected for the end of the 21st century under the SSP3-7.0 pathway are analyzed.

Among other results, we highlight distinct differences between the two reanalyses, especially over equatorial and polar regions. Further, the projections show, for example, different rates of warming between seasons, resulting in changes in the amplitude. The largest amplitude increase is projected over the Mediterranean region and the largest decrease over the Arctic Ocean.  

How to cite: Holtanová, E., Brunner, L., and Koláček, J.: Quantifying changes in seasonal temperature variations using a functional data analysis approach, EGU General Assembly 2025, Vienna, Austria, 27 Apr–2 May 2025, EGU25-17493, https://doi.org/10.5194/egusphere-egu25-17493, 2025.

EGU25-17706 | Orals | CL4.10

Forced Component Estimation Statistical Methods Intercomparison Project (ForceSMIP) 

Robert Jnglin Wills, Clara Deser, Karen McKinnon, Adam Phillips, Stephen Po-Chedley, Sebastian Sippel, and Anna Merrifield and the ForceSMIP Tier1 Contributors

Anthropogenic climate change is unfolding rapidly, yet its regional manifestation is often obscured by atmosphere-ocean internal variability. A primary goal of climate science is to identify the forced response, i.e., spatiotemporal changes in climate in response to greenhouse gases, anthropogenic aerosols, and other external forcing, amongst the noise of internal climate variability. Separating the forced response from internal variability can be addressed in climate models by using a large ensemble to average over different possible realizations of internal variability. However, with only one realization of the real world, it is a major challenge to isolate the forced response in observations, as is needed for attribution of historical climate changes, for characterizing and understanding observed internal variability, and for climate model evaluation.

In the Forced Component Estimation Intercomparison Project (ForceSMIP), contributors used existing and newly developed statistical and machine learning methods to estimate the forced response during the historical period within individual ensemble members and observations, across eight key climate variables (SST, surface air temperature, precipitation, SLP, zonal-mean atmospheric temperature, monthly max. and min. temperature, and monthly max. precipitation). Participants could use five CMIP6 large ensembles to train their methods, but they then had to apply their methods to individual evaluation members, the identity of which was hidden. Participants used methods including regression methods, convolutional neural networks, linear inverse models, fingerprinting methods, and low-frequency component analysis. Here we show how the different methods performed on climate models and what they determined to the be the forced response in observations. Our results show that many different types of methods are skillful for estimating the forced response and that the most skillful method depends highly on which variable and metric is evaluated. Furthermore, methods that show comparable skill can give very different estimates of the forced response in observations, illustrating the epistemic uncertainty in estimating the forced climate response from observations. ForceSMIP gives new insights into the forced response in observations across multiple key variables, but also the remaining uncertainty in its estimation.

How to cite: Jnglin Wills, R., Deser, C., McKinnon, K., Phillips, A., Po-Chedley, S., Sippel, S., and Merrifield, A. and the ForceSMIP Tier1 Contributors: Forced Component Estimation Statistical Methods Intercomparison Project (ForceSMIP), EGU General Assembly 2025, Vienna, Austria, 27 Apr–2 May 2025, EGU25-17706, https://doi.org/10.5194/egusphere-egu25-17706, 2025.

In 2022, Europe experienced a severe and extensive drought with substantial ecological and economic impacts. The climatic hazard that led to these impacts can be attributed to two primary causes. First, thermodynamic warming due to climate change reduces water availability through increased evaporative demand. Second, an unusual atmospheric circulation pattern during the event compounded the situation. This was further exacerbated by strong decadal trends in atmospheric circulation. While thermodynamic changes are physically well understood, our understanding of the impact of circulation-driven trends on climate is largely limited to its impact on trends in surface temperature. To attribute the role of these different climatic drivers on the drought impacts, we use a storyline approach by nudging the Community Earth System Model Version 2 (CESM2) to atmospheric circulation patterns from the ERA5 reanalysis data at different forcing levels. Our findings indicate that the dynamical conditions leading to the 2022 drought were the most extreme in the observed period, following a long-term atmospheric circulation trend that explains around 50% of European drying. Moreover, the 2022 circulation patterns not only intensified the drought but also interacted with thermodynamic effects, exacerbating the hydroclimatic impacts. By distinguishing between circulation-induced trends and thermodynamic changes, we provide a nuanced understanding of the drivers of European hydroclimatic variability and their contribution to extreme events. We highlight the critical need to consider both atmospheric circulation changes and thermodynamic influences to evaluate accurately and project future hydroclimatic trends in Europe.

How to cite: Dunkl, I., Sippel, S., and Bastos, A.: Disentangling the role of trends in Atmospheric Circulation Patterns from Thermodynamic Effects for European Hydroclimate, EGU General Assembly 2025, Vienna, Austria, 27 Apr–2 May 2025, EGU25-18544, https://doi.org/10.5194/egusphere-egu25-18544, 2025.

EGU25-18816 | Orals | CL4.10

Reconstructing Historical Climate Data using Deep Learning 

Étienne Plésiat, Robert J. H. Dunn, Markus Donat, and Christopher Kadow

Understanding past climate conditions is essential for addressing future climate challenges. However, observational climate datasets often contain missing values, especially in older records, leading to incomplete and inaccurate analyses. Interpolation methods like kriging are commonly employed to address this issue by filling data gaps. Nevertheless, these approaches often fail to effectively reconstruct complex climatic patterns [1, 2].

This study leverages the transformative power of deep learning to accurately reconstruct two observational datasets. The first dataset is an intermediate product of HadEX3 [3], which contains gridded extreme indices over land regions, such as the TX90p index, corresponding to the percentage of days where daily maximum temperature is above the 90th percentile. The second dataset is the Full data GPCC product [4], containing global precipitation fields at monthly frequency. To reconstruct these two datasets with high accuracy, we employ and compare three deep learning approaches: a U-Net with partial convolutional layers, a diffusion model and a graph neural network. In all cases, models are trained on CMIP6 climate model data, evaluated on unseen CMIP6 and ERA5 data and compared to Kriging. The best-performing models are then applied to the observational datasets, providing new insights into historical climate conditions to inform more effective climate adaptation strategies. The reconstructed datasets are being prepared for the community in the framework of the H2020 CLINT project [5] and the Horizon Europe EXPECT project [6].

[1] Kadow C. et al., Nat. Geosci., 13, 408-413 (2020)
[2] Plésiat É. et al., Nat. Commun., 15, 9191 (2024)
[3] Dunn R.J.H. et al., J. Geophys. Res. Atmos., 125, 1 (2020)
[4] Schneider, U. et al., DOI: 10.5676/DWD_GPCC/FD_M_V2022_100 (2022)
[5] https://climateintelligence.eu/
[6] https://expect-project.eu/

How to cite: Plésiat, É., Dunn, R. J. H., Donat, M., and Kadow, C.: Reconstructing Historical Climate Data using Deep Learning, EGU General Assembly 2025, Vienna, Austria, 27 Apr–2 May 2025, EGU25-18816, https://doi.org/10.5194/egusphere-egu25-18816, 2025.

EGU25-20122 | ECS | Posters on site | CL4.10

Advancing climate research through the WCRP core project on Earth System Modelling and Observations (ESMO) 

Bimochan Niraula, Sara Pasqualetto, and Fanny Adloff

Earth System Modelling and Observations (ESMO) is a new core project of the World Climate Research Project (WCRP) that coordinates, advances, and facilitates all modelling, data assimilation and observational activities within WCRP, working jointly with all other WCRP projects. Our mission is to facilitate the coordination and advancement of climate modeling and observational efforts. Through collaborative approaches, interdisciplinary partnerships, and identification of critical research gaps ESMO aims to enhance the accuracy, reliability, and accessibility of climate data and projections. Alongside three pre-existing Working Groups - on Coupling Modelling (WGCM), Numerical Experimentation (WGNE), and Sub-seasonal to Interdecadal Prediction (WGSIP), an additional working group on Observations for Researching Climate (WGORC) has now been established. WGORC in particular will focus on observations and needs for observation across WCRP, including observations for reanalyses and emerging technologies. This, alongside the other WGs focused on modelling, will be instrumental in identifying gaps and bridging research communities in climate science. Here, we present the exciting new structure of ESMO, and how we hope to bring together experts across modelling and observational disciplines, to further scientific advances.

How to cite: Niraula, B., Pasqualetto, S., and Adloff, F.: Advancing climate research through the WCRP core project on Earth System Modelling and Observations (ESMO), EGU General Assembly 2025, Vienna, Austria, 27 Apr–2 May 2025, EGU25-20122, https://doi.org/10.5194/egusphere-egu25-20122, 2025.

Land surface and the planetary boundary layer are linked by the water and energy cycles, and the effects of soil water-air coupling modulate near-surface temperatures. In particular, late spring soil moisture anomalies may uncover predictability to the system, and then contribute to predictions of extreme events such as heatwaves at the subseasonal to seasonal scale. In this study, we use a data-driven seasonal forecast for summer heat waves in the Western Mediterranean, and a downstream explainable artificial intelligence helps us separate the individual contribution of the predictors and quantify and rank them in terms of their relative importance. Soil moisture emerges as one of the heat wave predictors, along with SST in the North Atlantic and the background global warming. Results show that soil largely contributes to heatwaves predictability when it is dry at the beginning of the season, otherwise its importance is limited. In addition, soil moisture contribution substantially increases from the beginning of the 1990s, when the local warming quickly arises and summer precipitation declines sharply. When atmospheric patterns are favorable for the advection of hot and dry air, conditions for persisting and more intense heatwaves are supported by an interacting land surface. With little water available for evaporation, the increased atmospheric evaporative demand may not be met, therefore the lack of latent cooling in the atmosphere enables more intense and persistent heatwaves.

How to cite: Materia, S. and Donat, M.: Growing importance of soil moisture anomalies for prediction of summer heatwaves in the Western Mediterranean, EGU General Assembly 2025, Vienna, Austria, 27 Apr–2 May 2025, EGU25-20837, https://doi.org/10.5194/egusphere-egu25-20837, 2025.

EGU25-3861 | Posters on site | CL4.11

Advancing Climate System Understanding: Insights from the PalMod Project 

Kerstin Fieg, Mojib Latif, Michael Schulz, and Tatiana Ilyina

The PalMod project, funded by the German Federal Ministry of Education and Research (BMBF), aims at addressing key knowledge gaps in the understanding of the dynamics and variability of the climate system during the last glacial cycle. This period, which is marked by strong and rapid climatic fluctuations, serves as a testbed for complex Earth system models (ESMs). The models tested in this way will be used in climate-change scenarios for the next millennia to enhance future climate-change assessments. PalMod uses three ESMs—AWI-ESM, MPI-ESM, and CESM— that integrate physical and biogeochemical processes and employ advanced parameterizations regarding, for example, ice sheet-ocean interactions.

In Phases I and II, the project focused on key epochs of the last glacial cycle including inception, MIS3, and the last deglaciation. The ongoing final Phase III leverages these insights to project the climate over the next millennia. Central to this last project phase is to answer some of the major societally critical questions in association with climate change: What are the potential tipping points and at which global warming may they become relevant? Under what conditions could polar ice sheets collapse catastrophically, and how rapidly could sea levels rise under different future climate scenarios? How will permafrost evolve in a warming world? This presentation reflects on the progress made during the past two phases of the project and presents preliminary answers to the aforementioned pressing questions.

How to cite: Fieg, K., Latif, M., Schulz, M., and Ilyina, T.: Advancing Climate System Understanding: Insights from the PalMod Project, EGU General Assembly 2025, Vienna, Austria, 27 Apr–2 May 2025, EGU25-3861, https://doi.org/10.5194/egusphere-egu25-3861, 2025.

EGU25-4864 | Posters on site | CL4.11

Convection Permitting Regional Paleoclimate Simulations with Climate-Driven Land-Use Mapping for a reduced Mediterranean domain 

James Ciarlo`, Arthur Lamoliere, Graziano Giuliani, Erika Coppola, Aaron Micallef, and David Mifsud

The Central Mediterranean's complex topography and dynamic land-sea interactions provide a compelling opportunity for high-resolution paleoclimate modelling aimed at enhancing our understanding of natural climate variability. This study utilizes the RegCM5 regional climate model to conduct km-scale simulations, focusing on fine-scale climate dynamics for a reduced Mediterranean domain across five pivotal paleoclimate periods: Modern (ca. 1995 CE), Pre-Industrial (ca. 1850 CE), Medieval Climate Anomaly (MCA, ca. 1000 CE), mid-Holocene (6000 BP), and Last Glacial Maximum (LGM, 21000 BP). Simulations are driven by MPI-ESM-LR model outputs from PMIP4, with ERA5 reanalysis data used for evaluation runs.

A novel land-use mapping technique is applied, leveraging Köppen-Geiger climate classifications and current vegetation distributions to reconstruct paleoclimate vegetation patterns. Simulation results are benchmarked against E-OBS, ModE-RA, MCruns, and lgmDAnomaly datasets, revealing typical biases. Historical data exhibits a cold bias, while the 6000 BP period shows scattered low-level wet and cold biases, and the 21000 BP period presents warm and wet biases. Despite these challenges, the km-scale simulations effectively capture detailed climatic patterns, providing crucial insights into the Mediterranean’s paleoclimate and regional implications. These findings highlight the value of downscaling global models to km scales, which can advance our understanding of past climate dynamics and informing strategies for future climate adaptation.

How to cite: Ciarlo`, J., Lamoliere, A., Giuliani, G., Coppola, E., Micallef, A., and Mifsud, D.: Convection Permitting Regional Paleoclimate Simulations with Climate-Driven Land-Use Mapping for a reduced Mediterranean domain, EGU General Assembly 2025, Vienna, Austria, 27 Apr–2 May 2025, EGU25-4864, https://doi.org/10.5194/egusphere-egu25-4864, 2025.

EGU25-5445 | ECS | Posters on site | CL4.11

Arctic river blockage and the formation of glacial deep ocean salinity anomalies  

Hyuna Kim, Axel Timmermann, and Miho Ishizu

Substantial snow accumulation over northern continents during glacial periods contributed to the growth of the Laurentide and Eurasian ice sheets. As a result sea level dropped by ~120-130 m, which led to an increase in global mean ocean salinity by about 1 permil. Pore water chlorinity data from deep ocean sediment cores interestingly show even higher values regionally. Despite this superficial understanding of glacial ocean salinity shifts, the three-dimensional patterns of paleosalinity changes are still not well understood. Here, we argue that northern hemisphere ice-sheets effectively blocked pan-Arctic river discharge into the Arctic Ocean for millennia. In the absence of ice-sheet calving and melting, this process was responsible for the gradual accumulation of the 1 permil global mean salinity anomaly during glacial periods. To better understand the underlying physical mechanisms, we use the Community Earth System Model and mimic the freshwater withholding of the ice-sheets as an idealized negative freshwater perturbation. Applying this forcing scenario, we find that the river blockage due to the Laurentide and Eurasian ice-sheets removes the polar halocline, strengthens the Atlantic Meridional Overturning Circulation and contributes to the global increase of salinity at a rate of 0.1 permil/1000 years. Moreover, the process creates a characteristic pattern of deep ocean salinity anomalies, which is distinct from the vertical salinity redistribution due to sea-ice/brine formation in the Southern Ocean. Eventually, for glacial conditions both, the Arctic and Southern Ocean-generated salinity patterns combine.

How to cite: Kim, H., Timmermann, A., and Ishizu, M.: Arctic river blockage and the formation of glacial deep ocean salinity anomalies , EGU General Assembly 2025, Vienna, Austria, 27 Apr–2 May 2025, EGU25-5445, https://doi.org/10.5194/egusphere-egu25-5445, 2025.

EGU25-6568 | ECS | Orals | CL4.11

Using Past Surface Water Density to Constrain Future South Asian Monsoon Precipitation 

Héloïse Barathieu, Thibaut Caley, Valentin Portmann, Didier Swingedouw, Masa Kageyama, Pascale Braconnot, Didier Roche, Niclas Rieger, Bruno Malaizé, Marion Peral, Emilie Dassié, Karine Charlier, and Franck Bassinot

The hydrological cycle plays a crucial role in the Earth’s climate and has a direct impact on human populations. Despite advances, the IPCC AR6 report highlights persistent uncertainties concerning future projections of potential changes in the hydrological cycle, in particular for low latitudes monsoonal systems. This is because numerical climate models exhibit significant spread in their projections.

Traditionally, to estimate the future value of a climate variable, the distribution of projections from an ensemble of models is examined. However, this uncertainty is very high for water cycle, and the best estimates may be biased. To improve these projections, observational constraint, or emergent constraint methods, have been developed. These approaches adjust the distribution of projected variables based on observations, helping to reduce uncertainty. Furthermore, some studies show that the spatial pattern of sea surface salinity (SSS) is strongly correlated with the mean spatial pattern of the evaporation-precipitation (E-P) balance. Given that, water surface density is mainly influenced by salinity changes in region with strong precipitation and coastal runoff, both salinity and density could provide a useful tracer of the hydrological cycle.

In this study, we reconstruct past sea surface density based on geochemical analyses (ẟ18Oc) on foraminifera extracted from marine sediment cores in the Bay of Bengal. Density changes in this dilution basin are mainly related to south Asian monsoon precipitation changes. We used our density reconstructions for the last glacial maximum (LGM) and Mid-Holocene (MH) as a predictor for the observational constraint method. Our goal is to reduce uncertainties in future South Asian monsoon precipitation projections in climate models by linking paleoclimatic information with future climate projections. To do so, we used PMIP and CMIP numerical climate modelling experiments.

Our preliminary results show an underestimation of South Asian monsoon precipitation in the future (2000-2100) in most models, when using historical surface density and salinity (1900-2000) as a predictor. We are currently finalizing the use of LGM and MH surface density as predictor, in order to compare results when past predictors (LGM and MH) are used rather than an historical predictor.

How to cite: Barathieu, H., Caley, T., Portmann, V., Swingedouw, D., Kageyama, M., Braconnot, P., Roche, D., Rieger, N., Malaizé, B., Peral, M., Dassié, E., Charlier, K., and Bassinot, F.: Using Past Surface Water Density to Constrain Future South Asian Monsoon Precipitation, EGU General Assembly 2025, Vienna, Austria, 27 Apr–2 May 2025, EGU25-6568, https://doi.org/10.5194/egusphere-egu25-6568, 2025.

A rapid change in the Atlantic overturning circulation (AMOC) can have a major impact on the hydrological cycle over land and ecosystems. Examples of such events have been widely discussed in palaeoclimate studies investigating the response of the AMOC to rapid freshening of the North Atlantic caused by ice sheet instability and melting during ice ages or in the early Holocene (Wunderling et al. 2024). The rapid decline of the AMOC and the possibility of its collapse in the future could also have a major impact on terrestrial ecosystems. An open question is the identification of precursors to such shifts and the anticipation of impacts and feedbacks on ecosystems. Here we use as a starting point a transient simulation of the last 6 000 years with version IPSLCM6-LR of the IPSL model (Boucher et al. 2020), starting from the PMIP mid-Holocene simulation with this model (Braconnot et al. 2021).  Surprisingly, this simulation shows a rapid shift of 2 Sv in the AMOC, while this type of bifurcation was not seen in the set of CMIP6 simulations run with the same version of the model. (Boucher et al. 2020). Such a shift doesn't occur in a parallel simulation using a slightly different version of the model with fully interactive vegetation. The presentation will discuss the set of simulations used to identify 1) the reason for the shift, 2) the impact of the shift on the vegetation in Africa and Europe. For the latter, we run snapshot coupled simulations using as initial state the ocean state of the Holocene simulation with the AMOC shift, and the corresponding Earth’s orbit and trace gas configuration.  This allows us to estimate the amplification of the changes induced by the vegetation feedback on the regional changes in the hydrological cycle. 


Boucher O, Servonnat J, Albright AL, et al (2020) Presentation and Evaluation of the IPSL-CM6A-LR Climate Model. J Adv Model Earth Syst 12:e2019MS002010. https://doi.org/10.1029/2019ms002010

Braconnot P, Albani S, Balkanski Y, et al (2021) Impact of dust in PMIP-CMIP6 mid-Holocene simulations with the IPSL model. Clim Past 17:1091–1117. https://doi.org/10.5194/cp-17-1091-2021

Wunderling N, Von Der Heydt AS, Aksenov Y, et al (2024) Climate tipping point interactions and cascades: a review. Earth Syst Dyn 15:41–74. https://doi.org/10.5194/esd-15-41-2024

How to cite: Braconnot, P. and Marti, O.: Rapid change in AMOC intensity in a Holocene transient simulation provides insight into the ocean long term ocean memory  , EGU General Assembly 2025, Vienna, Austria, 27 Apr–2 May 2025, EGU25-7053, https://doi.org/10.5194/egusphere-egu25-7053, 2025.

EGU25-8946 | ECS | Posters on site | CL4.11

Impact of Past AMOC Disruptions on Ocean Oxygenation  

Eva M. Rückert, Bo Liu, and Tatiana Ilyina

The global ocean plays a crucial role in redistributing and storing heat, carbon, nutrients and other essential elements in the Earth’s climate system. As a prominent part of the global ocean circulation, the Atlantic Meridional Overturning Circulation (AMOC) shapes the spatial distribution of these elements and links the atmosphere to the deep ocean.

The state of ocean oxygenation and the carbon storage capacity are tightly connected to biogeochemical activity. High oxygen levels facilitate the efficient remineralization of organic matter, helping to stabilize the CO2 content in the upper ocean layers. In contrast, low oxygen levels enhance carbon storage in the deep ocean temporarily but increase the risk of pronounced outgassing during ocean circulation changes or upwelling events. Thus, ocean oxygenation acts both as an indicator and a control on biogeochemistry and thus long-term climate regulation.

Proxy data indicate substantial changes in AMOC strength in the past, particularly during Termination 1, when high freshwater fluxes disrupted deep water formation and significantly slowed down the ocean circulation. Despite these insights, the interplay between changes in ocean circulation, oxygenation and carbon storage and release during such abrupt events is still not fully understood.

To address these knowledge gaps, we used the Max Planck Institute for Meteorology Earth system model (MPI-ESM) coupled with the interactive Hamburg ocean carbon cycle model (HAMOCC) to simulate transient climate changes during the last deglaciation.

We focused on periods of major AMOC disruptions during the last deglaciation to investigate their impact on the ocean’s oxygen levels in the water column.

Preliminary results indicate a delayed increase of the global oxygen minimum zone (OMZ) volume following abrupt AMOC changes. The most significant changes in the oxygen levels can be observed in the Atlantic Sector of the Southern Ocean. Additionally, we explore the feedbacks between changes in oxygenation, carbon storage, and biological activity across these events.

This research provides new insights into the complex interplay between ocean circulation, oxygen dynamics, and carbon storage during deglacial periods, advancing our understanding of the mechanisms underlying abrupt climate events and their biogeochemical impacts.

How to cite: Rückert, E. M., Liu, B., and Ilyina, T.: Impact of Past AMOC Disruptions on Ocean Oxygenation , EGU General Assembly 2025, Vienna, Austria, 27 Apr–2 May 2025, EGU25-8946, https://doi.org/10.5194/egusphere-egu25-8946, 2025.

The ocean carbon sink and deoxygenation are two key research focuses under the current anthropogenically warming climate, as the former is essential in regulating atmospheric CO2, and the latter is a vital factor for the marine ecosystem. The oceanic carbon and oxygen cycles are closely linked as they are commonly influenced by several processes, such as temperature-dependent gas solubility, organic matter remineralisation in the interior ocean, and ventilation. Future predictions of ocean carbon sink and deoxygenation are still subject to considerable uncertainties as the observational data in the present-day ocean is too sparse to constrain the relevant natural processes. To deepen our understanding of the natural carbon and oxygen cycles, we use the state-of-the-art Max Planck Institute Earth System Model (MPI-ESM) to conduct transient simulations for the last deglaciation (21 ka to the present day).

The deglacial evolution of oceanic CO2 outgassing is mainly controlled by gradual global warming and the Atlantic Meridional Overturning Circulation (AMOC) variability driven by the meltwater from the prescribed ice sheet reconstruction. The global ocean oxygen content generally captures the features of the qualitative oxygen proxies, with lower oxygen content in the glacial ocean compared to the Holocene and a decrease in global oxygen content as the AMOC declines. The low oxygen content in the glacial ocean results from lower oxygen content in the deep ocean (below 2000 m), which is partially counteracted by higher oxygen content in the upper ocean, owing to solubility increase under colder temperatures. The glacial deep-ocean deoxygenation is governed by the air-sea disequilibrium under a more extensive, longer-lasting sea ice cover in the Southern Ocean and a more sluggish transport between the upper and interior ocean. Unlike the ocean carbon content, which closely follows the temporal variation of the North Atlantic Deep Water (NADW) strength, the evolution of the oxygen content is slow and decoupled from the NADW during its recovery phase, suggesting the Southern Ocean ventilation has a more significant impact on the oxygen dynamics. For the mid and late Holocene, when the ocean circulation is quasi-stable, the global air-sea CO2 flux is near zero, whereas the replenishment of deep-sea oxygen continues. Such different response time scales between the ocean carbon and oxygen cycles are also seen in additional sensitivity simulations where an AMOC decline and recovery are simulated by freshwater hosing. Our preliminary findings suggest that the past changes in the climate and ocean circulation are likely to have a long-lasting impact on oxygen dynamics and drive oxygen concentrations away from equilibrium states, which should be accounted for when conducting model-data comparisons.

How to cite: Liu, B., Rückert, E., and Ilyina, T.: Different time scales in the transient response of the ocean carbon and oxygen cycles to deglacial climate change, EGU General Assembly 2025, Vienna, Austria, 27 Apr–2 May 2025, EGU25-11435, https://doi.org/10.5194/egusphere-egu25-11435, 2025.

EGU25-11848 * | ECS | Orals | CL4.11 | Highlight

North American forest dieback simulated in response to warm mid-Holocene summers 

Alfred J. Wilson, Peter O. Hopcroft, Anya J. Crocker, Richard G. Stockey, Charles J. R. Williams, and Paul A. Wilson

Vegetation plays a critical role in regulating climate, not least as a sink of atmospheric carbon. How will anthropogenic warming affect the future distribution and behaviour of vegetation? The study of past warm intervals can contextualise biosphere responses to changes in temperature and precipitation. Pollen archives from central North America, in the Great Plains region, suggest that mid-Holocene (10-4 ka) warming was characterized by an abrupt expansion of grasslands and reduced forest cover. It has been suggested that these changes were a response to drying triggered by an increase in insolation and the abrupt collapse of the Laurentide Ice Sheet but evidence in support of this explanation is lacking. Here we report results from a new dynamic vegetation simulation of the mid-Holocene (6 ka) using the United Kingdom Earth System Model version 1.1 (UKESM1.1), in an atmosphere-land-only configuration. Our simulation is forced by sea-surface temperatures and sea-ice concentrations derived from the PMIP4 HadGEM3-GC3.1 midHolocene experiment and the orbit and greenhouse gas concentrations follow the PMIP4 protocol. In response to summer warming of between 0.5 and 1.5 °C, the model simulates a drying of up to 200 mm yr-1 in the North American continental interior and a substantial decrease in soil moisture. These land surface changes drive shifts in the distribution of plant functional types (PFTs) with a widespread decline in the fractional coverage of forests and a concurrent expansion of grasslands. The forest dieback is most intense in the north and central US and Canadian Great Plains where coverage falls by an area roughly equivalent to half the size of Texas.  

How to cite: Wilson, A. J., Hopcroft, P. O., Crocker, A. J., Stockey, R. G., Williams, C. J. R., and Wilson, P. A.: North American forest dieback simulated in response to warm mid-Holocene summers, EGU General Assembly 2025, Vienna, Austria, 27 Apr–2 May 2025, EGU25-11848, https://doi.org/10.5194/egusphere-egu25-11848, 2025.

EGU25-12057 | ECS | Posters on site | CL4.11

Transient climate simulation of the past 4.5 million years based on the coupled intermediate complexity model iLOVECLIM 

Thomas Extier, Alicia Hou, Thibaut Caley, Didier M. Roche, Peter Köhler, and Roderik S. W. van de Wal

The Earth experienced dramatic climate changes during the past million years, including a long-term gradual cooling from the Pliocene (5.3-2.6 million years ago; Ma) to the Pleistocene (2.6-0.011 Ma) and an abrupt transition from 41-kyr to 100-kyr glacial-interglacial cycles at ca. 1.2-0.8 Ma (i.e., the Mid-Pleistocene transition). Investigating the mechanisms that triggered these climatic responses requires long-term transient climate simulations which can be used to quantify the sensitivity of the Earth’s climate to different external and internal forcings. However, few such simulations exist and therefore, key questions regarding the long-term evolution of the earth system remain unanswered.

Here, we used iLOVECLIM, a coupled Earth system numerical climate model of intermediate complexity, to generate a 4.5 Ma transient climate simulation, the longest to date. iLOVECLIM is ideally suited for this task as it requires substantially less computational resources and time to perform transient climate simulations compared to fully coupled general circulation models. We performed the simulations with interactive atmosphere, ocean and vegetation components and used the methodology of previous long-term transient simulations. Briefly, we applied an acceleration factor of five to the external forcings (orbital parameters, greenhouse gases concentration and ice-sheets) and split the 4.5 Ma simulation into 44 chunks run in parallel to reduce the computing time from several years to a couple of months. Each chunk was initialized from an interglacial period, covers at least one glacial-interglacial cycle and has an overlap period of 20,000 years in order to compensate for issues related to spin-up effects and initial conditions. The complete simulation is a composite of all the individual chunks and time-sliding linear interpolation performed on the overlap intervals.

While the simulations are still ongoing, preliminary results demonstrate that our new model set-up and experimental design are able to produce reasonable outputs. When it is completed, the final simulation will be evaluated against available paleoclimate data and existing transient climate simulations. Apart from running a simulation with all the external forcings combined, we also plan to run subsequent simulations with each individual forcing alone to evaluate the climate responses associated with each. This unique long transient simulation will provide a better mechanistic understanding of the major climate reorganizations that occurred during the Plio-Pleistocene and will be useful for future data-model comparisons and data assimilation endeavours.

How to cite: Extier, T., Hou, A., Caley, T., Roche, D. M., Köhler, P., and van de Wal, R. S. W.: Transient climate simulation of the past 4.5 million years based on the coupled intermediate complexity model iLOVECLIM, EGU General Assembly 2025, Vienna, Austria, 27 Apr–2 May 2025, EGU25-12057, https://doi.org/10.5194/egusphere-egu25-12057, 2025.

EGU25-13365 | Orals | CL4.11

Sensitivity of the Pliocene Climate to CO2, Orbital Forcing and Vegetation.  

Julia Tindall, Alan Haywood, and Stephen Hunter

The climate of the Late Pliocene (3.60-2.58Ma), has been extensively studied using models and data, as it represents the most recent period in Earth history where CO2 levels were similar to the present day.   Within this interval, Marine Isotope Stage (MIS) KM5c (~3.205Ma) also had similar to present day orbital configuration, and hence was the subject of the second phase of the Pliocene Modelling Intercomparison Project (PlioMIP2). 

Phase 3 of PlioMIP (PlioMIP3) is now underway and includes a number of sensitivity experiments to assess how the Late Pliocene climate would have been expected to respond to different CO2 levels (280ppmv, 400ppmv, 490ppmv and 560ppmv), extreme orbits and vegetation.   

Here we will present results from these sensitivity experiments, which have been run using the Hadley Centre Climate Model (HadCM3).  We find that the CO2  changes have a slightly smaller effect on temperatures when using Late Pliocene boundary conditions, than when using preindustrial, however the differences are region dependent.  For example, Southern Ocean warming due to CO2 is notably lower with Pliocene boundary conditions than with preindustrial.  This is partly because non-CO2 Pliocene forcing has already warmed this region significantly, however non-linearities will be discussed.  

Results from the Late Pliocene experiment with a warm northern hemisphere summer orbit, and a warm southern hemisphere summer orbit will also be presented.  This will allow us to assess how temperature and precipitation patterns could have varied throughout the Late Pliocene.   The relative importance of paleogeography changes, CO2 changes, orbital changes and vegetation changes on Pliocene warming will be analysed.  


How to cite: Tindall, J., Haywood, A., and Hunter, S.: Sensitivity of the Pliocene Climate to CO2, Orbital Forcing and Vegetation. , EGU General Assembly 2025, Vienna, Austria, 27 Apr–2 May 2025, EGU25-13365, https://doi.org/10.5194/egusphere-egu25-13365, 2025.

EGU25-13628 | ECS | Posters on site | CL4.11

Modeling Paleocene-Eocene Hyperthermals with the PlaSim-LSG Earth System Model of Intermediate Complexity 

Isabella Ghirardo and Jost Hardenberg

Hyperthermal events, such as the Paleocene-Eocene Thermal Maximum (PETM, 56 million years ago) and Early Eocene Climatic Optimum (EECO, 52 million years ago), are of significant interest because they offer critical insights into how the Earth’s climate reacts to rapid increases in greenhouse gas concentrations. These events, marked by intense global warming and ocean acidification, improve our understanding of the long-term effects of sudden carbon releases and help assess the potential impacts of today's human-driven climate change.

In this study, we use a version of the Planet Simulator (PlaSim), an Earth Model of Intermediate Complexity (EMIC) improved with a 3D ocean model (Large-Scale Geostrophic ocean model, LSG), to simulate these hyperthermal periods. This modeling approach allows for detailed analyses of ocean-atmosphere interactions and their role in shaping global climate patterns under extreme GHG scenarios. The simulations include boundary conditions derived from Herold et al. (2014) and use an experimental approach similar to the DeepMIP protocol. We explore a range of atmospheric CO2 levels (from 1× to 16× pre-industrial concentrations) to evaluate the sensitivity of the climate system to these factors.

The focus is on understanding feedback mechanisms and climate dynamics under extreme greenhouse gas forcing, while also considering equilibrium climate sensitivity (ECS) and polar amplification, with attention to Antarctic warming and its implications for ice-free conditions during the late Paleocene–early Eocene. Current work involves testing and refining paleoclimate boundary conditions in the Planet Simulator, particularly adjusting paleogeography, vegetation parameters, and ocean circulation to match the climate conditions of that period. This study improves our understanding of past extreme greenhouse climates and evaluates the ability of modern Earth System Models (ESMs) to predict future climate changes.

How to cite: Ghirardo, I. and Hardenberg, J.: Modeling Paleocene-Eocene Hyperthermals with the PlaSim-LSG Earth System Model of Intermediate Complexity, EGU General Assembly 2025, Vienna, Austria, 27 Apr–2 May 2025, EGU25-13628, https://doi.org/10.5194/egusphere-egu25-13628, 2025.

EGU25-13785 | Orals | CL4.11

Experimental design for DeepMIP-Eocene Phase 2 - impact of new paleogeography and vegetation 

Dan Lunt and the The DeepMIP-Eocene Team

Warm, high-CO2 climates of Earth's past provide an opportunity to both evaluate climate models under extreme forcing and to explore mechanisms that lead to such warmth.  One such time period is the early Eocene, when global mean surface temperatures were 10-16 oC higher than preindustrial, and  CO2 concentrations were about ~1500 ppmv.

In this presentation we present the experimental design for Phase 2 of the Eocene component of the Deep-time Model Intercomparison project (DeepMIP-Eocene-p2).  The aim is to provide a framework within  which modelling groups can carry out a common set of simulations, thereby facilitating exploration of inter-model dependencies.  Focus is on the early Eocene Climatic Optimum (EECO, ~53.3-49.1 million years ago).  Relative to Phase 1 of DeepMIP, we provide a new paleogeography (topography, bathymetry) derived from four independent reconstructions, a new vegetation derived from vegetation model simulations that have been evaluated with paleobotanical data, and a new CO2 specification derived from the boron isotope proxy.  The core set of simulations consists of a preindustrial control, an abrupt increase to 4x preindustrial CO2 concentrations under modern conditions, a standard control EECO simulation at 5x preindustrial CO2 concentrations, and an EECO simulation with preindustrial CO2 concentrations.  In addition to these core simulations, we suggest a suite of optional sensitivity studies, which allow various sensitivities to be explored, such as to topography/bathymetry, greenhouse gases, land-surface parameters, astronomical and solar forcings, and internal model parameters.  Overall, we hope that the updated boundary conditions and guidance on initialisation in Phase 2 will allow more robust model-data comparisons, more accurate insights into mechanisms influencing early Eocene climate, and increased relevance for informing future climate change projection. 

In addition to the exprimental design, we present intitial simulations with the HadCM3 model with the new boundary conditions, and compare with the results from Phase 1, illustrating the sensitivity to the new paleogeography and vegetation.


How to cite: Lunt, D. and the The DeepMIP-Eocene Team: Experimental design for DeepMIP-Eocene Phase 2 - impact of new paleogeography and vegetation, EGU General Assembly 2025, Vienna, Austria, 27 Apr–2 May 2025, EGU25-13785, https://doi.org/10.5194/egusphere-egu25-13785, 2025.

EGU25-13793 | ECS | Posters on site | CL4.11

Ocean surface wind variability under the Pliocene warmth 

Hana Kawashima and Shineng Hu

During the mid-Pliocene, carbon dioxide (CO2) concentrations were comparable to current levels, ~350-450 p.p.m., making the mid-Pliocene a valuable analog for current and potentially future climates. However, the global average temperature in the mid-Pliocene is estimated to have been ~3 ºC higher than today, implying factors beyond greenhouse gases contributed to the warmth. Surface wind velocity, a key driver of ocean mixing and air-sea turbulent heat flux, significantly affects ocean heat content and global heat distribution. Understanding the role of surface wind speed in warm climates is therefore important to uncover the causes of the Pliocene warmth. 

In this study, we utilized a set of climate models from the Coupled Model Intercomparison Project (CMIP) and the Paleoclimate Modeling Intercomparison Project (PMIP) archives to analyze surface wind variability in the tropics during the mid-Pliocene and the Pre-industrial periods. Over the tropics, surface wind velocity is strongly influenced by sea surface temperature (SST) patterns, predominantly El Niño-Southern Oscillation. To explore the underlying mechanisms of surface wind variability, we applied Empirical Orthogonal Functions (EOF) to tropical SST data to extract SST patterns and decompose surface wind speed into SST-dependent and SST-independent components. Our results revealed that the ratio of SST-dependent and SST-independent wind variability could vary substantially in space and with season, and it could differ between the mid-Pliocene and the Pre-industrial period with a large inter-model spread. Implications for understanding the mid-Pliocene warmth and constraining future climate projection will be discussed.

How to cite: Kawashima, H. and Hu, S.: Ocean surface wind variability under the Pliocene warmth, EGU General Assembly 2025, Vienna, Austria, 27 Apr–2 May 2025, EGU25-13793, https://doi.org/10.5194/egusphere-egu25-13793, 2025.

EGU25-14091 | Orals | CL4.11

A brief note on Supercooled Glacial Deep Waters 

Miho Ishizu, Axel Timmermann, and Yun Kyung-Sook

According to hydrographic profiles, about 2-5% of the present deep Southern Ocean waters have temperatures below the freezing point. Which role these supercooled waters may have played under glacial conditions is an open question. To elucidate the variations and mechanisms of deep ocean supercooling in the past we analyze a recently conducted quasi-transient earth system model simulation (CESM1.2), which covers the climate history of the past 3 million years. After the mid-Pleistocene Transition (MPT, ~1.2-0.75 million years ago, Ma) the simulation shows the presence of substantial volumes of supercooled glacial intermediate/deep waters primarily in the equatorial to northern Pacific. Our study explores the formation mechanisms of these waters in the subarctic North Pacific and their importance in creating deep ocean stratification with potential impacts on ocean carbon storage. We also address several modeling caveats in representing only surface sea ice in the present generation of climate models (not allowing for subsurface freezing) and in ensuring tracer conversation in longterm transient climate model simulations.


How to cite: Ishizu, M., Timmermann, A., and Kyung-Sook, Y.: A brief note on Supercooled Glacial Deep Waters, EGU General Assembly 2025, Vienna, Austria, 27 Apr–2 May 2025, EGU25-14091, https://doi.org/10.5194/egusphere-egu25-14091, 2025.

EGU25-14317 | ECS | Orals | CL4.11

New Insolation Forcing for Paleoclimate Models 

Ilja J. Kocken and Richard E. Zeebe

In paleoclimate simulations, the insolation forcing at the top of the atmosphere needs to be altered to reflect Earth's orbital history during the time interval of interest. General Circulation Models (GCMs) often rely on either a modern orbital configuration to allow for direct comparison to modern and near-future climate simulations—sometimes with snapshot sensitivity experiments (DeepMIP, PlioMIP, etc.)—or they use the Berger (1978) (Ber78) routines to compute the orbital parameters. For snapshot simulations targeting older time periods such as the Eocene, using the modern orbital configuration is inappropriate, because the obliquity amplitude, for example, was much smaller than in the recent past. Our astronomical solutions ZB18a and ZB20a have been shown to produce the best match with geologic data to 58 Ma and 71 Ma, respectively (Zeebe & Lourens 2019, Kocken & Zeebe 2024). The eccentricity of the Ber78 solution diverges from these astronomical solutions already at ~33 ka, shows a different amplitude throughout, and drifts out of phase at ~1.6 Ma. It has been noted in the literature as well as code that the Ber78 routines are not appropriate for an analysis of time periods older than ~1 Myr. However, even recent transient simulations of the past 3 Myr sometimes fall back to using these outdated routines for the full time period. This is likely because of their ease of use; for example, the Ber78 routines are well-integrated into the Community Earth System Model (CESM).

In this study, we analyze the effects of using recent astronomical solutions on the insolation at the top of the atmosphere. Here we show that the absolute difference between insolation from Ber78 and our solution ZB18a increases periodically with increasing age, reaching values up to 88 Wm−2 at 2.68 Ma. This difference is of the same order of magnitude as the difference between a precession minimum and maximum. To facilitate using recent astronomical solutions in GCMs such as the CESM, we make the ZB18a and ZB20a orbital solutions readily available: We provide Fortran subroutines that calculate insolation and interpolate the astronomical parameters to a certain calendar date, and provide drop-in replacements to existing Fortran subroutines from the CESM. In this presentation we will show several examples of previous studies that could have benefited from these new routines.

Berger, A. (1978). Long-term variations of caloric insolation resulting from the earth’s orbital elements, Quaternary Research, 9, 139–167. https://doi.org/10.1016/0033-5894(78)90064-9

Zeebe, R. E., & Lourens, L. J. (2019). Solar System chaos and the Paleocene–Eocene boundary age constrained by geology and astronomy. Science, 365(6456), 926–929. https://doi.org/10.1126/science.aax0612

Kocken, I.J., & Zeebe, R. E. (2024). Testing Astronomical Solutions With Geological Data for the Latest Cretaceous: An Astronomically Tuned Time Scale. Paleoceanography and Paleoclimatology, 39(11). https://doi.org/10.1029/2024PA004954

How to cite: Kocken, I. J. and Zeebe, R. E.: New Insolation Forcing for Paleoclimate Models, EGU General Assembly 2025, Vienna, Austria, 27 Apr–2 May 2025, EGU25-14317, https://doi.org/10.5194/egusphere-egu25-14317, 2025.

EGU25-14580 | ECS | Orals | CL4.11

Remote impacts of the mid-Holocene Green Sahara 

Shivangi Tiwari, Francesco S. R. Pausata, Allegra N. LeGrande, Michael Griffiths, Ilana Wainer, Hugo Beltrami, Anne de Vernal, Peter O. Hopcroft, Clay Tabor, Deepak Chandan, and W. Richard Peltier

The mid-Holocene (MH: 6,000 years before present) is a key time slice for paleoclimate studies, and is one of the two entry cards for participation in the current Paleoclimate Modelling Intercomparison Project (PMIP4). The MH was characterized by high boreal summer insolation, leading to an intensification of the Northern Hemisphere monsoons. In northern Africa, the strengthening of the West African Monsoon was further amplified by nonlinear feedbacks, resulting in the development of vegetation referred to as the “Green Sahara”. The vegetation and land surface changes over northern Africa had various remote effects impacting the global climate through teleconnections.

In this study, we analyse outputs from five fully coupled global climate models to identify the  remote impacts of the Green Sahara on global climate. Through the difference of two sets of mid-Holocene simulations – with and without the Green Sahara – we isolate the effect of the northern African vegetation and land cover changes on South American hydroclimate and tropical modes of climate variability such as the El Niño Southern Oscillation and the Atlantic Niño. Using an atmosphere-only climate model, we further investigate the Saharan-Arctic teleconnection invoked to explain the Arctic cooling concurrent with Saharan desertification. We quantify proxy-model agreement through metrics such as the Cohen’s Kappa index and the Root Mean Square Error to assess if the inclusion of the Green Saharan changes leads to greater coherence of model simulations with proxy reconstructions. Our results demonstrate the critical role of the Green Sahara in modulating the MH climate.

How to cite: Tiwari, S., S. R. Pausata, F., N. LeGrande, A., Griffiths, M., Wainer, I., Beltrami, H., de Vernal, A., O. Hopcroft, P., Tabor, C., Chandan, D., and Peltier, W. R.: Remote impacts of the mid-Holocene Green Sahara, EGU General Assembly 2025, Vienna, Austria, 27 Apr–2 May 2025, EGU25-14580, https://doi.org/10.5194/egusphere-egu25-14580, 2025.

EGU25-15686 | Posters on site | CL4.11

Estimating the change in low level cloud cover during the Brunhes-Matuyama magnetic field reversal: A first modelling approach 

Irina Thaler, Jacob Svensmark, Martin Bødker Enghoff, Nir Shaviv, and Henrik Svensmark

Geomagnetic variations are the perfect testbed to study the effect of Galactic Cosmic Rays (GCR) on climate, as they disentangle solar variability from direct GCR effects. We use the 3D chemical transport model GEOS-CHEM to simulate the change in the cloud condensation nuclei number density during the Brunhes-Matuyama magnetic field reversal assuming present day aerosol conditions. We then estimate the change in cloud condensation nuclei for low level clouds under both solar minimum and solar maximum ionisation conditions. We also test whether the effect of ion-enhanced growth significantly enhances the process. We find a cloud condensation nuclei enhancement for low level clouds throughout the magnetic field reversal of several percent, which supports the observational findings of a wetter and colder climate during the Brunhes-Matuyama magnetic field reversal.

How to cite: Thaler, I., Svensmark, J., Bødker Enghoff, M., Shaviv, N., and Svensmark, H.: Estimating the change in low level cloud cover during the Brunhes-Matuyama magnetic field reversal: A first modelling approach, EGU General Assembly 2025, Vienna, Austria, 27 Apr–2 May 2025, EGU25-15686, https://doi.org/10.5194/egusphere-egu25-15686, 2025.

EGU25-17020 | ECS | Posters on site | CL4.11

Antarctic ice sheet evolution from the Last Glacial Maximum to the present day constrained by relative sea-level variations 

Jonas Van Breedam, Philippe Huybrechts, and Elie Verleyen

The Last Glacial Maximum (LGM) Antarctic ice sheet extent is relatively well constrained with an ice sheet reaching to the continental shelf edge in most places. The ice mass stored in the ice sheet and especially the ice sheet mass loss evolution since the Last Glacial Maximum is more debated. Reconstructed relative sea-level (RSL) variations along the Antarctic coast capture the interplay between ice mass changes, variations in the isostatic response and gravitational forces between the ocean water and the ice mass and therefore, can aid to reconstruct the Antarctic ice sheet evolution from the LGM to the present day.

Here we use the Antarctic ice sheet model AISMPALEO that includes a spatially variable Elastic Lithosphere Relaxing Asthenosphere isostasy model with an approximation of the gravitational consistent sea level equation. A large suite of Antarctic ice sheet model simulations is performed and analyzed from the Last Glacial Maximum to the present-day. The simulations are forced by different global sea-level reconstructions, PMIP4 climate model output for the ocean and the atmosphere and different Earth rheological parameters in the isostasy model. The model runs are compared with published datasets of relative sea-level along the coast of Antarctica to derive the best agreement between the RSL data and the Antarctic ice sheet evolution.

How to cite: Van Breedam, J., Huybrechts, P., and Verleyen, E.: Antarctic ice sheet evolution from the Last Glacial Maximum to the present day constrained by relative sea-level variations, EGU General Assembly 2025, Vienna, Austria, 27 Apr–2 May 2025, EGU25-17020, https://doi.org/10.5194/egusphere-egu25-17020, 2025.

EGU25-17858 | Orals | CL4.11

Simulating marine biogeochemistry and atmospheric pCO2 for the Last Glacial Maximum using an ensemble of calibrated parameter sets 

Chia-Te Chien, Markus Pahlow, Markus Schartau, Christopher Somes, and Andreas Oschlies

During the Last Glacial Maximum (LGM), atmospheric pCO2 was approximately 90 ppm lower than in the pre-industrial era. Several hypotheses have been proposed to explain this decrease, including changes in nutrient supply, increased iron input to the ocean, and variations in overturning circulation strength driven by differences in wind stress and moisture diffusivity. Current modeling approaches that simulate LGM marine biogeochemistry typically use parameter sets calibrated under pre-industrial boundary conditions, introducing uncertainty due to the imperfect knowledge of the values that can be assigned to the parameters for the LGM environment. The extent to which this uncertainty affects the simulated LGM marine biogeochemistry remains unclear. In this study, we employ an optimality-based non-Redfield plankton ecosystem model coupled with a 3D Earth system model to simulate LGM conditions. We conduct sensitivity analyses with 24 combinations of biogeochemical parameters (reduced benthic denitrification rate, decreased sedimentary iron input, higher PO4 levels, and increased atmospheric iron depositio­n) and physical boundary conditions (changes in wind stress pattern and increased meridional moisture diffusivity over the Southern Ocean). For each scenario, we perform 20 simulations using 20 biogeochemical parameter sets selected out of 600—each representing pre-industrial biogeochemistry and evaluated based on the misfit between observations and model outputs—resulting in a total of 480 simulations. Our results show that iron input exerts the most profound influence on LGM marine biogeochemistry and atmospheric pCO2, while changes in major nutrient supplies have minor effects. Additionally, the impact of physical conditions on biogeochemical tracers varies, depending on the specific biogeochemical settings. Compared to pre-industrial reference conditions, atmospheric pCO2 under full LGM conditions decreases by 36 to 58 ppm across the 20 simulations. The difference between the maximum and minimum pCO2 changes amounts to 50% of the 43 ppm average decrease. These findings highlight that, although the 20 parameter sets effectively reproduce pre-industrial marine biogeochemistry, significant cross-model variance in pCO2 responses and marine biogeochemical changes persists under LGM conditions.

How to cite: Chien, C.-T., Pahlow, M., Schartau, M., Somes, C., and Oschlies, A.: Simulating marine biogeochemistry and atmospheric pCO2 for the Last Glacial Maximum using an ensemble of calibrated parameter sets, EGU General Assembly 2025, Vienna, Austria, 27 Apr–2 May 2025, EGU25-17858, https://doi.org/10.5194/egusphere-egu25-17858, 2025.

EGU25-17910 | Posters on site | CL4.11

Planning for the next phase of the Paleoclimate Modelling Intercomparison Project (PMIP7) 

Chris Brierley, Masa Kageyama, Jean-Yves Peterschmitt, Christian Stepanek, and Louise Sime

The Paleoclimate Modelling Intercomparison Project (PMIP) was launched in 1995 and has since closely followed the phases of the Coupled Model Intercomparison Project (CMIP) providing understanding of past climate states based on the latest Global Climate Models and evaluation of their capacity to represent climates very different from the recent one. PMIP is planning its next phase, in the wake of CMIP7 launch (Dunne et al., 2024).

CMIP7 is organised along two main phases: the Fast Track, to be delivered in time for its results to be analysed and published for the seventh assessment report of the IPCC (Intergovermental Panel on Climate Change), followed by the main phase of CMIP7. This poster will describe the rationale of including an idealised paleoclimate simulation, "abrupt-127k", in the Fast Track set of experiments. This experiment starts from the Fast Track pre-industrial control experiment and then abruptly changes the astronomical parameters to those for 127,000 years ago (as well as some minor greenhouse gas changes). This will allow analyses of the sensitivity of the Arctic sea ice to conditions favouring its summer decrease or even collapse, and can be extended to become a last interglacial simulation (lig127k). The poster will also briefly describe the other experiments that are expected to be included in the next phase of PMIP. We are looking forward to discussions of key experiments, analyses, challenges with the PMIP and CMIP communities alike.

Dunne et al., 2024: https://doi.org/10.5194/egusphere-2024-3874

How to cite: Brierley, C., Kageyama, M., Peterschmitt, J.-Y., Stepanek, C., and Sime, L.: Planning for the next phase of the Paleoclimate Modelling Intercomparison Project (PMIP7), EGU General Assembly 2025, Vienna, Austria, 27 Apr–2 May 2025, EGU25-17910, https://doi.org/10.5194/egusphere-egu25-17910, 2025.

EGU25-18286 | ECS | Posters on site | CL4.11

Ice-sheet topography changes in North America affect teleconnection patterns on glacial time scales 

Isma Abdelkader Di Carlo, Francesco Pausata, Masa Kageyama, Cécile Davrinche, Marcus Lofverstrom, and Ulysses Ninnemann

The topography of the Laurentide Ice Sheet (LIS) during glacial periods, particularly the Last Glacial Maximum (LGM), played a pivotal role in shaping atmospheric circulation and teleconnection patterns. This study investigates the impact of LIS elevation changes on global atmospheric dynamics using fully coupled paleoclimate simulations with the isotope-enabled Community Earth System Model (CESM) version 1.2. Previous studies have shown that a higher LIS elevation significantly amplifies Arctic warming, reducing the equator-to-pole temperature gradient and influencing jet streams and stationary waves (Liakka & Lofverstrom, 2018 ; Beghin et al., 2014 ; Lofverstrom et al., 2014). This mechanism may also extend to the Southern Hemisphere, affecting teleconnection pathways.

By systematically modifying LIS elevation, we explore its role in altering large-scale atmospheric circulation features such as the Intertropical Convergence Zone (ITCZ), Southern Annular Mode (SAM), and Walker circulation, as well as modes of variability including El Niño–Southern Oscillation (ENSO). We show the critical influence of LIS topography on global teleconnections and how ice sheet dynamics shaped glacial climate variability and atmospheric feedbacks.

How to cite: Abdelkader Di Carlo, I., Pausata, F., Kageyama, M., Davrinche, C., Lofverstrom, M., and Ninnemann, U.: Ice-sheet topography changes in North America affect teleconnection patterns on glacial time scales, EGU General Assembly 2025, Vienna, Austria, 27 Apr–2 May 2025, EGU25-18286, https://doi.org/10.5194/egusphere-egu25-18286, 2025.

EGU25-18941 | ECS | Posters on site | CL4.11

Enhanced “wind-evaporation effect” drove the “deep-tropical contraction” in the early Eocene 

Zikun Ren, Tianjun Zhou, Zhun Guo, Meng Zuo, Lingqiang He, Xiaolong Chen, Lixia Zhang, Bo Wu, and Wenmin Man

The early Eocene is the warmest epoch in the last 65 million years, with a global mean temperature 9 to 23°C higher than the modern era. According to state-of-the-art climate models, the tropical rainfall contracted towards the equator during this extremely warm period. However, the physical mechanism causing this phenomenon remains unclear. In this study, we examined the hemispheric energy balance in the early Eocene that causes the equatorward contraction of tropical precipitation. A novel mechanism underlying this phenomenon is revealed. Based on the climate modeling of CESM1.2, we show that the GHG-induced warmth enhances the sensitivity of evaporation to surface wind speed changes in the early Eocene. Thus, the stronger tropical trade wind in the winter hemisphere will drive out stronger latent heat flux than in the summer hemisphere. This interhemispheric asymmetric response reduces the interhemispheric heating contrast in the solstice seasons. As a result, the ascending motion in the tropical atmosphere migrates towards the equator, finally decreases the width of tropical precipitation in the early Eocene.

How to cite: Ren, Z., Zhou, T., Guo, Z., Zuo, M., He, L., Chen, X., Zhang, L., Wu, B., and Man, W.: Enhanced “wind-evaporation effect” drove the “deep-tropical contraction” in the early Eocene, EGU General Assembly 2025, Vienna, Austria, 27 Apr–2 May 2025, EGU25-18941, https://doi.org/10.5194/egusphere-egu25-18941, 2025.

EGU25-19034 | Posters on site | CL4.11

Monsoon trend and multi-scale variability changes over the last 6000 years 

Roberta D'Agostino, Pascale Braconnot, Sandy P. Harrison, Julien Crètat, Zhenqian Wang, and Qiong Zhang and the PACMEDY

The Holocene started about 10000 years before present and is the period during civilizations as we know them today emerged. However, during that time several regions such as Sahel-Sahara or the Indus valley in the tropics experienced severe aridification and dramatic environmental changes for ecosystems and humans. There is general agreement that this has been caused by the southward shift of the boreal monsoon rain belt and that slow variations of Earth’s orbital parameters are the long-term driver. In addition to insolation forcing, several feedbacks involving the ocean, sea-ice, or vegetation have had a profound impact on regional changes and on the multiscale monsoon variability, including extreme monsoon years. They have shaped the magnitude and the timing of environmental changes depending on monsoon systems. Although these feedbacks have been widely discussed, their relative strength is still under debate. These unknows prevent proper anticipation and simulation of future monsoon behavior. Long transient simulations of the Holocene climate allow us to revisit these questions by shedding light on monsoon multiscale variability and the representation of vegetation feedbacks. Using a set of transient mid to late Holocene simulations (last 6000 years), we will discuss the relative evolution of the global monsoons. Highlights will be on the relative responses to changes in insolation seasonality between African and Indian monsoons, the role of dynamical versus thermodynamical atmospheric feedbacks in monsoon precipitation, and on the relationship between long term trends, interannual to multicentennial variability and periods of extreme dry or wet monsoon seasons. Comparisons of model results with proxy reconstruction of climate variability over land and ocean from speleothems, coral and shells has been done considering the chaotic nature of multiscale monsoon variability. They provide us with indication of the consistency of model inferred trends in monsoon variability and the real climate trajectory.

How to cite: D'Agostino, R., Braconnot, P., Harrison, S. P., Crètat, J., Wang, Z., and Zhang, Q. and the PACMEDY: Monsoon trend and multi-scale variability changes over the last 6000 years, EGU General Assembly 2025, Vienna, Austria, 27 Apr–2 May 2025, EGU25-19034, https://doi.org/10.5194/egusphere-egu25-19034, 2025.

EGU25-20327 | Posters on site | CL4.11

Insights from AWIESM-wiso:  climate and water isotope signals in northern Africa in a precession cycle 

Xiaoxu Shi, Martin Werner, Hu Yang, Qinggang Gao, Jiping Liu, and Gerrit Lohmann

Precessional forcing is a key driver of quaternary climate change. Based on 24 experiments covering a full precession cycle, this study explores spatio-temporal variations of both climate and isotope signals in northern Africa. We find a synchronous phasing of precipitation variations with solar radiation levels and an asynchronous timing of surface air temperature changes across different sub-regions of northern Africa. Based on daily precipitation, our results reveal earlier onset and withdrawal, as well as a shorter duration of the West Africa summer monsoon (WASM) at minimum precession compared to maximum precession. The onset of the WASM is controlled by the intensity of the Sahara Heat Low, while the monsoon termination is linked to subtropical solar radiation and interhemispheric thermo contrast. Using a novel scale-flux tracing technique, we find that, precipitation during minimum precession is more influenced by evaporation from warmer and more humid regions compared to maximum precession. Additionally, certain inland areas of northern Africa exhibit positive temporal isotope-precipitation gradients, violating the "amount effect". This phenomenon mainly occurs during precession phases associated with Green Sahara periods. The isotope composition changes in such places primarily reflect changes in upstream rainfall quantity, rather than changes in local precipitation as is inferred from present day analogs. Conversely, the "amount effect" remains applicable during dry periods in Africa when the Sahara desert is present. This suggests that isotope-based reconstruction of past precipitation variations during Green Sahara periods over North Africa needs to be taken with caution.

How to cite: Shi, X., Werner, M., Yang, H., Gao, Q., Liu, J., and Lohmann, G.: Insights from AWIESM-wiso:  climate and water isotope signals in northern Africa in a precession cycle, EGU General Assembly 2025, Vienna, Austria, 27 Apr–2 May 2025, EGU25-20327, https://doi.org/10.5194/egusphere-egu25-20327, 2025.

EGU25-789 | ECS | Orals | CL4.12

Evaluating Surface Heat Feedbacks: Insights from CMIP Models 

Kwatra Sadhvi, Lengaigne Matthieu, Danielli Vincent, Iyyappan Suresh, and Vialard Jérôme

Surface feedbacks are critical to understanding global temperature patterns, as they directly regulate the exchange of energy at the ocean-atmosphere boundary. While surface feedbacks have been studied using methods like the Gregory regression, Climate Feedback-Response Analysis Method (CFRAM) and Partial Radiative Perturbation (PRP) approaches, their role in shaping climate responses remains less explored through analytical frameworks. Here, we assess surface feedbacks across 48 models from the Coupled Model Intercomparison Project Phases 5 and 6 (CMIP5/6) using a novel analytical formulation. This approach focuses on net surface heat flux feedbacks (latent and longwave), with observational constraints to improve robustness.
Our results indicate that the globally averaged surface feedback is dominated by the latent heat component for both the multi-model mean and the diversity. This is because of strong compensation between upward and downward longwave feedbacks. Observational constraints further reveal that CMIP models tend to overestimate the negative latent heat feedback in the tropics, attributed to an exaggerated air-sea temperature gradient . This bias may contribute to a ~10% underestimation of the global warming signal in these models.
By leveraging this novel analytical approach, we provide insights into surface feedback processes that are obscured in traditional TOA-based analyses. While our findings for net longwave feedbacks align closely with the standard regression approach, the analytical method reveals systematically higher negative latent feedback values. This divergence points to the need of further investigating the roles of short-term feedback processes and dynamical contributions, paving the way for reconciling analytical and regression-based methodologies.

How to cite: Sadhvi, K., Matthieu, L., Vincent, D., Suresh, I., and Jérôme, V.: Evaluating Surface Heat Feedbacks: Insights from CMIP Models, EGU General Assembly 2025, Vienna, Austria, 27 Apr–2 May 2025, EGU25-789, https://doi.org/10.5194/egusphere-egu25-789, 2025.

EGU25-1486 | ECS | Orals | CL4.12

How to think about the shortwave water vapor feedback 

Florian E. Roemer, Stefan A. Buehler, and Kaah P. Menang

Recent studies have provided analytical descriptions of Earth’s longwave feedback λLW; to expand on this, we propose an analytical model for the shortwave water vapor feedback λSW. In this model, λSW is proportional to the change in the square of atmopsheric transmissivity tatm with temperature T and thus mainly originates from spectral regions that ”transition” from optically thin to optically thick. Following Jeevanjee (2023, DOI: 10.1119/5.0135727), we approximate tatm based on the column water vapor MH2O and the water vapor mass absorption cross-section κH2O. We show that in order to capture the weak T dependence of λSW, it is crucial to account for spectral variations in κH2O, which can already be achieved by a simple exponential fit.

We further demonstrate that the T dependence of λSW can be explained by the opposing effects of two main processes: At low T, more optically thin parts of the spectrum ”start” their transition than optically thick parts ”complete” their transition, leading to an increase in λSW with T. At high T, the inverse T dependence of the Clausius-Clapeyron relation leads to a decrease in λSW.

We can also extend our model to incorporate second-order effects such as spectral variations in solar irradiance and deviations of κH2O from the idealized exponential fit. This version of the model is in good agreement with full radiative transfer simulations. The remaining discrepancies can be attributed to non-linear absorption by the water vapor continuum, deviations in MH2O from the approximated Clausius-Clapeyron scaling, and the effects of molecular Rayleigh scattering.

In conclusion, we demonstrate that the shortwave water vapor feedback λSW can be understood using a simple analytical model. This model also demonstrates the merits of a spectral approach to understand λSW and illuminates the two key processes that drive its T dependence.

How to cite: Roemer, F. E., Buehler, S. A., and Menang, K. P.: How to think about the shortwave water vapor feedback, EGU General Assembly 2025, Vienna, Austria, 27 Apr–2 May 2025, EGU25-1486, https://doi.org/10.5194/egusphere-egu25-1486, 2025.

EGU25-1658 | Orals | CL4.12

Circulation and cloud responses to patterned SST warming 

Michael Byrne, Anna Mackie, Emily Van de Koot, and Andrew Williams

The climatological atmospheric circulation is key to establishing the tropical 'pattern effect', whereby cloud feedbacks induced by sea surface temperature (SST) warming depend on the spatial structure of that warming. But how patterned warming-induced circulation changes affect cloud responses is less clear. Here we use idealized simulations with prescribed SST perturbations to understand the contributions to changes in tropical-mean cloud radiative effects (CRE) from different circulation regimes. We develop a novel framework based on moist static energy to understand the circulation response, targeting in particular the bulk circulation metric of ascent fraction. Warming concentrated in regions of ascent leads to a strong 'upped-ante' effect and spatial contraction of the ascending region. Our framework reveals substantial contributions to tropical-mean CRE changes not only from traditional 'pattern effect' regimes, but also from the intensification of convection in ascent regions as well as a smaller contribution from cloud changes in convective margins.

How to cite: Byrne, M., Mackie, A., Van de Koot, E., and Williams, A.: Circulation and cloud responses to patterned SST warming, EGU General Assembly 2025, Vienna, Austria, 27 Apr–2 May 2025, EGU25-1658, https://doi.org/10.5194/egusphere-egu25-1658, 2025.

Cloud feedback remains a leading source of uncertainty in climate model projections under increasing atmospheric carbon dioxide. Cloud-controlling factor (CCF) analysis is a method used to observationally constrain cloud feedback and, subsequently, the climate sensitivity. Although high clouds contribute significantly to this uncertainty, they have historically received comparatively little attention in CCF studies. Here, we apply CCF analysis to observationally constrain high-cloud feedback, focusing on feedback associated with changes in cloud amount due to its dominant contribution to uncertainty. Our observational constraints reveal larger decreases in high cloud amount with warming than climate models predict, yet the net high-cloud radiative feedback remains near-neutral due to compensating shortwave and longwave effects. We also show that including upper-tropospheric static stability as a predictor effectively captures the stability iris mechanism and associated changes in cloud amount. This work highlights the importance of using physically relevant CCFs for robust observational constraints on high-cloud feedback and improving mechanistic understanding of its underlying drivers.

How to cite: Wilson Kemsley, S. J., Nowack, P., and Ceppi, P.: Observational high-cloud feedback constraints indicate climate models underestimate global reductions in high-cloud amount with warming, EGU General Assembly 2025, Vienna, Austria, 27 Apr–2 May 2025, EGU25-2499, https://doi.org/10.5194/egusphere-egu25-2499, 2025.

EGU25-2583 | ECS | Orals | CL4.12

Estimates of the Global Clear-Sky Longwave Radiative Feedback Strength from Reanalysis Data 

Helene Gloeckner, Lukas Kluft, Hauke Schmidt, and Bjorn Stevens

We use atmospheric profiles from ERA5, JRA55 and MERRA2 between 1993 and 2023 to estimate Earth’s global clear-sky longwave feedback strength on the seasonal and interannual timescale. Differences in the relationship of relative humidity with skin temperature prior to 2008 lead to interannual feedback strengths between 1.34 W m2 K1 (JRA55) and 1.89 W m2 K1 (MERRA2). Restricting the analysis to the last 16 years
yields more consistent interannual estimates of 2.05 W m2 K1 on average, which is larger than the overall seasonal estimate of 1.91 W m2 K1. The mid-tropospheric drying causing this difference suggest a substantial influence of ENSO variability on the interannual timescale. This indicates a long-term feedback strength smaller than 2.0 W m2 K1, which is already at the lower end of previous estimates; emphasizing the importance of accurate long-term RH measurements to reliably project Earth’s clear-sky feedback strength.

How to cite: Gloeckner, H., Kluft, L., Schmidt, H., and Stevens, B.: Estimates of the Global Clear-Sky Longwave Radiative Feedback Strength from Reanalysis Data, EGU General Assembly 2025, Vienna, Austria, 27 Apr–2 May 2025, EGU25-2583, https://doi.org/10.5194/egusphere-egu25-2583, 2025.

EGU25-3714 | ECS | Posters on site | CL4.12

Positive forcing over land cools the Eastern Pacific Ocean 

Moritz Günther, Sarah Kang, and Yohai Kaspi

We set out to disentangle the impacts of forcing over land vs. forcing over ocean on the sea surface temperature (SST) pattern. Based on previous research showing that forcings over land and ocean have distinct impacts on the circulation, we hypothesize that they would also affect the pattern of sea surface temperatures in different ways. We investigate the research question by quadrupling the CO2 concentration either only over ocean or only over land in the coupled global climate model MPI-ESM-1.2.

Our main results are:

  • the climate response to 4 x CO2 forcing only over land surface and forcing only over ocean adds up surprisingly linearly to the climate response to forcing everywhere.

  • 4 x CO2 forcing over land causes a cooling of up to 1.4 K in the equatorial, Eastern, and Southeastern Pacific Ocean within two years. In contrast, positive forcing over the ocean does not produce such a cooling on any time scale

  • Two main mechanisms contribute to the Pacific cooling in response to positive forcing over land:

    • (a) a northward ITCZ shift originating from the fact that there is more land in the Northern than the Southern hemisphere, enhancing equatorial upwelling and cooling from strengthened trade winds

    • (b) the monsoon-desert mechanism (Rodwell & Hoskins 1996), which strengthens the subtropical highs in response to atmospheric heating over the Americas, increasing the equatorward advection of cold air and initiating a wind-evaporation-SST feedback.


We find an equatorial and Eastern Pacific cooling not only in the abrupt land-forced simulation, but also in a transient simulation forced with a 1% / year CO2 increase over land, on a time scale of 20 years. The surprising finding that a positive forcing can cause a cooling in the Eastern Pacific, along with the mechanisms we describe, may contribute to better understanding the recent cooling of the Eastern Pacific Ocean as well as the long-standing model bias in simulating Eastern Pacific sea surface temperature patterns.

How to cite: Günther, M., Kang, S., and Kaspi, Y.: Positive forcing over land cools the Eastern Pacific Ocean, EGU General Assembly 2025, Vienna, Austria, 27 Apr–2 May 2025, EGU25-3714, https://doi.org/10.5194/egusphere-egu25-3714, 2025.

EGU25-4227 | ECS | Orals | CL4.12

Observational quantification of high cloud radiative effect and feedback: An Analysis of differences across the tropical Pacific 

Paula Veronica Romero Jure, Declan Finney, Amanda Maycock, Alan Blyth, Anna Mackie, and Hugo Lambert

Tropical high cloud feedback remains a key uncertainty in estimating Equilibrium Climate Sensitivity, particularly the optical depth feedback. The Pacific Intertropical Convergence Zone is a major contributor to tropical cloud radiative effect (CRE). The Tropical Pacific is also projected to see shifts in convection from West to East. In this study, we analyse the key differences in the observed high cloud radiative effect, optical depth and feedback between the East and West Pacific. Notably, we find that the strongest climatological high cloud optical depths and net radiative effects in the tropical region are found in the East Pacific, despite greater high cloud amounts in the West Pacific.   

We further estimate the high cloud feedback from the observed variability, using 20 years of CERES Flux By Cloud Type data from MODIS satellite (Sun et al. 2022), following Raghuraman et al [2024] for the regions. We find significant, opposite total high cloud feedbacks between the East and West Pacific, driven primarily by the high cloud amount feedback, with smaller contributions from the optical depth and altitude feedbacks. The shortwave and longwave cloud amount feedbacks are significant in both regions, greater in the West and opposite in sign to the East Pacific. However, the net amount feedback is negative in both regions and twice as strong in the East Pacific than in the West. As expected, the cloud altitude feedback is positive in every region analysed, primarily driven by the longwave component. Only the West Pacific shows a significant optical depth feedback, driven by a positive shortwave feedback.  The distinct high cloud amount and optical depth feedbacks estimated in the regions are not apparent when analysing the entire tropics. 

We find that the estimated cloud feedbacks in the tropical Pacific strongly depend on the inclusion of ENSO events in the record. Since climate projections suggest an El Nino-like warming in response to CO2 forcing, understanding the potential for changes in high cloud properties in the Pacific, as suggested by our observational evidence, is vital. 


References: 

Raghuraman, S.P. et al. (2024) ‘Observational Quantification of Tropical High Cloud Changes and Feedbacks’, Journal of Geophysical Research: Atmospheres, 129(7), p. e2023JD039364. Available at: https://doi.org/10.1029/2023JD039364. 

Sun, M. et al. (2022) ‘Clouds and the Earth’s Radiant Energy System(CERES) FluxByCldTyp Edition 4 Data Product’, Journal of Atmospheric and Oceanic Technology, 39(3), pp. 303–318. Available at: https://doi.org/10.1175/JTECH-D-21-0029.1. 

How to cite: Romero Jure, P. V., Finney, D., Maycock, A., Blyth, A., Mackie, A., and Lambert, H.: Observational quantification of high cloud radiative effect and feedback: An Analysis of differences across the tropical Pacific, EGU General Assembly 2025, Vienna, Austria, 27 Apr–2 May 2025, EGU25-4227, https://doi.org/10.5194/egusphere-egu25-4227, 2025.

EGU25-4417 | ECS | Orals | CL4.12

Addressing non-linearities when estimating radiative feedbacks associated with different historical forcing agents 

Maisie Wright, Harry Mutton, Mark Ringer, and Timothy Andrews

Understanding how radiative feedbacks respond to different historical forcing agents (e.g. aerosols or greenhouse gases) improves our ability to relate historical changes (1850-2014) to future projections. This is often investigated using historical single forcing experiments, where only one forcing agent is allowed to vary, to decompose the total (all-forcing) response. However, using a 45-member ensemble, we demonstrate that there are non-linearities in this decomposition which challenge its utility in HadGEM3-GC31-LL. Specifically, strong warming in the Southern Ocean and sea ice loss are seen in the aerosol single forcing experiment despite global cooling, which is found to be a feature that does not combine linearly with other climate drivers. Instead, we calculate the aerosol response as the difference between the all-forcing experiment and an “all-but-aerosol” experiment, where all forcing agents apart from aerosols are included. This method does not show strong Southern Ocean warming and sea ice loss in response to anthropogenic aerosols. We instead see a positive surface albedo feedback in this region, which is more consistent with the feedbacks seen in the all-forcing response. This allows for a more accurate comparison between feedbacks caused by different forcing agents.

How to cite: Wright, M., Mutton, H., Ringer, M., and Andrews, T.: Addressing non-linearities when estimating radiative feedbacks associated with different historical forcing agents, EGU General Assembly 2025, Vienna, Austria, 27 Apr–2 May 2025, EGU25-4417, https://doi.org/10.5194/egusphere-egu25-4417, 2025.

EGU25-4990 | ECS | Orals | CL4.12

Reversal of Precipitation Trend and Large-Scale Atmospheric Temperature Inversion in Hothouse Climates 

Jiachen Liu, Jun Yang, Feng Ding, Gang Chen, and Yongyun Hu

Throughout Earth's history and its potential future, surface temperatures (Ts​) have fluctuated across a far broader range than those of the present-day climate. However, the characteristics of extremely cold or warm climates remain less explored compared to modern climates. This study investigates the hydrological trends and atmospheric stratification in hothouse climates (Ts>330 K). Our results show that in climate models, precipitation decreases as surface temperature rises in hothouse climates, in contrast to the behavior observed in modern climates. This reversal trend results from the upper limit of outgoing longwave radiation and the continuously increasing shortwave absorption by H2O and aligns with a pronounced increase in atmospheric stratification. One remarkable feature of such a highly stable atmosphere is the occurrence of a large-scale “atmospheric temperature inversion”, where the upper atmosphere is warmer than the lower’s. Although this inversion has been noted in previous studies, its formation mechanisms have remained unclear. Our work demonstrates that while radiative heating in the lower troposphere is necessary, it is not independently sufficient to form this atmospheric inversion. Instead, large-scale subsidence-induced dynamic heating plays an essential role in forming this inversion. Hothouse climates, as characterized by these findings, are feeble worlds rather than vibrant worlds.

How to cite: Liu, J., Yang, J., Ding, F., Chen, G., and Hu, Y.: Reversal of Precipitation Trend and Large-Scale Atmospheric Temperature Inversion in Hothouse Climates, EGU General Assembly 2025, Vienna, Austria, 27 Apr–2 May 2025, EGU25-4990, https://doi.org/10.5194/egusphere-egu25-4990, 2025.

EGU25-5900 | ECS | Orals | CL4.12

Influence of Mean State Biases on Projections of the Tropical Warming Pattern 

Alessandra Stoppelli, Christian Éthé, Juliette Mignot, and Jérôme Vialard

The rise in anthropogenic greenhouse gases since the 20th century has led to regionally varying warming rates. Observations over recent decades reveal subdued warming—or even cooling—in the eastern and southeastern tropical Pacific, linked to intensified equatorial trade winds. Understanding this warming pattern is crucial due to its wide-reaching impacts: it alters atmospheric stability, driving rainfall changes through the warmer-get-wetter mechanism; affects El Niño variability and tropical cyclone intensity; and influences cloud cover, planetary albedo, and transient climate sensitivity.

While  models from the Coupled Model Intercomparison Project (CMIP), including IPSL-CM6A-LR, generally capture the subdued warming in the Southeast Pacific, they project enhanced warming in the eastern equatorial Pacific (El Niño-like response) that contradicts observations. A major factor behind this discrepancy could be the persistent cold and dry equatorial Pacific bias in these models, particularly pronounced in IPSL-CM6A-LR

To test this hypothesis, we analyze coupled flux-corrected simulations designed to reduce mean state biases. Corrections to momentum and heat fluxes mitigate cold tongue and western Pacific dry biases, as well as easterly wind errors. However, the double Intertropical Convergence Zone (ITCZ) bias remains substantial. We examine how these biases influence the tropical Pacific warming pattern during the historical period and under 21st-century climate projections, while addressing the limitations of stationary flux correction. Finally, we outline planned sensitivity experiments to explore the key physical processes driving the tropical warming pattern in response to climate change.

How to cite: Stoppelli, A., Éthé, C., Mignot, J., and Vialard, J.: Influence of Mean State Biases on Projections of the Tropical Warming Pattern, EGU General Assembly 2025, Vienna, Austria, 27 Apr–2 May 2025, EGU25-5900, https://doi.org/10.5194/egusphere-egu25-5900, 2025.

EGU25-5950 | ECS | Posters on site | CL4.12

An Estimation of the Efficacy of Methane Radiative Forcing Using Radiative Kernels 

Sumit Kumar, Ashwin K. Seshadri, and Govindasamy Bala

Methane (CH4) and carbon dioxide (CO2) are two major greenhouse gases with distinct radiative properties and climate responses. Using the National Centre for Atmospheric Research (NCAR) Community Atmosphere Model (CAM5) in two configurations (prescribed sea surface temperature and slab ocean) to estimate radiative forcing and climate response and radiative kernel analyses, we compare their slow feedback mechanisms and implications for climate sensitivity. We perform simulations with a 10X increase in CH4 and 1.35X CO2 concentration to simulate global mean warming of about 1.5 K in both cases. We find that CH4 requires a larger effective radiative forcing, indicating a lower efficacy relative to CO2.

We attribute CH4's lower efficacy to differences in slow feedback processes. CH4 exhibits more negative lapse rate feedback (difference of -0.10 Wm-2K-1) and more positive water vapor feedback (difference of 0.06 Wm-2K-1) due to equatorially concentrated radiative forcing and stronger upper-tropospheric warming. Feedback differences also include weaker positive shortwave cloud (difference of -0.05 Wm-2K-1) and smaller albedo (difference of -0.04 Wm-2K-1) feedback responses for CH4, resulting in a net feedback difference of -0.12 Wm-2K-1. These findings underscore the role of spatial forcing patterns, including CH4’s near-infrared shortwave absorption bands and low-latitude warming, in shaping feedback processes.

We find that CO2 forcing results in relatively stronger polar warming, enhancing albedo feedback, and induces larger mid-latitude cloud reductions, amplifying shortwave cloud feedback. Both gases have comparable positive longwave cloud feedback, broadly consistent with fixed anvil temperatures. All individual feedback differences are statistically significant. Our results highlight that distinct feedback responses arise from basic physical mechanisms, such as differing meridional warming patterns and small but distinct relative humidity changes.

Our study advances the understanding of radiative forcing structure and feedbacks in determining greenhouse gas impacts on climate sensitivity. It also highlights the need for multi-model assessments and Earth system modeling to evaluate feedback uncertainties and refine projections of long-term climate responses as relative contributions to radiative forcing evolve.

How to cite: Kumar, S., Seshadri, A. K., and Bala, G.: An Estimation of the Efficacy of Methane Radiative Forcing Using Radiative Kernels, EGU General Assembly 2025, Vienna, Austria, 27 Apr–2 May 2025, EGU25-5950, https://doi.org/10.5194/egusphere-egu25-5950, 2025.

EGU25-7361 | Orals | CL4.12

Perspectives on Climate Sensitivity and Ocean Heat Uptake 

Nadir Jeevanjee, David Paynter, John Dunne, John Krasting, and Lori Sentman

The notion of climate sensitivity has become synonymous with Equilibrium Climate Sensitivity (ECS). But, 21st century warming is affected at zeroth order by ocean heat uptake, which isn't accounted for by ECS but is accounted for by the Transient Climate Response (TCR). In this talk, we highlight some potentially underappreciated aspects of TCR and ocean heat uptake, using the two-box ocean model as a common theoretical framework. We emphasize that i) TCR can be scaled by the forcing to estimate transient temperature change across a variety of scenarios, ii) this scaling can be used to estimate the time to cross a given temperature target in a given forcing scenario, using only a model's TCR, and iii) the two-box model predicts a linear relationship between ocean heat content and surface temperature which is inconsistent with most models. This talk is based on an forthcoming article in Annual Reviews of Earth and Planetary Sciences.

How to cite: Jeevanjee, N., Paynter, D., Dunne, J., Krasting, J., and Sentman, L.: Perspectives on Climate Sensitivity and Ocean Heat Uptake, EGU General Assembly 2025, Vienna, Austria, 27 Apr–2 May 2025, EGU25-7361, https://doi.org/10.5194/egusphere-egu25-7361, 2025.

EGU25-7524 | Orals | CL4.12

An Observational Estimate of the Pattern Effect on Climate Sensitivity 

David WJ Thompson, Maria Rugenstein, Piers M Forster, and Leif Fredericks

We estimate the contributions of the spatially varying temperature field to internal climate feedbacks through the statistical relationships between the observed global-mean radiative response R and the spatially-varying temperature field Ti. The results indicate regions where surface temperature covaries with R and thus provide a statistical analogue to the causal response functions derived from simulations forced with surface temperature “patches”. Notably, the results of the statistical analyses yield patterns in temperature that explain roughly the same fraction of the variability in R as that explained by patch experiments. Consistent with the results of those experiments, the observational analyses indicate large negative internal feedbacks due to temperature variability over the western Pacific. Unlike the results inferred from such experiments, the analyses indicate equally large positive internal feedbacks over the southeastern tropical Pacific and negative internal feedbacks over land areas. When estimated from observations, temperature variability over the land areas accounts for roughly 80% of the global-mean, negative internal feedback; and temperature variability over the southeastern tropical Pacific acts to attenuate the global-mean negative internal feedback by nearly 10%.

How to cite: Thompson, D. W., Rugenstein, M., Forster, P. M., and Fredericks, L.: An Observational Estimate of the Pattern Effect on Climate Sensitivity, EGU General Assembly 2025, Vienna, Austria, 27 Apr–2 May 2025, EGU25-7524, https://doi.org/10.5194/egusphere-egu25-7524, 2025.

EGU25-8415 | ECS | Orals | CL4.12

Decomposing Cloud Radiative Feedbacks by Cloud-Top Phase 

Casey Wall, David Paynter, Yi Qin, Matvey Debolskiy, Margaret Duffy, Takuro Michibata, Brandon Duran, Nicholas Lutsko, Po-Lun Ma, Brian Medeiros, Trude Storelvmo, and Ming Zhao

Changes in cloud scattering properties and emissivity that arise from atmospheric warming cause substantial radiative feedbacks in model projections of anthropogenic climate change, and the relative importance of the underlying mechanisms is poorly understood. One leading hypothesis is that ice-to-liquid conversions cause clouds to optically thicken, producing a major negative feedback. We test this hypothesis by developing a method to decompose cloud radiative feedbacks by cloud-top phase. The method is applied to an ensemble of six state-of-the-art global climate models run with prescribed sea-surface temperature. In these simulations, the global mean of the net cloud scattering and emissivity feedback from cloud-phase conversions ranges from -0.17 to -0.01 W m-2 K-1, while the overall net cloud feedback ranges from 0.02 to 0.91 W m-2 K-1. The multi-model mean of the cloud scattering and emissivity feedback from cloud-phase conversions is approximately 18% of the magnitude of the multi-model mean of the overall cloud feedback (-0.10 W m-2 K-1 vs. 0.52 W m-2 K-1). These results indicate that cloud-phase conversions cause a robust negative feedback by changing cloud scattering and emissivity, but this mechanism makes a modest contribution to the overall cloud feedback at the global scale.

How to cite: Wall, C., Paynter, D., Qin, Y., Debolskiy, M., Duffy, M., Michibata, T., Duran, B., Lutsko, N., Ma, P.-L., Medeiros, B., Storelvmo, T., and Zhao, M.: Decomposing Cloud Radiative Feedbacks by Cloud-Top Phase, EGU General Assembly 2025, Vienna, Austria, 27 Apr–2 May 2025, EGU25-8415, https://doi.org/10.5194/egusphere-egu25-8415, 2025.

EGU25-8545 | Posters on site | CL4.12

Basic physic predicts stronger high cloud radiative heating with warming 

Blaž Gasparini, Giulio Mandorli, Claudia Stubenrauch, and Aiko Voigt

The interaction of cloud droplets and ice crystals with radiation, known as cloud radiative heating, alters temperature gradients in the atmosphere, affecting both cloud evolution as well as circulation and precipitation. Despite its climatic relevance, the response of cloud radiative heating to global warming remains largely unknown.

We study changes to cloud radiative heating profiles in a warmer climate, identify physical mechanisms responsible for these changes, and develop a theory based on well-understood physics to predict them. Our approach involves a stepwise procedure that starts with a simple hypothesis of an upward shift in cloud radiative heating at constant temperature, and gradually incorporates additional physical effects.

We find that cloud radiative heating intensifies as high clouds move upward, despite minimal changes in cloud properties and temperatures. We attribute this intensification to a decrease in air density, which often overcompensates for the decrease in high cloud fraction with warming in idealized multi-model simulations of radiative-convective equilibrium. Furthermore, the density-mediated changes in cloud radiative heating are also observed in satellite-derived retrievals of cloud radiative heating in the tropics.

The density-mediated increment in cloud radiative heating may increase the role of high clouds in controlling atmospheric flows in a warmer climate. Moreover, our results suggest that the uncertainty in model‐predicted changes in atmospheric circulations and hence regional climate could be reduced by narrowing the spread in model‐simulated cloud radiative heating in the present‐day climate.


How to cite: Gasparini, B., Mandorli, G., Stubenrauch, C., and Voigt, A.: Basic physic predicts stronger high cloud radiative heating with warming, EGU General Assembly 2025, Vienna, Austria, 27 Apr–2 May 2025, EGU25-8545, https://doi.org/10.5194/egusphere-egu25-8545, 2025.

EGU25-10273 | ECS | Orals | CL4.12

Why weakening the overturning Walker circulation in the tropical ascent region leads to a reduction in subtropical low clouds 

Danny McCulloch, Hugo Lambert, Mark Webb, and Geoffrey Vallis
Global Climate Models (GCMs) are essential for predicting the impacts of global and regional climate change in the coming decades. However, the primary source of uncertainty in these predictions is our limited understanding of cloud feedback and its representation in models.  The remote effects of deep convection on subtropical low clouds in the warming climate are poorly understood. Improving our knowledge of how deep convection affects low clouds via the tropical overturning circulation is crucial to refining climate projections.
 
In this study, we use an AMIP climate assessment configuration (with CMIP6 forcing) of the Met Office Unified Model to quantify the impact of local and remote changes in the tropical atmospheric circulation on subtropical low clouds.  We conduct a causal intervention analysis by applying a cooling perturbation in the free troposphere above the deep convective western equatorial Pacific Ocean. This method allows us to weaken the large-scale circulation in the ascent region and track the resulting effects on subtropical clouds. We find that when we cool the free troposphere in the tropical west Pacific region, we get a deepening of the subtropical East Pacific boundary layer and a reduction in overall low cloud fraction. This study allows us to determine and present the physical mechanism behind this "tropical ascent → subtropical clouds" interaction and emphasises the benefits of using targeted perturbation methods to conduct causal analyses and disentangle regional and process linkages within models. 

How to cite: McCulloch, D., Lambert, H., Webb, M., and Vallis, G.: Why weakening the overturning Walker circulation in the tropical ascent region leads to a reduction in subtropical low clouds, EGU General Assembly 2025, Vienna, Austria, 27 Apr–2 May 2025, EGU25-10273, https://doi.org/10.5194/egusphere-egu25-10273, 2025.

EGU25-11046 | ECS | Orals | CL4.12

Quantifying all-sky climate sensitivity with idealized clouds 

Lukas Kluft, Bjorn Stevens, Manfred Brath, and Stefan A. Buehler

We include idealised clouds in a single column model to estimate the all-sky climate sensitivity. Our results show that the cloud radiative effects observed from satellites can be accurately reproduced by combining high and low/mid-level clouds. We introduce a "fixed cloud albedo" null hypothesis, which assumes a fixed cloud albedo but allows for changes in cloud temperature as the surface warms. By analysing cloud distributions consistent with present-day observations, we estimate a mean fixed-albedo climate sensitivity of 2.2 K, slightly less than the clear-sky value. Our results highlight the importance of cloud masking effects, especially by mid-level clouds, and the reduction of radiative forcing by high clouds. Giving more weight to low-level clouds, which are assumed to change temperature with warming, results in a reduced estimate of 2.0 K. This provides a baseline to which changes in surface albedo, and a believed reduction in cloud albedo, would add to.

How to cite: Kluft, L., Stevens, B., Brath, M., and Buehler, S. A.: Quantifying all-sky climate sensitivity with idealized clouds, EGU General Assembly 2025, Vienna, Austria, 27 Apr–2 May 2025, EGU25-11046, https://doi.org/10.5194/egusphere-egu25-11046, 2025.

Uncertainty in climate sensitivity remains a critical challenge for effective mitigation and adaptation strategies. While cloud radiative feedbacks are often highlighted as a major source of this uncertainty, here we explore the impact of clear-sky shortwave radiation absorption by water vapor (SWA). Using abrupt 4xCO2 simulations with altered SWA, we show that higher SWA conditions lead to a larger increase in climate sensitivity over time due to the faster and stronger recovery of the initially weakened Atlantic Meridional Overturning Circulation (AMOC). Enhanced SWA reduces surface shortwave radiation, leading to global cooling, particularly in the Arctic, where increased salinity creates conditions favorable for AMOC recovery. This accelerated recovery amplifies warming in the subpolar North Atlantic, intensifying positive lapse rate and cloud feedbacks, ultimately leading to a larger increase in net climate feedback and climate sensitivity. This underscores the need to constrain clear-sky SWA uncertainties to improve projections of climate sensitivity and associated feedback mechanisms.

How to cite: Kang, S. and Lee, D.: Effective climate sensitivity increases with enhanced shortwave absorption by water vapor due to its impact on AMOC recovery, EGU General Assembly 2025, Vienna, Austria, 27 Apr–2 May 2025, EGU25-11416, https://doi.org/10.5194/egusphere-egu25-11416, 2025.

EGU25-12505 | Posters on site | CL4.12

Cloud Feedbacks Affect Hydrological Sensitivity 

Zachary McGraw, Lorenzo Polvani, Blaž Gasparini, Emily Van de Koot, and Aiko Voigt

Cloud responses to warming are a known uncertainty for temperature projections, yet how these same responses affect precipitation has been little evaluated. Here we explore how cloud radiative feedbacks influence the global mean precipitation change per degree of warming (hydrological sensitivity). With radiative kernels, we examine how warming-induced changes in cloud amount, altitude, and optical depth alter the atmosphere’s ability to radiatively cool and form precipitation. Our results suggest that high cloud responses are the single largest cause of spread in hydrological sensitivity across climate models. Applying the cloud locking methodology to one model, we find that cloud radiative responses reduce hydrological sensitivity by 14% and investigate the controls on this value.

How to cite: McGraw, Z., Polvani, L., Gasparini, B., Van de Koot, E., and Voigt, A.: Cloud Feedbacks Affect Hydrological Sensitivity, EGU General Assembly 2025, Vienna, Austria, 27 Apr–2 May 2025, EGU25-12505, https://doi.org/10.5194/egusphere-egu25-12505, 2025.

EGU25-13127 | Orals | CL4.12

Decoding the Anthropogenic Influences on Pacific Warming Patterns 

Yen-Ting Hwang, Shang-Ping Xie, Po-Ju Chen, Hung-Yi Tseng, Clara Deser, Hsiang-Chi Yeh, Yong-Jhih Chen, Yue Dong, Masahiro Watanabe, Sarah M. Kang, and Malte F. Stuecker
The observed lack of surface warming in the Southeast and central equatorial Pacific sharply contrasts with climate model projections, which consistently simulate an enhanced equatorial warming pattern. A recent assessment suggests that the zonal sea surface temperature gradient has historically been controlled by strengthening mechanisms but is projected to shift toward dominance by weakening mechanisms in the future (Watanabe et al., 2024). A pressing question remains: When will the weakening of the equatorial zonal sea surface temperature gradient emerge?
 
To address this question, I will review recent work from my group and collaborators, focusing on identifying the fast and slow components of sea surface temperature pattern responses to anthropogenic aerosols, stratospheric ozone, and greenhouse gases via idealized step-function experiments. Our findings suggest that the superposition of fast and slow responses to these forcings can sustain the equatorial cooling trend for longer than anticipated. Contrary to the interannual and decadal variability literature, which primarily emphasizes wave dynamics, we highlight the critical roles of spatial patterns in the atmospheric energy budget (moist static energy budget) in driving the initial adjustments of Hadley and Walker circulations. The fast components, along with the associated cloud radiative effects, initiate a series of air-sea interactions that set the stage for the slower components. Possible explanations for the discrepancies between model projections and observations will also be discussed.
 

How to cite: Hwang, Y.-T., Xie, S.-P., Chen, P.-J., Tseng, H.-Y., Deser, C., Yeh, H.-C., Chen, Y.-J., Dong, Y., Watanabe, M., Kang, S. M., and Stuecker, M. F.: Decoding the Anthropogenic Influences on Pacific Warming Patterns, EGU General Assembly 2025, Vienna, Austria, 27 Apr–2 May 2025, EGU25-13127, https://doi.org/10.5194/egusphere-egu25-13127, 2025.

EGU25-13431 | ECS | Posters on site | CL4.12

A Simple Spectral Model for Earth’s Albedo 

Zhiping Zhang, Daniel Koll, and Timothy Cronin

It is well-known that Earth's planetary albedo is about 0.3. Less clear is how this value might change in different climates. Here we propose a simple conceptual model for Earth's albedo. Our main insight is that, for a clear-sky N2-H2O atmosphere, the atmosphere can be approximated in the shortwave spectrum as either perfectly absorbing (due to water vapor absorption) or perfectly scattering (due to Rayleigh scattering); in contrast, clouds are approximately perfect scatterers throughout the shortwave spectrum. We use these approximations to derive analytic albedo expressions from the two-stream equations, which we validate against line-by-line model calculations.

Our results indicate that, for a clear-sky atmosphere, as surface temperature rises from 200 K to 500 K, Earth’s planetary albedo initially decreases with warming until around 350 K due to enhanced water vapor absorption, and then increases due to intensified Rayleigh scattering. Turning to idealized high and low cloud scenarios, cloudy atmospheres have significantly higher albedos than a clear-sky atmosphere at low temperatures. However, for an atmosphere with low clouds, albedo generally decreases with warming due to increased water vapor absorption above the clouds. In contrast, an atmosphere with high clouds exhibits nearly constant albedo with temperature, as high clouds mask the influence of the underlying atmosphere. These findings suggest that Earth’s clear-sky shortwave feedback is positive below 350 K and negative above 350 K. As for cloudy scenarios, low clouds induce a strong positive shortwave feedback at low temperatures, while high clouds don’t. Our simple model improves understanding of Earth’s planetary albedo and the role of shortwave feedback for the runaway greenhouse. Furthermore, our work suggests low clouds generally tend to destabilize Earth’s climate, which has potential implications for future climate change adaptation.

How to cite: Zhang, Z., Koll, D., and Cronin, T.: A Simple Spectral Model for Earth’s Albedo, EGU General Assembly 2025, Vienna, Austria, 27 Apr–2 May 2025, EGU25-13431, https://doi.org/10.5194/egusphere-egu25-13431, 2025.

The majority of climate models predict the development of an enhanced eastern equatorial Pacific (EEP) warming pattern (“El Niño-like”) by century-end, characterized by greater mean warming over the Pacific cold tongue compared to the western Pacific warm pool and the corresponding weakening of the Walker circulation. A number of plausible mechanisms have been proposed to explain this pattern; however, it remains unclear which proposed mechanism is dominant in this response. Moreover, the magnitude of the EEP pattern varies greatly across climate models. To understand these differences, we conduct partially coupled experiments with an abrupt 4xCO2 increase, wherein surface wind stress and shortwave fluxes are overridden to values prescribed from the preindustrial control simulations, using two climate models – CESM1 and CESM2. Although both models were developed at NCAR, their behaviors are very different. In the former model, changes in the east-west SST gradient along the equator are relatively small. In contrast, the latter model, known to have a high climate sensitivity, develops a very strong EEP pattern. We find that the key factors that explains these differences are the different strengths of the  Bjerknes (wind stress-SST) and shortwave (low clouds-SST) feedbacks critical in reducing the Pacific zonal SST gradient, whereas differential evaporative cooling in the equatorial region appears to be similar between the two models. We discuss the implications of these results to the ongoing and future changes in the tropical Pacific.

How to cite: Fedorov, A. and Fu, M.: The role of the Bjerknes and low-cloud feedbacks in the formation of the eastern equatorial Pacific warming pattern: contrasting two climate models, EGU General Assembly 2025, Vienna, Austria, 27 Apr–2 May 2025, EGU25-14461, https://doi.org/10.5194/egusphere-egu25-14461, 2025.

EGU25-14568 | ECS | Posters on site | CL4.12

Hydrological sensitivity affected by tropical tropospheric stability 

Donghyun Lee and Paulo Ceppi

Climate forcers perturb the energy amount inside the Earth, and atmospheric interactions in the troposphere sequentially vary to pursue the new stable state in the given energy budget. The varied energy amount of longwave, shortwave, and sensible heat flux in the atmosphere is balanced with latent heat flux, equivalent to the changes in precipitation in the global mean sense. For example, rising temperature emits more longwave radiation from the atmosphere (longwave cooling, LWC), and it allows more energy budget room for latent heat flux (LHF) heating, which explains enhanced precipitation.

Although previous studies argued hydrological sensitivity as the linearized scale of precipitation change per the global mean temperature change, this study confirms that tropical tropospheric stability has additionally affected hydrological sensitivity over the decades. Our results reveal that tropical ocean temperature patterns correlate statistically with the stability index. The numerically simplified term of this stability effect improves the prediction skills of the theoretical equation for the global mean precipitation change under scenarios with various forcing conditions.  Lastly, we discuss the possible impacts of recent ocean patterns and the tropical tropospheric stability phase on precipitation by comparing the observed data and climate models’ simulations, which are forced by the observed sea surface temperature.

How to cite: Lee, D. and Ceppi, P.: Hydrological sensitivity affected by tropical tropospheric stability, EGU General Assembly 2025, Vienna, Austria, 27 Apr–2 May 2025, EGU25-14568, https://doi.org/10.5194/egusphere-egu25-14568, 2025.

Tropical high cloud feedbacks exhibit considerable spread across climate models. This study applies the cloud radiative kernel technique of Zelinka et al. (2012a; 2013) to 22 models across the Coupled Model Intercomparison Project CMIP5 and CMIP6 ensembles to survey tropical high cloud feedbacks and analyze their relationships to climate sensitivity, changes to the tropical overturning circulation, and changes to deep convective organization across scales. First, the inter-model spread in tropical high cloud net, altitude, and optical depth feedbacks exhibit significant correlations to climate sensitivity in the tropical mean and on convective margins. Additionally, we find that inter-model variability in deep convective organization – at both the mesoscale and planetary scales – relates to the inter-model spread in high cloud feedbacks along convective margins. More specifically, decreases in tropical ascent area and increases in mesoscale organization of deep convection relate to more positive high cloud feedbacks, particularly within weak ascent and weak descent regimes. Increases in mesoscale organization also coincide with a greater weakening of the Pacific Walker circulation. Finally, relationships between the inter-model spread in tropical high cloud feedbacks, convective organization across scales, and sea surface temperature patterns will be discussed. 

How to cite: Schiro, K. and Dawson, E.: Spread in high cloud feedback along tropical convective margins linked to changes in convective organization across scales, EGU General Assembly 2025, Vienna, Austria, 27 Apr–2 May 2025, EGU25-14904, https://doi.org/10.5194/egusphere-egu25-14904, 2025.

We construct a radiative-advective model to investigate the drivers of Arctic amplification. The Rapid Radiative Transfer Model for GCMs (RRTMG) is utilized to calculate radiative heating rates, while the atmospheric horizontal energy transport (AHT) from JRA-55 reanalysis data is used as boundary conditions. We perturb individual factors in the model to assess the warming contributions from radiative forcing by different greenhouse gases, poleward energy transport at different vertical levels, and clouds.

We first examine the Arctic climate sensitivity to CO2, CH4, and O3. The climate sensitivity is defined as the surface temperature change per unit of TOA flux perturbation. The Arctic climate sensitivity to CO2 is 3.46 K/W/m². When CO2 is doubled, the instantaneous radiative forcing at TOA is 1.68 W/m², resulting in 5.7 K surface warming. For CH4, the Arctic climate sensitivity is 1.65 K/W/m², and doubling CH4 leads to a TOA perturbation of 0.46 W/m², leading to merely 0.76 K surface warming. The sensitivity to O3 is 0.21 K/W/m², with a doubling of O3 causing a 3.51 W/m² perturbation and 0.75 K surface warming.

The sensitivity to AHT is strongly dependent on its vertical structure, with greater sensitivity at lower levels. At 975 hPa level, the climate sensitivity reaches its peak value of 3.15 K/W/m², comparable to that of CO2. At the 900 hPa level where climatological AHT peaks, the climate sensitivity dramatically drops to 0.73 K/W/m². At higher altitude, the sensitivity continues to decrease: 0.64 K/W/m² at 850 hPa, 0.62 K/W/m² at 700 hPa, and 0.30 K/W/m² at 500 hPa. The climate sensitivity to clouds is 1.62 K/W/m². The climatological cloud fraction in the Arctic is 15%, with radiative effect of 2.09 W/m² at the TOA, resulting 3.41 K surface warming.

In summary, the Arctic region shows highest climate sensitive to CO2, followed by sensitivity to AHT at 975 hPa and CH4, although CH4 increase does not induce significant flux perturbations at the TOA. Clouds also play an important role. The sensitivities to AHT above 900 hPa and O3 are relatively smaller.

How to cite: Zhang, H. and Wang, Y.: Understanding the drivers of Arctic amplification through an idealized radiative-advective equilibrium model, EGU General Assembly 2025, Vienna, Austria, 27 Apr–2 May 2025, EGU25-15286, https://doi.org/10.5194/egusphere-egu25-15286, 2025.

EGU25-15351 | Orals | CL4.12

Strong pattern effect evident in Southern Ocean cloud feedback based on multiple lines of evidence 

Trude Storelvmo, Haochi Che, Jenny Bjordal, Tim Carlsen, Robert David, Ada Gjermundsen, Luke Whitehead, and Greg McFarquhar

The Southern Ocean is known to be one of the cloudiest places on Earth, and the important contribution of Southern Ocean clouds to Earth’s energy budget is undisputed. By changing their composition in response to warming, clouds in this region currently limit the rate of warming, as they become brighter with increasing temperature and thus exert a stabilising feedback on the climate system. Here, based on multiple lines of evidence, we show that in the current state of the Southern Ocean climate, this negative feedback happens to be maximised. Moving away from the present climate state in either direction (cooling or warming) will thus reduce the feedback, such that the climate sensitivity to any perturbation can be expected to grow rapidly with each degree of temperature change. This finding adds urgency to the implementation of effective climate mitigation to limit warming and thus preserve the stabilising climate effect of Southern Ocean clouds.

How to cite: Storelvmo, T., Che, H., Bjordal, J., Carlsen, T., David, R., Gjermundsen, A., Whitehead, L., and McFarquhar, G.: Strong pattern effect evident in Southern Ocean cloud feedback based on multiple lines of evidence, EGU General Assembly 2025, Vienna, Austria, 27 Apr–2 May 2025, EGU25-15351, https://doi.org/10.5194/egusphere-egu25-15351, 2025.

EGU25-17356 | ECS | Orals | CL4.12

Water Vapor Spectroscopy and Thermodynamics Constrain Earth’s Tropopause Temperature 

Brett McKim, Nadir Jeevanjee, Geoff Vallis, and Neil Lewis

As Earth warms, the tropopause is expected to rise, but predictions of its temperature change are less certain. Longstanding theories tie the tropopause temperature to outgoing longwave radiation (OLR), but this contradicts recent work in which simulations exhibit a Fixed Tropopause Temperature (FiTT) even as OLR increases. The FiTT is thought to result from the interaction between upper tropospheric moisture and radiation, but a predictive theory for FiTT has not yet been formulated. Here, we build on a recent explanation for the temperature of anvil clouds and argue that tropopause temperature, defined by where radiative cooling becomes negligible, is set by water vapor's maximum spectroscopic absorption and Clausius-Clapeyron scaling. This "thermospectric constraint'' makes quantitative predictions for tropopause temperature that are borne out in single column and general circulation model experiments where the spectroscopy is modified and both the radiative and lapse-rate tropopause change in response. This constraint provides a theoretical foundation for the FiTT hypothesis, shows how tropopause temperature can decouple from OLR, and suggests a way to relate the temperatures of anvil clouds and the tropopause.

How to cite: McKim, B., Jeevanjee, N., Vallis, G., and Lewis, N.: Water Vapor Spectroscopy and Thermodynamics Constrain Earth’s Tropopause Temperature, EGU General Assembly 2025, Vienna, Austria, 27 Apr–2 May 2025, EGU25-17356, https://doi.org/10.5194/egusphere-egu25-17356, 2025.

EGU25-17908 | ECS | Orals | CL4.12

Quantifying the tuning uncertainty on the climate sensitivity of the EC-Earth climate model 

Federico Fabiano, Chiara Ventrucci, Paolo Davini, Jost von Hardenberg, and Susanna Corti

Despite decades of developments, the inter-model spread in climate sensitivity in the latest CMIP ensemble remains substantial, with relevant implications for mid- to long-term climate projections. The inter-model differences are driven by model biases and structural deficiencies, mostly linked to cloud feedbacks, but the specific processes that dominate this issue remain unclear. Physical parametrizations are of primary importance for the performance of climate models, in particular those regarding microphysics and convection - especially at current model resolutions. Indeed, a fundamental yet often overlooked aspect of coupled model development is the tuning of parameters involved in these parametrizations to align with some specific constraints (e.g. radiative balance and global mean temperature in the pre-industrial state).
Here, we propose a methodology to evaluate the uncertainty in equilibrium climate sensitivity (ECS) arising from parameter tuning and apply it to the EC-Earth3 climate model. Our approach consists in systematically perturbing a set of tuning parameters - primarily those affecting tropical convection and precipitation - aiming to maximize their impact on climate sensitivity while ensuring the parameters remain within a plausible range. We obtain a low and a high sensitivity configuration of the model, resulting in a moderate change in climate sensitivity of approximately ±0.3 K. Finally, the results are discussed in the context of the CMIP6 ensemble, suggesting that the inter-model spread is likely driven by deeper structural differences within the models rather than uncertainties arising from the tuning process.

How to cite: Fabiano, F., Ventrucci, C., Davini, P., von Hardenberg, J., and Corti, S.: Quantifying the tuning uncertainty on the climate sensitivity of the EC-Earth climate model, EGU General Assembly 2025, Vienna, Austria, 27 Apr–2 May 2025, EGU25-17908, https://doi.org/10.5194/egusphere-egu25-17908, 2025.

EGU25-20708 | ECS | Orals | CL4.12

CO2-dependence of Longwave Clear-sky Feedback is sensitive to Temperature 

Yue Xu and Daniel Koll

CO2 is widely appreciated as a radiative forcing agent, but recent work showed that CO2 also acts as a climate feedback (Seeley & Jeevanjee 2020). CO2’s ability to emit longwave radiation allows the atmosphere to shed more energy in response to surface warming, and gives rise to a “radiator fin” effect which dominates Earth’s climate sensitivity in hot-and-high-CO2 climates. However, the general CO2-dependence of the longwave feedback is still poorly understood.

Here we explore the CO2-dependence of Earth’s longwave clear-sky feedback using a line-by-line model. We report a dividing surface temperature (Ts) of ~290 K for typical relative humidities. Above 290K, CO2 increases the feedback; below 290K, CO2 decreases the feedback; around 290K, the feedback is CO2-independent. We explain our results via a spectral competition between CO2 radiator fins, which enhance the feedback, and CO2 blocking the surface’s emission, which decreases the feedback. Only at high Ts, once H2O shuts down all window regions, does CO2 enhance the feedback.

Given that Earth’s global-mean temperature is close to ~290K, our results explain why feedback CO2-dependence is weak in our current climate but could have been important for paleoclimates. Finally, because feedback CO2-dependence is identical to forcing Ts-dependence, our results also explain the temperature-dependence of the CO2 forcing. Analogous to the clear-sky feedback, CO2 forcing also changes its behavior above versus below ~290K.

How to cite: Xu, Y. and Koll, D.: CO2-dependence of Longwave Clear-sky Feedback is sensitive to Temperature, EGU General Assembly 2025, Vienna, Austria, 27 Apr–2 May 2025, EGU25-20708, https://doi.org/10.5194/egusphere-egu25-20708, 2025.

EGU25-20772 | ECS | Orals | CL4.12

Changes in the large-scale circulation and the clear-sky response to warming at very slow rotation rates 

Abisha Mary Gnanaraj, Hauke Schmidt, and Jiawei Bao

The clear-sky response to surface warming is generally the result of increases in tropospheric temperature and water vapour, assuming constant relative humidity (RH). While this purely thermodynamic response is fairly well understood, there has been less focus on whether the response of the large-scale circulation to surface warming can alter the clear-sky response. Therefore, in this study, we investigate how the large-scale circulation on Earth-like planets would respond to warming, whether the constant RH assumption holds for different circulation responses, and how deviations from this assumption can affect the clear-sky response. We use the ECHAM6 general circulation model in an aquaplanet configuration and modify the large-scale circulation by changing the planet's rotation rate from 1/32 to 8 times the current Earth's rotation rate. We run two sets of experiments, one with a fixed SST as a control scenario and the other with a +4K warming scenario. We analyse the radiative flux-circulation response as the difference between the warming and control scenarios.

From faster to slower rotation, the Hadley cell expands and strengthens, increasing the dryness of the atmosphere and decreasing the water vapour masking effect. Therefore, at first order, when RH is assumed to be constant, the clear-sky response increases from faster to slower rotation. However, there are second order effects at rates slower than 1/4 of the Earth's current rotation rate, which we associate with the large changes ( > 10%) in RH. At such slow rotation rates, the Hadley cell becomes global. Meanwhile, a secondary circulation develops, characterised by convergence at the equator in the lower troposphere and divergence in the mid-troposphere. We refer to this as the congestus circulation. Changes in RH correlate well with changes in the response of the congestus circulation to warming. The deep Hadley circulation weakens with surface warming like on Earth. But the congestus circulation strengthens, increasing mid-tropospheric RH, which in turn reduces the clear-sky response. We discuss to what extent this effect is due to increased upper-tropospheric radiative cooling that is not compensated by the deep circulation. Alternatively, we discuss whether this effect is due to increased convective self-aggregation with surface warming that increases the congestus outflow.

How to cite: Gnanaraj, A. M., Schmidt, H., and Bao, J.: Changes in the large-scale circulation and the clear-sky response to warming at very slow rotation rates, EGU General Assembly 2025, Vienna, Austria, 27 Apr–2 May 2025, EGU25-20772, https://doi.org/10.5194/egusphere-egu25-20772, 2025.

EGU25-20967 | Orals | CL4.12

Links between internal variability and forced climate feedbacks: The importance of patterns of temperature variability and change 

Luke Davis, David W. J. Thompson, Maria Rugenstein, and Thomas Birner

Understanding the relationships between internal variability and forced climate feedbacks is key for using observations to constrain future climate change. Here we probe and interpret the differences in these relationships between the idealised climate change projections provided by the CMIP5 and CMIP6 experiment ensembles. We find that internal variability feedbacks better predict forced feedbacks in CMIP6 relative to CMIP5 by over 50%, and that the increased predictability derives primarily from the slow (>20 year) response to greenhouse gas forcing. A key novel result is that the increased predictability is consistent with the greater resemblance between patterns of internal and forced temperature change in CMIP6, which suggests temperature pattern effects play a key role in predicting forced climate feedbacks. In general, we find that forced feedbacks are more predictable when the response more closely resembles El Niño, with amplified East Pacific warming and cloud changes reflecting a weakened Walker circulation. Despite the increased predictability, emergent constraints provided by observed internal variability are weak and largely unchanged from CMIP5 to CMIP6 due to the relative shortness of the observational record.

How to cite: Davis, L., Thompson, D. W. J., Rugenstein, M., and Birner, T.: Links between internal variability and forced climate feedbacks: The importance of patterns of temperature variability and change, EGU General Assembly 2025, Vienna, Austria, 27 Apr–2 May 2025, EGU25-20967, https://doi.org/10.5194/egusphere-egu25-20967, 2025.

EGU25-366 | Posters on site | CL4.13

Linking carbon cycling to climate feedbacks in a simple climate model for decarbonization 

Greta Shum, Abigail Swann, Dargan Frierson, and Charles Koven

Complex models of the Earth system are increasingly able to represent processes that make up the carbon-climate system, but a variety of simple climate models (SCMs) use parameterized representations of the Earth system, which make them easily deployed tools for climate mitigation assessment and accessible tools for conceptual understanding. However, SCMs vary in their approach to simplifying the Earth system, especially in their representation of the carbon cycle. We examine how two distinct carbon cycle structures within one SCM, FaIR, produce differing constrained projections of future climate under idealized decarbonization. We find that differences in carbon cycle structure lead to differences in the timescales of carbon uptake, which do not directly lead to or explain differences in warming under the same decarbonization emissions scenario. Differences in the metrics of warming are instead primarily explained by assumptions about climate feedbacks and non-carbon cycle forcing, which are parameterized separately from carbon cycling. When we introduce a physically-motivated link reflecting the connection between ocean circulation and energy balance, we see a change in the set of climate feedbacks necessary to explain our observed carbon-climate system. The result is a shift in TCRE, ZEC, and consequent necessary mitigation.

How to cite: Shum, G., Swann, A., Frierson, D., and Koven, C.: Linking carbon cycling to climate feedbacks in a simple climate model for decarbonization, EGU General Assembly 2025, Vienna, Austria, 27 Apr–2 May 2025, EGU25-366, https://doi.org/10.5194/egusphere-egu25-366, 2025.

EGU25-2921 | Orals | CL4.13

TCRE, ZEC and ocean heat uptake efficacy response to AMOC 

Anastasia Romanou

Remaining carbon budgets consistent with limiting global warming below certain temperature thresholds are estimated from the transient climate response to emissions (TCRE) and the zero emissions commitment (ZEC). TCRE is the amount of warming per unit of cumulative carbon dioxide emissions, while ZEC is the amount of warming that would occur following a complete cessation of emissions. IPCC AR 6 (Canadell et al, 2023, Chapter 5) concluded with medium confidence that TCRE is nearly constant with time and independent of the rate of emissions (or emissions pathway) and therefore it is a good predictor of CO2-induced warming after emissions reductions, although some studies (MacDougal 2017; Seshadri 2017) have pointed towards pathway dependence at very high and very low emissions rates. In all studies there is the implicit assumption that the cumulative fraction of carbon taken up by the terrestrial biosphere is constant, and that the climate feedback parameter and ocean heat uptake efficacy do not change in time. Using a suite of emissions-driven Earth system model simulations, we explore the impact of immediately halting CO2 emissions under different levels of global warming. We show that the climate system undergoes state shifts when AMOC weakens substantially due to forcing and/or internal variability, and only then significant cooling occurs following CO2 emissions cessation but with considerable consequences for regional climates.  We identify ranges of non-zero likelihood for AMOC collapse and the associated global warming levels, emissions thresholds and a possible mechanism linked to high latitude sea ice transport variability. We demonstrate that TCRE, ZEC and ocean heat uptake efficiency are state dependent and, while fast feedbacks control ZEC when mitigation occurs at lower emissions levels, AMOC weakening becomes the leading driver setting ZEC at higher emissions levels. Even the most ambitious mitigation of climate change would be ineffective if action is delayed and the climate system is too close to a tipping point of the Atlantic Meridional Overturning Circulation, since there would be significant differences in the committed warming. 

How to cite: Romanou, A.: TCRE, ZEC and ocean heat uptake efficacy response to AMOC, EGU General Assembly 2025, Vienna, Austria, 27 Apr–2 May 2025, EGU25-2921, https://doi.org/10.5194/egusphere-egu25-2921, 2025.

EGU25-8578 | ECS | Orals | CL4.13

Implications of permafrost carbon cycle feedbacks for TCRE: evidence from Earth system modeling 

Rémi Gaillard, Patricia Cadule, Philippe Peylin, Nicolas Vuichard, and Bertrand Guenet

TCRE – the linearity between global warming and cumulative anthropogenic CO2 emissions – underpins the concept of remaining carbon budgets and is critical for designing mitigation policies in line with the Paris Agreement. The future response of carbon sinks to anthropogenic perturbations is a major source of uncertainty in estimates of future TCRE. In particular, the strong Arctic warming is expected to lead to permafrost thaw, exposing the large amounts of soil organic carbon stored in permafrost to decomposition, and eventually releasing CO2 and CH4 to the atmosphere in a positive climate-carbon feedback. On the other hand, CO2 fertilisation and permafrost nitrogen release are likely to enhance vegetation carbon uptake by counteracting negative feedbacks. However, both the amplitude and the timing of the resulting future net carbon balance in permafrost regions remain highly uncertain. In particular, previous studies, using either land surface or intermediate complexity models, have shown no consensus on the strength of the nitrogen-mediated feedback. In addition, future TCRE estimates are based on (fully coupled) Earth system model (ESM) projections. However, only two ESMs in the CMIP6 ensemble represent permafrost carbon and the last IPCC assessment of TCRE used external estimates of permafrost carbon cycle feedbacks. The inclusion of permafrost carbon cycle processes in ESMs is therefore necessary to improve the reliability of future projections and inform policy decisions.

Based on the CMIP6 version of the Institut Pierre-Simon Laplace ESM, we developed IPSL-Perm-LandN, a new ESM that includes an explicit land nitrogen cycle and key permafrost physical and biogeochemical processes. Under future increasing atmospheric CO2 concentrations, the permafrost region remains a carbon sink in IPSL-Perm-LandN despite significant soil carbon losses due to permafrost thaw. In particular, we show a strong negative feedback arising from permafrost nitrogen release, which supports a large land carbon uptake and prevents the carbon-climate feedback parameter γ from increasing (negatively) by more than 10 PgC.°C-1. However, this is likely to be overestimated by our representation of soil nitrogen dynamics and plant nitrogen uptake. Our findings highlight the importance of better constraining the nitrogen cycle in permafrost regions and better representing permafrost carbon processes in ESMs to reduce the uncertainty in TCRE and remaining carbon budgets.

How to cite: Gaillard, R., Cadule, P., Peylin, P., Vuichard, N., and Guenet, B.: Implications of permafrost carbon cycle feedbacks for TCRE: evidence from Earth system modeling, EGU General Assembly 2025, Vienna, Austria, 27 Apr–2 May 2025, EGU25-8578, https://doi.org/10.5194/egusphere-egu25-8578, 2025.

EGU25-8653 | ECS | Posters on site | CL4.13

After 'Net Zero': Tracing uncertainties in the Zero Emissions Commitment signal 

Tabea Rahm, David Hohn, and Nadine Mengis

One of the defining challenges of our century is to limit global warming. Reducing anthropogenic carbon dioxide emissions to net zero has been understood to be a central measure in achieving this climate goal. Still, after achieving net zero CO2 emissions, the climate system could show a delayed temperature response. This temperature response is called Zero Emissions Commitment (ZEC) and has been estimated to be approximately 0±0.3 K in the ZECMIP multi-model mean (Jones et al., 2019; MacDougall et al., 2020). Understanding and constraining ZEC remains relevant, especially when considering the remaining carbon budget for reaching ambitious climate targets. However, individual climate models show a high level of uncertainty in the ZEC response.

ZEC is closely related to the carbon cycle, the planetary heat uptake and their respective distance to their equilibrium states at the point of net zero. Therefore, we investigate how the pre-industrial state and responsiveness of these processes to anthropogenic climate change relate to their ZEC response in Earth system models simulating the ZECMIP experiments. We aim to characterise the models' ZEC response as a function of the chosen, observable climate variables (e.g., overturning strength at 26° N, global carbon project (Friedlingstein et al., 2023) carbon fluxes, or ocean heat content of the upper 700 m), that will then later serve as basis for observationally constrained ZEC estimates. We will show first preliminary results and invite feedback on the study design.


References

Friedlingstein, P. et al. (2023). “Global Carbon Budget 2023” Earth System Science Data 15 (12): 5301–69. https://doi.org/10.5194/essd-15-5301-2023.

Jones, C.D. et al. (2019). “The Zero Emissions Commitment Model Intercomparison Project (ZECMIP) Contribution to C4MIP: Quantifying Committed Climate Changes Following Zero Carbon Emissions” Geoscientific Model Development 12 (10): 4375–85. https://doi.org/10.5194/gmd-12-4375-2019.

MacDougall, A.H. et al. (2020). “Is There Warming in the Pipeline? A Multi-Model Analysis of the Zero Emissions Commitment from CO2Biogeosciences 17 (11): 2987–3016. https://doi.org/10.5194/bg-17-2987-2020.

How to cite: Rahm, T., Hohn, D., and Mengis, N.: After 'Net Zero': Tracing uncertainties in the Zero Emissions Commitment signal, EGU General Assembly 2025, Vienna, Austria, 27 Apr–2 May 2025, EGU25-8653, https://doi.org/10.5194/egusphere-egu25-8653, 2025.

Simple models have been used in a variety of ways to summarize Earth system processes related to global warming and its mitigation. This poster will provide a pedagogical survey of the many uses to which these models have been put, focusing especially their role in understanding the regime of prolonged low carbon dioxide (CO2) emissions following emissions peak and decline.  We will show that the low emissions regime is exactly where path independence between global warming and cumulative CO2 emission breaks down, giving rise to the possibility of a substantial zero emissions commitment (ZEC). Using a few different simple models, the factors affecting the ZEC in low emissions scenarios and its relation to path dependence will be described, and we will furthermore examine the observability of respective model parameters affecting the magnitude of ZEC.     

How to cite: Seshadri, A. K.: The role of simple models in understanding the low CO2 emissions regime and the ZEC, EGU General Assembly 2025, Vienna, Austria, 27 Apr–2 May 2025, EGU25-10543, https://doi.org/10.5194/egusphere-egu25-10543, 2025.

EGU25-10573 | ECS | Posters on site | CL4.13

Understanding the mechanisms driving the ocean’s anthropogenic carbon reservoir under changing emissions 

Hwa-Jin Choi, Bo Liu, and Tatiana Ilyina

Understanding the mechanisms governing the evolution of the ocean’s anthropogenic carbon reservoir is critical for assessing its role in the global carbon cycle and susceptibility of the ocean carbon sink to climate change. Anthropogenic carbon, primarily from fossil fuel burning, interacts with and alters the natural carbon cycle, increasing the vulnerability of surface waters to natural carbon leaks. To address these dynamics, we quantify the mechanisms affecting oceanic anthropogenic carbon, including ocean circulation, biological production, and carbonate chemistry, using the Max Planck Institute Earth System Model. By disentangling the multi-factors through separating the evolutions of natural carbon—pre-industrial oceanic carbon pools—and anthropogenic carbon, we aim to develop a clearer and more comprehensive understanding of the ocean carbon cycle. Utilizing idealized emissions-driven simulations, we assess the sensitivity of the ocean carbon sink under varying emission pathways, such as increasing and decreasing CO2 emissions. This mechanistic understanding is crucial to understanding the vulnerability of the ocean carbon sink and monitoring the carbon budget. By linking these insights to the Transient Climate Response to cumulative CO2 Emissions (TCRE), this study contributes to a framework for evaluating carbon cycle feedback under diverse emission pathways.

How to cite: Choi, H.-J., Liu, B., and Ilyina, T.: Understanding the mechanisms driving the ocean’s anthropogenic carbon reservoir under changing emissions, EGU General Assembly 2025, Vienna, Austria, 27 Apr–2 May 2025, EGU25-10573, https://doi.org/10.5194/egusphere-egu25-10573, 2025.

EGU25-11301 | ECS | Orals | CL4.13

The reforestation-TCRE: A metric to quantify the effect of reforestation on global temperature 

Alexander MacIsaac, Kirsten Zickfeld, Damon Matthews, and Andrew MacDougall

With a well-studied potential to remove CO2 from the atmosphere, reforestation is a CO2 removal intervention common to net-zero CO2 pathways, policies, and the voluntary CO2 offset market. However, the relationship between a reforestation-based CO2 removal and temperature change is complicated by the biogeophsyical effects of reforestation on temperature, which have a demonstrated uncertainty across climate models. Furthermore, reforestation is a land-based intervention occurring in specific geographic locations and the relationship between reforestation within a specific locality and global temperature change is not well-defined.

Here we address these concerns by asking whether the TCRE framework - the fundamental metric relating anthropogenic CO2 emissions to global temperature change - and its regional variant can be applied to measure the effect of reforestation-based CO2 removal on global temperature. We conduct idealized net-zero CO2 simulations in a climate model of intermediate complexity (the UVic ESCM) to quantify the reforestation-TCRE across large-scales of reforestation. We measure reforestation-based CO2 removals by assessing both the change in above-ground and the change in above and below-ground CO2 in reforested areas as compared to a counter-factual simulation without reforestation. We further isolate the biogeophyical effects of reforestation to constrain the reforestation-TCRE to only the carbon-effects of reforestation. We expect our results to show that the reforestation-TCRE is not equal and opposite to the TCRE, which is accountable to the biogephsical effects of reforestation and asymmetries between the climate effects of a reforestation-based CO2 removal and an anthropogenic CO2 emission. Despite the short-coming, we expect our results to provide a metric for calculating a direct relationship between reforestation-based CO2 removal and global temperature change that is relatable to net-zero frameworks and potentially reproducible across climate models.

How to cite: MacIsaac, A., Zickfeld, K., Matthews, D., and MacDougall, A.: The reforestation-TCRE: A metric to quantify the effect of reforestation on global temperature, EGU General Assembly 2025, Vienna, Austria, 27 Apr–2 May 2025, EGU25-11301, https://doi.org/10.5194/egusphere-egu25-11301, 2025.

EGU25-12149 | ECS | Orals | CL4.13

Knowing what we know now: predicting ZEC with observables in a simple climate model 

Sofia Palazzo Corner, Joeri Rogelj, Zebedee Nicholls, Chris Jones, and Chris Smith

The Zero Emissions Commitment (ZEC) is understood to be the result of two evolving processes in the time after net zero: cooling due to carbon uptake by the land and ocean, and warming due to decreasing heat uptake by the ocean. The balance between these warming and cooling effects is what determines whether we can expect additional global temperature change after emissions stop, or whether zero emissions marks the point of temperature stabilisation. But are there observables prior to net zero that can predict which way this balance will fall?

Using the simple climate model MAGICC, we find ZEC to be a function of a handful of variables in the years leading up to net zero: global surface temperature, carbon uptake, ocean heat uptake and effective radiative forcing. This simple regression performs well for predicting additional global temperature change 50 years after net zero, with reasonable predictability 100, 200 and 1000 years after emissions stop. We find that higher warming at net zero increases the probability of a positive ZEC. We test the predictability of this model in FAIR, and assess the agreement with ESM and EMIC results from ZECMIP. We investigate the potential for constraining ZEC using this model and observables available today.

How to cite: Palazzo Corner, S., Rogelj, J., Nicholls, Z., Jones, C., and Smith, C.: Knowing what we know now: predicting ZEC with observables in a simple climate model, EGU General Assembly 2025, Vienna, Austria, 27 Apr–2 May 2025, EGU25-12149, https://doi.org/10.5194/egusphere-egu25-12149, 2025.

EGU25-12981 | Posters on site | CL4.13

Toward an observational constraints on the Transient Climate Response to Cumulative Emission 

Roland Séférian, Aurélien Ribes, and Saïd Qasmi

The relationship between CO2-induced warming and global mean temperature, known as the Transient Climate Response (TCR) to cumulative CO2 emissions (TCRE), is anemergent property of the Earth system. It allows to derive allowable CO2 emissions, or carbon budget, for a given anthropogenic warming threshold, such as the Paris Agreement warming target. The assessment of the TCRE in IPCC AR6 makes use of the theoretical framework as proposed by Jones and Friedlingstein (2020), which separate TCRE in two major drivers: the Transient Climate Response (TCR) and the airborne fraction (AF) of anthropogenic CO2 emissions. While published works have allowed to account for a constrained TCR range in the assessment of the TCRE, estimated of AF results only from unconstrained multi-model outputs.

The present work applies a novel methodology based on Bayesian statistics to integrate multiple lines of historical evidences to constrain future AF. Bayesinas statistics allows to exploits the time-varying relationship between the total anthropogenic emissions of CO2 and AF over the historical period and propagate this relationship in the future to constrain the AF range at CO2 doubling. The narrower very likely range for AF at CO2 doubling 41-59% (50% as Best estimates) results in a constrained very likely range for the TCRE, 1-2.1 K EgC-1 (1.5 as Best estimates). This constrained range is about 20% smaller than the latest assessed range for the TCRE and shines light on how novel observations and monitoring of anthropogenic emissions and airborne fraction of CO2 could results in even stronger constrain on TCRE estimates in the near future.

How to cite: Séférian, R., Ribes, A., and Qasmi, S.: Toward an observational constraints on the Transient Climate Response to Cumulative Emission, EGU General Assembly 2025, Vienna, Austria, 27 Apr–2 May 2025, EGU25-12981, https://doi.org/10.5194/egusphere-egu25-12981, 2025.

EGU25-13389 | Orals | CL4.13

Effect of land carbon accounting methods on the climate response to cumulative CO2 emissions 

H. Damon Matthews, Kirsten Zickfeld, Alexander MacIsaac, and Mitchell Dickau

The proportionality between global temperature change and cumulative CO2 emissions underpins our understanding of how climate will respond to future emissions, and what level of emissions reductions will be needed to stabilize global temperatures. Typically, fossil fuel and land-use CO2 emissions are treated as equivalent drivers of this global temperature response, and emissions reductions from both sources are assumed to contribute similarly to mitigation targets. However, measuring land-use CO2 emissions in the real world is complicated by the difficulty in separating direct emissions (those caused by deforestation and other human land-use activities) from indirect carbon fluxes caused by CO2 fertilization and other land carbon responses to changing climate conditions. Consequently, an emission (or removal) of CO2 from land use activities as measured and reported in national emissions inventories is not equivalent to a land-use emission as defined in modelling studies that have been used to quantify the climate response to cumulative fossil fuel and land-use CO2 emissions. Here we assess the impact of these different land carbon accounting conventions on two key metrics of the climate response to cumulative CO2 emissions: the Transient Climate Response to cumulative CO2 Emissions (TCRE) and the Zero Emissions Commitment (ZEC). Using a spatially-explicit intermediate complexity Earth system model, we quantify these two metrics as a function of (1) fossil fuel CO2 emissions only; (2) fossil fuel + direct land-use CO2 emissions; and (3) fossil fuel + net land-use CO2 fluxes including indirect land carbon sinks. We show that both the magnitude and time-dependence of the TCRE and ZEC metrics is sensitive to the inclusion and definition of land carbon emissions. This finding underscores the need for improved clarity and care in the application of scientific findings to real-world mitigation efforts related to land carbon emissions and removals.

How to cite: Matthews, H. D., Zickfeld, K., MacIsaac, A., and Dickau, M.: Effect of land carbon accounting methods on the climate response to cumulative CO2 emissions, EGU General Assembly 2025, Vienna, Austria, 27 Apr–2 May 2025, EGU25-13389, https://doi.org/10.5194/egusphere-egu25-13389, 2025.

EGU25-15339 | Posters on site | CL4.13

Southern Ocean heat burp in a cooling world 

Ivy Frenger, Svenja Frey, Andreas Oschlies, Julia Getzlaff, Torge Martin, and Wolfgang Koeve

The ocean accumulates carbon and heat under anthropogenic CO2 emissions and global warming. In net-negative emissions scenarios, where more CO2 is extracted from the atmosphere than emitted, we expect global cooling. Little is known about how the ocean will release heat and carbon under such a scenario. Here we use an Earth system model of intermediate complexity and show results of an idealized climate change scenario that, following global warming forced by an atmospheric CO2 increase of 1% per year and CO2 doubling at year 70, subsequently features decreasing atmospheric CO2 at a rate of -0.1% per year, implying sustained net-negative emissions. After four hundred years of net-negative emissions and gradual global cooling, abrupt reemergence of heat from the ocean interior leads to a global mean surface temperature increase of several tenths of degrees that lasts for more than a century. The ocean heat "burp" originates in heat that has previously accumulated under global warming in the Southern Ocean at depths and emerges to the ocean surface via deep convection. Surprisingly, this heat burp is largely devoid of CO2. This is because changes in ocean circulation affect heat more than carbon, with an additional muting effect of CO2 loss due to particularities of sea water carbon chemistry. As the ocean heat loss causes a global mean surface temperature increase that is independent of atmospheric CO2 concentrations or emissions, it  presents a mechanism that introduces a break down of the quasi-linear relationship of the TCRE.

How to cite: Frenger, I., Frey, S., Oschlies, A., Getzlaff, J., Martin, T., and Koeve, W.: Southern Ocean heat burp in a cooling world, EGU General Assembly 2025, Vienna, Austria, 27 Apr–2 May 2025, EGU25-15339, https://doi.org/10.5194/egusphere-egu25-15339, 2025.

EGU25-15995 | Orals | CL4.13

Constraining uncertainties of the Zero Emissions Commitment with a large ensemble of UVic 2.10 climate model simulations 

David Hohn, Giang Tran, Makcim De Sisto, and Nadine Mengis

Achieving global temperature stabilisation requires net-zero CO₂ emissions, a goal widely recognised within the scientific community. However, a critical and contested question remains: will the Earth's climate continue to warm due to thermal and biogeochemical inertia even after emissions cease? This phenomenon, known as Zero Emissions Commitment (ZEC), has been estimated to likely be 0.0 ºC with a multi-model spread of 0.3°C. Considering its magnitude, ZEC may represent a significant fraction of the remaining warming before the 1.5°C threshold is reached.

In an attempt to constrain uncertainties in ZEC estimates, this study presents findings from a large ensemble of simulations conducted using the University of Victoria Earth System Climate Model (UVic ESCM v2.10). The ensemble design systematically varies model parameters within observationally constrained ranges, targeting processes identified as having the largest potential influence on ZEC (Palazzo-Corner et al., 2023). These parameters include carbon cycle feedbacks, ocean heat uptake, and CO2 fertilisation effects, which are represented with appropriate and acceptable levels of complexity within the UVic ESCM.

In line with the CMIP7 emissions-driven experimental design focus, we employ the esm-flat10-zec as well as esm-flat20-zec, which uses a constant emission rate of 10 PgC/yr and 20 PgC/yr, respectively (Sanderson et al., 2024), with varying cumulative emission budgets. This approach allows for the exploration of ZEC parameter uncertainty under varying emission rates and carbon budgets, increasing our process-based understanding of the metric.


References

Sanderson, B. M. et al. The need for carbon-emissions-driven climate projections in CMIP7. Geoscientific Model Development 17, 8141–8172 (2024).

Palazzo Corner, S. et al. The Zero Emissions Commitment and climate stabilization. Frontiers in Science 1, 1170744 (2023).

How to cite: Hohn, D., Tran, G., De Sisto, M., and Mengis, N.: Constraining uncertainties of the Zero Emissions Commitment with a large ensemble of UVic 2.10 climate model simulations, EGU General Assembly 2025, Vienna, Austria, 27 Apr–2 May 2025, EGU25-15995, https://doi.org/10.5194/egusphere-egu25-15995, 2025.

EGU25-16501 | Orals | CL4.13

Asymmetric carbon-climate responses to cumulative emissions under different CO2 pathways 

Hongmei Li, Lennart Ramme, Chao Li, and Tatiana Ilyina

While previous research has extensively explored the effects of rising CO2 levels, the response of the climate and carbon cycle to reductions in CO2 remains less understood. In this study, we are going to uncover the asymmetric carbon-climate responses and underlying processes under different emission pathways, including decreasing and negative CO2 emissions.

Based on the Max Planck Institute Earth System Model (MPI-ESM1-2-LR), we have run a large ensemble of simulations incorporating an interactive carbon cycle under different future scenarios to quantify variations in atmospheric CO2 growth, along with carbon sinks in response to changing emissions. We found asynchronous changes in the atmospheric CO2 and emissions driven by carbon sinks, and the ocean and land become CO2 sources after ~2100 under negative emissions. While the climate responses to cumulative emissions along increasing pathways overlap, the responses along decreasing pathways are asymmetric and show uncertainties in the presence of internal climate variability.

Further idealized flat10 simulations with constant positive and negative CO2 emissions allow us to quantify the response of the carbon sink and climate under deep decarbonization. The climate and carbon cycle is irreversible even under the accumulation of zero emissions, featuring a lower global temperature and atmospheric CO2 concentration. An asymmetric response in the carbon uptake and release, and the ocean storage of carbon and heat intervene in the transient responses of climate to the cumulative CO2 emissions.

By leveraging these simulations under diverse scenarios, we seek to enhance our understanding of the transient climate response, providing insights into the potential impacts of emission reduction strategies and the role of negative emissions in climate mitigation.

How to cite: Li, H., Ramme, L., Li, C., and Ilyina, T.: Asymmetric carbon-climate responses to cumulative emissions under different CO2 pathways, EGU General Assembly 2025, Vienna, Austria, 27 Apr–2 May 2025, EGU25-16501, https://doi.org/10.5194/egusphere-egu25-16501, 2025.

EGU25-18370 | ECS | Orals | CL4.13

Understanding the Mechanisms Behind Zero Emissions Commitment (ZEC) at Different Warming Levels 

Laura Gibbs, Andy Wiltshire, Chris Jones, Colin Jones, Spencer Liddicoat, Ric Williams, Timothy Andrews, Eddy Robertson, Andrea Dittus, Ranjini Swaminathan, Lee DeMora, Jeremy Walton, Paulo Ceppi, and Till Kuhlbrodt

The Zero Emissions Commitment (ZEC) describes the climate response following the cessation of emissions and is critical for understanding long-term climate projections and remaining carbon budgets. Using simulations from the UK Earth System Model (UKESM), we explore ZEC behaviour across stabilized warming levels (WLs) following the protocol developed for TIPMIP. UKESM simulations reveal a strong dependence of ZEC on WL: while ZEC is near zero for WL <=2K, it becomes increasingly positive at higher WLs. This behaviour underscores the importance of disentangling the contributions of the different underlying processes to understand the mechanisms driving ZEC variability.

To explore the drivers of this behaviour, we analyse ZEC across a range of WLs focusing on both the thermal response and carbon cycle dynamics. We find that changes in physical feedbacks dominate the WL dependence of ZEC. However, the carbon cycle response still exhibits notable dynamics: land carbon uptake saturates after a few decades, while ocean uptake persists for centuries, shifting the balance between land and ocean contributions over time. While the climate response is approximately linear during the ramp-up phase, we hypothesize that ZEC is influenced by both the magnitude and duration of warming, reflecting a dependence on the system’s distance from equilibrium. These results highlight the critical role of WL-dependent responses in shaping long-term climate commitment and provide new insights into the mechanisms driving the variation in ZEC across scenarios.

How to cite: Gibbs, L., Wiltshire, A., Jones, C., Jones, C., Liddicoat, S., Williams, R., Andrews, T., Robertson, E., Dittus, A., Swaminathan, R., DeMora, L., Walton, J., Ceppi, P., and Kuhlbrodt, T.: Understanding the Mechanisms Behind Zero Emissions Commitment (ZEC) at Different Warming Levels, EGU General Assembly 2025, Vienna, Austria, 27 Apr–2 May 2025, EGU25-18370, https://doi.org/10.5194/egusphere-egu25-18370, 2025.

EGU25-19007 | Orals | CL4.13

A normalised framework for the Zero Emission Commitment: competing controls by thermal and carbon processes 

Ric Williams, Phil Goodwin, Paulo Ceppi, Chris Jones, and Andrew MacDougall

Climate models reveal a range of global surface temperature responses after net zero, generally a slight cooling, but sometimes a slight continued warming. This post emission response is affected by a range of processes including carbon uptake by the land and ocean, planetary heat uptake and time-varying climate feedback. To reveal their relative importance, a normalised framework is set out for the Zero Emissions Commitment (ZEC),  connecting the change in surface temperature (normalised by the change at net zero)  to changes in the atmospheric carbon inventory, radiative forcing, planetary heat uptake and climate feedback. Whether the temperature decreases or continues to rise after net zero is controlled by opposing contributions from (i) a weakening in radiative forcing due to a decrease in atmospheric carbon from the uptake by the land and ocean carbon sinks versus (ii) a strengthening in the surface warming due to a decline in ocean heat uptake and sometimes augmented by time-varying climate feedbacks. Inter-model differences in the post emission temperature response for the ZEC Model Intercomparison Project scenario are primarily determined by differences in the ocean uptake of heat and the land uptake of carbon, followed by differences in the ocean uptake of carbon and time-varying climate feedbacks.

How to cite: Williams, R., Goodwin, P., Ceppi, P., Jones, C., and MacDougall, A.: A normalised framework for the Zero Emission Commitment: competing controls by thermal and carbon processes, EGU General Assembly 2025, Vienna, Austria, 27 Apr–2 May 2025, EGU25-19007, https://doi.org/10.5194/egusphere-egu25-19007, 2025.

EGU25-21870 | Orals | CL4.13

AERA-MIP: TCRE, emission pathways and remaining budgets compatible with 1.5 and 2 °C global warming stabilization 

Yona Silvy and Thomas Frölicher and the AERA-MIP author team

While international climate policies now focus on limiting global warming to well below 2 °C or pursuing a 1.5 °C level of global warming, the climate modelling community has not provided an experimental design in which all Earth system models (ESMs) converge and stabilize at the same prescribed global warming levels. This gap hampers accurate estimations based on comprehensive ESMs of the carbon emission pathways and budgets needed to meet such agreed warming levels and of the associated climate impacts under temperature stabilization. Here, we apply the Adaptive Emission Reduction Approach (AERA) with ESMs to provide such simulations in which all models converge at 1.5 and 2.0 °C warming levels by adjusting their emissions over time. These emission-driven simulations provide a wide range of emission pathways and resulting atmospheric CO2 projections for a given warming level, uncovering uncertainty ranges that were previously missing in the traditional Coupled Model Intercomparison Project (CMIP) scenarios with prescribed greenhouse gas concentration pathways. Meeting the 1.5 °C warming level requires a 40 % (full model range: 7 % to 76 %) reduction in multi-model mean CO2-forcing-equivalent (CO2-fe) emissions from 2025 to 2030, a 98 % (57 % to 127 %) reduction from 2025 to 2050, and a stabilization at 1.0 (−1.7 to 2.9) PgC yr−1 from 2100 onward after the 1.5 °C global warming level is reached. Meeting the 2.0 °C warming level requires a 47 % (8 % to 92 %) reduction in multi-model mean CO2-fe emissions until 2050 and a stabilization at 1.7 (−1.5 to 2.7) PgC yr−1 from 2100 onward. The on-average positive emissions under stabilized global temperatures are the result of a decreasing transient climate response to cumulative CO2-fe emissions over time under stabilized global warming. This evolution is consistent with a slightly negative zero emissions commitment – initially assumed to be zero – and leads to an increase in the post-2025 CO2-fe emission budget by a factor of 2.2 (−0.8 to 6.9) by 2150 for the 1.5 °C warming level and a factor of 1.4 (0.9 to 2.4) for the 2.0 °C warming level compared to its first estimate in 2025. The median CO2-only carbon budget by 2150, relative to 2020, is 800 GtCO2 for the 1.5 °C warming level and 2250 GtCO2 for the 2.0 °C warming level. These median values exceed the median IPCC AR6 estimates by 60 % for the 1.5 °C warming level and 67 % for 2.0 °C. Some of the differences may be explained by the choice of the mitigation scenario for non-CO2 radiative agents. Overall, this new type of warming-level-based emission-driven simulation offers a more coherent assessment across climate models and opens up a wide range of possibilities for studying both the carbon cycle and climate impacts, such as extreme events, under climate stabilization.

How to cite: Silvy, Y. and Frölicher, T. and the AERA-MIP author team: AERA-MIP: TCRE, emission pathways and remaining budgets compatible with 1.5 and 2 °C global warming stabilization, EGU General Assembly 2025, Vienna, Austria, 27 Apr–2 May 2025, EGU25-21870, https://doi.org/10.5194/egusphere-egu25-21870, 2025.

EGU25-970 | ECS | PICO | CL4.14

Studies to Control Resuspension of Dust from Playgrounds 

Umangi Mehta, V.S. Vamsi Botlaguduru, Manaswita Bose, and Virendra Sethi

Dust resuspension from playgrounds can be a major contributor to urban air pollution. To address this issue, mitigation strategies such as the use of windscreens, water sprinkling, and dust suppressants have been reported in literature (Dong et al., 2007; Jeon et al., 2021; Taylor et al., 2015). However, the effectiveness of these measures is dependent on the soil type, wind patterns affected by green cover and surrounding. This study aims to provide insights into the effectiveness of different dust control strategies and offer potential solutions for widespread application in urban playgrounds. Laboratory-scale experiments were conducted to evaluate the influence of particle size distribution, wind speed and moisture content on dust resuspension from three different soil types. Numerical simulations will be performed to simulate the wind patterns that influence dust resuspension for a selected playground in Mumbai.

How to cite: Mehta, U., Botlaguduru, V. S. V., Bose, M., and Sethi, V.: Studies to Control Resuspension of Dust from Playgrounds, EGU General Assembly 2025, Vienna, Austria, 27 Apr–2 May 2025, EGU25-970, https://doi.org/10.5194/egusphere-egu25-970, 2025.

EGU25-1057 | ECS | PICO | CL4.14

Dust Aerosol and Water Vapor Radiative Effects: A Multi-Campaign Analysis of ASKOS and ORCESTRA/PERCUSION Over the Atlantic 

Dimitra Kouklaki, Alexandra Tsekeri, Anna Gialitaki, Kyriakoula Papachristopoulou, Panagiotis-Ioannis Raptis, Bernhard Mayer, Claudia Emde, Silke Groß, Eleni Marinou, Vassilis Amiridis, and Stelios Kazadzis

Aerosols significantly attenuate solar radiation and influence atmospheric thermodynamic stability, particularly over regions like the Atlantic, impacting Earth's energy budget and climate through radiative heating or cooling. Quantifying these effects is challenging due to aerosol diversity and complexity. For desert dust particles, the difficulty lies in defying their optical properties and accurately monitoring their extensive distribution.

This study aims to assess the radiative effects of dust aerosols and water vapor (WV), and their impact on atmospheric heating rates, by adopting non-spherical particle shapes and their intrinsic microphysical and optical properties during severe dust events. To achieve this, ground-based, airborne, and satellite observations are employed along with Radiative Transfer (RT) modeling, and more precisely the libRadtran RT package (Mayer and Kylling, 2005; Emde et al., 2016). The study utilizes data from two experimental campaigns – ASKOS and ORCESTRA/PERCUSION – both conducted in the Atlantic region during peak trans-Atlantic dust transport periods, in summers of 2022 and 2024.

In the frame of the ASKOS ESA Joint Aeolus Tropical Atlantic Campaign (JATAC), we utilized ground-based remote sensing and airborne in-situ observations, including solar radiation and airborne meteorological profiles. Microphysical properties from UAVs, MOPSMAP (Gasteiger and Wiegner, 2018) and TAMUdust2020 (Saito et al., 2021) scattering databases were used to derive dust optical properties considering a mixture of spheroidal and irregular-hexahedra shapes. Multi-wavelength lidar measurements contributed to the validation of the optical properties and dust vertical distribution. RT simulations incorporated WV concentration, to investigate dust-WV-solar radiation interactions under clear sky conditions. The simulated broadband shortwave radiation was, finally, compared with the ground-based solar radiation measurements.

A second case study was performed, leveraging ORCESTRA/PERCUSION campaign (https://orcestra-campaign.org/percusion.html) synergistic airborne measurements. This campaign incorporated a comprehensive suite of airborne instruments, providing, amongst others, radiation measurements, meteorological profiles, and extensive lidar measurements. Radiation at the top of the atmosphere (TOA) from the EarthCARE ESA mission supported comprehensive closure studies at TOA and at aircraft level.

Acknowledgements

This research was financially supported by the PANGEA4CalVal project (Grant Agreement 101079201) funded by the European Union, the CERTAINTY project (Grant Agreement 101137680) funded by Horizon Europe program and the AIRSENSE project which is part of Atmosphere Science Cluster of ESA’s EO Science for Society programme. DK, ΑΤ, ΚP, PR and SK would like to acknowledge COST Action HARMONIA (International network for harmonization of atmospheric aerosol retrievals from ground-based photometers), CA21119, supported by COST (European Cooperation in Science and Technology).

References

Mayer, B., Kylling, A.: Technical note: The libRadtran software package for radiative transfer calculations - description and examples of use. Atmos. Chem. Phys., 5(7), 1855–1877, 2005.

Emde, C., et al.: The libRadtran software package for radiative transfer calculations (version 2.0.1), Geoscientific Model Development, 9(5), 1647–1672, 2016.

Gasteiger, J. and Wiegner, M.: MOPSMAP v1.0: a versatile tool for the modeling of aerosol optical properties, Geosci. Model Dev., 11, 2739–2762, https://doi.org/10.5194/gmd-11-2739-2018, 2018.

Saito, M., et al.: A comprehensive database of the optical properties of irregular aerosol particles for radiative transfer simulations, J. Atmos. Sci., in press, https://doi.org/10.1175/JAS-D-20-0338.1, 2021.


How to cite: Kouklaki, D., Tsekeri, A., Gialitaki, A., Papachristopoulou, K., Raptis, P.-I., Mayer, B., Emde, C., Groß, S., Marinou, E., Amiridis, V., and Kazadzis, S.: Dust Aerosol and Water Vapor Radiative Effects: A Multi-Campaign Analysis of ASKOS and ORCESTRA/PERCUSION Over the Atlantic, EGU General Assembly 2025, Vienna, Austria, 27 Apr–2 May 2025, EGU25-1057, https://doi.org/10.5194/egusphere-egu25-1057, 2025.

EGU25-1247 | ECS | PICO | CL4.14

Vertical Profiling of Dust Layers in the Eastern Mediterranean: Sources, Dynamics, and Impacts 

Irina Rogozovsky, Albert Ansmann, Kevin Ohneiser, Holger Baars, Ronny Engelmann, Julian Hofer, and Alexandra Chudnovsky

Dust pollution is a critical environmental challenge with far-reaching impacts on climate and health. Despite its significance, no unified methodology exists for identifying dust-contaminated days, leading to inconsistencies across disciplines. The most widely used approaches often rely on ground-based measurements to classify dust events. However, these methods may overlook lofted dust layers. We used a ground-based lidar system to detect and classify dust layers and compared the results to widely adopted methods. Surprisingly, at least 50% of dust-contaminated days identified by lidar were missed by traditional surface-based methods. This gap underscores the critical role of vertical profiling in accurately capturing dust presence, which is vital for improving health impact studies and climate models. Our results highlight the challenges of distinguishing between anthropogenic and natural dust events using only ground-based measurements, as many measurement approaches classify mixed aerosols as dust, potentially leading to biased exposure estimates. In addition, vertical profiling and layering data revealed distinct pollution configurations in the Eastern Mediterranean (EM) region, ranging from purely anthropogenic layers to complex mixtures of marine aerosols, anthropogenic pollution, and desert dust. Results reveal that dust layers in the EM often extend vertically up to 10 km, with depths reaching 6.3 km. We used air masses back trajectory analysis to identify the source of particles for each layering type, and found 2 distinct dust sources, North African mostly pure dust and Middle Eastern dust with anthropogenic component. Finally, we analysed the uncertainties of the conventional satellite-derived AOD measurements. It was found the presence of lofted dust layers or mixed aerosols challenge the retrieval accuracy, gaining crucial insights into the limitations of satellite-derived AOD in representing complex atmospheric environments, especially in dust dominated regions. The holistic approach applied in our study is essential for understanding the dynamic interplay between pollution sources and atmospheric interactions, particularly in regions like the EM, which serve as a crossroads for diverse aerosol types.

How to cite: Rogozovsky, I., Ansmann, A., Ohneiser, K., Baars, H., Engelmann, R., Hofer, J., and Chudnovsky, A.: Vertical Profiling of Dust Layers in the Eastern Mediterranean: Sources, Dynamics, and Impacts, EGU General Assembly 2025, Vienna, Austria, 27 Apr–2 May 2025, EGU25-1247, https://doi.org/10.5194/egusphere-egu25-1247, 2025.

EGU25-2589 | PICO | CL4.14

Can we infer a mineralogical signature of dust hot spots using EMIT hyperspectral data? 

Paul Ginoux, Philip G. Brodrick, Maria Gonçalves Ageitos, Greg S. Okin, Carlos Pérez Garcia-Pando, David R. Thompson, and Robert O. Green

With more than 20 years of MODIS twice daily global measurements, dust hot spots have been
located using the extrema of frequency of occurrence of Dust Optical Depth (DOD) derived from
MODIS Deep Blue aerosol products. We know that these hot spots have a geomorphological signature (cf. Prospero et al., 2002; Baddock et al., 2016) but does it also imply that they have a mineralogical signature? This is important to know as mineralogy controls the sign and amplitude of dust interactions with the Earth's climate systems, in particular in terms of radiative forcing, ice cloud formation, rain water acidity, snow albedo, ocean bio-geochemistry. By overlaying over the dust hot spots, the soil mineralogy retrieved from the hyperspectral instrument NASA-JPL Earth Surface Mineral Dust Source Investigation (EMIT) over almost 3 years, our presentation will show that mineralogical content of dust hot spots is region specific.

How to cite: Ginoux, P., Brodrick, P. G., Gonçalves Ageitos, M., Okin, G. S., Pérez Garcia-Pando, C., Thompson, D. R., and Green, R. O.: Can we infer a mineralogical signature of dust hot spots using EMIT hyperspectral data?, EGU General Assembly 2025, Vienna, Austria, 27 Apr–2 May 2025, EGU25-2589, https://doi.org/10.5194/egusphere-egu25-2589, 2025.

EGU25-3373 | ECS | PICO | CL4.14

Analysis of PM2.5 Impacts from Agricultural Vinyl Waste Treatment Processes and Uncollected Waste 

Hyunjun Park, Minseon Park, Namhoon Lee, and Hui-Young Yun

The treatment of agricultural plastic waste is a critical source of fine dust (PM2.5) emissions, contributing significantly to air pollution. Uncollected plastic waste, predominantly subjected to open-air incineration, exacerbates this issue, underscoring the need for comprehensive management strategies.

This study aims to predict PM2.5 emissions from agricultural plastic waste treatment processes and quantify the contribution of uncollected plastic waste to air pollution, providing a novel analysis of the relative environmental impact of these two waste management pathways. Using the CAPSS model and process-specific emission factors, PM2.5 emissions from shredding, crushing, and sorting processes were estimated based on the annual average agricultural plastic waste generation of 314,000 tons from 2016 to 2021.

Predicted PM2.5 emissions per ton of treated waste were 0.00012 kg, 0.00075 kg, and 0.00043 kg for shredding, crushing, and sorting processes, respectively. By 2030, cumulative emissions from these processes are expected to reach 25.09 kg, 156.84 kg, and 89.92 kg. In contrast, uncollected vinyl waste subjected to open-air incineration is estimated to generate approximately 725,779.45 kg of PM2.5 by 2030, a figure nearly 2,600 times higher than emissions from treated waste.

The findings highlight the disproportionate environmental impact of uncollected vinyl waste compared to treated waste. This study underscores the urgency of improving collection rates and optimizing treatment processes for agricultural vinyl waste. Policy recommendations include expanding treatment facilities, fostering private-sector recycling initiatives, and enforcing stricter regulations on open-air incineration to mitigate fine dust emissions effectively. Future research should explore the comprehensive evaluation of waste management systems and the development of advanced technologies for reducing PM2.5 emissions.

Acknowledgments

This research was supported by Particulate Matter Management Specialized Graduate Program through the Korea Environmental Industry & Technology Institute(KEITI) funded by the Ministry of Environment(MOE)

How to cite: Park, H., Park, M., Lee, N., and Yun, H.-Y.: Analysis of PM2.5 Impacts from Agricultural Vinyl Waste Treatment Processes and Uncollected Waste, EGU General Assembly 2025, Vienna, Austria, 27 Apr–2 May 2025, EGU25-3373, https://doi.org/10.5194/egusphere-egu25-3373, 2025.

EGU25-4448 | ECS | PICO | CL4.14

Detection of seasonal-specific potential source areas of mineral dust on Crete (Greece) based on isotope measurements and mineralogical investigations 

Simon Bitzan, Cécile L. Blanchet, Georgios E. Christidis, Kerstin Schepanski, and Fabian Kirsten

The Sahara is the Earth’s largest dust source, producing dust plumes that impact the whole planet. The eastern Mediterranean is one of the areas significantly affected by Saharan dust and its deposition.
The geochemical and mineralogical composition of the deposited mineral dust particles depend on their source area and on spatiotemporal variability of the source areas.
Although being of great importance for local soil formation and soil distribution, the impact of changes in dust provenance has not been extensively studied in the eastern Mediterranean. Thus, further research is required to characterize dust deposition fluxes, transport trajectories and the geochemical and mineralogical composition of deposited mineral dust.
Modelled trajectories of dust events provide good insights on aeolian transport routes, but if larger distances are covered over land, the exact source area of the deposited material cannot be traced with certainty. The question also arises as to whether the composition of the mineral dust deposited differs due to spatial sorting and thus its influence on the deposition area.
In order to gain insight into the dynamics of dust deposited on Crete, we present results from eight passive deposition traps (marble samplers) that were installed in western Crete at various sites around the Lefka Ori mountains. Monthly sampling was performed between March 2023 and June 2024, which provides us a unique temporal and spatial coverage.
Here we used a multi-proxy fingerprinting approach including Nd-Sr isotopic composition, mineralogy and grain-size distribution. The isotope analyses show a temporal shift in the potential source areas over the year, but no significant spatial differences. This spatial homogeneity in the isotopic signature of deposited dust suggests a minor influence of local inputs, which are characterized by distinct geological contexts, which is confirmed by the mineralogy. Samples with a coarser and well-sorted grain-size distribution likely track larger dust events, as a relatively larger proportion originates from the same source. The aim is to combine the results and thus to highlight and classify the intensity of influence of different source areas on the soil development of western Crete. In the long term, an analysis of back-tracking trajectories is to be carried out and combined with the results of the isotope analyses, which we expect to improve the informative value of the potential source areas.

How to cite: Bitzan, S., Blanchet, C. L., Christidis, G. E., Schepanski, K., and Kirsten, F.: Detection of seasonal-specific potential source areas of mineral dust on Crete (Greece) based on isotope measurements and mineralogical investigations, EGU General Assembly 2025, Vienna, Austria, 27 Apr–2 May 2025, EGU25-4448, https://doi.org/10.5194/egusphere-egu25-4448, 2025.

EGU25-4494 | PICO | CL4.14

Unraveling Late Quaternary Climate Dynamics: Insights from the Velika Vrbica Loess-Palaeosol Sequence, Wallachian Basin 

Zoran Perić, Cathal Ryan, Warren Thompson, Milica Radaković, Petar Krsmanović, Helena Alexanderson, and Slobodan Marković

The Velika Vrbica loess-palaeosol sequence (LPS) in northeastern Serbia, located at the westernmost boundary of the Wallachian Basin, provides a high-resolution terrestrial archive of palaeoenvironmental changes spanning Marine Isotope Stages (MIS) 3 to MIS 1. This study integrates optically stimulated luminescence (OSL) dating, magnetic susceptibility (χ), and mass accumulation rates (MAR) to reconstruct climatic and environmental dynamics over the last ~41,000 years. The OSL chronology reveals consistent loess deposition from ~41 ka to 3 ka, with peak accumulation rates during MIS 3 and late MIS 2. Notably, MARs are higher during the interstadial MIS 3 compared to the Last Glacial Maximum (MIS 2), challenging conventional models that associate intensified dust deposition solely with colder glacial phases. This pattern highlights the influence of regional factors such as sediment source proximity, wind dynamics, and variations in sediment trapping efficiency. The χ record highlights fluctuations in pedogenesis and aeolian activity, which broadly correspond to climatic oscillations captured in the NGRIP δ¹⁸O ice core record. These global cold periods align with intensified dust deposition, but substantial MAR values observed during warmer interglacial phases suggest that sedimentation processes in southeastern Europe were influenced by additional, localized drivers. The Velika Vrbica LPS captures detailed environmental responses to Dansgaard-Oeschger (D-O) events, marked by rapid warming and subsequent cooling phases. These responses reflect the sensitivity of southeastern Europe to abrupt climatic shifts and reveal the nuanced relationship between global climatic drivers and regional environmental processes. Notably, the sandy layer deposited between ~32 ka and ~15 ka reflects intensified palaeowind activity during the Last Glacial Maximum, further illustrating the interplay between climate and sedimentation dynamics. Comparison with other LPSs in southeastern Europe highlights the distinct depositional patterns of Velika Vrbica, with pronounced MAR peaks during MIS 3 and considerable variability during MIS 2. These findings diverge from the widely accepted model of loess formation, emphasizing the importance of site-specific factors and regional climatic influences. For example, while most models predict lower dust input during interglacial periods, the Velika Vrbica LPS records substantial dust deposition even during MIS 3 interstadials. This challenges established paradigms and underscores the complexity of loess formation processes in dynamic semi-arid environments. By integrating high-resolution geochronological data with sedimentological and palaeoclimatic analyses, this research provides critical insights into late Quaternary climate dynamics in southeastern Europe. The Velika Vrbica LPS not only enhances our understanding of the region’s environmental history but also contributes to refining global models of loess deposition and dust dynamics. These findings emphasize the need for further site-specific investigations to disentangle the interplay between global climate systems and local environmental processes, thereby advancing our understanding of past climatic variability and its implications for future environmental changes.

How to cite: Perić, Z., Ryan, C., Thompson, W., Radaković, M., Krsmanović, P., Alexanderson, H., and Marković, S.: Unraveling Late Quaternary Climate Dynamics: Insights from the Velika Vrbica Loess-Palaeosol Sequence, Wallachian Basin, EGU General Assembly 2025, Vienna, Austria, 27 Apr–2 May 2025, EGU25-4494, https://doi.org/10.5194/egusphere-egu25-4494, 2025.

EGU25-4612 | ECS | PICO | CL4.14

Westerly jet variations over East Asia since the Last Glacial Maximum: Evidence from Asian dust records in the Mariana Trench  

Yanning Wu, Yifeng Liu, Tao Wu, Chun-Feng Li, Wancang Zhao, Taoran Song, and Liyan Tian

The seasonal migration of the westerly jet (WJ) over East Asia is recognized as a substantial factor in the historical climate of the region, especially regarding spatial and temporal variability of regional rainfall and the dust cycle in the Northern Hemisphere. However, the evolution of East Asian WJ since the Last Glacial Maximum (LGM) remains debated. To enhance our understanding, we investigate the changes in Asian dust sources in sediments from the southern Mariana Trench utilizing trace elements and Sr-Nd isotopes.

According to the geochemical analyses, the eolian dust from the Taklimakan desert is the major dust source to the southern Mariana Trench during most of the LGM. Nevertheless, the Mongolian Gobi Desert became the dominant dust contributor during partial periods of the early LGM. This result can be attributed to changes in the timing of the seasonal WJ transition and the meridional distribution of the WJ. During the LGM, low boreal summer insolation kept the WJ axis south of the Tibetan Plateau throughout the year, which should be accompanied by broad meridional distribution of the WJ affecting mid-to-high latitudes. However, extensive Northern Hemisphere ice sheets prevented the occurrence of the WJ over mid-to-high latitudes. Therefore, the WJ mainly transported the Taklimakan dust. The smaller ice sheets in the early LGM than in the late LGM allowed the WJ to appear over the Mongolian Gobi Desert, favoring the local dust export.

During the mid-Holocene, the trench received a mixed contribution of the Taklimakan and the Mongolian Gobi dust. Strong boreal summer insolation during this period caused the WJ axis to frequently shift to a southwest-northeast orientation and an earlier seasonal WJ transition. This facilitated the transport of dust from both deserts. In the late Holocene, the Taklimakan desert became the dominant dust source, due to a reoriented WJ axis with a west-east orientation and a delayed seasonal transition driven by declining boreal summer insolation.

How to cite: Wu, Y., Liu, Y., Wu, T., Li, C.-F., Zhao, W., Song, T., and Tian, L.: Westerly jet variations over East Asia since the Last Glacial Maximum: Evidence from Asian dust records in the Mariana Trench , EGU General Assembly 2025, Vienna, Austria, 27 Apr–2 May 2025, EGU25-4612, https://doi.org/10.5194/egusphere-egu25-4612, 2025.

EGU25-4644 | ECS | PICO | CL4.14

Intermediate-mode mineral dust aerosols efficiently scatter solar radiation 

Chen Cui, Pengfei Tian, Binrui Wang, and Wenfang Wang

Dust aerosols emitted naturally into the atmosphere play a crucial role in the climate system by scattering and absorbing radiation, which may alter regional aerosol radiative forcing. Aerosol size distributions exhibit a widespread trimodal pattern globally, and the presence of this trimodal distribution affects the scattering properties of the aerosol population. Here, we identify an intermediate mode in the African dust aerosol size distribution, previously overlooked, located between the fine and coarse modes. In regions with high dust loads, dust particles undergo physical processes, including surface fragmentation due to external forces, generating fine fragments with a characteristic size of approximately 0.6 µm. These fragments exhibit strong scattering properties, with a scattering efficiency factor roughly five times that of the fine mode, making them significant contributors to regional cooling effects. However, in recent years, the concentration of the intermediate mode has been gradually decreasing due to regional economic development and desert management, impacting both regional and global environmental and climate effects. This study provides new insights into dust aerosol emissions and improves the parameterization of dust in global climate models. These findings are crucial for enhancing the accuracy of global climate simulations and better quantifying the impact of dust aerosols on the climate.

How to cite: Cui, C., Tian, P., Wang, B., and Wang, W.: Intermediate-mode mineral dust aerosols efficiently scatter solar radiation, EGU General Assembly 2025, Vienna, Austria, 27 Apr–2 May 2025, EGU25-4644, https://doi.org/10.5194/egusphere-egu25-4644, 2025.

EGU25-4775 | PICO | CL4.14

Paleoclimate informed simulations for constraining aerosol radiative effects 

Samuel Albani, Natalie M. Mahowald, Longlei Li, Douglas S. Hamilton, and Jasper F. Kok

Aerosol radiative effects are still one of the major sources of uncertainty in terms of a quantitative understanding of climate changes across time scales, despite many advances in the field. Yet, paleodata databases offer the opportunity to constrain to some extent past natural aerosol emissions, allowing to account for aerosol radiative effects in a more realistic way in simulations with Earth System Models, at least from the point of view of amounts and spatial distributions of different aerosol species.

Here we first present the results of simulations conducted with CESM1.0 using paleodust constrained emissions for different equilibrium climate states, then broaden our discussion on the importance of historical and paleoclimate aerosol radiative effects, considering the published literature. We estimated that preindustrial to present-day aerosol radiative effects are affected by emission uncertainties that are just as large as model spread uncertainties (2.8 W m−2). We advocate that more efforts are put into improving and expanding existing paleodata collections and that those available should be taken into account when assessing uncertainties related to aerosol radiative effects. In particular we propose a new intercomparison project (AERO-HISTMIP) that compares outcomes when using multiple emission pathways in CMIP historical simulations.  

How to cite: Albani, S., Mahowald, N. M., Li, L., Hamilton, D. S., and Kok, J. F.: Paleoclimate informed simulations for constraining aerosol radiative effects, EGU General Assembly 2025, Vienna, Austria, 27 Apr–2 May 2025, EGU25-4775, https://doi.org/10.5194/egusphere-egu25-4775, 2025.

EGU25-5652 | ECS | PICO | CL4.14

From Sahara Desert to Ukraine: an integrated study of mineral dust transport 

Yuliia Yukhymchuk, Gennadi Milinevsky, Vassyl Danylevsky, Philippe Goloub, Xuhui Gao, and Xuanyi Wei

In April 2024, the transport of mineral dust from the Sahara Desert was observed over Ukraine. This phenomenon, unusual for the region, resulted in reduced visibility, "red rain," degraded air quality, and altered atmospheric aerosol properties over Kyiv. To better understand the impact of this event, sun photometers and modeling efforts were used to analyze the changes in aerosol characteristics and the atmospheric influence of mineral dust transport. Observations from the AERONET Kyiv station indicated significant changes in aerosol characteristics. Specifically, there was an increase in aerosol optical depth (AOD) and coarse-mode AOD, while the Angstrom exponent (AE) and fine-mode AOD showed a decline. Cluster analysis of these parameters revealed temporal patterns and correlations between the observed changes. The size distribution analysis highlighted the dominant influence of coarse particles. Additionally, the single scattering albedo (SSA) and refractive index values were affected, reflecting the presence of mineral dust compared to typical conditions. The GEOS-Chem chemical transport model further indicated changes in mineral dust concentrations, suggesting its notable impact on Ukraine's territory. Additionally, the HYSPLIT model was utilized in this study to analyze backward trajectories of air masses, providing crucial information about their movement before reaching the territory of Ukraine and identifying their origins.

How to cite: Yukhymchuk, Y., Milinevsky, G., Danylevsky, V., Goloub, P., Gao, X., and Wei, X.: From Sahara Desert to Ukraine: an integrated study of mineral dust transport, EGU General Assembly 2025, Vienna, Austria, 27 Apr–2 May 2025, EGU25-5652, https://doi.org/10.5194/egusphere-egu25-5652, 2025.

EGU25-5908 | ECS | PICO | CL4.14

Towards Convection-Resolving Dust Emission Modelling 

Pascal Kunze, Matthias Faust, Kerstin Schepanski, and Ina Tegen

Dust emissions are closely associated with wind speed and are affected by a variety of meteorological drivers and factors that have effects across different spatial and temporal scales. Global or regional atmospheric dust models employing parameterized convection often encounter difficulties in accurately replicating observed dust emissions. Recent investigations by Garcia-Carreras et al. (2021) have demonstrated significant discrepancies when modeling Northern African dust emissions across various grid scales using either parametrized convection or resolved convection. In order to further clarify the influence of model resolution on dust emissions, an investigation was conducted employing surface winds from two different model studies: the coarse-resolution CMIP-6 model intercomparison study [Eyring et al. (2016)] with parameterized convection and the high-resolution ICON model  simulation that was part of the DYAMOND project [Stevens et al. (2019)], which was computed with explicit convection. Two different dust products were computed using the modelled surface winds: the Dust Uplift Potential (DUP) derived from wind data and an offline dust emission model based on Tegen et al. (2002), which incorporates soil and vegetation effects to simulate dust emission fluxes utilizing gridded surface wind fields. The dust emissions from the different models are evaluated across various source regions, including Northern Africa, the Arabian Peninsula, Central Asia, the Gobi Desert, and the Taklamakan Desert. Convective events such as haboobs particularly necessitate explicit modeling at convection-resolving resolution, which is e.g an important cause of dust emissions in the southern Sahara in northern hemisphere summer. Other local wind systems can be discerned by both high and low-resolution models, albeit at varying magnitudes. In the Gobi region, there is negligible impact of model resolution on dust emissions. These findings could inform further research on modeling dust emission and  transport by providing a basis for improved dust emission parameterizations in large-scale models.

How to cite: Kunze, P., Faust, M., Schepanski, K., and Tegen, I.: Towards Convection-Resolving Dust Emission Modelling, EGU General Assembly 2025, Vienna, Austria, 27 Apr–2 May 2025, EGU25-5908, https://doi.org/10.5194/egusphere-egu25-5908, 2025.

EGU25-6183 | ECS | PICO | CL4.14

Meteorological Drivers of East Asian dust activity in spring 2001-2022 

Feifei Mu and Stephanie Fiedler

East Asian dust storms from the Gobi and the Taklamakan Desert occur frequently in spring. Dust aerosols influence climate through effects on radiation and clouds, and impair air quality with impacts on human health. However, large uncertainties in model simulations of dust aerosols persist. An estimation of the relative contributions of different meteorological drivers to dust activities can help to improve the representation of dust storms in models.

Mongolian cyclones, which form East of the Altai-Sayan Mountains, are important for dust-emitting winds in the Gobi Desert. Utilizing an automated detection algorithm of extratropical cyclones and multiple datasets for dust aerosol for 2001–2022, the contribution of Mongolian cyclones to East Asian dust emission and dust optical depth is quantitatively estimated (Mu and Fiedler). The results highlight that springtime dust storms in East Asia are primarily associated with a low-pressure system over Mongolia. Mobile Mongolian cyclones explain almost half of the total spring dust emission amount of the Gobi Desert. The calculated relative contributions of Mongolian cyclones to dust emissions in the Gobi Desert are similar from two different products, despite differences in the physical parameterization schemes for dust emission, number and location of the prescribed potential dust sources, and in the absolute dust emission amount by a factor ten. Dust emissions in the Gobi Desert and dust aerosol optical depth in the region downwind have decreased in the past decades, with Mongolian cyclones contributing to reductions of 10%-18% decade-1 and 11%--15% decade-1, respectively. The reduction of dust emissions and dust aerosol optical depth is at least in part explained by weaker and fewer Mongolian cyclones over time. 

Mongolian cyclones may also affect the dust activity in the Taklamakan Desert to the west of the Gobi Desert. The passage of the Mongolian cyclone in mid-March 2021 has led to a cold air intrusion into the Taklamakan Desert. The cold air favored the nighttime near-surface temperature inversion. The stable stratification near the surface allows the development of Nocturnal Low-Level Jets (NLLJs). The breakdown of NLLJs results in a strengthening of near-surface winds, which are sufficiently strong for dust emissions in many parts of the Taklamakan Desert (Mu et al., 2023). The Taklamakan dust was elevated by deep mixing and transported eastwards by prevailing mid-level westerlies, impacting air quality primarily in western China. Ongoing work addresses the link of cyclones and NLLJs in the Taklamakan Desert from the climatological perspective.

References:

Mu, F., Luiz, E.W., Fiedler, S., 2023. On the dynamics and air-quality impact of the exceptional East Asian dust outbreak in mid-March 2021. Atmos. Res. 292, 106846.
Mu, F. and Fiedler, S., in review. How much do atmospheric depressions and Mongolian cyclones contribute to East Asian spring dust activities?

How to cite: Mu, F. and Fiedler, S.: Meteorological Drivers of East Asian dust activity in spring 2001-2022, EGU General Assembly 2025, Vienna, Austria, 27 Apr–2 May 2025, EGU25-6183, https://doi.org/10.5194/egusphere-egu25-6183, 2025.

EGU25-6741 | ECS | PICO | CL4.14

The contribution of haboobs to the dust direct radiative effect 

Andreas Baer, Rumeng Li, and Martina Klose

Mineral dust is the most abundant type of atmospheric aerosol in terms of mass. Dust models at non-storm resolving resolutions are usually able to capture the dust load on diurnal or longer-term average, but perform worse in capturing its diurnal variability. A main reason for this deficit is the fact that phenomena smaller than the grid size cannot be represented and are therefore lacking in the simulations. A major dust-event type that can only be represented at single-digit kilometer resolution are haboobs – intense dust storms created by the cold-pool outflow of moist convection. Haboobs mostly occur during the afternoon and thus their representation in models at storm resolving resolutions increases dust emissions during the afternoon hours, especially in regions where haboobs typically occur. As a significant amount of global dust emissions can be attributed to haboobs, their impact, e.g. on interactions of dust aerosol with radiation, on the continental to global scale is of special interest.

Here we investigate the contribution of haboobs to the direct radiative effect (DRE) of dust through their modulation of the dust diurnal cycle and vertical and horizontal distributions. For this purpose, we performed a set of annual simulations of the year 2020 using the ICON-ART model at 5km and 80km grid resolution for a domain covering North Africa and the Arabian Peninsula, as these regions are strong dust sources and haboob hotspots. A radiation multiple call scheme in ICON-ART was used to assess the DRE from a single simulation. We analyze differences in DRE and the vertical and horizontal dust distribution between the simulations and link them to the spatial distribution of haboob occurrence in the high-resolution simulation.

By assessing the impact of haboobs on the radiation balance of the earth, we aim to contribute to evaluating the benefits of storm-resolving simulations on a global scale with online treatment of aerosols; and to test the importance of representing meso-scale phenomena for quantification of dust-climate impacts.

How to cite: Baer, A., Li, R., and Klose, M.: The contribution of haboobs to the dust direct radiative effect, EGU General Assembly 2025, Vienna, Austria, 27 Apr–2 May 2025, EGU25-6741, https://doi.org/10.5194/egusphere-egu25-6741, 2025.

EGU25-7106 | ECS | PICO | CL4.14

Another one traps the dust: Central Svalbard Lake sediments track 8,000 years of High Arctic wind strength 

Zofia Stachowska, Willem G. M. van der Bilt, Mateusz C. Strzelecki, and Jan Kavan

The Arctic warms faster than any other region on Earth. As sea ice diminishes in response, wind speeds increase due to reduced drag over open waters. Lake sediments offer valuable records of these processes and their relation to past climate change through the deposition of wind-blown grains and elements. This study reconstructs 8,000 years of Arctic eolian activity using laminated sediments from closed Lake Dunsappietjørna on the Svalbard archipelago. The site faces North Atlantic Westerlies as well as Easterly winds. By integrating geochemical (X-Ray Fluorescence – XRF), visual (Computed Tomography – CT and Scanning Electron Microscope – SEM), and granulometric (End Member Modeling Analysis – EMMA) fingerprints in a geostatistical (Principal Component Analysis – PCA) framework, we link clastic lacustrine input to sediment sources in the catchment, and unravel the imprint of Westerly and Easterly wind systems throughout the Holocene.

How to cite: Stachowska, Z., van der Bilt, W. G. M., Strzelecki, M. C., and Kavan, J.: Another one traps the dust: Central Svalbard Lake sediments track 8,000 years of High Arctic wind strength, EGU General Assembly 2025, Vienna, Austria, 27 Apr–2 May 2025, EGU25-7106, https://doi.org/10.5194/egusphere-egu25-7106, 2025.

The 2.3-million-year grain-size records of detrital components from IODP Site U1430 in the East (Japan) Sea illustrate the influence of East Asian Winter Monsoon variations on Asian dust transport and deposition. Dust transport was driven by two distinct wind systems: low-level northwesterly winter monsoon winds and upper-level westerlies. Using end-member (EM) modeling of grain-size distributions, five EMs were identified: fine-mode dust transported by upper-level westerlies (EM1), coarse-mode dust carried by northwesterly surface winds (EM2), and marine tephra components (EM3, EM4, EM5). After excluding marine tephra contributions, a refined dust-size distribution model was developed, focusing on EM1 and EM2. The cyclic patterns and amplitudes of dust-size variations at Site U1430 closely align with size records from the Chinese Loess Plateau (CLP), where sedimentation is predominantly influenced by northwesterly surface winds. This agreement suggests that dust deposition at Site U1430 was similarly controlled by the intensity of these winds, rather than upper-level westerlies. Additionally, variations in loess size across the CLP and modern dust observations indicate that vertical and lateral sorting processes during atmospheric transport contributed to the finer dust sizes recorded at Site U1430. These findings highlight the critical role of surface wind intensity and atmospheric sorting in shaping long-term dust deposition patterns in the East (Japan) Sea. 

How to cite: Jang, J.-H., Bahk, J.-J., and Lee, D. E.: IODP Site U1430 Asian Dust Size Records in the East (Japan) Sea Since the Early Pleistocene: The Role of Northwesterly Surface Winds and Upper Westerlies , EGU General Assembly 2025, Vienna, Austria, 27 Apr–2 May 2025, EGU25-7600, https://doi.org/10.5194/egusphere-egu25-7600, 2025.

EGU25-8292 | ECS | PICO | CL4.14

Saharan dust deposition in the eastern Mediterranean Sea: ballasting agent or fertilizer? 

Anouk van Boxtel, Addison Rice, Gert J. de Lange, Francien Peterse, and Jan-Berend Stuut

Dust deposition can increase the strength of the biological pump through fertilizing and ballasting effects of the deposited dust, in particular in (ultra-)oligotrophic oceans such as the eastern Mediterranean Sea (EMS). However, dust characteristics, such as nutrient content and bioavailability, organic-matter content, and grain-size distribution, and thus its fertilizing and ballasting potential, can vary between dust events.

Here, we present a long-term (1999-2011), high-resolution (14-21 days) sediment-trap record of dust fluxes, dust grain-size distributions, and fluxes of plant leaf waxes at 500, 1500, and 2500m water depth to assess seasonal and interannual variation in the amount and characteristics of dust deposited in the EMS.

We find that dust events mainly occur during late spring and summer, although their exact timing and magnitude varies between years. Differences in grain-size distribution and plant wax content between dust events indicate that the provenance, transportation, and/or deposition mode of the dust varied between events. The dust events archived in the sediment traps are preceded by atmospheric dust transport, indicated by increased Aerosol Optical Depth (AOD) values recorded by satellites in the weeks before dust fluxes increase. However, several major atmospheric dust outbreaks observed by satellites do not appear in the sediment trap record. This indicates that not all material that passes the EMS through the atmosphere is actually deposited on the sea surface and/or reaches the traps at larger water depths.

Most dust events in the sediment traps can be traced through the water column, indicating relatively rapid vertical export. The dust events coincide with increases in organic carbon flux, supporting the proposed role of dust in the biological pump through ballasting. However, while coarse-grained dust is consistently transferred to the deepest trap, regardless of the absolute flux, finer-grained dust is primarily detected in the upper trap. We will use our dataset to further investigate whether export of fine-grained dust is also linked to ballasting or is mediated by productivity in the surface ocean through the formation of organic aggregates and fecal pallets, either as a result of dust fertilization or natural processes.

How to cite: van Boxtel, A., Rice, A., de Lange, G. J., Peterse, F., and Stuut, J.-B.: Saharan dust deposition in the eastern Mediterranean Sea: ballasting agent or fertilizer?, EGU General Assembly 2025, Vienna, Austria, 27 Apr–2 May 2025, EGU25-8292, https://doi.org/10.5194/egusphere-egu25-8292, 2025.

EGU25-8963 | PICO | CL4.14

Evaluating the impact of improved dust representation and atmospheric iron chemistry in marine primary production and subsurface iron stocks  

Joan Llort, Elisa Bergas-Massó, Raffaelle Bernardello, Valentina Sicardi, Maria Gonçalves Ageitos, Carla Pons, Stelios Myriokefalitakis, and Carlos Pérez García-Pando

The impact of dust deposition on the fertilisation of marine ecosystems has been studied for decades. Despite the relevance of this air-sea interaction, aerosol chemical transformation, deposition over the ocean, and the eventual influence on ocean biogeochemistry (including carbon export) are poorly represented in most Earth System Models (ESM). For instance, the deposition of soluble iron (the chemical iron forms that phytoplankton can uptake) is often estimated in ESM as a constant fraction of deposited dust. This type of simplistic formulation underrepresents the interannual and spatial variability of the aeolian input of nutrients in marine ecosystems. 

In this work, we present a reconstruction of global ocean biogeochemistry for the last 30 years, where we evaluate the impact of newly produced iron deposition fields derived from the state-of-the-art atmospheric model EC-Earth3-Fe, which explicitly resolves the mineralogy of dust sources, includes a detailed representation of the atmospheric Fe dissolution processes and accounts for the contribution of other sources of Fe, such as anthropogenic combustion and biomass-burning. When compared to a standard run using climatological atmospheric inputs and constant dissolution rates the new simulation shows a contrasted response of marine primary production where production increases above 10% in large areas of the Pacific and the South Atlantic, while other smaller regions show an equivalent decrease. 

We also analysed the impact of the monthly resolved historical reconstruction of dust deposition (i.e., atmospheric model forced with observed meteorology) on the primary production’s interannual variability. Results showed no immediate impact of dust deposition variability on marine primary production. However, we found a replenishment of the subsurface stock of dissolved iron associated with the increase in dust deposition over the Equatorial Atlantic, the Indian Ocean and the subtropical Pacific. As this subsurface stock is one of the main seasonal inputs of iron through winter vertical mixing, it can induce delayed responses in marine ecosystems. Ongoing work is evaluating this hypothesis and comparing the simulated vertical distribution of dissolved iron in the water column against observations acquired by the GEOTRACES program.

In this presentation, we will also describe the efforts made in the new project BIOTA to understand how changes in aerosol transformation and deposition interact with the projected increase in upper ocean stratification, potentially enhancing the relative importance of aeolian nutrient inputs.

How to cite: Llort, J., Bergas-Massó, E., Bernardello, R., Sicardi, V., Gonçalves Ageitos, M., Pons, C., Myriokefalitakis, S., and Pérez García-Pando, C.: Evaluating the impact of improved dust representation and atmospheric iron chemistry in marine primary production and subsurface iron stocks , EGU General Assembly 2025, Vienna, Austria, 27 Apr–2 May 2025, EGU25-8963, https://doi.org/10.5194/egusphere-egu25-8963, 2025.

EGU25-8965 | ECS | PICO | CL4.14

Photovoltaic production in West Africa: Impact of dust and water footprint of cleaning operations 

Amy Tamunoibinyemiem Banigo, Benoit Hingray, Louise Crochemore, Béatrice Marticorena, and Sandrine Anquetin

To achieve universal electricity access and comply with Paris Agreement, one large-scale objective of the Economic Community of West African States (ECOWAS) is the deployment of +8 to +20 GWp of solar energy systems by 2030 (IRENA, 2018). ECOWAS is located south of the Saharan region and close to the Bodélé depression, which has been observed to have the largest atmospheric dust production activity on Earth (Isaacs et al., 2023). Once deposited on panels, dust reduces the transmission of solar radiation to the panels and, consequently, the energy production (Sarver et al., 2013). Annual losses of solar energy production of up to 54% have been observed in the region due to dust (Chanchangi et al., 2022). These production losses can be mitigated by regularly cleaning solar panels. In West Africa, cleaning operations commonly use water but many areas are water-scarce. It is thus important to ensure that water resources are not further strained by water cleaning operations associated with the expected large-scale deployment of solar energy systems in the region.

In the present work, we aim to assess the water footprint of different cleaning strategies of virtual solar plants in the ECOWAS region. A first step towards this aim consists in regionally assessing how dust would accumulate on Photovoltaic (PV) panels and, in turn, what the associated production losses would be. We present a dust accumulation model allowing to simulate, over a long time period and across the region, the temporal sub daily variations of dust accumulation on virtual PV panels. The model uses as input the particulate matter concentration of different particle sizes. Dust data from the CAMS and MERRA2 reanalyses are considered. Both datasets are first compared to observations of regional particulate matter concentration available from a set of four stations from the INDAAF network. CAMS data were found to better agree with observations (> 0.8 correlation for a 1-week temporal resolution). Time series of dust accumulation simulated from CAMS data were then compared to time series of dust deposit observations available for the same four INDAAF stations. Results show fair agreement but highlight significant differences, likely due to uncertainties in various variables and model assumptions. Lastly, simulated accumulated dust amounts are used as input to a PV soiling loss model to derive the transmission reduction and the mean PV production losses for different cleaning operation strategies.

References

Chanchangi et al., 2022. Soiling mapping through optical losses for Nigeria. Renewable Energy, 197, 995–1008. https://doi.org/10.1016/j.renene.2022.07.019

IRENA (2018), Renewable Energy Statistics 2018, The International Renewable Energy Agency, Abu Dhabi.

Isaacs et al., 2023. Dust soiling effects on decentralized solar in West Africa. Applied Energy, 340, 120993. https://doi.org/10.1016/j.apenergy.2023.120993

Sarver et al.,2013. A comprehensive review of the impact of dust on the use of solar energy: History, investigations, results, literature, and mitigation approaches. Renewable and Sustainable Energy Reviews, 22, 698–733. https://doi.org/10.1016/j.rser.2012.12.065

How to cite: Banigo, A. T., Hingray, B., Crochemore, L., Marticorena, B., and Anquetin, S.: Photovoltaic production in West Africa: Impact of dust and water footprint of cleaning operations, EGU General Assembly 2025, Vienna, Austria, 27 Apr–2 May 2025, EGU25-8965, https://doi.org/10.5194/egusphere-egu25-8965, 2025.

EGU25-9134 | PICO | CL4.14

Coordinated vertical tandem-profiling of a Saharan dust intrusion over Central Europe on 20 June 2024 based on balloon-borne soundings from two different sites. 

Ralf Weigel, Konrad Kandler, Monika Scheibe, Katie Smith, Luis Valero, Luca K. Eichhorn, Sina Jost, Kristin Röck, Sonja Gisinger, Alexandre Baron, Troy Thornberry, Adrienne Jeske, and Holger Tost

When favourable synoptic conditions prevail, desert dust is transported from North Africa to Central Europe. Between June 19 and 21, 2024, air from North and Northwest Africa spread from Algeria across the south-coast of France with predicted dust load > 1200 mg m-2 over an area limited by the Rhone Valley, extending to the coasts of Belgium and the Netherlands. The intrusion reached as far as the Skagerrak and the Kattegat and stretched across parts of Poland and the Czech Republic to the Aegean Sea and Greece, and it entirely covered Italy. On June 20, 2024, time-coordinated balloon-borne vertical soundings were carried out over Germany from two locations: 1) at 13:18 CEST from Oberpfaffenhofen (OPH - near Munich) and 2) at 14:15 CEST from Spielberg (SPb - near Frankfurt/Main, in the framework of “TPChange”, DFG TRR301) with the aim to analyse the same (intermediately transported) air mass. The SPb balloon payload included (a. o.) a radiosonde (RS41 SGP by VAISALA), a set of dual-stage impactors to perform particle sampling for offline physico-chemical analyses, and optical particle counters (OPC) such as the Portable Optical Particle Spectrometer (POPS). The OPH payload consisted of an OPC-N3 (by Alphasense) and the RS41 SGP.

Qualitative agreement was obtained from the independent profiles: from 1.5 km to 4.8 km height, a layer of increased particle number concentration (N) with 100 to 1000 cm-3 stands out from the background (N < 20 cm-3) in the vertical profile for particles with a diameter (Dp) from 0.14 µm to 2.6 µm (POPS-detected sized range). While below ~ 4.5 km (OPH) and ~ 4.8 km (SPb), the relative humidity (RH) remains below 87 %, the region of particle enhancement is effectively capped by a cloud layer (RH exceeding 100 %) of about 200 m vertical thickness above ~ 4.5 km (OPH) and ~ 4.8 km (SPb), respectively. Aloft, N drops abruptly and temporarily reaches background values < 20 cm-3. The impactor sample taken throughout passage of the particle layer showed considerable presence of mineral dust (generally > 75 % of all particles collected), the largest of which have estimated Dp of 10 µm and smallest Dp were estimated with 0.1 µm. Admixtures of sea salt (particle fraction Dp > 500nm) and sulphates (fraction Dp < 500 nm) were also identified. We will present more specific microphysical properties of the mineral dust aerosol, including morphology and chemical composition, and discuss these in the context of the atmospheric conditions at both measurement sites.

How to cite: Weigel, R., Kandler, K., Scheibe, M., Smith, K., Valero, L., Eichhorn, L. K., Jost, S., Röck, K., Gisinger, S., Baron, A., Thornberry, T., Jeske, A., and Tost, H.: Coordinated vertical tandem-profiling of a Saharan dust intrusion over Central Europe on 20 June 2024 based on balloon-borne soundings from two different sites., EGU General Assembly 2025, Vienna, Austria, 27 Apr–2 May 2025, EGU25-9134, https://doi.org/10.5194/egusphere-egu25-9134, 2025.

EGU25-9264 | PICO | CL4.14 | Highlight

The shadow of the wind: photovoltaic power generation under Europe's dusty skies 

György Varga, Fruzsina Gresin, András Gelencsér, Adrienn Csávics, and Ágnes Rostási

The impact of the Sahara dust storm events on photovoltaic power generation in Europe will be presented. In recent years, driven by global sustainability, climate and energy security objectives, photovoltaic power generation has been expanding worldwide, with a particular focus on the European continent. We are also witnessing a change in the frequency and intensity of Saharan dust storm events. Atmospheric particulate matter significantly reduces irradiance through its direct and indirect effects, with energy flux changes sometimes having serious economic and security of supply implications. 

In a diverse energy mix, which varies significantly from state to state, weather-dependent renewable generation must be forecasted to meet the delicate balancing needs of electricity supply, which poses a major challenge to the system operator. Analysis of the accuracy of the forecasts has shown that this is subject to significant errors and that the magnitude of these errors is larger during dust storm events than during non-dust storm situations. In the photovoltaic power generation data series of the southern (Portugal, Spain, France, Italy, Greece) and central European (Hungary) countries  presented here, we characterise episodes where atmospheric dust caused irradiance and electricity production to deviate significantly from the predicted levels.

Key Takeaways:

(1) The influence of atmospheric particulate matter is substantial for both photovoltaic (PV) production and generation forecasting. This effect is likely more pronounced with meridional (south-north) dust transport due to a steeper thermal gradient, which intensifies cloud formation processes through warm air advection and increased fine-grained particulate mass.

(2) Accurate PV production forecasts cannot be achieved using coarse-resolution aerosol climatology data without aerosol-cloud coupling. Instead, calculations should integrate up-to-date dust load data and relevant cloud physics relationships.

(3) The quantities of atmospheric dust, the dynamics of its transport, and the mineralogical and physical properties (such as grain size and shape) of the dust are not well understood. These factors have diverse impacts on cloud formation processes, necessitating further research for better comprehension.

(4) Due to climate change and the inherent variability of the climate system, forecasts are made under fluctuating hydrometeorological and atmospheric conditions, which inherently carry uncertainties. These errors are expected to become more significant with increasing PV capacity, thus managing them will require expanding electricity storage capacities alongside more precise forecasts.

The research was supported by the NRDI projects FK138692 and by the Sustainable Development and Technologies National Programme of the Hungarian Academy of Sciences (FFT NP FTA). This work has been implemented by the National Multidisciplinary Laboratory for Climate Change (RRF-2.3.1-21-2022-00014) project within the framework of Hungary's National Recovery and Resilience Plan supported by the Recovery and Resilience Facility of the European Union.

How to cite: Varga, G., Gresin, F., Gelencsér, A., Csávics, A., and Rostási, Á.: The shadow of the wind: photovoltaic power generation under Europe's dusty skies, EGU General Assembly 2025, Vienna, Austria, 27 Apr–2 May 2025, EGU25-9264, https://doi.org/10.5194/egusphere-egu25-9264, 2025.

EGU25-10547 | PICO | CL4.14

Dust emission from dust sources in Iceland: Insights from the High-Latitude Dust Experiment in summer 2021 

Kerstin Schepanski, Konrad Kandler, Mara Montag, Kilian Schneiders, Agnesh Panta, Adolfo González-Romero, Cristina González-Flórez, Martina Klose, Xavier Querol, Andrés Alastuey, Jesús Yus-Díez, Sylvain Dupont, Pavla Dagsson-Waldhauserová, and Carlos Pérez García-Pando

Mineral dust is one of the most prominent natural aerosols and is almost ubiquitous in the atmosphere, where it substantially interacts, modulates and alter atmospheric processes. Although research on dust aerosol is carried out since many decades by means of different approaches and techniques, knowledge on mineral dust emitted at high latitudes or in cold climate regions is still limited despite its pivotal impact on polar environments. Within a warming climate, dust emitted from sources located in cold climate zones is expected to increase due to the retreat of the ice sheets and increasing melting rates. Therefore, and for its extensive impacts on different aspects of the climate system, a better understanding of the atmospheric dust cycle at high latitudes/cold climates in general, and the spatio-temporal distribution of dust sources in particular, are essential.

We will present results from the HiLDA measurement campaign which took place in summer 2021 in the Dyngjusandur in Iceland. The measurements were set up to observe dust concentration variability across the Dyngjusandur and near-source dust transport areas in order to eventually conclude on the variability in dust source emissivity. We have measured aerosol size distributions and meteorological parameters distributed over different dust source areas at high temporal resolution for a period of eight weeks in summer 2021 and spring 2022. During this time, we observed a couple of intense dust events as well as background conditions. Ultimately, the analysis of our measurement data addresses the complex web of interactions which is defined by the variability of dust source characteristics and wind speed distribution in concert. Findings from this study contribute to the understanding of dust emission in cold climate regions and its spatio-temporal variability, which is essential with respect to the quantification of dust-associated feedbacks in the Earth system.

How to cite: Schepanski, K., Kandler, K., Montag, M., Schneiders, K., Panta, A., González-Romero, A., González-Flórez, C., Klose, M., Querol, X., Alastuey, A., Yus-Díez, J., Dupont, S., Dagsson-Waldhauserová, P., and Pérez García-Pando, C.: Dust emission from dust sources in Iceland: Insights from the High-Latitude Dust Experiment in summer 2021, EGU General Assembly 2025, Vienna, Austria, 27 Apr–2 May 2025, EGU25-10547, https://doi.org/10.5194/egusphere-egu25-10547, 2025.

EGU25-11653 | PICO | CL4.14

Earth Observations and Atmospheric Dust: unveiling Atlantic Ocean deposition 

Jan-Berend Stuut, Emmanouil Proestakis, Vassilis Amiridis, Carlos Pérez Garcia-Pando, Svetlana Tsyro, Jan Griesfeller, Antonis Gkikas, Thanasis Georgiou, Maria Gonçalves Ageitos, Jeronimo Escribano, Stelios Myriokefalitakis, Elisa Bergas Masso, Enza Di Tomaso, Sara Basart, and Angela Benedetti

The global ocean is a key component to the Earth’s climate system, absorbing atmospheric energy in excess and exchanging as a sink climate-relevant gases with the atmosphere. More specifically, through the uptake of atmospheric CO2 and acting as carbon storage, through the processes of biological pump and solubility pump, helps to mitigate anthropogenic CO2 increase. Moreover, the ocean enables phytoplankton photosynthesis, impacts ocean color, light penetration into deeper layers, and sea surface temperature, eventually modulating weather and resulting to feedback effects on climate. However, primary production highly depends on the spatial distribution of input nutrients from the atmosphere, with iron (Fe) availability the most important limiting factor for phytoplankton growth. Across the open ocean, the principal source of Fe is considered atmospheric mineral dust, transported over distances of thousands of kilometers prior removal through wet deposition or gravitational settling.

The present study provides quantification of the amount of atmospheric dust deposited into the broader Atlantic Ocean. Based on Cloud–Aerosol Lidar with Orthogonal Polarization (CALIOP) routine observations on atmospheric dust, the primary instrument onboard Cloud–Aerosol Lidar and Infrared Pathfinder Satellite Observations (CALIPSO), and meridional and zonal wind components provided by the European Centre for Medium-Range Weather Forecasts (ECMWF) reanalysis (ERA5), the atmospheric dust fluxes and the dust deposited component across the tans-Atlantic transits are estimated. On the basis of more than sixteen years (12/2006-11/2022) of Earth Observations, and for the Atlantic Ocean region extending between latitudes 60°S and 40°N, the annual-mean amount of deposited dust is estimated at 274.79 ± 31.64 Tg, of which 243.98 ± 23.89 Tg is deposited into the North Atlantic Ocean and 30.81 ± 10.49 Tg into the South Atlantic Ocean. Moreover, a negative statistically significant decreasing trend in dust deposition into the Atlantic Ocean for this period is revealed, characterized by slope -13.35 Tg yr-1 and offset 306.97 Tg.

The climate data record is evaluated against high quality sediment-trap measurements of deposited lithogenic material implemented as reference dataset, demonstrating the protentional of the established dataset to be used in a wide range of applications, including filling geographical and temporal gaps in sediment-trap measurements, aiding model simulation evaluations, uncovering physical processes in the dust cycle from emission to deposition, and enhancing our understanding of dust's biogeochemical impacts on ocean ecosystems, as well as its effects on weather and climate.


Acknowledgements

This research was supported by the Dust Observation and Modelling Study (DOMOS) under ESA contract number 4000135024/21/I-NB. Emmanouil Proestakis acknowledges support by the AXA Research Fund for postdoctoral researchers under the project entitled “Earth Observation for Air-Quality – Dust Fine-Mode (EO4AQ-DustFM)”.

How to cite: Stuut, J.-B., Proestakis, E., Amiridis, V., Pérez Garcia-Pando, C., Tsyro, S., Griesfeller, J., Gkikas, A., Georgiou, T., Gonçalves Ageitos, M., Escribano, J., Myriokefalitakis, S., Bergas Masso, E., Di Tomaso, E., Basart, S., and Benedetti, A.: Earth Observations and Atmospheric Dust: unveiling Atlantic Ocean deposition, EGU General Assembly 2025, Vienna, Austria, 27 Apr–2 May 2025, EGU25-11653, https://doi.org/10.5194/egusphere-egu25-11653, 2025.

EGU25-12087 | ECS | PICO | CL4.14

From fine to giant: Multi-instrument assessment of the particle size distribution of emitted dust during the J-WADI field campaign 

Hannah Meyer, Martina Klose, Konrad Kandler, Sylvain Dupont, and Carlos Pérez García-Pando and the J-WADI Team

Mineral dust, a key component of Earth’s aerosols, impacts atmospheric processes and climate. Emitted from dry soil, these particles travel long distances, influencing atmospheric radiation, cloud dynamics, and biogeochemical cycles. Dust effects are size-dependent. Larger particles, for example, tend to warm the atmosphere, whereas smaller ones (diameter dp < 2.5 µm) typically cool it. Understanding dust transport and impacts requires detailed particle size distribution (PSD) data at emission, but measurements are sparse and larger particles (dp > 10 µm) are understudied due to low concentrations and sampling challenges.

The Jordan Wind Erosion and Dust Investigation (J-WADI) campaign, conducted in September 2022 near Wadi Rum, Jordan, provides the platform for this study, in which we characterize the PSD at emission, focusing on super-coarse (10 < dp ≤ 62.5 µm) and giant (dp > 62.5 µm) particles. This study is the first to comprehensively characterize the size distribution of mineral dust directly at the emission source, covering diameters between 0.4 and 200 µm. Using a suite of aerosol spectrometers, the overlapping size ranges enabled systematic intercomparison and validation across instruments, improving PSD reliability and addressing challenges in detecting larger particles, such as inlet efficiencies or size range restrictions.

Results show significant PSD variability over the course of the campaign. During periods with friction velocities (u*) above 0.25 ms⁻¹, super-coarse and giant particles were observed, with concentrations increasing with u*. These large particles account for about two-thirds of the total mass during the campaign, with contributions of 90% during an active emission event, emphasizing the importance of including super-coarse and giant particles in PSD analyses. A prominent mass concentration peak was observed near 50 µm. While particle concentrations for dp < 10 µm show strong agreement among most instruments, discrepancies appear for larger dp due to reduced instrument sensitivity at the size range boundaries and sampling inefficiencies. Despite these challenges, physical samples collected using a flat-plate sampler largely confirm the PSDs derived from aerosol spectrometers.

These findings advance the characterization of PSD over a large size range at emission sources and lay the foundation to further improve our understanding of the mechanisms facilitating super-coarse and giant dust particle emission and transport.

How to cite: Meyer, H., Klose, M., Kandler, K., Dupont, S., and Pérez García-Pando, C. and the J-WADI Team: From fine to giant: Multi-instrument assessment of the particle size distribution of emitted dust during the J-WADI field campaign, EGU General Assembly 2025, Vienna, Austria, 27 Apr–2 May 2025, EGU25-12087, https://doi.org/10.5194/egusphere-egu25-12087, 2025.

EGU25-13198 | PICO | CL4.14

Giant Particle Size Distribution and Composition Near and In Dust Sources 

Konrad Kandler, Agnesh Panta, Mara Montag, Melanie Eknayan, Hannah Meyer, Martina Klose, Kerstin Schepanski, Cristina González-Flórez, Adolfo González-Romero, Andres Alastuey, Pavla Dagsson Waldhauserová, Xavier Querol, and Carlos Pérez García-Pando

Mineral dust is one of the key players in the Earth’s atmosphere with respect to climate and atmospheric nutrient transport. Dust spans a large size range of particle diameters, reaching from around 100 nm to more than 100 µm. While it has been assumed for a long time that the super-coarse (10 - 62.5 µm) and giant (> 62.5 µm) particles are not widely dispersed from the sources, more recent observations show that they can travel on a regional up to even intercontinental scale. Owing to the negligence and difficulty in measurement, not much information is available on this dust size range.

In the present work we have collected dust by means of a simple flat-plate deposition sampler and analyzed the collected material with electron microscopy and X-ray fluorescence, yielding information on particle size distributions and elemental composition. Samples were collected during intensive field campaigns of the FRAGMENT project in Morocco in 2019, a joint field campaign with the HiLDA project in Iceland in 2021, and the Jordan Wind erosion And Dust Investigation (J-WADI) in 2022. During all campaigns, severe dust conditions were observed with mass concentrations ranging into the tens of milligrams per cubic meter.

All observed number size distributions have in common a decrease towards submicron particles and a monotonic decrease with increasing particle size starting from 5 µm diameter. Both features are in general corroborated by online size distribution measurements in the overlap region, while the decrease towards smaller particle sizes is enhanced in the deposition sampling, most probably linked to the lower deposition speed of these particle sizes. The mean size distribution observed in Iceland has relatively more larger particles, followed by Jordan and lastly Morocco. Besides modes at around 1 µm and 5 µm, in Morocco a tertiary mode at around 70 µm in diameter gets pronounced. Mineral composition was estimated for each particle from the elemental composition. Morocco and Jordan have a similar composition with a slightly higher amount of Ca-accreted and feldspar particles in Jordan and more illite-/muscovite-like ones in Morocco. Expectedly, the composition of Icelandic dust is different, with volcanic glass, feldspars, and pyroxene/amphibole-like particles dominating. Comparing the coarse (sub-10-µm) with the super-coarse/giant (>10 µm) size range, we observe in the hot deserts less calcite for the larger particles as a common feature. The trend of a decreasing relative contribution of Fe-rich particles starting at the submicron range continues. In Iceland, we see the dominance of glassy particles still increase with increasing particle size. A big change in composition between these size classes is not observed unlike, for example, in previous measurements in Morocco, which showed a strong increase of quartz-like particles for the giant particle range. That indicates a considerable small-scale variability in freshly emitted dust plumes, dependent on their source.

How to cite: Kandler, K., Panta, A., Montag, M., Eknayan, M., Meyer, H., Klose, M., Schepanski, K., González-Flórez, C., González-Romero, A., Alastuey, A., Dagsson Waldhauserová, P., Querol, X., and Pérez García-Pando, C.: Giant Particle Size Distribution and Composition Near and In Dust Sources, EGU General Assembly 2025, Vienna, Austria, 27 Apr–2 May 2025, EGU25-13198, https://doi.org/10.5194/egusphere-egu25-13198, 2025.

EGU25-13655 | ECS | PICO | CL4.14

Modelling of Dust Emissions from Agricultural Sources in Europe 

Matthias Faust, Robert Wagner, Ralf Wolke, Steffen Münch, Roger Funk, and Kerstin Schepanski

Mineral dust emissions from arable land are a significant environmental concern. Fugitive dust emissions commonly arise during mechanical activities such as tilling and harvesting, while aeolian emissions occur from sparsely vegetated cropland, particularly during the transitional phases between fresh tillage and substantial vegetation growth and hence coverage of the bare soil. Suspended in the atmosphere, dust aerosol particles originating from arable land suposedly affect human health, reduce air quality, and can economically impact agricultural productivity due to soil degradation and reduced yields.

Agricultural dust emissions are often overlooked in coupled atmosphere-aerosol models, perhaps due to the complex conditions that lead to emissions. Fugitive emissions are highly variable, influenced by unpredictable human activities, while aeolian emissions require accurate descriptions of vegetation dynamics during transitional periods.

To address these gaps, we developed modelling strategies to simulate both fugitive and aeolian emissions. Fugitive emissions were analysed using a Lagrangian particle dispersion model designed to capture the turbulent mixing of dust particles in the atmospheric boundary layer. A case study based on measured tilling emissions demonstrated how atmospheric stratification can limit or amplify dust plumes and their range of transport.

For aeolian emissions, a new parameterisation was implemented in the atmosphere-aerosol model COSMO-MUSCAT, utilising high-resolution satellite data to represent vegetation cover. We tested our model for a dust emission event in Poland in 2019, where the model showed good agreement with satellite observations and ground-based measurements.

Ultimately, our modelling efforts provide insights into the dynamics, spatial distribution, and broader impacts of agricultural dust emissions, contributing to a more comprehensive understanding of their role in the atmosphere.

How to cite: Faust, M., Wagner, R., Wolke, R., Münch, S., Funk, R., and Schepanski, K.: Modelling of Dust Emissions from Agricultural Sources in Europe, EGU General Assembly 2025, Vienna, Austria, 27 Apr–2 May 2025, EGU25-13655, https://doi.org/10.5194/egusphere-egu25-13655, 2025.

EGU25-16684 | ECS | PICO | CL4.14

Enhancing Aerosol Modeling: Integrating the Mineralogy of Mineral Dust into ECHAM_HAMMOZ 

Elisabeth Hofmann, Robert Wagner, and Kerstin Schepanski

Dust aerosols are a key component of the climate system due to their interactions with radiation, their influence on atmospheric chemistry, and their role in biogeochemical cycles. Despite this importance, many climate models treat mineral dust particles as a homogeneous entity, overlooking their inherent variability regarding mineralogical composition. In reality, dust aerosols consist of fine particles entrained by wind from sparsely vegetated soil surfaces, originating from geographically diverse regions of the Earth and shaped by local climate and geological conditions. These particles are a complex mixture of various mineralogies with distinct size distributions.

In this study, we discuss the global distribution of mineral dust aerosol concentrations with regard to the dust particles’ mineralogical composition, using the atmosphere-aerosol model ECHAM-HAMMOZ (ECHAM6.3.0-HAM2.3-MOZ1.0). The model has been enhanced by integrating 12 minerals derived from the database of Journet et al. (2014), as modified by Gonçalves Ageitos et al. (2023). This implementation allows for a more detailed representation of the mineralogical diversity of atmospheric dust aerosols as a function of soil mineralogy at the contributing dust source areas. The results of the model simulations are evaluated against observational data in order to assess the model's accuracy and performance with regard to the representation of the mineralogical composition of dust aerosol plumes.

This work highlights the importance of incorporating mineralogical diversity in climate models to better understand the role of dust aerosols in the Earth system.


  • Gonçalves Ageitos, María & Obiso, Vincenzo & Miller, Ron & Jorba, Oriol & Klose, Martina & Dawson, Matt & Balkanski, Yves & Perlwitz, Jan & Basart, Sara & Tomaso, Enza & Escribano, Jerónimo & Macchia, Francesca & Montané Pinto, Gilbert & Mahowald, Natalie M & Green, Robert O & Thompson, David & Pérez García-Pando, Carlos. (2023). Modeling dust mineralogical composition: sensitivity to soil mineralogy atlases and their expected climate impacts. Atmospheric Chemistry and Physics. 23. 8623-8657. 10.5194/acp-23-8623-2023.

  • Journet, E., Balkanski, Y., and Harrison, S. P.: A new data set of soil mineralogy for dust-cycle modeling, Atmos. Chem. Phys., 14, 3801–3816, https://doi.org/10.5194/acp-14-3801-2014, 2014.

How to cite: Hofmann, E., Wagner, R., and Schepanski, K.: Enhancing Aerosol Modeling: Integrating the Mineralogy of Mineral Dust into ECHAM_HAMMOZ, EGU General Assembly 2025, Vienna, Austria, 27 Apr–2 May 2025, EGU25-16684, https://doi.org/10.5194/egusphere-egu25-16684, 2025.

EGU25-16882 | ECS | PICO | CL4.14

Magnetic minerals in atmospheric Saharan dust  

Iida Kostamo, Johanna Salminen, Anu Kaakinen, Outi Meinander, Antti Penttilä, and Karri Muinonen

Atmospheric dust is an important component of the global climate system. It has large-scale effects on the planetary radiation budget, the albedo of snow/ice, and biogeochemical cycles. Despite this, particularly the magnetic minerals in atmospheric dust have been poorly described in aerosol models. The absorption effects of magnetic particles can be comparable to black carbon, they promote ice nucleation and therefore play a role in cloud formation, and they increase the input of iron into ocean ecosystems. We aim to contribute to characterizing these dust particles and their source areas, long-range transport, and scattering effects.  

The research material consists of Saharan dust deposited on snow in Finland, collected as an extensive citizen science campaign by the Finnish Meteorological Institute during 2021. The first results regarding the dust samples were published by Meinander et al. (2023). The multidisciplinary study showed that the dust originated from the Sahara and the Sahel regions (south of Sahara), based on the magnetic properties of the particles, and the System for Integrated modeLling of Atmospheric coMposition (SILAM) model. The results form the basis for the present project.  

A detailed magnetic characterization of the dust samples is one of the main objectives. Identifying properties such as the types and grain sizes of the magnetic particles is crucial in indicating the source area of the dust and improving the light scattering and absorption models of dust. Magnetic measurements, including initial susceptibility with two frequencies, anhysteretic remanence, and isothermal remanence, have been carried out for a set of 47 dust samples. The preliminary results are in good agreement with the previously published magnetic analyses (Meinander et al. 2023), showing signs of the presence of both Saharan and anthropogenic dust.  

In the future, the scattering and absorption of light by the dust particles will be studied both experimentally and theoretically. The existing numerical methods will be extended for the treatment of magnetic particles, particularly. 


Meinander, O., Kouznetsov, R., Uppstu, A. et al. African dust transport and deposition modelling verified through a citizen science campaign in Finland. Sci Rep 13, 21379 (2023). https://doi.org/10.1038/s41598-023-46321-7 

How to cite: Kostamo, I., Salminen, J., Kaakinen, A., Meinander, O., Penttilä, A., and Muinonen, K.: Magnetic minerals in atmospheric Saharan dust , EGU General Assembly 2025, Vienna, Austria, 27 Apr–2 May 2025, EGU25-16882, https://doi.org/10.5194/egusphere-egu25-16882, 2025.

EGU25-17479 | ECS | PICO | CL4.14

A 21-year evaluation of MODIS Aerosol Optical Depth retrievals during Icelandic dust events 

Sam Poxon, Matthew Baddock, and Joanna Bullard

The wind-blown entrainment, transportation, and deposition of mineral dust originating in the high latitudes plays a significant role in atmospheric, cryospheric, marine and terrestrial environments at the regional scale. However, the intermittent nature of dust events occurring over broad spatial scales is difficult to capture from field studies alone. Remote sensing datasets are well-suited to overcoming some of these spatial limitations, and while they have been effectively used to characterise and understand dust activity across the major global hotspots, they lack application in high latitude dust regions. The use of surface observations of dust, such as those recorded at meteorological stations, is an important step in assessing the value of data retrieved from space. Meteorological observations have an established application in monitoring wind erosion and dust activity at broad spatial and temporal scales, however their use as a comparative method for evaluating data retrieved from remote sensing remains under explored.

This research presents the first systematic comparison of remotely-sensed data and ground-based present weather dust codes for a high latitude region, using Iceland as a case study. Remote sensing datasets including Aerosol Optical Depth, Angstrom Exponent and Single Scattering Albedo are derived from the MODIS Level-2 Aerosol Product at 10 km resolution, has and have been evaluated against coded present weather reports of dust obtained from 23 Icelandic meteorological stations for the study period 2001 – 2022. Preliminary analysis indicates that Aerosol Optical Depth is elevated for dust constrained days which allows some inference about the seasonality of dust activity.  Further comparative testing of ground-based and remotely-sensed data may create opportunities for better understanding the opportunities and limitations associated with remote sensing of high latitude dust activity in regions where ground-based data are not available.

How to cite: Poxon, S., Baddock, M., and Bullard, J.: A 21-year evaluation of MODIS Aerosol Optical Depth retrievals during Icelandic dust events, EGU General Assembly 2025, Vienna, Austria, 27 Apr–2 May 2025, EGU25-17479, https://doi.org/10.5194/egusphere-egu25-17479, 2025.

EGU25-20931 | ECS | PICO | CL4.14

Is there a link between modelled mineral dust hematite content and lidar measured intensive optical properties? 

Sofía Gómez Maqueo Anaya, Dietrich Althausen, Julian Hofer, Moritz Haarig, Ulla Wandinger, Bernd Heinold, Ina Tegen, Matthias Faust, Holger Baars, Albert Ansmann, Ronny Engelmann, Annett Skupin, Birgit Hesse, and Kerstin Schepanski

Mineral dust aerosols are composed of a complex mixture of various minerals that vary by source region. Notably, the iron oxide fraction differs yielding to differences in the dust absorbing properties in the UV-VIS spectrum due to changes in the imaginary parts of the complex refractive index.

This study investigates whether variations in the Saharan dust’s iron oxide content have led to measurable variations in the backscattering properties of dust particles, which is indicated by laboratory measurements and theoretical models. This work combines modelled mineralogical data using the regional dust model COSMO-MUSCAT with vertically resolved lidar measurements conducted in Cabo Verde, located in the tropical Atlantic Ocean off the west coast of Northern Africa.

The results include comparisons between the modelled iron oxide content and lidar resolved intensive optical properties, such as the lidar ratio (extinction-to-backscattering ratio), the backscatter-related Ångström exponent (ÅE), and the particle depolarization ratio. Dust plumes were analysed over two northern hemispheric summer campaign periods in 2021 and 2022. The findings reveal that the strongest correlations were observed between the modelled iron oxide mineral content and the backscatter-related ÅE. This supports the idea that variations in dust iron oxide content influence this intensive optical property at UV-VIS wavelengths, even though the backscatter-related ÅE is regarded to indicate mainly the particle size.

This study provides a framework for further exploring the influence of a varying hematite content on the backscattering properties of dust in the UV-VIS wavelength range. Establishing certainty with regards to dust optical properties, particularly at these wavelengths, is essential for improving calculations of dust radiative impact.

How to cite: Gómez Maqueo Anaya, S., Althausen, D., Hofer, J., Haarig, M., Wandinger, U., Heinold, B., Tegen, I., Faust, M., Baars, H., Ansmann, A., Engelmann, R., Skupin, A., Hesse, B., and Schepanski, K.: Is there a link between modelled mineral dust hematite content and lidar measured intensive optical properties?, EGU General Assembly 2025, Vienna, Austria, 27 Apr–2 May 2025, EGU25-20931, https://doi.org/10.5194/egusphere-egu25-20931, 2025.

EGU25-1470 | Orals | CL4.15

Novel and skilful ocean-based predictors for European hydro-meteorological extremes 

Amulya Chevuturi, Marilena Oltmanns, Isaac Abbott, Wilson Chan, Eugene Magee, Maliko Tanguy, Sergio Vicente Serrano, Dhais Peña Angulo, Cecilia Svensson, Ben Harvey, Bentje Brauns, John Bloomfield, and Jamie Hannaford

With anticipated changes in future hydrological extremes over Europe, it is important to better understand their underlying drivers for ultimately improving their forecasting. Previous studies have demonstrated a significant influence of the North Atlantic Ocean on European climate. Building on this, we identify novel North Atlantic Sea surface temperature (SST) indicators that are linked to meteorological and hydrological extremes across various European catchments at long lead times. We evaluate predictor-predictand relationships by assessing the concurrent and lagged statistical links between European hydro-climate variables (e.g., precipitation, evaporation, temperature, streamflow and groundwater levels) with North Atlantic SST indicators. These SST indicators are associated with events that increase freshwater input into the ocean, leading to subsequent shifts in key ocean currents. Combining observations and theory, we trace the associated teleconnection pathways from North Atlantic Ocean changes to atmospheric dynamics influencing the North Atlantic Jet Stream, ultimately impacting the European hydroclimate that can account for the statistical links. Our findings reveal that these North Atlantic SST patterns exert varying influences on the Scandinavian regions, central western Europe and Iberian Peninsula at one-to-two years lead time. Our research therefore has significant potential in practical applications for advancing forecasting of extremes and early warning systems through the identification of novel and skilful predictors, which can contribute to the mitigation of risks associated with hydro-meteorological extremes.

How to cite: Chevuturi, A., Oltmanns, M., Abbott, I., Chan, W., Magee, E., Tanguy, M., Vicente Serrano, S., Peña Angulo, D., Svensson, C., Harvey, B., Brauns, B., Bloomfield, J., and Hannaford, J.: Novel and skilful ocean-based predictors for European hydro-meteorological extremes, EGU General Assembly 2025, Vienna, Austria, 27 Apr–2 May 2025, EGU25-1470, https://doi.org/10.5194/egusphere-egu25-1470, 2025.

EGU25-1901 | ECS | Posters on site | CL4.15

A Climatology of Northern Hemisphere Cold Surge 

Wenling Cui, Lin Wang, and Meng Gao

Cold surges, or cold waves, are extreme weather events marked by abrupt drops in surface temperature and strong winds, making them some of the most impactful and concerning phenomena. Unlike cold air outbreaks, which are defined solely by sustained low temperatures, cold surges are characterized by both significant temperature drops and low temperatures. These events can severely disrupt societal activities, posing serious threats to human health, agricultural production, and economic stability. Despite their importance, there is no universally accepted definition of cold surges, and their tracks are often inferred indirectly, using proxies such as the movement of the Siberian High or air particle trajectories. In this study, we propose a unified definition of cold surges and introduce a novel method for their automatic identification and tracking. This algorithm detects cold surges and provides characteristics such as affected areas, duration, temperature drop, and temperature anomalies. Using this method, a Northern Hemisphere cold surge climatology is obtained.Based on the distribution of the frequency of affected areas, the entire Northern Hemisphere is divided into four regions: (1) Africa-Eurasia (AF-EA) ;(2) Pacific Ocean (PO);(3) North America (NA);(4) Atlantic Ocean (AtlO).The characteristics of cold surges in the Northern Hemisphere and these four regions are described. The frequency of cold surges in the Northern Hemisphere shows an increasing trend before 1970 and a decreasing trend after 1970, which is also observed in AF-EA, PO, NA, and AtlO. The duration shows a decreasing trend in the Northern Hemisphere and all four regions. The mean 24-hour temperature drop and the maximum 24-hour temperature show a slight negative (positive) trend in the Northern Hemisphere, AF-EA, and NA (AtlO). The mean and maximum temperature anomalies show a positive trend in the Northern Hemisphere, AF-EA, AtlO, and PO.

How to cite: Cui, W., Wang, L., and Gao, M.: A Climatology of Northern Hemisphere Cold Surge, EGU General Assembly 2025, Vienna, Austria, 27 Apr–2 May 2025, EGU25-1901, https://doi.org/10.5194/egusphere-egu25-1901, 2025.

EGU25-1955 | Posters on site | CL4.15

Characterizing the local and global climatic factors associated with vegetation dynamics in the karst region of southwest China 

Azfar Hussain, Jianhua Cao, Haider Abbas, Ishtiaq Hussain, Jinxing Zhou, Hui Yang, Abolfazl Rezaei, Qukan Luo, Waheed Ullah, and Zhong Liang

Understanding the relationship between vegetation and climatic drivers is essential for assessing terrestrial ecosystem patterns and managing future vegetation dynamics. This study examines the effects of local climatic factors and remote large-scale ocean–atmosphere circulations from the Pacific, Atlantic, and Arctic Oceans, as well as the East Asian and Indian summer monsoons, on the spatiotemporal variability of the Normalized Difference Vegetation Index (NDVI) in the karst region of southwest China (KRSC) using Mann-Kendall test, Sen’s slope, cross-correlation, and wavelet analysis. We observed a significant increase in NDVI over karst and non-karst regions from 1981 to 2019, with a notable abrupt shift from 2001 onwards, underscoring the importance of understanding the underlying drivers. The significant correlation and coherence of surface air (TMP) and soil temperatures (ST) with NDVI, especially when analyzed using wavelet methods, indicate their crucial role in vegetation dynamics. Additionally, the broad coherence patterns of AMO and WHWP with NDVI at annual and decadal cycles suggest that ocean–atmosphere interactions also play a significant part. At interannual periodicities, most large-scale indices displayed significant coherence with NDVI. These findings highlight the complexity of NDVI variability, which is better explained by the integration of multiple local and global factors rather than by single variables. The integrated local–global drivers, particularly TMP-ST-AMO-NP-WHWP and PCP-SM-AMO-NP-WHWP, with mean coherence of 0.90 and 0.89, respectively, showed the highest mean coherence, emphasizing the need for a multifaceted approach in understanding vegetation changes rather than a single local variable or atmospheric circulation index. These findings have significant implications for policy-makers, aiding in better planning and policy formulations considering climate change and atmospheric variability.

How to cite: Hussain, A., Cao, J., Abbas, H., Hussain, I., Zhou, J., Yang, H., Rezaei, A., Luo, Q., Ullah, W., and Liang, Z.: Characterizing the local and global climatic factors associated with vegetation dynamics in the karst region of southwest China, EGU General Assembly 2025, Vienna, Austria, 27 Apr–2 May 2025, EGU25-1955, https://doi.org/10.5194/egusphere-egu25-1955, 2025.

Eurasia is a sensitive and high-risk region for global climate changes, where climate anomalies significantly influence natural ecosystems, human health, and economic development. The North Atlantic tripole (NAT) sea surface temperature anomaly is crucial to interannual precipitation variations in Eurasia. Several studies have focused on the link between the NAT and climate anomalies in winter and spring. However, the mechanism by which the summer NAT impacts climate anomalies in Eurasia remains unclear. This study examines how the NAT impacts interannual variations of summer precipitation in mid–high-latitude Eurasia. Precipitation variations are associated with the atmospheric teleconnection triggered by the NAT. When the NAT is in its positive phase, the anomalous atmospheric diabatic heating over the North Atlantic excites an equivalent-barotropic Rossby wave train response that propagates eastward toward Eurasia, resulting in atmospheric circulation anomalies over the region. The combined effects of atmospheric circulation, radiative forcing, and water vapor transport anomalies lead to decreased precipitation across northern Europe and central Eurasia, with higher precipitation anomalies over northeast Asia. Finally, numerical experiments verify that the summer NAT excites atmospheric teleconnections propagating downstream, affecting precipitation anomalies in mid–high-latitude Eurasia. This study provides a scientific basis for predicting Eurasian summer precipitation and strengthening disaster management strategies.

How to cite: shangling, C. and haipeng, Y.: Impact of Summer North Atlantic Sea Surface Temperature Tripole on Precipitation over Mid–High-Latitude Eurasia, EGU General Assembly 2025, Vienna, Austria, 27 Apr–2 May 2025, EGU25-2349, https://doi.org/10.5194/egusphere-egu25-2349, 2025.

Under the backdrop of global warming, heat events have become increasingly frequent and have garnered significant attention.  Northwest China, situated in the drylands of central Eurasia, exhibits a climate and ecological environment that is particularly vulnerable to global warming compared to other regions.  Over the past few decades, the frequency of heat waves in Northwest China has markedly increased, yet their underlying causes remain unclear.  Our research indicates that heat events in Northwest China are closely associated with the Silk Road teleconnection Pattern (SRP), where the occurrence of heat waves frequently corresponds to the strongly positive phase of SRP.  Furthermore, using the Linear baroclinic model, we determined that the wave source of SRP originates from the North Atlantic Ocean.  To explore the possible mechanism, we selected an extreme heat event in Northwest China in 2021 as a typical case study.  The regressed circulation fields to daily SRP were highly consistent with the anomalies observed during July 9–22, 2021, suggesting that the diurnal propagation of SRP modulates the circulation anomaly associated with the heat wave event.  Diabatic heating influenced by SRP was identified as the primary factor contributing to the thermal low over Northwest China.  Specifically, diabatic heating in the lower troposphere was intensified due to enhanced downward shortwave radiation and surface sensible heat flux, accompanied by strong descending motions and reduced cloud cover induced by an anticyclone guided by SRP over Northwest China.  This study enhances our understanding and confidence regarding the effects of large-scale circulation on local temperature anomalies in mid-latitudes.

How to cite: Zhou, J. and Yu, H.: Extreme heat event over Northwest China driven by Silk Road Pattern and its possible mechanism , EGU General Assembly 2025, Vienna, Austria, 27 Apr–2 May 2025, EGU25-2359, https://doi.org/10.5194/egusphere-egu25-2359, 2025.

EGU25-2653 | Orals | CL4.15

QBO modulation of MJO teleconnections in the North Pacific 

seok-woo son, Min-Jee Kang, and Hera Kim

This study examines the influence of the Quasi-Biennial Oscillation (QBO) on the Madden-Julian Oscillation (MJO) teleconnections in the North Pacific using ERA5 data. It is found that the Rossby wave trains induced by MJO phase 6–7 exhibit greater strength and robustness during the westerly QBO winter (WQBO) than during the easterly QBO winter (EQBO), although the MJO itself is weaker during the former. This counter-intuitive dependency of MJO teleconnections on the QBO is attributed to the preexisting MJO teleconnections prior to the MJO phase 6–7. The MJO phase 6–7 is more frequently preceded by stronger MJO phase 3–4 during the EQBO than during the WQBO. The preceding MJO phase 3–4 teleconnections, which have opposed signs to the MJO phase 6–7 teleconnections, result in a considerable attenuation of the MJO phase 6–7 teleconnections by destructive interference. This result is supported by linear model experiments. The subseasonal-to-seasonal prediction models also indicate improved prediction skills of MJO phase 6–7 teleconnections during the WQBO compared to the EQBO. These results suggest that enhanced MJO activities during the EQBO do not necessarily result in stronger and more robust MJO teleconnections in the North Pacific.

How to cite: son, S., Kang, M.-J., and Kim, H.: QBO modulation of MJO teleconnections in the North Pacific, EGU General Assembly 2025, Vienna, Austria, 27 Apr–2 May 2025, EGU25-2653, https://doi.org/10.5194/egusphere-egu25-2653, 2025.

The weakening of the Atlantic Meridional Overturning Circulation (AMOC) leads to a distinct horseshoe pattern of colder sea surface temperatures (SST) anomalies in the North Atlantic as found in many modeling studies. This SST horseshoe pattern is a characteristic feature of the Atlantic extratropical-tropical teleconnection leading to the tropical atmospheric response associated with the AMOC weakening, such as the southward shift of the Atlantic Intertropical Convergence Zone (ITCZ). A similar SST horseshoe pattern associated with the Atlantic Multidecadal variability (AMV) has also been observed in modern climate, with the SST anomalies propagating from the extratropical North Atlantic into the tropical North Atlantic along the horseshoe pathway. Despite its importance, the mechanisms of the Atlantic extratropical-tropical teleconnection associated with the AMOC weakening remain poorly understood. Previous studies suggest the Wind-Evaporation-SST (WES) feedback as a plausible mechanism. Here, we conduct water hosing experiments using a high-resolution fully coupled climate model to elucidate the mechanisms responsible for the Atlantic extratropical-tropical teleconnection associated with the AMOC weakening. Our analysis, focusing on boreal summer, suggests that the WES feedback is not the primary mechanism for the Atlantic extratropical-tropical teleconnection. By examining the transient response as the AMOC weakens, we identify the key mechanisms responsible and reveal the important role of the oceanic and atmospheric circulations involved in the SST horseshoe pattern formation. We also illustrate how the relative importance of the oceanic and atmospheric processes in the Atlantic extratropical-tropical teleconnection changes under different amplitudes of the freshwater forcing applied in the water hosing experiments. The mechanisms of the Atlantic extratropical-tropical teleconnection are crucial for the development of the tropical atmospheric response associated with the AMOC weakening (e.g. the southward shift of the Atlantic ITCZ).

How to cite: Joshi, R. and Zhang, R.: On the Atlantic extratropical-tropical teleconnection in response to external freshwater forcing, EGU General Assembly 2025, Vienna, Austria, 27 Apr–2 May 2025, EGU25-3376, https://doi.org/10.5194/egusphere-egu25-3376, 2025.

EGU25-4983 | ECS | Posters on site | CL4.15

Silk Road Pattern on the Intraseasonal Time Scale 

Qianting Yuan and Riyu Lu

Based on reanalysis data from 1968 to 2021, this study investigates the characteristics of Silk Road Pattern (SRP), a teleconnection pattern embedded in the Asian jet during summer, on the intraseasonal timescale. Results showed that the 10–30-day oscillations are the main component of SRP intraseasonal variability. The results of correlation for the base points along the jet axis indicate that the SRP on the 10–30-day timescale, hereafter referred to as the Bi-weekly Silk Road Pattern Oscillation (BSRP), is characterized by 3 alternatively-signed cells of 200-hPa meridional wind anomalies. The teleconnection patterns are highly consistent, no matter with the location of base points, suggesting that the BSRP is not geographically phase-locked, i.e., the BSRP has no preferred locations in the zonal direction, which is quite different with the SRP on the interannual timescale. Therefore, we “merge” the teleconnection patterns for the various base points into a composite pattern, and analyze the composite pattern to highlight the common features. The analyzed results demonstrate that the BSRP propagates eastwards of, and the speed of energy dispersion is estimated to be approximately 25° per day. In addition, the SRP obtains energy from the basic flows through the baroclinic energy conversion. On the other hand, barotropic energy conversion is weak and shows little variation with the change of longitude, failing to contribute to phase locking. Finally, we also explored the climatic impact of BSRP and found that the BSRP can induce remarkable precipitation and temperature anomalies.

How to cite: Yuan, Q. and Lu, R.: Silk Road Pattern on the Intraseasonal Time Scale, EGU General Assembly 2025, Vienna, Austria, 27 Apr–2 May 2025, EGU25-4983, https://doi.org/10.5194/egusphere-egu25-4983, 2025.

The summer North Atlantic Oscillation (SNAO) has been shown to exert a significant influence on downstream climate anomalies, primarily via the Silk Road teleconnection pattern (SRP). However, the linkage between the SNAO and the SRP is not consistently robust, and the SNAO does not invariably excite the SRP. The SRP itself is an upper-tropospheric teleconnection pattern traveling along the midlatitude Asian westerly jet, characterized by alternating southerly and northerly wind anomalies. In this study, we focus on the considerable variability of the SNAO’s southern branch and categorize the interannual SNAO–SRP relationship into two categories: a strongly linked category and a weakly linked category. Our results indicate that, under the strongly linked category, the SNAO’s southern branch retracts westward toward the Baltic Sea, whereas under the weakly linked category, it extends eastward beyond the Ural Mountains. When the southern branch retracts westward, a pronounced negative precipitation anomaly over Europe induces upper-level convergence, producing a strong positive Rossby wave source (RWS) anomaly, which effectively excites the downstream SRP wave train. In contrast, when the southern branch extends eastward, this process does not hold. These findings link the morphology of the SNAO to its capability to initiate the SRP, offering new insights into how the SNAO exerts remote impacts.

How to cite: Yuanxin, G., Riyu, L., and Xiaowei, H.: What type of summer North Atlantic Oscillation will trigger the downstream Silk Road teleconnection pattern, and how?, EGU General Assembly 2025, Vienna, Austria, 27 Apr–2 May 2025, EGU25-5054, https://doi.org/10.5194/egusphere-egu25-5054, 2025.

The Pacific Northwest experienced a record-breaking heatwave during the summer of 2021, resulting in significant adverse effects on both human society and ecosystems. This event was so extreme and shattered previous temperature records by an astounding 5 ℃, highlighting the need for a comprehensive understanding of the underlying physical mechanisms. In this study, we employ a hierarchical approach with increasing complexity to demonstrate that the Asian summer monsoon, when accounting for all relevant convective activities, contributed to suppressing the intensity of this event. Without the variability of the Asian summer monsoon, the heatwave's amplitude is estimated to be approximately 0.4°C (3%-4%) greater than the already extraordinary observed amplitude. Since this extreme event occurred against a context of imperfect synchronization among climate systems, it serves as a warning that even more intense heatwave is likely to occur in the future even if global warming remains at current levels.

How to cite: Xu, P.: The 2021 Pacific Northwest heatwave would have been more severe without the influence of Asian summer monsoon, EGU General Assembly 2025, Vienna, Austria, 27 Apr–2 May 2025, EGU25-5081, https://doi.org/10.5194/egusphere-egu25-5081, 2025.

EGU25-5192 | Posters on site | CL4.15

Epoch-based Sea Surface Temperature for Climate System Analysis 

Robert Grumbine

Taking the principle that climate is what one expects, I suggest and illustrate with Sea Surface Temperature (SST) that it is desirable to represent the climatology as linear in time with the first few (3, it turns out) harmonics of the annual cycle. In many regions of the globe the trend is physically and statistically significant. We also expect the seasonal cycle to continue, though amplitude and phase of the harmonics do change — themselves matters of direct interest in climatology. In representing the SST climatology this way, rather than the common average over each month or for each day independently, the approach is similar to how slowly varying terms in astronomy, such as the earth’s eccentricity, are represented by an Epoch (date for time 0) and adjustments for secular changes while moving away in time.  

The Epoch-based climatology approach is shown in comparison to the traditional by developing a 30 year climatology for each and examining the departure from each climatology of the next 10 years observations. The Epoch climatology has markedly reduced anomalies compared to the traditional. A further comparison is to examine the autocorrelation of the anomalies in time. The traditional climatology has inflated times, including excess autocorrelation at annual time scale, meaning that there were things we could and should expect but which are not captured by that approach.

How to cite: Grumbine, R.: Epoch-based Sea Surface Temperature for Climate System Analysis, EGU General Assembly 2025, Vienna, Austria, 27 Apr–2 May 2025, EGU25-5192, https://doi.org/10.5194/egusphere-egu25-5192, 2025.

EGU25-5659 | ECS | Posters on site | CL4.15

StoryPy: A Python-based package to compute climate storylines 

Richard Alawode, Julia Mindlin, and Marlene Kretschmer

Dynamical storylines explore qualitatively different changes in climate driven by forced responses
in large-scale remote drivers, such as Arctic Amplification, tropical amplification, and the stratospheric
polar vortex. This approach helps address uncertainties in regional climate responses by using physical
understanding to link large-scale thermodynamic and dynamic climate responses to regional impacts and
present a small set of projections in a conditional way. By contextualizing events within broader climate
patterns, dynamical storylines aim to deepen understanding of the uncertainties associated with climate
change, particularly in relation to polar, tropical, and global warming.


Our project aims to make this advanced methodology accessible to a broader audience through a
user-friendly Python package and an intuitive interface. Our package, termed StoryPy, provides
a set of functions to analyze multi-model ensembles by focusing on the identification of dynamical
storylines. With customizable options for selecting remote drivers, target seasons, and climate variables
or climatic-impact drivers, the StoryPy provides flexibility and adaptability for various research
and policy applications. In this work we show the usability of the tool by applying it to the case of the
Mediterranean region and analyze regional climate uncertainty associated with drivers including Arctic
Amplification and the Stratospheric polar vortex.


By facilitating the technical complexity of identifying coherent narratives that bridge the gap between
complex climate dynamics and specific, actionable impacts, our hope is that in the long-run this tools
helps to facilitate dialogue among scientists, policymakers, and diverse stakeholder communities.

How to cite: Alawode, R., Mindlin, J., and Kretschmer, M.: StoryPy: A Python-based package to compute climate storylines, EGU General Assembly 2025, Vienna, Austria, 27 Apr–2 May 2025, EGU25-5659, https://doi.org/10.5194/egusphere-egu25-5659, 2025.

EGU25-5732 | ECS | Posters on site | CL4.15

Diverse Response of Western North Pacific Anticyclone to Fast-Decay El Niño During Decaying Summer 

Leishan Jiang, Han-Ching Chen, Tim Li, and Lin Chen

Previous studies suggested that fast-decay El Niño events are more favorable in generating the western North Pacific anticyclone (WNPAC) in the decaying summer. However, we found that this is not the case for all fast-decay El Niño events. By comparing two groups of fast-decay El Niño events with significant and insignificant WNPAC in the following summer, we found that the westward extension of the equatorial Pacific cold sea surface temperature anomalies (SSTA) and the subtropical central-north Pacific cold SSTA play important roles in the generation and intensification of the WNPAC during decaying summer. Further analyses indicated that the internal atmospheric mode—North Pacific Oscillation during boreal spring can affect the formation of the cold SSTA over the subtropical central-north Pacific and the westward extension of the equatorial Pacific cold SSTA during summer. Additional effects of tropical Indian and Atlantic forcing on the maintenance of the WNPAC are also shown.

How to cite: Jiang, L., Chen, H.-C., Li, T., and Chen, L.: Diverse Response of Western North Pacific Anticyclone to Fast-Decay El Niño During Decaying Summer, EGU General Assembly 2025, Vienna, Austria, 27 Apr–2 May 2025, EGU25-5732, https://doi.org/10.5194/egusphere-egu25-5732, 2025.

The equatorial Atlantic (EA) sea surface temperature anomalies (SSTA) exhibit significant interannual variability, typically peaking during the boreal summer months of May to August. In this study, we utilize an extended recharge-discharge oscillator (RO) model, considering both coupled Atlantic ocean-atmosphere interactions and the remote influence of Pacific ENSO forcing, to explore the dynamics of EA SSTA seasonality. Our results demonstrate that this extended RO model captures the temporal characteristics of EA SSTA well, especially its seasonal variation. Further analysis suggests that the seasonality of EA SSTA is primarily governed by the seasonal modulation of the EA SSTA growth rate, characterized by a robust seasonal cycle transitioning from positive to negative during boreal summer. In contrast, the EA SSTA phase transition rate and the ENSO forcing coefficient contribute relatively little to the seasonal preference of EA SSTA. In most climate models, EA SSTA also shows a tendency to peak during the boreal summer; however, the seasonal preference is significantly weaker compared to observations. This weaker preference in climate models primarily results from the smaller contribution of the EA SSTA growth rate, which is mainly due to the lower (more negative) annual mean of the growth rate and secondarily due to the weaker seasonal cycle amplitude of the growth rate.

How to cite: Chen, H.-C., Cai, Z., Ge, W., and Jiang, L.: Exploring the Seasonal Characteristics of the Equatorial Atlantic SSTA: Insights from an Extended Recharge-Discharge Oscillator Framework, EGU General Assembly 2025, Vienna, Austria, 27 Apr–2 May 2025, EGU25-7889, https://doi.org/10.5194/egusphere-egu25-7889, 2025.

Teleconnections are crucial in shaping climate variability and regional climate change. The fidelity of teleconnections in climate models is important for reliable climate projections. As the observed sample size is limited, scientific judgment is required when models disagree with observed teleconnections. We illustrate this using the example of the relationship between El Ni.o‐Southern Oscillation (ENSO) and the northern stratospheric polar vortex (SPV), where the MIROC6 large ensemble exhibits an ENSO‐SPV correlation opposite in sign to observations. Yet the model well captures the upward planetary‐wave propagation pathway through which ENSO is known to affect the SPV. We show that the discrepancy arises from the model showing an additional linkage related to horizontal stratospheric wave propagation. Observations do not provide strong statistical evidence for or against the existence of this linkage. Thus, depending on the research purpose, a choice has to be made in how to use the model simulations. Under the assumption that the additional linkage is spurious, a physically‐based bias adjustment is applied to the SPV, which effectively aligns the modeled ENSO-SPV relationship with the observations, and thereby removes the model‐observations discrepancy in the surface air temperature response. However, if one believed that the additional linkage was genuine and was undersampled in the observations, a different approach could be taken. Our study emphasizes that caution is needed when concluding that a model is not suitable for studying teleconnections. We propose a forensic approach and argue that it helps to better understand model performance and utilize climate model data more effectively.

How to cite: Shen, X., Kretschmer, M., and Shepherd, T. G.: A Forensic Investigation of Climate Model Biases inTeleconnections: The Case of the Relationship BetweenENSO and the Northern Stratospheric Polar Vortex, EGU General Assembly 2025, Vienna, Austria, 27 Apr–2 May 2025, EGU25-9462, https://doi.org/10.5194/egusphere-egu25-9462, 2025.

Probabilistic lagged dependence (ranging from months to seasons) between atmospheric-oceanic variables, comes essentially from their linear and nonlinear statistical multivariate correlations. A new technique is presented to estimate the posterior conditional pdf of a scalar predictand y(t+lag) at lag tau, knowing a vector of predictor climatic indices X(t), taken at time t. For that, we apply a variant of the Kernel Canonical Correlation Analysis (KCCA) linking extended feature vectors f(Y) and g(X), filled with nonlinear and mixing functions (e.g. monomials, component products). The issued, leading canonical component pair (u,v) is then used to estimate the copula between X and Y, estimated as the Gaussian copula between Gaussian-anamorphed components ug, vg of u,v respectively. This copula works as a maximum-entropy copula, maximizing the Gaussian correlation Cor-g (Pearson correlation between ug, vg), captured by the feature vectors, and also maximizing the part  -0.5*log(1-cor-g^2) of the mutual information (MI) between X and Y. Moreover, Cor-g is much more outlier-resistant than the Pearson correlation. The above method is applied in two cases: 1) Y being a climatic index, (e.g. El-Niño index with lags tau in the range 0-48 months) and 2) Y being the local monthly temperature or precipitation for lags of 1-2 months. In both cases, X is taken as a set of climatic indices from the pool: El-Niño, NAO, AMO, PDO, IOD; QBO, TNA, TSA, SCAND, WE, EA-WR. The Gaussian-copula model improves the forecast of extreme situations, even beyond 1-2 standard deviations, providing a way of exploring probabilistic nonlinear forecasts and nonlinear lagged teleconnections. This work is supported by the Portuguese Fundação para a Ciência e Tecnologia, FCT, I.P./MCTES through national funds (PIDDAC): UID/50019/2025 and LA/P/0068/2020 https://doi.org/10.54499/LA/P/0068/2020).

How to cite: Pires, C., Hannachi, A., and Vannitsem, S.: Estimation of probabilistic copulas from nonlinear correlations: Application to lagged teleconnections and monthly atmospheric forecasting., EGU General Assembly 2025, Vienna, Austria, 27 Apr–2 May 2025, EGU25-11798, https://doi.org/10.5194/egusphere-egu25-11798, 2025.

EGU25-13940 | ECS | Posters on site | CL4.15

Creating a Database of Climate Extremes and Variability in Polar Ice Cores 

Brooke M. Chase, Tyler R. Jones, Bradley R. Markle, Valerie Morris, Rhys-Jasper León, Kevin S. Rozmiarek, Ella H. Johnson, Adira Lunken, Tirso Jesús Lara Rivas, and Bruce H. Vaughn

Prior results from EGRIP (East Greenland Icesheet Project ice core) indicate that interannual-to-decadal variability in water isotopes lead abrupt Dansgaard-Oeschger event (D-O Events) warming by hundreds of years. As part of the U.S. National Science Foundation funded “Beyond Mean Climate” project, GISP2 (Greenland Ice Sheet Project 2 ice core) is being resampled at the NSF-Ice Core Facility and reanalyzed for high resolution water isotope measurements at INSTAAR, University of Colorado. GISP2 gives us the chance to verify those results from EGRIP and test whether the lead-lag may result from firn processes and diffusion, or from regional climate dynamics. Additionally, for part of this project we are creating a statistical database of climate variability and extremes in multiple Greenland and Antarctic ice cores. This database will include GISP2 and existing records of high-resolution water isotopes and impurities. The initial statistical database of climate indicators will include the mean, standard deviation, extreme values using the tail ends of probability distributions, and spectral analysis to determine the average amplitude in a given frequency band. We will present initial results on the first section of processed data from GISP2, as well as results from WDC (West Antarctic Ice Sheet Divide ice core), SPC (South Pole ice core), and EGRIP (East Greenland Icesheet Project ice core). In particular, we will focus on how the strength of interannual-to-decadal variability is different across geographies (Greenland, Antarctica, interhemispheric), analyze lead-lag between mean temperature and variability (e.g. for D-O Events in Greenland and their Antarctic counterparts, Antarctic Isotope Maxima (AIM) Events), and compare results across the deglaciation.

How to cite: Chase, B. M., Jones, T. R., Markle, B. R., Morris, V., León, R.-J., Rozmiarek, K. S., Johnson, E. H., Lunken, A., Rivas, T. J. L., and Vaughn, B. H.: Creating a Database of Climate Extremes and Variability in Polar Ice Cores, EGU General Assembly 2025, Vienna, Austria, 27 Apr–2 May 2025, EGU25-13940, https://doi.org/10.5194/egusphere-egu25-13940, 2025.

EGU25-16218 | Orals | CL4.15

Observed global response of ocean stratification to climatic forcing 

Raquel Somavilla, Alberto Naveira-Garabato, Cesar González-Pola, Julio M. Fernández-Diaz, and Ignasi Vallès

The global ocean plays a pivotal role in climate by taking up, storing and redistributing vast amounts of heat, carbon and other tracers. A fundamental factor shaping this role is the ocean’s stratification, which accounts for the resistance of a water column to be mixed vertically. As such, stratification modulates the transfer of climatically important properties (e.g., heat, carbon, oxygen and nutrients) between deeper oceanic layers and near-surface waters, which are in frequent contact with the atmosphere and may thus interact with the rest of the climate system.

It has traditionally been assumed that beyond the deepest extent of surface mixing in winter, ocean stratification remains approximately constant or evolves very slowly on the interannual and longer time scales of pertinence to contemporary climate variability – comprising both internal and anthropogenic changes imprinted on the historical record. As a result, most research efforts to document or understand ocean stratification and its climatic function have, to date, primarily focused on near-surface waters. Deeper in the water column, little is known about the extent to (or time scales over) which the stratification of the main pycnocline, extending to depths in excess of 1000 m, is influenced by climate variability.

Here, we test this view by performing the first global-scale, systematic investigation of the spatio-temporal variability of ocean stratification from the surface to the main pycnocline, using 20 years (2003-2022) of data from the Argo float array. We demonstrate that deep-ocean stratification varies significantly with well-defined spatio-temporal patterns. Both near-surface and main pycnocline stratifications are found to exhibit spatially-structured, vertically-coherent, global-scale variations on seasonal-to-decadal time scales, unveiling a new view of ocean stratification from surface to depth as a rapidly-evolving, readily-interactive element of the climate system. Variability in stratification is organized into well-defined patterns that replicate the spatial footprints and time scales of major climate modes such as the El Niño – Southern Oscillation, pointing to these modes of internal variability as important drivers of stratification changes. Our diagnosed patterns and forcings of stratification variability provide an important benchmark for advancing the climate models used to understand and predict the ongoing climate change.

How to cite: Somavilla, R., Naveira-Garabato, A., González-Pola, C., Fernández-Diaz, J. M., and Vallès, I.: Observed global response of ocean stratification to climatic forcing, EGU General Assembly 2025, Vienna, Austria, 27 Apr–2 May 2025, EGU25-16218, https://doi.org/10.5194/egusphere-egu25-16218, 2025.

EGU25-18859 | ECS | Orals | CL4.15

Tropical Teleconnections with Summer Temperature Anomalies in the Eastern Mediterranean 

Elizur Berkovitch, Chaim Garfinkel, and Assaf Hochman

The warming trend in the Eastern Mediterranean summer is faster than the global average. Climate projections indicate that this accelerated summer warming will persist in the coming decades. As the region continues to warm, the likelihood of summer months with extreme temperatures will increase, posing significant societal challenges. Understanding the mechanisms driving summer temperatures in the region is crucial for improving regional climate projections and medium-range weather predictability. This study explores the potential link between the African Monsoon and Eastern Mediterranean summer temperatures. ERA5 reanalysis data, at 0.25° horizontal resolution, were analyzed to examine correlations between the two regions and identify possible connecting mechanisms. Additionally, simulations from the Large Ensemble Single Forcing Model Intercomparison Project (LESFMIP) were utilized to isolate potential explanations for the teleconnection. These simulations also demonstrate that this link exists on both decadal and monthly scales. A significant correlation was identified between Sahel Monsoon activity and Eastern Mediterranean summer temperatures. Wetter summer months in the Sahel were associated with warmer conditions in the Eastern Mediterranean. The dynamic patterns observed during warm summers in the Eastern Mediterranean resemble those during anomalously wet Sahel summers. A poleward shift of the Saharan Heat Low, linked to increased Sahel precipitation, appears to drive circulation changes associated with warmer Eastern Mediterranean summers. Several proposed mechanisms could explain this link, although their validity requires further investigation. Understanding this correlation could enhance regional climate change projections and improve medium-range predictions of extreme weather events in both the Sahel and the Eastern Mediterranean.

How to cite: Berkovitch, E., Garfinkel, C., and Hochman, A.: Tropical Teleconnections with Summer Temperature Anomalies in the Eastern Mediterranean, EGU General Assembly 2025, Vienna, Austria, 27 Apr–2 May 2025, EGU25-18859, https://doi.org/10.5194/egusphere-egu25-18859, 2025.

EGU25-18886 | ECS | Orals | CL4.15

Disentangling reduced representations of teleconnections using variational autoencoders 

Fiona Spuler, Marlene Kretschmer, Magdalena Alonso Balmaseda, Yevgeniya Kovalchuk, and Theodore G. Shepherd

Studying teleconnections using data-driven methods relies on identifying suitable representations of the relevant dynamical processes involved. Often, these representations are identified through a dimensionality reduction of the dynamical process itself, such as the Niño3.4 index to represent the El-Niño Southern Oscillation or the clustering of circulation regimes to represent states of the North Atlantic eddy-driven jet. The relationship between these representations can subsequently be assessed in a causal model. However, since these representations are identified independently of the teleconnection studied, they do not necessarily capture the dynamical processes relevant for explaining the relationship between the two phenomena. Here, we present a regularised dimensionality reduction approach using variational autoencoders, a deep generative machine learning method, to identify reduced representations of large-scale processes and their teleconnections jointly in a causal framework. Applying the approach to study regional dynamical drivers of precipitation extremes over Morocco at subseasonal lead times, we show that the method is able to identify a representation of the circulation over the North Atlantic, which disentangles the drivers of precipitation over Morocco while maintaining its subseasonal predictability and physical interpretability. Furthermore, we demonstrate the ability of the approach to disentangle large-scale teleconnections at longer lead times.

How to cite: Spuler, F., Kretschmer, M., Balmaseda, M. A., Kovalchuk, Y., and Shepherd, T. G.: Disentangling reduced representations of teleconnections using variational autoencoders, EGU General Assembly 2025, Vienna, Austria, 27 Apr–2 May 2025, EGU25-18886, https://doi.org/10.5194/egusphere-egu25-18886, 2025.

EGU25-113 | ECS | Orals | CL4.17

Sea level  variations at the world coastlines over the past two decades from reprocessed satellite altimetry 

Lancelot Leclercq, Anny Cazenave, Fabien Léger, Florence Birol, Fernando Nino, and Jean-François Legeais

In the context of the ESA Climate Change Initiative Sea Level project, we performed a complete reprocessing of high resolution (20 Hz, i.e., 350m) along-track altimetry data of the Jason-1, Jason-2 and Jason-3 missions over January 2002 to June 2021 in the world coastal zones. This reprocessing provides along-track sea level time series and associated trends from the coast to 50 km offshore over the study period. We call ‘virtual coastal stations’ the closest along-track point to the coast. This creates a new network of 1160 virtual sites well distributed along the world coastlines. We performed Empirical Orthogonal Decomposition analyses of the sea level time series at the virtual stations, globally and regionally, in order to: (1) identify the main drivers of the coastal sea level variability at interannual time scale, and (2) assess the along-coast coherence of the sea level response to the dominant drivers. The results highlight those coastlines where the EOF first mode reveals a dominant long-term coastal sea level rise They also help in identifying other regions where the coastal sea level is dominated interannual variations, highly correlated to natural climate modes. This analysis allows us to clearly separate portions of the world coastlines displaying different sea level behaviors. In regions where no tide gauge data are available (a large portion of the southern hemisphere), our results provide new information on present day sea level changes at the coast, hopefully useful for coastal adaptation.

How to cite: Leclercq, L., Cazenave, A., Léger, F., Birol, F., Nino, F., and Legeais, J.-F.: Sea level  variations at the world coastlines over the past two decades from reprocessed satellite altimetry, EGU General Assembly 2025, Vienna, Austria, 27 Apr–2 May 2025, EGU25-113, https://doi.org/10.5194/egusphere-egu25-113, 2025.

EGU25-1418 * | Orals | CL4.17 | Highlight

Estimating the cost of sea level rise 

Magnus Hieronymus, Jim Hedfors, Lisa Van Well, Gunnel Göransson, Sebastian Bokhari Irminger, and Åke Magnusson

Sea level rise increases the flood risk in coastal communities throughout the world. Many studies have shown that enormous property values are at risk already this century. In particular under high emission scenarios. Protecting infrastructure from flooding is thus an important objective for coastal spatial planning, and planning activities are ongoing in states, counties and municipalities around the world. Current coastal spatial planning methods are, however, not well tailored for this task. Problems persist in how such plans can incorporate: uncertainties, time dependence and the interplay between sea level rise and sea level extremes. Here we demonstrate how these different components can be incorporated into a joint probabilistic framework, using Monte Carlo methods. A model called the sea level simulator is used together with a cost function that estimates the value of infrastructure as a function of its height above the current mean sea level, giving a comprehensive coupling between physical and economic risk. That is, between high sea levels and economic loss. The end result is a probabilistic estimate of flooding loss conditioned on user-defined emission scenario probabilities. The framework is well fit both as a decision support tool and as a tool for making uncertainty quantifications. The capabilities of the framework are demonstrated using examples from one of Sweden's oldest cities, the city of Kalmar. Examples are given showing how losses and their uncertainty depend on emission scenario, the length of the planning period and thresholds in the cost curve


How to cite: Hieronymus, M., Hedfors, J., Van Well, L., Göransson, G., Bokhari Irminger, S., and Magnusson, Å.: Estimating the cost of sea level rise, EGU General Assembly 2025, Vienna, Austria, 27 Apr–2 May 2025, EGU25-1418, https://doi.org/10.5194/egusphere-egu25-1418, 2025.

EGU25-2624 | Posters on site | CL4.17

What Antarctic sea-level rise estimates to 2050 should be used for decision-making? 

Matt King, Felicity McCormack, and Yucheng Lin

We focus on the Antarctic contribution to sea level by 2050, intending to improve sea-level rise estimates for decadal decision-making purposes. We compare ISMIP6 2100 ice sheet model-derived projections and data-driven estimates from 2015-2050. We find that models divide into two categories of response based on their initialisation approach, with spin-up-style models generally showing little response to forcing (relative to their control) over this period even under a high emissions scenario, while data assimilation models suggest increased change in the Amundsen Sea Embayment and parts of East Antarctica, and accelerating ice loss along the Siple Coast. We suggest a lower surface mass balance in the forced simulations than the control simulations drives an unrealistic mass loss signal in the Amundsen Sea sector in the ISMIP6 projections over 2015-2050. We then focus on the data assimilation models and explore their projection of the dynamic contribution to sea levels by 2050. We complement these with data-driven estimates based on linear or linear-plus-quadratic models fit to gridded satellite altimeter data while also considering natural climate variability that dominates decadal-scale surface mass balance variations. Historical trends (i.e., pre-2015) are not necessarily captured in the ISMIP6 2100 models, partly due to a lack of observational constraints before the satellite record. Hence, we use gridded empirically-derived surface lowering trends combined with the ISMIP6 projected trends, and compare them to the linear and quadratic linear and quadratic empirical extrapolations to 2050. Finally, we explore the differences and sensitivities in sea level fingerprints deriving from these estimates and their potential implications for decision-making processes.

How to cite: King, M., McCormack, F., and Lin, Y.: What Antarctic sea-level rise estimates to 2050 should be used for decision-making?, EGU General Assembly 2025, Vienna, Austria, 27 Apr–2 May 2025, EGU25-2624, https://doi.org/10.5194/egusphere-egu25-2624, 2025.

EGU25-4356 | ECS | Posters on site | CL4.17

Sea-level rise along the North Atlantic coasts since 1900 

Blandine Jacob, Lucia Pineau-Guillou, William Llovel, and Virginie Thierry

The global mean sea-level rise is today well quantified: 1.4 ± 0.1 mm yr-1 over 1901-1993 (based on tide gauge records) and 3.0 ± 0.2 mm y-1 over 1993-2010 (based on satellite altimetry data). However, this rise is not uniform and large departures from the global mean sea-level trend are observed. Given that over 750 million people are living in the low-elevation coastal zone and because sea-level will continue to rise due to climate change, it is crucial to obtain reliable trends at local and regional scale, to design appropriate adaptation policies for the future. In this study, we investigated the North Atlantic sea-level rise over the 20th century along the coasts using tide gauges and climate model outputs from the Coupled Model Intercomparison Project 6 (CMIP6) framework. As climate models do not account for land ice melt, the contribution of ice sheets (Greenland and Antarctica), mountain glaciers and land water storage were added a posteriori. Climate models provide gridded data with a relatively coarse resolution (~1°); whether they correctly simulate sea-level rise at a given point in space is still an open question. We explored the ability of climate models to correctly reproduce the 20th century sea-level trends at the nearest points to tide gauge locations in the North Atlantic ocean over 1900-2014. Based on a multi-member ensemble approach from CMIP6 model outputs, we determine both the externally forced (ensemble mean) and internal variability contribution (ensemble spread) to historical sea-level changes. We showed that the internal variability is higher on the west side of the North Atlantic basin than on the east side. 

How to cite: Jacob, B., Pineau-Guillou, L., Llovel, W., and Thierry, V.: Sea-level rise along the North Atlantic coasts since 1900, EGU General Assembly 2025, Vienna, Austria, 27 Apr–2 May 2025, EGU25-4356, https://doi.org/10.5194/egusphere-egu25-4356, 2025.

EGU25-5094 | Orals | CL4.17

Future Sea-Level Rise in Southeast Asia: New Insights on Uncertainty, Ocean Dynamics, and Extreme Events 

Dhrubajyoti Samanta, Benjamin S. Grandey, Zhi Yang Koh, Lock Yue Chew, and Benjamin P. Horton

Future sea-level rise will generate hazards for coastal populations, economies, and infrastructure in Singapore and Southeast Asia. However, regional projections remain highly uncertain due to complex regional to local factors, including ocean dynamics, and extreme sea-level events. Here, we review our 4-year project funded by Singapore’s National Sea Level Programme, which focused on enhancing the accuracy of regional sea-level rise projections by 2100. Our approach includes: 1) attributing historical sea-level changes to anthropogenic and natural forcings[1]; 2) quantifying drift uncertainty in global climate model simulations[2]; 3) investigating tide-surge interaction in Singapore and surrounding regions[3]; and 4) addressing ambiguity in sea-level rise projection by fusing multiple projections used in the Intergovernmental Panel on Climate Change 6th Assessment Report (IPCC AR6)[4]. First, using large ensemble climate model simulations we detected and attributed historical (1950–2014) sea-level changes over the Indo-Pacific warm pool region providing insights for future projections. We discovered that the historical rise in sea level is predominantly driven by the influence of greenhouse gases, although aerosols tend to moderate the rate of rise. Notably, the rate of sea-level rise and the time of emergence of anthropogenic signals vary spatially in the region. We also highlight the important role of manometric sea-level changes in shallow and coastal regions in Southeast Asia. Second, we develop a Monte Carlo drift correction technique to quantify uncertainty in drift correction for global climate models, using climate model data. Our findings highlight that drift uncertainty can significantly impact energy balance estimates and sea-level rise, underscoring the need to account for drift uncertainty when analyzing climate model outputs. Third, using a statistical framework, we study tide-surge interaction at seven tide gauges along the coast of Singapore and the east coast of Peninsular Malaysia, focusing on the timing of extreme non-tidal residual relative to tidal high water. We found that tide-surge interaction influences coastal water levels in this region, and our semi-empirical model provides insight into the mechanisms of tidal phase alteration. Finally, we propose a new approach to quantify the best estimate of the scientific uncertainty associated with sea-level rise by fusing the complementary strengths of the ice sheet models and expert elicitations used in IPCC AR6. Under a high-emissions scenario, the very likely range is 0.5–1.9 m. The 95th percentile projection of 1.9 m can inform a high-end storyline, supporting decision-making for activities with low uncertainty tolerance. We plan to use our findings to offer policymakers and coastal planners a robust, high-confidence toolset for long-term adaptation strategies in Singapore and Southeast Asia.


[1] Samanta et al., (2024), https://doi.org/10.1029/2023EF003684

[2] Grandey et al., (2023), https://doi.org/10.5194/gmd-16-6593-2023

[3] Koh et al., (2024), https://doi.org/10.5194/os-20-1495-2024

[4] Grandey et al., (2024), https://doi.org/10.1029/2024EF005295

How to cite: Samanta, D., Grandey, B. S., Koh, Z. Y., Chew, L. Y., and Horton, B. P.: Future Sea-Level Rise in Southeast Asia: New Insights on Uncertainty, Ocean Dynamics, and Extreme Events, EGU General Assembly 2025, Vienna, Austria, 27 Apr–2 May 2025, EGU25-5094, https://doi.org/10.5194/egusphere-egu25-5094, 2025.

EGU25-5300 | ECS | Posters on site | CL4.17

2500 years of late Holocene relative sea-level change at Gress, Isle of Lewis, northwest Scotland 

Khai Ken Leoh, Natasha Barlow, Sue Dawson, Uisdean Nicholson, and Adam Switzer

The late Holocene relative sea-level (RSL) history of Scotland is spatially and temporally variable, as it lies close to the boundaries of the former British-Irish Ice Sheet (BIIS) and within the maximum sea-level fingerprint of Antarctic melt. It is therefore an interesting location to understand the interplay of drivers of RSL and the consequences on rates of change, over centennial to millennial timescales. However, there are few late Holocene RSL records from the region, especially islands offshore of mainland Scotland. Along mid-latitude coastlines, salt-marsh deposits provide ideal archives of late Holocene sea level. In this study, we combine stratigraphy, sedimentology (grain size analysis and loss-on-ignition) and diatom biostratigraphy to reconstruct late Holocene sea level, at a newly studied salt marsh at Gress, on the eastern coastline of the Isle of Lewis in the Outer Hebrides. Rather than the typical quantitative transfer function approach, we instead utilise a qualitative visual assessment method to reconstruct RSL due to poor performance by the UK modern diatom transfer function at this location. By combining 14C dates and Bayesian modelling, we derive a chronological model for the core to assess the timing of any RSL change. We consequently present a new, near-continuous RSL record at Gress which shows a stable to slowly falling RSL trend over the last ~2500 years. At ~AD 580, the disappearance of Sphagnum moss, a typical freshwater species, accompanies the appearance of brackish diatoms species, highlighting a potential increase in the proximity of marine conditions which may indicate regionally rising RSL from this time.

How to cite: Leoh, K. K., Barlow, N., Dawson, S., Nicholson, U., and Switzer, A.: 2500 years of late Holocene relative sea-level change at Gress, Isle of Lewis, northwest Scotland, EGU General Assembly 2025, Vienna, Austria, 27 Apr–2 May 2025, EGU25-5300, https://doi.org/10.5194/egusphere-egu25-5300, 2025.

This study investigates sea level variability in the East Sea (ES) and East China Sea (ECS) using a combination of in-situ observation, satellite altimeter data from the Copernicus Marine Environment Monitoring Service (CMEMS), and reanalysis datasets from the Hybrid Coordinate Ocean Model (HYCOM), Ocean Reanalysis System 5 (ORAS5), and Global Ocean Reanalysis and Simulation (GLORYS) for the period 1993-2023. The analysis focuses on the influences of steric effects and mass components on sea level, excluding atmospheric pressure impacts for simplification. The Ieodo Ocean Research Station (IORS), located in the ECS at 125.18°E and 32.12°N, served as a key observation point. The trends in monthly mean sea level were 5.82 mm yr-1 (in-situ, 2003–2023) and 3.53 mm yr-1 (CMEMS, 1993–2023), 3.09 mm yr-1 (GLORYS, 1993–2023), 2.27 mm yr-1 (ORAS5, 1993–2023) and -0.09 mm yr-1 (HYCOM, 1994–2023). Notably, HYCOM trends exhibited variability over sub-periods, with rates of 0.85 mm yr-1 (1994-2015), 2.75 mm yr-1 (2016-2023), 0.56 mm yr-1 (1994-2017), 8.82 mm yr-1 (2018-2023), and 0.56 mm yr-1 (2003-2023). Cross-correlation analysis demonstrated significant agreement between detrended sea levels, with coefficients of 0.92 (CMEMS & GLORYS), 0.90 (CMEMS & HYCOM), 0.89 (CMEMS & ORAS5), 0.80 (CMEMS & in-situ). Additionally, this methodology was applied to sea level data from Ulleung Island at 130.90°E and 37.50°N and Dok Island at 131.87°E and 37.24°N, providing further insights into sea level variability in the ES and ECS. Understanding sea level changes in these regions using limited but representative datasets contributes to improving knowledge of regional sea level variability and supports analysis and prediction in a warming climate.

How to cite: Han, M. and Lim, H.-S.: Sea Level Variability in the East Sea and East China Sea: Insights from Observations and Reanalysis (1993-2023), EGU General Assembly 2025, Vienna, Austria, 27 Apr–2 May 2025, EGU25-5302, https://doi.org/10.5194/egusphere-egu25-5302, 2025.

Coastal zones in the Maritime Continent are one of the most vulnerable regions in the world to sea level rise and other climate-associated hazards. Ocean circulations transport mass, salt, and heat through the South China Sea (SCS) and the Southeast Asian Seas (SEAS), linking the western tropical Pacific and Indian Oceans. This process significantly influences regional sea-level changes, causing higher rates of sea-level rise than global. Current global general circulation models (GCMs) are mostly limited in resolving regional ocean circulation and boundary currents due to their coarse resolution. Therefore, dynamic downscaling of the global GCMs to regional scales using high-resolution ocean models is widely considered as an efficient solution to derive regional sea-level projections. In this study, we employ an eddy-resolving regional ocean model (NEMO) to dynamically downscale sea-level projections from the global climate model (EC-Earth3) for the SSP2-4.5 and SSP5-8.5 scenarios in the Maritime Continent, encompassing the South China Sea and other Southeast Asian Seas. A novel aspect of our approach is the use of WRF-based downscaled atmospheric fields from the same parent global climate model (EC-Earth3), to provide high resolution surface boundary conditions for the ocean model projections. This study further explores the low-frequency steric sea-level trend and variability, as well as associated heat flux and transport by prevailing climate modes in the region.

How to cite: Ma, P. and Pavel, T.: Low-Frequency Variability and Projected Changes of Steric Sea Level in the Maritime Continent, EGU General Assembly 2025, Vienna, Austria, 27 Apr–2 May 2025, EGU25-5431, https://doi.org/10.5194/egusphere-egu25-5431, 2025.

The effects of model resolution on the simulation of sea-level variability were analyzed based on the second-generation climate system ocean model from the State Key Laboratory of Numerical Modeling for Atmospheric Science and Geophysical Fluid Dynamics, Institute of Atmosphere Physics (LICOM2) with resolutions of 1° (LICOM2-L) and 0.1° (LICOM2-H).The interannual variability, decadal variability, and long-term trends of the dynamic sea level (DSL)  are estimated using a multivariate linear regression model based on the LICOM2-L and LICOM2-H datasets during 1958–2007. The analysis reveals that the distributions of interannual and decadal variability, as well as long-term trends, are consistent between the LICOM2-L and LICOM2-H simulations in the tropics and mid-latitudes. However, differences in these variabilities are most pronounced in the regions of the western boundary currents and Antarctic Circumpolar Current, primarily due to variations in thermosteric sea level (TSSL) and halosteric sea level. In contrast, the DSL variability differences in the Southern Ocean are mainly due to the TSSL. 
Analyses of ocean heat content (OHC) budgets suggest that the differences between the LICOM2-L and LICOM2-H simulations are mainly in decadal variability and long-term trends. The interannual and decadal variabilities of OHC are significantly influenced by both large-scale mean advection and eddy-induced transport. The latter plays a more pronounced role in high-latitude regions and contributes notably to decadal variability and trend differences. At the equator, eddy-induced transport is the primary driver of long-term trends, accounting for 80% of the total contribution, while the large-scale mean advection contributes the remaining 20%. These findings underscore the complex interplay between mean advection and eddy processes in shaping the thermohaline structure and sea level variability in the ocean models.

How to cite: Wang, Y.: Impacts of model resolution on the simulation of sea-level variability by a global ocean-sea ice model, EGU General Assembly 2025, Vienna, Austria, 27 Apr–2 May 2025, EGU25-6336, https://doi.org/10.5194/egusphere-egu25-6336, 2025.

EGU25-7344 | ECS | Posters on site | CL4.17

Detecting Sea Level Fingerprints from Synthetic Satellite Altimetry Data Using Deep Learning 

Kangmin Mao, Jing Sun, and Riccardo Riva

Continental freshwater input from glaciers and ice sheets is responsible for more than half of the ongoing global sea level rise. This freshwater redistributes across the oceans following specific patterns, determined by gravitational, rotational and deformation effects, known as sea level fingerprints. These fingerprints can be uniquely associated with their continental mass sources and could in theory enable the reconstruction of continental water and ice mass changes, helping to better attribute the causes of ongoing sea level change. However, they are very difficult to detect because their magnitude is much smaller than the signals related to ocean sterodynamic changes and atmospheric effects. To address this challenge, our research has employed deep learning techniques to separate sea level fingerprints from synthetic satellite altimetry data. Our findings reveal that deep learning is highly effective at this task, highlighting significant potential of deep learning in detecting large-scale geospatial signals. This deep learning approach could serve as a basis for accurately quantifying mass changes in the cryosphere and land hydrology from satellite altimetry observations over the last three decades, ultimately providing valuable insights into the impacts of climate change on sea level and the global water cycle.

How to cite: Mao, K., Sun, J., and Riva, R.: Detecting Sea Level Fingerprints from Synthetic Satellite Altimetry Data Using Deep Learning, EGU General Assembly 2025, Vienna, Austria, 27 Apr–2 May 2025, EGU25-7344, https://doi.org/10.5194/egusphere-egu25-7344, 2025.

EGU25-7702 | Orals | CL4.17

Sea-Level Science in Singapore and Southeast Asia 

Benjamin P. Horton, Lauriane Chardot, Stephen Chua, Benjamin S. Grandey, Muhammad Hadi Iksan, Tanghua Li, Trina Ng, Dhrubajyoti Samanta, Timothy Shaw, Fang Yi Tan, Sherene Tan, Iuna Tsyrulneva, and Wenshu Yap

Sea-level rise in Singapore and Southeast Asia differs from the global average due to various regional and local processes, such as land uplift and subsidence, ocean and atmospheric circulation, and the gravitational effects from melting ice sheets. The current scarcity of sea-level data in Southeast Asia, however, limits our ability to understand the regional and local processes needed to generate more accurate sea-level rise projections. We therefore realize there is a crucial need to produce more sea-level data within Southeast Asia and develop sea-level models that can effectively inform adaptation strategies for rising sea levels.

Using case studies from the Southeast Asia Sea Level (SEA2) program from Singapore and Southeast Asia, we illustrate how historical and geological data can constrain future projections, and how sea-level projections can motivate the development of new sea-level research questions to mitigate and adapt to climate change.

  • We showed that rapid sea-level rise driven by ice melting ~14,500 and ~11,500 years ago signi­ficantly reduced land area and forced early human migration across Southeast Asia[1]. During these periods, thresholds of coastal habitat survival were also surpassed resulting in large-scale coastal wetland retreat.
  • Glacial Isostatic Adjustment (GIA) model predictions suggest Southeast Asia experienced sea levels higher than present between 7,000 and 4,000 years ago, producing a mid-Holocene highstand[2]. Variability in the highstand magnitude is controlled by solid Earth parameters while the highstand timing is controlled by ice sheet melting history.
  • We introduced a new fusion method for quantifying a best-estimate of sea-level rise uncertainty to support decision-making[3]. We estimate that by 2100, global sea levels will likely rise between 0.3-1.0 m under low emission and 0.5-1.9 m under high emission scenarios.
  • We demonstrate the implications of rising sea levels to coastal ecosystems. With 3°C of warming, nearly all mangrove forests and coral reef islands would be beyond their sea-level rise tipping point for survival[4].

[1] Kim, H.L., Li, T., et al. 2023. Commun Biol 6, 150. https://doi.org/10.1038/s42003-023-04510-0

[2] Li, T., et al. 2023. Quat Sci Rev 319, 108332. https://doi.org/10.1016/j.quascirev.2023.108332

[3] Grandey, B.S., Dauwels, J., Koh, Z.Y., Horton, B., et al. 2024. Earth’s Future. https://doi.org/10.21203/rs.3.rs-2922142/v3

[4] Saintilan, N., Horton, B., et al. 2023. Nature 621, 112–119. https://doi.org/10.1038/s41586-023-06448-z

How to cite: Horton, B. P., Chardot, L., Chua, S., Grandey, B. S., Iksan, M. H., Li, T., Ng, T., Samanta, D., Shaw, T., Tan, F. Y., Tan, S., Tsyrulneva, I., and Yap, W.: Sea-Level Science in Singapore and Southeast Asia, EGU General Assembly 2025, Vienna, Austria, 27 Apr–2 May 2025, EGU25-7702, https://doi.org/10.5194/egusphere-egu25-7702, 2025.

EGU25-7935 | ECS | Orals | CL4.17

Sea level budget in light of recent observational advances since 1960 

Huayi Zheng, Lijing Cheng, Sönke Dangendorf, Anne Barnoud, Kevin Trenberth, John Fasullo, and John Abraham

Closure of the global mean sea level (GMSL) budget is essential to understand the causes of GMSL rise. Accounting for the recent progress in observing and estimating of GMSL, steric sea level and ocean mass changes, this study assesses the budget for the GMSL trend and acceleration for the three key observational eras of 1960-2021, 1993-2023 and 2005-2023. For 1960-2021, the trend of GMSL is 1.86 ± 0.34 mm yr-1, closely matching the sum of contributions of 1.88 ± 0.13 mm yr-1, with most dominant contributions coming from steric height change and glacier melting. The observed GMSL acceleration of 0.072 ± 0.005 mm yr-2 for 1960-2021 matches contributions of 0.066 ± 0.005 mm yr-2 and is dominated by steric height change. From 1993 to 2023, the GMSL rise of 3.27 ± 0.06 mm yr-1 also aligns with contributions of 3.22 ± 0.15 mm yr-1. The acceleration of observed GMSL is 0.078 ± 0.013 mm yr-2 for this period, which is supported by the acceleration inferred from sum of contributions of 0.072 ± 0.004 mm yr-2. For 2005-2023, the observed GMSL acceleration is 0.084 ± 0.006 mm yr-2, mainly driven by steric sea level change at 0.083 ± 0.016 mm yr-2. Although the acceleration within three periods is consistent, the driver changes depend on the periods. This study reconciles the observed GMSL trend and acceleration with the sum of contributors since 1960, highlighting the importance of adequate data processing and bias corrections.

How to cite: Zheng, H., Cheng, L., Dangendorf, S., Barnoud, A., Trenberth, K., Fasullo, J., and Abraham, J.: Sea level budget in light of recent observational advances since 1960, EGU General Assembly 2025, Vienna, Austria, 27 Apr–2 May 2025, EGU25-7935, https://doi.org/10.5194/egusphere-egu25-7935, 2025.

EGU25-7949 | ECS | Posters on site | CL4.17

Applying copula to joint probability methods: a comparison of extreme sea-level estimation methods 

Zhi Yang Koh, Benjamin Grandey, Justin Dauwels, and Lock Yue Chew

Accurate evaluation of sea-level return levels is crucial for coastal planning. Two ubiquitous methods are the generalised Pareto distribution (GPD), favoured for its ease of access and cheap computational cost, and the skew surge joint probability method (SSJPM), which models deterministic tides and stochastic surges separately but does not consider tide–surge interaction. We propose a modification to the SSJPM, called the copula joint probability method (CJPM), where a copula is used to model the joint distribution of skew surges and peak tides, to account for correlation between tidal high water and skew surge. We compare the performance of the GPD, SSJPM and CJPM in estimating the 30-year return level using only ten years of training data. To validate the models, we require long observational records which can be provided by tide gauges with approximately 100 calendar years of records. For each tide gauge record, ten calendar years are randomly chosen to train the three models while the remaining years are used to validate model predictions. This procedure is repeated multiple times and the mean absolute error (MAE) of each model is estimated at each tide gauge site. The SSJPM and CJPM have lower MAE than the GPD at most tide gauges. The CJPM complements the SSJPM by accounting for correlation between tidal high water and skew surge, providing improved performance at many tide gauges.

How to cite: Koh, Z. Y., Grandey, B., Dauwels, J., and Chew, L. Y.: Applying copula to joint probability methods: a comparison of extreme sea-level estimation methods, EGU General Assembly 2025, Vienna, Austria, 27 Apr–2 May 2025, EGU25-7949, https://doi.org/10.5194/egusphere-egu25-7949, 2025.

EGU25-9224 | Orals | CL4.17

Constraining extreme sea levels along the European coasts from a large ensemble of climate models 

Marta Marcos, Miguel Agulles, Angel Amores, Xiangbo Feng, and Jon Robson

The storm surge contribution to coastal extreme sea levels along the European coastlines has been explored using a set of hydrodynamic numerical simulations. When forced by high-resolution atmospheric fields, simulated storm surge time series display good correspondence with observations. Because of their length, accuracy and consistency, these numerical data have been widely used to characterise coastal extreme sea levels, in terms of their magnitude and probability of occurrence. These outputs are then often used to infer coastal hazards and risks. However, higher risks associated to the most extreme events, represented by return periods substantially longer than the simulated time span, are generally accompanied by large uncertainties, thus limiting the robustness of long-term coastal risks assessments based solely on these otherwise valuable datasets. One way to reduce these uncertainties is increasing their sample size. Here, we do so by running a number of hydrodynamic simulations forced by mean sea level pressure and surface wind fields from a set of initialised climate models from the Decadal Climate Prediction Project (DCPP) over a domain covering the European coasts (excluding the Baltic Sea) and amounting for a total of 9000 years. Hydrodynamic simulations forced with atmospheric pressure and wind fields from these models, once are biased-corrected, result in a much larger dataset of coastal storm surges. Large datasets also provide information on the probability of extreme sea levels that are plausible in the current climate but for which there is no observational evidence.

How to cite: Marcos, M., Agulles, M., Amores, A., Feng, X., and Robson, J.: Constraining extreme sea levels along the European coasts from a large ensemble of climate models, EGU General Assembly 2025, Vienna, Austria, 27 Apr–2 May 2025, EGU25-9224, https://doi.org/10.5194/egusphere-egu25-9224, 2025.

EGU25-9785 | ECS | Posters on site | CL4.17

Increasing the resolution of sea-level simulations for Western Europe with a regional ocean model until 2100 

Jeemijn Scheen, Dewi le Bars, Tim H.J. Hermans, Iris J. Keizer, Bert Wouters, Stef Lhermitte, and Aimée B.A. Slangen

Global mean sea level is rising due to anthropogenic climate change, via the thermal expansion of seawater and the mass loss of land ice. Regional sea-level change is also affected by changes in ocean currents due to the changing climate and internal climate variability. Global climate models from CMIP6 (Coupled Model Intercomparison Project Phase 6) simulate future sterodynamic sea-level change – the combined contribution of thermal expansion and ocean dynamics – with a resolution on the order of 100 by 100 km. However, at this resolution, the simulation of coastal processes on the continental shelves and the exchange between the European continental shelves and the deep Atlantic Ocean is limited. We address this by dynamically downscaling four CMIP6 models using the ROMS regional ocean model for Western Europe, which has a 12 by 12 km resolution with 30 terrain-following depth layers. Based on the results, we present sea-level projections until 2100 for 2 emission scenarios. We investigate the effect of dynamical downscaling on future sea-level trends in Western Europe. For example, we find that regional sea level rises more in the German Bight than in other regions during the satellite era because of changes in wind. With our ensemble of 4 downscaled CMIP6 models, we are able to quantify the inter-model uncertainty and we can assess the advantages and disadvantages of dynamical downscaling for annual mean sea-level projections.

How to cite: Scheen, J., Bars, D. L., Hermans, T. H. J., Keizer, I. J., Wouters, B., Lhermitte, S., and Slangen, A. B. A.: Increasing the resolution of sea-level simulations for Western Europe with a regional ocean model until 2100, EGU General Assembly 2025, Vienna, Austria, 27 Apr–2 May 2025, EGU25-9785, https://doi.org/10.5194/egusphere-egu25-9785, 2025.

The Mediterranean Sea accounts for less than 0.5% of the global ocean's total volume and is characterized by unique significance in terms of oceanographic complexity. Indeed, an internal conveyor belt, together with complex circulation patterns and gyres, defines the entire domain. The understanding of Mediterranean oceanography has evolved significantly in recent times, transitioning from a static perspective to a dynamic one, as circulation patterns and thermohaline properties in the basin are now acknowledged to vary over time. Within this dynamic framework, the North Ionian Gyre (NIG) emerges as one of the most intriguing oceanographic features. Situated in the Ionian Sea, the NIG is known to reverse its circulation between cyclonic and anticyclonic modes on a quasi-decadal scale. This fluctuation results in significant variations in the redistribution of water masses and thermohaline properties throughout the Mediterranean Sea. Although various hypotheses have been proposed to explain the causes of these reversal episodes, a widely accepted consensus has yet to be reached. Moreover, reversal episodes have been documented only since the late 1980s through direct observations, modeling, and experimental studies, while the historical variability of this phenomenon remains poorly understood.

In this study, to enhance the understanding of the NIG evolution over time, information about sea-level changes has been accounted for. Indeed, variations in thermohaline properties and water mass redistribution, induced by NIG state shifts, might have been recorded in sea-level changes as a response to these modifications. A total of 46 tide gauges, distributed across the entire domain, have been considered, providing signals that often date back decades or even cover the entire 20th century. Furthermore, information from satellite altimetry has been included to provide a detailed spatial view of sea-level changes in recent decades across the Mediterranean Sea. After the removal of effects such as atmospheric pressure, glacial isostatic adjustment, and the sea-level response induced by the water mass exchange from continents, all signals were decomposed into a finite number of mode functions, each theoretically related to a specific phenomenon. At this stage, the influence of vertical land movements recorded in tide gauges has been isolated and attributed to residual signals, while the oscillatory modes primarily represent sea-level changes associated with thermohaline variations and the dynamic redistribution of seawater. 

An interesting oscillatory, quasi-decadal signal emerged as the second mode of variability within all datasets considered. Inflections within this signal provide a notable match, both in time and space, with all known NIG reversal episodes, particularly in the eastern Mediterranean sub-basins. These inflections manifest as an acceleration (or deceleration) in sea-level rise during anticyclonic (cyclonic) NIG phases. Despite their low magnitude in terms of amplitude (approximately 4 cm), they appear to be associated with the main driver of short-term variability in sea-level trends across the domain. Since signals from tide gauges provide long-term time series, this correlation enables the reconstruction of the NIG reversal history over the past 120 years based on direct observations.

How to cite: Meli, M.: Sea-level variability as a proxy for ocean dynamics in the Mediterranean Sea, EGU General Assembly 2025, Vienna, Austria, 27 Apr–2 May 2025, EGU25-10181, https://doi.org/10.5194/egusphere-egu25-10181, 2025.

EGU25-10449 | ECS | Orals | CL4.17

The Eastern Mediterranean Sea mean sea level decadal slowdown: the effects of the water budget 

Federica Borile, Nadia Pinardi, Vladyslav Lyubartsev, Mahmud Hasan Ghani, Antonio Navarra, Jacopo Alessandri, Emanuela Clementi, Giovanni Coppini, Lorenzo Mentaschi, Giorgia Verri, Vladimir Santos da Costa, Enrico Scoccimarro, Antonio Novellino, and Paolo Oddo

The Mediterranean Sea, as a semi-enclosed basin, is particularly sensitive to climatic changes, making it a critical region for studying sea level variability. This study investigates the decadal variability of the Mean Sea Level (MSL) trend in the Mediterranean and its subregions over the past 30 years (1993-2022), using a combination of satellite altimetry, tide gauges, and reanalysis datasets.

Our findings reveal a slowdown in the overall Mediterranean MSL trend during the 2013-2022 decade compared to previous periods, highlighting significant regional differences. The Western Mediterranean exhibits an accelerating trend consistent with global sea level rise, while the Eastern Mediterranean has experienced a decadal slowdown, including the Adriatic and Aegean Seas, where negative trends are observed. This slowdown is attributed to the combined effects of changes in the water cycle and the balancing of thermal and haline steric components. Increased evaporation emerges as a key driver of the observed trend changes, surpassing contributions from precipitation, runoff, and strait transport.

These results underscore the significance of the Mediterranean's water budget in influencing sea level trends and highlight the complexity of interpreting decadal sea level changes. The findings suggest that continued monitoring and a better understanding of regional water budgets are crucial for refining future projections and developing effective climate adaptation strategies for the Mediterranean coastal areas.

How to cite: Borile, F., Pinardi, N., Lyubartsev, V., Ghani, M. H., Navarra, A., Alessandri, J., Clementi, E., Coppini, G., Mentaschi, L., Verri, G., da Costa, V. S., Scoccimarro, E., Novellino, A., and Oddo, P.: The Eastern Mediterranean Sea mean sea level decadal slowdown: the effects of the water budget, EGU General Assembly 2025, Vienna, Austria, 27 Apr–2 May 2025, EGU25-10449, https://doi.org/10.5194/egusphere-egu25-10449, 2025.

EGU25-10506 | Orals | CL4.17

Relative sea level projections constrained by tide gauge trends 

Matthias Mengel and Mahé Perrette

Projections of relative sea level rise are central to assess the future impacts of sea level rise, but available projections do not emerge as a continuation of the historical data. This complicates local adaptation planning, coastal impact assessments and communication to policy makers. Here, we present a spatial Bayesian model to provide local projections  emerging from past records. The model integrates tide gauges, GPS and satellite altimetry with past and future constraints on mountain glaciers, polar ice sheets, thermal expansion, ocean circulation, land water storage and glacial history. We separate natural, unforced ocean variability from the long-term signal to provide posterior estimates of sea level change and vertical land motion. The model reduces the uncertainty for local projections within this century through the inclusion of local constraints while producing global median projections and uncertainty ranges similar to the IPCC AR6. The model allows to project local relative sea level rise for any given global-mean temperature pathway and we illustrate this with projections for three IPCC AR6 WG3 pathways.

How to cite: Mengel, M. and Perrette, M.: Relative sea level projections constrained by tide gauge trends, EGU General Assembly 2025, Vienna, Austria, 27 Apr–2 May 2025, EGU25-10506, https://doi.org/10.5194/egusphere-egu25-10506, 2025.

EGU25-10629 | ECS | Posters on site | CL4.17

Control of non-linear vertical land motion on future sea-level projections across the eastern Indian Ocean 

Emmaline Martin, Luke Jackson, and Sophie Williams

Sea-level change has garnered significant interest, particularly in recent decades, and is becoming of undeniable concern for numerous stakeholders and communities globally. Vertical land motion contributes to local sea-level change but its causes and rates vary widely. Whilst long term, large scale isostatic adjustment is predictable, short term, local non-linear changes (e.g., subsidence via groundwater extraction, or active tectonics) remain unaccounted for in current sea-level projections. In the eastern Indian Ocean, large uncertainties in VLM remain, which we consider an effect of non-linear behaviour and we assess to improve predictability. Owing to a lack of long term VLM data in the region, we test approaches combining tide gauges and satellite altimetry to derive 30-year VLM time series. We validate the approach using 20 TGs co-located with GNSS measurements of VLM. We separate the signal into linear and non-linear components and demonstrate, for example locations, the effect of propagating non-linear VLM into local sea-level projections.

How to cite: Martin, E., Jackson, L., and Williams, S.: Control of non-linear vertical land motion on future sea-level projections across the eastern Indian Ocean, EGU General Assembly 2025, Vienna, Austria, 27 Apr–2 May 2025, EGU25-10629, https://doi.org/10.5194/egusphere-egu25-10629, 2025.

The socio-economic impacts of sea-level rise are significant, especially in coastal regions with dense populations and costly infrastructure. Accurate projections of sea-level changes at regional scales are essential for risk assessment but are challenging due to the interplay of processes affecting the height of both the land and sea surface (and, therefore, relative sea level). Rising sea levels from ice melting and ocean expansion exacerbate flooding risks, with nuisance flooding serving as an early warning for vulnerable regions such as Atlantic Canada, which is experiencing GIA-induced land subsidence. The compounded effects of GIA and contemporary sea-level rise escalate regional vulnerability to flooding. This study improves projections of mean sea-level changes and nuisance flooding in Atlantic Canada by integrating the sea-level signal from optimal regional GIA models into the framework adopted in the 6th Assessment Report of the Intergovernmental Panel on Climate Change (IPCC). Projections under SSP1-1.9, SSP3-7.0, and SSP5-8.5 scenarios for 2050, 2100, and 2150 CE are used to assess nuisance flooding frequency at 40 tide gauge stations. Our results demonstrate that the GIA signal contributes significantly to flooding frequency estimates and that these estimates can depart considerably from those estimated using the IPCC (AR6) mean sea level projections. For example, nuisance flooding at Halifax becomes chronic (>50 days annually) by 2050 CE under SSP3-7.0 using our GIA model results. This level of chronic flooding occurs in Halifax at 2050 CE only for the most extreme scenario (SSP5-8.5) when using the IPCC mean sea level projections.

How to cite: Parang, S., Karegar, M. A., and Milne, G. A.: Improved projections of sea-level change and nuisance flooding in Atlantic Canada: The importance of GIA-induced land motion, EGU General Assembly 2025, Vienna, Austria, 27 Apr–2 May 2025, EGU25-11472, https://doi.org/10.5194/egusphere-egu25-11472, 2025.

In March of 2018, a winter storm hit Southern New England (US East Coast), with most of the coastal cities experiencing minor to moderate coastal floods. However, days after the storm passed and the winds and waves calmed down, the tide-gauge data continued to reach minor flooding levels. What was the cause of this prolonged recurrent flooding? Here we argue that the lingering effects of local ocean current dynamics contributed to this flooding.

Along the US East Coast, an important driver of coastal sea-level variability is ocean dynamics, related to both large-scale circulation, such as the Gulf Stream, but also smaller local ocean currents. A relevant circulation feature in Southern New England is the Shelfbreak jet (SBJ). The SBJ flows equatorward from the Labrador Sea towards the Gulf Stream at Cape Hatteras following the shelf break along the Northeast US coast. In a recent study, we showed that the SBJ and sea level along the southern New England coast are highly correlated, especially at timescales of 1-15 days (Camargo et al., 2024).  

​​Since this frequency band coincides with the timescales of storm surges, we explore the implication of our findings for coastal flooding. We find that the SBJ explains, on average, about 25% of the storm surge variance for flood days along Southern New England. Specifically, for the March 2018 winter storm, SBJ dynamics are responsible for more than 90% of the storm surge observed 4 days after the peak of the storm. That is, there would have been no flooding so many days after the storm passed if not for SBJ-related-dynamics.

Our results suggest local ocean dynamics are an important component  of storm surges in Southern New England, and contribute to lingering flooding after a storm has passed. Thus, we advocate that ocean dynamics should be considered in flood studies elsewhere. Furthermore, our results suggest that focusing only on large-scale circulation, such as the Gulf Stream or ocean overturning, may not be satisfactory for understanding the most basic dynamics essential for making meaningful projections of the future.

Reference: Camargo, C. M. L., Piecuch, C. G., & Raubenheimer, B. (2024). From Shelfbreak to Shoreline: Coastal sea level and local ocean dynamics in the northwest Atlantic. Geophysical Research Letters, 51, e2024GL109583. https://doi.org/10.1029/2024GL109583

How to cite: M.L. Camargo, C., Piecuch, C., and Raubenheimer, B.: Coastal Floods and the Lingering Effects of the Shelfbreak Jet - A case study of how local ocean currents contribute to coastal flooding in Southern New England (US), EGU General Assembly 2025, Vienna, Austria, 27 Apr–2 May 2025, EGU25-11771, https://doi.org/10.5194/egusphere-egu25-11771, 2025.

EGU25-12705 | ECS | Orals | CL4.17

Properly integrating vertical land motion with sea-level change – towards robust projections of relative sea-level rise  

Philip S.J. Minderhoud, Katharina Seeger, Manoochehr Shirzaei, and Pietro Teatini

Coastal lowlands in the world increasingly face accelerating rates of relative sea-level rise, as global sea level rises and coastal land subsidence increases. Originating from both natural and anthropogenic processes, land subsidence (i.e. downward vertical land motion) is particularly prominent in densely populated coastal-deltaic settings where human activities can accelerate subsidence rates to several centimetres or even decimetres per year, thereby dominating local, contemporary relative sea-level rise. Proper inclusion of vertical land motion dynamics into sea-level change projects, combined with high-accurate and correctly referenced coastal elevation data, is crucial to accurately project relative sea-level change in these critical, densely populated coastal areas.

Recent advancements in satellite-based InSAR data acquisition and processing capacity provide insights into contemporary vertical land motion dynamics at unprecedented spatial scale, complementary to traditional measurements of vertical land motion by e.g. tide gauges and GNSS stations. However, it requires a robust InSAR-data processing framework that ensures internal consistency of SAR data and rigorously assesses output accuracy. In addition, correct interpretation of InSAR results is important as observations provide reflector movements which may not align with land surface movements, particularly in urban areas. This poses the risks of oversimplification and misinterpretation when linking InSAR results to sea-level change.

In addition, coastal subsidence is the result of various subsurface processes at different depths and can be highly non-linear over time, unlike sea-level change, resulting in complex spatio-temporal patterns and dynamics. This makes projection of non-linear vertical land motions and relative coastal elevation change not straightforward and robust strategies have yet to be developed. We advocate the development of standardized InSAR (post-)processing workflows and interdisciplinary collaboration to improve the observation and proper interpretation of vertical land movement, particularly in coastal cities and river deltas. We also discuss how to move from contemporary observations of coastal vertical land motion towards disentangling drivers and processes, move to process-based projections of coastal subsidence and integrate them in robust projections of future relative sea-level changes and coastal exposure assessments.


How to cite: Minderhoud, P. S. J., Seeger, K., Shirzaei, M., and Teatini, P.: Properly integrating vertical land motion with sea-level change – towards robust projections of relative sea-level rise , EGU General Assembly 2025, Vienna, Austria, 27 Apr–2 May 2025, EGU25-12705, https://doi.org/10.5194/egusphere-egu25-12705, 2025.

Global mean sea level (GMSL) derived from satellite altimetry reflects in an integrated way the overall variability in the Earth's climate system. Linear trend analyses suggest that GMSL is currently rising at a rate of 3.3 mm/yr (Guérou et al., 2023). However, understanding GMSL variations beyond the overall trend is critical to correctly interpret long-term changes. At interannual timescales, variability in GMSL is driven by steric changes in ocean heat content and barystatic variations of water mass, with the El Nino-Southern Oscillation (ENSO) contributing about equally to both.

Here, we are interested in quantifying the impact of internal (multi-) decadal climate variability, which is crucial for assessing the anthropogenic contributions and its role in current GMSL acceleration. Specifically, we focus on the statistical interrelationship between GMSL and the Pacific Decadal Variability as expressed by the Pacific Decadal Oscillation (PDO) index. By studying the co-variability between PDO index and GMSL over the full period of existing satellite altimetry records, we demonstrate that the low-frequency variability superposed to (linear) GMSL rise is almost perfectly consistent with PDO over most of the past decades but exhibits a complete decoupling after 2019. Thus, GMSL rise estimated by statistically accounting for low-frequency climate variability is unprecedented since 2019, supporting the recently reported significant acceleration in the rise of global mean sea level.

This work has been financially supported by INESC TEC via the International Visiting Researcher Programme 2024.

How to cite: Donner, R. and Barbosa, S.: Recent decoupling of global mean sea level rise from decadal scale climate variability, EGU General Assembly 2025, Vienna, Austria, 27 Apr–2 May 2025, EGU25-13153, https://doi.org/10.5194/egusphere-egu25-13153, 2025.

EGU25-13297 | ECS | Orals | CL4.17

Towards overshoot-proof multi-century sea level rise projections 

Tessa Möller, Zebedee Nicholls, Jared Lewis, Carl-Friedrich Schleussner, and Alexander Nauels

Temporarily crossing and subsequently returning below 1.5°C, a so-called temperature ‘overshoot’, is a scenario of increasing relevance and interest. Potential impacts and risks of such an overshoot, including triggering irreversible ice loss and a large multi-century sea-level rise (SLR) commitment, need to be better understood to support well-informed policy and decision making.

Here, we use a set of eight overshoot scenarios from the PROVIDEv1.2 ensemble, covering a wide range of peak temperatures and emission reduction rates, to force an updated MAGICC-SLR emulator to explore the multi-century responses of the main sea level components. The emulator updates include a new calibration for the Greenland solid ice discharge component and different land water storage representations following population assumptions as represented in the Shared Socioeconomic Pathway (SSP) framework. These are the first steps of a comprehensive MAGICC-SLR update to provide overshoot-proof state-of-the-art probabilistic SLR projections.

Under a scenario that extrapolates mitigation efforts resulting from current climate policies out to 2100 and thereafter decreases global average temperatures back to 1.5°C, we project a global mean SLR of 1.4 m (median, 0.7-3.2 m very likely range) by 2300, relative to 1995-2014 levels. By extending the 2300 radiative forcing levels further into the future, we explore SLR projections until 2500, with greatly increasing uncertainties and decreasing robustness of the sea level response. In case of a temperature overshoot below 2.0°C, our results suggest that global mean SLR is reduced by following a SSP1 rather than SSP2 population pathway through dam impoundment and groundwater extraction management. For the updated MAGICC-SLR emulator, we find that the relative contribution of the Greenland solid ice discharge component steadily increases over time and becomes the dominant SLR driver across all scenarios beyond 2300. Our results suggest that by 2500, the committed global SLR from overshooting 1.5°C cannot be returned to levels of a 1.5°C stabilization scenario.

We highlight and discuss the limitations and caveats when projecting SLR under overshoot with simplified modeling approaches and outline next steps to continue overshoot-proofing MAGICC-SLR. We emphasize the need for a careful evaluation of the parameterizations for each SLR component to ensure a physically robust representation of the (ir)reversibile multi-century SLR response under overshoot.

How to cite: Möller, T., Nicholls, Z., Lewis, J., Schleussner, C.-F., and Nauels, A.: Towards overshoot-proof multi-century sea level rise projections, EGU General Assembly 2025, Vienna, Austria, 27 Apr–2 May 2025, EGU25-13297, https://doi.org/10.5194/egusphere-egu25-13297, 2025.

EGU25-13409 | ECS | Posters on site | CL4.17

Linking regional extreme sea level variability in North-Western Europe to large scale climate modes 

Lisanne Blok, Marilena Oltmanns, Andrea Marinoni, and Ali Mashayek

Extreme sea level (ESL) events pose the highest risk to coastal communities and infrastructure, with their frequency and intensity projected to increase in the future. These events result from a combination of tidal height, mean sea level, wave height, and storm contributions. However, the spatiotemporal variability of regional extreme sea-level events and its connection to climate teleconnections and large-scale weather processes remain poorly understood.
In this work, we demonstrate that regional ESL variability can be attributed to large-scale teleconnections and traced back to atmospheric and oceanographic patterns in the North-Atlantic. 

Applying Empirical Orthogonal Function (EOF) analysis on the daily maximum of hourly detrended and detided sea level from the CODEC dataset, we found that the first three modes explain 90% of the variance (53%, 20%, and 9%, respectively).  Clustering using Gaussian Mixture models reveals five distinct regions of sea level variability. The top three EOF modes show significant correlations using linear regression with climate indices, most significantly the North Atlantic Oscillation, Arctic Oscillation, and the Eastern Atlantic. Composite analysis of these modes attributes each mode variability to large-scale atmospheric and oceanographic variables. This highlights significant weather patterns in the North Atlantic, connecting non-local weather sources to regional variability of sea level extremes.

Our findings illustrate how regional sea level variability is driven by large-scale weather and climate patterns. By linking distinct spatial modes to significant drivers and changes in weather variables, we provide new insights on the causes and climatology of high sea levels. This understanding offers valuable applications for early warning systems and coastal planning. Furthermore, understanding the drivers of ESL variability can improve long-term predictions of regional coastal flooding risk. Given the global nature of ESL events and the increasing need for adaptation, our research contributes to a critical foundation for future resilience planning.

How to cite: Blok, L., Oltmanns, M., Marinoni, A., and Mashayek, A.: Linking regional extreme sea level variability in North-Western Europe to large scale climate modes, EGU General Assembly 2025, Vienna, Austria, 27 Apr–2 May 2025, EGU25-13409, https://doi.org/10.5194/egusphere-egu25-13409, 2025.

EGU25-14028 | ECS | Posters on site | CL4.17

Common Era sea levels in tropical regions 

Fangyi Tan, Jennifer Walker, Yucheng Lin, Maeve Upton, Timothy Shaw, Nurul Syafiqah Tan, and Benjamin Horton

Common Era (last 2000 years) relative sea-level (RSL) records have revealed important insights on the drivers of RSL change; links between climate and sea-level changes; and the timing of the modern acceleration in the rates of sea-level rise. However, the distribution of Common Era RSL records is spatially biased to the North Atlantic. Here, we update the global database of Common Era RSL records with 36 new sea-level index points from coral microatolls and mangrove sediments in Southeast Asia, and 12 RSL data points from a continuous-core mangrove record in Belize. A spatio-temporal hierarchical model is applied to analyse the influence of these new records on the global mean sea-level rate and to attribute regional RSL trends to possible local and regional drivers of RSL change.

How to cite: Tan, F., Walker, J., Lin, Y., Upton, M., Shaw, T., Tan, N. S., and Horton, B.: Common Era sea levels in tropical regions, EGU General Assembly 2025, Vienna, Austria, 27 Apr–2 May 2025, EGU25-14028, https://doi.org/10.5194/egusphere-egu25-14028, 2025.

EGU25-14972 | Orals | CL4.17

Separating the Global Pattern of Externally Forced Sea Level Rise from Natural Variability in the Short Climate Record 

Sang-Ik Shin, Cécile Penland, Matthew Newman, and Michael Alexander

Global mean sea level rapidly increased during the 20th century, at a rate that doubled in the past few decades. Global satellite altimetry records, which have only been available since 1993, have additionally shown that the recent rise in sea level is neither spatially uniform nor linear in time. However, this change in sea level over such a short period likely convolves the externally forced climate signal with natural climate variability, and separating these is critical for coastal planners and policymakers to account for sea-level impacts on their communities. Previous studies have demonstrated that the “least damped (eigen)mode” (LDM) of a Linear Inverse Model (LIM) can effectively identify both sea surface temperature and sea level trend patterns in long records, even when they bear some similarity to patterns of natural climate variability, but that this approach becomes problematic for shorter records. In this study, we show that applying a Gram-Schmidt orthonormalization to the LIM’s eigenmodes adjusts the LDM so that it can identify the trend pattern even for record lengths of a few decades. We first test the technique by applying it to output from large ensembles of historical simulations made by two climate models, NCAR’s CESM2 and GFDL’s SPEAR: For record lengths as short as a few decades, our technique successfully identifies the forced response, as estimated by the ensemble mean, from any single ensemble member. Finally, we determine the forced sea level rise signal from observations, both on global and regional ocean scales as well as for coastal regions as measured by a gauge network, over the satellite observational era, and show how it differs from simple linear or quadratic trend estimates.

How to cite: Shin, S.-I., Penland, C., Newman, M., and Alexander, M.: Separating the Global Pattern of Externally Forced Sea Level Rise from Natural Variability in the Short Climate Record, EGU General Assembly 2025, Vienna, Austria, 27 Apr–2 May 2025, EGU25-14972, https://doi.org/10.5194/egusphere-egu25-14972, 2025.

EGU25-15449 | Posters on site | CL4.17

Holocene sea-level evolution in Western Australia  

Nicole Khan, Mick O'Leary, Tanghua Li, Roger Creel, Chengcheng Gao, Abang Nugraha, Rahul Kumar, Juliet Sefton, and Adam Switzer

Records of Holocene relative sea-level (RSL) change from Western Australia, a far-field location distal to former polar ice sheets, offer important constraints on ice melt contributions to global mean sea-level (GMSL) change. Despite this, recent efforts to reconstruct RSL have been limited, and the nature of Holocene RSL evolution in Western Australia remains debated in part due to biased comparisons of data. Here we review, re-evaluate, and aggregate RSL data from Western Australia following international standard protocol and explore the potential of sedimentary archives from beach ridge systems and buried transgressive facies of southwestern Australia to produce accurate, high-resolution records of RSL change. We use these data to test several working hypotheses about ice sheet contributions to GMSL change during the Holocene and the influence of local (e.g., non-stationary tides) or higher-frequency (e.g., El Niño Southern Oscillation) drivers of sea-level variability. Improved constraints on the behaviour of relative sea level during the Holocene will provide necessary data for enhancing our understanding of earth rheology, ice sheet dynamics, and natural variability of sea-level changes under warm, interglacial climate states.

How to cite: Khan, N., O'Leary, M., Li, T., Creel, R., Gao, C., Nugraha, A., Kumar, R., Sefton, J., and Switzer, A.: Holocene sea-level evolution in Western Australia , EGU General Assembly 2025, Vienna, Austria, 27 Apr–2 May 2025, EGU25-15449, https://doi.org/10.5194/egusphere-egu25-15449, 2025.

EGU25-15515 | Orals | CL4.17

Future projections of sea level rise in the Mediterranean Sea 

Iván Manuel Parras Berrocal, Robin Waldman, Nicolas Gonzalez, and Samuel Somot

Future sea level change in the Mediterranean Sea is one of the major climate hazards for populations living in low-elevation coastal zones (≤10 m above mean sea level). In this study, we analyze projections of mean sea level rise in the Mediterranean Sea by the end of the 21st century. To address this, we use a set of multi-decadal simulations from three pairs of regional climate system models (RCSMs) of the Med-CORDEX initiative together with the simulations of their driving global climate models (GCMs). For the first time, we analyze the mean relative sea level simulated by a set of high-resolution and fully coupled regional models to provide a detailed characterization of regional and local patterns of future Mediterranean sea level change. By 2100, under the high-emission SSP5-8.5 scenario, the basin-averaged total sea level is projected to rise by +71 cm from RCSMs and +76 cm from GCMs (central estimates). Among the sea level components, the sterodynamic term (dynamic sea level + global mean thermosteric sea level) is the largest contributor to total sea level rise, with 91% of its contribution driven by global thermal expansion. The sterodynamic term and the vertical land motion drive local sea level adjustments in regions such as the Balearic Sea and the Ionian islands, leading to the highest sea level rise in the Mediterranean. We find that sea level rise in the Mediterranean is expected to be slower than the nearby Atlantic due to a dynamic adjustment within the basin. Furthermore, compared to the GCMs, the RCSMs show a higher spread (extremes) of the sea level response without a mean regional effect.

How to cite: Parras Berrocal, I. M., Waldman, R., Gonzalez, N., and Somot, S.: Future projections of sea level rise in the Mediterranean Sea, EGU General Assembly 2025, Vienna, Austria, 27 Apr–2 May 2025, EGU25-15515, https://doi.org/10.5194/egusphere-egu25-15515, 2025.

EGU25-16137 | ECS | Posters on site | CL4.17

A new framework to explore high-end sea-level rise for the UK: updating H++ 

Jennifer H. Weeks, Lesley C. Allison, Andy Beverton, Jason A. Lowe, Harriet G. Orr, Helen Roberts, and Matthew D. Palmer

The UK high-plus-plus (H++) scenario for high-end sea-level rise is used in sensitivity testing for significant infrastructure (e.g. nuclear facilities) and forms part of the Environment Agency planning guidance in England. However, the existing H++ scenario, developed as part of the UK Climate Projections in 2009 (UKCP09), does not reflect the latest science knowledge on ice sheet instability processes and has limitations, as revealed in consultations with users of this information. We outline a new H++ framework to inform coastal planning and decision-making. The first step involves users screening decisions using an updated H++ scenario that reflects major scientific advances since UKCP09. For decisions found to be sensitive to high-end sea-level rise in the screening step, the second step involves users evaluating adaptation options and damage costs against a wider library of alternative, plausible storylines. Our H++ screening scenario is based on the Intergovernmental Panel on Climate Change Sixth Assessment Report low-likelihood high-impact sea-level rise assessment. In response to stakeholder needs, all storylines within the H++ framework provide time-continuous, geographically-specific sea-level rise projections to 2300 and information on rates of sea-level rise.

How to cite: Weeks, J. H., Allison, L. C., Beverton, A., Lowe, J. A., Orr, H. G., Roberts, H., and Palmer, M. D.: A new framework to explore high-end sea-level rise for the UK: updating H++, EGU General Assembly 2025, Vienna, Austria, 27 Apr–2 May 2025, EGU25-16137, https://doi.org/10.5194/egusphere-egu25-16137, 2025.

EGU25-16149 | Orals | CL4.17

Decomposing steric and dynamic sea level trends in a future high-emission scenario of the Mediterranean Sea 

Nicolas M. Gonzalez, Robin Waldman, Ivan M. Parras-Berrocal, and Samuel Somot

Over the past few decades, the rise of sea level has emerged as a critical concern for coastal regions across the globe, driving intense scientific efforts to understand the underlying processes. However, disentangling and interpreting ocean physics’ contributions (sterodynamic) to these changes remains a complex challenge. To contribute to a better understanding of future sea level rise patterns, this study proposes a sterodynamic sea level decomposition for Boussinesq models with a specific focus on the mass change contribution. In particular, we explore the interplay between mass and density-driven changes and disentangle the respective influences of freshwater and salt mass changes. Based on a high-emission (SSP5-8.5) coupled regional projection of the Mediterranean climate system, we apply this methodology to the Mediterranean Sea.
Under the investigated scenario, the Mediterranean sterodynamic sea level is projected to rise by 32 cm by the end of the 21st century. We find that 24 cm are attributable to the global ocean temperature increase and 8 cm to regional hydrographic and mass changes, the so-called “dynamic sea level change”. Focusing on these regional patterns, our results reveal that the mediterranean dynamic sea level rise is predominantly caused by an increase in salt mass. Specifically, this increase results from an enhanced net volume transport through the Strait of Gibraltar in response to increased evaporation and steeper sea level gradient with the Atlantic Ocean. Finally, we attribute local sea level variations to changes in the mediterranean circulation and horizontal density variations. Overall, this study emphasizes the added value of a comprehensive decomposition of mass’ contribution for interpreting future sea level rise patterns.

How to cite: Gonzalez, N. M., Waldman, R., Parras-Berrocal, I. M., and Somot, S.: Decomposing steric and dynamic sea level trends in a future high-emission scenario of the Mediterranean Sea, EGU General Assembly 2025, Vienna, Austria, 27 Apr–2 May 2025, EGU25-16149, https://doi.org/10.5194/egusphere-egu25-16149, 2025.

EGU25-17187 | ECS | Posters on site | CL4.17

A new Bayesian approach to the inverse modelling of modern sea level change 

Daniel Heathcote and David Al-Attar

Estimates of mean sea level change in the 20th and 21st centuries are important for monitoring the effects of climate change. In particular, there is increasing interest in attributing the relative contributions to observed sea level change both globally and in specific regions. Here we present a new method for obtaining such quantitative inferences from combinations of satellite gravity, satellite altimetry, and tide gauge data. Our approach is based upon a full Bayesian solution to the associated inference problem which incorporates realistic priors on all unknowns along with a comprehensive treatment of observational uncertainties. An essential step within this method is the solution of both the sea level equation and its adjoint, with the latter approach being a new development. As part of this work, open source python libraries are being developed for sea level modelling and the solution of Bayesian inference problems within a function space setting. 

How to cite: Heathcote, D. and Al-Attar, D.: A new Bayesian approach to the inverse modelling of modern sea level change, EGU General Assembly 2025, Vienna, Austria, 27 Apr–2 May 2025, EGU25-17187, https://doi.org/10.5194/egusphere-egu25-17187, 2025.

EGU25-18262 | Posters on site | CL4.17

Evaluating late Holocene relative sea-level changes from the tropics: Matang Mangrove Forest Reserve, Malaysia. 

Timothy Shaw, Behara Satyanarayana, Wenshu Yap, Tanghua Li, Jędrzej Majewski, Fangyi Tan, Jennifer Walker, Mohd Fadzil, Adam Switzer, and Benjamin Horton

Reconstructions of past relative sea level (RSL) during the late Holocene have shown a response to natural climate warming and cooling phases such as the Medieval Climate Anomaly and Little Ice Age. Coupled with long-term instrumental measurements from tide gauges, they also showed a timing of emergence in RSL rate centered around the mid-19th century, with a 20th century rise that is extremely likely (P≥0.999) faster than the proceeding 3000 years. These conclusions, however, are derived from RSL reconstructions and tide-gauge records that are limited in tropical latitudes and currently excludes Southeast Asia hindering the interpretation of sea-level changes and validation of models that predict future spatial variability.

Here, we present a new RSL reconstruction using mangrove sediments from the Matang Mangrove Forest Reserve, western Peninsula Malaysia to constrain RSL change during the late Holocene. Following an extensive field reconnaissance, we collected a ~3 m core from the upper intertidal environment and modern surface samples across an intertidal-to-mangrove gradient to constrain modern and fossil indicative meanings. Selected samples were analyzed for organic content, foraminiferal assemblages and environmental DNA and sample sites were surveyed relative to local Malaysian national geodetic benchmarks using differential GPS. We constrained temporal uncertainties in the reconstruction using accelerator mass spectrometry radiocarbon dating of bulk sediment fine-fractions (n=11) coupled with short-lived radionuclide chronohorizons within a Bayesian age-depth framework.

Stratigraphic investigations revealed uniform sedimentary sequences comprising subtidal and intertidal silty clay muds overlain by organic (50% LOI) mangrove peats to depths of ~2.5 m within which foraminiferal tests are well preserved and dominated by typical agglutinated taxa including Arenoparrella mexicana and Trochammina inflata. Radiocarbon dating provides an excellent chronology of in sequence ages approximately ~2200 years old. We combined the proxy reconstruction with nearby tide gauge records and applied a spatiotemporal empirical hierarchical model to quantify magnitudes and rates of RSL change. We compare the RSL reconstruction with other new records from Singapore and use glacial isostatic adjustment model predictions to assess and discuss driving processes throughout the region.

How to cite: Shaw, T., Satyanarayana, B., Yap, W., Li, T., Majewski, J., Tan, F., Walker, J., Fadzil, M., Switzer, A., and Horton, B.: Evaluating late Holocene relative sea-level changes from the tropics: Matang Mangrove Forest Reserve, Malaysia., EGU General Assembly 2025, Vienna, Austria, 27 Apr–2 May 2025, EGU25-18262, https://doi.org/10.5194/egusphere-egu25-18262, 2025.

EGU25-21523 | Orals | CL4.17

Near-term future sea-level projections supported by extrapolation of tide-gauge observations 

Jinping Wang, Xuebin Zhang, John Church, Matt King, and Xianyao Chen

Global, regional and local sea-level projections rely on complex process-based models of the climate-ocean-cryosphere system. While extrapolation of observational data has been examined on global and regional scales, this approach has not yet been used for the additional complexities of local coastal sea-level projections. Here, we evaluate the sea level trend and acceleration for a global network of tide-gauge observations over 1970-2023, which are then extrapolated to provide local projections up to 2050 and compared with the process-based projections from the IPCC Sixth Assessment Report (AR6). For 2050 relative to 2020, the observation-based projections agree with AR6 process-based projections within the 90% uncertainty range at the majority (99%) of 237 tide gauges. Thus, the observation-based projections provide complementary perspectives of near-term local sea-level changes, and this agreement provides increased confidence in the current understanding and projections of sea-level changes over coming decades.

How to cite: Wang, J., Zhang, X., Church, J., King, M., and Chen, X.: Near-term future sea-level projections supported by extrapolation of tide-gauge observations, EGU General Assembly 2025, Vienna, Austria, 27 Apr–2 May 2025, EGU25-21523, https://doi.org/10.5194/egusphere-egu25-21523, 2025.

EGU25-726 | ECS | Orals | CL4.18

Intensified hydrological cycle, not sea level rise, caused PETM shelf deoxygenation  

Matthew Staitis, Mark Chapman, Nikolai Pedentchouk, Alina Marca, Paul Dennis, and Alexander Dickson

The Paleocene-Eocene Thermal Maximum (PETM) ~56 million years ago, provides one of the best geological analogues for investigating how marine oxygen levels respond to rapid global warming and massive perturbations to the global carbon cycle. Various studies on PETM shelf sections have documented the deposition of an extensive organic-rich sapropel horizon, which provides a unique geological archive into better understanding the crucial drivers and interactions responsible for PETM deoxygenation within shallow shelf settings. Changes in relative sea level and/or the hydrological cycle during the PETM have both been invoked as potential drivers behind this marine deoxygenation. However, there is currently a lack of high resolution dated PETM records which integrate and resolve the temporal relationship between these mechanisms and the onset of shelf deoxygenation. Therefore, we have investigated Kheu River; a key PETM section in the northern Caucasus which has previously produced several geochemical records indicating the prevalence of intermittent shallow marine anoxia and euxinia within the sapropel horizon. Our new datasets, together with published palaeoceanographic and palaeoclimatic proxy-based reconstructions from Kheu River, have been evaluated using a sequence stratigraphic framework and calibrated to an orbitally-tuned age model. Similar shallowing and deepening trends inferred from co-variations in geochemical, micropalaeontological, and sedimentological datasets suggest bottom water redox conditions at Kheu River were influenced by changes in relative sea level over ~105-year timescales. Despite this however, we show the deposition of the sapropel horizon occurred more rapidly during the first ~26 kyr of the PETM carbon isotope excursion (CIE), consistent with an intensified hydrological cycle driver. This transient hydrological driven deoxygenation event is also coeval with an interval of maximum continental weathering, nutrient, and sediment influx at Kheu River, suggesting shallow shelf environments were sites of diverse and dynamic biogeochemical process interactions during the onset of the PETM CIE. These results underscore the complexity of shallow marine ecosystem responses to climate forcing. They also provide valuable insights into the drivers of marine deoxygenation in a rapidly warming world, which can help us better predict future deoxygenation patterns. 

How to cite: Staitis, M., Chapman, M., Pedentchouk, N., Marca, A., Dennis, P., and Dickson, A.: Intensified hydrological cycle, not sea level rise, caused PETM shelf deoxygenation , EGU General Assembly 2025, Vienna, Austria, 27 Apr–2 May 2025, EGU25-726, https://doi.org/10.5194/egusphere-egu25-726, 2025.

EGU25-1807 | Orals | CL4.18

Orbital Influences on Deep Ocean Oxygen Concentrations and Respired Carbon Storage 

Allison Jacobel, Celeste Pallone, Kassandra Costa, Robert Anderson, and Jerry McManus

Quantitative records of bottom water oxygen (BWO) are critical for understanding deep ocean change through time. Because of the stoichiometric relationship between oxygen and carbon, BWO records provide insight into the physical and biogeochemical processes that control the air-sea partitioning of both gases over Quaternary glacial-interglacial cycles with important implications for climate and benthic habitats. Here, we present new geochemical datasets from Ocean Discovery Program (ODP) Site 1240 in the eastern equatorial Pacific to constrain BWO using a multiproxy approach (aU, Mn/Al, Δδ13C, and U/Ba). This combination of approaches, and a co-registered proxy record of the rain rate of organic carbon to the site (Baxs flux), allows us to quantitatively identify changes in BWO and to parse local and basin-wide contributions to the signal.

Our results provide direct evidence for the role of orbital precession and obliquity in driving deep sea respired carbon and oxygen concentrations, not just during deglaciations, but during both glacial and interglacial periods. We find variations in BWO on the order of ~50 μmol/kg that occur with ~23 kyr peridiocity during the substages of Marine Isotope Stage 5, and variations of ~100 μmol/kg on glacial-interglacial timescales. These findings have important implications for the role of insolation in driving deep ocean respired oxygen and carbon concentrations and point to physical and biogeochemical changes in the Southern Ocean as key drivers of planetary-scale carbon change.

How to cite: Jacobel, A., Pallone, C., Costa, K., Anderson, R., and McManus, J.: Orbital Influences on Deep Ocean Oxygen Concentrations and Respired Carbon Storage, EGU General Assembly 2025, Vienna, Austria, 27 Apr–2 May 2025, EGU25-1807, https://doi.org/10.5194/egusphere-egu25-1807, 2025.

EGU25-2369 | ECS | Posters on site | CL4.18

Episodic intensification of marine phosphorus burial and oceanic oxygen minimum zone expansion over the last 80 million years 

Jinzhou Peng, Dengfeng Li, Simon Poulton, Gary O’Sullivan, David Chew, Yu Fu, and Xiaoming Sun

Marine phosphatization events cause episodic carbonate fluorapatite (CFA) precipitation on seamounts, and are commonly linked to growth hiatuses in ferromanganese (Fe-Mn) crusts, provide critical archives for reconstructing past ocean oxygen dynamics and phosphorus cycling due to the tight relationship with oceanic oxygen minimum zones(OMZs). However, the complete record of these events and their paleoenvironmental significance remains poorly understood, in large part due to poor age constraints. Here, we apply U-Pb dating to CFA in Fe-Mn crusts from Western Pacific seamounts. These data exhibit good alignment with Sr isotope ages, revealing six potential phosphatization events. This established CFA chronology tightens the timespan of phosphatization events and refines the age framework of Fe-Mn crusts. We subsequently utilize a multiproxy approach to demonstrate that the phosphatization events occurred coeval with the expansion of oceanic OMZs. The Western Pacific Fe-Mn crusts thus document major perturbations in global oceanic phosphorus cycling, which appear to have been driven by climate-induced increases in primary productivity linked to changes in global ocean circulation. These findings offer insights into potential implications for nutrient cycling, marine ecosystems, and the evolution of OMZs.

How to cite: Peng, J., Li, D., Poulton, S., O’Sullivan, G., Chew, D., Fu, Y., and Sun, X.: Episodic intensification of marine phosphorus burial and oceanic oxygen minimum zone expansion over the last 80 million years, EGU General Assembly 2025, Vienna, Austria, 27 Apr–2 May 2025, EGU25-2369, https://doi.org/10.5194/egusphere-egu25-2369, 2025.

EGU25-2419 | ECS | Posters on site | CL4.18

Reconstructing the OMZ in the east Pacific during the Pliocene using G. hexagonus 

Yu-Hsin Huang, Nicolaas Glock, and Jeroen Groeneveld

Ocean oxygen concentration has been reported to decline over the past few decades due to the ongoing climate crisis. The development of the Oxygen Minimum Zone (OMZ) during the Pliocene (5.3–2.6 Ma) offers a valuable analog for understanding ocean oxygenation under modern climate change, as the Pliocene shares similar climatic conditions with those in the present. However, the mechanisms controlling OMZ development during this period are not fully understood, highlighting the need for suitable proxies to provide further insights. Recent studies have proposed the planktic foraminifer Globorotaloides hexagonus as a potential direct indicator of OMZ variability, assisting investigations into oxygen-depleted environments. While previous research suggests that modern G. hexagonus responds to change in water oxygen concentration through variations in shell porosity, its application in paleo-reconstructions remains unexplored. Thus, the biogeochemical relationship between G. hexagonus and OMZs requires additional investigation. In this study, we quantified the abundance of G. hexagonus at Ocean Drilling Program (ODP) Site 1241 in the East Equatorial Pacific to investigate its relationship with oxygen concentrations during glacial-interglacial cycles in the Pliocene. Our results indicate significant variability in G. hexagonus abundance, suggesting changes in OMZ. The results initially focus on Marine Isotope Stages (MIS) 96-100 (~2.55–2.4 Ma), where a correlation appears between the trend in G. hexagonus abundance and precession variability cycles (insolation). In contrast, no significant variability patterns are observed around MIS M2 (~3.3 Ma). We then selected four samples characterized by high and low G. hexagonus abundance and captured their images using scanning electron microscopy (SEM). A deep learning algorithm, initially trained for pore morphometry in benthic foraminifera, was retrained specifically to analyze G. hexagonus SEM images, enabling efficient obtaining of pore parameters (porosity, pore size, and pore density). Significant differences in porosity between high- and low-abundance groups suggest that increased porosity is associated with stronger OMZ, consistent with the abundance counts. Statistical analysis indicates that porosity variations are primarily driven by changes in pore size rather than pore density. Although the current findings cover only the ~2.55–2.4 Ma interval, they provide robust evidence for oxygenation-related adaptations in G. hexagonus abundance and pore morphology. Furthermore, extending the G. hexagonus abundance study from 3.3-2.4 Ma and including Mn/Ca analyses on the tests of G. hexagonus will provide more robust evidence on the controlling forces behind the variability in OMZ intensity during the Pliocene.


How to cite: Huang, Y.-H., Glock, N., and Groeneveld, J.: Reconstructing the OMZ in the east Pacific during the Pliocene using G. hexagonus, EGU General Assembly 2025, Vienna, Austria, 27 Apr–2 May 2025, EGU25-2419, https://doi.org/10.5194/egusphere-egu25-2419, 2025.

The oxygen concentration of oceanic deep waters in the Pacific and atmospheric carbon dioxide (pCO2) have been found to be intrinsically linked during glacial-interglacial cycles through processes such as organic carbon remineralization and the storage of dissolved inorganic carbon in the deep ocean. However, the persistence of this link over the Neogene is unclear. Here, we present a reconstruction of oxygenation history over the past 24 million years at IODP Site U1438B (4700.5 m water depth) in the Philippian Sea, where the bottom waters are mainly originated from the Lower Circumpolar Deep Water (LCDW). The employed proxies for oxygenation are the Alcohol Preservation Index (API) and U/Ba ratio. Our results reveal an overall trend of decreased bottom water oxygenation since the early Miocene, which aligns with the long-term decline in atmospheric pCO2. Notably, we identify a period of significant decrease of oxygenation from 16–12 million years ago (Ma), concurrent with the most significant CO2 decline in the Neogene centered at the East Antarctic ice sheet (EAIS) expansion. We propose that this significant decreases of oxygenation, indicative of increase in deep-ocean respired carbon pool, was caused by weakened LCDW ventilation due to the EAIS expansion. Interestingly, during the Arctic polar ice sheet expansion at the Pliocene-Pleistocene transition at around 3-2 Ma, LCDW oxygenation also weakened significantly, although the LCDW was unlikely affected by the hypothesized sub-Arctic deep water. Nevertheless, our results support an intrinsic connection between the deep Pacific respired carbon pool and atmospheric CO2 that has existed since the early Miocene.

How to cite: Dong, K. and Jia, G.: Changes in Deep Water Oxygenation in the Philipean Sea Over the Past 24 Million Years: Insights from IODP Site U1438B, EGU General Assembly 2025, Vienna, Austria, 27 Apr–2 May 2025, EGU25-3423, https://doi.org/10.5194/egusphere-egu25-3423, 2025.

EGU25-7994 | Posters on site | CL4.18

Paleoriver discharge controlled by precession cycle in the North Africa over the past 240,000 years: relationship to sapropel formation 

Kazuyo Tachikawa, François Beny, Laurence Vidal, Abel Guihou, Corinne Sonzogni, Sandrine conrod, Adnya Pratiwi, Pierre Deschamps, and Hartmut Schultz

The sedimentary sequence of the eastern Mediterranean is often marked by organic-rich layers called sapropels. Sapropel formation was mainly caused by excess freshwater input and the subsequent reduction of ventilation due to an enhanced African monsoon combined with deglacial water input. However, the paleoriver discharge from the North Africa under interglacial and glacial boundary conditions and its impact on the sapropel formation has not been fully clarified yet. We obtained an Nd isotopic composition (εNd) record of the detrital fraction as well as a grain size indicator of a marine sediment core from the eastern side of the Gulf of Sirte to reconstruct the reactivation of Libyan fluvial fossil systems for the past 240,000 years. The εNd record showed a systematic increase from a baseline of -12 to -9 to -8 for sapropels S1 to S9, including the glacial sapropel S6. This εNd shift was synchronous with barium enrichment and depleted planktonic foraminiferal oxygen and carbon isotopic compositions that marked the sapropels. Based on a new εNd map of source regions in North Africa, the higher εNd values can be explained by preferential weathering of volcanic fields and soils and increased river discharge under both interglacial and glacial conditions. The grain size indicator showed an increase in fine river particles relative to coarse atmospheric dust when detrital εNd was higher, supporting this interpretation. These observations are consistent with the available detrital εNd records, suggesting that the higher isotopic signals during sapropel formation are a basin-wide feature in the Gulf of Sirte. The hydrological cycle in the study area was estimated to be more sensitive to precessional forcing than to high-latitude climate conditions, being consistent with previous modelling studies.

How to cite: Tachikawa, K., Beny, F., Vidal, L., Guihou, A., Sonzogni, C., conrod, S., Pratiwi, A., Deschamps, P., and Schultz, H.: Paleoriver discharge controlled by precession cycle in the North Africa over the past 240,000 years: relationship to sapropel formation, EGU General Assembly 2025, Vienna, Austria, 27 Apr–2 May 2025, EGU25-7994, https://doi.org/10.5194/egusphere-egu25-7994, 2025.

EGU25-8311 | ECS | Orals | CL4.18

Investigating I/Ca ratio in planktic foraminifera: an integrated approach in the Mediterranean Sea and beyond 

Vincent Guarinos, Kazuyo Tachikawa, Thomas Chalk, Marta Garcia, Giuseppe Siani, Marie Revel, Hartmut Schulz, and Francisco Sierro

Global ocean oxygen depletion is a growing concern, with direct observations showing widespread decline that is not fully captured by existing models. The dynamics of oxygenation are critical to marine ecosystem health and are influenced by physical and biogeochemical factors. To reconstruct past variation of dissolved oxygen content, foraminiferal iodine to calcium (I/Ca) ratio has been developed. This proxy is based on the fact that iodine speciation is dependent on oxygen content and that only iodate ions (IO3-) can be incorporated into the calcite lattice by substitution for carbonate ions. However, our knowledge of foraminiferal I/Ca behavior needs improvement because the relationship between planktonic foraminiferal I/Ca and oxygen content in the upper 500m water column appears to be empirical and the influence of physical and biogeochemical parameters has not been fully addressed yet, and thus prohibits the development of a fully quantitative proxy.

In this study, we present the first planktic foraminiferal I/Ca data from core-top material (late Holocene) in the Mediterranean Sea and a compilation of previously published core-top and plankton tow I/Ca data from the global ocean. We use this database to examine the influence of the maximum and minimum oxygen concentration, temperature, salinity, nutrients, pH, alkalinity, chlorophyll, water velocities and mixed layer depth on the I/Ca proxy. Additionally, we assess the effects of water depth and sample age to monitor possible iodine accumulation during the foraminiferal test settling and early diagenetic effects. We also investigate the potential for differential behaviour between foraminiferal species by categorising by the presence/absence of symbionts.

We find unexpectedly low I/Ca as low as 1 µmol/mol in samples from the western basin of the Mediterranean Sea, providing the first low I/Ca from fossil foraminiferal which lived in waters thought to be highly oxygenated. Principal Component Analysis (PCA) confirms the dominance of oxygen content on foraminiferal I/Ca, however, analysis of the foraminiferal I/Ca residuals after subtraction of oxygen dependence suggest a potential role of temperature. No clear trend is not observed between the residuals and sample age, suggesting a negligible influence of burial diagenesis. Iodine accumulation during the settling of foraminiferal tests has been proposed to explain the high I/Ca of fossil samples when compared to plankton tows, but no trends are visible between our residuals and water depth, implying that there is no systematic effect from post-mortem settling. The cause of low foraminiferal I/Ca in oxygenated waters remains unclear and may involve poorly constrained local oxygen variability, the chemical dynamics of iodine, iodine incorporation mechanisms, or other unknown parameters.

How to cite: Guarinos, V., Tachikawa, K., Chalk, T., Garcia, M., Siani, G., Revel, M., Schulz, H., and Sierro, F.: Investigating I/Ca ratio in planktic foraminifera: an integrated approach in the Mediterranean Sea and beyond, EGU General Assembly 2025, Vienna, Austria, 27 Apr–2 May 2025, EGU25-8311, https://doi.org/10.5194/egusphere-egu25-8311, 2025.

EGU25-9257 | Orals | CL4.18

 Oxygenation of western Norwegian fjords 

Bjørg Risebrobakken, Mattia Ferraro, Irina Polovodova Asteman, Amandine Tisserand, Matthias Moros, Dag Inge Blindheim, Haflidi Haflidason, Elin Darelius, and Agnes Weiner

In fjords, oxygenation depends on exchange or no exchange of deep fjord basin water. In sill fjords, water mass exchange is directly linked to the density of the water mass found around sill depth. Along the coast of Norway, warming water entails reduced density and less frequent renewal events. To evaluate to what degree such observed changes are within the range of natural variability, we need to expand our knowledge base beyond observations. Here, we present reconstructions of fjord oxygenation and associated water mass density in and outside of western Norwegian sill fjords. Sediment records covering the last few centuries will be presented, covering the transition from the Little Ice Age towards the recent warming, hence documenting responses taking place while transferring from a somewhat colder to warmer than preindustrial climate. The fjord basins were characterized by a transition from less well oxygenated to better oxygenated fjord bottom water. Drivers of change in fjord oxygenation and how the fjord basin changes are impacted by oceanographic changes taking place in the more open coastal oceans will be discussed.


How to cite: Risebrobakken, B., Ferraro, M., Polovodova Asteman, I., Tisserand, A., Moros, M., Blindheim, D. I., Haflidason, H., Darelius, E., and Weiner, A.:  Oxygenation of western Norwegian fjords, EGU General Assembly 2025, Vienna, Austria, 27 Apr–2 May 2025, EGU25-9257, https://doi.org/10.5194/egusphere-egu25-9257, 2025.

EGU25-9638 | ECS | Orals | CL4.18

Temporal, morphological, and taxonomic frameworks for calibrating benthic foraminifera pores patterns as a proxy for paleoxygenation in the Southeast Pacific 

Sebastián Garrido, Babette A. A. Hoogakker, Julien Richirt, Dharma Reyes-Macaya, Iván Hernández-Almeida, Jorge Cardich, Alexis Castillo Bruna, Marie P. A. Fouet, Eugenia M. Gayo, Dierk Hebbeln, Laura Farías, and Frans Jorissen

Calcareous benthic foraminifera can develop pores in their shells for gas exchange with seawater. Pore patterns, like porosity, pore density, and pore size, are influenced by environmental factors like bottom water dissolved oxygen concentration (BWDO). Some benthic foraminiferal species increase their test porosity under low BWDO, making them a useful proxy for reconstructing past oxygenation. The pore patterns proxy for BWDO is validated in the Southeast Pacific (SEP) by examining six benthic foraminifera species compared to estimate BWDO on the sediment sites. Specimens were collected from surface sediments at 24–3,252 m water depths across the SEP (12°–44°S) and selected based on their Rose Bengal staining, oxygen isotopes, and calibrated sediment radiocarbon age to reflect modern conditions. The benthic foraminiferal species measured in this study typically have a planispiral shell with pores on two sides: pores on the umbilical side, which faces the water column, and the spiral side, commonly used for attachment. Both sides are measured to test their role in oxygen uptake. Porosity, pore density, and size were measured on all visible chambers and, specifically, on the penultimate and antepenultimate chambers. In the SEP, the main response to BWDO changes occurs on the umbilical side of the benthic foraminifera, while some oxygen uptake might also happen on the spiral side. Combined benthic foraminifera species, and solely C. wuellerstorfi, increase umbilical porosity under lower BWDO. These findings align with global calibrations, supporting the quantitative use of the benthic foraminifera pore patterns proxy to reconstruct past BWDO in other oceans, with an error range of around ±60 µmol kg-1 for BWDO above 100 µmol kg-1 and around ±20 µmol kg-1 for BWDO lower than 100 µmol kg-1.

How to cite: Garrido, S., Hoogakker, B. A. A., Richirt, J., Reyes-Macaya, D., Hernández-Almeida, I., Cardich, J., Castillo Bruna, A., Fouet, M. P. A., Gayo, E. M., Hebbeln, D., Farías, L., and Jorissen, F.: Temporal, morphological, and taxonomic frameworks for calibrating benthic foraminifera pores patterns as a proxy for paleoxygenation in the Southeast Pacific, EGU General Assembly 2025, Vienna, Austria, 27 Apr–2 May 2025, EGU25-9638, https://doi.org/10.5194/egusphere-egu25-9638, 2025.

EGU25-10221 | ECS | Posters on site | CL4.18

When seafloor anoxia sharpens paleoenvironmental reconstructions: signature of sapropel S1 and exceptional preservation of fine laminations to decipher climatic and oceanographic variations in the Ionian Sea. 

Hélène Belliard, Nathalie Babonneau, Antonio Cattaneo, Tommaso Tesi, Alessio Nogarotto, Vincent Coussin, and Marc-André Gutscher

The Ionian Sea is a deep-marine basin in the central Mediterranean Sea affected by great earthquakes and tsunamis linked to the tectonic activity of the Calabrian and Hellenic subduction zones. The sedimentary record presents gravity-driven deposits in the basin (turbidites, debrites, megabeds) and includes a particular unit formed during oxygen depletion (10–6.3 kyr), corresponding to the sapropel S1 layer. The S1 record in the Ionian Sea was typically described as a carbon-enriched layer with a thickness of a few centimeters. New data collected during the FOCUS-X2 campaign (2022), off Etna, reveal an exceptional 15 m thickness at 2050 m of water depth for the interval of 10-6.3 kyr. 


Sediment core FX2-CS14 is located in a fault graben, which acts as a sediment trap. It offers an unprecedented opportunity to study the sedimentary records variations along the last 22 kyrs and to analyse in detail the S1-equivalent sapropel unit.  Core FX2-CS14 dataset is comprised of: major element composition, physical properties, X-ray imagery (XCT), grain size measuremets, and radiocarbon dates. Organic geochemical analyses included measurements of organic carbon, nitrogen, δ13C isotopic composition, and biomarkers (lignin and cutin).


The sedimentary facies before and after the S1-equivalent layer include: 1) Debrites, 2) Turbidites, 3) Fine brown deposits, 4) Light brown hemipelagites with foraminifera and bioturbation, and 5) Tephra. The S1-equivalent unit displays numerous millimeter-scale laminated facies, including up to 3-5 unique sub-facies and micro-turbidites (which are rare or not visible outside of this period), likely due to better preservation. Bioturbation and benthic foraminifera are absent in the S1-equivalent unit, except during its interruption (S1i), indicating seafloor anoxia. This anoxia enables high-resolution studies of climatic and oceanographic variations during the sapropel S1 equivalent period. 


The geochemical analyses show that the sapropel S1-equivalent deposits have low organic carbon (0–1%) due to sapropel dilution by large volume of detrital sediment (690 gravity-flow event beds). Organic geochemistry reveals depleted δ¹³C, indicating terrestrial input, and mixed sedimentary origins of the organic matter. The sedimentary record of this coring site shows marine and continental signals, with evidence of older components, likely influenced by floods and river discharge. The extended unit highlights intense land-ocean exchanges and strong connectivity.


The frequency of gravity deposits (turbidites) increases significantly from ~5 events/1000 years in the recent period to ~60 events/1000 years during the S1-equivalent unit. In recent period, the gravity-driven deposits frequency seems consistent with the occurrence of strong earthquake (M ≥6). However, during the S1-equivalent period, turbidites are probably related to other triggering mechanism. Micro-turbidite (≤2 mm) could result from decadal-scale, climate-driven torrential floods triggering turbidity currents (or hyperpycnal flows). 

How to cite: Belliard, H., Babonneau, N., Cattaneo, A., Tesi, T., Nogarotto, A., Coussin, V., and Gutscher, M.-A.: When seafloor anoxia sharpens paleoenvironmental reconstructions: signature of sapropel S1 and exceptional preservation of fine laminations to decipher climatic and oceanographic variations in the Ionian Sea., EGU General Assembly 2025, Vienna, Austria, 27 Apr–2 May 2025, EGU25-10221, https://doi.org/10.5194/egusphere-egu25-10221, 2025.

EGU25-11797 | Orals | CL4.18 | Highlight

Long-Term Changes in Oxygen Dynamics in the Northern Benguela Upwelling System 

Tomas Lovato, Amr Talaat Salama, Elisa Lovecchio, Momme Butenschön, Marco Zavatarelli, and Stephanie Henson

The Benguela Upwelling System (BUS) is one of the world’s most productive marine ecosystems, driven by wind-induced upwelling that delivers nutrient-rich deep waters to the surface, fueling high primary productivity. Dissolved oxygen (DO) in the BUS exhibits a pronounced latitudinal gradient, with the northern BUS (NBUS, 15°S–23°S) persistently hypoxic (<60 mmol O₂/m³), in stark contrast to the well-oxygenated southern BUS. Climate warming intensifies these challenges, as rising ocean temperatures, stronger upwelling, and increased oxygen consumption drive reductions in DO levels, threatening fisheries, benthic biodiversity, and ecosystem services.

This study addresses key questions on the long-term changes in DO dynamics in the NBUS: (1) What is the long-term variability in the total DO inventory over the past four decades (1980–2020)? (2) What are the primary drivers of oxygenation and deoxygenation trends? (3) What role does SACW play in regulating oxygen levels? (4) How does the OMZ vary in spatial extent, volume, and boundary depth over time? (5) What are the relative contributions of physical and biogeochemical processes to DO variability?

To investigate these questions, we employ a coupled physical-biogeochemical modeling system based on the Nucleus for European Modeling of the Ocean (NEMO v4.2.2) coupled with the Biogeochemical Flux Model (BFM v5.3). The model, with a horizontal resolution of 1/16° (~7 km), simulates pelagic-benthic interactions, lower trophic-level dynamics, and sediment remineralization, as driven by ERA5 atmospheric reanalysis and GLOFASv2.1 river discharge data.

Our results reveal a vertical dipole in oxygen trends. Positive trends dominate the upper 200 meters, linked to a declining SACW fraction (0–400 meters), while negative trends at 400–950 meters are primarily driven by ocean warming. OMZs show contrasting patterns, with the threshold OMZ (<120 mmol O₂/m³) expanding and the core OMZ (<20 mmol O₂/m³) contracting. This study highlights the complex interplay between warming, upwelling intensification, and ocean circulation in shaping oxygen dynamics in this highly productive marine system.

How to cite: Lovato, T., Talaat Salama, A., Lovecchio, E., Butenschön, M., Zavatarelli, M., and Henson, S.: Long-Term Changes in Oxygen Dynamics in the Northern Benguela Upwelling System, EGU General Assembly 2025, Vienna, Austria, 27 Apr–2 May 2025, EGU25-11797, https://doi.org/10.5194/egusphere-egu25-11797, 2025.

The decline of ocean oxygen concentrations is an environmental issue of increasing concern. Detrimental changes have been observed in the last century, most prevalently in coastal marine environments. Drivers include warming, increased water stratification, higher biological oxygen demands, and other anthropogenic influences such as eutrophication. Current trends are predicted to continue in coming decades to centuries, but model uncertainties in future outcomes and severity persist. Long-term records of marine oxygen dynamics are crucial for improving climate models, contextualizing modern deoxygenation trends and understanding underlying mechanisms. Efforts to expand the toolbox of proxies capable of resolving low-oxygen states in the geological past are ongoing. Redox sensitive trace elements (e.g., manganese, iodine or uranium) in biogenic calcium-carbonates are among the emerging proxies. I will explore aspects of coastal oxygen dynamics and elemental cycling relevant for the calibration of trace element proxies on the example of manganese-to-calcium ratios (Mn/Ca) in benthic foraminifera. I showcase studies demonstrating (1) the potential of foraminiferal Mn/Ca as high-resolution archives of oxygen changes, and its current limitations, (2) the use of micro-analytical techniques such as laser-ablation ICP MS analyses and µXRF imaging in calibration approaches, and (3) the influence of biological factors on oxygen-proxy relationships. In conclusion, understanding the complexity of geochemical cycling in the light of oxygen thresholds, environmental settings and biological controls is critical for developing robust trace element proxies. Continued efforts of refining the manganese and other trace element proxies offer promising avenues towards quantitative reconstructions of bottom-water oxygen concentrations in the low oxygen-range, and a better understanding of past and present states of the marine environment.

How to cite: Brinkmann, I.: Coastal oxygen changes and element cycling: foraminifera as benthic monitors, EGU General Assembly 2025, Vienna, Austria, 27 Apr–2 May 2025, EGU25-12568, https://doi.org/10.5194/egusphere-egu25-12568, 2025.

EGU25-16103 | Orals | CL4.18

Deglacial deoxygenation event in Mediterranean intermediate waters, a prelude to the last sapropel formation 

Isabel Cacho, Leopoldo Pena, Jaime Frigola, Albert Català, Maria de la Fuente, Sergi Trias-Navarro, Sara Campderrós, Mar Selvaggi, Judit Torner, Giulia Margaritelli, José Noel Pérez-Asensio, Guillem Corbera, Dimitris Evangelinos, and Fabrizio Lirer

Reconstructing past changes in oxygen content can be challenging due to some limitations of the proxies used, which are often not continuously represented in the sedimentary record. Here, we present a series of past oxygen reconstructions in the Mediterranean Sea based on the measurement of U/Mn ratios over foraminifera diagenetic coatings. We first test the feasibility of the proxy through different oxygen content locations and explore the fixation of the geochemical signal over different foraminiferal carriers and through the redox zone. The feasibility of the proxy is further tested by direct comparison with oxygen reconstructions based on benthic foraminiferal assemblages, supporting the robustness of our oxygen content proxy. This proxy has been applied over the last deglaciation and the Holocene in a collection of cores covering a wide range of depths in the western Mediterranean, as well as key sites in the eastern Mediterranean. This exercise provides a new insight into the evolution of the Mediterranean thermohaline circulation during the last deglaciation. Our reconstructions confirm the development of the already described deglacial organic-rich layer in the western Mediterranean, but prove that this stagnation process started in relation to the Heinrich 1 ice melting. Surprisingly, they also provide evidence for the development of a strong oxygen minimum zone in intermediate layers of the western Mediterranean, suggesting that the deep water oxygen depletion was much weaker. This finding confirms that the previously described weakening of the western Mediterranean deep water convection associated with this event was closely linked to a smoother circulation of the Levantine Intermediate Waters (LIW). Our reconstructions also support a general reorganization of the Mediterranean circulation during the Younger Dryas, which, according to Nd isotope data (Trias-Navarro et al., 2023), it was associated with a general intensification of the LIW outflow into the western Mediterranean. This western basin began to re-ventilate at this time, leading to a progressively thinner oxygen minimum zone at intermediate depths, while the re-intensification of deep convection occurred later, after 9 kyr. This change coincides with the onset the deep anoxic conditions development that led to the formation of the last sapropel in the eastern Mediterranean. Curiously, at this time in the western Mediterranean, maximum oxygenation occurred at the depth of the present LIW, suggesting the appearance of a different source of well ventilated water mass (Selvaggi et al., in review). Overall, these results indicate a tight but complex connection between the convection cells of the eastern and western Mediterranean, but also reflect the high sensitivity of this circulation system to past climate changes and their control in the development of intense deoxygenation events.


Trias-Navarro, S., et al. (2023). Eastern Mediterranean water outflow during the Younger Dryas was twice that of the present day. Communications Earth & Environment, 4(1), 147. https://doi.org/10.1038/s43247-023-00812-7


Selvaggi, M. et al. (in revision). Environmental Conditions Controlling Cold-Water Coral Growth in the Southern Alboran Sea Since the Last Deglaciation. Global and Planetary Change. Available at SSRN: https://ssrn.com/abstract=4991071 or http://dx.doi.org/10.2139/ssrn.4991071

How to cite: Cacho, I., Pena, L., Frigola, J., Català, A., de la Fuente, M., Trias-Navarro, S., Campderrós, S., Selvaggi, M., Torner, J., Margaritelli, G., Pérez-Asensio, J. N., Corbera, G., Evangelinos, D., and Lirer, F.: Deglacial deoxygenation event in Mediterranean intermediate waters, a prelude to the last sapropel formation, EGU General Assembly 2025, Vienna, Austria, 27 Apr–2 May 2025, EGU25-16103, https://doi.org/10.5194/egusphere-egu25-16103, 2025.

EGU25-16248 | ECS | Orals | CL4.18

The relationship of transient oxygen and carbon cycle changes in simulations of repeated glacial cycles 

Markus Adloff, Frerk Pöppelmeier, Thomas F. Stocker, and Fortunat Joos

The glacial cycles of the late Pleistocene directly influenced the  oxygenation pattern of the global ocean, due to physical and biological changes responding to orbital and climatic change. These changes in past oxygenation had profound implications for carbon storage in seawater and marine sediments. Here we show how different Earth system processes affect benthic oxygen concentrations over repeated glacial cycles in the fully coupled Earth system model Bern3D. We further investigate how these oxygen changes relate to changes in marine carbon storage. Pioneering work on glacial-interglacial marine carbon cycle changes predicted linear relationships between Apparent Oxygen Utilization (AOU) and regenerated Dissolved Organic Carbon (DIC) changes, which are commonly used to estimate marine, and in some cases even atmospheric, carbon reservoir changes from reconstructions of these quantities. The new simulations show that the often-postulated linear correlations break in simulations of climatic change, often even in a closed atmosphere-ocean system that does not take into account weathering-burial imbalances. The underlying conceptual and box models do not capture essential dynamics of the real world systems, most importantly saturation disequilibria in the surface ocean. Hence, the linear relationships between these variables break in 3-d dynamic circulation models. AOU is therefore not a reliable measure for regenerated carbon in the ocean interior1,2 over glacial cycles and thus not a direct tracer of remineralisation. However, the perturbations of the oxygen cycle are, albeit in an intricate manner, related to those of the carbon cycle, and thus oxygen proxy reconstructions provide a constraint on carbon flux changes. For example, spatial and temporal patterns of oxygen concentration changes provide strong constraints for temporal changes of several Earth system processes (e.g. sea ice expansion, circulation and remineralisation) and oxygen proxy records are thus indispensable to test alternative scenarios of past ocean carbon cycle and atmospheric CO2 in Earth system models.


References

1 Cliff, E., Khatiwala, S. and Schmittner, A., 2021. Glacial deep ocean deoxygenation driven by biologically mediated air–sea disequilibrium. Nature Geoscience, 14(1), pp.43-50.

2 Schmittner, A. and Fillman, N.J., 2024. Carbon and carbon-13 in the preindustrial and glacial ocean. PLOS Climate, 3(7), p.e0000434.

How to cite: Adloff, M., Pöppelmeier, F., Stocker, T. F., and Joos, F.: The relationship of transient oxygen and carbon cycle changes in simulations of repeated glacial cycles, EGU General Assembly 2025, Vienna, Austria, 27 Apr–2 May 2025, EGU25-16248, https://doi.org/10.5194/egusphere-egu25-16248, 2025.

EGU25-17056 | ECS | Posters on site | CL4.18

Oxygenation and Ventilation in the Intermediate Southeast Pacific Ocean during abrupt Antarctic warming event AIM8  

Pushpak Martin John Nadar, Kikki Kleiven, Ulysses Ninnemann, and Nil Irvali

Antarctic Intermediate Water (AAIW) and Subantarctic Mode Water (SAMW) form the two main intermediate depth water masses from the Southeast Pacific Ocean. They sequester and store copious quantities of atmospheric gases, such as CO2 and O2, and are the most important global oxygen source to the thermocline and equatorial region. These intermediate ocean water masses thus regulate and modulate the benthic ecosystem and nutrient cycling. They are also sensitive recorders of changes in ocean circulation and play a critical role in contributing or triggering interhemispheric overturning changes by changing its depth, distribution, and properties. It is therefore important to understand the environmental feedback to the variations in intermediate ocean to define the tipping points in the ocean-climate system.  

The variability of the AAIW specifically during abrupt climatic transitions such as the Antarctic Isotope Maxima event (AIM 8) is not yet constrained due to scarcity of well-dated high-resolution records. Antarctic Isotope Maxima (AIM) events are millennial-scale abrupt warming events during Marine Isotope Stage 3 (MIS-3; 57-29 kya) identified in the Antarctic ice core records. They are characterized by 1 to 3°C warming and cooling phase and are potentially triggered by AMOC instability due to freshwater discharge, internal sea-ice-ocean-atmospheric variability and Southern Ocean dynamics. Here, we use a high-resolution sediment core, Ocean Drilling Program (ODP) Site 1233 (41º00′S; 74º27′W at 838m water depth), recovered from intermediate water depths in the SE Pacific to study the physical and biogeochemical characteristics of the AAIW during AIM 8 using stable isotope measurements from epifaunal and infaunal benthic foraminifera. 

The reconstructed [O2] shows a rapid rise in values to about 350 μmol/kg during the abrupt AIM 8 event, providing key insights on ocean ventilation and water mass structure. A stark contrast in the rate of change in [O2] signal in comparison to the rate of change in δ¹³C and δ¹⁸O signals in the interval 37–39.4 ka explains sensitivity of interior ocean ventilation as response to changing water mass structure or rates of warming. Our high-resolution study thus resolves the rates of changes in the water masses influencing oxygenation of the interior ocean at its source location in the SE Pacific. Our results highlight the drivers of oxygenation changes such as changes in ventilation, thermocline dynamics, and ocean circulation operating independently or in combination during the abrupt AIM 8 event. The magnitude and rate of ocean ventilation changes can potentially be used as an analogue for Last Glacial Maximum to define a tipping point within the ocean-climate system. 

How to cite: Nadar, P. M. J., Kleiven, K., Ninnemann, U., and Irvali, N.: Oxygenation and Ventilation in the Intermediate Southeast Pacific Ocean during abrupt Antarctic warming event AIM8 , EGU General Assembly 2025, Vienna, Austria, 27 Apr–2 May 2025, EGU25-17056, https://doi.org/10.5194/egusphere-egu25-17056, 2025.

EGU25-17939 | ECS | Posters on site | CL4.18

Shift in Sedimentary Dynamics in the Belluno Basin (Southern Alps, Italy) after the Peak of the Early Toarcian Oceanic Anoxic Event 

Jan Meissner, Miriam Cobianchi, Axel Munnecke, and Vincenzo Picotti

The early Toarcian Oceanic Anoxic Event (T-OAE, ∼183 Ma) provides an analog to the consequences of extreme climate change and major perturbation of the global carbon cycle. This disruption of the Earth’s system in the Early Jurassic caused the extension of anoxic and euxinic waters, notably in the Alpine-Mediterranean Tethys and across the northern European epicontinental shelf and north African margin, as indicated in the geological record by the widespread occurrence of organic-rich black shales. This event has been extensively studied in marine and continental records. However, the environmental dynamics during the recovery phase of the T-OAE are still poorly understood.

The Southern Alps of northern Italy are a critical region for reconstructing the evolution and dynamics of the T-OAE. The best outcrops of the associated black shales are found in the Belluno Basin, a narrow pelagic trough that formed between two carbonate platforms in the earliest Jurassic. Here, they are found in successions featuring large-scale rhythmic alternations between limestone and marlstone, which are interpreted as having a mostly primary origin.

In this study, we integrate petrographic, geochemical, and mineralogical data from the Vajont Gorge section near Longarone to investigate short-term signals (on a couplet scale) and long-term paleoenvironmental trends (on an outcrop scale) after the peak of the T-OAE.

Our results reveal that the recovery phase from the negative carbon-isotope excursion of the T-OAE is accompanied by a gradual increase in carbonate deposition or preservation. We argue that a significant portion of this mud-grade carbonate originated from calcareous nannoplankton and aragonitic muds shed off platforms. However, the short-term signal of the initial variations in the aragonite input into the deeper basin was lost due to early diagenetic carbonate redistribution processes.

Furthermore, our findings suggest that the lithological rhythms are linked to cyclic variations in the strength of bottom-water currents. We hypothesize that these variations in bottom current activity were caused by episodic reactivation of the thermohaline circulation in the Belluno Basin, which could have facilitated the amelioration of bottom-water oxygen conditions after prolonged phases of water mass stagnation during the peak of the T-OAE.

How to cite: Meissner, J., Cobianchi, M., Munnecke, A., and Picotti, V.: Shift in Sedimentary Dynamics in the Belluno Basin (Southern Alps, Italy) after the Peak of the Early Toarcian Oceanic Anoxic Event, EGU General Assembly 2025, Vienna, Austria, 27 Apr–2 May 2025, EGU25-17939, https://doi.org/10.5194/egusphere-egu25-17939, 2025.

Ice core records show a sigificant decline in atmospheric oxygen concentrations during the last 800ka (Stolper et al., 2016). Recent data from blue ice seem to show similar oxygen concentrations from around 800 ka to 1500 ka (Yan et al 2021) and this change has been suggested as one possible driver of the Mid Pleistocene Transition (MPT) from 40ka (one obliquity cycle) to 80 or 120 ka glacial cycles (two or three obliquity cycles). We have shown that not only shallow but also deep terrestrial pyrite oxidation and potentially oxidation of organic substance on shelves exposed during sea-level lowstands in glacials is a significant source of both CO2 and a significant sink for O2 (Kölling et al 2019). Since these reduced phases are only recharged in the upper meters of the inundated shelf sediments during interglacials, the reservoir of the CO2 producing and oxygen consuming material is gradually declining over the Pleistocene. In our model, the MPT is the time, when the sea-level decline during one 40ka obliquity cycle is not enough to expose significant amounts of reduced shelf sediments anymore. We suggest that the CO2 release through subareal oxidation of pyrite and organic substance on exposed shelves might be a substantial ingredient adding to the obliquity driven increase in high latitude insolation to terminate a glacial phase. The lack of this additional CO2 contribution might thus be a cause of glacial cycles failing to terminate whithout any significant change in orbital conditions. In our model, the oxygen demand by pyrite oxidation causes a step decline to 21.16 vol% in the beginning of the Pleistocene at 2.6 Ma, a gradual decline to 21.11 Vol% at 1.2 Ma (MIS 36) and a steeper decline after the MPT. The major step declines in oxygen concentrations driven by pyrite oxidation are modelled in MIS 20 (-0.02 vol%), MIS16 (-0.04 Vol%) and MIS 12 (-0.03 Vol%). In our model, the Pleistocene decline in atmospheric oxygen is a side effect of the terrestrial oxidation of pyrite and organic substance in glacially exposed shelf sediments. We think, there is no "100 ka" driver for longer glacial cycles, but the magnitude and timing of this CO2 producing and O2 consuming process might be crucial to terminate glacials and might thus be responsible for failed terminations /missing interglacials specifically after the MPT.

How to cite: Koelling, M.: Sea-level driven Pleistocene decline in atmospheric oxygen concentrations after the MPT, EGU General Assembly 2025, Vienna, Austria, 27 Apr–2 May 2025, EGU25-17995, https://doi.org/10.5194/egusphere-egu25-17995, 2025.

EGU25-18887 | Posters on site | CL4.18

Impact of the Central American and the Indonesian seaways on the ocean circulation and oxygen minimum zone in the tropical Pacific 

Viacheslav Khon, Babette Hoogakker, Birgit Schneider, Joachim Segschneider, and Wonsun Park

The tectonic change in geometry of two tropical seaways, the Central American Seaway (CAS) and Indonesian seaway, during the mid-Miocene to mid-Pliocene (~16-3 Ma BP) is thought as a key factor for the development of the present-day tropical Pacific oxygen minimum zone.

The aim of this study is to investigate the dual impact of sill depth changes in the Central American and the Indonesian seaways on the ocean circulation and oxygen minimum zone in the tropical Pacific. To this end, we performed a series of sensitivity experiments with the global climate model KCM where sill depths of both tropical seaways were set at different depths, ranging from shallow to deep levels.

Our results based on a separate effect of CAS changes support previous modelling studies showing that CAS closure have led to an intensification of the Atlantic Meridional Overturning Circulation due to a termination of fresh-water supply from the tropical Pacific to the North Atlantic. The open CAS increases meridional sea surface height gradient in the tropical Pacific which drives eastward subsurface flow in the region. This, in turn, facilitates stronger west-to-east oxygen supply and subsequent overall oxygen enrichment in the subsurface Pacific waters with strongest anomalies observed in the eastern tropical Pacific.

Another important task of this study is to investigate how various sill depths of the Indonesian seaway can additionally adjust an individual effect of open CAS-induced changes for ocean currents in the Pacific and the tropical Pacific oxygen minimum zone.  

How to cite: Khon, V., Hoogakker, B., Schneider, B., Segschneider, J., and Park, W.: Impact of the Central American and the Indonesian seaways on the ocean circulation and oxygen minimum zone in the tropical Pacific, EGU General Assembly 2025, Vienna, Austria, 27 Apr–2 May 2025, EGU25-18887, https://doi.org/10.5194/egusphere-egu25-18887, 2025.

EGU25-20639 | ECS | Posters on site | CL4.18

Response of the subtropical oxygen minimum zone off Chile to El Niño events in a regional biogeochemical model: remote vs local forcings 

Matías Pizarro-Koch, Boris Dewitte, and Catalina Aguirre

The Humboldt eastern boundary upwelling system, due to its proximity to the equator is highly sensitive to equatorial Pacific disturbances, particularly those associated with the El Niño Southern Oscillation (ENSO). This has consequences for the so-called oxygen minimum zone, an extensive area of low oxygen waters at intermediate depths that impacts marine biota. During warm El Nino events, the OMZ tends to shrink in its upper margin along both Peru and central Chile but the magnitude of the change is sensitive to the characteristics of El Niño events. Here, we focus on the subtropical OMZ off Chile (18°-38°S) and document OMZ volume and pattern changes during extreme El Niño events (1982/83 and 1997/1998) based on a regional coupled model simulation. This is contrasted to changes that occurred in 1972/73 that correspond to the occurrence of a moderate El Niño event in the tropical Pacific. The results indicated that the volume of the subtropical OMZ off Chile decreased on average by 27-48% during these El Niño events, which was associated with a coastal oxycline deepening that peaked during the development phase of the events. However, we find that the magnitude of the change varies a lot between events with in particular the 1972/73 El Niño exhibiting the largest changes in volume. The model analyses reveal that the OMZ volume reduction resulted from a combined effect of changes in the poleward transport oxygen-poor waters by the Peru-Chile undercurrent and the contribution of Ekman pumping (negative wind stress curl) and mesoscale eddy fluxes. 

How to cite: Pizarro-Koch, M., Dewitte, B., and Aguirre, C.: Response of the subtropical oxygen minimum zone off Chile to El Niño events in a regional biogeochemical model: remote vs local forcings, EGU General Assembly 2025, Vienna, Austria, 27 Apr–2 May 2025, EGU25-20639, https://doi.org/10.5194/egusphere-egu25-20639, 2025.

EGU25-413 | Orals | CL4.19

Evolution of the Antarctic Ice Sheet from green- to icehouse conditions: Using unique data for advancing numerical model simulations 

Johann P. Klages, Claus-Dieter Hillenbrand, Ulrich Salzmann, Steven M. Bohaty, Torsten Bickert, Karsten Gohl, Gerrit Lohmann, Thorsten Bauersachs, Robert D. Larter, Tina van de Flierdt, Denise K. Kulhanek, and Andreas Läufer

Most ice sheet models indicate that the Antarctic Ice Sheet (AIS) will lose considerable amounts of ice over the coming decades and centuries. This mass loss will mainly be caused by warm deep waters increasingly reaching the AIS’ margins and, with many upstream parts of ice-sheet sectors being grounded far below modern sea level, this will lead to accelerating and irreversible retreat. Are we therefore currently witnessing the initiation of runaway retreat of large parts of the ice sheet that will result in rapid sea level rise resulting in severe consequences for global coastal communities? Finding more reliable answers to this question requires robust multi-proxy data evidence from AIS-proximal records spanning times that were warmer and CO2-richer than today. Such sediment records are rare and challenging to obtain, requiring drilling campaigns that are only feasible within large multinational consortiums. Some extensive Antarctic field campaigns, however, were recently realized, are about to be accomplished, or at the planning stage. This presentation will introduce these campaigns and highlight how their results combined with novel coupled modeling techniques will eventually provide significant new insights into the AIS’ long-term evolution. This information will allow for better predictions of its response to conditions anticipated for the foreseeable future.

How to cite: Klages, J. P., Hillenbrand, C.-D., Salzmann, U., Bohaty, S. M., Bickert, T., Gohl, K., Lohmann, G., Bauersachs, T., Larter, R. D., van de Flierdt, T., Kulhanek, D. K., and Läufer, A.: Evolution of the Antarctic Ice Sheet from green- to icehouse conditions: Using unique data for advancing numerical model simulations, EGU General Assembly 2025, Vienna, Austria, 27 Apr–2 May 2025, EGU25-413, https://doi.org/10.5194/egusphere-egu25-413, 2025.

EGU25-1189 | Posters on site | CL4.19

Neogene circulation in Princess Elizabeth Trough, Southern Ocean, driven by gyres? 

Gabriele Uenzelmann-Neben

The atmospheric CO2 content has been discussed as one of the major factors influencing global climate. In the framework of the deep ocean forming the main reservoir of carbon dioxide, the Southern Ocean plays a crucial role in partitioning carbon between the atmosphere and the deep ocean. The processes resulting in the variability of atmospheric CO2 and carbon uptake in the deep ocean have not yet been fully identified. Sedimentary structures imaged with seismic reflection data are interpreted regarding direction and intensity of pathways of deep/bottom water masses to contribute to the knowledge on potential locations of carbon subsidence. Under the assumption that the general circulation scheme has been similar during the Neogene, i.e., driven by gyres, the positions and sizes of palaeo-gyres have been reconstructed, which were then interpreted regarding the intensity of carbon uptake. This has been compared with published reconstruction of warming/cooling trends of the global climate. While the method applied is equivocal it links observed sedimentary structures with the development of gyres thus potential sports of carbon uptake. This way the presented reconstruction provides pieces to the climate variability puzzle, which can be tested using numerical simulation.

How to cite: Uenzelmann-Neben, G.: Neogene circulation in Princess Elizabeth Trough, Southern Ocean, driven by gyres?, EGU General Assembly 2025, Vienna, Austria, 27 Apr–2 May 2025, EGU25-1189, https://doi.org/10.5194/egusphere-egu25-1189, 2025.

The intensification of Northern Hemisphere Glaciation at ~2.7 Ma ago, known as the significant iNHG event during the late Pliocene, has marked a prominent transition of Earth’s climate from uni-polar to bi-polar ice sheets. Here, we present proxy records from the deep sea sediments of Ocean Drilling Program Site 1123 in the South Pacific (41°47´S,171°30´W,water depth 3290 m), covering a time span of approximately 3.5 to 1.7 million years, aiming to reveal the South Pacific deep circulation and ocean carbon reservoir changes during this period. After careful rinsing of the sediment samples, we selected benthic foraminifer C. Wuellerstorfi and G. Mundulus for B/Ca ratio and fish tooth εNd isotope analysis, with a temporal resolution of approximately 3 to 10 thousand years, totaling 112 sediment samples.

Our results show that the eNd of ODP Site 1123 rapidly shifted towards negative values by approximately 2 units during the iNHG period. Meanwhile, the deep-water △[CO32-] reconstructed using the B/Ca ratio of benthic foraminifera exhibited a positive shift at around 2.9 Ma and then a negative shift at around 2.7 Ma. We interpret that the positive shift in △[CO32-] at ODP Site 1123 at ~2.9 Ma might be caused by the weakening of the Antarctic Circumpolar Current (ACC), which reduced the upwelling in the Southern Ocean and thereby caused a shift of the major source of the water mass bathing this site from the north with more negative carbonate ion concentrations to that in the south with more positive carbonate ion concentrations. The enhanced northward expansion of southern sourced water in the deep Pacific Ocean could result in a decrease in the Pacific carbon reservoir. We further hypothesize that the enhanced input of sub-Antarctic dust during the iNHG period had great potential for increasing the iron fertilization effect, thereby strengthening the biological pump in the sub-Antarctic region. This process had resulted in an increase in the carbon storage and a more negative carbonate ion concentration in the southern sourced water flowing into the Pacific Ocean, ultimately causing the negative shift in △[CO32-] at ODP Site 1123 and enhancing carbon storage in the Pacific Ocean. Our results demonstrate that the Pacific Ocean had played a great role in the decline of the atmospheric pCO2 and finally contributed to the final formation of the iNHG event.

How to cite: Xu, J., Ma, Y., and Tian, J.: Synergic Variations of the South Pacific Deep Circulation and Carbon Reservoir During the Late Pliocene Intensification of the Northern Hemisphere Glaciation, EGU General Assembly 2025, Vienna, Austria, 27 Apr–2 May 2025, EGU25-2567, https://doi.org/10.5194/egusphere-egu25-2567, 2025.

EGU25-3002 | ECS | Posters on site | CL4.19

Evidence of significant destratification of the Subantarctic Pacific during the past 3.3-2.4 million years 

Li-Peng Wu, Li Lo, Chuan-Chou Shen, Ludvig Löwemark, Pei-Tzu Wu, and Horng-Sheng Mii

The Earth's climate transitioned significantly from the mid-Piacenzian Warm Period (mPWP, 3.3–3.0 Ma) to the intensified Northern Hemisphere Glaciation (iNHG, 3.0–2.7 Ma). The Southern Ocean, a major CO2 sink, played a pivotal role in this shift by regulating CO2 through ocean ventilation. While most research focuses on the Northern Hemisphere, this study investigates planktonic foraminiferal assemblages, stable isotopes, trace metals, and sedimentary records from the Subantarctic Pacific to explore the Southern Hemisphere’s contribution.

Three intervals are identified: mPWP (3.3–3.0 Ma), iNHG (3.0–2.7 Ma), and the Subantarctic-dominant interval (<2.7 Ma). Key planktonic foraminiferal groups include Neogloboquadrina pachyderma (cold-water indicator), Globoconella spp. (thermocline indicators, G. puncticulata and G. inflata), and Globigerina bulloides (nutrient-enrichment indicator). During the mPWP, thermocline species dominated (90%). The faunal assemblage underwent a transition during the iNHG, with a 40% decline in Globoconella spp. and accompanied growth of N. pachyderma. By the Subantarctic-dominant interval, N. pachyderma increased (~90%), reflecting expanded cold-water conditions. G. bulloides rose by 30% at the end of the mPWP and fluctuated with glacial-interglacial (G/IG) cycles, peaking during interglacials (~25% higher). These shifts suggest destratification at the mPWP’s end and higher surface productivity during the Subantarctic-dominant interval, supported by increased planktonic foraminiferal accumulation rates.

Sedimentary analysis reveals a long-term decrease in CaCO3 content (90% reduction) and a slight increase in total organic carbon (TOC) content, showing a 1% growth throughout the research interval. Additionally, ice-rafted debris (IRD) production exhibits a pronounced increase, reaching a maximum of 200 pieces/cm²·kyr during the Subantarctic-dominant interval, and demonstrates a long-term upward trend throughout the research interval. This rise in the IRD aligns with the increased abundance of the cold-water species N. pachyderma, suggesting an expansion of sea ice and ice sheets.

Stable isotope records reveal long-term environmental changes. δ¹³C values decreased during the mPWP and stabilized during the iNHG but became G/IG-dominant in the Subantarctic-dominant interval, with lower values in glacial periods likely due to increased Circumpolar Deep Water (CDW) input. δ18O records suggest a cooling trend (over 1‰) throughout the interval, showing G/IG variability in N. pachyderma and Globoconella spp. during the Subantarctic-dominant period. The δ18Oseawater derived from planktonic foraminifera generally exhibits a long-term increasing trend from -0.5‰ to 2‰, with glacial periods showing approximately 1‰ higher δ18Oseawater compared to interglacial periods.

Mg/Ca-derived temperatures show complex patterns. While N. pachyderma Mg/Ca ratios reveal strong G/IG fluctuations (~6°C) during the Subantarctic-dominant interval, G. puncticulata exhibits a long-term cooling (~6°C) since the iNHG. G. inflata mirrors these trends, and G. bulloides shows a 2°C decline. These data highlight N. pachyderma’s sensitivity to sea-ice expansion and the thermal stability preferences of G. bulloides.

Overall, stable ocean stratification and minimal sea ice characterized the mPWP, underpinned by a well-stratified thermocline. Since the iNHG, frontal system shifts, destratification, and increased CDW upwelling have enhanced nutrient availability and phytoplankton photosynthesis, boosting CO2 sequestration. By 2.55 Ma, the Subantarctic Pacific emerged as a critical CO2 sink, driven by Pleistocene G/IG cycles and contributing significantly to global CO2 storage.

How to cite: Wu, L.-P., Lo, L., Shen, C.-C., Löwemark, L., Wu, P.-T., and Mii, H.-S.: Evidence of significant destratification of the Subantarctic Pacific during the past 3.3-2.4 million years, EGU General Assembly 2025, Vienna, Austria, 27 Apr–2 May 2025, EGU25-3002, https://doi.org/10.5194/egusphere-egu25-3002, 2025.

The Circumpolar Deep Water (CDW) is one of the key components of the global climate system and Antarctic cryosphere. However, the variability of the CDW in the Indian sector of the Southern Ocean over glacial-interglacial climate cycles is still unknown due to a lack of knowledge of deep-water geochemistry. The new records of δ18O and δ13C in benthic foraminifer from Del Caño Rise (DCR-1PC and DCR-2PC) characterized the δ13C composition of CDW in the Indian sector of the Southern Ocean. During the glacial periods, the South Indian has lower δ13C values, representing the influence of a more southern water mass, perhaps a glacial Antarctic Bottom Water (AABW). A comparison with published South Atlantic (ODP 1090) and South Pacific (PS 75/59) deep water records suggests a continuous water mass exchange throughout the past 500 ka. Almost identical glacial-interglacial δ13C variations imply a common deep-water evolution in all basins, suggesting persistent CDW exchange and homogenization. A much lower δ13C signal was observed at the deeper Cape Basin (ODP 1089, RN13-229), which was influenced by strong AABW originating from the Weddell Sea during the glacial periods. The anomalous heavier values (> 0.5‰) were recorded at DCR-1PC during the MIS 5 (~97 ka and ~83 ka), suggesting the strong influence of the North Atlantic Deep Water (NADW). 

How to cite: Ikehara, M.: Circumpolar Deep Water variability in the Southern Ocean during the past 500 ka, EGU General Assembly 2025, Vienna, Austria, 27 Apr–2 May 2025, EGU25-3529, https://doi.org/10.5194/egusphere-egu25-3529, 2025.

EGU25-5120 | ECS | Posters on site | CL4.19

The evolution of deep water in the Southwest Pacific Ocean since 30 ka BP 

Xiaojie Tang, Giuseppe Siani, and Christophe Colin

The Southern Ocean (SO) is a key area for global climate. It connects the deep water with the surface through upwelling. The deep SO, storing a large amount of carbon during the glacial period and releasing CO2 during the deglacial period, is critical for the carbon cycle on orbital-millennial timescales.

In the Southwest Pacific (SWP), there are many reconstructions of deep water, however, these reconstructions primarily rely on carbon and oxygen isotopes, which cannot effectively distinguish the North Pacific Deep Water (NPDW) and the Circumpolar Deep Water (CDW). Neodymium isotopes (εNd) of seawater is dominated by the crustal sources, which is spatial heterogeneous, enabling its wide application as water mass traces. However, the available data in the SWP is not enough to resolve spatial complexity and evolution mechanisms of water masses, especially at the depth of NPDW and UCDW (Upper CDW).

Here, εNd on planktonic foraminifera are used to investigate the evolution of deep-water masses in SWP since 30 ka BP on core MD97-2115 (43° 6' 30" S, 171° 29' 7.8" W, 2160 m water depth), which is located on the east Chatham Rise.

The εNd results show an increase from -4.5 to -3.8 between 30 ka BP and 21 ka BP, followed by a positive shift to -4.7 at 19 ka BP. After 19 ka BP, the values remain relatively stable around -5.

These values agree well with modern NPDW seawater εNd value in Southwest Pacific Basin, ranging from -4 to -5. Comparison with nearby εNd records suggests a persistent influence of NPDW in the eastern Chatham Drift since 30 ka BP. However, the mechanism of the shift around 19 ka BP needs further investigation.

How to cite: Tang, X., Siani, G., and Colin, C.: The evolution of deep water in the Southwest Pacific Ocean since 30 ka BP, EGU General Assembly 2025, Vienna, Austria, 27 Apr–2 May 2025, EGU25-5120, https://doi.org/10.5194/egusphere-egu25-5120, 2025.

EGU25-7544 | Orals | CL4.19

Intermediate Water Dynamics and CO2 Anomalies during the Mid-Brunhes Event 

Raúl Tapia, Sze Ling Ho, Dirk Nürnberg, A. Nele Meckler, Frank Lamy, and Ralf Tiedemann

Antarctic Intermediate Water (AAIW) plays a key role in the global carbon cycle, but its contribution to past CO2 variability in the past is still poorly understood. Using multi-proxy paleoceanographic reconstructions (foraminiferal Mg/Ca, ∆47, δ18O) from the South Pacific sector of the Southern Ocean, we investigate changes in AAIW’s physical properties across the Mid-Brunhes Event (MBE), a major atmospheric CO2 transition. Our results reveal a contrasting evolution within the Subantarctic Pacific: while surface ocean temperatures remained relatively stable over the past 600 ka, the subsurface experienced a marked shift in AAIW properties across the MBE towards warmer and saltier conditions. This change could be related to a reduction in iceberg-derived freshwater input and may have affected the ability of AAIW to sequester atmospheric CO2. Prior to the MBE, colder and fresher conditions, coinciding with a steep vertical thermal gradient, would have enhanced CO2 drawdown and minimized outgassing, enabling AAIW to retain its high CO2 load. The synchronization of the suggested reduction in AAIW’s uptake efficiency with the increase in atmospheric CO2 across the MBE suggests a pivotal role in modulating atmospheric CO2 during this critical climate transition. This finding challenges the traditional view that this shift is mainly attributed to changes in bottom water formation.

How to cite: Tapia, R., Ho, S. L., Nürnberg, D., Meckler, A. N., Lamy, F., and Tiedemann, R.: Intermediate Water Dynamics and CO2 Anomalies during the Mid-Brunhes Event, EGU General Assembly 2025, Vienna, Austria, 27 Apr–2 May 2025, EGU25-7544, https://doi.org/10.5194/egusphere-egu25-7544, 2025.

EGU25-7778 | ECS | Posters on site | CL4.19

Poleward shift in Southern Westerlies triggered by iceberg discharge in the North Atlantic 

Takuto Kasuya, Kana Nagashima, Hitoshi Hasegawa, Yusuke Okazaki, Yuta Kuniyoshi, Ayako Abe-Ouchi, Shinya Iwasaki, Helge W. Arz, Julia R. Hagemann, Naomi Harada, Masafumi Murayama, Carina B. Lange, and Frank Lamy

During the last glacial period, millennial-scale iceberg discharges in the North Atlantic, known as Heinrich Events (HEs), could have shifted the Southern Hemisphere Westerly Wind Belt (SWW) poleward and potentially led upwelling-driven CO2 outgassing from the Southern Ocean. However, direct evidence of SWW poleward shift in response to HEs remains limited. Based on detrital elements, minerals, and grain-size records in well-dated sediment cores, MR16-09 PC02 (46°04.23′S, 76°32.10′W, 2793 m water depth) and PC03 (46°24.32′, 77°19.45′, 3082 m water depth), from off western Patagonia at ~46°S, we found abrupt onsets in the discharge of coarse silt-sized detritus during the latter half of each HEs (HE 3, 4, 5, 5a, and 6) originating from the Patagonian Batholith located in the coastal area of western Patagonia. Such abrupt discharges are unique events south of ~46°S and probably reflect the extension of glacial erosion into the western fjords related to a pronounced positive anomaly in the glacial accumulation/ablation mass balance of the western-central Patagonian ice sheet. Our climate model (MIROC4m) hosing experiment in the North Atlantic suggests the SWW and precipitation belt began shifting poleward hundreds of years after the onset of HE, which is consistent timing with our proxy data. Thus, increased precipitation south of 46°S following the poleward-SWW shift most likely generated detritus discharges. These findings provide critical evidence of abrupt climate changes propagating from the North Atlantic to the southern midlatitudes via the large-scale reorganization of the atmospheric and ocean circulations.

How to cite: Kasuya, T., Nagashima, K., Hasegawa, H., Okazaki, Y., Kuniyoshi, Y., Abe-Ouchi, A., Iwasaki, S., Arz, H. W., Hagemann, J. R., Harada, N., Murayama, M., Lange, C. B., and Lamy, F.: Poleward shift in Southern Westerlies triggered by iceberg discharge in the North Atlantic, EGU General Assembly 2025, Vienna, Austria, 27 Apr–2 May 2025, EGU25-7778, https://doi.org/10.5194/egusphere-egu25-7778, 2025.

EGU25-8265 | Orals | CL4.19

Ice age and deglacial stratification of the polar Antarctic Zone 

François Fripiat, Daniel M. Sigman, Xuyuan E. Ai, Cédric Dumoulin, Simone Moretti, Anja Studer, Bernhard Diekmann, Oliver Esper, Thomas Frederichs, Frank Lamy, Ling Liu, Frank Pattyn, Mareike Schmitt, Ralf Tiedemann, Gerald Haug, and Alfredo Martínez-García

The Antarctic Zone has long been suspected to play a crucial role in the glacial-interglacial changes in atmospheric concentration of CO2. However, global climate has many possible influences on Antarctic  Zone conditions, with the potential for interactions between ice, winds and circulation that, in turn, influence the biogeochemistry and carbon budget of the Antarctic Zone surface. In a sediment core from the polar Antarctic Zone, we analyzed diatom-bound nitrogen isotopes to reconstruct surface nitrate concentration, which reflects the balance between biological productivity and the flux of subsurface nitrate into the Antarctic surface. The record covers the last 150 kyr, which includes two peak glacial periods and the subsequent deglaciations and interglacials. During each glacial period, the data support prior interpretations of lower surface nitrate concentrations and reduced circulation-driven nitrate supply to the Antarctic surface, although the change appears to be weaker at this polar Antarctic Zone site than in records from further north in the open Antarctic Zone. Early in each deglaciation, there is a further decline in surface nitrate concentration, reflecting a rise in density stratification. This is followed by an increase in nutrient supply in each of the two interglacials, signaling more vigorous surface-subsurface exchange than during the glacials or the early deglaciations. Combining the data with other Antarctic records further from the continent, the deglacial changes echo model simulations of ongoing global warming, in which upwelling increases near the Polar Front, while subsurface influx to the surface closer to the Antarctic continent decreases in response to ice sheet melting. The findings have implications for the cause of the observed rise in atmospheric CO2 concentrations during deglaciations and also warrant consideration with regard to the future of the ocean’s uptake of global warming heat and fossil fuel-derived CO2.

How to cite: Fripiat, F., Sigman, D. M., Ai, X. E., Dumoulin, C., Moretti, S., Studer, A., Diekmann, B., Esper, O., Frederichs, T., Lamy, F., Liu, L., Pattyn, F., Schmitt, M., Tiedemann, R., Haug, G., and Martínez-García, A.: Ice age and deglacial stratification of the polar Antarctic Zone, EGU General Assembly 2025, Vienna, Austria, 27 Apr–2 May 2025, EGU25-8265, https://doi.org/10.5194/egusphere-egu25-8265, 2025.

EGU25-8697 | ECS | Orals | CL4.19

Exploring glacial-interglacial nutrient conditions in the Antarctic Zone: Insights from a one-dimensional water column model 

Cédric Dumoulin, François Fripiat, Barbara Hinnenberg, Haojia Ren, Daniel Sigman, and Alfredo Martinez-Garcia

In the Antarctic Zone (AZ), deep nutrient-rich waters ascend to the surface, feeding the Southern Ocean's overturning circulation cells. However, the rate of upwelling exceeds the capacity of phytoplankton to fully consume the gross nutrient supply to the AZ surface, leading to the release of previously sequestered CO2 into the atmosphere. During ice ages, enhanced nutrient utilization has been proposed as a mechanism that could contribute to lower atmospheric CO2 concentration. Fossil-bound δ15N records in the AZ point to a more complete nitrate consumption in surface waters during ice ages. This increase in nitrate utilization coincides with reduced export production, suggesting a lower gross nitrate supply to the surface and, therefore, a reduction in the exchange of water between the surface and the deep ocean. Preliminary reconstructions indicate more than a 5-fold reduction in the rate of gross nitrate supply to match paleo proxy data and near complete nitrate consumption at the surface. Model simulations are ambiguous, but none show more than a ≥ 2-fold reduction in water exchange in the AZ during ice ages.

One hypothesis for this discrepancy is the progressive depletion (“mining-out”) of nutrients from the AZ upper ocean. Reduced glacial upwelling, combined with repeated summer nitrate consumption and the export of assimilated nitrate as sinking organic matter, followed by deep winter mixing, could gradually deplete the upper water column’s nutrient reservoir. This process would lower the shallow subsurface nutrient concentrations and elevate nitrate δ15N relative to the deep ocean. As a result, the nutrient supply per volume of upwelled water would decline, aligning better with model simulations. 

To test this hypothesis, we developed a 1D advection-diffusion-reaction model of the water column, accounting for surface nitrate consumption and isotope fractionation. The model was calibrated using Argo floats data and high-resolution hydrographic nitrate isotopes transect in the AZ (GO-SHIP SO4P 2018), successfully matching depth and seasonal profiles. We also applied the model to the western subarctic Pacific, which exhibits a similar observation pattern for fossil-bound δ15N and export production during ice ages but contrasts in the ratio between advective and diffusive nutrient supply.

Our results highlight the critical role of nutrient mining in driving isotopic changes during ice ages. With reduced upwelling, nutrients are progressively depleted in the upper AZ. However, even under this mechanism, a substantial reduction in upwelling (more than a twofold decrease) is still required to achieve observed glacial δ15N values – though less extreme than previous estimates. Nevertheless, in reduced upwelling scenarios, the glacial surface nitrate concentration is significantly higher than previous estimates. This supports the potential of nutrient mining in matching paleo-data with less drastic changes to the Southern Ocean.

How to cite: Dumoulin, C., Fripiat, F., Hinnenberg, B., Ren, H., Sigman, D., and Martinez-Garcia, A.: Exploring glacial-interglacial nutrient conditions in the Antarctic Zone: Insights from a one-dimensional water column model, EGU General Assembly 2025, Vienna, Austria, 27 Apr–2 May 2025, EGU25-8697, https://doi.org/10.5194/egusphere-egu25-8697, 2025.

EGU25-8794 | ECS | Posters on site | CL4.19

790,000 years of millennial-scale Cape Horn Current variability and interhemispheric linkages 

Vincent Rigalleau, Frank Lamy, Nicoletta Ruggieri, Henrik Sadatzki, Helge W. Arz, Stephen Barker, Lester Lembke-Jene, Antje Wegwerth, Gregor Knorr, Igor M. Venancio, Taina M.L. Pinho, Ralf Tiedemann, and Gisela Winckler

Millennial-scale variations in the strength and position of the Antarctic Circumpolar Current exert considerable influence on the global meridional overturning circulation and the ocean carbon cycle. The mechanistic understanding of these variations is still incomplete, partly due to the scarcity of sediment records covering multiple glacial-interglacial cycles with millennial-scale resolution. Here, we present high-resolution current strength and sea surface temperature records covering the past 790,000 years from the Cape Horn Current as part of the subantarctic Antarctic Circumpolar Current system, flowing along the Chilean margin. Both temperature and current velocity data document persistent millennial-scale climate variability throughout the last eight glacial periods with stronger current flow and warmer sea surface temperatures coinciding with Antarctic warm intervals. These Southern Hemisphere changes are linked to North Atlantic millennial-scale climate fluctuations, plausibly involving changes in the Atlantic thermohaline circulation. The variations in the Antarctic Circumpolar Current system are associated with atmospheric CO2 changes, suggesting a mechanistic link through the Southern Ocean carbon cycle.

How to cite: Rigalleau, V., Lamy, F., Ruggieri, N., Sadatzki, H., Arz, H. W., Barker, S., Lembke-Jene, L., Wegwerth, A., Knorr, G., Venancio, I. M., Pinho, T. M. L., Tiedemann, R., and Winckler, G.: 790,000 years of millennial-scale Cape Horn Current variability and interhemispheric linkages, EGU General Assembly 2025, Vienna, Austria, 27 Apr–2 May 2025, EGU25-8794, https://doi.org/10.5194/egusphere-egu25-8794, 2025.

The Antarctic Circumpolar Current (ACC) connects all major Ocean basins and plays a pivotal role in regulating ocean circulation modulating the deep-sea ventilation by upwelling and downwelling of water masses. The Southeastern Pacific Ocean (SEP) is a key region of Antarctic Intermediate Water (AAIW) formation, which has significant influence on low latitude climate. South Westerly Winds (SWW) – ACC interaction has an important role in promoting the upwelling of Upper Circumpolar Deep Water (UCDW), which is relatively corrosive and enhances the dissolution of aragonitic foraminiferal tests.  Hence, the percentage abundance ratio of aragonitic test benthic foraminifera Hoeglundina elegans vs total calcareous foraminifera test can serve as a reliable proxy for ACC current strength variability. The upwelling and downwelling of UCDW are responsible for CO2 release to the atmosphere and oxygen uptake in the AAIW water mass, respectively, affecting the deep sea biota in the SEP. Hence, this study analysed the benthic foraminifera abundance variations in International Ocean Discovery Program (IODP) Site U1542 (~1101 m depth, Chilean margin, under AAIW influence) for the last ~400 ka to evaluate the linkages between ACC, SWW, and AAIW and associated forcing factors. The spectral and continuous wavelet analyses were performed for the AAIW characteristic proxies i.e. oxic species (%), combined suboxic and dysoxic species (%) of benthic foraminifera that show a 44 kyr obliquity cycle. This cycle suggests the influence of Patagonian Ice Sheet (PIS) dynamics and the role of atmospheric CO2 in regulating marine carbon reservoirs through AAIW production during various glacial-interglacial cycles. The ACC strength variability proxy i.e. aragonitic Hoeglundina elegans (%)/Total calcareous foraminifera (%) shows the presence of ~100 kyr cycle, which is also observed in the Asian monsoon record. This study suggests that ACC has influenced the Asian monsoon by modulating AAIW production, which regulates the atmospheric CO2 concentration linked with 100 kyr cycle.

How to cite: Datta, S., Das, S. K., Rath, S., and Singh, R. K.: Assessing the role of Antarctic Circumpolar Current strength variability in Antarctic Intermediate Water formation and low-latitude climate over the last 400 ka, EGU General Assembly 2025, Vienna, Austria, 27 Apr–2 May 2025, EGU25-9914, https://doi.org/10.5194/egusphere-egu25-9914, 2025.

EGU25-12282 | Orals | CL4.19

Interactions between Antarctic ice-sheet extent and summer sea-ice variability over the last 45,000 years in the Weddell Sea-Dronning Maud Land as reconstructed from snow petrel stomach-oil deposits 

Erin McClymont, Thale Damm-Johnsen, Ewan Wakefield, Anna Rix, Michael Bentley, Yasmin Cole, W. James Grecian, Dominic Hodgson, Eleanor Maedhbh Honan, Zhongxuan Li, Claire Penny, Kerry Strong, Mark Stevenson, Philippa Ascough, Darren Grocke, A. Rus Hoelzel, Richard Phillips, Louise Sime, and Stephen Willis

Constraining the nature and timing of changes to the East Antarctic ice sheet in the Weddell Sea-Dronning Maud Land sector over the last glacial cycle has been challenging, due to limited geological evidence and contrasting models of past ice sheet extents and retreat behaviour. It is important to distinguish between these scenarios, because this region is also a source of Antarctic Bottom Water, and there are regions of the ice sheet which are sensitive to ocean warming.

Here, we present a novel archive of past sea-ice environments from regurgitated stomach oils of snow petrels (Pagodroma nivea) spanning the last ~45,000 years. Snow petrels forage within sea ice, and record changes to their diet and surface ocean properties within their stomach oil biochemistry. The stomach-oil deposits we examine here are preserved at breeding colonies extending from the Theron Mountains (30°W) to the Sør Rondane Mountains (23°W). We use the deposits to constrain the presence of bedrock for breeding, which becomes available as the ice sheet thins or retreats.

We show major variations in snow petrel occupation over time, in part related to availability of breeding habitat as ice sheet extent fluctuated. Reconstructions of snow petrel diet using multi-proxy analysis of fatty acids, stable carbon and nitrogen isotope ratios, and elemental composition (via XRF) shows centennial-scale variations in diet and regional differences in sea ice histories. We propose that open waters (‘polynyas’) were present in the sea ice during Marine Isotope Stages 2 and 3, and that their properties evolved through time as summer sea ice expanded to its maximum extent (~29-22 ka) and retreated across the last deglaciation. We explore how these changes in summer sea-ice environment are linked to changes in ice-sheet extent and ocean/atmospheric circulation over the last ~45 ka.

How to cite: McClymont, E., Damm-Johnsen, T., Wakefield, E., Rix, A., Bentley, M., Cole, Y., Grecian, W. J., Hodgson, D., Honan, E. M., Li, Z., Penny, C., Strong, K., Stevenson, M., Ascough, P., Grocke, D., Hoelzel, A. R., Phillips, R., Sime, L., and Willis, S.: Interactions between Antarctic ice-sheet extent and summer sea-ice variability over the last 45,000 years in the Weddell Sea-Dronning Maud Land as reconstructed from snow petrel stomach-oil deposits, EGU General Assembly 2025, Vienna, Austria, 27 Apr–2 May 2025, EGU25-12282, https://doi.org/10.5194/egusphere-egu25-12282, 2025.

EGU25-12620 | ECS | Posters on site | CL4.19

East Antarctic Ice Sheet–Southern Ocean Interactions in Prydz Bay region from the Middle Miocene to the Present 

Dimitris Evangelinos, Tina van de Flierdt, Leopoldo D. Pena, Eduardo Paredes, Isabel Cacho, and Carlota Escutia

Understanding Southern Ocean-Antarctic Ice Sheet (AIS) interactions in the geological past is crucial for evaluating the sensitivity of the ice sheet to ocean forcing during future climate warming and predicting its contribution to future sea-level rise. Geological evidence indicates the onset of a modern-like strong Antarctic Circumpolar Current (ACC) in the Late Miocene (~10 million years ago). However, the response of the East Antarctic Ice Sheet to these changes remains poorly constrained. In this study, we present neodymium and strontium isotope compositions of fine-grained (<63 μm) detrital sediments from Ocean Drilling Program (ODP) Site 1165, located on the continental rise off Prydz Bay. These records trace changes in sediment provenance from the Middle Miocene to the present, offering insights into how erosion by Antarctica’s ice sheets in the Prydz Bay sector has evolved over time. Our data reveal that the ice sheet in the Prydz Bay sector crossed a tipping point in the Late Miocene, becoming highly dynamic. Our preliminary findings suggest that this significant shift in the East Antarctic Ice Sheet's evolution may be linked to the emergence of the modern ACC, indicating major ocean-ice interactions in the Late Miocene.

How to cite: Evangelinos, D., van de Flierdt, T., Pena, L. D., Paredes, E., Cacho, I., and Escutia, C.: East Antarctic Ice Sheet–Southern Ocean Interactions in Prydz Bay region from the Middle Miocene to the Present, EGU General Assembly 2025, Vienna, Austria, 27 Apr–2 May 2025, EGU25-12620, https://doi.org/10.5194/egusphere-egu25-12620, 2025.

EGU25-14057 | Posters on site | CL4.19

Evidence from IODP Site U1537 in the Dove Basin, Scotia Sea for a warmer Antarctica during the early Pleistocene (2.4-2.1 Ma)  

Suzanne OConnell, Kelly Fenton-Samuels, Sidney Hemming, Brendan Reilly, Cheng-cheng Wang, and Samina Anee

IODP Site U1537 is located in a contourite deposit in the Dove Basin of the southeastern Scotia Sea, in 3,713 meters of water. It consists of alternating diatom oozes and silty clays, with variable amounts of sand to gravel-sized clasts delivered as IRD.   Shipboard track measurements, weight percent ice-rafted detritus (IRD), 40Ar/39Ar hornblende and biotite age (provenance), and split core XRF elemental measurements were collected and examined to study Antarctic ice-sheet dynamics between 1.75 and 3.35 Ma, the Plio-Pleistocene transition. 

            The highest and most variable amounts of IRD (from 0 to >0.4 g/cm2/ky) are in the earliest part of the study before 3.24 Ma. Between 3.24 and 2.4 Ma, with the exception of one sample, IRD comprises < 0.2 g/cm2/ky of the sediment. Between 2.4 and 2.1 Ma, IRD form < 0.05 g/cm2/ky, and from 2.1 Ma to the end of the study, they return to values of < 0.1, g/cm2/ky. With the exception of the lowest IRD interval (2.4 and 2.1 Ma), 40Ar/39Ar ages of biotite and hornblende grains are sourced from both East and West Antarctica, with the majority being between about 400 and 600 Ma old, broadly corresponding to the Pan-African event, and the assemblage of Gondwana.

            The 300,000-year, diatom-rich, low IRD interval between 2.4 and 2.1 Ma is unique in that all of the grains, except one, came from West Antarctica. Other Antarctic sites such as IODP Site U1361 (Wilkes Land), and ODP Site 1011 (northwest tip of the Antarctic Peninsula), also have their lowest IRD values during this time interval. We propose that this was a warmer time interval and that icebergs from East Antarctica either melted before reaching the Dove Basin or there were no ice-terminating glaciers.

How to cite: OConnell, S., Fenton-Samuels, K., Hemming, S., Reilly, B., Wang, C., and Anee, S.: Evidence from IODP Site U1537 in the Dove Basin, Scotia Sea for a warmer Antarctica during the early Pleistocene (2.4-2.1 Ma) , EGU General Assembly 2025, Vienna, Austria, 27 Apr–2 May 2025, EGU25-14057, https://doi.org/10.5194/egusphere-egu25-14057, 2025.

EGU25-14263 | ECS | Orals | CL4.19

Progressive declines in Pacific Antarctic Zone upwelling intensity during each glaciation of the last 460 ka  

Xuyuan Ai, Daniel Sigman, Alfredo  Martínez-García, Anja Studer, Francois Fripiat, Frank Lamy, Mareike Schmitt, Sergey Oleynik, and Gerald Haug

The long 100,000-year glacial-interglacial cycles are key features of climate evolution since the Mid-Pleistocene Transition, and changes in the Southern Ocean are proposed to have played an important role in the generation of these cycles. Data from the Indian and Pacific sectors of the Antarctic Zone over the last 150 ka show that during the glacial intervals, export production decreased, and surface nitrate concentration, as reflected by d15N of organic matter bound in diatom frustules (d15Ndb), decreased. Together these findings suggest that upwelling was weaker in the Antarctic Zone during the ice ages. Here we report ~2-kyr resolution d15Ndb measurements from the Pacific sector of the Antarctic Zone extending to the past 460 ka, with chronology supported by TEX86L-paleotemperature proxy correlation with air temperature reconstructed from Antarctic ice cores. The results show continuously increasing Antarctic Zone d15Ndb during peak glacial periods. This suggests progressive declines in surface nitrate concentration and, thus, in upwelling and/or vertical mixing intensity as land ice sheets grew, even though Antarctic ice core temperature and atmospheric CO2 appear to have stabilized at their minima earlier in each ice age. This correlation points to an interhemispheric mechanism that links southern high-latitude conditions to northern high-latitude ice buildup during peak glacial intervals. We will discuss the implications for the saw-tooth pattern of the 100,000-year glacial-interglacial cycles and for carbon cycle feedbacks within these 100,000-year cycles.

How to cite: Ai, X., Sigman, D., Martínez-García, A., Studer, A., Fripiat, F., Lamy, F., Schmitt, M., Oleynik, S., and Haug, G.: Progressive declines in Pacific Antarctic Zone upwelling intensity during each glaciation of the last 460 ka , EGU General Assembly 2025, Vienna, Austria, 27 Apr–2 May 2025, EGU25-14263, https://doi.org/10.5194/egusphere-egu25-14263, 2025.

EGU25-14444 | ECS | Posters on site | CL4.19

Benthic responses to warming and ice retreat on the Chilean Margin during the Last Glacial Period 

Lisa C. Herbert, Elena Brion, Laura M. Wehrmann, Vincent Rigalleau, Helge W. Arz, Gisela Winckler, and Frank Lamy

Marine terminating ice sheets and glaciers influence the chemical, biological and physical dynamics of adjacent marine systems. For example, changes in ice extent affect sedimentation rates along glaciated coasts, as well as drive shifts in marine productivity linked to stratification and nutrient delivery. These changes can affect the redox conditions and storage of organic carbon in shelf sediments. Therefore, glacial retreat due to modern climate warming could potentially have major impacts on marine productivity, sedimentation and carbon cycling in the Southern Ocean and other high latitude areas. To study the effects of warming on diagenetic processes and sedimentation dynamics, we analyzed core samples from IODP Expedition 383 Site U1542, collected close to the southern Chilean Margin, a region of rapid sedimentation rates that is linked to the Southern Ocean via the Cape Horn Current and the Drake Passage. This site provides a high-resolution record of changes at the western maximum extent of the Patagonia Ice Sheet (PIS), which was dominant in this setting during the last glacial period. Preliminary results from this Site indicate 7 distinct intervals of short-term warming events (1-5 kyr) between 20 and 60 kyr. We analyzed samples spanning these warming events for total organic carbon, grain size, and Fe minerology, and compared results with records of trace metal (e.g., Mn and Ni) contents from X-ray fluorescence (XRF) analysis. Preliminary results indicate that when the PIS retreated during short-term warming events, the redox conditions in the sediment shifted, becoming more reducing as indicated by trace metal contents and Fe minerology, and the organic carbon content in the sediment increased. In addition, larger grain sizes during warm periods suggest a possible decrease in fine glacial flour input with the retreat of the ice sheet. Overall, this study disentangles signals reflecting diagenetic, benthic redox and sedimentological changes driven by changes in glacial input. This research ultimately aims to improve our understanding of how a marginal marine system responded to climatic warming and ice sheet loss, serving as a potential analog for future loss of modern ice sheets.

How to cite: Herbert, L. C., Brion, E., Wehrmann, L. M., Rigalleau, V., Arz, H. W., Winckler, G., and Lamy, F.: Benthic responses to warming and ice retreat on the Chilean Margin during the Last Glacial Period, EGU General Assembly 2025, Vienna, Austria, 27 Apr–2 May 2025, EGU25-14444, https://doi.org/10.5194/egusphere-egu25-14444, 2025.

EGU25-14857 | ECS | Posters on site | CL4.19

Radiolarians reveal past water mass changes at the Sabrina Coast, East Antarctica 

Kelly-Anne Lawler, Vikki Lowe, Giuseppe Cortese, Amy Leventer, Taryn Noble, Philip O'Brien, Bradley Opdyke, Alix Post, and Leanne Armand

Radiolarians are siliceous marine zooplankton found in all of the world’s oceans, inhabiting the entire water column. Their fossilised skeletons, preserved in marine sediments, provide valuable paleoceanographic information due to their distinct depth preferences. In the Southern Ocean, radiolarians preserved in ice-edge marine sediment cores offer a snapshot into  past oceanographic conditions and climatic changes linked to ocean-ice interactions.

Detailed counts of radiolarian taxa have been generated using a sediment core from the Sabrina Coast, East Antarctica. The Sabrina Coast serves as the marine exit point of the Totten Glacier, which is currently thinning due to surface and basal processes. The radiolarian record reveals instances of water mass change on the continental slope during the four most recent interglacial periods (Marine Isotope Stages 1, 5, 7, and 9).

Radiolarian assemblages in this region exhibit greater species richness and diversity than other microfossil groups, such as diatoms and silicoflagellates. Factor analysis highlights that radiolarian assemblages are more dynamic and variable than diatom assemblages during interglacial periods. Fluctuations in the abundance of key radiolarian taxa indicate the presence of intermediate water at times in each interglacial. When paired with subsurface temperature reconstructions, these findings may reveal past periods of basal melting of the Totten Glacier.

How to cite: Lawler, K.-A., Lowe, V., Cortese, G., Leventer, A., Noble, T., O'Brien, P., Opdyke, B., Post, A., and Armand, L.: Radiolarians reveal past water mass changes at the Sabrina Coast, East Antarctica, EGU General Assembly 2025, Vienna, Austria, 27 Apr–2 May 2025, EGU25-14857, https://doi.org/10.5194/egusphere-egu25-14857, 2025.

EGU25-17190 | ECS | Posters on site | CL4.19

Land-ocean interaction in southern New Zealand during the past 200 ka 

Hannah Krüger, Helge Arz, Samuel Toucanne, Jérôme Kaiser, Frank Lamy, Lester Lembke-Jene, Norbert Nowaczyk, and Katharina Pahnke

During the Late Quaternary global climate variations and interactions with the southern westerly wind belt and the adjacent surface ocean circulation caused glacier advances and retreats in New Zealand’s Southern Alps. Most studies in this region, however, focus on the last glacial period and evidence of older glacier activity is more fragmentary. The use of marine sediment cores as continuous archives for glacier fluctuations over glacial-interglacial cycles is a common method to circumvent such terrestrial archive limitations. Our study investigates the glaciation history of New Zealand’s South Island over the past 200,000 years and its interaction with paleoceanographic changes of the adjacent Southeast Tasman Sea. Solander Trough south of New Zealand represents a major conduit of terrestrial sediments from the Southern Alps. Core SO290-17-1 from Solander Trough is therefore ideally suited for a multi-proxy approach. The stratigraphy of the core is based on oxygen isotopes from benthic foraminifera and X-ray fluorescence core scanning, paleo- and rockmagnetic measurements. In addition, stable oxygen and carbon isotopes from planktic and benthic foraminifera are combined with the former methods for the paleoenvironmental reconstructions. The XRF Fe/Ca ratio indicates enhanced terrestrial inputs during MIS 2, MIS 4 and MIS 6. To investigate changes in sediment source and hence glacier dynamics on land, we use radiogenic neodymium isotopes (expressed in ɛNd) as a proxy for source-specific terrestrial input. Significant ɛNd changes in SO290-17-1 are expected in response to glacier fluctuations because of the complex geology (in nature and age) of the Fiordland and East Southland regions, on which glaciers fluctuated during the last glacial periods. Our data for MIS 4-6 will be compared to results obtained on core TAN1106-28 from the Solander Trough for MIS 1-4 (Toucanne et al., submitted).

How to cite: Krüger, H., Arz, H., Toucanne, S., Kaiser, J., Lamy, F., Lembke-Jene, L., Nowaczyk, N., and Pahnke, K.: Land-ocean interaction in southern New Zealand during the past 200 ka, EGU General Assembly 2025, Vienna, Austria, 27 Apr–2 May 2025, EGU25-17190, https://doi.org/10.5194/egusphere-egu25-17190, 2025.

EGU25-17938 | ECS | Orals | CL4.19

Evidence for West Antarctic Ice Sheet sensitivity to different recent Pleistocene interglacial climates 

Jim Marschalek, Guido Pastore, Tina van de Flierdt, Molly Patterson, Robert McKay, Liam Holder, Georgia Grant, Juliane Mueller, Wenshen Xiao, Sunghan Kim, Giuseppe Cortese, Samantha Bombard, R. Mark Leckie, Tim van Peer, Saiko Sugisaki, Osamu Seki, Denise Kulhanek, Pieter Vermeesch, Andrew Carter, and Edward Gasson and the Additional authors

The warmer-than-present interglacial periods of the late Pleistocene provide the closest palaeo analogues to inform predictions of Antarctic ice sheet mass loss over the coming decades and centuries. However, the response of Antarctica’s ice sheets to environmental conditions during these interglacial periods remains poorly constrained, resulting in significant uncertainties in ice sheet model predictions of future sea-level rise. Here, sediment provenance analyses (Nd and Sr isotope compositions, detrital zircon U-Pb dates and heavy mineral counts) reveal changes to ice sheet extent in the Ross Sea over the glacial-interglacial cycles of the last ~400 kyr at International Ocean Discovery Program (IODP) Site U1524.

Glacial periods show a broadly mixed East/West Antarctic provenance signature, consistent with an ice sheet grounded across most of the Ross Sea continental shelf that reworked older sediments. In contrast, interglacial intervals - including the Holocene - consist primarily of sediment derived from West Antarctica, suggesting westward transport by ocean currents dominates sediment delivery to the site. Detailed examination of these West Antarctic sourced intervals reveals a consistent pattern of provenance change over the course of each interglacial examined. East Antarctic-derived sediment is only dominant at the site for two short-lived intervals just after two interglacial periods, thought to be Marine Isotope Stage (MIS) 11 and MIS 9 based on the current age model. These intervals may record a transient ice sheet configuration in the earliest part of each glacial period where the Ross Ice Shelf had grown to a larger-than-present size, whilst the grounding zone had not yet advanced far beyond its present-day location. Critically, each of these two East Antarctic dominated intervals displays different provenance characteristics, implying differing ice flow patterns in the Ross Ice Shelf and therefore different ice sheet extents in the preceding interglacials. This suggests Antarctica’s ice sheets are sensitive to the relatively subtle differences in climate seen in recent interglacial periods.

How to cite: Marschalek, J., Pastore, G., van de Flierdt, T., Patterson, M., McKay, R., Holder, L., Grant, G., Mueller, J., Xiao, W., Kim, S., Cortese, G., Bombard, S., Leckie, R. M., van Peer, T., Sugisaki, S., Seki, O., Kulhanek, D., Vermeesch, P., Carter, A., and Gasson, E. and the Additional authors: Evidence for West Antarctic Ice Sheet sensitivity to different recent Pleistocene interglacial climates, EGU General Assembly 2025, Vienna, Austria, 27 Apr–2 May 2025, EGU25-17938, https://doi.org/10.5194/egusphere-egu25-17938, 2025.

EGU25-18269 | ECS | Posters on site | CL4.19

Changes in deep water circulation dynamics in the South Atlantic Ocean during Marine Isotope Stage 11 

Lisa S. Oelkers, Natalia Vazquez Riveiros, Daniel A. Frick, Claire Waelbroeck, and Julia Gottschalk

Persistent deep-water formation in the North Atlantic and Southern Ocean is believed to drive the ventilation of the global deep ocean throughout late Pleistocene interglacial periods. The persistency of interglacial deep-ocean ventilation was, however, challenged based on reconstructed deep ocean deoxygenation events at Ocean Drilling Program (ODP) Site 1094 from the Antarctic Atlantic Ocean attributed to a perturbation in Antarctic Bottom water (AABW) formation during Marine Isotope Stage (MIS) 5e and 11. While a connection to instabilities of the West Antarctic Ice Sheet related to warming of Circumpolar Deep Water was postulated, the drivers and spatial extent of these ‘AABW stagnation events’ remain incompletely known. Here, we present new bottom water oxygen (BWO) reconstructions based on authigenic U enrichments in benthic foraminiferal coatings of Uvigerina spp. from Subantarctic Atlantic sediment core MD07-3077 (44.15°S, 14.23°E; 3770 m) for MIS 11 (424-374 ka before present). A combination of these BWO estimates with Uvigerina spp. Mg/Ca-derived bottom water temperature (BWT)- and δ18O-derived bottom water salinity (BWS) reconstructions at the same study site provides insights into the impact and mechanisms driving AABW stagnation events in the Atlantic Southern Ocean. Our results reveal predominantly well-oxygenated deep-water conditions in the Subantarctic Atlantic during MIS 11, with only one transient low-BWO event at 395 ka before present. This suggests that AABW stagnation events during MIS 11 were largely confined to the Antarctic Atlantic Ocean, indicating a limited northward expansion of poorly oxygenated water. Although this hints at a driver from the south, the variability in our reconstructed BWT and BWS records during the postulated MIS11 AABW stagnation events suggest various hydrographic settings that pinpoint mechanistic differences in the drivers among the bottom water deoxygenation events. Our new data provides crucial constraints on the (in)stability of climatic conditions in the Atlantic Southern Ocean, and by inference near the Antarctic ice sheet margin, during the warmer-than-present climate interval MIS 11.

How to cite: Oelkers, L. S., Vazquez Riveiros, N., Frick, D. A., Waelbroeck, C., and Gottschalk, J.: Changes in deep water circulation dynamics in the South Atlantic Ocean during Marine Isotope Stage 11, EGU General Assembly 2025, Vienna, Austria, 27 Apr–2 May 2025, EGU25-18269, https://doi.org/10.5194/egusphere-egu25-18269, 2025.

EGU25-18501 | Posters on site | CL4.19

Orbital and millennial-scale upper ocean dynamics in the Pacific Southern Ocean since the Mid-Pleistocene Transition 

Frank Lamy, Vincent Rigalleau, Nicoletta Ruggieri, Lester Lembke-Jene, Helge W. Arz, Gesine Mollenhauser, and Gisela Winckler

The Southern Ocean plays a critical role in the Earth system, both for the uptake of anthropogenic carbon and for the exchange of heat and nutrients between high and low latitudes. This is particularly valid for the Subantarctic Southern Ocean where atmosphere-ocean-cryosphere interactions and teleconnections between high and low latitudes play an important role in past and future climate change providing the major link between Antarctica and the low latitudes. In general, atmosphere-ocean interactions within the Southern Ocean are believed to control sea ice cover, upper ocean stratification, biological nutrient utilization, and exposure rates of CO2-enriched deep water. Thus, they have been considered to play a key role in explaining the variability in atmospheric CO2 concentrations, which are controlled by biogeochemical and physical processes.

Beyond information from continental margin records, little is known on millennial-scale variability in the pelagic Southern Ocean. High resolution sediment archives reaching back various glacial/interglacial cycles have not been explored so far. This includes the time span beyond the reach of the presently available ice-cores and will likely be critical for evaluating the extended time-interval of the ongoing European Beyond EPICA – oldest ice (BE-OI) ice core drilling initiative. Our project focuses on high resolution paleoceanographic reconstructions (biomarker-based sea surface temperatures, biogenic opal, Antarctic Circumpolar Current strength, ice-rafted detritus) of upper ocean dynamics at Expedition 383 IODP Site 1539 in the subantarctic South Pacific in vicinity of the modern Subantarctic Front (SAF). This location is characterized by unusually high sedimentation-rates (~10-50 cm/kyr), mainly because Site U1539 is reached by the northerly extended opal belt during glacials with high diatom ooze deposition. This unique setting provides a high-resolution pelagic sediment archive in an area with strong oceanographic gradients (close to the SAF with strong dynamics of SST, ACC strength, and the influence of the opal belt).

We expect that high resolution records from IODP Expedition 383 Site U1539 could substantially enhance our understanding of sub-orbital climate variations and potential tipping points in the Southern Ocean and their link to the marine carbon cycle and Antarctic ice-sheet stability.

How to cite: Lamy, F., Rigalleau, V., Ruggieri, N., Lembke-Jene, L., Arz, H. W., Mollenhauser, G., and Winckler, G.: Orbital and millennial-scale upper ocean dynamics in the Pacific Southern Ocean since the Mid-Pleistocene Transition, EGU General Assembly 2025, Vienna, Austria, 27 Apr–2 May 2025, EGU25-18501, https://doi.org/10.5194/egusphere-egu25-18501, 2025.

EGU25-18659 | Posters on site | CL4.19

Multi-proxy reconstruction of sea surface temperatures in the Pacific Southern Ocean over the last glacial-interglacial cycle 

Nicoletta Ruggieri, Andrea Jaeschke, Jens Hefter, Vincent Rigalleau, Lester Lembke-Jene, Oliver Esper, Gesine Mollenhauer, Gisela Winckler, and Frank Lamy

The Southern Ocean, especially the Subantarctic region, plays a critical role in anthropogenic carbon uptake, heat exchange, and nutrient transfer between high and low latitudes. Pronounced past changes in surface ocean properties, particularly sea surface temperatures (SSTs), reflect this region’s exceptional sensitivity to external and internal forcings over millennial and orbital timescales. This underscores its importance in understanding past and future climate change and its key role as major link between Antarctica and the low latitudes.

Accurate reconstructions of past SSTs are crucial for understanding past climate dynamics and validating models for future projections. To achieve this, various temperature proxies based on physical, chemical, and biological properties preserved in marine sediments have been developed. However, all proxies carry uncertainties due to environmental factors that may bias the signals archived in the sedimentary record. A multiproxy approach helps to mitigate these uncertainties, providing a more robust and comprehensive interpretation of past climate conditions.

This study presents a high-resolution SST reconstruction from IODP Expedition 383 Site U1539 and pre-site survey PS75/054 in the Subantarctic South Pacific, near the modern Subantarctic Front (SAF), using three different temperature proxies: a diatom transfer function and two organic proxies based on coccolithophorid alkenone lipids (UK’37) and archaeal glycerol dialkyl glycerol tetraether (GDGT) lipids (TEX86). This location is characterized by unusually high sedimentation-rates (~10-50 cm/kyr), mainly because the northerly extended opal belt reaches Site U1539 during glacials with high diatom ooze deposition.

Our record spans the last 150 ka with a centennial to millennial resolution. The general temperature pattern follows the overall glacial/interglacial succession. The alkenone SSTs range from minimum values approaching zero around the Last Glacial Maximum to ~10°C in MIS 5e (and 6-7°C during the Holocene equivalent to modern austral summer SST). These exceptionally high glacial/interglacial amplitudes are much less pronounced in the diatom summer SST reconstruction with an amplitude of only~3-4°C. Much higher SSTs are shown by the TEX86 with equally maximum values during MIS 5e (absolute SST higher than the alkenone SST). However, the TEX86 temperature record shows very high amplitudes at millennial time-scales. Within dating uncertainties, these changes follow the Antarctic temperature pattern as recorded in ice-core.

We are discussing the palaeoceanographic implications of our SST records and potential reasons for the partial mismatches of the different SST proxies. These include varying seasonality sensitivity, depth habitat, and SST calibration and transfer function uncertainties.

How to cite: Ruggieri, N., Jaeschke, A., Hefter, J., Rigalleau, V., Lembke-Jene, L., Esper, O., Mollenhauer, G., Winckler, G., and Lamy, F.: Multi-proxy reconstruction of sea surface temperatures in the Pacific Southern Ocean over the last glacial-interglacial cycle, EGU General Assembly 2025, Vienna, Austria, 27 Apr–2 May 2025, EGU25-18659, https://doi.org/10.5194/egusphere-egu25-18659, 2025.

EGU25-21005 | Orals | CL4.19 | Highlight

 West Antarctic Ice Sheet dynamics controlled export production in the Pacific Southern Ocean over the last 500,000 years 

Torben Struve, Frank Lamy, Frederik Gäng, Johann Klages, Katharina Pahnke, Gerhard Kuhn, Oliver Esper, Lester Lembke-Jene, and Gisela Winckler

The increased supply of the micronutrient iron (Fe) promotes primary and export production in the Fe-limited Southern Ocean, which acts as a dynamic sink of atmospheric CO2 that has amplified past natural climate variations. This mechanism critically relies on the partial dissolution of the lithogenic particle input. However, the influence of lithogenic particle composition (and Fe solubility) on Southern Ocean export production in the large Antarctic Zone (AZ) is largely unconstrained for the Pleistocene glacial cycles. Here, we present a comprehensive dataset of glacial-interglacial particle fluxes and geochemical composition in the remote Southeast Pacific AZ covering the last 500,000 years. The observed high fluxes and compositional range of lithogenic material can only be explained by sediment input sourced from West Antarctica. Importantly, higher solubility of the lithogenic input corresponds with enhanced export production, implying that West Antarctic Ice Sheet (WAIS) dynamics controlled the primary production in large parts of the South Pacific AZ. These processes contributed to atmospheric CO2 reductions in particular during the early part of the glacial cycles, suggesting that the WAIS retreat will likely affect predictions of future changes in Southern Ocean biogeochemical cycles.

How to cite: Struve, T., Lamy, F., Gäng, F., Klages, J., Pahnke, K., Kuhn, G., Esper, O., Lembke-Jene, L., and Winckler, G.:  West Antarctic Ice Sheet dynamics controlled export production in the Pacific Southern Ocean over the last 500,000 years, EGU General Assembly 2025, Vienna, Austria, 27 Apr–2 May 2025, EGU25-21005, https://doi.org/10.5194/egusphere-egu25-21005, 2025.

EGU25-407 | ECS | Orals | CL4.21

Kilometer-scale trends, variability, and extremes of the Adriatic far-future climate (RCP 8.5, 2070−2100) 

Iva Vrdoljak, Cléa Denamiel, and Ivica Vilibić

Due to the Adriatic basin unique orography-driven dynamics, the atmosphere-ocean interactions within this region are poorly represented in currently available regional climate models. To address this gap, the Adriatic Sea and Coast (AdriSC) kilometer-scale atmosphere-ocean model was developed to provide a more accurate assessment of climate hazards in the Adriatic under historical (1987–2017) and far-future (2070–2100) conditions. Our analysis of AdriSC model projections for the far-future climate reveals significant and alarming changes. These include pronounced land-sea atmospheric contrasts, intensified heatwaves, extreme rainfall, and droughts. Additionally, we observe enhanced surface saline lake effects during summer, a contracting yet intensified southern Adriatic cyclonic gyre, and strengthened vertical stratification over the South Adriatic Pit. Several of these changes, such as more frequent and prolonged heatwaves, are already observable and causing widespread socio-environmental impacts. Shifts in precipitation patterns, with altered timing and intensity, are increasing the risk of both droughts and floods, while rising ocean temperatures, salinities, and marine heatwaves are threatening marine ecosystems, fisheries, and aquaculture. These findings highlight the critical importance of robust kilometer-scale atmosphere-ocean modeling for accurately projecting and addressing extreme climate events. Expanding the AdriSC experiment with ensemble simulations under multiple climate scenarios would further enhance the reliability of these projections, providing invaluable insights for policymakers and local communities. Such work is essential for the development of effective adaptation and mitigation strategies to address the evolving climate challenges in the Adriatic region.

How to cite: Vrdoljak, I., Denamiel, C., and Vilibić, I.: Kilometer-scale trends, variability, and extremes of the Adriatic far-future climate (RCP 8.5, 2070−2100), EGU General Assembly 2025, Vienna, Austria, 27 Apr–2 May 2025, EGU25-407, https://doi.org/10.5194/egusphere-egu25-407, 2025.

EGU25-531 | ECS | Posters on site | CL4.21

Multi-source assessment of current precipitation dynamics over the Mediterranean region 

Akbar Rahmati Ziveh, Yannis Markonis, Martin Hanel, Christos J. Lolis, and Amir AghaKouchak

Climate change and variability are expected to intensify the hydrological cycle, altering precipitation patterns, especially in climate hot spots like the Mediterranean region. Despite extensive research, comprehensive studies using high-resolution datasets to assess spatial and temporal variability across the entire Mediterranean are limited. Here, we analyze trends in total precipitation, wet days, daily intensity, and quantile-based precipitation intensities using ten datasets from 2001 to 2019: E-OBS, EM-EARTH, ERA5-Land, GPM-IMERG, GSMaP, GPCP, GPCC, MERRA2-Land, MSWEP, and MSWX. Results indicate an increase in total precipitation driven by more wet days and intensified precipitation. Spatial analysis shows rising annual precipitation trends in the eastern and northern Mediterranean, while the western region, especially the Iberian Peninsula, exhibits declines. Annual precipitation and wet day frequency display mirrored patterns, with both metrics gradually increasing until 2012, followed by higher variability. Quantile analysis reveals rising precipitation trends across all, with medium-range quantiles (30th to 60th quantiles) showing the highest increases. These findings enhance our understanding of recent precipitation changes in the Mediterranean, crucial for water resource management, agriculture, and climate resilience.

How to cite: Rahmati Ziveh, A., Markonis, Y., Hanel, M., J. Lolis, C., and AghaKouchak, A.: Multi-source assessment of current precipitation dynamics over the Mediterranean region, EGU General Assembly 2025, Vienna, Austria, 27 Apr–2 May 2025, EGU25-531, https://doi.org/10.5194/egusphere-egu25-531, 2025.

This study focused on four Mediterranean Sea (MS) cyclones classified as medicanes: Zorbas, Ianos, Apollo, and Daniel. Each of these cyclones traversed warm-core eddies (WCEs) during their propagation. We explored the influence of these eddies on the cyclones' development and examined how the eddies, including their biogeochemical properties, responded to the passage of the cyclones. Cyclones Zorbas and Apollo intensified considerably in close proximity to the WCEs. The intensification was accompanied by moisture convergence, yielding substantial precipitation. Additionally, chlorophyll-a concentrations and Phytoplankton increased after the cyclone passed over a WCE. Cyclone Ianos, the strongest recorded cyclone in the MS, underwent only marginal intensification above the WCE. However, in this case, a strong marine heatwave (MHW) was present later during the intensification, releasing more latent and sensible heat fluxes due to the high ocean heat content (OHC). Medicane Daniel has stood out as the deadliest recorded storm in Mediterranean history. Our analysis identified the presence of a WCE (OHC) and a moderate MHW at the location where the medicane intensified. These conditions led to high moisture convergence, increased total column water, and significant precipitation. Since the WCE and MHW features were situated near the coastal region, the medicane reached its maximum intensity just before landfall, potentially contributing to the reported severe damage in Libya. In the case of Ianos and Daniel, chlorophyll-a concentrations and Phytoplankton increased at the MHW location. All four cyclones responded similarly to elevated temperatures at the mesoscale (i.e., WCE) and regional scale (i.e., MHW). Our results stress the importance of mesoscale and regional SST variability and how they may regulate extreme storms like medicanes.

How to cite: Jangir, B. and Strobach, E.: Interaction between Medicanes and the Mediterranean Sea: Investigating Sea Surface Temperature Anomalies in the path of medicanes and the Case study of Medicane Daniel, the Deadliest Mediterranean Cyclone, EGU General Assembly 2025, Vienna, Austria, 27 Apr–2 May 2025, EGU25-934, https://doi.org/10.5194/egusphere-egu25-934, 2025.

EGU25-2949 | ECS | Posters on site | CL4.21

Is the Projected Aridification in the Mediterranean Region a Simple "Dry-Get-Drier" Response? 

Roshanak Tootoonchi and Simona Bordoni

Models robustly project decreases in net precipitation (precipitation minus evaporation, P–E) due to human-induced warming over the Mediterranean region, in qualitative agreement with the simple thermodynamic "dry-get-drier" scaling of the atmospheric moisture convergence (Held and Soden, 2006). This thermodynamic scaling, however, neglects changes in relative humidity and horizontal temperature gradients, which might be important in a region of large land–ocean contrasts, such as the Mediterranean. Here we explore if and to what extent the extended scaling of Byrne and O'Gorman (2015), which incorporates these gradients and is based on climatological moisture fluxes and changes in surface properties only, might better capture the thermodynamic response of the Mediterranean hydroclimate projected by the end of the 21st century by ten models in the phase 6 of the Coupled Model Intercomparison Project (CMIP6) archive.

According to the CMIP6 multi-model mean, the simple scaling for the mean thermodynamic component, in the absence of changes in atmospheric circulation and advection, causes a negative P–E tendency over the Mediterranean Sea and the surrounding land areas and a weak positive P–E tendency over northwestern Africa. This is indeed an amplified pattern of the time mean flow: there is increased moistening (drying) where the time mean flow is convergent (divergent) in the base climate.

The extended scaling, unlike the simple scaling, predicts a wettening over the ocean, in the annual mean and through the seasonal cycle. While not fully accounting for the magnitude nor the extent of the wettening due to the “full” thermodynamic adjustment of the Mediterranean hydroclimate, inclusive of thermodynamic contributions from both moisture convergence and advection, the extended scaling outperforms the simple scaling by partially capturing the overall signal. Throughout the region, differences between the simple and the extended scaling primarily arise from the contribution of the terms involving the gradients of fractional changes in near-surface relative humidity and changes in the near-surface temperature, with the term involving changes in relative humidity being negligible. Even if largely cancelling, the two gradient terms give rise to a pattern grossly characterized by moistening over the ocean and drying over neighboring land regions.

The results of this work highlight how thermodynamical changes in the Mediterranean hydrological cycle result from an interplay between different mechanisms, arising from the thermodynamical contributions from both moisture convergence and horizontal advection. While the extended scaling has been shown to be an effective approach in explaining the deviation of the global annual-mean P–E response over land from the "wet-get-wetter" paradigm, it has not been evaluated for regional studies or different seasons. Our study shows that regional studies, such as those focusing on the Mediterranean, could also benefit from the extended scaling, enhancing our understanding of future hydroclimate changes in this vulnerable region.


References:

  • Byrne, M. P., & O’Gorman, P. A. (2015). The response of precipitation minus evapotranspiration to climate warming: Why the “Wet-get-wetter, dry-get-drier” scaling does not hold over land. Journal of Climate, 28(20), 8078–8092. https://doi.org/10.1175/JCLI-D-15-0369.1
  • Held, I. M., & Soden, B. J. (2006). Robust Responses of the Hydrological Cycle to Global Warming. Journal of Climate, 19(21), 5686–5699. https://doi.org/10.1175/JCLI3990.1

How to cite: Tootoonchi, R. and Bordoni, S.: Is the Projected Aridification in the Mediterranean Region a Simple "Dry-Get-Drier" Response?, EGU General Assembly 2025, Vienna, Austria, 27 Apr–2 May 2025, EGU25-2949, https://doi.org/10.5194/egusphere-egu25-2949, 2025.

Farmers confront a range of climate change-induced stressors, such as increasing temperatures, variations in rainfall, and the heightened frequency and intensity of extreme weather events, underscoring the varying risks in challenging decision-making processes. Increasing the success in adapting to climate extremes largely depends on a thorough understanding of farmers’ perspectives and abilities to face both immediate and prolonged climate disturbances. Strategies can differ based on intention (independent or self-directed), duration (short- or long-term), type and level of engagement (individual or community, local or global), and nature (technical, financial, institutional), whether they are applied before or after severe weather events and concurrent extremes. Furthermore, internal drivers (e.g., farmers’ characteristics, experiences, attitudes) and external predictors (e.g., innovation and technology, costs, incentives, support) tend to influence farmer risk perception, preparation intention, and adaptive capacity. Hence, it is imperative to conduct a conscientious assessment of how farmers face climate change to gain a deeper understanding of their vulnerability or resilience, and effectively move to increasing their adaptive capacity.

Following a bottom-up approach, this contribution delves into farmers’ behaviour regarding climate change by considering climate change awareness, perception, and adaptation. We conducted 921 surveys randomly among farmers in California, known as the California’s agricultural hub, concentrating about five million hectares growing more than 250 crops and producing ¼ of the nation’s food production. As one of the most climatically vulnerable regions globally, it is essential to examine how farmers experience, perceive, and respond to more frequent and intense extremes events (e.g., heatwave, drought, wildfire, erratic rainfall) together with evaluating the nature and nuance of (anthropogenic) climate change scepticism. Three main questions are addressed through descriptive and inferential statistics: 1) Do farmers recognize climate change as a major issue and identify who is responsible for? 2) What are the most perceived impacts and which effects are more evident among the farming community? and 3) How significantly do farmers promote adaptation strategies and what barriers reduce their resilience?

Preliminary results highlighted that 1) Farmers believe their farm is exposed to extreme events (75%), particularly challenging for irrigated crops (80%), 2) Warmer temperatures, heatwaves and droughts together with decreased rainfall and snowpack are reported by at least half of farmers, increasing changes in plant growth (59%), and 3) 2 out of 3 farmers introduce soil conservation techniques and switching to more efficient irrigation methods. However, some barriers are hindering adaptation, such as the high cost of investment (72%), the increasing environmental regulatory requirements (68%) or the lack of funding to support climate adaptation (e.g., water trading programs), which was pinpointed by half of the respondents. Additionally, we have explored the potential heterogeneity among farmers’ preferences and the influence and predictability between being aware and perceive climate change impacts, and perceive impacts and apply for adaptation measures. A better comprehension of the farmers’ behavior in terms of risk assessment and adaptive capacity can facilitate the transferability of bottom-up findings into behavior modelling as well as the customization of more targeted and flexible adaptation instruments and strategies.

How to cite: Ricart, S., Escriva-Bou, A., and Castelletti, A.: How Californian farmers perceive and react to climate change? A triple-loop approach to strengthening climate risk assessment from social learning, EGU General Assembly 2025, Vienna, Austria, 27 Apr–2 May 2025, EGU25-4548, https://doi.org/10.5194/egusphere-egu25-4548, 2025.

EGU25-7479 | Orals | CL4.21

Mediterranean precipitation remains stationary and is primarily driven by the natural dynamics of atmospheric circulation 

Sergio Martín Vicente Serrano and the Mediterranean Precipitation Analysis Team

Advanced climate models project a substantial decrease in future precipitation for the Mediterranean, consistent with recent observational studies suggesting declining rainfall levels often attributed to human-driven climate change. However, other researchers highlight significant variability in Mediterranean precipitation due to atmospheric circulation patterns, with overall stability over the long term. Given these conflicting findings, a detailed evaluation of precipitation trends is essential, relying on high-quality, densely distributed observational data and comparing climate model simulations with historical observations. Using a dataset from over 23,000 stations across 27 countries, we have demonstrated that Mediterranean precipitation has remained largely stable, exhibiting variability over multi-decadal and annual scales. While earlier studies have frequently linked the relatively small number of significant precipitation trends identified to anthropogenic influences, it seems more plausible that such trends are driven through variability in atmospheric circulation driven by the internal variability. Notably, this study found limited evidence of human activity directly affecting the atmospheric circulation mechanisms, whether on a large or regional scale. Moreover, our findings align with CMIP6 model simulations, both of which suggest the absence of a consistent long-term trend in precipitation.

How to cite: Vicente Serrano, S. M. and the Mediterranean Precipitation Analysis Team: Mediterranean precipitation remains stationary and is primarily driven by the natural dynamics of atmospheric circulation, EGU General Assembly 2025, Vienna, Austria, 27 Apr–2 May 2025, EGU25-7479, https://doi.org/10.5194/egusphere-egu25-7479, 2025.

EGU25-8848 | Posters on site | CL4.21

Summer-time Mediterranean amplification to different climate drivers 

Stergios Misios, Kostas Douvis, Theodora Stavraka, John Kapsomenakis, Stavros Solomos, Antonis Gkikas, Christos Spyrou, Ilias Fountoulakis, Anastasia Poupkou, Pavlos Kalabokas, and Christos Zerefos

The Mediterranean region is particularly sensitive to climate change as it is located at the crossroads of atmospheric processes. In the Mediterranean, and particularly in it’s eastern parts, the rate of warming is more pronounced than the global mean rate of warming, with projected increase up to  2.5-3.0 °C and simultaneous decrease in precipitation of 15 % by the end of the century.

Here, we investigate the contribution of different climate drivers to regional warming trends, focusing in the summer season. We are analyzing surface and atmospheric temperature trends in simulations from nine climate models participating in the Precipitation Driver and Response Model intercomparison project (PDRMIP). The model simulations have assumed idealized and abrupt forcing applied in global scale, specifically: doubling the CO2 concentrations, 10 times the present-day black carbon concentrations, 5 times the SO4 concentration, 3 times the CH4 concentration and 2% increase in total solar irradiance (TSI). Model results are compared with trends in reanalysis datasets and long-term radiosonde soundings in selected locations in the eastern Mediterranean. 

Increases in CO2, CH4 and TSI cause a very similar seasonal variation of the temperature amplification, with a stronger magnitude simulated at the upper troposphere. Consistent to the surface amplification, the strongest warming in the upper troposphere is found in the June-July-August (JJA) season. SO4 causes a stronger upper tropospheric temperature amplification, particularly in July and August. BC aerosols, on the other hand cause a considerably stronger amplification in the JJA season which spreads to the upper troposphere the following months.

Our analysis highlights the important role of aerosols in the observed summer-time temperature trends in the Mediterranean and mechanisms are discussed.

How to cite: Misios, S., Douvis, K., Stavraka, T., Kapsomenakis, J., Solomos, S., Gkikas, A., Spyrou, C., Fountoulakis, I., Poupkou, A., Kalabokas, P., and Zerefos, C.: Summer-time Mediterranean amplification to different climate drivers, EGU General Assembly 2025, Vienna, Austria, 27 Apr–2 May 2025, EGU25-8848, https://doi.org/10.5194/egusphere-egu25-8848, 2025.

EGU25-9271 | Orals | CL4.21

Projected temperature changes in the Eastern Mediterranean for the 21st century from downscaled GCMs  

Chaim Garfinkel, Dorita Rostkier-Edelstein, Anton Gelman, Efrat Morin, and Lidia Schendrik

The Middle East is a "hot spot" for climate change. Global climate models (GCM) have low spatial resolution and cannot capture the spatial variability of the region's climate. We developed a statistical downscaling (SD) method to assess expected temperature changes in diverse climate zones of the Eastern Mediterranean. The SD algorithm is based on finding past synoptic conditions ("analogues"), also known as the K-nearest neighbors (KNN) method. This method links coarse spatial resolution GCMs with past local measurements of temperature to provide the local future estimates.

The SD was trained on ERA5.1 reanalysis to characterize past synoptic conditions and 30 homogenized past local observations of surface temperature for the period 1979-2014. The algorithm optimization and validation were achieved through cross-validation against the historical observations. The process showed that gridded surface temperatures from global models are enough for optimal accuracy. The algorithm has been applied on 10 CMIP6 models for the historical period, the SSP245 [greenhouse gases (GHG) emissions rate decreases till the end of the 21st century] and the SSP585 (GHG emissions significantly increase till the end of the 21st century) scenarios.

Cross-validation of ERA5.1 and CMIP6-models downscaled results for the historical period show that the minimum and maximum temperature distributions generated by the SD algorithm closely fit those at the 30 measurement stations. Moreover, they are significantly more accurate than those derived from the coarse-resolution CMIP6 models, which show cold-biased thinner distributions.

After validation of the algorithm, we apply it to downscale CMIP6 models for the 2080-2100 period. The downscaled SSP245 scenario shows that minimum and maximum temperatures increase by up to 5o C and 4o C with respect to the reference historical period, respectively. For the downscaled SSP585 scenario maximum changes are as large 7o C and 5o C for minimum and maximum temperatures, respectively.  More significant warming is observed during the cold season, in agreement with previously reported studies for the Northern hemisphere extra-tropics. The downscaled temperature estimations show their usefulness in projecting future temperatures at fine spatial resolution (well below the GCMs spatial resolution) that capture different climate characteristics (e.g., urban versus rural locations, low elevation versus mountain terrain), not possible to appropriately estimate from coarse GCMs.

On-going work focuses on additional future time periods and scenarios, further improvement of the algorithm in dealing with out-of-sample data, geographic transferability and use of the projected downscaled temperatures in human health studies. 


How to cite: Garfinkel, C., Rostkier-Edelstein, D., Gelman, A., Morin, E., and Schendrik, L.: Projected temperature changes in the Eastern Mediterranean for the 21st century from downscaled GCMs , EGU General Assembly 2025, Vienna, Austria, 27 Apr–2 May 2025, EGU25-9271, https://doi.org/10.5194/egusphere-egu25-9271, 2025.

EGU25-10431 | ECS | Posters on site | CL4.21

Exploring Future Bioclimatic Changes In Western Türkiye Under SSP3 Projections 

Ongun Şahin, Ayşegül Ceren Moral, Cemre Yürük Sonuç, Emre Salkım, and Yurdanur Ünal

This study investigates climate change patterns in the western region of Türkiye using high-resolution bioclimatic variables to capture the detailed spatial and temporal changes. It is funded by the project titled Predicting the Distribution of Future Basic Forest Tree Species Using Different Climate Projections and Developing Adaptation Strategies for Turkey' which is implemented under the “Climate Change Adaptation Grant Program (CCAGP)”.

The western part of Türkiye is characterized by vast agricultural areas and majority of the nation’s forest stock both of which play critical roles in the country's economy and ecology. The region's agricultural lands serve as one of the primary suppliers of food and resources to urban centers, ensuring food security and economic stability. Additionally, the forests in this area are ecological hotspots, hosting approximately 300 endemic plant species and contributing to biodiversity conservation. The importance of agriculture and forestry in the region emphasize the need for a thorough understanding of climate impacts, facilitating the development of sustainable agricultural and forestry management practices and policies to protect these vital resources.

To explore these dynamics in depth, we conducted the regional climate model simulations using COSMO-CLM at a convective permitting resolution 2.5 km x 2.5 km, driven by the EC-EARTH3-Veg from the CMIP6. These simulations were carried out for both historical (1995-2014) and future periods, including the mid-century (2050-2059) and the end of the century (2090-2099) under SSP3-7.0 scenario. To assess the reliability of the regional climate model, we compared its output with observational data from the region for the reference period. Key variables such as temperature and precipitation were analyzed, and their values were contrasted against the on-site measurements. Subsequently, we calculated bioclimatic variables for the reference period, as well as for the mid-century and end-of-century projections, to assess how these climatic changes might affect the region over time.

This high-resolution analysis enables a detailed assessment of 19 bioclimatic variables and their trends throughout the century how the agricultural and forest areas respond to climate change. Acquiring knowledge of the projected increase in temperature and the decline in precipitation by the end of the century is crucial for understanding the impacts on these vital areas, which are essential for ecosystem health and biodiversity. Under the SSP3-7.0 scenario, our findings indicate that annual mean temperatures increase around 4.5°C when comparing the period of 1995-2014 with that of 2090-2099. Also, we found that annual precipitation amount over the region decreases around 170 mm/year, which indicates a nearly 25% reduction in the freshwater availability by the end of the century. Especially, the precipitation of the wettest month shows a comparable decrease across these periods. Understanding these shifting in bioclimatic variables is crucial to preserve the agricultural and forest areas with their biodiversity.

How to cite: Şahin, O., Moral, A. C., Yürük Sonuç, C., Salkım, E., and Ünal, Y.: Exploring Future Bioclimatic Changes In Western Türkiye Under SSP3 Projections, EGU General Assembly 2025, Vienna, Austria, 27 Apr–2 May 2025, EGU25-10431, https://doi.org/10.5194/egusphere-egu25-10431, 2025.

EGU25-11424 | Posters on site | CL4.21

Advancing climate change vulnerability assessment of Mediterranean seagrass meadows 

Bohao He, Qianjiang Li, Zhuoling Li, Jinjie Zhao, and Lorenzo Mari

Seagrass meadows are pivotal marine ecosystems supporting biodiversity, stabilizing coastlines, and acting as major carbon sinks worldwide. Yet, these habitats are increasingly threatened by climate change. This global pattern is especially evident in the Mediterranean Sea, where rising temperatures and ocean acidification surpass global trends. This study presents a comprehensive vulnerability assessment for key Mediterranean seagrass families (Cymodoceaceae and Posidoniaceae) under different climate scenarios, using the latest Shared Socio-economic Pathways (SSPs) from the IPCC’s 6th Assessment Report. We integrated species distribution models (SDMs) and climate-niche factor analysis (CNFA) to capture sensitivity (encompassing ecological marginality and niche specialization) and exposure (quantifying climate departure from baseline conditions). Our ensemble SDMs, trained on an extensive dataset of seagrass occurrences and multi-decadal environmental data, revealed high predictive performance for both Cymodoceaceae and Posidoniaceae. Results indicate that Posidoniaceae generally exhibit higher risk owing to slower growth rates and reduced adaptive capacity. Under moderate to high emission scenarios (SSP2-4.5 and SSP5-8.5), hotspots of heightened seagrass vulnerability emerge in the northern and eastern Adriatic Sea, the northeastern Aegean-Levantine Seas, and parts of the Western Mediterranean. A marked “tipping point” in exposure-vulnerability relationships suggests that even incremental increases in climate stressors can trigger disproportionate ecological responses. Further, while warming also poses a significant threat, our findings identify ocean acidification as a dominant driver of future seagrass declines in the Mediterranean, with vulnerability trends persisting beyond 2070 under high-emission pathways. These insights emphasize the urgent need for integrated climate mitigation and targeted regional management strategies, including robust greenhouse gas emission reductions and local conservation measures. By elucidating the spatial heterogeneity of seagrass responses, this study offers a critical framework to prioritize interventions, protect essential ecosystem services, and guide policy-making for sustaining Mediterranean marine biodiversity and coastal resilience in an era of rapid environmental change.

How to cite: He, B., Li, Q., Li, Z., Zhao, J., and Mari, L.: Advancing climate change vulnerability assessment of Mediterranean seagrass meadows, EGU General Assembly 2025, Vienna, Austria, 27 Apr–2 May 2025, EGU25-11424, https://doi.org/10.5194/egusphere-egu25-11424, 2025.

EGU25-12096 | Posters on site | CL4.21

Climate Change Impacts on Olive Oil Production in Greece: Challenges and Pathways to Resilience 

Aristeidis Koutroulis, Ioannis Daliakopoulos, and Manolis Grillakis

Climate change is posing significant challenges in the agricultural sector. While olive trees are well adopted to the mediterranean environment, olive oil production is being especially vulnerable due to its reliance on stable climatic conditions [1]. A recent example of drought and heatwaves in the previous two years slashed Spanish production and contributed to the doubling of olive oil prices [2]. Changes in temperature and precipitation are affecting olive tree cultivation by posing challenges in the flowering and growing season [3], as well as the soil moisture and the available water resources for irrigation.

This study investigates the impacts of climate change on olive cultivation in Greece, by analyzing key climatic indicators relevant to olive cultivation, focusing on their historical trends and projected changes under mid-range (RCP4.5) and high-concentration (RCP8.5) scenarios. The analysis considers key indicators such as changes in the length of the dry season, the frequency of heat stress events, consecutive dry years, and shifts in critical flowering conditions (temperature, wind, and chilling accumulation). This research further explores soil management related sustainable agricultural practices to enhance crop resilience.

This research develops representative climatic indicators and examines their evolution across multiple scenarios and time horizons to provide a comprehensive overview of the climate change challenges faced by Greek olive producers. The findings are aiming to inform the development of strategies for implementing sustainable agricultural practices that enhance resilience, ensuring the long-term viability of olive oil production in the context of climate change.


[1] Kaniewski, D., Marriner, N., Morhange, C., Khater, C., Terral, J.F., Besnard, G., Otto, T., Luce, F., Couillebault, Q., Tsitsou, L. and Pourkerman, M., 2023. Climate change threatens olive oil production in the Levant. Nature Plants, 9(2), pp.219-227.

[2] Reiley, L., 2023. Olive oil prices reach record highs as Spain's harvest is halved. The Washington Post, Oct. 6, 2023, pp.NA-NA.

[3] Grillakis, M.G., Kapetanakis, E.G. and Goumenaki, E., 2022. Climate change implications for olive flowering in Crete, Greece: Projections based on historical data. Climatic Change, 175(1), p.7.


This work is supported by MINERVA Ltd. under the research project “Assessment of climate change impacts on olive oil production and implementation of sustainable agricultural adaptation practices in Greece”.

How to cite: Koutroulis, A., Daliakopoulos, I., and Grillakis, M.: Climate Change Impacts on Olive Oil Production in Greece: Challenges and Pathways to Resilience, EGU General Assembly 2025, Vienna, Austria, 27 Apr–2 May 2025, EGU25-12096, https://doi.org/10.5194/egusphere-egu25-12096, 2025.

EGU25-12231 | ECS | Posters on site | CL4.21

Post-fire recovery and the role of armed conflict in the Eastern Mediterranean - A case study in Lebanon 

Lucia S. Layritz, Georgia Majdalani, Maya A. Zomer, Tiago Ermitão, Ana Bastos, and Carl Boettiger

Wildfires are a natural feature of Mediterranean ecosystems. However, research efforts are unevenly distributed, with fire ecology of the Eastern Mediterranean remaining understudied compared to other parts of the biome. Furthermore, direct and indirect links between armed conflict and wildfires have been suggested for this region, interacting with climatological and ecological factors to create complex fire dynamics that are not yet well understood. 

Mediterranean ecosystems are adapted to fire and in general exhibit strong regeneration capabilities. Nevertheless, with a drier and hotter climate anticipated in the future due to climate change, there is concern of overstretching the ecosystem’s regenerative ability. In the Eastern Mediterranean, while more research regarding fire regimes and fire risk has emerged in recent years, vegetation recovery after fire has rarely been investigated.

Using Lebanon as a case study, we aim to disentangle the roles of climate, armed conflict, and other human impacts in post-fire recovery patterns in Eastern Mediterranean ecosystems. Using a recently compiled, national fire occurrence dataset and publicly available vegetation indices data, we will first create a statistical model to identify areas where fire activity is primarily driven by climate vs. conflict. We will then study recovery trajectories of vegetation after wildfire to address the following questions:  (1) Does vegetation recover after wildfire, and if so, on what timescales? (2) Which environmental factors control recovery dynamics? (3) Do climate- vs. conflict driven fires differ in their properties, e.g. size? and (4) Are there differences in recovery patterns between climate- and conflict-associated fires?

How to cite: Layritz, L. S., Majdalani, G., Zomer, M. A., Ermitão, T., Bastos, A., and Boettiger, C.: Post-fire recovery and the role of armed conflict in the Eastern Mediterranean - A case study in Lebanon, EGU General Assembly 2025, Vienna, Austria, 27 Apr–2 May 2025, EGU25-12231, https://doi.org/10.5194/egusphere-egu25-12231, 2025.

EGU25-13271 | Orals | CL4.21 | Highlight

The Portuguese National Roadmap for Adaptation 2100: from regional climate simulations to economic costs and adaptation 

Pedro M M Soares and Faculty of Sciences of the University of Lisbon Team

As warming and drying future conditions may significantly affect the human and natural environment in the Mediterranean, the climate risks and vulnerabilities assessments are key to support adaptation strategies. In this context, the Portuguese National Roadmap for Adaptation 2100 (RNA2100) aimed at providing scientific support to adaptation  policy exercises by (1) identifying and characterising climate change impacts on the most vulnerable domains in Portugal Mainland; (2) characterising socioeconomic impacts on different territorial scales and assess financial needs; and (3) contributing to the implementation of a National Spatial Planning Policy Programme. The most vulnerable domains focused by the RNA2100 include the coastal regions, water resources/agroforestry and wildfires. The RNA2100 followed three stages: regional climate scenarization, biophysical impacts for a number of sectors and hazards, and the economic analysis of selected impacts. The future projected climate for Portugal was characterized using a weighted multi-model multi-variable ensemble based on the EURO-CORDEX Phase I simulations, produced at 12 km resolution. One historical present climate period (1971-2000) and three future periods (2011-2040, 2041-2070, 2071-2100), under three different scenarios (RCP2.6, RCP4.5 and RCP8.5), were considered. The biophysical impact modelling was performed for four climate impact sectors: coastal erosion and flooding, forest fires, water and agroforestry systems.

Climate change poses a significant threat to water resources and agroforestry in mainland Portugal. Southern regions, particularly beyond the Tagus River, will face more significant impacts, with the Water Exploitation Index plus (WEI+) potentially increasing by up to +99 percentage points under RCP8.5 or around +22 points under RCP4.5. Without adaptation, economic losses in crop yields could reach €426 million annually under the moderate mitigation scenario and approach €670 million under the high emissions scenario. Even meeting Paris Agreement targets could still result in yearly losses of €172 million by 2100. The discourse on climate adaptation and wildfire management in the five NUTS II regions emphasizes the importance of multifaceted strategies in confronting the escalating threat of wildfires exacerbated by climate change. The results emphasize the pivotal role of awareness initiatives with coercive measures to effectively reduce ignitions and mitigate projected losses (saving from 290,000 euros/year in A.M.L. to 88 million euros/year in Centro). Portuguese coastal areas are extensively vulnerable to climate change impacts, with projections showing up to 587 km2 (RCP4.5) and 604 km2 (RCP8.5) of vulnerable coastlines by the end of the 21st century. Adaptation is overall recommended at national scale, despite the different results yielded by the cost-benefit analysis, depending on the region. Total inaction costs (without adaptation) are projected to surpass 12000 million € (RCP4.5) and 14000 million € (RCP8.5) until 2100, in contrast with approximately 5000 million € (for both scenarios) of expected adaptation costs.

Acknowledgements

This work is supported by the Portuguese Fundação para a Ciência e Tecnologia, FCT, I.P./MCTES through national funds (PIDDAC):  UID/50019/2025 and LA/P/0068/2020 https://doi.org/10.54499/LA/P/0068/2020).

How to cite: Soares, P. M. M. and Team, F. O. S. O. T. U. O. L.: The Portuguese National Roadmap for Adaptation 2100: from regional climate simulations to economic costs and adaptation, EGU General Assembly 2025, Vienna, Austria, 27 Apr–2 May 2025, EGU25-13271, https://doi.org/10.5194/egusphere-egu25-13271, 2025.

EGU25-14474 | Orals | CL4.21

Climate Adaptation and Resilience Plan for San Bernardino Valley, California, USA 

Greg Woodside, Adekunle Ojo, Kai Palenscar, and Erik Feldman

San Bernardino Valley Municipal Water District (San Bernardino Valley) is a regional water management and resource agency in southern California, United States of America. San Bernardino Valley prioritizes collaborative approaches to climate adaptation and working with partner agencies and land managers within the watershed to develop innovative strategies to provide sustainable water supply and support the changing needs of our region’s people and environment.   Climate change continues to alter climate conditions in southern California, a Mediterranean climate region. Changes in temperature, aridity, rainfall, and storm patterns present highly variable challenges to San Bernardino Valley’s planning and operations. Water supply reliability will continue to be impacted by changes in availability of local water and water imported into the San Bernardino area from northern California. Extreme weather events such as heat waves, more intense rainfall, and extended droughts are likely to increase in frequency or severity. Climate change also increases our exposure to extreme wildfire and impacts from sea level rise that affects water imported from northern California. These conditions may threaten the durability of taxpayer investments in water projects and the habitat conservation efforts associated with those projects.

Over the last three years, San Bernardino Valley staff and Board of Directors worked with partner agencies and a consulting team to evaluate regional climate vulnerabilities and develop a Climate Adaptation and Resilience Plan (CARP).  The CARP is an adaptive guide designed to strengthen the District’s water reliability and proactively address existing and future climate change impacts. The CARP provides a collaborative adaptive management process that promotes flexibility in the Agency's responses to changes in climate projections and adjustments based on real-world conditions, potentially decades into the future. The CARP outlines an ongoing phased implementation of actions over 20 years that will reduce or minimize risks to San Bernardino Valley's infrastructure, operations, and investments.

Development of the CARP included conducting a greenhouse gas emissions inventory, assessing climate risks and vulnerabilities, identifying proposed actions to increase our ability to adapt and be resilient in the face of climate change, and develop a phasing and implementation plan.  The CARP is organized around four Guiding Principles: (1) Maintain a diverse water portfolio, (2) Protect the Water Portfolio, (3) Improve operational and infrastructure resilience, and (4) Connect people to water and climate.  Measures and actions are organized in the CARP through the Guiding Principles, providing a holistic approach to increasing our region’s resilience across its water sources, the ecosystems that its water resources rely on, its infrastructure and operations, and water uses in the communities it serves.

San Bernardino Valley is committed to developing new data-driven measures and strategies, leveraging emerging technologies and products, and updating the CARP on an ongoing basis to meaningfully adapt to emerging climate threats and maintain progress towards achieving resilience.  Much like the natural systems within the region, the agencies and communities of our watershed are integrally connected, each contributing unique pieces of the innovative solutions that will support a sustainable and resilient future for our people and our shared environment.

How to cite: Woodside, G., Ojo, A., Palenscar, K., and Feldman, E.: Climate Adaptation and Resilience Plan for San Bernardino Valley, California, USA, EGU General Assembly 2025, Vienna, Austria, 27 Apr–2 May 2025, EGU25-14474, https://doi.org/10.5194/egusphere-egu25-14474, 2025.

EGU25-15986 | ECS | Posters on site | CL4.21

Ecological responses of planktonic foraminifera and pteropods to sapropel formation in the eastern Mediterranean Sea 

Sonia Chaabane, Thibault de Garidel-Thoron, Hartmut Schultz, Sandrine Conrod, and Kazuyo Tachikawa

The Mediterranean Sea, a semi-enclosed basin, has experienced periodic anoxic events that resulted in sapropels—organic-rich sediment layers formed during deep-water oxygen depletion. While the main processes driving sapropel formation are understood, the ecological and morphological responses of planktonic species to these extreme conditions remain largely unexplored. This study aims to fill this gap by examining the composition, tolerance, and ecological responses of calcareous planktonic species, with a focus on planktonic foraminifera Globigerinoides ruber morphotypes and pteropod populations across sapropel formation events. To investigate these responses, we analyzed one sediment core retrieved from the Gulf of Sirte, covering the last 130 k years with a focus on sapropels S1 and S5. Microfossil samples were investigated using a microfossil sorter (MiSo) Robot at CEREGE, which automatically images and measures microfossils from the coarse sediment fraction, unlike conventional approaches, which focus on species abundance and identification solely. This approach allowed us to determine both abundance and size of the different specimens, at the species level, through the training of a Convolutional Neural Network (CNN) which was applied to label a large dataset (160,000 images). Our results reveal significant shifts in planktonic community composition and diversity throughout the sapropels S1 and S5. Planktonic foraminifera diversity decreased during sapropels, notably with a reduction in species like Globigerinoides ruber and Globigerinoides elongatus. In contrast, pteropod abundance increased, suggesting they may be more resilient to environmental changes due to their higher motility compared to foraminifera and lower species competition during these anoxic periods. Size variations in dominant species were also observed, with distinct changes linked to environmental stressors such as lower salinity. This study provides valuable insights into the resilience and adaptability of planktonic species environmental changes, offering a more refined understanding of sapropel-related ecological impacts on marine communities.

How to cite: Chaabane, S., de Garidel-Thoron, T., Schultz, H., Conrod, S., and Tachikawa, K.: Ecological responses of planktonic foraminifera and pteropods to sapropel formation in the eastern Mediterranean Sea, EGU General Assembly 2025, Vienna, Austria, 27 Apr–2 May 2025, EGU25-15986, https://doi.org/10.5194/egusphere-egu25-15986, 2025.

EGU25-16524 | ECS | Orals | CL4.21

Climate change projections of heatwaves in Valencia (Spain) using a heat index analysis 

Ana Fernandez-Garza, Eric Gielen, Manuel Pulido-Velazquez, Adria Rubio-Martin, Hector Macian-Sorribes, and Dariana Avila-Velasquez

The increasing duration and intensity of heatwaves have become a growing concern due to their implications for health, economy and agronomy. The data from the reference period 1950-2017 from different studies around the globe indicates an average increase of 1 day per decade in heatwave duration and between 2 and 6 °C per decade in intensity. This phenomenon is particularly evident in cities such as Valencia and other locations in the Mediterranean region, where extreme temperatures have reached record levels. In Valencia, for example, the highest temperature in its history was recorded in 2023, at 46.8 °C.

The objective of this contribution is to project trends for heatwaves by estimating various features, such as their duration, intensity, and cumulative impact, using heat index (HI) as a key metric to evaluate the risk and the degree of exposure associated with these extreme events in the Mediterranean city of Valencia. The analysis applies daily maximum temperature and relative humidity data for the period 1979 to 2100 from five global climate models of the CMIP6 (GFDL-ESM4, IPSL-CM6A-LR, MPI-ESM1.2-HR, MRI-ESM2-0, UKESM1-0-LL) and historical observations (1979-2014), processed with ERA5-Land grids (~9 km) and classified by climate change scenarios defined in the IPCC Sixth Assessment Report. Heatwave intensity was assessed using the HI, which combines temperature and humidity to estimate thermal sensation and its effects on health.

Since 2010, heatwaves have shown a significant increase in duration and intensity in Valencia. Between 2011 and 2013, the total number of heatwave days exceeded 25 days per year, with intensity peaks above 50 °C. Climate models reflect similar trends to historical trends, with MPI-ESM1-2-HR showing the closest alignment to the historical trend.

In the climate change analysis period from 2014 to 2100, the SSP370 and SSP585 scenarios show a more accelerated increase in exposed days and extreme heat values, with the most pronounced trends occurring after 2055. In contrast, the SSP126 scenario suggests stagnation in the duration and intensity of heatwaves at 2014 levels in some models. However, projections from models such as IPSL-CM6A-LR and MRI-ESM2-0 indicate persistently high values throughout the period, highlighting variations in model responses even under the same scenario.

The results highlight the rising trends in the intensity and duration of heatwaves in Valencia, clearly illustrating their progression over time in the context of climate change and the increasing frequency of extreme events. The use of the HI as a metric underscores its implications for human health and well-being. These findings emphasize the need for adaptive and preventive measures to address the growing impacts of heatwaves on the most vulnerable populations, especially in the Mediterranean cities.  

Acknowledgements:

This study has received funding from the: “THE HUT project” (The Human-Tech Nexus – Building a Safe Haven to cope with Climate Extremes), under the European Union’s horizon research and innovation programme (GA No. 101073957).

How to cite: Fernandez-Garza, A., Gielen, E., Pulido-Velazquez, M., Rubio-Martin, A., Macian-Sorribes, H., and Avila-Velasquez, D.: Climate change projections of heatwaves in Valencia (Spain) using a heat index analysis, EGU General Assembly 2025, Vienna, Austria, 27 Apr–2 May 2025, EGU25-16524, https://doi.org/10.5194/egusphere-egu25-16524, 2025.

EGU25-16860 | Orals | CL4.21

Recent salinification, warming and stratification changes impacting deep water formation in the Mediterranean Sea 

Nikolaos Skliris, Robert Marsh, Matthew Breedon, and Simon Josey

The Mediterranean Sea undergoes a long-term salinification and warming with strong implications for its overturning circulation and subsequently for its regional climate. In this study ERA5 atmospheric reanalysis and En4 hydrographic monthly datasets were used to investigate the impacts of changing air-sea fluxes and stratification on deep water formation of the Mediterranean Sea over 1979-2023. Results indicate non-significant long-term changes in winter net heat flux controlling deep water formation at the major formation sites of the two sub-basins. However, winter sensible and latent heat fluxes show a pronounced decreasing trend resulting in a strong reduction of winter ocean heat loss in the Gulf of Lions over the last two decades. This is contrasted by increased turbulent air-sea heat fluxes driving enhanced winter ocean heat loss in the Aegean Sea during the same period. Large salinity increases are obtained across the basin mainly induced by warming-driven evaporation increases over 1979-2023. This excessive salinification may have strongly enhanced salt preconditioning in all major dense water formation sites, sustaining deep water formation despite of the increasingly warming climate.  Results reveal that temperature and salinity increases largely counteract each other resulting in relatively small changes in density in most parts of the basin. However, the density contrast is significantly increasing between the upper layer which becomes lighter due to excessive surface warming and the deeper layers affected by large amounts of saltier/denser water masses mainly formed during strong climatic transient events in both sub-basins under anomalous winter surface cooling over one or two severe winters, particularly during the East Mediterranean Transient (EMT) in the early 1990’s and the Western Mediterranean Transition (WMT) in the mid-2000s. The combined effects of increased water-column stratification and decreasing winter ocean heat loss can have dramatic impacts on deep water formation as evidenced in the Gulf of Lions over the last decade.       

How to cite: Skliris, N., Marsh, R., Breedon, M., and Josey, S.: Recent salinification, warming and stratification changes impacting deep water formation in the Mediterranean Sea, EGU General Assembly 2025, Vienna, Austria, 27 Apr–2 May 2025, EGU25-16860, https://doi.org/10.5194/egusphere-egu25-16860, 2025.

In recent years, an increase in the frequency and intensity of cyclones with tropical characteristics has been observed in areas of the Mediterranean Sea (De la Vara et al., 2021). The rise in this type of cyclones has triggered extreme weather conditions in many Mediterranean coastal regions (Romero & Emanuel, 2013). With the increasing focus on the study and characterisation of these types of cyclones (Gutiérrez-Fernández et al., 2024), numerous research efforts have employed different methodologies to investigate the favourable conditions for the development of cyclones with tropical characteristics in the Mediterranean (Romero & Emanuel, 2017). Among the methods used to study the favourable conditions for the development of tropical cyclones, one of the most widely applied is the Potential Intensity (PI; Holland, 1997). This index measures the theoretical maximum intensity a cyclone with tropical characteristics can achieve under specific atmospheric conditions. This method has been investigated in numerous studies on tropical cyclones and demonstrates that high values of this index are associated with a higher likelihood of intense tropical cyclone development (Emanuel, 2005; Wing & Camargo, 2007).

Therefore, the main motivation for this study is to analyse the evolution of the Potential Intensity (PI) over the past 70 years in the Mediterranean region. For this purpose, ERA5 reanalysis data (Hersbach et al., 2023) covering the period from 1950 to 2023 over the Mediterranean basin were used. The results indicate an increase in the values of this index, particularly during the autumn months, when most cyclones with stronger tropical characteristics occur. Finally, an individual analysis of this index was conducted under pre-development conditions for recent cyclones with tropical characteristics in the Mediterranean.

de la Vara, A., Gutiérrez‐Fernández, J., González‐Alemán, J. J., & Gaertner, M. A. (2021). Characterization of medicanes with a minimal number of geopotential levels. International Journal of Climatology, 41(5), 3300-3316.

Emanuel, K. (2005). Genesis and maintenance of" Mediterranean hurricanes". Advances in Geosciences, 2, 217-220.

Gutiérrez‐Fernández, J., Miglietta, M. M., González‐Alemán, J. J., & Gaertner, M. A. (2024). A new refinement of Mediterranean tropical‐like cyclones characteristics. Geophysical Research Letters, 51(8), e2023GL106429.

Hersbach, H., Bell, B., Berrisford, P., Biavati, G., Horányi, A., Muñoz Sabater, J., Nicolas, J., Peubey, C., Radu, R., Rozum, I., Schepers, D., Simmons, A., Soci, C., Dee, D., Thépaut, J-N. (2023): ERA5 hourly data on pressure levels from 1940 to present. Copernicus Climate Change Service (C3S) Climate Data Store (CDS), DOI: 10.24381/cds.bd0915c6 (Accessed on 29/10/2024)

Holland, G. J. (1997). The maximum potential intensity of tropical cyclones. Journal of the atmospheric sciences, 54(21), 2519-2541.

Romero, R., & Emanuel, K. (2013). Medicane risk in a changing climate. Journal of Geophysical Research: Atmospheres, 118(12), 5992-6001.

Romero, R., & Emanuel, K. (2017). Climate change and hurricane-like extratropical cyclones: Projections for North Atlantic polar lows and medicanes based on CMIP5 models. Journal of Climate, 30(1), 279-299

Wing, A. A., Sobel, A. H., & Camargo, S. J. (2007). Relationship between the potential and actual intensities of tropical cyclones on interannual time scales. Geophysical research letters, 34(8).

How to cite: Gutiérrez-Fernández, J., Alvarez Castro, C., and Rodriguez-Guisando, E.: Is there an increase in favourable conditions for the development of cyclones with tropical characteristics in the Mediterranean basin? A study of Potential Intensity in the Mediterranean Region over the last 70 Years, EGU General Assembly 2025, Vienna, Austria, 27 Apr–2 May 2025, EGU25-16866, https://doi.org/10.5194/egusphere-egu25-16866, 2025.

EGU25-1748 | ECS | Posters on site | OS1.8

Underestimated future Arctic Ocean warming due to unresolved marine heatwaves at low resolution 

Ruijian Gou, Yaocheng Deng, Yingzhe Cui, Shu Qi, Shengpeng Wang, Lixin Wu, and Gerrit Lohmann

The Arctic Ocean is projected to warm twice more than the global mean in a warming 21st century, contributed by an increased solar heat input due to sea ice decrease. Here we find more solar heat input into the Arctic Ocean in a higher-resolution climate model. This is due to the impacts of Arctic marine heatwaves (MHWs), known as episodes of extreme ocean warming. The explicit consideration of MHWs, which are stronger and more realistic in higher-resolution models, increases melting of sea ice and thus solar heat input, thereby reinforcing the long-term Arctic Ocean warming. A positive feedback is identified between stronger MHWs and larger Arctic Ocean warming. We emphasize that Arctic Ocean warming is underestimated by the current generation of climate models, which generally have a too low spatial resolution to resolve Arctic MHWs. We conclude that future eddy- and storm-resolving models will provide a new perspective on the Earth system's response to past and future climate and environmental extremes.

How to cite: Gou, R., Deng, Y., Cui, Y., Qi, S., Wang, S., Wu, L., and Lohmann, G.: Underestimated future Arctic Ocean warming due to unresolved marine heatwaves at low resolution, EGU General Assembly 2025, Vienna, Austria, 27 Apr–2 May 2025, EGU25-1748, https://doi.org/10.5194/egusphere-egu25-1748, 2025.

EGU25-2347 | ECS | Orals | OS1.8

Ecological response to anthropogenic climate change in the Beaufort Sea: Biennial-scale evidence from proxy and instrumental records during the last ~70 years 

Laura Gemery, Renata Szarek, Kenta Suzuki, Jason Addison, Beth Caissie, Young Jin Joe, Koji Seike, Katsurai Yamada, Jonaotaro Onodera, Motoyo Itoh, and Masanobu Yamamoto

We analyzed ostracode and foraminifera assemblages, silicoflagellates, biogenic silica, and sediment grain size from two high-resolution box cores collected in the Alaska and Canadian Beaufort Sea during the 2022 Arctic Challenge for Sustainability (ArCSII) expedition. These cores provide biennial-scale, multi-proxy records of ecological change over the past ~70 years. At BC2, located east of Barrow Canyon, faunal assemblages over the last 41 years showed three distinct ecological periods: (1) the 1980s-1990s, dominated by species indicative of stable, ice-covered conditions; (2) a shift post-2000 with warmer temperatures, longer ice-free seasons, and increased sandy sediments; and (3) a recent period (2018–2022) characterized by subarctic and Pacific-affiliated species, reflecting productive, summer ice-free waters. Similarly, at MT1 near the Mackenzie Trough, three periods were identified: (1) cold, stable conditions with high sea-ice cover (1950-1980); (2) a transition in the 1990s marked by increased productivity and longer ice-free periods; and (3) a shift (2002–2022) toward more dynamic, productive conditions, with reduced sea-ice extent and increasing Mackenzie River discharge. The faunal transitions among ostracodes, foraminifera, and silicoflagellates correspond closely with changes in ocean conditions, providing key insights into the timing of ecological responses to anthropogenic climate change. By integrating instrumental data—such as temperature, sea-ice extent, and river discharge—with the biological proxy records, we constrained the timing of when these environmental shifts began affecting biological organisms. This analysis revealed that changes in faunal composition are tightly linked to warming, sea-ice loss, and altered freshwater inputs, and underscores the complex, cascading impacts of climate change on Arctic ecosystems. These ecological shifts are also influenced by large-scale ocean-atmosphere dynamics, such as the Pacific Decadal Oscillation, which further modulate the timing and magnitude of ecological responses in the Beaufort Sea ecosystem.

How to cite: Gemery, L., Szarek, R., Suzuki, K., Addison, J., Caissie, B., Joe, Y. J., Seike, K., Yamada, K., Onodera, J., Itoh, M., and Yamamoto, M.: Ecological response to anthropogenic climate change in the Beaufort Sea: Biennial-scale evidence from proxy and instrumental records during the last ~70 years, EGU General Assembly 2025, Vienna, Austria, 27 Apr–2 May 2025, EGU25-2347, https://doi.org/10.5194/egusphere-egu25-2347, 2025.

EGU25-3623 | Orals | OS1.8

Atlantification in a multi-model ensemble of historical climate simulations 

Davide Zanchettin, Francesco De Rovere, and Angelo Rubino

Atlantification is a major phenomenon associated with rapid changes in the Arctic Ocean, including anomalous sea-ice loss, warming and salinification of the near-surface, enhanced mixing and changes in the ecosystem structure. Despite anomalous transport of Atlantic water in the Barents Sea/Fram Strait region is among the recognized causes of Atlantification, this phenomenon remains poorly characterized in the context of the historical (1850-present) period, hence far from being fully understood.

In this contribution, we illustrate recent progress of the Italian funded project “ATTRACTION: Atlantification dRiven by polAr-subpolar ConnecTIONs in a changing climate” that aims at providing a historical perspective on Atlantification by integrating observational evidence over the last decades, paleo-reconstructions and numerical climate simulations. We show results from a multi-model ensemble of historical climate simulations contributing to CMIP6 and depict robust traits of the simulated Atlantification across models and realizations toward fingerprinting the phenomenon at the gateway of the Arctic Ocean and toward a robust definition of an index for its quantitative characterization.

How to cite: Zanchettin, D., De Rovere, F., and Rubino, A.: Atlantification in a multi-model ensemble of historical climate simulations, EGU General Assembly 2025, Vienna, Austria, 27 Apr–2 May 2025, EGU25-3623, https://doi.org/10.5194/egusphere-egu25-3623, 2025.

EGU25-3788 | Orals | OS1.8

Impacts of synchronously coupled dynamic ice sheets in the GFDL Global Ocean Cryosphere Model iOM 

Olga Sergienko, Alexander Huth, Matthew Harrison, and Nicole Schlegel

The polar oceans, the high-latitude Earth systems, and the Earth climate system as a whole are strongly affected by the Antarctic and Greenland ice sheets. The recent developments of global climate models have allowed to accounting for the effects of the ice sheets either indirectly via parameterizations of freshwater fluxes, or via infrequent coupling between stand-alone ice sheet models and other climate models' components. The latter approach typically does not conserve mass across the model comonents.  In order to address these issues, we have developed a global ocean-cryosphere model iOM that includes synchronously coupled Antarctic and Greenland ice sheets in addition to sea ice and icebergs. The results of global simulations forced by the EAR-Interim reanalysis show strong seasonal and subseasonal variability in the ice-sheet/ocean interactons, demonstrating the importance of a tight synchronous coupling between the ice sheet and the ocean model components. iOM will allow us to explore interactions and feedbacks between the polar oceans and cryosphere on the subseasonal to decadal timescales.

How to cite: Sergienko, O., Huth, A., Harrison, M., and Schlegel, N.: Impacts of synchronously coupled dynamic ice sheets in the GFDL Global Ocean Cryosphere Model iOM, EGU General Assembly 2025, Vienna, Austria, 27 Apr–2 May 2025, EGU25-3788, https://doi.org/10.5194/egusphere-egu25-3788, 2025.

Differences in salt content of North Atlantic surface waters drive variations in Nordic Seas' overturning circulation. These form a switchboard for changes in the oceanic heat transport to North European high latitudes, the 'Nordic Heat Pump', and for Atlantic Meridional Overturning Circulation (AMOC). We deduced changes in the Nordic Seas' overturning circulation during peak last glacial and early deglacial times (22-15 cal. ka) from two marine sediment cores with centennial-scale age resolution synchronized via radiocarbon (14C) plateau tuning. Sediment data suggest that the salinity of surface waters, advected through the Denmark Strait from the northwesternmost Atlantic, started to drop significantly near 18.4 cal. ka. This accompanied precisely an abrupt rise in bottom water temperature by up to 3.5°C and a drop in both ventilation and 14C ventilation ages of Denmark Strait overflow waters feeding the AMOC. Moreover, it paralleled a change in (detrital) Pb and Nd radiogenic isotopes suggesting that overflow waters then started to have their dominant source in the North Iceland Jet of upper North Atlantic Intermediate Water that overflows the shallow basaltic Iceland-Scotland Ridge east of Iceland. Off Norway, the salinity reduction north of Iceland went along with a fast rise in the 14C reservoir age of surface waters from ~600–1200 years up to ~2000 years and an abrupt breakdown of Nordic Seas' convection of young deep waters. Accordingly, warm Atlantic waters were replaced by slightly cooler Arctic polar waters aged like those of the East Greenland Current, inducing a breakdown of the 'Nordic Heat Pump' and start of 'Heinrich Stadial 1' as reflected by a precisely coeval cooling documented on top of the Greenland ice sheet, lasting until ~15 cal. ka. The outlined circulation changes starting near 18.4 cal. ka remind us of potential implications of the meltwater flow from West Greenland strongly enhanced today. 

How to cite: Sarnthein, M. and Blaser, P.:  Meltwater-induced salinity drop in Greenland Sea induced changes in AMOC and the onset of Heinrich-1 stadial 18 400 years ago – Potential analog to modern trends, EGU General Assembly 2025, Vienna, Austria, 27 Apr–2 May 2025, EGU25-3821, https://doi.org/10.5194/egusphere-egu25-3821, 2025.

EGU25-6159 | Orals | OS1.8

Atlantic Water distribution in the central and eastern Arctic Ocean during past interglacials 

Robert F. Spielhagen, Henning A. Bauch, and Andreas Mackensen

We present planktic foraminiferal and planktic stable isotope records from central and eastern Arctic Ocean sediment cores with a particular attention on the development of the structure of upper water masses during two past interglacials (here termed IG3 and IG2), in comparison to the present Holocene (IG1). The age of interglacials IG2 and IG3 is currently under discussion. While the "classic" age model based on Jakobsson et al. (2000, Geology) would relate them to marine isotope (sub)stages (MIS) 5e and 5a, latest work (e.g., Song et al., 2023, Earth Sci. Rev.; Razmjooei et al., 2023, Quat. Sci. Rev.) would assign ages of MIS 11, 9, 7 or 5.

Stable oxygen and carbon isotopes from polar planktic foraminifers Neogloboquadrina pachyderma give clues on their habitat within the upper water column which today is characterized by an ice-covered low-saline cold surface layer, underlain by high-saline warm Atlantic Water. Sediments from IG2 and IG3 containing also subpolar planktic foraminifers Turborotalita quinqueloba show oxygen isotope values of close to modern ones, indicating a similar water mass structure as today, with a transition level between freshwater-rich and Atlantic Water. Carbon isotope values are lower and may point at a higher bioproductivity due to less sea ice and a decomposition of carbon in the upper waters. Interestingly, in the sediments underneath, which are barren in T. quinqueloba but contain abundant N. pachyderma, both oxygen and carbon isotopes are significantly higher. These data can be interpreted as evidence of a strongly stratified water column, a deeper habitat of the foraminifers, a strong subsurface advection of Atlantic Water and more sea ice during the early phases of IG2 and IG3. In cases, due to a lack of carbonate microfossils this interval is not represented in all analyzed cores. We assume that near-surface salinities were below the tolerance limit of planktic foraminifers in the very early parts of IG2 and IG3, probably due to a strong influence of meltwater from disintegrating ice sheets on northern Eurasia in the preceding glacial stages. Our results reveal a two-step development of conditions in the central Arctic during previous warm intervals. In the first part, the uppermost water column (including the habitat depth of T. quinqueloba) always had very low salinties due to freshwater discharge from ice sheets on the continents. Only in the second part Atlantic Water was shoaling and allowed the occupation by shallow-dwelling T. quinqueloba. Data from the Kara Sea continental margin suggest that upper water conditions in the eastern Arctic remained under strong freshwater influence, at least throughout IG2.

How to cite: Spielhagen, R. F., Bauch, H. A., and Mackensen, A.: Atlantic Water distribution in the central and eastern Arctic Ocean during past interglacials, EGU General Assembly 2025, Vienna, Austria, 27 Apr–2 May 2025, EGU25-6159, https://doi.org/10.5194/egusphere-egu25-6159, 2025.

EGU25-6192 | Posters on site | OS1.8

Arctic gateways, sea level and climate changes in the subpolar North Atlantic 

Anne de Vernal and Claude Hillaire-Marcel

Paleoceanographic records demonstrate linkages between the increasing Pacific water flux accompanying the postglacial submergence of the shallow (~ 50 m deep) Bering Strait and the progressive warming of the Western Arctic until ca. 4000 years BP (cf. de Vernal et al. Sci. Adv. 2024). The Pacific water flux also impacts the freshwater budget of the Arctic Ocean, which ultimately plays a role in the Arctic sea ice and freshwater export rate to the northern North Atlantic. Sea-level changes thus deserve special attention from an Arctic perspective as they can considerably modify the exchanges between the Pacific and Arctic oceans. Furthermore, sea level determines the status of the Arctic shelves, submerged or not, which in turn plays a role in sea-ice production, as well as in the latent heat from the Atlantic water mass flowing northward through Fram Strait and the Barents Sea. We hypothesize that the increased freshwater inflow from the Pacific into the Arctic and the enhanced sea ice formation rates resulting from the sea level rise have played a role in the large scale cooling trend of the eastern Arctic and subarctic North Atlantic that has marked the late Holocene.


How to cite: de Vernal, A. and Hillaire-Marcel, C.: Arctic gateways, sea level and climate changes in the subpolar North Atlantic, EGU General Assembly 2025, Vienna, Austria, 27 Apr–2 May 2025, EGU25-6192, https://doi.org/10.5194/egusphere-egu25-6192, 2025.

Modeling results and proxy data both suggest that sea-ice conditions in the Arctic Ocean were less severe during the last interglacial (MIS 5e) compared to the present interglacial (MIS 1), but spatial variability of the sea-ice cover is still poorly constrained. In this study, variations in the intensity and composition of biogenic sedimentary structures (bioturbation and trace fossils) are used to address spatial differences in sea-ice distribution between the two interglacials. The presence or absence of trace fossils and bioturbated sediment have long been used to separate interglacial and glacial and intervals in central Arctic Ocean sediment cores based on the premise that interglacial conditions with less sea ice and more open waters led to higher food flux to the benthic communities, and vice versa. However, spatial differences in sea-ice cover during the individual interglacials also led to differences in primary productivity and consequently to spatial variations in the intensity of bioturbation and the composition of trace fossils. Areas characterized by perennial sea ice and few open leads or polynyas have a lower food flux than areas close to the sea-ice margin or with abundant polynyas. Consequently, the areas with more severe sea-ice conditions display fewer trace fossils and less intensely bioturbated sediments than areas characterized by open leads, polynyas, or areas situated close to the ice margin where primary productivity is higher. The spatial pattern shows a clear decrease in bioturbation intensity and trace fossil diversity from areas today characterized by relatively open waters, towards areas characterized by thick perennial sea ice. There is also a general pattern of more diverse trace fossil communities and more intense bioturbation observed from MIS 5e sediments compared to MIS 1, suggesting that sea-ice conditions during MIS 5e were generally less severe than during the present interglacial. The application of trace fossils and bioturbation for the reconstruction of sea ice conditions is particularly viable because of the large number of cores with X-ray radiographs available from data repositories such as www.pangaea.de. The main limitation of the method comes from the generally poor age control of Arctic sediments beyond the range of radiocarbon dating.

How to cite: Löwemark, L.: A comparison of Arctic Ocean sea-ice conditions during interglacials MIS 5e and MIS 1 based on biogenic sedimentary structures, EGU General Assembly 2025, Vienna, Austria, 27 Apr–2 May 2025, EGU25-6455, https://doi.org/10.5194/egusphere-egu25-6455, 2025.

EGU25-6518 | ECS | Orals | OS1.8

Does increased spatial resolution improve the simulation of Arctic sea ice lows in NEMO4.2-SI3? 

Benjamin Richaud, François Massonnet, Thierry Fichefet, Dániel Topal, Antoine Barthélemy, and David Docquier

The Arctic total sea ice extent has rapidly declined since the beginning of satellite observations. This decline materialized into record sea ice lows in the summers of 2007 and 2012. Those sea ice lows exhibit an important spatial heterogeneity and are likely caused by different dynamic and thermodynamic drivers of atmospheric and oceanic origins. Using the global ocean–sea ice model NEMO4.2-SI3 in the same setup but at three different horizontal resolutions (namely, 1/12°, 1/4° and 1°), we thoroughly examine the most extreme sea ice states simulated in summer by the model from a mass balance perspective. This method allows to disentangle the dominating mechanisms leading to the sea ice lows, such as dynamic redistribution and compression of sea ice in 2007, or preconditioning and excess basal melt in 2012. It also highlights the importance of processes at the ice-ocean interface to drive the evolution of sea ice at all considered temporal scales. We then compare how increased spatial resolution, allowing for the simulation of finer-scale physical processes such as ocean eddies, impacts the modelled sea ice thickness and concentration distribution, as well as the different ice mass fluxes. A particular attention is being paid to the influence of ocean heat content anomalies, as increased horizontal resolution provides a more realistic simulation of heat inflow in the Beaufort Gyre through subsurface eddies of Pacific origin. This study highlights the benefits of increased spatial resolution for realistically simulating the Arctic sea ice cover and weighs them with the associated computational cost. The decomposition of the ice mass budget into its different thermodynamic and dynamic terms puts forward the often downplayed role of the ocean in determining the interannual variability of Arctic sea ice and provides a stepping stone for further studies.

How to cite: Richaud, B., Massonnet, F., Fichefet, T., Topal, D., Barthélemy, A., and Docquier, D.: Does increased spatial resolution improve the simulation of Arctic sea ice lows in NEMO4.2-SI3?, EGU General Assembly 2025, Vienna, Austria, 27 Apr–2 May 2025, EGU25-6518, https://doi.org/10.5194/egusphere-egu25-6518, 2025.

EGU25-7420 | Orals | OS1.8

Inserting the Arctic Ocean into the global late Pleistocene climate/ocean system: The Graal Quest? 

Claude Hillaire-Marcel, Anne de Vernal, and Tengfei Song

The setting of a consensual climate history of the Arctic Ocean spanning the last major climatic cycles is still unachieved despite recent converging views about the chronostratigraphy of marine archives from this ocean. Under both permanent and seasonally-opened sea-ice covers, sedimentary recordings present anomalies, ranging from hiatuses under thick ice-shelf covers, during glacials, to winnowed or mixed sequences generated by deep-density currents, under seasonally freezing sea-ice conditions during interglacials or interstadials. In opposition, short, early, or late-glacial events (e.g., continental ice surging and glacial lake drainage events) may have led to the deposition of relatively thick layers occasionally with reworked material. Accordingly, time interpolation between dated layers and within these layers is misleading, and lateral sediment advection leads mixed microfossils and biomarkers records, thus to biased paleoceanography/paleoclimate inferences. Interglacial as well as glacial sequences are subsequently poorly recorded. Along ridges, erosion of fine particles by sinking brines and deep density-driven current, with redeposition in sheltered/deeper sites, further results in the mixing of fossil populations. This process and its impact on paleoecological reconstructions are well-documented by 14C records spanning the Holocene-Marine Isotope Stage 3 interval. In several cores raised from central Arctic ridges, for example, a few centimeters of mixed Holocene and Marine Isotope Stage 3 assemblages illustrate this interval. Nonetheless, the positions of the last two interglacials in deep sedimentary cores may be set with some confidence based on the relative decay of sedimentary excesses in U-series isotopes (231Pa vs 230Th) and detrital feldspar grain OSL-ages. With the complementary support of paleomagnetic records, a tentative outline of the major late Quaternary glacial/interglacial events may be proposed, as illustrated here by records from the Chukchi Sea margin. In this area, high interglacial/interstadial sea-level intervals allowed Pacific Water influx through the shallow Bering Strait, as recorded by radiogenic Nd-isotope excursions and enhanced Si-fluxes (thus high primary productivity). High sea levels also resulted in the flooding of shelves, leading to high manganese fluxes in the deep basins. These provided a cyclostratigraphic tool for the correlation of records throughout the Arctic Ocean, as documented in several studies of the last decades. 

How to cite: Hillaire-Marcel, C., de Vernal, A., and Song, T.: Inserting the Arctic Ocean into the global late Pleistocene climate/ocean system: The Graal Quest?, EGU General Assembly 2025, Vienna, Austria, 27 Apr–2 May 2025, EGU25-7420, https://doi.org/10.5194/egusphere-egu25-7420, 2025.

EGU25-8417 | Posters on site | OS1.8

Dual clumped isotopes of speleothems: unveiling Late Miocene paleotemperatures for the High Arctic 

Gabriella Koltai, Jens Fiebig, Jian Wang, Hai Cheng, Christoph Spötl, Lawrence R. Edwards, Lena Friedrich, Anika Donner, Anna Nele Meckler, Jonathan Lloyd Baker, and Gina Elaine Moseley

The Late Miocene (11.63 to 5.33 million years (Ma)) has drawn attention as a potential analogue for future anthropogenic warming. During this time the global climate was warmer than present, with atmospheric CO2 concentrations at or above current levels, covering the same range as the IPCC emission scenarios. Despite its relevance for future climate scenarios, terrestrial Arctic climate variability during the Late Miocene remains poorly understood, mainly due to the scarcity of continuous, absolutely-dated proxy records.

Here we present a multi-proxy climate record derived from radiometrically dated speleothems from two caves located in eastern North Greenland (80°N). Today these caves are situated at altitudes of 604 and 660 m above sea level, in an area characterised by continuous permafrost and an annual precipitation of ca. 200 mm. Speleothem deposition provides evidence for several episodes of warmer and more humid climate conditions during the Late Miocene compared to today. We utilized dual clumped isotope thermometry to quantify these temperature changes, providing the first continental temperature record for the eastern North Greenland during the Late Miocene.

How to cite: Koltai, G., Fiebig, J., Wang, J., Cheng, H., Spötl, C., Edwards, L. R., Friedrich, L., Donner, A., Meckler, A. N., Baker, J. L., and Moseley, G. E.: Dual clumped isotopes of speleothems: unveiling Late Miocene paleotemperatures for the High Arctic, EGU General Assembly 2025, Vienna, Austria, 27 Apr–2 May 2025, EGU25-8417, https://doi.org/10.5194/egusphere-egu25-8417, 2025.

EGU25-8884 | Orals | OS1.8

Seawater temperature and water mass provenance changes over the last century in the North Atlantic Ocean reconstructed from cold-water coral geochemistry  

Paolo Montagna, Kathrin Brocker, Evan Border, Manuel Rigo, Stefán Áki Ragnarsson, Héðinn Valdimarsson, Steinunn Hilma Ólafsdóttir, Steffen Therre, Jens Fohlmeister, Julie Trotter, Malcolm McCulloch, Marleen Lausecker, Patrick Blaser, Gilles Reverdin, Christophe Colin, and Norbert Frank

The aragonite skeletons of cold-water corals (CWCs) offer critical insights into the physico-chemical changes and dynamics of intermediate-depth water masses at high temporal resolution (e.g. sub-decadal). Previous studies have shown that variations in seawater temperature, water ventilation age, and water mass provenance can be reconstructed from measurements of skeletal Li/Mg ratios, paired U/Th and 14C, and neodymium isotopes, respectively. Notably, the solitary azooxanthellate scleractinian coral species Desmophyllum dianthus is particularly valuable due to its broad distribution, century-long lifespan, and layered skeletal growth, which facilitates the use of geochemical tracers at sub-decadal intervals.

In this study, we analysed several Desmophyllum dianthus samples collected in 2012 from the Northern Iceland Basin at depths of 570-700 m during the ICE-CTD R/V Thalassa expedition, using the Remotely Operated Vehicle Victor 6000 operated by IFREMER. Sub-samples of the coral skeletons collected along the growth axis were analysed for Li/Mg, stable isotopes (δ11B, δ18O, δ13C), U/Th, 14C and Nd isotopes, with the aim to reconstruct the physico-chemical changes of the North Atlantic intermediate water masses, specifically the Iceland-Scotland Overflow Water, Sub-Arctic Intermediate Water and Western North Atlantic Central Water, and assess how their contributions have shifted over recent decades. The Li/Mg ratios provided sub-decadal temperature records, showing variations between ~2 to ~6 °C, closely linked to changes in Nd isotopic compositions. These findings can be explained by decadal fluctuations in the North Atlantic Oscillation and East Atlantic atmospheric patterns, which influence the strength of the Atlantic Subpolar Gyre, leading to changes in the amount of warmer Subtropical Gyre-sourced water or colder Subpolar Gyre-sourced water. Additionally, our results suggest a significant reduction, by about half over the past ~70 years, of the ISOW, pointing to an increased northward transport of warm subtropical waters in recent decades. This shift may have contributed to the recent warming in the Arctic region and a notable multi-decadal weaking of the Nordic Sea overflow currents.

How to cite: Montagna, P., Brocker, K., Border, E., Rigo, M., Ragnarsson, S. Á., Valdimarsson, H., Ólafsdóttir, S. H., Therre, S., Fohlmeister, J., Trotter, J., McCulloch, M., Lausecker, M., Blaser, P., Reverdin, G., Colin, C., and Frank, N.: Seawater temperature and water mass provenance changes over the last century in the North Atlantic Ocean reconstructed from cold-water coral geochemistry , EGU General Assembly 2025, Vienna, Austria, 27 Apr–2 May 2025, EGU25-8884, https://doi.org/10.5194/egusphere-egu25-8884, 2025.

EGU25-8902 | Orals | OS1.8

More modest peak temperatures during the Last Interglacial for both Greenland (and Antarctica) suggested by multi-model isotope simulations 

Louise Sime, Rahul Sivankutty, Irene Malmierca-Vallet, Sentia Goursaud Oger, Allegra LeGrande, Erin McClymont, Agatha de Boer, Alexandre Cauquoin, and Martin Werner

The Last Interglacial (LIG) period approximately 130,000 to 115,000 years ago, represents one of the warmest intervals in the past 800,000 years. Here we simulate water isotopes in precipitation in Antarctica and the Arctic during the LIG, using three isotope-enabled atmosphere-ocean coupled climate models: HadCM3, MPI-ESM-wiso, and GISS-E2.1. These models were run following the Paleoclimate Modelling Intercomparison Project, phase 4 (PMIP4) protocol for the LIG at 127ka (kilo-years ago), supplemented by a 3000-year Heinrich Stadial 11 (H11) experiment run with HadCM3. The long H11 simulation has meltwater from the Northern Hemisphere applied to the North Atlantic which causes large-scale changes in ocean circulation including cooling in the North Atlantic and Arctic and warming in the Southern and Global Ocean. We find that the standard 127ka simulations do not capture the observed Antarctic warming and sea ice reduction in the Southern Ocean and Antarctic regions, but they capture around half of the warming in the Arctic.  The H11 simulations align better with observations: they capture 80% of the warming, sea ice loss, and δ18O changes for both Greenland and Antarctica. Decomposition of seasonal δ18O drivers highlights the dominant role of sea-ice retreat and associated changes in precipitation seasonality in influencing isotopic values in all simulations, alongside a small common response to orbital forcing. We use the H11 and multi-model 127k simulations together to infer LIG surface air temperature (SAT) changes based on ice core measurements. Coastal sites in Greenland and Antarctica appear to have experienced less warming compared with higher central regions. The peak inferred LIG Greenland SAT increase is +2.89 ± 1.32 K at the NEEM ice core site. This is less than half the previously inferred warming. Peak inferred LIG Antarctic SAT increases are +4.39 ± 1.45 K at EDC, dropping to  +1.67 ± 3.67 K at TALDICE.  

How to cite: Sime, L., Sivankutty, R., Malmierca-Vallet, I., Goursaud Oger, S., LeGrande, A., McClymont, E., de Boer, A., Cauquoin, A., and Werner, M.: More modest peak temperatures during the Last Interglacial for both Greenland (and Antarctica) suggested by multi-model isotope simulations, EGU General Assembly 2025, Vienna, Austria, 27 Apr–2 May 2025, EGU25-8902, https://doi.org/10.5194/egusphere-egu25-8902, 2025.

EGU25-9378 | Orals | OS1.8

Atlantification at the Arctic Gateway: Past and Present Dynamics 

Gabriella M. Boretto, Tommaso Tesi, Giuliana Panieri, Margit H. Simon, Mathia Sabino, Alessio Nogarotto, Stijn De Schepper, Agnes Weiner, Jens Hefter, Silvia Giuliani, Leonardo Langone, Gesine Mollenhauer, Simon Belt, and Lucilla Capotondi

Reconstructing climate patterns from the Common Era is necessary for placing modern human-driven climate changes within the context of natural climatic variations. This is particularly relevant for the Arctic, which is warming faster than any other. This global trend is tied to rapid sea ice loss and the increasing influx of Atlantic waters into the Arctic basin, a phenomenon called "Atlantification". In this context, we reconstruct the last centuries paleoenvironmental changes in the Arctic region from sediment cores strategically located along the Barents Sea (HH1141, 74.015°N 21.071°E, -285 m; HH1181, 74.081°N 21.362°E, -298 m water depth; HH969, 76.765°N 35.831°E, -174 m water depth), and on the northern margin of the Svalbard Archipelago (KH21-234-04 (80.3531ºN 16.308ºE, -394 m water depth), based on geochronological and geochemical analyses, benthic foraminiferal data and organic biomarkers. The Age-depth are based on excess 210Pb, and are extrapolated down-core, assuming stable sediment accumulation rates (SAR) before the 20th century. The results allow us to identify two main oceanographic intervals. Pre-1900 ys CE, the dominance of Elphidium clavatum, Cassidulina reniforme, Islandiella helenae, Islandiella norcrossi, Stainforthia feylingi, Stainforthia loeblechi, together with a high concentration of biomarker (spring sea ice biomarker IP25, and alkenones), indicate cold conditions. The second interval, corresponding to the 20th century, is characterized by the presence of Adercotryma glomeratum, Trifarina angulosa, Nonionellina labradorica, Globobulimina auriculata, Melonis barleanus, Buccella frigida, documenting warm water mass inflow related to the expand incursion of Atlantic waters. Moreover, biomarker analyses provide further details of the paleoceanographic conditions showing less seasonal sea ice influence in the region and the intrusion of Atlantic waters within the Arctic domain. This work sets another milestone in our understanding of the “Atlantification” process that is crucial to forecasting the environmental changes in this region that are susceptible to heat transport through the Atlantic gateways, which affects climate and ecosystems.

How to cite: Boretto, G. M., Tesi, T., Panieri, G., Simon, M. H., Sabino, M., Nogarotto, A., De Schepper, S., Weiner, A., Hefter, J., Giuliani, S., Langone, L., Mollenhauer, G., Belt, S., and Capotondi, L.: Atlantification at the Arctic Gateway: Past and Present Dynamics, EGU General Assembly 2025, Vienna, Austria, 27 Apr–2 May 2025, EGU25-9378, https://doi.org/10.5194/egusphere-egu25-9378, 2025.

EGU25-10178 | ECS | Orals | OS1.8

Flow asymmetry over varying topography: Implications for large-scale circulation 

Anna Lina Petruseviciute Sjur and Pål-Erik Isachsen

Ocean flows interacting with topography are critical for shaping large-scale circulation in polar regions such as the Arctic Ocean, where strong topographic steering shapes flow along continental slopes. Flow over sloping topography with corrugations exhibits an asymmetric response to prograde versus retrograde forcing, with stronger and more laminar flows in the prograde case (here, prograde forcing aligns with topographic wave propagation, while retrograde forcing opposes it). Previous studies attribute this asymmetry to increased topographic form stress for retrograde forcing. To further investigate these dynamics, we analyze flow responses to time-variable forcing over corrugated slopes using momentum budgets along depth-following contours. In this framework, the topographic form stress term vanishes, and vorticity fluxes across depth-contours emerge as the dominant mechanism driving asymmetries.

Preliminary results from idealized shallow water simulations reveal distinct nonlinear flow behaviors. For shorter forcing periods, the flow exhibits a cyclonic shift consistent with the "Neptune effect." For longer forcing periods, retrograde flow strength saturates, plateauing even as forcing increases. These findings build on our previous analysis of a realistic Arctic Ocean simulation, which indicated that these nonlinear effects leave an imprint on large-scale circulation. Together, they suggest that mesoscale topography-flow interactions modulate large-scale circulation and contribute to temporal variability in polar oceans under changing forcing conditions.

How to cite: Sjur, A. L. P. and Isachsen, P.-E.: Flow asymmetry over varying topography: Implications for large-scale circulation, EGU General Assembly 2025, Vienna, Austria, 27 Apr–2 May 2025, EGU25-10178, https://doi.org/10.5194/egusphere-egu25-10178, 2025.

EGU25-13019 | Posters on site | OS1.8

Sea Ice Decline and Glacier Retreat Drive Greening of Svalbard in the 20th Century 

Gianmarco Ingrosso, Chiara Ceccarelli, Federico Giglio, Patrizia Giordano, Jens Hefter, Leonardo Langone, Stefano Miserocchi, Gesine Mollenhauer, Alessio Nogarotto, Mathia Sabino, and Tommaso Tesi

The greening of previously barren landscapes in the Arctic is one of the most relevant responses of terrestrial ecosystems to climate change. Analyses of satellite data (available since ~1980) have revealed a widespread tundra advance consistent with recent global warming, but the length of the time-series is insufficient to resolve the long-term variability and the precise timing of the greening onset. Here, we measured plant-derived biomarkers from an Arctic fjord sediment core as proxies for reconstructing past changes in tundra vegetation during the transition from the Little Ice Age to modern warming. Our findings revealed a rapid expansion of the tundra since the beginning of the twentieth century, largely coinciding with the decline of summer sea ice extent, glacier retreat, and Atlantification of the eastern Fram Strait. The greening trend inferred from biomarker analysis peaked significantly in the late 1990s, along with a shift in the tundra community towards a more mature successional stage. Most of these signals were consistent with the biomolecular fingerprints of vascular plant species that are more adapted to warmer conditions and have widely expanded in proglacial areas during recent decades. Our results suggest that the greening of Arctic fjords may have occurred earlier than previously thought, improving our mechanistic understanding of vegetation-climate-cryosphere interactions that will shape tundra vegetation under future warming projections.

How to cite: Ingrosso, G., Ceccarelli, C., Giglio, F., Giordano, P., Hefter, J., Langone, L., Miserocchi, S., Mollenhauer, G., Nogarotto, A., Sabino, M., and Tesi, T.: Sea Ice Decline and Glacier Retreat Drive Greening of Svalbard in the 20th Century, EGU General Assembly 2025, Vienna, Austria, 27 Apr–2 May 2025, EGU25-13019, https://doi.org/10.5194/egusphere-egu25-13019, 2025.

EGU25-13346 | Posters on site | OS1.8

Seasonal climate signals from ground ice and pollen since the Middle Pleistocene as recorded in the ancient permafrost exposed in the Batagay megaslump (East Siberia) 

Thomas Opel, Margret Fuchs, Andrej Andreev, Alexander Kizyakov, Sebastian Wetterich, Hanno Meyer, and Ulrike Herzschuh

The Batagay megaslump (67.58°N, 134.77°E) in East Siberia is the largest known retrogressive thaw slump on Earth. Its approximately 55 m high headwall exposes discontinuously ancient permafrost that dates back to at least 650 ka. The permafrost preserves several paleoclimate and paleoecological proxies with distinct seasonality, e.g., ground ice and pollen.

In this study, we constrain the cryostratigraphy and chronology of the exposed permafrost based on field observations, newly obtained post-infrared infrared stimulated luminescence ages and systematic radiocarbon dating of the upper part of the sequence. To obtain seasonal climate signals, we reconstructed temperatures and precipitation from pollen and analyzed the stable isotope composition of ice wedges and composite wedges as well as pore ice from all exposed stratigraphic units.

A strongly continental climate with strong seasonal contrasts is characteristic for this region throughout glacial and interglacial periods of the Quaternary. The Lower Ice Complex with large syngenetic ice wedges (3-7 m thick, dated MIS 17/16 to MIS 13/12) indicates rather moist, cold winters and variable summers. Above an erosional unconformity, the Lower Sand unit (≤20 m) is characterized by narrow composite (i.e. ice-sand) wedges and formed under cold and dry conditions during late MIS 7 and MIS 6. Substantial warming during the Last Interglacial, i.e., MIS 5e was accompanied by permafrost degradation and the development of taiga forest, as evidenced by a woody debris layer (≤3m). The formation of the overlying Upper Ice Complex (20-25 m thick, local Yedoma Ice Complex equivalent) with huge syngenetic ice wedges started already during MIS 5, probably in MIS 5d, and ended towards the end of MIS 3. A rather cold and dry MIS 4 was followed by the coldest but moist winters of the record and variable but warmer and dry summers in MIS 3. The Upper Sand unit (≤20 m, MIS 3-2) with narrow composite wedges represents a dry climate with less cold winters than in MIS 3 and relatively warm summers. Above an erosional unconformity, the Holocene cover (≤3m) reflects the warmest and rather dry climate of the entire record. The comprehensive permafrost record of the Batagay megaslump delineates Late Quaternary seasonality variability and provides thus far-reaching paleoclimate baseline data for the East Siberian terrestrial Arctic that deserves further proxy-based and model-based validation.

How to cite: Opel, T., Fuchs, M., Andreev, A., Kizyakov, A., Wetterich, S., Meyer, H., and Herzschuh, U.: Seasonal climate signals from ground ice and pollen since the Middle Pleistocene as recorded in the ancient permafrost exposed in the Batagay megaslump (East Siberia), EGU General Assembly 2025, Vienna, Austria, 27 Apr–2 May 2025, EGU25-13346, https://doi.org/10.5194/egusphere-egu25-13346, 2025.

EGU25-13443 | Posters on site | OS1.8

Modelling of the Arctic Ocean and Labrador Sea at 1/60th Degree 

Paul G. Myers, Clark Pennelly, and Hoshyar Pouneh

Our group has carried out simulations of the Labrador Sea at 1/60th and shown that very-high resolution significantly improves the model solution. That resolution, by representing the mesoscale and part of the sub-mesoscale significantly improves the simulation of boundary current system, eddies and shelf-basin exchange, with the small-scale processes combining to also improve the large-scale circulation and overturning. Given such improvements for the Labrador Sea, we now examine modelling the entire Arctic Ocean and the subpolar North Atlantic Ocean north of 53N latitude. The configuration is named ARC60. The experiment also includes an iceberg module and tidal forcing. 


Here we present some of our ongoing analysis using the two very high resolution configurations and how it changes the solution compared to lower resolution simulations. We explore questions related to water formation in the Labrador Sea and Greenland melt, behavior of the Labrador Current and the Deep Western Boundary Current. We also explore the impact of Greenland runoff on driving coastal seasonal features in Melville Bay. Finally we look at eddies and small scale processes in the Arctic Ocean and Beaufort Gyre.

How to cite: Myers, P. G., Pennelly, C., and Pouneh, H.: Modelling of the Arctic Ocean and Labrador Sea at 1/60th Degree, EGU General Assembly 2025, Vienna, Austria, 27 Apr–2 May 2025, EGU25-13443, https://doi.org/10.5194/egusphere-egu25-13443, 2025.

EGU25-15556 | Posters on site | OS1.8

Introducing “Into the Blue”: a new ERC Synergy Grant resolving past Arctic warm climates 

Petra M Langebroek, Mariana Esteves, Jochen Knies, Gerrit Lohmann, Stijn De Schepper, Juliane Mueller, Monica Winsborrow, Mohamed Ezat, and Into the Blue team

The Arctic is changing: sea ice is retreating and the Greenland Ice Sheet is melting. The impact of a “bluer” and “greener” Arctic has yet to fully unfold, and extensive impacts are expected on ocean currents, stratification, marine heat waves and ecosystems.

Our poster introduces the newly funded ERC Synergy Grant “Into the Blue - Resolving Past Arctic Greenhouse Climates (i2B)”. In the coming 6 years, we will study past warm periods during the Quaternary, Pliocene and Miocene with a focus on the Arctic. We will (1) document ice sheet, sea ice, ocean, and ecosystem change by analysing existing and new data as well as model results, (2) understand ocean-cryosphere feedbacks, and (3) determine the impact of a warmer Arctic on climate, ecosystems and society.

How to cite: Langebroek, P. M., Esteves, M., Knies, J., Lohmann, G., De Schepper, S., Mueller, J., Winsborrow, M., Ezat, M., and team, I. T. B.: Introducing “Into the Blue”: a new ERC Synergy Grant resolving past Arctic warm climates, EGU General Assembly 2025, Vienna, Austria, 27 Apr–2 May 2025, EGU25-15556, https://doi.org/10.5194/egusphere-egu25-15556, 2025.

EGU25-15665 | Orals | OS1.8

The CMIP7-PMIP FastTrack abrupt-127k simulation 

Christian Stepanek, Louise C. Sime, Rachel Diamond, Chris Brierley, David Schroeder, Masa Kageyama, and Irene Malmierca-Vallet

A rapidly warming climate with substantial polar amplification will lead the Arctic becoming ice free during summer. An Arctic that „turns blue“, i.e. that changes from a current Arctic Ocean covered by high-albedo sea ice to a future low-albedo ice free water surface, may occur as early as the 2050s even under low emissions scenarios (Kim et al., 2023). Absence of summer sea ice will further exacerbate Arctic warming and will have ramnifications from regional to global scale (Bruhwiler et al., 2021).

The study of past warm climate states with significantly reduced prevalence of Arctic sea ice enables an integrated proxy-data and climate modelling approach. This provides a valuable out-of-sample test for climate models from which future projections are derived and may help us to better understand processes and climate patterns related to a blue Arctic.

Based on the Last Interglacial (~127,000 years ago), a time when orbital parameters caused much increased boreal high-latitude insolation forcing in particular from boreal spring to boreal autumn, the fourth iteration of the Paleoclimate Modelling Intercomparison Project (PMIP4) identified in their simulation lig127k substantial model-spread of simulated minimum annual Arctic sea ice conditions (Kageyama et al., 2020; Sime et al., 2023). To enable a better understanding of the origin of model-model discord the paleoclimate science community has proposed simulation abrupt-127k (Sime et al., in prep.) as part of the FastTrack portfolio of the seventh interation of the Climate Modelling Intercomparison Project (CMIP7). While simulation abrupt-127k inherits orbital and greenhouse gas parameters of PMIP4 simulation lig127k, its layout follows the approach of CMIP simulation abrupt-4xCO2, where the initial scientific focus is on a comparably short period (~100 model years) after model initialisation rather than on the quasi-equilibrated climate as in PMIP4 simulation lig127.

With this presentation we will outline rationale and utility of CMIP7 FastTrack simulation abrupt-127k to a) increase the model ensemble from the classical PMIP to the wider CMIP framework; b) focus on processes and feedbacks that translate modified climate forcing into Arctic climate towards refining our understanding of the apparent model-model discord found in lig127k; c) enhance analysis of simulated sea ice conditions and dynamics based on the standardized protocol for sea-ice related climate model outputs by the Sea-Ice Model Intercomparison Project (SIMIP; Notz et al., 2016).

How to cite: Stepanek, C., Sime, L. C., Diamond, R., Brierley, C., Schroeder, D., Kageyama, M., and Malmierca-Vallet, I.: The CMIP7-PMIP FastTrack abrupt-127k simulation, EGU General Assembly 2025, Vienna, Austria, 27 Apr–2 May 2025, EGU25-15665, https://doi.org/10.5194/egusphere-egu25-15665, 2025.

EGU25-15904 | ECS | Posters on site | OS1.8

Spatial variability and controls on the authigenic 10Be/9Be ratio in Arctic shelves and deep ocean sediments 

Agathe Ollive, Florian Adolphi, Jens Matthiessen, Walter Geibert, Michael Alscher, Konstanze Stübner, and Johannes Lachner

The authigenic 10Be/9Be ratio retrieved from marine sediments is a promising proxy for reconstructing Arctic paleoceanography, particularly the interplay of riverine and marine influences on the extensive continental shelves and in deep basins. This study investigates the spatial variability of authigenic 10Be/9Be ratios in surface sediments from the Kara and Laptev Seas, tracing its variations from river mouths to the open ocean. Calculated 10Be/9Be ratios of the water column are compared with measured ratios in surface sediments to identify controlling factors such as reversible scavenging, co-precipitation, and water mass mixing. Results confirm that authigenic 10Be/9Be records the different water masses, with low 10Be/9Be on the shelves and increasing 10Be/9Be towards the deep sea. However, while sediments on the continental shelves faithfully capture the riverine 10Be/9Be signature, offsets emerge in deeper basins due to incomplete reversible scavenging and/or coprecipitation leading to lower authigenic 10Be/9Be in deep sea sediments compared to the local water column. This study highlights the potential of 10Be/9Be as a geochemical proxy for Arctic watermass mixing while emphasizing the complexity of interacting sedimentary and oceanographic processes influencing authigenic 10Be/9Be in Arctic Ocean sediments.

How to cite: Ollive, A., Adolphi, F., Matthiessen, J., Geibert, W., Alscher, M., Stübner, K., and Lachner, J.: Spatial variability and controls on the authigenic 10Be/9Be ratio in Arctic shelves and deep ocean sediments, EGU General Assembly 2025, Vienna, Austria, 27 Apr–2 May 2025, EGU25-15904, https://doi.org/10.5194/egusphere-egu25-15904, 2025.

EGU25-15910 | ECS | Orals | OS1.8

Multi-millennial future warming scenarios with the comprehensive Earth system model AWIESM 

Lars Ackermann, Gregor Knorr, Matteo Willeit, and Gerrit Lohmann

Numerical model simulations are an essential tool for assessing effects of global warming on the climate system in future greenhouse gas concentration scenarios. Commonly, these simulations cover only the next few centuries or use low-complexity models for longer periods. However, to assess the dynamics of Earth system components with long response times like the ocean or ice sheets, multi-millennial simulations with comprehensive Earth system models are essential.
Here, we present multi-millennial simulations with the complex Earth System Model AWIESM, covering an integration time beyond the typical CMIP time scale. The model runs on a multi-resolution grid with a horizontal resolution of up to 20 km in high latitudes. The model includes an interactive ice sheet for the Greenland domain. The simulations are forced with transient greenhouse gas concentrations obtained from model simulations with the Earth System Model of intermediate complexity CLIMBER-X with an interactive carbon cycle, covering overshoot scenarios that enable assessment of long-term ice sheet and ocean dynamics.
Our results reveal a scenario-dependent weakening of the Atlantic Meridional Overturning Circulation (AMOC), followed by partial recovery over the next millennium. All scenarios show sea ice-free or nearly sea ice-free summer conditions in the northern and southern hemispheres. Winter sea ice shows an asymmetric response under future warming. While Arctic winter sea ice changes are small in low- to medium-emission scenarios, Southern Ocean winter sea ice shows a large reduction even in low-emission scenarios. The Greenland ice sheet shows a continuing ice mass loss during the next millennium, even with decreasing greenhouse gas concentrations in medium-emission scenarios. The main area of ice loss is West Greenland.
These findings underscore the importance of long-term simulations with comprehensive Earth system models to understand the complex, delayed responses of key climate system components and their broader implications for the Earth system.

How to cite: Ackermann, L., Knorr, G., Willeit, M., and Lohmann, G.: Multi-millennial future warming scenarios with the comprehensive Earth system model AWIESM, EGU General Assembly 2025, Vienna, Austria, 27 Apr–2 May 2025, EGU25-15910, https://doi.org/10.5194/egusphere-egu25-15910, 2025.

EGU25-16307 | ECS | Posters on site | OS1.8

Sedimentary ancient DNA to unlock Arctic marine biodiversity during the Holocene Thermal Maximum 

Jérémy Courtin, Sofia Ribeiro, and Heike Zimmermann

Greenland’s west coast is highly vulnerable to the impacts of climate change, with profound implications for marine ecosystems and their services. Projections suggest significant restructuring of Arctic marine ecosystems due to ongoing sea ice decline, yet uncertainties remain regarding the biosphere-specific responses of these ecosystems. The Arctic cryosphere has undergone significant changes throughout the Holocene, with the Holocene Thermal Maximum (HTM) representing a key period of reduced sea ice and warmer conditions. These past environmental shifts provide a valuable analogue for understanding the ongoing impacts of climate warming on Arctic marine ecosystems. Understanding past climate impacts on marine species is essential for predicting future changes and informing policy decisions.

While traditional microfossil records have advanced our knowledge of past ecosystems, they are biased toward species with hard body parts and are insufficiently covered in time and space. To address these limitations, we use sedimentary ancient DNA (sedaDNA) to track HTM marine biodiversity dynamics. This method allows for the detection of a broad range of organisms, including soft-bodied species such as ciliates and jellyfish, which are not preserved in the fossil record. To enhance the taxonomic resolution of marine eukaryotes across all trophic levels, from primary producers to marine mammals, we developed custom hybridization capture probes targeting barcoding regions. This approach enables the retrieval of short DNA fragments and the assessment of postmortem damage to validate the sedaDNA signal. We employed a two-step methodology: (1) compiling databases such as GBIF and WoRMS to identify knowledge gaps in Arctic marine biodiversity, and (2) evaluating various barcoding genes (e.g., 18S, rbcL, ITS2, COI) for taxonomic resolution and reference availability. Using the SILVA-NR99 database, we focused on the V7 region of the small subunit ribosomal RNA gene as a universal marker, while applying alternative markers for groups lacking sufficient resolution. We generated 46,804 80bp-long probes targeting 11,389 species, which we tested both in silico and on marine surface sediment samples collected from 25 sites around Greenland before their application to Holocene sediment cores from western Greenland.

This approach holds great potential for identifying key marine Arctic species across trophic levels and optimizing their taxonomic resolution during the HTM, revealing ecosystem responses to warming. By providing new insights into Arctic marine ecosystem dynamics and their long-term responses to climate change, we aim to offer valuable information for developing adaptive management strategies aimed at ensuring the ecological sustainability of the region.

How to cite: Courtin, J., Ribeiro, S., and Zimmermann, H.: Sedimentary ancient DNA to unlock Arctic marine biodiversity during the Holocene Thermal Maximum, EGU General Assembly 2025, Vienna, Austria, 27 Apr–2 May 2025, EGU25-16307, https://doi.org/10.5194/egusphere-egu25-16307, 2025.

EGU25-17242 | ECS | Posters on site | OS1.8

Characteristics of ocean mesoscale vortices in the Amerasian Basin from a high resolution pan-Arctic model 

Noémie Planat, Carolina Dufour, Camille Lique, Jan Rieck, Claude Talandier, and Bruno Tremblay

Observations and numerical models reveal that mesoscale eddies are ubiquitous in the Arctic Ocean. These eddies are thought to play an important role in particular in the transport of heat, salt and nutrients from the shelves to the deep basins, in the modulation of the sea ice cover, and in the dynamical equilibrium of the Beaufort gyre. However, the characteristics of these eddies are poorly documented. 
Here, an eddy detection and tracking method is applied to the output of a high resolution (1/12°) regional model of the Arctic - North Atlantic over the period 1995-2020 to investigate mesoscale eddies in the Amerasian Basin. Over that period, about 6000 eddies per year and per depth level are found distributed about equally between cyclones and anticyclones. On average, these eddies last 7 days, travel 5 km and have a radius of 12.4 km, with strong regional and temporal disparities that exist within the eddy population studied.  Down to 250 m (i.e. the second pycnocline), eddy characteristics show a strong asymmetry between the shelf and the central basin with more numerous and larger eddies that travels longer distances with the mean flow along the shelf break. In the top 70 m, the mean characteristics of detected eddies display a strong seasonality following that of the sea ice cover. Below the first pycnocline at 70 m, the number of eddies shows little seasonality but a transient increase in response to the recent acceleration of the gyre. Deeper, within the Atlantic Waters, eddies are generated everywhere across the basin and present little interannual variability.
Finally, this eddy census helps interpret some discrepancies found between previous studies that use different datasets and approaches to examine the eddy field in the Arctic. In particular, our analysis show that the anticyclone dominance within the Beaufort Gyre that arises from the analysis of eddies from the Ice Tethered Profilers is partly due a regional sampling bias. 

How to cite: Planat, N., Dufour, C., Lique, C., Rieck, J., Talandier, C., and Tremblay, B.: Characteristics of ocean mesoscale vortices in the Amerasian Basin from a high resolution pan-Arctic model, EGU General Assembly 2025, Vienna, Austria, 27 Apr–2 May 2025, EGU25-17242, https://doi.org/10.5194/egusphere-egu25-17242, 2025.

EGU25-17627 | ECS | Orals | OS1.8

Exploring the use of sedaDNA to provide a palaeogenomic-based biostratigraphy in central Arctic Ocean sediments 

Emelie Ståhl, Anna Linderholm, and Matt O'Regan

The Arctic is currently undergoing rapid warming, which in the near future is expected to result in summers with an ice-free Arctic Ocean interior, and winters having thinner, and more mobile ice. Changes in sea-ice cover will have profound impacts on Arctic oceanography, its marine ecosystem, and ultimately on our climate from regional to global scales. To better understand what will happen in a changing future, we must look into the past. Arctic marine sediments provide a range of proxies that provide valuable palaeoceanographic, and palaeoclimatic information, documenting changes to the cryosphere. Yet, a confident interpretation of palaeoceanographic, and palaeoclimatic changes across glacial cycles of the Pleistocene is still hampered by our inability to accurately date Arctic marine sediments.

Studies conducted by Jakobsson et al. in the early 2000s transformed age-model interpretations in the Arctic following the identification of the coccolithophore Gephyrocapsa huxleyi (formerly known as Emiliania huxleyi) in a sediment core from the Lomonosov Ridge. Although G. huxleyi evolved globally ca 290 ka during MIS 8 (300-243 ka), it is generally believed that this species first appeared in the Arctic Ocean during the last interglacial period (MIS 5, 71-130 ka). The biostratigraphic datum provided by the first appearance of this species has therefore been central to much palaeoceanographic research conducted in the Arctic. However, identifying nannofossils in Arctic Ocean sediments is non-trivial, as their mineral remains are often poorly preserved or entirely absent due to unfavorable taphonomic conditions. This has led to ambiguous age estimates, as revealed by a recent study by Razmjooei et al. (2023) revising the calcareous nannofossil biostratigraphy in the Arctic, indicating that previously inferred sub-stages of MIS 5 may actually represent full interglacial periods rather than interstadials.

Recent advances using sedimentary ancient DNA (sedaDNA) now permit genome-based approaches to identify calcareous photosynthetic algae in marine sediments. We hypothesize that the sedaDNA approach may provide a “palaeogenomic biostratigraphic” age control when the conventional fossil-based approach is not usable due to poorly preserved or absent fossil remains. Given its importance in Arctic biostratigraphy, and since this is the only coccolithophore with an existing reference genome, we focus on G. huxleyi. An initial pilot study analyzing 5 samples from one sediment core from the central Arctic Ocean has previously showed positive reads for G. huxleyi in sediment layers argued to be from the last interglacial (MIS 5). Expanding on this pilot-study, we conducted a high-resolution sampling, totaling 93 sedaDNA samples, of two additional cores from the central Arctic Ocean. By integrating metagenomics with fossil, and climate proxy data, we aim to more confidently place the first appearance of G. huxleyi in the biostratigraphic framework of Quaternary Arctic marine sediments.

How to cite: Ståhl, E., Linderholm, A., and O'Regan, M.: Exploring the use of sedaDNA to provide a palaeogenomic-based biostratigraphy in central Arctic Ocean sediments, EGU General Assembly 2025, Vienna, Austria, 27 Apr–2 May 2025, EGU25-17627, https://doi.org/10.5194/egusphere-egu25-17627, 2025.

EGU25-17764 | ECS | Orals | OS1.8

Marine ecosystem changes linked to climate and terrestrial freshwater inputs in a Northeast Greenland fjord over the Holocene 

Meri Mäkelä, Sofia Ribeiro, Christof Pearce, Henrieka Detlef, J. Sakari Salonen, Marit-Solveig Seidenkrantz, and Maija Heikkilä

Decreasing sea-ice extent and retreating and thinning of Greenland’s glaciers are rapidly changing Arctic coastal environments by warming and freshening the sea surface and impacting light availability. In Arctic fjords, productivity is significantly influenced by the position of glacier termini, and the present retreat of the Greenland Ice Sheet will increase the number of fjords surrounded only by land-terminating glaciers in the future. This will most likely affect the productivity and ecosystem structure of coastal marine areas. To predict future cryosphere change and its impacts, it is essential to understand climate and ecosystem variability beyond the instrumental era.  

Here we present a high-resolution reconstruction of coastal marine ecosystem change and its linkages to terrestrial freshwater and organic matter inputs in Young Sound fjord, Northeast Greenland, over the Holocene. The reconstructions are based on marine sediment-core proxies: organic-walled palynomorphs (including e.g. dinoflagellate cysts and pollen), sympagic and pelagic biomarkers (highly branched isoprenoids and sterols) and a set of geochemical indicators (sediment organic carbon, nitrogen, their stable isotopes, and biogenic silica). The results suggest a relatively cold early Holocene with extensive sea-ice cover and low productivity. Warmer and more variable conditions take hold after approximately 9 kyr with increasing productivity, species richness and terrestrial freshwater inputs, with colder conditions seen after approximately 3.5 kyr with high productivity coupled with higher ice-algae contribution. The results also indicate that this near-shore marine ecosystem is clearly influenced by local forcings, such as terrestrial freshwater and organic matter inputs, suggesting that the continuous melting of the Greenland Ice Sheet will affect marine productivity and ecosystem structure in Greenland’s fjord systems, with potential impacts on biodiversity and sustainability of fisheries. 

How to cite: Mäkelä, M., Ribeiro, S., Pearce, C., Detlef, H., Salonen, J. S., Seidenkrantz, M.-S., and Heikkilä, M.: Marine ecosystem changes linked to climate and terrestrial freshwater inputs in a Northeast Greenland fjord over the Holocene, EGU General Assembly 2025, Vienna, Austria, 27 Apr–2 May 2025, EGU25-17764, https://doi.org/10.5194/egusphere-egu25-17764, 2025.

EGU25-18918 | ECS | Posters on site | OS1.8

Long term influence of changing soil hydrology in an Earth System Model on Arctic Amplification 

Nagore Meabe-Yanguas, Jesus Fidel González-Rouco, Félix García-Pereira, Phillipp de Vrese, Alex Martínez-Vila, Norman Julius Steinert, Johann Jungclaus, and Stephan Lorenz

The Arctic’s enhanced response to global warming, driven by sea-ice and lapse-rate feedbacks, among other processes, has significant implications for the climate system, ecosystems, and society. Known as Arctic Amplification (AA), this phenomenon accelerates permafrost thawing, influencing carbon soil emissions and hydrology. However, the physics of permafrost-related processes remain poorly understood. Additionally, Earth System Models (ESMs) exhibit significant uncertainties in projecting future Arctic hydrology, making it difficult to determine whether this region will become wetter or drier. A better representation of soil thermodynamics and hydrology within ESMs allows for assessing uncertainties related to permafrost processes. This study uses a modified version of the MPI-ESM, where soil hydro-thermodynamics is improved in permafrost regions. With the tuning of parameters in these modifications we create the WET and DRY versions of the model. This allows for evaluating how these changes affect Earth's climate and, in particular, AA until 2300. Simulations, reveal that the AA factor converges to a value of 2–3 when external forcing outperforms the influence of internal variability. Furthermore, differences in climate backgrounds and the availability of sea ice and snow result in feedback processes of different magnitudes. Thus, accurately representing Arctic hydrology is crucial to better understand and predict the region's future changes. The feedback mechanisms explored here not only shape Arctic climate, but also have the potential to affect the global climate via a series of teleconnections.

How to cite: Meabe-Yanguas, N., González-Rouco, J. F., García-Pereira, F., de Vrese, P., Martínez-Vila, A., Steinert, N. J., Jungclaus, J., and Lorenz, S.: Long term influence of changing soil hydrology in an Earth System Model on Arctic Amplification, EGU General Assembly 2025, Vienna, Austria, 27 Apr–2 May 2025, EGU25-18918, https://doi.org/10.5194/egusphere-egu25-18918, 2025.

EGU25-19167 | Posters on site | OS1.8

Reassessment and applications of the Mg/Ca - δ18Oc proxy system recorded in shells of the Arctic planktonic foraminifera Neogloboquadrina pachyderma 

Audrey Morley, Elwyn de la Vega, Markus Raitzsch, Jelle Bijma, Ulysses Ninnemann, Gavin Foster, Thomas Chalk, Julie Meilland, Rachel Cave, Janina Büscher, and Michal Kucera

Observation-based reconstructions of Arctic sea surface temperatures in response to changing climate boundary conditions are critical to constrain climate sensitivity and evaluate the uncertainties of model simulations. On long and pre-instrumental timescales, this is only possible by employing climate proxies. Yet, most proxies of essential climate variables, such as sea surface temperatures (SST), suffer from limitations when applied to cold temperatures that characterize Arctic environments. These limitations prevent us from constraining uncertainties for some of the most sensitive climate tipping points that can trigger rapid and dramatic global climate change such as Polar Amplification, the disruption of AMOC, sea ice loss, and permafrost melting that are intrinsic to the polar regions. Here, we present a new approach to reconstructing sea surface temperatures (SST) using paired Mg/Ca - δ18Oc recorded in shells of the Arctic planktonic foraminifera Neogloboquadrina pachyderma. We show that in this proxy system, the Mg/Ca – palaeothermometry is affected by variations in seawater carbonate chemistry, which can be successfully quantified and removed from paleotemperature reconstructions allowing a reassessment of the absolute temperature and the magnitude of marine polar amplification to climate forcing on glacial-interglacial timescales. By applying this novel approach to existing records, we show that the magnitude of high latitude SST cooling during glacial periods has been underestimated and that the new estimate of SST change between the Late Holocene and the LGM exceeds model-based estimates of marine polar amplification by up to 3.0 ±1.0˚ C. Our findings open up opportunities to better constrain the oceanic carbonate system enabling a quantification of high-latitude ocean-atmosphere carbon exchange as well as to benchmark the performance of CMIP6 and future generations of climate models.

How to cite: Morley, A., de la Vega, E., Raitzsch, M., Bijma, J., Ninnemann, U., Foster, G., Chalk, T., Meilland, J., Cave, R., Büscher, J., and Kucera, M.: Reassessment and applications of the Mg/Ca - δ18Oc proxy system recorded in shells of the Arctic planktonic foraminifera Neogloboquadrina pachyderma, EGU General Assembly 2025, Vienna, Austria, 27 Apr–2 May 2025, EGU25-19167, https://doi.org/10.5194/egusphere-egu25-19167, 2025.

EGU25-19282 | Orals | OS1.8

Seasonal particle dynamics in Kongsfjorden during two years of contrasting environmental conditions 

Francesco Paladini de Mendoza, Stefano Miserocchi, Patrizia Giordano, Federico Giglio, Mauro Mazzola, and Leonardo Langone

Global climate change is particularly pronounced in the Arctic regions, widely recognized as a "climatic hotspot" by the scientific community. This phenomenon, known as Arctic amplification refers to the accelerated increase in Arctic surface temperature compared to the global average. This process drives the ongoing loss of Arctic sea-ice volume and intensifies the ice-albedo feedback mechanism. Key physical drivers include the increased intrusion of warm Atlantic Water into the Arctic Ocean, which profoundly impacts biogeochemical cycles. Over the past decades, the CNR-ISP has developed marine and atmospheric observatories in the Svalbard region. These include three moorings (MDI, KIM, MAP) measuring biogeochemical parameters along the water column in the Kongsfjorden-Krossfjorden fjord system, and the land-based platform, the Amundsen-Nobile Climate Change Tower (CCT), measuring atmospheric parameters. As part of the ITINERIS PNRR project, the moorings were equipped with advanced biogeochemical sensors capable of monitoring Essential Ocean Variables, enablingthe study of seasonal and annual dynamics of suspended marine particles and nutrients. Between 2022 and 2024, contrasting environmental conditions shaped the dynamics of particulate matter and nutrients. One striking difference between the two years was the intrusion of Atlantic water observed at the end of summer in 2023 which extended to the inner Kongfjorden. Additionally, the timing of the spring phytoplankton bloom between 2023 and 2024 shifted, and also the terrestrial input from summer glacier melting exhibited significant variability. The spring phytoplankton bloom begins when PAR increases after the polar night nutrient concentrations are high due to autumn replenishment and winter water convection, and the influence of Atlantic Water on nitrate replenishment rates is evident. The timing of the spring bloom results from a complex interplay of atmospheric and marine factors. In the inner part of the Kongsfjorden, suspended matter concentrations are primary driven by glacial meltwater inputs, which contributes to low-salinity surface waters within the fjord. These findings underscore the intricate relationships between environmental changes, particle dynamics, and nutrient cycling in Svalbard.

How to cite: Paladini de Mendoza, F., Miserocchi, S., Giordano, P., Giglio, F., Mazzola, M., and Langone, L.: Seasonal particle dynamics in Kongsfjorden during two years of contrasting environmental conditions, EGU General Assembly 2025, Vienna, Austria, 27 Apr–2 May 2025, EGU25-19282, https://doi.org/10.5194/egusphere-egu25-19282, 2025.

EGU25-19394 | Orals | OS1.8 | Highlight

Warm climates in the Arctic: Lessons from the past and long-term future 

Gerrit Lohmann

The Arctic is changing: sea ice is retreating and the Greenland Ice Sheet is melting. The impact of a different Arctic realm has yet to fully unfold, and extensive impacts are expected on ocean currents, stratification, marine heat waves and ecosystems. I will study past warm periods during the Quaternary, Pliocene and Miocene with focus on the Arctic. Marine heatwaves (MHWs), defined as extreme ocean warming episodes, have strengthened over the past decades. High-resolution climate models improve understanding of MHWs under global warming, but such events in the future Arctic are currently overlooked. In a high-resolution climate model, we find Arctic MHWs intensify on orders of magnitude during the warming twenty-first century, following sea ice retreat. However, with little sea ice coverage, strong interannual variability emerges, which could surpass the amplitude of former intensification. Additionally, the intensification of MHWs is linked to a substantial increase in the rate of temperature anomaly change. Cenozoic climate changes have been associated with tectonic activity and fluctuations in atmospheric CO2 levels. To explore these dynamics, we present the Holocene, Last Interglacial, Miocene and Pliocene sensitivity experiments. These experiments incorporate variations in paleogeography, ocean gateway configurations, atmospheric CO2 concentrations, and a range of ocean vertical mixing. 


Ackermann, L., C. Danek, P. Gierz, and G. Lohmann, 2020: AMOC recovery in a multi-centennial scenario using a coupled atmosphere-ocean-ice sheet model. Geophysical Research Letters, 47 (16), e2019GL086810, DOI:10.1029/2019GL086810

Contzen, J., Dickhaus, T., and Lohmann, G.: Variability and extremes: statistical validation of the Alfred Wegener Institute Earth System Model (AWI-ESM), Geosci. Model Dev., 15, 1803–1820, doi:10.5194/gmd-15-1803-2022, 2022.

Gou, R., K. Wolf, C. Hoppe, L. Wu, G. Lohmann, 2025: The changing nature of future Arctic marine heatwaves and its potential impacts on the ecosystem. Nature Climate Change, https://doi.org/10.1038/s41558-024-02224-7

Lohmann, G., M. Butzin, N. Eissner, X. Shi, C. Stepanek, 2020: Abrupt climate and weather changes across timescales. Paleoceanography and Paleoclimatology 35 (9), e2019PA003782, DOI:10.1029/2019PA003782

Lohmann, G., G. Knorr, A. Hossain, C. Stepanek, 2022: Effects of CO2 and Ocean Mixing on Miocene and Pliocene Temperature Gradients. Paleoceanography and Paleoclimatology 37, (2), e2020PA003953, doi:10.1029/2020PA003953

Lohmann, G., 2020: Temperatures from energy balance models: the effective heat capacity matters, Earth Syst. Dynam., 11, 1195–1208, doi:10.5194/esd-11-1195-2020.

Hossain, A., G. Knorr, W. Jokat, G. Lohmann, K. Hochmuth, P. Gierz, C. Stepanek, and K. Gohl, 2023: The Impact of Different Atmospheric CO2 Concentrations on Large Scale Miocene Temperature Signatures. Paleoceanography and Paleoclimatology, 38 (2), e2022PA004438. DOI:10.1029/2022PA004438 

How to cite: Lohmann, G.: Warm climates in the Arctic: Lessons from the past and long-term future, EGU General Assembly 2025, Vienna, Austria, 27 Apr–2 May 2025, EGU25-19394, https://doi.org/10.5194/egusphere-egu25-19394, 2025.

EGU25-20470 | Posters on site | OS1.8

Revisiting Late Quaternary chronostratigraphy of the Arctic Ocean using the 230Th excess method 

Tengfei Song, Claude Hillaire-Marcel, Yanguang Liu, Jean-Carlos Montero-Serrano, Guillaume St-Onge, Anne de Vernal, and Jianxing Liu

The Late Quaternary chronostratigraphic framework of the Arctic Ocean remains contentious, hindering our understanding of Arctic paleoceanographic conditions and their influence on global climate change. Recent advances in microbiostratigraphy and amino acid racemization (AAR) dating challenge the high-sedimentation rate central Arctic scenario proposed nearly two decades ago. To address this issue, U-Th analyses were performed on a Lomonosov Ridge sediment core, ICE04, whose chronostratigraphy had previously been established using AMS14C dating, lithological and mineralogical correlations, and the identification of a paleomagnetic excursion.

The Th-230 excess (230Thxs) distribution and decay downcore suggest a revised age framework. Specifically, the previously identified marine isotope stage (MIS) 3 layer can be re-assigned to MIS 3 to 6, while the MIS 4/4-5d layer extends back to MIS 7. Additionally, the 234U/238U ratio record indicates active late diagenetic processes likely driven by organic carbon decomposition. These findings highlight several key points: 1) younger organic carbon may dissolve and reprecipitate downcore due to late diagenetic processes, limiting the reliability of 14C ages derived from bulk organic carbon; 2) lithological correlations used to construct Late Quaternary chronostratigraphy can introduce significant uncertainties and may be biased by the misinterpretation of other methods, such as 14C dating; 3) dolomite peaks are recommended as reliable markers for the site-to-site correlations as they are linked to the meltwater discharge from the NW margin of the Laurentide Ice Sheet; and 4) the 1-meter-thick interval exhibiting a negative geomagnetic polarity, previously attributed to the Matuyama Chron (~780 ka) or the Laschamp (~41 ka) and Mono Lake (~35 ka) excursions, is dated to MIS 4-5d using the 230Thxs method. The revised age addresses the complexity of paleomagnetic behavior in the Arctic and underscores the need for further investigation to resolve these discrepancies.

Using the 230Thxs method, we estimate a late Quaternary mean sedimentation rate of <2 cm/ka for core ICE04, significantly lower than the previously reported rate of >4 cm/ka. These findings align with the sediment-starved deep Arctic scenario proposed prior to the 2000s, further indicating that an effort must be conducted to account for all the available data.

How to cite: Song, T., Hillaire-Marcel, C., Liu, Y., Montero-Serrano, J.-C., St-Onge, G., de Vernal, A., and Liu, J.: Revisiting Late Quaternary chronostratigraphy of the Arctic Ocean using the 230Th excess method, EGU General Assembly 2025, Vienna, Austria, 27 Apr–2 May 2025, EGU25-20470, https://doi.org/10.5194/egusphere-egu25-20470, 2025.

EGU25-21110 | Orals | OS1.8

Arctic Ocean: mixing and exchange in a changing ocean 

Tom P. Rippeth

The Arctic Ocean differs from other oceans globally in several ways. Stratification is largely determined by changes in salinity, with cooler fresher water overlying warmer (intruding) saltier water. Until very recently the ocean was largely isolated from the atmosphere by sea ice restricting exchange of heat and momentum across the sea surface. As much of the Arctic Ocean lies poleward of the critical latitude for the dominant tidal forcing, preventing the formation of freely propagating internal tides, the major pathway of tidal energy to ocean mixing. As such mixing between layers in the Arctic Ocean is weak.

An analogy is often drawn between the circulation in the Arctic Ocean and that in an estuary. Lateral gradients in density drive exchange through Arctic gateways with the exchange flow mediated by vertical mixing within the Arctic Ocean. Here we examine the potential impact of the recent decline sea ice extent on both the vertical mixing and the import of heat and export of freshwater through the Arctic gateways.

How to cite: Rippeth, T. P.: Arctic Ocean: mixing and exchange in a changing ocean, EGU General Assembly 2025, Vienna, Austria, 27 Apr–2 May 2025, EGU25-21110, https://doi.org/10.5194/egusphere-egu25-21110, 2025.

EGU25-270 | ECS | Orals | OS1.5

Extensive Intrusion of Antarctic Intermediate Water into the Arabian Sea during Younger Dryas  

Arvind Shukla, Tapas Kumar Mishra, Sunil Kumar Singh, and Arun Deo Singh

Antarctic Intermediate Water (AAIW) plays a crucial role in the global thermohaline circulation and is a vital component of the Atlantic Meridional Overturning Circulation (AMOC). It significantly contributes to the redistribution of heat, oxygen, and nutrients across the global ocean. Understanding the dynamics of intermediate water circulation over millennial timescales is essential for evaluating how changes in the AMOC affect ocean heat transport during abrupt climatic events. Despite its importance, the relationship between global intermediate water circulation and abrupt high-latitude climatic events such as the Younger Dryas (YD) and Heinrich Stadials (HS) remains partly understood, particularly in the Indian Ocean. To address this gap, we present a high-resolution ~29 kyr record of Neodymium isotopes (ƐNd) from the authigenic phases of a sediment core (SK-17) collected at 840 m depth in the eastern Arabian Sea, off Goa. Our ƐNd data shows significant temporal variations from -9.5 to -6.1 throughout the core. Climatic periods (such as YD and HS) with enhanced radiogenic Nd signatures indicate increased northward penetration of AAIW into the northern Indian Ocean during these intervals. These episodes correspond to colder periods in the Northern Hemisphere, suggesting a direct linkage between Northern Hemisphere climate dynamics and the formation of AAIW in the Southern Ocean. Specifically, the enhanced formation of AAIW during these times may have been driven by warming-induced deceleration of the AMOC, which likely triggered increased AAIW production in the Southern Ocean. This connection highlights the interplay between the North Atlantic Deep-Water formation and Southern Ocean climate processes governed by the "bipolar seesaw" mechanism. By linking AAIW variability in the Arabian Sea to global climatic events, our study underscores the importance of intermediate water masses in understanding the mechanisms driving past and potential future changes in the AMOC.

How to cite: Shukla, A., Mishra, T. K., Singh, S. K., and Singh, A. D.: Extensive Intrusion of Antarctic Intermediate Water into the Arabian Sea during Younger Dryas , EGU General Assembly 2025, Vienna, Austria, 27 Apr–2 May 2025, EGU25-270, https://doi.org/10.5194/egusphere-egu25-270, 2025.

The Arabian Sea (AS) hosts the world’s thickest and most intense oxygen minimum zone (OMZ), and previous studies have documented a dramatic decline of dissolved oxygen (DO) in the northeastern AS in recent decades. In this study, using the recently released data from Biogeochemical-Argo floats, we found a surprising trend of recovery in deoxygenation within the core region of the OMZ in the AS (ASOMZ) since 2013. The average DO concentration increased by approximately threefold, from ~0.63 μM in 2013 to ~1.68 μM in 2022, and the thickness of the ASOMZ decreased by 13%. We find that the weakening of Oman upwelling resulting from the weakening of the summer monsoon is the main driver of oxygenation in the ASOMZ. In addition, the reduction of primary production linked to warming-driven stratification reinforces deoxygenation recovery at depth.

How to cite: Liu, T., Qiu, Y., and Lin, X.: Dissolved oxygen recovery in the oxygen minimum zone of the Arabian Sea in recent decade as observed by BGC-Argo floats, EGU General Assembly 2025, Vienna, Austria, 27 Apr–2 May 2025, EGU25-2038, https://doi.org/10.5194/egusphere-egu25-2038, 2025.

EGU25-3030 | Posters on site | OS1.5

Southern Hemisphere water mass transport to the Arabian Sea linked to Greenland climate variability during Heinrich Event 4  

Andreas Lückge, Martina Hollstein, Markus Kienast, Jeroen Groeneveld, Enno Schefuß, Mahyar Mohtadi, and Stephan Steinke

Several paleoceanographic and climate modeling studies have shown both oceanic and atmospheric teleconnections between climate in the tropics and the high latitudes on timescales ranging from decadal to multi-centennial. The last glacial period is characterized by millennial-scale abrupt warmings (interstadials) followed by rather gradual coolings to colder (stadials) Dansgaard-Oeschger (DO) events. The more pronounced of these stadial phases coincide with occurrences of ice-rafted debris in sediments from the mid-latitude Atlantic Ocean, referred to as Heinrich events (HE). Climate oscillations associated with DOs and HEs are also recorded in tropical climate archives around the Indian Ocean and on the Asian continent. However, forcing and response mechanisms of the Indo-Asian monsoon system and ocean-atmosphere exchange processes in conjunction with these millennial-scale oscillations are still poorly understood. Here, we present high-resolution geochemical and micropaleontological data from a sediment core located at 571 m water depth offshore Pakistan, representing the past 80,000 years at millennial-scale resolution.

Alkenone unsaturation-derived sea surface temperature (SST) estimates show overall variations between 23 and 28°C. Millennial scale SST changes of 2°C are modulated by longer-term SST fluctuations. Interstadial intervals are characterized by higher organic carbon (TOC) concentrations, whereas sediments with low TOC contents mark stadials. Productivity-related and anoxia-indicating proxies show abrupt shifts with a 50-60 year duration at climate transitions, such as interstadial inceptions. Inorganic data consistently indicate that enhanced fluxes of terrestrial-derived sediments are paralleled by productivity maxima, and are characterized by an increased fluvial contribution from the Indus River during interstadials. The hydrogen isotopic composition of terrigenous plant waxes indicates that stadials are dry phases whereas humid conditions seem to have prevailed during interstadials. Stadials are characterized by an increased contribution of aeolian dust. HEs are especially dry, indicating a dramatically weakened Indian summer monsoon and increased continental aridity.  

The stable oxygen isotope (δ18O) records of the surface-dwelling foraminifera G. ruber and of the thermocline-dwelling P. obliquiloculata both show a strong correspondence to Greenland ice core δ18O, whereas the δ18O signal of benthic foraminifera (U. peregrina and G. affinis) reflects patterns similar to those observed in Antarctic ice core records. Distinct shifts in benthic δ18O during stadials indicate frequent injections of oxygen-rich intermediate water masses of Southern Ocean origin into the Arabian Sea. The most pronounced oceanographic changes occur during the transition and the termination of HE 4, respectively. Mg/Ca ratios of G. affinis show a rapid increase (decrease) of bottom water temperatures during the onset (termination) of HE 4, which is in good agreement to modelling studies. The hydrogen isotopic composition of terrigenous plant waxes indicates that HE 4 is much drier than the surrounding DOs.

Overall, our results strengthen the notion that North Atlantic temperature changes and shifts in the hydrological cycle of the Indian monsoon system are closely coupled, with significant impacts on regional environmental conditions such as river discharge and ocean margin anoxia. These shifts were modulated by changes in the supply of water masses from the Southern Hemisphere.

How to cite: Lückge, A., Hollstein, M., Kienast, M., Groeneveld, J., Schefuß, E., Mohtadi, M., and Steinke, S.: Southern Hemisphere water mass transport to the Arabian Sea linked to Greenland climate variability during Heinrich Event 4 , EGU General Assembly 2025, Vienna, Austria, 27 Apr–2 May 2025, EGU25-3030, https://doi.org/10.5194/egusphere-egu25-3030, 2025.

EGU25-3617 | Posters on site | OS1.5

Intermediate circulation variability in the equatorial Indian Ocean 

Qingwen Zhong, Peter Brandt, Rena Czeschel, and Franziska U. Schwarzkopf

The Equatorial Intermediate Current (EIC) impacts the distribution and the transport of biogeochemical tracers such as oxygen. The EIC in Indian Ocean, covering the range from 200 to 1000 m between 2°S and 2°N , has higher velocity and a lower-frequency variability in the central basin than in the east. The EIC variability is forced by the wind stress forming equatorial beams and is also strengthened by basin resonance. We use zonal current velocity timeseries of 2015-2023 obtained from different equatorial moorings and a continuous timeseries of 2000-2022 years derived from a global NEMO ocean model configuration at 0.25° horizontal resolution with 46 z-levels (ORCA025.L46) and apply the method of vertical mode decomposition aiming to characterize equatorial zonal velocity variability of the Indian Ocean by equatorial beams, baroclinic modes, and equatorial basin resonance.

From west to east, the Indian Ocean is divided by the topography into three subbasins. The west basin is from the western boundary to the Maldives Islands at 73°E; the central basin is from 73°E to the 90°E ridge; the east basin is from 90°E to the eastern boundary. The frequency – baroclinic mode decomposition of the velocity field shows that semiannual and annual signals are the most significant components. For semiannual signals, the second to fourth baroclinic modes contribute at the mooring locations at 80°E and 85°E, while the fifth to eighth modes dominate at 93°E, indicating the essential role of higher baroclinic modes in the eastern basin. For annual signals, lower baroclinic modes are more significant in the east than in the central subbasin. The model output agrees with the observed distribution of contributing baroclinic modes. Observations further reveal several strong EIC events occurring in 2015-2016 and 2020-2021. Atmospheric data showed corresponding strong anomalies in zonal wind stress and outgoing long-wave radiation. Sea surface temperature anomalies happened along with them. With the distribution of the contributing baroclinic mode, the equatorial beams could explain the strong current events at intermediate depths. The energy input from atmospheric forcing propagates along beams, which are predominantly formed by the second baroclinic mode in the central basin and by the superposition of several higher baroclinic modes in the eastern basin. Future research would focus on the role of equatorial beams in the deeper current variability with the knowledge of contributed baroclinic modes in the Indian Ocean.

How to cite: Zhong, Q., Brandt, P., Czeschel, R., and Schwarzkopf, F. U.: Intermediate circulation variability in the equatorial Indian Ocean, EGU General Assembly 2025, Vienna, Austria, 27 Apr–2 May 2025, EGU25-3617, https://doi.org/10.5194/egusphere-egu25-3617, 2025.

This study investigated the influence of interannual variations in tropical Indian Ocean tripole (IOT) on the surface air temperature (SAT) over the western Tibetan Plateau (TP) during boreal summer. During the positive phase of the IOT, two northward cross-equatorial airflows are induced over the tropical eastern and western Indian Ocean. These airflows reinforce the ascending motion over southern tropical Asia (80°–125°E, 15°–25°N), increasing local precipitation, as confirmed by observations and simulations by the Community Atmosphere Model. The upper-level Asian Continental Meridional Teleconnection (ACMT) pattern is excited by the latent heat released from precipitation and transmits signals from southern tropical Asia to the western TP, leading to the positive geopotential height anomalies and anomalous anticyclones over there. Upper-level circulation anomalies over the western TP enhance atmospheric thickness through adiabatic processes, consequently elevating local SAT. The ACMT associated with precipitation anomalies thus serves as an atmospheric bridge connecting the IOT and the SAT variations over the western TP.

How to cite: Zhang, Y., Zhu, M., and Li, J.: Physical connection between the tropical Indian Ocean tripole and western Tibetan Plateau surface air temperature during boreal summer , EGU General Assembly 2025, Vienna, Austria, 27 Apr–2 May 2025, EGU25-6573, https://doi.org/10.5194/egusphere-egu25-6573, 2025.

EGU25-8266 | ECS | Posters on site | OS1.5

Nitrogen Cycling in the East Equatorial Indian Ocean and Bay of Bengal: Insights from Nitrate Isotopes and Water Masses 

Gesa Schulz, Kirstin Dähnke, Tina Sanders, Jan Penopp, Hermann W. Bange, Rena Czeschel, and Birgit Gaye

Oxygen minimum zones (OMZ) contribute to 20 to 40 % of global fixed nitrogen loss despite occupying only about 1 % of the ocean. The Bay of Bengal (BoB) contains one of the most pronounced OMZ in intermediate waters worldwide, with oxygen levels near anoxic conditions. Understanding nitrogen cycling in OMZs is critical for comprehending and accurately modeling the global oceanic nitrogen cycle.

In this study, we examined nitrogen cycling in the East Equatorial Indian Ocean (EEIO) and the BoB using water column properties—including temperature, salinity, oxygen, nutrients, and dual stable isotopes of nitrate—collected during a cruise in April/May 2024. Potential temperature and salinity profiles revealed a clear separation between the BoB and the EEIO at 5°N, with distinct water mass distributions and limited mixing between the two regions.

Depth profiles of nitrate stable isotopes displayed notable variations. In waters below 300 m, isotopic signatures were influenced solely by water mass distribution. In contrast, isotope variations in the upper 200 m reflected active on-site fractionation. Surface waters (<100 m) exhibited significant nitrate isotope enrichment and a nitrate deficit, driven by phytoplankton uptake. Below this layer, nitrification was observed, primarily through regenerative production using previously assimilated biomass rather than newly fixed nitrogen from N2 fixation. A regional decoupling of nitrate dual isotopes, with more enriched δ18O-NO3- in more northern samples of the central BoB, suggested increased nitrite reduction followed by re-oxidation without full assimilation into organic matter in the BoB.

Within the OMZ of the BoB, we identified a persistent nitrate deficit and slightly enriched nitrate isotopes, indicative of nitrogen loss. Given that oxygen concentrations remained slightly above the threshold for significant denitrification in most samples, anammox likely represents the dominant nitrogen loss pathway in the BoB's OMZ.

How to cite: Schulz, G., Dähnke, K., Sanders, T., Penopp, J., Bange, H. W., Czeschel, R., and Gaye, B.: Nitrogen Cycling in the East Equatorial Indian Ocean and Bay of Bengal: Insights from Nitrate Isotopes and Water Masses, EGU General Assembly 2025, Vienna, Austria, 27 Apr–2 May 2025, EGU25-8266, https://doi.org/10.5194/egusphere-egu25-8266, 2025.

EGU25-8405 | Orals | OS1.5 | Highlight

Tropical Indian Ocean Warming: A Key Driver of Future Hadley Circulation Changes 

Yong Sun, Gilles Ramstein, Alexey Fedorov, and Lin Ding

The rapid warming of the oceans is increasingly recognized for its significant impacts on the climate system and is a central issue in the Climate Variability and Predictability (CLIVAR) research program. However, the effect of future ocean warming—particularly regional ocean warming—on the Hadley Circulation (HC) remains poorly understood. This study addresses the regional contributions of tropical ocean warming to future HC changes, focusing on the 1.5°C, 2°C, and 3°C warming scenarios outlined in the Paris Agreement. Through large ensemble numerical simulations, we demonstrate for the first time that the tropical Indian Ocean dominates future HC changes, while the tropical Pacific Ocean is the main source of uncertainty in HC projections. These results provide critical insights for improving Earth system models and enhancing the projection of tropical atmospheric circulation. Furthermore, they offer a scientific foundation for monitoring and forecasting climate risks associated with future HC shifts, supporting the development of key policy decisions.

Sun, Y., Ramstein, G., Fedorov, A.V., Ding, L., & Liu, B. (2025). Tropical Indian Ocean drives Hadley circulation change in a warming climate. National Science Review, 12(1), nwae375, https://doi.org/10.1093/nsr/nwae375


How to cite: Sun, Y., Ramstein, G., Fedorov, A., and Ding, L.: Tropical Indian Ocean Warming: A Key Driver of Future Hadley Circulation Changes, EGU General Assembly 2025, Vienna, Austria, 27 Apr–2 May 2025, EGU25-8405, https://doi.org/10.5194/egusphere-egu25-8405, 2025.

EGU25-8568 | Posters on site | OS1.5

Picocyanobacteria show warm water preference in the south-central Arabian Sea (North Indian Ocean) during the summer monsoon 

Haimanti Biswas, Mintu Chowdhury, and Natasha Majumder

The Arabian Sea, a part of the north Indian Ocean shows a trend of increasing sea surface temperature (SST) over a decadal scale. This area is particularly important due to high phytoplankton growth which is mostly governed by atmospheric forcing and also a place for carbon burial. Hence it is imperative to understand the responses of phytoplankton to this warming trend. The summer monsoon (June-August) winds develop a low-level atmospheric jet (Findlater Jet) blowing across the central Arabian Sea. The positive wind stress curl in the north of this jet leads to open ocean upwelling with consequent nutrient enrichment and phytoplankton bloom. The negative curl in the south results in down-welling and deepening of the mixed layer depth. During the winter monsoon, the wind direction reverses and speed weakens, but in the northern part the cold convective mixing occurs due to the cooling and densification of surface waters and also fuels high phytoplankton growth. However, the south remains oligotrophic, low productive, and warmer compared to the north. We present here two data sets of phytoplankton taxonomy done by both marker pigment analyses by HPLC and light microscopy collected in two field campaigns during summer monsoons 2017 (August) and 2018 (August) along the central Arabian Sea (64°E, 11 -21° N in 1 ° interval). The northern part of the Findlater Jet was mostly occupied by the cooler waters and highest nutrient levels that promoted large diatom-dominated phytoplankton biomass. The southern part was oligotrophic with deep mixed layers, warm, and dominated by (~50%) picocynaobacteria and Prochlorococcus (containing zeaxanthin and DV-Chla) followed by smaller chain-forming diatoms, and heterotrophic dinoflagellates. We have observed that the upwelling strength was stronger in 2018 with cooler waters and higher nutrient levels compared to 2017. The occurrences of warmer waters in 2017 supported higher growth of picocynaobacteria. This is also consistent with other global analyses of long-term trends observed from the Indian Ocean. We have considered a box of 64-66°E and divided it into two sectors, south (18-21°N) and north (11-15°N). The satellite-derived SST data from 2000-2024 indicates a warming trend during summer monsoon both in the north and south. However, no such trend was noticed during winter. This observation suggests that warming during summer monsoon may directly influence the phytoplankton community and may affect carbon transfer and cycling in this dynamic basin.

How to cite: Biswas, H., Chowdhury, M., and Majumder, N.: Picocyanobacteria show warm water preference in the south-central Arabian Sea (North Indian Ocean) during the summer monsoon, EGU General Assembly 2025, Vienna, Austria, 27 Apr–2 May 2025, EGU25-8568, https://doi.org/10.5194/egusphere-egu25-8568, 2025.

EGU25-8783 | ECS | Posters on site | OS1.5

Calibrating Individual Foraminifera Analysis for Climate reconstruction in the Western Indian Ocean: Assessing Seasonal and Interannual Variability 

Yohan Lichterfeld, Guillaume Leduc, Kaustubh Thirumalai, Laurence Vidal, Thibault De Garidel-Thoron, Corinne Sonzogni, and Clara Bolton

The Indian Ocean is affected by seasonal and interannual climate variability, with large consequences on the water cycle over adjacent landmasses. The northern Indian Ocean influences the African and Asian monsoon systems, and its seasonal and interannual variability interacts with El Niño-Southern Oscillation (ENSO) in the Pacific Ocean, potentially triggering Indian Ocean Dipole (IOD) development. Future projections suggest that Indian Ocean modes of climate variability could be enhanced under warming scenarios, but a lack of past records precludes a deeper understanding of how the Indian Ocean modes of variability could change over evolving boundary conditions.

Due to low sediment accumulation rates and bioturbation in marine cores, bulk analyses cannot usually record past climate variability at seasonal or interannual timescales. In contrast, individual foraminifera analyses (IFA) can theoretically estimate the total variance in a population of foraminifera that experienced upper ocean variability at sub-centennial timescales. Geochemical records (δ18O, Mg/Ca) based on IFA have been used to reconstruct past climate variance including seasonality, ENSO in the Pacific Ocean, and IOD in the eastern Indian Ocean. However, using variance in a foraminifera population to pinpoint which mode of variability is the ultimate driver remains a challenge.

Here we model the range of variability of different key sites in the Indian Ocean to seasonal vs interannual climate variability using ORAS-5 re-analysis temperature and salinity data spanning the period from 1958 to 2018, and to assess the impact of changing the amplitude of these modes of variability on total δ18O variance of model foraminifera populations. In light of these results, we then analyzed IFA (δ18O and morphology) in three core-top samples, targeting two planktonic foraminifera species with different seasonalities and depth habitats: Ocean Drilling Program Site 722 in the Arabian Sea upwelling region, monsoon-influenced Site MD77-191 near the southern tip of India, and Site MD96-2060 core offshore Tanzania in the western Indian Ocean. Results will allow us to better evaluate how to interpret IFA in different oceanographic biomes of the Indian Ocean, ultimately leading to a better understanding of past climate extremes embedded in paleoclimate record.

How to cite: Lichterfeld, Y., Leduc, G., Thirumalai, K., Vidal, L., De Garidel-Thoron, T., Sonzogni, C., and Bolton, C.: Calibrating Individual Foraminifera Analysis for Climate reconstruction in the Western Indian Ocean: Assessing Seasonal and Interannual Variability, EGU General Assembly 2025, Vienna, Austria, 27 Apr–2 May 2025, EGU25-8783, https://doi.org/10.5194/egusphere-egu25-8783, 2025.

EGU25-8934 | ECS | Orals | OS1.5

A Baseline for Recognizing Change: Diversity and Biogeography of the Maldives Atolls' Shallow Water Foraminifera 

Hitisha Baroliya, Thomai Anagnostoudi, Shai Oron, Enric Sala, Alan Freidlander, and Beverly Goodman- Tchernov

The Maldives archipelago has become one of the most famous touristic locations in the world and is under noticeable pressure from various human activities such as extensive fisheries and tourism.  Because of this, the Pristine Seas Project (National Geographic) included the area in its efforts to fill existing knowledge gaps such as its species diversity and distribution as part of a larger aim to establish science-based protected marine reserve zones. Foraminifera, unicellular marine marvels, are renowned for their use as an environmental bioindicator of broader conditions. The present study investigates the diversity and biogeographic patterns of recent shallow water foraminifera that inhabit three distinctive atolls in the Maldives archipelago. Sediment samples were collected from reef and lagoon environments of the 26 distinct localities across three southern Maldives atolls - Addu, Fuvahmulah, and Huvadhoo. The most abundant taxa are Amphistegina followed by Calcarina, Heterostegina and Sorites. A species richness and diversity varied among sampling sites, with higher richness observed in MV18 station (Addu Atoll). Cluster analysis revealed distinct foraminiferal assemblages associated with different reef zones and sediment types. Here we discuss environmental parameters such as depth, substrate characteristics, ocean current influence, foraminiferal distribution patterns within and between different atolls of Maldives and also in comparison to the greater Indian Ocean datasets. The empirical data generated in this study offers a better understanding of ecosystem biodiversity in this remote location which may act as a baseline for future experimental and ecological studies, assessing possible anthropogenic influences and provides valuable insights into the regional vulnerability to climate change. Present study highlights the importance of habitat, microhabitat conservation and contributes to our knowledge of Indian Ocean marine biodiversity and biogeography.

Keywords: Indian Ocean, assemblage, habitat, distribution, large benthic foraminifera

How to cite: Baroliya, H., Anagnostoudi, T., Oron, S., Sala, E., Freidlander, A., and Goodman- Tchernov, B.: A Baseline for Recognizing Change: Diversity and Biogeography of the Maldives Atolls' Shallow Water Foraminifera, EGU General Assembly 2025, Vienna, Austria, 27 Apr–2 May 2025, EGU25-8934, https://doi.org/10.5194/egusphere-egu25-8934, 2025.

EGU25-9261 | ECS | Orals | OS1.5

Impact of a newly observed recurring eddy on the western Bay of Bengal productivity  

William Luty, Fatma Jebri, Meric Srokosz, Andrew Ross, Stephen Griffiths, and Zoe Jacobs

Mesoscale eddies have a significant impact on the biological productivity in the Bay of Bengal (Eastern Indian Ocean). However, we do not currently have a complete understanding of them. The Bay of Bengal is a region that is highly dependent on fishing for its population’s survival, with surrounding countries such as Bangladesh depending on fish from the bay for approximately 60% of their consumed animal protein, and hence understanding any changes in this biological productivity is important. In this work, using 25-42 years of satellite data and the py-eddy-tracker eddy detection algorithm (Mason et al., 2014), we observe a yearly recurring mesoscale eddy (called hereafter the Odisha Eddy) on the western coast of the Bay of Bengal, which was noted before but investigated here, for the first time, in terms of physics and biological response. We also examine the impact of a confluence zone that forms between the EICC as it reverses poleward and an equatorward flowing boundary during May to September on the Odisha Eddy variability, using a new algorithm that automatically identifies this confluence zone based on satellite altimetry currents data. We further investigated the impact that the EICC confluence zone has on the biological productivity of the Odisha Eddy. We found that the eddy has an increase in the concentration of chlorophyll-a by 42% as compared to the surrounding waters, and that when the eddy occurs alongside the confluence zone, the chlorophyll-a content within the Odisha Eddy is 36% higher than when the eddy occurs alone. The Odisha Eddy also presents a larger radius (31% increase), amplitude (47% increase) and faster rotational velocity (15% increase) when it occurs alongside the confluence zone. We conclude that the EICC confluence zone amplifies the positive effect that the Odisha Eddy has on the biological productivity of this region of the Bay of Bengal. We hypothesise that this is due to the confluence zone enhancing advection of nutrients within and around the eddy. More research is needed to fully examine this mechanism and other controls (e.g., impact of ocean planetary waves, wind field) influencing the Odisha Eddy productivity in the Bay.

How to cite: Luty, W., Jebri, F., Srokosz, M., Ross, A., Griffiths, S., and Jacobs, Z.: Impact of a newly observed recurring eddy on the western Bay of Bengal productivity , EGU General Assembly 2025, Vienna, Austria, 27 Apr–2 May 2025, EGU25-9261, https://doi.org/10.5194/egusphere-egu25-9261, 2025.

The Indian Ocean Dipole (IOD) and Tripole (IOT) represent primary modes of interannual variability in the Indian Ocean, impacting both regional and global climate. Unlike the IOD, which is closely related to the El Niño-Southern Oscillation (ENSO), our findings unveil a substantial influence of the Australian Monsoon on the IOT. An anomalously strong Monsoon induces local sea surface temperature (SST) variations via the wind-evaporation-SST mechanism, triggering atmospheric circulation anomalies in the eastern Indian Ocean. These circulation changes lead to changes in oceanic heat transport, facilitating the formation of the IOT. Our analysis reveals a strengthening connection between the Australian Monsoon and the IOT in recent decades, with a projected further strengthening under global warming. This contrasts with the diminished coupling between ENSO and IOD in recent decades from observations and model projections, illustrating evolving Indian Ocean dynamics under the warming climate.

How to cite: Chen, M.: Emerging influence of the Australian Monsoon on Indian Ocean interannual variability in a warming climate, EGU General Assembly 2025, Vienna, Austria, 27 Apr–2 May 2025, EGU25-10702, https://doi.org/10.5194/egusphere-egu25-10702, 2025.

EGU25-12271 | ECS | Orals | OS1.5

A horseshoe salinity pattern in the Indian Ocean 

Limonlisa Sahu, Balaji Senapati, and Mihir K. Dash

Salinity plays a major role in the global hydrological cycle and climate by modulating upper ocean stratification and sea surface temperature. Past studies have revealed the salinity variation in different major ocean basins from interannual to decadal time scales. However, understanding of upper ocean salinity variation in the Indian Ocean is limited, especially on decadal time scale and thus its global impacts. Our study reveals the presence of a horseshoe pattern in the upper ocean salinity, which varies on a decadal time scale. This pattern is generated from air-sea interaction mechanisms and is linked with Ningaloo Niño. The sea surface temperature anomalies in the southeastern tropical Indian Ocean in relation to Ningaloo Niño triggers the circulation anomaly causing the variation in the precipitation pattern. As a result, the upper ocean freshens or gets more saline and forms as a horseshoe pattern in upper ocean salinity on a decadal time scale. This variation could be useful for better presentation of salinity variation in the Indian Ocean and its associated impacts.

How to cite: Sahu, L., Senapati, B., and Dash, M. K.: A horseshoe salinity pattern in the Indian Ocean, EGU General Assembly 2025, Vienna, Austria, 27 Apr–2 May 2025, EGU25-12271, https://doi.org/10.5194/egusphere-egu25-12271, 2025.

EGU25-15053 | ECS | Orals | OS1.5

Regime Shifts in Marine Heat Extremes in the Northern Indian Ocean 

Hitesh Gupta, Rahul Deogharia, and Sourav Sil

Sea Surface Temperature (SST) extreme, known as the Marine Heat Extremes (MHEs), has become more frequent and intense over the years in the Northern Indian Ocean (NIO), leading to increased uncertainty in monsoon and cyclones. In this study, we characterised the evolution of MHEs utilising the monthly Hadley Centre Sea Ice and SST (HadISST) for 1900–2020 over the NIO. For a comparative analysis of evolution of MHEs, the region was further divided into Eastern Equatorial IO (EEIO), Western Equatorial IO (WEIO), Arabian Sea (AS), and Bay of Bengal (BoB). A MHE event is defined when the SST crosses the monthly varying 98th percentile threshold corresponding to the fixed climatological baseline of 1901–1950. Two normalized indices, i.e., Normalized Extreme Frequency Index and Heat Index, have been utilized to understand the spatio-temporal characteristics of intensity and frequency, respectively. Both the indices show a non-linear exponential increment. Moreover, the area fraction experiencing MHEs was also found to increase swiftly, following a sigmoidal curve. Frequent mean regime-shifts in these quantities have been observed, increasing the unpredictability of the climate system. Moreover, statistical tests revealed that the MHE attributes are increasing because of the increasing mean SST rather than its variance.  A mixed layer heat budget analysis shows that the MHE attributes have been increasing more rapidly over the WEIO, followed by EEIO, AS, and lastly the BoB, majorly due to the net heat flux followed by the horizontal advection. These findings underscore the non-linear escalation of thermal stress on marine ecosystems and the broader climate, emphasizing the need to develop mitigation strategies.

How to cite: Gupta, H., Deogharia, R., and Sil, S.: Regime Shifts in Marine Heat Extremes in the Northern Indian Ocean, EGU General Assembly 2025, Vienna, Austria, 27 Apr–2 May 2025, EGU25-15053, https://doi.org/10.5194/egusphere-egu25-15053, 2025.

EGU25-15560 | Posters on site | OS1.5

The Indian Ocean Tropical Gyre and associated heat-salt Transport and its ecological impact: A review 

Yan Du, Zhangzhe ZHao, and Yuhong Zhang

With the developing observation system, our understanding of Indian Ocean circulation has advanced in recent years. We have noticed the rapid increase of the ocean content in the Indian Ocean, and its role in global climate changes. In the mean state, a relatively closed current loop is established by an eastward current along the equator and a westward current south of the equator, regarded as the Indian Ocean Tropical Gyre (IOTG). As an important component of Indian Ocean air-sea interaction, the essential impacts of IOTG have been discovered. Due to the monsoon, IOTG displays significant seasonal variations, characterized by the reversal of currents and associated heat-salt redistribution. Also, IOTG interacts with the climate modes. This paper summarizes the advances, including the multi-scale variations of IOTG, associated heat-salt transport, and its ecological impact.

How to cite: Du, Y., ZHao, Z., and Zhang, Y.: The Indian Ocean Tropical Gyre and associated heat-salt Transport and its ecological impact: A review, EGU General Assembly 2025, Vienna, Austria, 27 Apr–2 May 2025, EGU25-15560, https://doi.org/10.5194/egusphere-egu25-15560, 2025.

EGU25-19800 | Orals | OS1.5

Systematic biases over the equatorial Indian Ocean and their influence on seasonal forecasts of the IOD 

Andrew Turner, Marimel Gler, Linda Hirons, Charline Marzin, and Caroline Wainwright

Accurate representation and predictability of the Indian Ocean Dipole (IOD) in seasonal forecasts are crucial given its pronounced socioeconomic impacts on countries surrounding the Indian Ocean.  Using hindcasts from the coupled Met Office Global Seasonal Forecasting System (GloSea6), coupled mean state biases in the western and eastern equatorial Indian Ocean (WEIO and EEIO) and their impacts on IOD prediction are examined. 

Results show that GloSea6 exhibits a pronounced cold bias in the EEIO that rapidly develops after the onset of the monsoon in boreal summer (JJA, July-August) and persists through the autumn season (SON, September-November).  This cold bias, along with a dry bias, is linked to erroneous easterlies and a shallow thermocline, likely associated with the summer monsoon circulation.  The seasonal evolution and relative timing of the precipitation biases between the western and eastern IOD poles, such that the biases develop through JJA in the EEIO but follow in the WEIO in SON, suggests that the EEIO plays the leading role in the development of coupled feedbacks that result in an overall large dipole pattern of atmospheric and subsurface oceanic biases in SON.

Analysis of skill metrics for the IOD shows that GloSea6 achieves a high anomaly correlation coefficient at short lead times, though it tends to overestimate IOD ampltiude, indicating higher IOD variability compared to observations.  This overestimation is larger in the eastern IOD pole than in the western pole and is likely linked to the poor representation of the evolution of the SST anomalies in the EEIO during positive and negative IOD events in SON.  This aligns with the skill metrics of the individual poles, which show a lower anomaly correlation coefficient and higher prediction errors observed in the eastern pole compared to the west.

Results in this study highlight the crucial role of regional biases, particularly in the EEIO, in shaping IOD variability and suggest that addressing these regional biases in GloSea6 could improve IOD prediction skill, enhancing forecasts of climate impacts for countries surrounding the Indian Ocean.

How to cite: Turner, A., Gler, M., Hirons, L., Marzin, C., and Wainwright, C.: Systematic biases over the equatorial Indian Ocean and their influence on seasonal forecasts of the IOD, EGU General Assembly 2025, Vienna, Austria, 27 Apr–2 May 2025, EGU25-19800, https://doi.org/10.5194/egusphere-egu25-19800, 2025.

EGU25-20979 | ECS | Posters on site | OS1.5

Delayed Response of Eddy Kinetic Energy Build-up off Somali Coast During Summer Monsoon 

Junshu Lin, Minyang Wang, Lingxing Dai, Hideharu Sasaki, and Yan Du

The Great Whirl (GW), a prominent anticyclonic gyre in the northwest Indian Ocean, is crucial in regional circulation and energy dynamics during the summer monsoon. Using satellite observations and high-resolution ocean simulations, this study examines the mechanisms behind the growth and maintenance of Eddy Kinetic Energy (EKE) in the GW region. EKE peaks about 56 days after the summer monsoon’s peak, a delay caused by energy transfer processes. Southwest wind forcing during the monsoon initiates the EKE growth, with the barotropic energy conversions from mean flows eventually dominating the energy input. Enhanced stretching and shear effects of the Somali Currents (SC) intensify barotropic instabilities, maintaining EKE even as monsoon winds weaken. The baroclinic energy conversions act as a secondary energy input, exhibiting a positive eddy buoyancy work (potential energy to kinetic energy) at the upwelling wedge regions northwest of the GW. Our study highlights the importance of internal energy transfer processes in modulating ocean circulation and energy dynamics off the Somali Coast, emphasizing eddy-mean flow interactions and potential-to-kinetic energy transfer in the Somali upwelling system.

How to cite: Lin, J., Wang, M., Dai, L., Sasaki, H., and Du, Y.: Delayed Response of Eddy Kinetic Energy Build-up off Somali Coast During Summer Monsoon, EGU General Assembly 2025, Vienna, Austria, 27 Apr–2 May 2025, EGU25-20979, https://doi.org/10.5194/egusphere-egu25-20979, 2025.

EGU25-21348 | ECS | Posters on site | OS1.5

Low-frequency coupling of the Indian and Pacific Walker circulation modulated by volcanic forcing 

Shouyi Wang, Caroline Ummenhofer, and Delia Oppo

Climate variability in the Indian and Pacific Oceans exhibits strong coupling on interannual to decadal timescales. Since the early 2000s, however, synchronization of decadal climate modes between the two basins has decreased due to enhanced greenhouse gas forcing and anthropogenically driven warming of the Indian Ocean. Understanding mechanisms of decoupling is crucial for properly characterizing and predicting low-frequency (decadal-multidecadal) climate variations which have a large impact on regional water resources around the Indian Ocean rim and marine ecosystems.

Here we contextualize the recent inter-basin decoupling by reconstructing Indo-Pacific basin interactions over the past four centuries (1630-2000 CE) through leveraging a compilation of tropical paleoclimate archives and two reconstruction methods. Specifically, we employ a network of coral proxy records from the Indian Ocean, Maritime Continent, and Pacific Ocean, alongside select hydroclimatically-sensitive stalagmite and tree-ring records from the Indian Ocean rim to reconstruct the Indian and Pacific Walker circulations, as well as the Indian Ocean Basin Mode over the past four centuries.

Our results confirm that Indo-Pacific coupling was present throughout the preindustrial era, and was disrupted only by a series of strong tropical volcanic eruptions during the early 19th century. We find, based on last millennium climate model simulations and hemispheric temperature reconstructions, that the interhemispheric asymmetry of cooling in response to volcanic forcing as well as the Indian Ocean’s strong sensitivity to external forcings caused this anomalous decoupling of Indo-Pacific climate. Additionally, the mechanisms of past decoupling associated with volcanism provide insights into the source of inter-model spread on the magnitude of future Indo-Pacific trends.

How to cite: Wang, S., Ummenhofer, C., and Oppo, D.: Low-frequency coupling of the Indian and Pacific Walker circulation modulated by volcanic forcing, EGU General Assembly 2025, Vienna, Austria, 27 Apr–2 May 2025, EGU25-21348, https://doi.org/10.5194/egusphere-egu25-21348, 2025.

EGU25-21671 | Posters on site | OS1.5

Interannual Variability of Chlorophyll Concentrations in the Arabian Sea 

Skandh Joshi and Subra Prakash Dey

Chlorophyll concentrations in the ocean exhibit significant spatial and temporal variability, driven by a complex interplay of physical, chemical, and biological factors. Seasonal changes are primarily influenced by variations in light availability, temperature, and nutrient supply, while interannual fluctuations are often linked to large-scale climate phenomena such as the El Niño-Southern Oscillation (ENSO) and the Indian Ocean Dipole (IOD). These variations have profound implications for oceanic primary productivity, marine ecosystems, and global biogeochemical cycles. The Arabian Sea, one of the most productive regions of the global ocean, experiences high biological productivity due to seasonal upwelling driven by the Southwest Monsoon and winter convective mixing. Upwelling brings nutrient-rich deep waters to the surface, stimulating phytoplankton growth and increasing chlorophyll concentrations, which in turn support a diverse marine ecosystem and economically significant fisheries. In our study, we analysed monthly and seasonal climatologies of chlorophyll(mg/m3) in the Arabian Sea, examining anomalies over a 24-year period (1998–2021). Our results revealed significant interannual variability, with notable peaks and dips in chlorophyll anomalies. For instance, anomalies exceeded a deviation from the climatological mean by 0.2 in 2005 but dropped as low as -0.2 in 2016. By analysing the standard deviation of log-transformed chlorophyll-a anomalies, we identified five regions exhibiting the highest variability. Further investigation into these regions revealed distinct patterns in upwelling dynamics across different years and seasons, emphasizing the diverse factors influencing upwelling processes in the Arabian Sea. Focusing on the western coast of India, we observed contrasting climatic behaviours between the northern and southern regions. In the northern part, wind anomalies did not directly correspond to chlorophyll anomalies, indicating a more complex interplay of factors. Conversely, in the southern region, a strong correlation between chlorophyll and wind anomalies suggests a dominant wind-driven upwelling mechanism. These findings enhance our understanding of the regional variability in upwelling processes and highlight the intricate interactions between oceanic and atmospheric drivers in this dynamic marine system. Our study provides valuable insights into the variability of chlorophyll concentrations in the Arabian Sea, offering a better understanding of its ecological and climatic significance. These findings contribute to improved modelling and prediction of primary productivity, which is crucial for both ecosystem management and climate studies.

How to cite: Joshi, S. and Prakash Dey, S.: Interannual Variability of Chlorophyll Concentrations in the Arabian Sea, EGU General Assembly 2025, Vienna, Austria, 27 Apr–2 May 2025, EGU25-21671, https://doi.org/10.5194/egusphere-egu25-21671, 2025.

EGU25-2063 | Posters on site | ERE1.3

Salt weathering of coastal stone heritage in Mykonos, Greece 

Luigi Germinario and Claudio Mazzoli

One of the most critical challenges for preserving and protecting historical built heritage in coastal regions is the comprehension of the interaction between building materials and seawater or sea spray and its effects in time. This contribution addresses the forms and dynamics of sea salt weathering by considering as case study Mykonos Castle in Greece, built from the 13th century and now surviving only in its towers, churches, and stone walls, being just a few meters away from the shore or even underwater. The fieldwork and preliminary laboratory activities were arranged for investigating the petrographic characteristics and decay patterns of the main building stones (gneisses, marbles, granitoids, etc.), their in-pore salt content constrained by orientation, height, and distance from the sea, and rate and amount of their surface erosion monitored on site. The findings are expected to help assessing the vulnerability of cultural heritage in coastal regions due to changing environmental stresses, also in view of climate change.


Acknowledgements

This study is carried out within the project THETIDA, which has received funding from the European Union's Horizon Europe scheme under the program Culture, Creativity and Inclusive Society (grant agreement no. 101095253).

How to cite: Germinario, L. and Mazzoli, C.: Salt weathering of coastal stone heritage in Mykonos, Greece, EGU General Assembly 2025, Vienna, Austria, 27 Apr–2 May 2025, EGU25-2063, https://doi.org/10.5194/egusphere-egu25-2063, 2025.

EGU25-3685 | Posters on site | ERE1.3

An assessment of GO addition to an NHL binder 

Enrico Garbin, Matteo Panizza, Maria Chiara Dalconi, Luca Nodari, Codrut Costinas, Lucian Baia, Liviu Cosmin Coteţ, and Patrizia Tomasin

Natural Hydraulic Lime (NHL) binders are generally preferred to those cement-based in case of restoration works, thanks to their good compatibility with historical substrates. Moreover, they can be considered more sustainable in comparison to cement, being sintered at lower temperatures. Nonetheless, while having a good compatibility with historic substrates, their performance might need improvement in terms of strength values and strength development without sensibly affecting their stiffness.
To this purpose, the incorporation of Graphene Oxide (GO) was considered, due to the beneficial effects showed by studies on cementitious binders. This work presents the characterization of NHL pastes (i.e. without aggregates) prepared with a water-to-binder ratio of 0.5 and 3 different dosages of GO retrieved from literature about cement and concrete, namely 0.01%, 0.06% and 0.12% by weight of NHL dry powder.
The NHL powder and the reacted binder were characterized via X-ray Powder Diffraction (XRD) and Scanning Electron Microscopy (SEM). From a mechanical standpoint, indirect tensile and compressive strengths were tested at 28 and 84 days of age, while stiffness was assessed via Ultrasonic Pulse Velocity (UPV) at 7, 14 and 28 days of age.
Preliminary results showed a minor strength improvement, which was more apparent at 84 days of age, with no remarkable modification of the stiffness. Results also indicates that it might be worth testing possible greater dosages of GO.

How to cite: Garbin, E., Panizza, M., Dalconi, M. C., Nodari, L., Costinas, C., Baia, L., Coteţ, L. C., and Tomasin, P.: An assessment of GO addition to an NHL binder, EGU General Assembly 2025, Vienna, Austria, 27 Apr–2 May 2025, EGU25-3685, https://doi.org/10.5194/egusphere-egu25-3685, 2025.

EGU25-4351 | Posters on site | ERE1.3

A multi-analytical approach to assess potential damaged areas on the building materials of monumental structures. 

Giuseppe Casula, Silvana Fais, Maria Giovanna Bianchi, and Paola Ligas

The integrated studies within the field of non-invasive diagnostics for the characterization of the state of conservation of stone building materials of monuments have the common target to meet the current and future needs of society in the field of cultural heritage. The conservation of the built heritage requires many interventions aimed at analyzing the state of health of the monuments, their preventive preservation, reconstruction, and restoration. All actions and diagnostic analyses should respect the historical significance of the investigated monuments and the physical properties of the materials that make up the cultural heritage structures. In this context, the use of non-invasive diagnostic techniques of various nature (e.g. terrestrial laser scanner (TLS), digital photogrammetry, acoustic, electrical) plays a role of fundamental importance both in the preventive preservation and in the monitoring of monumental structures over time. In fact, the use of such techniques is also particularly effective in controlling the effectiveness of restoration interventions.

In this study we have examined different architectural elements (walls and semi-columns) of the Basilica of San Saturnino relevant monument in the historical centre of the town of Cagliari (Italy). The analysis has been carried out by different geomatic (TLS and digital photogrammetry) and geophysical (acoustics and electrical) techniques. The combined application of digital photogrammetry and terrestrial laser scanning can provide high-resolution 3D models calibrated and textured with both reflectance and natural colours useful for evaluating the state of conservation of surface materials and for rationally planning further geophysical analyses, particularly the acoustic ones carried out with tomographic methods. In this study the acoustic techniques applied in the ultrasonic range have been used essentially in two modes, namely: surface and transmission. The obtained 2D models adequately describe the longitudinal velocity distribution both on the shallow parts of the investigated old walls and on the internal section of different architectural elements (semi-columns) showing the influence of the variation of intrinsic rock properties on the ultrasonic longitudinal wave propagation. The electrical resistivity data acquired on the surface of the old walls have allowed to depict the resistivity distribution on the wall surface. Electrical resistivity is a physical property of a rock that characterizes its conductive properties. For porous media such as the building carbonate rocks under study, the electrical resistivity depends on many physical properties (i.e., internal structure, water content, fluid composition and porosity) and together with the elastic properties can be useful to interpret the various properties of the investigated materials and their conservation state. In conclusion, the non-invasive techniques applied in this study can effectively aid the restoration of the building materials at Basilica di San Saturnino, Cagliari, Italy. This study confirms how each technique gave a range of different information to the restorers, and the interventions that can be undertaken in light of the acquired knowledge of the investigated monument.


Acknowledgements: The authors would like to thank the Ministero della Cultura- DIREZIONE GENERALE MUSEI - DIREZIONE REGIONALE MUSEI SARDEGNA (ITALY) for their kind permission to work on the San Saturnino Basilica (Cagliari – Italy).

How to cite: Casula, G., Fais, S., Bianchi, M. G., and Ligas, P.: A multi-analytical approach to assess potential damaged areas on the building materials of monumental structures., EGU General Assembly 2025, Vienna, Austria, 27 Apr–2 May 2025, EGU25-4351, https://doi.org/10.5194/egusphere-egu25-4351, 2025.

EGU25-8054 | Orals | ERE1.3

 The fight against shoreline erosion along the coast of the second marine station of Wimereux (France), 1899-1942 

François G. Schmitt, Virginie Gaullier, Emmanuel Blaise, and Olivier Cohen
The second marine station in Wimereux, called the Alfred Giard Zoological Station, was built at the Pointe-aux-Oies, between Wimereux and Ambleteuse (North of France), in 1899. The construction was carried out in a dune field, very close to the sea. Attached to the Sorbonne University (Paris), the station was in operation for almost 40 years, under the direction of Alfred Giard, then after his death in 1908, under the direction of Maurice Caullery. As the latter explains in his memoirs, very quickly it was necessary to build a dike to protect the building from marine erosion. Throughout the beginning of the XXth century the laboratory developed, with the construction of extensions to the building, an access ramp for a boat, and several protective dikes, including one, built by Maurice Lonquéty, who left the river mouth of the Slack at Ambleteuse 4 km North, and joined the station. In 1942 the station was destroyed by the German army.
Using archives, historical sources and old photographs, we retrace the history of this station and its fight agains marine shoreline erosion. Old airborne photographs allow the position of the station to be precisely located for the first time on modern maps, showing that it was located on what is now the foreshore, due to coastal erosion at this location. Stakes in the sand, pieces of dykes and a remains of the Lonquéty dike are still visible on the foreshore.

The lithological nature of the bedrock helps explain this differential erosion, the position of the station being on a loose area while a few hundred meters further south, the construction on the base of the Pointe-aux-Oies would have allowed the building to be protected from erosion.

How to cite: Schmitt, F. G., Gaullier, V., Blaise, E., and Cohen, O.:  The fight against shoreline erosion along the coast of the second marine station of Wimereux (France), 1899-1942, EGU General Assembly 2025, Vienna, Austria, 27 Apr–2 May 2025, EGU25-8054, https://doi.org/10.5194/egusphere-egu25-8054, 2025.

EGU25-8233 | ECS | Orals | ERE1.3

Lead Dynamics in Black Crusts: Elemental Distribution and Mobility Analysis in Lede Stone from Antwerp, Belgium 

Sofia Deboli, Jean-Marc Baele, Alessandra Bonazza, Thibaut Van Acker, Frank Vanhaecke, Katrin Wilhelm, and Tim De Kock

Black crusts commonly form on historic buildings as a result of interactions between building materials and atmospheric pollutants. These crusts primarily consist of gypsum layers that develop on calcium-rich surfaces through sulfation processes, especially in urban environments with elevated atmospheric contaminants. Moreover, black crusts accumulate particulate matter, polyaromatic hydrocarbons, and heavy metals such as lead (Pb), largely originating from anthropogenic activities like vehicular emissions, coal combustion, and industrial operations. Acting as passive environmental samplers, these crusts offer valuable insight into urban pollution trends.

Although the water-soluble components of black crusts, such as Ca²⁺, Mg²⁺, Na⁺, and SO₄²⁻, have been extensively studied, the understanding of trace elements, particularly Pb, remains incomplete, especially regarding their behavior and mobility. This study aims to fill this gap by examining Pb distribution, availability, and interactions within black crusts and the underlying stone substrates. Samples collected from historical buildings in Antwerp were analyzed using a multi-technique approach. SEM-EDX was employed for initial chemical and morphological characterization, while LA-ICP-TOF-MS enabled the generation of high-resolution quantitative elemental distribution maps for major, minor, and trace elements. Depth-resolved analysis of Pb migration was further explored through portable LIBS, contributing to a deeper understanding of crust stratigraphy and pollutant dynamics.

Preliminary findings indicate that Pb is predominantly concentrated in the outermost layers of the black crust. Given the crust’s primary composition of gypsum, a sulfate mineral, it is hypothesized that Pb is sequestered as lead sulfates, contributing to its immobilization within the crust. However, this contrasts with existing literature, which highlights Pb’s stronger affinity for carbonate phases, suggesting a tendency for it to migrate into carbonate layers and potentially into the underlying stone substrate. The confinement of Pb within the crust deviates from expected behavior, raising important questions about its speciation. Understanding the conditions under which Pb could become mobile is crucial, with factors such as kinetic limitations, local pH variations, and environmental conditions like humidity and wet-dry cycles likely influencing its migration.

This research investigates the behavior of Pb within black crusts, aiming to advance the conservation of historic buildings while addressing the public health risks associated with urban lead exposure. By examining the factors influencing Pb mobility, the study seeks to inform the development of targeted mitigation strategies for lead contamination. The expected outcomes will not only contribute to the long-term preservation of cultural heritage but also enhance urban environmental safety, providing critical insights that bridge the fields of heritage conservation and public health.

How to cite: Deboli, S., Baele, J.-M., Bonazza, A., Van Acker, T., Vanhaecke, F., Wilhelm, K., and De Kock, T.: Lead Dynamics in Black Crusts: Elemental Distribution and Mobility Analysis in Lede Stone from Antwerp, Belgium, EGU General Assembly 2025, Vienna, Austria, 27 Apr–2 May 2025, EGU25-8233, https://doi.org/10.5194/egusphere-egu25-8233, 2025.

EGU25-9102 | ECS | Posters on site | ERE1.3

Expert Insights on Integrating Vertical Greening Systems into Historic Buildings: Survey Findings 

Eda Kale, Marie De Groeve, Yonca Erkan, and Tim De Kock

Integrating vertical greening systems (VGS) into historic buildings presents both advantages and challenges related to heritage conservation and urban sustainability. VGS contribute environmental benefits, such as reducing surface temperatures, improving air quality, and supporting biodiversity. However, their implementation raises concerns about potential risks to architectural integrity and cultural heritage.

This study explores expert perspectives on the implementation of VGS in historic buildings, focusing on the environmental, cultural, social, economic, legal, and technical aspects. Using a mixed-methods approach, the research combines insights from a literature review with survey data gathered from experts in vertical greening and heritage conservation. Both open-ended and closed-ended responses were analyzed to identify variations in expert opinions.

The findings reveal a general recognition of the environmental benefits of VGS; however, significant technical and cultural concerns present obstacles to widespread adoption. The results emphasize the need for increased awareness and structured information for stakeholders to promote a balanced approach that maximizes the advantages of VGS while addressing the challenges associated with historic architecture.

How to cite: Kale, E., De Groeve, M., Erkan, Y., and De Kock, T.: Expert Insights on Integrating Vertical Greening Systems into Historic Buildings: Survey Findings, EGU General Assembly 2025, Vienna, Austria, 27 Apr–2 May 2025, EGU25-9102, https://doi.org/10.5194/egusphere-egu25-9102, 2025.

Moisture has an important and essential role in the transportation of salts in masonry structures, therefore understanding the changes in moisture content provides valuable insights into the diagnostics of historic buildings, namely allowing the prediction of salt weathering. In this study, the thick walls of a fortress were studied. The Citadella is a landmark historic building in Budapest, that was built from Miocene porous limestone in the middle of the 19th century. Besides external cladding with porous limestone, the cores of the walls also contain volcanic tuffs. The walls are high (12-16 m) and their thickness is more than 1.5 m, which makes it difficult to record the moisture distribution. The sources of water are partly linked to direct precipitation on the wall surface or from capillary rise from pavement surfaces and from the soil. To assess the moisture distribution and salt content both on-site and laboratory analyses were performed during the dry summer period and wet autumn period. Not only the wall surfaces but also the subsurface zones and wall interiors were studied. Dry drillings were made to assess the in-depth moisture profile and salt content. Using an on-site moisture test it was possible to identify the moist and water-saturated zones of the ashlars and renders. Salt content and composition were measured on drilled dust samples and small samples obtained from the wall surface. Optical microscopy, XRF and XRD and Thermogravimetric analyses allowed the identification of salts. According to laboratory tests, the major salts responsible for the damage of external walls are gypsum, halite and hygroscopic nitric salts. The salt distribution within the depth shows seasonal variations. It was possible to detect the moisture distribution and salt content changes in depth and along vertical profiles. The results of the current research can be used to understand the moisture and salt distribution in thick natural stone walls and help in the diagnostics of historic structures and evaluate the salt weathering processes under various climate conditions.

How to cite: Kis, A. and Török, Á.: Seasonal changes of moisture and salt content of historic porous limestone walls; obtained form surface measurements and depth profiles, EGU General Assembly 2025, Vienna, Austria, 27 Apr–2 May 2025, EGU25-9492, https://doi.org/10.5194/egusphere-egu25-9492, 2025.

EGU25-9880 | Orals | ERE1.3

„Alabaster from Lagny“, myth or reality? 

Wolfram Kloppmann, Undine Dömling, Lise Leroux, and Aleksandra Lipińska

Gypsum alabaster is one of the most prominent stones used in European sculpture in medieval and early modern times. Many historical quarries are documented through textual and material evidence (Lipińska, in press) but some remain enigmatic. The “albâtre de Lagny”, a town situated on the banks of the River Marne in the eastern suburbs of Paris, has been mentioned throughout the 19th century as source for sculpture, notably for the numerous altarpieces now known as English production. This is in obvious contradiction to what 20th century research found out about the workshops in and around Nottingham using local material. The systematic reference to Lagny, invalidated by material fingerprinting for those and numerous other sculptures, has discredited these earlier sources. It has even been questioned if the gypsum quarried along the Marne River has ever been used for sculpture and the Lagny alabaster was qualified as legend (Bresc-Bautier, 2018; Jugie et al., 2024).

The discovery of an unpublished manuscript, preserved at the Museum of Natural History (MNHN) in Paris, written by one of the most prominent figures of political, legal and scientific life of the late 18th century, Chrétien Guillaume de Lamoignon de Malesherbes (1721-1794) , sheds a new light on this deposit. Lamoignon provides a detailed description of an alabaster-grade layer in the gypsum quarries of Thorigny, north of Lagny, based on his personal observations and interviews with the workers, a precise stratigraphy, and a list of collected samples. He also visited a workshop in the very centre of Paris using the “Lagny alabaster”, at this time undoubtedly for decorative objects rather than for figurative sculpture. The timeframe for this manuscript is  still uncertain, we can situate it between the French translation of the “Lithogeognosia” of Pott in 1753, the 1759 alabaster essay of Daubenton, both cited by Lamoignon, and his death on the guillotine in 1794.

After transcribing the manuscript and precisely locating the historical quarry, we investigated French collections of geological reference materials and found indeed samples of “Lagny alabaster” from the 19th and early 20th century at the MNHN and the BRGM. We are currently completing our corpus of isotope fingerprints of this deposit (Kloppmann et al., 2017), so far based on a single sample provided by the Laboratory of Historical Monuments (LRMH), to better constrain its use for artwork, eventually back beyond the mid-18th century.

The Materi-A-Net project is supported by the Franco-German FRAL program (ANR-21-FRAL-0014-01 and DFG 469987104) (https://materi-a-net.uni-koeln.de/en/the-project/)

Bresc-Bautier G. (2018) La sculpture en albâtre dans la France du XVIe siècle. Revue de l’Art, 200/2018-2, 37-45.

Jugie S., Leroux L., et al. (2024) L’albâtre et ses sources : incertitudes historiques et ambiguïtés de la documentation levées grâce aux analyses. Technè, 57, 49-59.

Kloppmann W., Leroux L., et al. (2017) Competing English, Spanish, and French alabaster trade in Europe over five centuries as evidenced by isotope fingerprinting. Proceedings of the National Academy of Sciences, 114, 11856–11860.

Lipińska A. (in press) Alabaster. Studies in Material Meaning(s), Studies in Art and Materiality, Leyde, Boston: Brill.

How to cite: Kloppmann, W., Dömling, U., Leroux, L., and Lipińska, A.: „Alabaster from Lagny“, myth or reality?, EGU General Assembly 2025, Vienna, Austria, 27 Apr–2 May 2025, EGU25-9880, https://doi.org/10.5194/egusphere-egu25-9880, 2025.

One of the most visited historical sites of Budapest is the Heroes’ Square, where a 36 m high Corinthian-style stone column forms part of the Millennium Monument. On the top of the column, a bronze statue depicting Archangel Gabriel is visible. The monument was inaugurated in 1901. The stone column consists of ring-shaped limestone segments (drums). In the conical shape, the drums have a diameter of 2.25  at the lower part of the column, which reduces to 1.9 m at the top. Each drum is 0.5 m high. The condition of the stone column has aggravated in the past 120 years and the current research provides an overview of the actual condition of the stone elements and gives some hints on the preservation of the bronze statue. Tests included the on-site identification of major lithotypes, and testing surface strength and weathering grade using a Schmidt hammer. The moisture distribution was detected using a portable moisture meter. Small samples were collected for laboratory analyses and oriented samples were taken representing the north, east, south and west directions, with different exposure to sun and precipitation, representing different micro-climates. Textural analyses of samples were made by using optical microscopy and SEM-BSE, while mineralogical composition and elemental analyses were performed using XRF and thermogravimetric analyses. The prevailing lithotype is Pleistocene travertine with some textural varieties. The most common weathering forms are black crusts, dissolution features, and green staining of the stone surface from dissolved bronze. The composition of weathering crusts differs from the orientation, namely wind and rain-exposed parts have a different composition than the sheltered ones. The stability of the column was also analyzed. During structural analyses, a minor amount of cracks were also recognized. Loss of renders and dissolution of the stone surface can also cause problems. The study provides an example of integrated research of material properties and structural stability of historic stone structures.

How to cite: Török, Á. and Kis, A.: Diagnostics and preparation of restoration works of a 36 m high stone column holding a giant bronze statue, EGU General Assembly 2025, Vienna, Austria, 27 Apr–2 May 2025, EGU25-10376, https://doi.org/10.5194/egusphere-egu25-10376, 2025.

The present study investigated the relationship between the Salt Weathering Index (SSI) (Yu & Oguchi, 2010) and WAC, which is one of the methods used to evaluate the physical properties of stone, using various salt weathering experiments on building stones and artificial stones. The stone types studied were tuff (Oya stone, Towada stone, Ashino stone, Nikka stone, Tatsuyama stone), granite (Makabe stone), sandstone (Tago stone, Indian sandstone), porous rhyolite (Koga stone), and brick. Of these, 10 types of bricks, both homemade and commercial, were used. As a result, there was a rough correlation between SSI and WAC, and the multiple linear approximation had the highest coefficient of determination. The reason for the variation in the approximation formula is the difference in rock structure. In other words, for porous rhyolite and some bricks, which were probably fired at high temperatures, the WAC value was higher than the SSI value, whereas, for sandstone and dense tuff which were formed at low temperatures, the WAC value tended to be lower. In addition, the highest coefficient of determination between the rate of dry weight loss (DWL) and the SSI was obtained in the salt weathering experiment using a total immersion method with Na2SO4, MgSO4, and Na2CO3 solutions. This is probably because the MgSO4 solution has the highest viscosity and crystallization occurs in the deeper layers, which flake off on re-immersion. For Na2SO4, the coefficient of determination is high, except for the Tago sandstone. Although the reason for this is unclear, it is considered that the Na2SO4 precipitated dissolved before it had time to grow sufficiently. In the case of Na2CO3, the DWL is high in the Indian sandstone, but this is thought to be because the quartz that makes up the sandstone dissolved in the alkaline solution.

How to cite: Oguchi, C.: Salt Susceptibility Index for various building stones and their practical durability, EGU General Assembly 2025, Vienna, Austria, 27 Apr–2 May 2025, EGU25-12344, https://doi.org/10.5194/egusphere-egu25-12344, 2025.

EGU25-12731 | Posters on site | ERE1.3

Improving the sustainability of lime mortars by reusing cow hair 

Eduardo Molina-Piernas, María Jesús Pacheco-Orellana, Javier Martínez-López, Salvador Domínguez-Bella, and Ángel Sánchez-Bellón

In many countries, construction, agriculture and livestock sectors produce and emit a large amount of waste and greenhouse gases, accelerating the climate change. For that, new trends and policies for waste management are required due to the high and constant demand for natural resources. The recent activities framed in the green economy are favouring the reuse and recycling of many waste products, in the so-called “Zero Waste” initiatives to reduce the carbon footprint, as well as to the reduction of associated energy expenditure. Among these waste products, those linked to animal by-products not intended for human consumption are usually incinerated for their elimination in Spain, contributing to the emission of CO2. Consequently, new initiatives are required to promote the reuse of this waste, such as in the development of more sustainable construction products. This paper presents the new results of the SoSCal Project, comparing sets of lime mortar with a proportion of cow hair of 0%, 0.5%, 1%, 2%, 5%, 10% and 12% in weight per kilo of mortar. Some of the advances achieved are that, regardless of the amount of hair added, no cracking process has been observed and the amount of water required can be reduced by 5%, so that extrapolation to larger production quantities would result in significant savings. Although it is necessary to carry out more tests since the workability is compromised, and therefore it will be important to find conditions according to the need for the applicability of the mortar. Another aspect is the increase in the resistance to crystallization of salts with respect to the mortar without fibres, although the durability has been greater in practically all cases, regardless of the quantity of fibres. The addition of hair has affected the thermal properties, specifically the heat transmissivity through the samples, showing a direct relationship between the percentage of added hair and this parameter. The maximum recorded temperatures differed by almost 8°C between the samples without fibres (0%) and those containing 12% of hair after one hour of heating, with the latter also cooling down much faster due to the higher hair content. Based on the results obtained, the addition of animal fibres is showing very positive results compared to the reference mortar. Thus, enhancing the properties of a traditional product, such as lime, compared to Portland cement will also have a very positive effect, since it could reduce the production of this type of cement by having other options, which would also imply reducing the emission of CO2 into the atmosphere. However, it is necessary to continue with the tests already started and to carry out other tests, especially mechanical and weathering durability tests to evaluate its performance.


Acknowledgements: This study was financially supported by the Research Project TED2021-132417A-I00 funded by MCIN/AEI /10.13039/501100011033 and by the European Union NextGenerationEU/ PRTR

How to cite: Molina-Piernas, E., Pacheco-Orellana, M. J., Martínez-López, J., Domínguez-Bella, S., and Sánchez-Bellón, Á.: Improving the sustainability of lime mortars by reusing cow hair, EGU General Assembly 2025, Vienna, Austria, 27 Apr–2 May 2025, EGU25-12731, https://doi.org/10.5194/egusphere-egu25-12731, 2025.

EGU25-13034 | ECS | Orals | ERE1.3

Exploring Daylight Optimization Policies in the Conservation and Restoration of Historical Buildings in Belgium 

Nurefşan Sönmez, Arzu Cılasun Kunduracı, and Yonca Erkan

Daylight is crucial for providing visual comfort, supporting well-being, and creating an energy-efficient environment. However, its integration into historical building conservation remains a vital yet underexplored area, requiring a delicate balance between improving occupant comfort and preserving the historical significance of these buildings.
This research investigates how daylight use is addressed in conservation policies and regulations within Belgium, with a focus on the Flanders region. The study employs a mixed-method approach, combining interviews with professionals in architecture, conservation, and built heritage with a comprehensive review of existing national, regional, and local regulations. These methods aim to evaluate the adequacy of current policies and explore opportunities for improvement.
Key questions addressed include: Which regulations and guidelines govern daylight considerations in restoration efforts? What are the most frequently altered building elements during restoration, and how does daylight integration factor into these changes? Additionally, the study probes the balance between preserving historical authenticity and adapting buildings for contemporary use, assessing whether local policies adequately support this equilibrium.
Findings reveal that while daylight optimization is increasingly recognized as essential for improving occupant comfort, energy efficiency, and the functionality of re-functioned historical buildings, its integration into conservation policies requires greater emphasis. The research highlights the need for interdisciplinary collaboration, such as architects and heritage conservationists working with environmental scientists to design innovative daylighting systems, alongside the development of more comprehensive daylight guidelines aligned with the unique requirements of historical buildings.
By exploring potential improvements to existing policies, this study aims to contribute to a more holistic approach to the restoration of historical buildings, ensuring that they remain both culturally significant and sustainably functional in modern contexts.

How to cite: Sönmez, N., Cılasun Kunduracı, A., and Erkan, Y.: Exploring Daylight Optimization Policies in the Conservation and Restoration of Historical Buildings in Belgium, EGU General Assembly 2025, Vienna, Austria, 27 Apr–2 May 2025, EGU25-13034, https://doi.org/10.5194/egusphere-egu25-13034, 2025.

Marine geology is a relatively young discipline compared to the research conducted on land. In France, while the first draft of a geological map dates back to the 18th century (Guettard, 1746), it wasn't until 1980 that marine data on the metropolitan continental margins were integrated into the geological map at a 1/1,500,000 scale, published by the BRGM. Jean-Étienne Guettard, a physician, botanist, and mineralogist, and a friend of Lavoisier, already had the remarkable intuition of a continuity in geological formations across the English Channel. In 1917, Stanilas Meunier, in his "Geological History of the Sea," boldly claimed that the science of marine geology had French origins.

For a long time, the progress of marine geology was constrained by the barrier of the water column. Therefore, initial information about fossil seas came from land-based studies. In Northern France, particularly along the Boulonnais coast, pioneering work was carried out by Pierre Pruvost (1921, 1924) and Auguste-Pierre Dutertre, the latter writing in 1925 a geological report on Pointe aux Oies and the vicinity of the Wimereux Zoological Station in the Glanures Biologiques, published on the occasion of the Station’s fiftieth anniversary (1874-1924).

Louis Dangeard, one of the great pioneers of French marine geology, was the first in the world to publish a thesis in 1928 on a submarine basin, specifically that of the English Channel, after spending 7 consecutive years (1922-1928) aboard the prestigious research vessel “Pourquoi pas ?” under Captain Jean Charcot. Subsequently, in 1933, he succeeded in forming a team of researchers and students to establish the Marine Geology Center of Caen. In France, the first sheets of the sedimentological underwater map of the Atlantic continental shelf of France at a 1/100,000 scale were published in 1968 by the National Geographic Institute, with a remarkable contribution from Louis Dangeard’s former students: Jacques Bourcart and André Guilcher, along with Gilbert Boillot, Pierre Hommeril, Félix Hinschberger, Pierre Giresse, and Claude Larsonneur, working on state thesis topics focusing on the English Channel.

Subsequent work would be closely tied to technological advancements in marine tools, particularly geophysics, after the first oceanographic expeditions of the N/O Challenger (1872-1877). Using archives and historical sources, we trace here the evolution of marine geological cartography, a brief history of oceanographic vessels, and the exploration tools that gradually shaped the tectono-sedimentary understanding of the English Channel.

How to cite: Gaullier, V.: Birth and Evolution of Marine Geological Cartography: Contribution to the Tectono-Sedimentary Understanding of the English Channel, EGU General Assembly 2025, Vienna, Austria, 27 Apr–2 May 2025, EGU25-15133, https://doi.org/10.5194/egusphere-egu25-15133, 2025.

EGU25-15240 | ECS | Orals | ERE1.3

Implications of green façades on historic building materials 

Marie De Groeve, Eda Kale, Scott Allan Orr, and Tim De Kock

Cities are increasingly implementing nature-based solutions (NbS) to mitigate current climate stressors in urban environments, e.g. elevated temperatures and air pollutions levels. Among NbS, ground-based green façades are well-known for their ability to cover a large surface area of vegetation while using minimal ground space. This green initiative consists of climbing plants growing along a vertical surface by either attaching themselves to the surface or using a climbing aid.

Despite the proven benefits of green façades, historic buildings, crucial components of urban environments, are often neglected in urban mitigation strategies. Concerns about potential adverse effects of greening on materials durability and structural integrity, which is currently poorly understood, have limited their implementation on historic buildings. Our research aims to understand the impact of green façades on the degradation processes of historic building materials to unlock the co-benefits of greening built heritage and to explore the potential of green façades as a preventive conservation method.

To achieve this, we analyse the interaction of green initiatives and stone-built heritage in both outdoor and controlled environments. Case studies conducted in the historic city centre of Antwerp (Belgium) over the past two years provided valuable insights on how green façades have an impact on the local microclimate. Monitoring a wide range of environmental parameters, relevant for common degradation processes of built heritage, e.g. surface and air temperature, solar irradiation,  moisture content, amount of wind-driven rain and relative humidity, enables an understanding of the mechanisms of green façades responsible for changes in the local microclimate and identifies the key extrinsic and intrinsic factors affecting the effectiveness of this greenery.  

Our findings highlight the potential of green façades to reduce the risk of common degradation processes affecting built heritage. Green façades significantly reduces solar irradiation and moisture accumulation on wall surfaces, thereby lowering the risk of biodeterioration. It also lowers the maximum surface temperatures by providing shade and tempers the relative humidity fluctuations. This buffering effect reduces the likelihood of salt crystallisation, most common during summer. In winter, evergreen vegetation enhances resistance to freeze-thaw cycles by maintaining higher minimum surface temperatures through thermal blanketing and reducing moisture accumulation on wall surfaces.

This research provides valuable insights into the potential of green façades as a sustainable and preventive conservation method for stone-built heritage. By buffering environmental conditions at the wall surface, green façades can unlock co-benefits: improving urban environments while enhancing the durability of historic building materials. A deeper understanding of the behaviour of green façades on the degradation of historic building materials can support their implementation in urban environments, ensuring that stone-built heritage becomes more resilient to current and future climate challenges.  

How to cite: De Groeve, M., Kale, E., Orr, S. A., and De Kock, T.: Implications of green façades on historic building materials, EGU General Assembly 2025, Vienna, Austria, 27 Apr–2 May 2025, EGU25-15240, https://doi.org/10.5194/egusphere-egu25-15240, 2025.

EGU25-16284 | Posters on site | ERE1.3

Comparative analysis of digital markers in photogrammetry and laser scanning for documentation of archeological immovable monuments 

Lyubka Pashova, Ivan Lirkov, Miglena Raykovska, Nikolay Petkov, Pavel Georgiev, Kristen Jones, Hristina Kabadzhova, Georgi Evtimov, Georgi Vasilev, Stanislav Harizanov, and Milen Borisov

Advances in the accessibility of surveying and geoscience tools and developments in computer science have led to significant growth and rapid developments in the efficiency and accuracy of heritage documentation practices from objects to entire buildings and complexes. Modern cultural heritage research relies heavily on producing accurate 3D models using digital documentation methods such as photogrammetry and laser scanning. Innovative approaches to 3D documentation through digital photogrammetry and laser scanning provide the opportunity to create digital twins of real cultural heritage monuments. For these digital twins to be relatable to the real world for quantitative analysis, they must be scaled and oriented in some way. The most common method for accurately scaling 3D models is through the use of markers. Markers ensure accurate spatial measurements by linking coordinates in the model to real-world coordinates. These markers help in image orientation, calibration, and 3D reconstruction. Despite their common use, currently, there is no set of designed markers that can be universally used across various modeling methods and software. The present investigation aims to identify different types of markers used for commercial and research purposes, comparing and contrasting their type, accuracy, and suitability for specific applications. Based on an evaluation of existing software solutions and indicators through laboratory tests, the qualities of markers will be analyzed and evaluated to facilitate precise 3D modeling and improve the reliability of data collected through photogrammetry and laser scanning. The effectiveness of markers will be analyzed through comparative studies investigating how different configurations and types of markers affect the overall accuracy and effectiveness of reconstructed 3D models of photographed objects. The findings are intended to provide insight into best practices for selecting and implementing markers in archaeological surveys, contributing to more accurate and reliable results from modeling, creating newly developed innovative markers, and allowing broader applicability for precise 3D modeling of photographed national cultural heritage sites.

Acknowledgments: The authors would like to thank the Bulgarian National Science Fund for funding the research under the project  "An integral approach in creating digital twins of archeological immovable monuments using innovative technologies", contract КP-06-Н82/1 - 06.12.2024.

How to cite: Pashova, L., Lirkov, I., Raykovska, M., Petkov, N., Georgiev, P., Jones, K., Kabadzhova, H., Evtimov, G., Vasilev, G., Harizanov, S., and Borisov, M.: Comparative analysis of digital markers in photogrammetry and laser scanning for documentation of archeological immovable monuments, EGU General Assembly 2025, Vienna, Austria, 27 Apr–2 May 2025, EGU25-16284, https://doi.org/10.5194/egusphere-egu25-16284, 2025.

EGU25-17798 | Posters on site | ERE1.3

Preliminary proposal for an experimental method to measure erosion susceptibility of heritage stones 

Javier Martínez-Martínez, Edgar Berrezueta, David Benavente, and Timea Kóvacs

Rock erodibility is an intrinsic property defined as the vulnerability of a rock to erosion (Martínez-Martínez et al., 2024; doi: 10.1201/9781003429234-177). Intuitively, erodibility is a key concept in cultural heritage conservation, especially in studies concerning the exposure of building materials to wind, rain, hail, and human activity. However, research on its implications for heritage conservation remains scarce.

Abrasion resistance of rocks is a property routinely measured in geomechanical laboratories and it offers a practical approach to assessing the erosion susceptibility of the material. Two standardized methods, the Böhme abrasion test and the Wide Wheel Abrasion test, are widely used to evaluate abrasion resistance in dimension stones. However, these methods require both large and numerous samples, rendering them unsuitable for cultural heritage studies, where sampling is severely limited. To overcome this limitation, a modified version of the Böhme abrasion test is proposed. This adaption uses a plate grinding machine commonly employed for preparing rock thin sections, making the procedure widely accessible in geoscience laboratories.

The standardized Böhme Abrasion test requires cubic samples of 71 mm size, place on a grinding plate and subjected to an abrasive load of 294N for 16 cycles of 22 turns each. Wear is calculated from the loss in volume and weight. In contrast, the modified procedure uses smaller prismatic samples (20×30×30 mm) and a plate grinding machine operating at 30 cycles per minute under a load of 0.02 N/mm². Sample dimensions and weight are measured at the beginning of the test. Each sample is abraded for 15 minutes on two perpendicular surfaces, and the final dried weight is recorded (Martínez-Martínez et al., 2017; doi: 10.1016/j.buildenv.2017.05.034). Material loss is quantified as the modified Böhme Abrasion Loss (mBAL), calculated using the equation

mBAL = ΔV = Δm/ρb

where ΔV is the volume loss (in mm3); Δm is the mass difference (in g); and ρb is the bulk density of the rock.

This modified procedure was validated using a variety of commercial dimension stones, including limestones, marbles, travertines, tuffs, calcarenites, calcirrudites, sandstones, quartzites and slates. Results where compared to those obtained with the standardized Wide Wheel Abrasion test on the same rock types. A strong correlation (R2=0.87) was observed between the two methods, expressed by the equation

mBAL = 8.9 Tww – 86.5

where Tww the wear trace measured in the Wide Wheel Abrasion Test.

This modified approach offers a viable solution for assessing erosion susceptibility in heritage contexts, enabling reliable quantification with minimal material requirements. It offers a valuable tool for developing effective conservation strategies for cultural heritage.

This work was supported by grant numbers PID2020-116896RB-C21 and PID2020-116896RB-C22 funded by MCIN/AEI/ 10.13039/501100011033

How to cite: Martínez-Martínez, J., Berrezueta, E., Benavente, D., and Kóvacs, T.: Preliminary proposal for an experimental method to measure erosion susceptibility of heritage stones, EGU General Assembly 2025, Vienna, Austria, 27 Apr–2 May 2025, EGU25-17798, https://doi.org/10.5194/egusphere-egu25-17798, 2025.

EGU25-18457 | ECS | Orals | ERE1.3

Climate-induced Risk Assessment of Library Collections within Dora I WWII Bunker in Trondheim, Norway 

Giulia Boccacci, Francesca Frasca, Chiara Bertolin, Tonje Dahlin Saeter, Erlend Lund, and Anna Maria Siani

Short- and long-term variability in indoor microclimate conditions within conservation spaces (museums, galleries, archives, and libraries) can exacerbate the risk of deterioration of cultural materials. Active microclimate control systems are often installed to stabilize thermo-hygrometric conditions, conversely, massive buildings with thick walls are less affected by outdoor conditions due to their high thermal inertia. Historic reinforced concrete structures, like bunkers and fortifications, are often windowless, further providing stable microclimate and protecting sensitive materials from photodegradation. World War II (WWII) bunkers often labeled as “dark” or “painful heritage”, were initially perceived only as symbols of war and occupation, leading to neglect and material deterioration over time. However, the impossibility of their demolition gradually encouraged interest towards their reuse, raising awareness of their social, historical, and economic potential. This contribution provides a comprehensive microclimate analysis to support management strategies in a unique case study: the NTNU (Norwegian University of Science and Technology) library for cellulose-based materials, hosted within “Dora I” WWII bunker in Trondheim, Norway (63.43° N 10.40° E). The archive spans 3700 m2 and contains around 5200 m3 of collections, including ancient volumes, journals, newspapers, and pictures. “Dora I”, a massive reinforced concrete German submarine and terrestrial fortification with 3.5 m-thick walls, covers a total area of approximately 16,000 m². 10 thermo-hygrometers compliant with European standards were installed, ensuring representativeness of indoor conditions across two floors. Time series of air temperature (T) and relative humidity (RH) are significantly longer (7 years, since 2018) than most studies in the literature, and are continuous and complete with minimal number of missing values. Statistical approaches from climatology are applied to analyse T-RH data, decomposing time series into short-term (daily/noise) and long-term (seasonal) variability (extracted by sinusoidal fits) to provide insights into indoor climate dynamics. A comprehensive conservation risk assessment, based on dose-response functions, evaluated biological and chemical threats to archival materials using both raw and filtered (i.e., “clean”) microclimate data. This approach allows to examine how anthropogenic factors (e.g., access and archival management) in the noisy signal may exacerbate climate-induced conservation risks. The findings demonstrate the exceptional features of this massive building, where peak summer temperatures occur indoors 2 to 2.5 months later than outdoors, depending on sensor location. The study estimates no biological risks for cellulose materials from humidity-dependent insects or mould growth, with temperature-dependent insect degradation that remains a threat, particularly from June to December (although it has decreased over time). Chemical degradation risks, confirmed by three indicators, remains significant from July to October. This is evident when considering raw microclimate data, which reveals slight but still significant variations in risky days compared to "clean" data, suggesting a potential influence of human activities related to archival management. In conclusion, the findings underscore the benefits of massive structures in preserving vulnerable materials and a useful methodological approach in combining raw and filtered microclimate data to assess conservation risks. Analysing noise signal may inform conservators about the impact of their management practices, offering a useful framework for similar archival contexts worldwide.

How to cite: Boccacci, G., Frasca, F., Bertolin, C., Dahlin Saeter, T., Lund, E., and Siani, A. M.: Climate-induced Risk Assessment of Library Collections within Dora I WWII Bunker in Trondheim, Norway, EGU General Assembly 2025, Vienna, Austria, 27 Apr–2 May 2025, EGU25-18457, https://doi.org/10.5194/egusphere-egu25-18457, 2025.

EGU25-18921 | ECS | Orals | ERE1.3

Understanding some of the effects of shelter design on deterioration at the Mnajdra Megalithic Temples of Malta 

Rosangela Faieta, JoAnn Cassar, Mantas Valantinavičius, and Daniel Micallef

The site of Mnajdra, one of the UNESCO-listed Megalithic Temples of Malta (https://whc.unesco.org/en/list/132)  dating back to 3600 - 2400 BC, is located on the southern coast of the Maltese archipelago. This site, along with two other similar sites, was sheltered in 2009 with reversible, open-sided shelters, with the aim of mitigating the critical impact of the aggressive marine environment on the conservation of the limestone megaliths.  Environmental conditions such as rain, wind, salt damage and direct insolation - triggering thermoclastism (thermal stress)- were identified as a key factor contributing to the progressive stone weathering and are currently being monitored by a multidisciplinary study.

This abstract will focus on understanding the impact of these protective, open-sided shelters on the temperature variations of the Mnajdra’s façade, with particular attention to diurnal and seasonal fluctuations, comparing to data available from the pre-sheltering period. Other studied environmental factors will not be addressed here.

The Mnajdra complex is widely recognized for its astronomical alignment, with the main (eastern) façade oriented to mark the equinoxes, solstices, and other solar events. In order to retain the association of the Temples with these alignments and to continue to observe these events, the shelters were designed to remain more open on the eastern side. As a result, surface temperature variations are currently monitored on the eastern façade, where direct sunlight could cause significant temperature fluctuations with possible subsequent deterioration effects such as microcracks formation and progressive material weakening.

Thermal imaging data was thus collected across two seasons - autumn (9th October 2023) and summer (19th June 2024) at 10-minute intervals during morning hours to identify trends of the fluctuations.

Results from these two campaigns revealed significant surface temperature fluctuations in autumn and lower variations in summer. Surface temperature gradients were observed, with a more intense gradient in autumn (from 27,8°C at 7.50 am to over 35°C at 8.50am), and less intense fluctuation in summer (from 27,3°C at 6.50am to 30,4°C at 7.50am). In both seasons, hotspots were identified particularly in areas of different megaliths (of the same stone type) where prolonged exposure (approximately 1h) to direct solar radiation occurred.

Taking into account the difference in air temperature recorded during the acquisition (19-25°C in October and 26-32°C in June) this difference can possibly be attributed to the inclination of the sun. The more significant surface temperature fluctuations observed in autumn are likely attributed to the angle of solar incidence at that time. The sun reaches the studied megaliths more directly in autumn and less directly in the summer solstice, resulting in greater variations in surface temperature.

This study forms part of a broader multidisciplinary project integrating non-invasive analytical techniques and environmental parameter modelling to evaluate the efficacy of sheltering systems. All the findings will provide scientific data to inform conservation strategies also aiming at mitigating the progressive weathering on these unique heritage sites, and ensuring their long-term preservation sites also in projection of increasing challenges due to the impacts of climate change.

How to cite: Faieta, R., Cassar, J., Valantinavičius, M., and Micallef, D.: Understanding some of the effects of shelter design on deterioration at the Mnajdra Megalithic Temples of Malta, EGU General Assembly 2025, Vienna, Austria, 27 Apr–2 May 2025, EGU25-18921, https://doi.org/10.5194/egusphere-egu25-18921, 2025.

EGU25-19597 | Orals | ERE1.3

Assessment of UNESCO Cultural Heritage Sites Vulnerability through Multicriteria Analysis 

Diana Popovici, Andreea Andra-Toparceanu, Florina Chitea, Iuliana Armaș, Adriana Bianca Ovreiu, Sonia Malvica, and Donatella Carboni

Recognizing the inestimable value of the UNESCO World Cultural Heritage Sites for future generations, it is necessary to be aware of their vulnerability to multi-risks in the context of global climate change and the growing interest and engagement of citizens and stakeholders.

Romania is home to nine categories of cultural heritage sites (CHSs) – the Horezu Monastery, the Churches of Moldavia, the Villages with Fortified Churches in Transylvania, the Dacian Fortresses of the Orăștie Mountains, the Wooden Churches of Maramureş, the Historic Centre of Sighişoara, the Roșia Montană Mining Landscape, the Brâncuși Monumental Ensemble of Târgu Jiu, and the Frontiers of the Roman Empire – Dacia.

This work has been partially developed in the frame of two projects: 10101/2024-UB SPAH, funded by the University of Bucharest, which emphasizes sustainable and participatory activities in heritage-aware communities facing geographical risks, and 395080/2024 GeoAlliance, titled “Driving Sustainable Urban Futures:  A Romanian-Norwegian Innovation Geophysical Alliance for Green Transition and SMART City Development”. Supported by the EEA and Norway Grants, the latest project provided geophysical data for representative sampling urban of cultural heritage sites, underscoring the significant role that geophysics play in enhancing urban resilience. Results were integrated within a multi-criteria analysis (MCA) to assess the vulnerability of CHSs in Romania to both natural and man-made hazards. To apply the multicriteria analysis of CHSs vulnerability, a GIS database was developed with both natural and human-induced processes such as earthquakes, landslides, floods, that threaten the cultural heritage proprieties, being identified, mapped and ranked. This was followed by mapping the multi-hazard susceptibility features across the nine categories of the UNESCO World CHSs. The next step involved inventorying the specific attributes of each cultural heritage site that contribute to their vulnerability to various hazards and impact their resilience.  The vulnerability assessment considered several intrinsic factors that can increase exposure to hazards. Key factors include the age and the height of the structure, the elevation and the level of insulation, the used construction materials, and foundation depth. Additionally, the effectiveness of modern infrastructure, especially the underground water pipes and sewage performance, along with shallow hydrogeological and geophysical induced changes, significantly influences their risk. Other important considerations included visitor numbers and the degree of degradation of the construction, as well as ongoing consolidation and renovation efforts.

The findings from multicriteria analysis revealed the most susceptible cultural heritage sites to both natural and human-induced hazards. The paper emphasizes that although many heritage sites are highly exposed to multiple hazards, some of these sites have lower vulnerability despite being susceptible to these threats. Additionally, certain hazard processes that initially seem harmless to the CHSs are long-term damage. The results of the present work can serve as a valuable resource for site managers, enabling them to better understand where the vulnerabilities of their managed site reside and to intervene with higher efficiency in day-to-day monitoring and maintenance. Additionally, the insights can assist central and local authorities in comprehending financial requirements and allocating the necessary budget for protection and management efforts in order to strengthen CHSs protection.

How to cite: Popovici, D., Andra-Toparceanu, A., Chitea, F., Armaș, I., Ovreiu, A. B., Malvica, S., and Carboni, D.: Assessment of UNESCO Cultural Heritage Sites Vulnerability through Multicriteria Analysis, EGU General Assembly 2025, Vienna, Austria, 27 Apr–2 May 2025, EGU25-19597, https://doi.org/10.5194/egusphere-egu25-19597, 2025.

EGU25-20444 | Posters on site | ERE1.3

Archaeometrical characterization of the Roman wall paintings from Gades (Cádiz, Spain). 

Salvador Domínguez-Bella, Macarena Lara Medina, Maria Angeles Pascual Sanchez, and Eduardo Molina-Piernas

In Roman Baetica and specifically in the city of Gades (Cádiz, Spain), studies about Roman mural paintings has been mainly approached from a traditional perspective, with specific exceptions where archaeometric studies have been carried out on this type of construction and decorative materials. During an archaeological intervention carried out in the Santa Bárbara car park in Cádiz between 2009 and 2012, several Roman mural paintings fragments from the levels of waste deposits were documented. The archaeological record has allowed the levels to be dated between the 1st century BC and the 1st century AD., thus this set of pictorial remains belongs to the Republican phase or to the initial stage of the Augustean period of Gades, a period with hardly any examples of pictorial representations from the early times in Baetica. Due to the number of fragments of Roman paintings with a great variety of colours, several analytical methodologies to know the composition, technique and quality of the paintings were carried out by means X-ray diffraction, X-ray fluorescence spectroscopy, Raman spectroscopy, FTIR, polarized optical microscope, scanning electron microscope, cathodoluminescence microscope and spectrophotometry. A representative set of 31 samples was chosen for this study. Some samples only show a single layer of paint on the mortar, but it is more frequent to find several overlapping layers. The colour palette presents: light and dark blue; bright, light and dark red; purple; light and dark yellow; light green and green; white, brown and lampblack. These colours were identify as egyptian blue, cinnabar, hematite, iron ochers, celadonite, calcite, black, and mixtures between them. On the other hand, the mortars characterization showed two types, the first one is the most numerous and were used as substrate for all identified colours, except for pure black. In fact, fragments that only presented the black pigment, sometimes with lines in white, have been identified on the intonaco layers with ceramic. This remains probably corresponded with a prominent Roman urban villa placed in the Eriteia island of Gades, confirming the importance that this city had within the Roman Empire.

Acknowledgements: This study was financially supported by the Research Project TED2021-132417A-I00 founded by MCIN/AEI /10.13039/501100011033 and by the European Union NextGenerationEU/PRTR, and the Research Project “La gestión de los residuos sólidos en Gades. Aproximación a la caracterización tipológica de los vertidos y su inserción en el entramado urbano de una ciudad costera” (CEIJ-006) Fundación CEiMAR.

How to cite: Domínguez-Bella, S., Lara Medina, M., Pascual Sanchez, M. A., and Molina-Piernas, E.: Archaeometrical characterization of the Roman wall paintings from Gades (Cádiz, Spain)., EGU General Assembly 2025, Vienna, Austria, 27 Apr–2 May 2025, EGU25-20444, https://doi.org/10.5194/egusphere-egu25-20444, 2025.

EGU25-20560 | Orals | ERE1.3

The use of ultrasonic pulse-echo tomography to assess UPV in soft calcarenitic stones 

Emilia Vasanelli, Davide Di Gennaro, Matteo Sticchi, Gianni Blasi, and Maria Antonietta Aiello

Measuring the ultrasonic pulse velocity of stone ashlars belonging to masonry structures provides useful indications for assessing the materials' strength and state of conservation, the need for their possible substitution, and the effectiveness of consolidating treatments. Ultrasound techniques as nondestructive tests preserve the integrity of masonry buildings that especially in Italy often have a cultural and historical-artistic value.
Several correlations linking ultrasonic velocity with the compressive strength of stone materials are available in the literature. These correlations are often developed in the laboratory using small-size samples, high measurement frequencies, and direct transmission measurement modes. In situ, it is often difficult to make measurements under such conditions due to the inaccessibility of both the surfaces of materials and the higher dimension of the elements to investigate. In addition, material surfaces are often affected by deterioration which causes problems in the transducer coupling with measurement surfaces. Furthermore, the use of coupling agents is usually forbidden in the case of artistic artifacts. The ultrasonic tomograph with pulse-echo technology (PE UT) overcomes such difficulties. Pulse-echo method introduces a stress pulse by a transmitter into an object at an accessible surface. The pulse propagates into the test object and is reflected by flaws or interfaces. The surface response caused by the arrival of reflected waves, or echoes, is monitored by receivers. Tomography gives visualization, either by cross-section or 3D images, of the interior structure of the object to find anomalies and determine the material physical properties. PE UT has an array of dry-point contact transducers (DPCT) that enable ultrasonic measurements on rough surfaces without coupling gel, reducing the measuring time and test invasiveness. PE UT employs transverse S-waves instead of longitudinal P-waves because they give more reliable results for degraded materials and in the presence of defects. In the literature, there are several studies in which tomographic images were used to detect the presence of defects in concrete and rock members. In these cases, a reference value of UPV is assumed. On the contrary, few studies use PE UT images to determine UPV on concrete or stone members. Thus, the appropriateness of this technique to assess UPV is still under research due to the lack of a sufficient number of published experimental studies.
In the present paper, the reliability of PE UT in determining the ultrasonic velocity of soft calcarenitic stone elements, known as Lecce stone, is investigated. The measurements are compared with those conducted with conventional transducers at different frequencies in direct and indirect modes. The measurements are also carried out considering the presence of water in the material, which strongly influences not only the ultrasonic measurements but also the strength of the material itself. Four levels of saturation from dry to fully saturated states are considered. The results of the experimental campaign evidence that PE UT is a reliable technique for UPV assessment, allowing rapid one-side measurements on surfaces in different conditions.

How to cite: Vasanelli, E., Di Gennaro, D., Sticchi, M., Blasi, G., and Aiello, M. A.: The use of ultrasonic pulse-echo tomography to assess UPV in soft calcarenitic stones, EGU General Assembly 2025, Vienna, Austria, 27 Apr–2 May 2025, EGU25-20560, https://doi.org/10.5194/egusphere-egu25-20560, 2025.

EGU25-213 | ECS | Orals | OS1.6

Frontal Subduction in an Increasingly Stratified Southern Ocean 

Lilian Dove, Mara Freilich, Lia Siegelman, Baylor Fox-Kemper, and Paul Hall

Pycnocline stratification is increasing across multiple ocean basins due to a warming surface ocean and changes in wind forcing. Pycnocline stratification plays a leading order role in tracer transport, shaping capacity for heat and carbon uptake, making it a key parameter of interest on timescales ranging from paleoclimate to plankton blooms. Part of the challenge in assessing the role of pycnocline stratification in global models is the two-way connection between physical processes at the mesoscale and submesoscale and stratification, with important implications for the resulting tracer transport. Using idealized runs of MITgcm, we find that the strength of pycnocline stratification influences the formation and evolution of submesoscale structure. When a constant isopycnal slope is initialized, tracers get efficiently transferred across the base of the mixed layer and get trapped in anticyclonic submesoscale vortices below the mixed layer. This leads to tracer concentrations below the mixed layer and fluxes through it to be stronger under decreased stratification conditions. In contrast, when the frontal lateral buoyancy gradient is held fixed while stratification changes, the vertical flux of tracers and the concentrations at depth stay constant across all examined stratification conditions. Understanding the relationship between pycnocline stratification and fine-scale physical motions is necessary to diagnose and predict trends in carbon uptake and storage, particularly in the Southern Ocean. 

How to cite: Dove, L., Freilich, M., Siegelman, L., Fox-Kemper, B., and Hall, P.: Frontal Subduction in an Increasingly Stratified Southern Ocean, EGU General Assembly 2025, Vienna, Austria, 27 Apr–2 May 2025, EGU25-213, https://doi.org/10.5194/egusphere-egu25-213, 2025.

EGU25-339 | Orals | OS1.6

Advancing understanding of Southern Ocean phytoplankton phenology with 4D data product 

Nicolas Mayot, Raphaëlle Sauzède, Lloyd Izard, David Nerini, and Julia Uitz

The Southern Ocean plays a major role in the global carbon cycle, with air-sea carbon dioxide (CO2) exchanges influenced by phytoplankton phenology. However, during summer, global ocean biogeochemistry models struggle to capture the interplay between biological and physical processes and their combined effects on air-sea CO2 fluxes. Improved constraints on phytoplankton seasonal dynamics and the mechanistic drivers of their spatial and temporal variability are crucial for refining these models. In this study, we used a 24-year (1998–2022) database of weekly vertical profiles of chlorophyll-a and particulate organic carbon concentrations. This observation-based 4D dataset was generated by matching up and merging satellite and hydrological data using a machine learning methodology trained on BioGeoChemical-Argo observations. A Functional Principal Component Analysis, coupled with a Gaussian Mixture Model, was applied to this dataset, enabling a revised regionalisation of the Southern Ocean based on the 3D seasonal variability of phytoplankton biomass and particulate organic carbon concentrations. Distinct latitudinal differences mostly align with physical oceanic fronts, while zonal differences emerge within the Antarctic Circumpolar Current region. These spatial patterns reflect regional disparities in key phytoplankton growth drivers, including light and nutrient availability, vertical mixing, and stratification. We further explore the interannual variability of this bioregionalisation, shedding light on the environmental drivers of phytoplankton seasonal dynamics and their potential biogeochemical impacts in the context of a changing climate.

How to cite: Mayot, N., Sauzède, R., Izard, L., Nerini, D., and Uitz, J.: Advancing understanding of Southern Ocean phytoplankton phenology with 4D data product, EGU General Assembly 2025, Vienna, Austria, 27 Apr–2 May 2025, EGU25-339, https://doi.org/10.5194/egusphere-egu25-339, 2025.

EGU25-427 | ECS | Orals | OS1.6

Southern Ocean mechanisms of glacial CO2 drawdown and their links to global climate 

Madison Shankle, Graeme MacGilchrist, James Rae, and Andrea Burke

The Southern Ocean is a critical player in regulating Earth’s carbon cycle and climate, yet its role under future climate change remains uncertain. Studying the Southern Ocean under past climate states can help address this knowledge gap. For example, changes in the Southern Ocean, through modulating deep ocean carbon content, are widely thought to have played a driving role in the atmospheric carbon dioxide (CO2) fluctuations of Earth’s past ice ages. Here we present three novel findings that advance our understanding of processes linking Southern Ocean changes to glacial CO2 drawdown. First, a new proxy record reveals a tight coupling between atmospheric CO2 levels and deep Southern Ocean carbon storage over the Last Glacial Cycle, providing clear evidence of the systematic transfer of carbon into the deep ocean during glaciation and its release during deglaciation. These results are used to quantify the deep Indo-Pacific’s remineralized carbon content at the Last Glacial Maximum and are found to explain a significant proportion of observed glacial CO2 drawdown. Second, we demonstrate how improved ventilation of North Pacific mid-depths (evidenced by glacial proxy data) directly impacts Southern Ocean biogeochemistry by reducing the carbon and nutrient load of waters upwelling in the Southern Ocean. This process enhances biological pump efficiency, curtailing Southern Ocean CO2 outgassing and highlighting a critical interhemispheric connection in glacial nutrient cycling. Finally, idealized numerical modelling experiments demonstrate cooling of the high northern latitudes associated with a large Northern Hemisphere ice sheet can, in isolation of any other forcing, remotely induce glacial-like changes in Southern Ocean sea ice, circulation, and biogeochemistry that work to enhance ocean carbon content. These changes include expanded southern sea ice and cooler, saltier, better-stratified bottom water, which together increase oceanic carbon storage via solubility- and disequilibrium-driven effects. Collectively, these findings underscore the Southern Ocean’s central role in mediating interhemispheric and glacial climate feedbacks, offering new insights into the processes that drove the Earth’s into low-CO2 glacial periods.

How to cite: Shankle, M., MacGilchrist, G., Rae, J., and Burke, A.: Southern Ocean mechanisms of glacial CO2 drawdown and their links to global climate, EGU General Assembly 2025, Vienna, Austria, 27 Apr–2 May 2025, EGU25-427, https://doi.org/10.5194/egusphere-egu25-427, 2025.

EGU25-1745 | ECS | Orals | OS1.6

Persistent Abyssal Warming but Emerging Salinity Shifts in the Southern Ocean 

Kathryn Gunn, Matthew England, and Stephen Rintoul

Recent observations reveal that Antarctic Bottom Water is thinning, warming, and spreading northward more slowly into the abyssal ocean. The causes and consequences of these changes remain uncertain due to limited observations. Using historical data (1985-2024) and model projections (2041-2050), we assess abyssal ocean changes in the past, present, and future. Between 1985-2024, isopycnals below 3000~m descended at -149±5 m decade-1, and are replaced by warmer water, causing warming of 0.03±0.02 °C decade-1. Freshening of -0.004±0.003 g kg-1 decade-1 occurred due to meltwater-driven changes in continental shelf waters forming bottom water. Projections suggest bottom water thinning will continue, doubling the abyssal ocean’s contribution to Southern Ocean sea level rise by 2050. However, freshening has slowed or reversed, indicating a salinity turning point. This transition occurs as shelf waters become too fresh and light to reach the abyssal ocean, with important implications for overturning circulation, nutrient cycling, and regional sea level rise.

How to cite: Gunn, K., England, M., and Rintoul, S.: Persistent Abyssal Warming but Emerging Salinity Shifts in the Southern Ocean, EGU General Assembly 2025, Vienna, Austria, 27 Apr–2 May 2025, EGU25-1745, https://doi.org/10.5194/egusphere-egu25-1745, 2025.

EGU25-1761 | Posters on site | OS1.6

Distinct optical properties of dissolved organic matter near Getz and Dotson ice shelves in the Amundsen Sea 

Jinyoung Jung, Juyoung Son, Youngju Lee, Tae-Wan Kim, Jisoo Park, and Mi Hae Jeon

The Amundsen Sea, located in West Antarctica, is undergoing rapid melting due to the intrusion of Circumpolar Deep Water. This intrusion results in ice sheet thinning and basal melting, which can have cascading effects on the biogeochemical cycle of dissolved organic matter (DOM) by introducing iron from sea ice and glaciers and by affecting ocean circulation. Therefore, it is crucial to understand the dynamics of the DOM in this region. Our study focused on assessing the optical properties of DOM in the oceanic areas adjacent to the West Getz Ice Shelf (WGIS) and the Dotson Ice Shelf (DIS). Notably, the WGIS regions exhibited relatively high dissolved organic carbon (DOC) and chromophoric DOM (CDOM) absorption coefficient at 350 nm (a350). Molecular weight indices, including spectral slope coefficient (S275-295) and specific UV absorbance at 254 nm (SUVA254), suggested that high molecular weight DOM with a substantial aromatic component predominated in the WGIS regions. Conversely, the DIS regions showed low CDOM values, low SUVA254 values, and elevated S275-295 values, indicative of low molecular weight CDOM with lower aromaticity. Furthermore, we observed significant negative correlations between the biomass of Phaeocystis antarctica (P. antarctica) and phosphate (PO4) in the WGIS regions. However, no such relationship was found in the DIS region. These findings imply that the high concentration and molecular weight of a350 in the WGIS regions, spanning from the surface layer to deeper depths, are predominantly driven by autochthonous sources, notably the colony-forming blooms of P. antarctica. The results of this study highlight the crucial role of bloom conditions in shaping both the quantity and quality of DOM in the Amundsen Sea.

How to cite: Jung, J., Son, J., Lee, Y., Kim, T.-W., Park, J., and Jeon, M. H.: Distinct optical properties of dissolved organic matter near Getz and Dotson ice shelves in the Amundsen Sea, EGU General Assembly 2025, Vienna, Austria, 27 Apr–2 May 2025, EGU25-1761, https://doi.org/10.5194/egusphere-egu25-1761, 2025.

EGU25-1764 | Posters on site | OS1.6

Spatial Variability of Phytoplankton Communities in the Ross Sea: Insights from High-Resolution Observations 

Youngju Lee, Jinyoung Jung, Jisoo Park, and Jong Kuk Moon

The Ross Sea is a critical region for understanding phytoplankton dynamics and their role in polar marine ecosystems in the west Antarctica, particularly in the context of rapid environmental change. Investigating the spatial variability of phytoplankton biomass and community structure is essential for assessing ecosystem productivity and biogeochemical cycling in this vulnerable area. From January to February 2023, a field survey of the Ross Sea was conducted onboard the icebreaker research vessel Araon, utilizing high-resolution, continuous observations of surface seawater with the Algae Online Analyzer and Imaging FlowCytoBot. These observations provided precise spatial distribution data on phytoplankton biomass and species abundance. The results revealed intricate spatial variability in phytoplankton community structure and biomass across the eastern and western Ross Sea, spanning coastal to offshore gradients, and in the dynamic waters near polynyas and ice shelves. The phytoplankton community was predominantly composed of diatoms, especially Fragilariopsis spp., and/or Phaeocystis spp., with their dominance varying across spatial gradients. The observed patterns suggest that multiple interacting environmental factors, including sea ice concentrations, water masses, and ocean currents, influence on phytoplankton distribution in the region. These findings highlight the critical role of physical and biological interactions in phytoplankton distributions and offer valuable insights into their potential responses to environmental changes in the Ross Sea ecosystem.

How to cite: Lee, Y., Jung, J., Park, J., and Moon, J. K.: Spatial Variability of Phytoplankton Communities in the Ross Sea: Insights from High-Resolution Observations, EGU General Assembly 2025, Vienna, Austria, 27 Apr–2 May 2025, EGU25-1764, https://doi.org/10.5194/egusphere-egu25-1764, 2025.

Walter Munk’s seminal work, Abyssal Recipes, has established a foundational framework for comprehending abyssal water upwelling for almost 60 years. While it has profoundly influenced theoretical, laboratory, and observational studies of deep-ocean processes, discrepancies arise when compared with long-term observational data. One prominent paradox is known as the interior downwelling conundrum: When Munk's framework is applied to conditions of bottom-intensified mixing, it predicts downwelling rather than upwelling, which contradicts the mass balance in the abyssal ocean. This study revisits this challenge by investigating the unsteady dynamics of abyssal isopycnals. We demonstrate that under a cooling regime in the abyssal ocean, which is linked with the formation of the Antarctic Bottom Water (AABW) in the last little Ice Age more than 1000 years ago, rising water parcels can co-exist with downward diapycnal velocities. This reconciliation aligns Munk’s theory with the observed mass balance and resolves the longstanding paradox. These findings provide fresh insights into the conundrum and contribute to advancing our understanding of the closure of the global thermohaline and overturning circulations.

How to cite: Han, L.: Revisiting the Conundrum of Interior Downwelling in Munk’s Abyssal Recipes: An Unsteady Perspective Linked to a Cooling AABW, EGU General Assembly 2025, Vienna, Austria, 27 Apr–2 May 2025, EGU25-2364, https://doi.org/10.5194/egusphere-egu25-2364, 2025.

EGU25-2563 | ECS | Orals | OS1.6

Impact of additional freshwater around Antarctica on the Southern Ocean carbon cycle : an inter-model comparison 

Ombeline Jouet, Judith Hauck, Christopher Danek, Alexander Haumann, Tore Hattermann, Morven Muilwijk, Andrew G. Pauling, Neil C. Swart, and Christoph Völker

The ongoing increase of global mean temperature, caused by anthropogenic CO2 emissions, will most likely lead to enhanced melting and calving of Antarctic ice shelves in the coming decades. As a consequence, the freshwater input into the Southern Ocean is expected to increase as well. The resulting change in ocean salinity could have significant consequences for ocean circulation, water column stratification, and water mass formation in the Southern Ocean, which are all expected to affect the capacity of the surface ocean to remove CO2 from the atmosphere, and the sequestration of carbon in the deep ocean. However, the magnitude and spatio-temporal patterns of these changes and their links to freshwater forcing are not yet well understood. To reduce these uncertainties, increase our understanding, and better quantify the feedbacks on the climate system, the international SOFIA initiative (Swart et al., 2023) defines freshwater input protocols for consistent use in various Earth System Models. Here we study the impact of additional freshwater around Antarctica on circulation and carbon fluxes in a steady preindustrial climate state using four Earth System Models. Most of the models show a decrease in the uptake of CO2 by the surface of the Southern Ocean, caused by a strengthened outgassing of natural CO2 between 50°S and 60°S. The stronger outgassing can be attributed to an increase in sub-surface dissolved inorganic carbon concentration south of the Antarctic Circumpolar Current that is associated with a redistribution of water masses in the Southern Ocean. Furthermore the reduction of the production and downward flow of Antarctic Bottom Water is leading to a decrease of its volume, and the expansion of carbon-rich Circumpolar Deep Water, which increases the carbon content at depth and thus weakens the overall CO2 uptake. However, the models disagree in terms of the intensity of the weakened Southern Ocean CO2 uptake. This difference seems to be mainly linked to the model resolution and the representation of the ocean mean state, e.g. the strength of the stratification, which is a determining factor for the redistribution of the additional freshwater to depth. To pursue this work, experiments with additional freshwater forcing in various climate states are conducted to analyse the ocean carbon cycle’s response and quantify potential climate feedbacks.

How to cite: Jouet, O., Hauck, J., Danek, C., Haumann, A., Hattermann, T., Muilwijk, M., Pauling, A. G., Swart, N. C., and Völker, C.: Impact of additional freshwater around Antarctica on the Southern Ocean carbon cycle : an inter-model comparison, EGU General Assembly 2025, Vienna, Austria, 27 Apr–2 May 2025, EGU25-2563, https://doi.org/10.5194/egusphere-egu25-2563, 2025.

EGU25-2577 | Orals | OS1.6

Anomalous Summertime CO2 sink in the subpolar SouthernOcean promoted by early 2021 sea ice retreat 

Jacqueline Boutin, Kirtana Naëck, Sebastian Swart, Marcel Du Plessis, Liliane Merlivat, Laurence Beaumont, Antonio Lourenço, Francesco D'Ovidio, Louise Rousselet, Brian Ward, and Jean-Baptiste Sallée

The physical and biogeochemical processes governing the air-sea CO2 flux in the Southern Ocean are still widely debated. This presentation focus on an anomalously large sink of CO2 observed north of the Weddell Sea in Summer 2022. The processes behind this anomalous situation are analyzed based on the combination of in situ observations, various satellite parameters (altimetric currents, Chl-a, ice concentration and sea surface salinity) and ocean model reanalysis.

The “Southern Ocean Carbon and Heat Impact on Climate” cruise in Summer 2022 aimed at studying physical and biogeochemical processes in the Weddell Sea and in its vicinity. A “CARbon Interface OCean Atmosphere” (CARIOCA) drifting buoy was deployed in January 2022 in the subpolar Southern Ocean, providing hourly surface ocean observations of fCO2 (fugacity of CO2), dissolved oxygen, salinity, temperature and chlorophyll-a fluorescence for 17 months. An underwater glider was piloted with the buoy for the first 6 weeks of the deployment to provide vertical ocean profiles of hydrography and biogeochemistry. These datasets reveal an anomalously strong ocean carbon sink for over 2 months occuring in the region of Bouvet Island and associated with large plumes of chlorophyll-a (Chl-a). Based on Lagrangian backward trajectories reconstructed using various surface currents fields, we identified that the water mass reaching the Bouvet Island region originated from the south-west, from the vicinity of sea ice edge in Spring 2021. We suggest that a strong phytoplankton bloom developed there in November 2021 favoured by early sea ice melt in 2021 in the Weddell Sea. These waters, depleted in carbon, then travelled to the position of the CARIOCA buoy. The very low values of ocean fCO2, measured by the buoy (down to 310 μatm), are consistent with net community production previously observed during blooms occurring near the sea ice edge, partly compensated by air-sea CO2 flux along the water mass trajectory. Early sea ice retreat might therefore have caused a large CO2 sink farther north than usual in Summer 2022, in the Atlantic sector of the subpolar Southern Ocean. Such events might become more frequent in the future as a result of climate change.

How to cite: Boutin, J., Naëck, K., Swart, S., Du Plessis, M., Merlivat, L., Beaumont, L., Lourenço, A., D'Ovidio, F., Rousselet, L., Ward, B., and Sallée, J.-B.: Anomalous Summertime CO2 sink in the subpolar SouthernOcean promoted by early 2021 sea ice retreat, EGU General Assembly 2025, Vienna, Austria, 27 Apr–2 May 2025, EGU25-2577, https://doi.org/10.5194/egusphere-egu25-2577, 2025.

EGU25-3356 | ECS | Orals | OS1.6

Sensitivity of Antarctic dense water formation to surface vertical resolution 

Wilton Aguiar, Adele K. Morrison, Andy McC. Hogg, Wilma Huneke, David Hutchinson, Paul Spence, Pedro Colombo, and Kial D Stewart

Dense water formation on the Antarctic continental shelf drives the abyssal overturning circulation, being the main process by which Antarctic Bottom Waters form. Despite its importance, most ocean models cannot simulate dense water formation at the Antarctic coast and flow down the continental slope (i.e., overflow) due to the fine resolution required by these processes. While many studies have looked at the impact of horizontal and vertical resolution in the deep ocean on the overflows, no studies have investigated whether surface vertical resolution impacts dense water formation. In this work, we varied the surface ocean cell of two dense water-forming models from 1m to 5m thickness as a simple vertical resolution sensitivity test. We used the ACCESS-OM2 and the Pan-Antarctic ocean and sea ice models, each employing a different boundary layer parameterization. Thickening the surface cell to 5m in ACCESS-OM2 decreased the dense water formation at the Antarctic continental shelf by 45% (1.5 Sv) and ceased its overflow through the continental slope after 10 years of simulation. In the Pan-Antarctic, thickening the surface cell reduced the Antarctic dense water formation by 34% (1.5 Sv) and its overflow by 67% (2.5 Sv) after 10 simulation years. The dense water formation reduction in 5m experiments is explained by a southward shift in the surface Ekman transports, bringing light offshore waters to the coast and prohibiting dense water formation at the Antarctic continental shelf. This response is independent of the boundary layer scheme employed.

How to cite: Aguiar, W., K. Morrison, A., McC. Hogg, A., Huneke, W., Hutchinson, D., Spence, P., Colombo, P., and D Stewart, K.: Sensitivity of Antarctic dense water formation to surface vertical resolution, EGU General Assembly 2025, Vienna, Austria, 27 Apr–2 May 2025, EGU25-3356, https://doi.org/10.5194/egusphere-egu25-3356, 2025.

EGU25-4254 | ECS | Orals | OS1.6

Freshwater Sources and their Variability through Salinity-δ18O Relationships: A Machine Learning Solution to a Water Mass Problem 

Xabier Davila, Elaine L. McDonagh, Fatma Jebri, Geoffrey Gebbie, and Michael P. Meredith

While the Southern Ocean is freshening, the sources of this freshening and their variability remain uncertain. Freshwater enters the ocean as Meteoric Water (MW; precipitation, river runoff, glacial discharge) and Sea Ice Meltwater (SIM). These inputs can be quantified using seawater salinity and stable oxygen isotopes in seawater, δ18O; however it involves the challenging task of determining the isotopic signature of MW (δ18OMW). Here, we apply Self-Organising Map (SOM), a machine learning technique, to water mass properties to estimate the global distribution of the isotopic signature of MW (δ18OMW) by characterizing distinct salinity-δ18O relationships from two comprehensive datasets. The inferred δ18OMW is then used in a 3-endmember mixing model to estimate MW and SIM contributions to global ocean freshwater content. Our results show the large scale distribution of MW and SIM, as well as giving insights into their role in mass transformation and interannual variability. We highlight the MW content in Ice Shelf Water and Antarctic Bottom Water linked to glacial melt, which is concurrent with brine content derived from sea ice formation. Our results also show that AABW has freshened since the 1990’s due to a reduction of sea ice formation (less brine production) rather than an increase in glacial melt, and suggest the emergence of anthropogenic forced signals in seawater δ18O.

How to cite: Davila, X., L. McDonagh, E., Jebri, F., Gebbie, G., and P. Meredith, M.: Freshwater Sources and their Variability through Salinity-δ18O Relationships: A Machine Learning Solution to a Water Mass Problem, EGU General Assembly 2025, Vienna, Austria, 27 Apr–2 May 2025, EGU25-4254, https://doi.org/10.5194/egusphere-egu25-4254, 2025.

EGU25-5183 | ECS | Posters on site | OS1.6

Impact of Mesoscale Eddies on CO₂ Fluxes in the Southern Ocean 

Mariana Salinas Matus, Nuno Serra, Fatemeh Chegini, and Tatiana Ilyina

The Southern Ocean plays a crucial role in the global carbon cycle, uptaking about 43% of the ocean’s CO₂ uptake. However, significant uncertainties remain regarding the processes governing CO₂ fluxes in this region. Mesoscale eddies have been identified as a potential source of these uncertainties. In this study, we analyze 30 years of daily, high-resolution (10 km) global simulations using the ICON-O ocean model coupled with the HAMOCC biogeochemistry model. The Okubo-Weiss parameter and vorticity is used to classify four flow regimes—anticyclonic eddy cores, cyclonic eddy cores, eddy core peripheries, and quiescent background—allowing us to generate composites for each. Our results show that CO₂ flux is directed into the ocean across all four regimes, with the magnitude of CO₂ uptake varying by regime. Anticyclones have a greater capacity for CO₂ uptake compared to cyclones. In certain regions (i.e. Agulhas retroflection and the Brazil-Malvinas confluence) anticyclones exhibit the highest CO₂ uptake capacity among the four regimes, a pattern linked to the greater eddy intensity of these areas. An analysis of the CO₂ flux terms shows that wind speed and ∆pCO₂ are the primary contributors to flux magnitud and variability. As atmospheric pCO₂ is prescribed, the main changes in ∆pCO₂ are related to changes in oceanic pCO₂. These variations are primarily driven by dissolved inorganic carbon (DIC) and sea surface temperature, which tend to compensate for each other, with DIC having a stronger influence. To explore DIC changes, we analyzed DIC budgets in the first 300 m. In the surface layer, the total DIC tendency is predominantly driven by vertical diffusion, which causes a net loss of DIC to deeper layers and induces atmospheric CO₂ flux into the ocean. Vertical diffusion is particularly stronger in anticyclonic eddies, explaining their enhanced ability to absorb CO₂. In deeper layers, the total DIC tendency is primarily controlled by the divergence of advective fluxes, while changes in DIC from sources and sinks (i.e. biogeochemical processes) are almost entirely balanced by vertical diffusion. These findings highlight the dominant role of mesoscale eddies in oceanic carbon uptake and underscore the need for more refined models to accurately represent their impact on the global carbon cycle.

How to cite: Salinas Matus, M., Serra, N., Chegini, F., and Ilyina, T.: Impact of Mesoscale Eddies on CO₂ Fluxes in the Southern Ocean, EGU General Assembly 2025, Vienna, Austria, 27 Apr–2 May 2025, EGU25-5183, https://doi.org/10.5194/egusphere-egu25-5183, 2025.

The Southern Ocean plays a critical role in global climate regulation, acting as a key pathway for heat, momentum, and biochemical transport. Using expanded hydrographic observations from the WOCE/CLIVAR SR03 section (1991–2018), a choke point between Tasmania and Antarctica, along with high-resolution GLORYS12 reanalysis data (1993–2018), we investigate long-term changes in the Antarctic Circumpolar Current (ACC) and Tasman Outflow (TO) and their relationship with the southward migration of the Subtropical Front (STF). Our results reveal a significant southward migration of the STF, while the Subantarctic Front remains meridionally stable. This STF migration is associated with an intensified TO and strengthened Ekman convergence, leading to enhanced subduction of cold, low-salinity intermediate water in the Subantarctic Zone and increased subsurface warming (0.4–0.8°C per decade) north of the ACC. The TO has strengthened significantly (+3.1 Sv per decade), while the ACC’s geostrophic transport shows an increasing trend (+3.2 Sv per decade), indicating the poleward expansion of subtropical circulation towards Antarctica. Additionally, the correlation between TO transport and the Southern Annular Mode (SAM) index (r = 0.48, p < 0.05) suggests that westerly wind variability plays a key role in modulating ocean transport in this region. Our findings emphasize the importance of STF migration and TO expansion in shaping Southern Ocean circulation under climate change. The poleward shift of westerlies and subtropical systems underscores the ongoing sensitivity of transport processes to global warming. Further research with extended observations and high-resolution climate models is needed to refine projections of circulation changes and their impact on oceanic heat transport in the Southern Ocean.

How to cite: Park, T., Kim, Y. S., and Park, J.: Poleward Migration of the Subtropical Front and Its Implications for the Tasman Outflow and Antarctic Circumpolar Current in the Southern Ocean, EGU General Assembly 2025, Vienna, Austria, 27 Apr–2 May 2025, EGU25-7897, https://doi.org/10.5194/egusphere-egu25-7897, 2025.

EGU25-8065 | ECS | Posters on site | OS1.6

Carbon Exchange and Ocean Ventilation along the East Antarctic Margin 

Mara Lena Rosmann, Hendrik Grotheer, Lester Lembke-Jene, Alexander Haumann, and Gesine Mollenhauer

The Southern Ocean (SO) plays a crucial role in regulating the Earth’s climate by absorbing atmospheric carbon and storing it in the deep ocean. (Brovkin et al., 2012). Past studies reported a reduction in this uptake capacity over the last few decades. However, the temporal and spatial variability of the Southern Ocean’s carbon pump appears to be more complex  (Landschützer et al., 2015), with the Indian sector arguably being the least explored and understood region. A key objective of this PhD is to use radiocarbon signatures of dissolved inorganic carbon (DI14C), combined with stable carbon isotopes to quantify exchange processes between the ocean, atmosphere and sediments along the East Antarctic margin. A comprehensive sample set of sea water, sediment pore water and sediment surface samples was collected during three expeditions (2022 - 2024) on R/V Polarstern from more than 50 stations. Several sites from key locations will be selected to study ocean ventilation, water mass alterations and exchanges, and bottom water formation in the region. In addition, we will perform analyses in high spatial resolution to target more specific research questions, in particular ocean – ice shelf interactions. The East Antarctic coast from Prydz Bay to Vincennes Bay lends itself as case study area for tracing the inflow of Circumpolar Deep Water onto the continental shelf and its interaction with the marine-based portions of the Amery and Shackleton Ice Shelves, as well as Totten Glacier. Sections sampled along meridional transects further offshore and to the west allow to differentiate between regional varieties of Antarctic Bottom Water formation. Comparing water column data with 14C signals recorded in surface sediment benthic foraminifera will contribute to an improved understanding of the use of radiocarbon as a ventilation age proxy. Initial analyses are being conducted at the radiocarbon laboratory at Alfred Wegener Institute Helmholtz Centre for Polar and Marine Research, equipped with an accelerator mass spectrometer (AMS) Mini Carbon Dating System (MICADAS). Next steps involve method development, focusing on optimizing the graphitization process of DIC samples prior to radiocarbon analysis.

Brovkin, V., Ganopolski, A., Archer, D., & Munhoven, G. (2012). Glacial CO 2 cycle as a succession of key physical and biogeochemical processes. Climate of the Past8(1), 251-264.

Landschützer, P., Gruber, N., Haumann, F. A., Rödenbeck, C., Bakker, D. C., Van Heuven, S., ... & Wanninkhof, R. (2015). The reinvigoration of the Southern Ocean carbon sink. Science349(6253), 1221-1224.

How to cite: Rosmann, M. L., Grotheer, H., Lembke-Jene, L., Haumann, A., and Mollenhauer, G.: Carbon Exchange and Ocean Ventilation along the East Antarctic Margin, EGU General Assembly 2025, Vienna, Austria, 27 Apr–2 May 2025, EGU25-8065, https://doi.org/10.5194/egusphere-egu25-8065, 2025.

EGU25-8079 | ECS | Orals | OS1.6

Impact of Microplastics on Antarctic Krill Faeces Carbon Sequestration in the Southern Ocean 

Nan Wu, Aidan Hunter, and Clara Manno

The Southern Ocean plays a crucial role in absorbing carbon dioxide from the atmosphere, accounting for 20% of the ocean's carbon sink despite covering only 10% of the global ocean area. Antarctic Krill (Euphausia superba) are central to this process, as their faeces help remove carbon from the upper ocean by sinking to deeper layers. However, microplastics are increasingly polluting the Southern Ocean, and have been found in zooplankton, especially krill. These buoyant microplastics may slow the sinking of krill faeces, potentially reducing the amount of carbon that is trapped in the deep ocean. Whether, and to what extent, microplastics impact faeces sinking is still an open question. To address this gap, we developed a theoretical model to study how microplastics affect the density and fragmentation of krill FP which in turn will impact their vertical sinking to the oceanic depths. Our findings suggest that in environmentally relevant concentrations, microplastics could slow down the sinking of these pellets. Larger microplastics have the most impact, causing greater fragmentation of the faeces as they settle in the water column. While the buoyancy effect of microplastics is currently marginal due to the density change, under a business-as-usual scenario. Our results highlight that future increases in microplastics will likely have a significant negative impact on the ability of krill to promote the storage of carbon in the deep ocean.

How to cite: Wu, N., Hunter, A., and Manno, C.: Impact of Microplastics on Antarctic Krill Faeces Carbon Sequestration in the Southern Ocean, EGU General Assembly 2025, Vienna, Austria, 27 Apr–2 May 2025, EGU25-8079, https://doi.org/10.5194/egusphere-egu25-8079, 2025.

EGU25-8145 | Posters on site | OS1.6

Analyzing Factors that Influence the Irreversibility of Ocean Export Production 

Jieun Wie and Byung-Kwon Moon

Ocean export production is the backbone of marine ecosystems, and it is crucial to carefully track their changes under the global warming. This study analyzes the irreversibility of ocean export production and the major factors affecting it by performing CO2 reduction experiments with the LOVECLIM, a medium complexity model. After a 1,500-year spin-up to the present-day CO2 level of 367 ppm, it was increased by 1% per year for 140 years and then decreased again for the same period. The present-day CO2 level was then held for 5,000 years. Ocean export production decreased at low latitudes and increased at mid- and high-latitudes, with the largest changes occurring in the equatorial and Antarctic Circumpolar Current regions. Nutrient concentrations in the euphotic zone decreased as the global ocean circulation weakened and ocean stratification intensified. Nevertheless, ocean export production has increased at high latitudes because of deepen mixed layer depth due to strong westerlies of both hemisphere and the creation of sea ice melting, which has led to the widen euphotic zones, high nutrient concentrations despite decreased nutrient concentrations, and increased ocean temperatures. The irreversibility of ocean export production with CO2 concentration is seen in 84.3% of the world's oceans. It will take more than 1,300 years for global ocean export production to return to its initial concentration after a CO2 reduction experiment, so it will need to be carefully monitored over a long period of time.


Acknowledgements: This work was supported by the National Research Foundation of Korea (NRF) grant funded by the Government of Korea (MSIT) (No. 2022R1A2C1008858) and Global - Learning & Academic research institution for Master’s·PhD students, and Postdocs (LAMP) Program of the National Research Foundation of Korea (NRF) grant funded by the Ministry of Education (No. RS-2024-00443714).

How to cite: Wie, J. and Moon, B.-K.: Analyzing Factors that Influence the Irreversibility of Ocean Export Production, EGU General Assembly 2025, Vienna, Austria, 27 Apr–2 May 2025, EGU25-8145, https://doi.org/10.5194/egusphere-egu25-8145, 2025.

EGU25-8253 | ECS | Orals | OS1.6

New insights into the primary production and the structure of the phytoplankton community in the Southern Indian Ocean from the subtropical to the Antarctic zones 

Valentin Deteix, Céline Ridame, Melilotus Thyssen, Céline Dimier, Claire Lo Monaco, Nicolas Metzl, Aline Tribollet, and Frédéric Planchon

Assessing and understanding the factors that control the biological carbon pump (BCP), i.e. the transfer of organic carbon biologically fixed by primary production (PP) from the euphotic zone to the deep ocean, remains a major challenge in marine biogeochemistry. Among these factors, the intensity of PP and the structure of phytoplankton community play key roles in the biogeochemical fluxes of the BCP and depend on the physico-chemical conditions of the ocean. Although the BCP has received significant attention in the last decades, the magnitude of this process remains poorly quantified, notably for under-sampled areas such as the Indian sector of the Southern Ocean (ISSO). The latter hosts contrasting biogeochemical provinces, from low productive systems with High Nutrient Low Chlorophyll areas, to high productive regimes in the vicinity of the Subantarctic Islands as a consequence of natural iron fertilization.

This study aims to assess the links between the PP and phytoplankton community structure in the ISSO. We present results from the SOCARB (South Indian Ocean CARBon fluxes from the surface to the mesopelagic twilight zone) cruise conducted during the late austral summer of 2023. This includes: (i) PP from 13C method and on-deck incubations, (ii) relative phytoplankton chemotaxonomic groups from pigments data and total chlorophyll a (TChla) and (iii) phytoplankton size classes abundances from on board cytometry flow analyses. PP and pigments were size-fractioned (< 3 µm; 3-20 µm; > 20 µm) following the three considered phytoplankton classes (pico-; nano-; microphytoplankton) to quantify their impact on organic carbon production and to address the size structure of the phytoplankton community.

At the Antarctic zone (AZ) and the Polar Frontal zone (PFZ), integrated TChla – over the 0.01 % euphotic layer depth – was structured by TChlaNANO (46 ± 12 %) and TChlaMICRO (40 ± 14 %) and featured a community dominated by diatoms and haptophytes (68 ± 8 %). The Subantarctic zone (SAZ) differs from the rest of the Southern Ocean (i.e. south of the subtropical front) with a distinct community and a TChla structured in pico- (42 %) and nano- (36 %). In the South Indian Ocean, the Subtropical zone (STZ) exhibited a TChla structured by TChlaPICO (43 ± 8 %) and TChlaNANO (39 ± 9 %) with a diversified community. From linear correlations and relative contribution of phytoplankton groups to TChla, we show that PP in the AZ and PFZ is conditioned by diatoms and haptophytes algal biomass in both nano- and micro- size classes. In the STZ, PP is mainly conditioned by the algal biomass of cyanobacteria in the pico- and by haptophytes, chlorophytes and dinoflagellates in the nano- size classes. Our results also underline the intra-zonal variability of PP and TChla through bottom-up processes, such as cyclonic eddy in the STZ or water mass intrusion in the PFZ. This study paves the way for a better comprehension of phytoplankton productivity and community size structure, which could contribute to a more detailed knowledge on their role in the BCP.

How to cite: Deteix, V., Ridame, C., Thyssen, M., Dimier, C., Lo Monaco, C., Metzl, N., Tribollet, A., and Planchon, F.: New insights into the primary production and the structure of the phytoplankton community in the Southern Indian Ocean from the subtropical to the Antarctic zones, EGU General Assembly 2025, Vienna, Austria, 27 Apr–2 May 2025, EGU25-8253, https://doi.org/10.5194/egusphere-egu25-8253, 2025.

EGU25-8611 | ECS | Orals | OS1.6

Lagrangian reconstruction of a glaciogenic iron delivery to the Kerguelen blooms, Southern Ocean: comparison of SWOT-merged products with conventional altimetry 

Alex Nalivaev, Francesco D'Ovidio, Laurent Bopp, Maristella Berta, Clara Azarian, Louise Rousselet, and Stéphane Blain

There is general agreement that iron is the main nutrient limiting primary productivity in the Southern Ocean. In contrast to the average low biological productivity elsewhere in the Southern Ocean, the Kerguelen region is home to massive blooms that extend hundreds of kilometers offshore, and serve as a backbone to rich ecosystems. The blooms have been shown to be sustained by continental iron inputs, in particular by the resuspension of iron-enriched sediments over the plateau, transported eastward by the Antarctic Circumpolar Current. However, iron inputs from glacial erosion and ice melt may be another iron source. In particular, two of the outlet glaciers of Kerguelen's Cook Ice Cap transport iron-enriched lithogenic material downstream to the coastal waters of the Golfe des Baleiniers. Whether the circulation is able to connect the glacier outlets to the pelagic area, and how much of the pelagic bloom can be influenced by glaciogenic iron, are two open questions that we address here. Using in situ and satellite data, we show the persistence, on an interannual basis, of a chlorophyll-enriched plume connected to the Golfe des Baleiniers and driven by a horizontal advection of iron. Using a Lagrangian methodology,  we reconstruct the horizontal advection of iron and show that glaciogenic iron supply influences up to a third of the spatial extent of the open ocean bloom onset. We find that the new high resolution SWOT observations allow a significant reduction in altimetry biases attributable compared to previous products, allowing a better representation of fine scale biogeochemical structures. Our results are particularly relevant in the context of the negative mass balance of ice caps and glacial retreat evidenced both on Kerguelen and other Southern Ocean islands in the context of climate change.

How to cite: Nalivaev, A., D'Ovidio, F., Bopp, L., Berta, M., Azarian, C., Rousselet, L., and Blain, S.: Lagrangian reconstruction of a glaciogenic iron delivery to the Kerguelen blooms, Southern Ocean: comparison of SWOT-merged products with conventional altimetry, EGU General Assembly 2025, Vienna, Austria, 27 Apr–2 May 2025, EGU25-8611, https://doi.org/10.5194/egusphere-egu25-8611, 2025.

EGU25-9075 | Orals | OS1.6 | Highlight

Record Low Winter 2023 Antarctic Sea-Ice Increased Ocean Heat Loss, Dense Water Formation and Storms 

Simon Josey, Andrew Meijers, Adam Blaker, Jeremy Grist, Jenny Mecking, and Holly Ayres

The recent decline in Antarctic sea-ice, notably the extreme low winter cover in 2023 and 2024 is a major source of concern. Some progress has been made towards determining the drivers of ice loss but uncertainty remains regarding its impacts, particularly for ocean-atmosphere interaction. Resolution of this uncertainty is important as ice decline can significantly modify surface heat loss, and thus the ocean and atmosphere. We show that the substantial failure of ice regrowth in winter 2023 provided a major new source of turbulent ocean heat loss to the atmosphere. Ice concentration in the Weddell, Bellingshausen and Ross Seas is reduced by up to 80% and is accompanied by an unprecedented doubling of mid-winter ocean heat loss. Furthermore, peak heat loss shifts from late April to mid-June with weaker than normal heat loss in austral autumn. The strengthening of winter surface heat loss is accompanied by changes on both sides of the ocean-atmosphere interface. These include a rise in frequency of atmospheric storms and greater surface heat loss driven dense water formation. The findings reveal that the record low winter 2023 Antarctic sea-ice cover substantially modified Southern Ocean-atmosphere interaction and motivate in-depth analysis of the wider climate system impacts. The subsequent evolution of low ice conditions together with their ocean-atmosphere impacts through to 2025 will also be considered.

How to cite: Josey, S., Meijers, A., Blaker, A., Grist, J., Mecking, J., and Ayres, H.: Record Low Winter 2023 Antarctic Sea-Ice Increased Ocean Heat Loss, Dense Water Formation and Storms, EGU General Assembly 2025, Vienna, Austria, 27 Apr–2 May 2025, EGU25-9075, https://doi.org/10.5194/egusphere-egu25-9075, 2025.

EGU25-9664 | Posters on site | OS1.6

On the fate of North Atlantic deep waters in the Southern Ocean 

Bruno Millet, William Gray, Casimir de Lavergne, Claire Waelbroeck, Gilles Reverdin, Frerk Pöppelmeier, and Didier Roche

Dense waters formed in the North Atlantic (NADW) propagate southward into the Southern Ocean. There, a portion upwells to the surface in a south-eastward spiral (Tamsitt et al. 2017), a portion is entrained into the northward flowing Antarctic Bottom water (AABW), and a portion propagates northward at mid-depths of the Indian and Pacific Oceans. Combined, these processes result in a gradual eastward dilution of NADW at its core density around the Southern Ocean. However, no consensus has been reached on the dilution rate of these waters and how it impacts global ocean ventilation. Here, we use historical  observations to track the dilution of NADW around the Southern Ocean. We find a persistent  maximum at mid-densities, corresponding to the NADW core, which erodes eastward from the Atlantic sector. Furthermore, we evaluate the dilution of an artificial North Atlantic dye in three models of ocean transports: a 1° global configuration of the Nucleus for European Modelling of the Ocean (NEMO), version 2 of the Ocean Circulation Inverse Model (OCIM), and the Total Matrix Intercomparison (TMI). The erosion of the North Atlantic dye maximum around the Southern Ocean varies markedly across models, and is largest in TMI. The available  data point to an overly rapid erosion in TMI, but remain too scarce in the Pacific sector to place strong constraints on the dilution rate of the NADW core. A zonal circumpolar transect of salinity and  measurements, together with characterisation of inter-laboratory offsets, would greatly help to constrain the fate of NADW.

How to cite: Millet, B., Gray, W., de Lavergne, C., Waelbroeck, C., Reverdin, G., Pöppelmeier, F., and Roche, D.: On the fate of North Atlantic deep waters in the Southern Ocean, EGU General Assembly 2025, Vienna, Austria, 27 Apr–2 May 2025, EGU25-9664, https://doi.org/10.5194/egusphere-egu25-9664, 2025.

Under future climate forcing, in both strong emission (SSP585) and strong mitigation (SSP126) scenarios, the deep overturning circulation of the Southern Ocean collapses by 2050 in almost all CMIP6 simulations.  The SSP scenario applied ultimately has a relatively small impact on this shutdown, which appears to have commenced in the last few decades of the historical scenario runs – the present day.  The ensemble mean drops to 50% (10±4 Sv) strength, from a pre Industrial strength of 20±9 Sv, with individual models decreasing by over 65%.    This ‘collapse’ occurs over 30-50 years, with most of the temporal variation explained by internal variability within models. 

Associated with the change in overturning strength is a reduction in Antarctic Bottom Water (AABW) volume south of 30S by >2x10¹⁶ m3, driven by a reduction in formation rates around Antarctica.  Here surface warming reduces formation by approximately 4 Sv, whilst freshwater effects (due to sea ice reduction for example) are relatively weak.  Walin analysis shows that subsequent entrainment of Circumpolar Deep Water (CDW) by convecting AABW also significantly decreases, further reducing AABW volume and export.

The reduction in AABW formation results in an expansion of CDW volumes.  CDW upwelling reduced due to the lower cell shutdown is largely compensated by a wind driven increase in upper cell overturning of approximately 25%.  The increased upper cell overturning enhances SAMW export by up to 5 Sv, with a significant boost to net heat export due to both enhanced volumes and temperatures of this water mass.

We explore the wider impact of these Southern Ocean shifts in overturning on the net warming and carbon storage of the global ocean, and the wider global climate.  We contextualize climate model representations of bottom water processes against observations and other model studies to suggest that a deep overturning tipping point may have already been reached.


How to cite: Meijers, A. and Rosser, J.: Collapse of deep overturning under future climate forcing and impacts on ocean heat and carbon uptake in CMIP6 models, EGU General Assembly 2025, Vienna, Austria, 27 Apr–2 May 2025, EGU25-9932, https://doi.org/10.5194/egusphere-egu25-9932, 2025.

EGU25-10829 | ECS | Posters on site | OS1.6

Drivers of surface distribution of dissolved organic carbon and nitrogen along the northern Antarctic Peninsula and the Atlantic Southern Ocean 

Raquel Avelina, Christine Klaas, Claudia Hamacher, Cássia O. Farias, Kai-Uwe Ludwichowski, Claudia Burau, Rodrigo Kerr, Boris P. Koch, Mauricio M. Mata, and Leticia C. da Cunha

Dissolved organic carbon and nitrogen (DOC and DON, respectively) are important components of the carbon and nutrient cycle in marine systems. However, there are still significant gaps in understanding the role of these compounds in the biogeochemical cycles of polar environments, due to the limitations of spatiotemporal sampling. Here, we present an overview of surface distributions of DOC and DON along the Northern Antarctic Peninsula (NAP) and Atlantic Southern Ocean (ASO), using the dataset available between 1992 and 2022, collected during different seasons. We used DOC data collected from RV Almirante Maximiano cruises by the Brazilian High Latitude Oceanography Group (GOAL), along the NAP, DOC and DON data collected from RV Polarstern cruises (Alfred Wegener Institute, Germany), along the ASO, as well as DOC and DON datasets from international repositories. DOC and total dissolved nitrogen were analyzed primarily with a Shimadzu TOC-L® Series. DON was calculated by subtracting dissolved inorganic nitrogen concentrations from total dissolved nitrogen. Excess DOC and DON were calculated by subtracting the respective deep concentrations. Surface DOC concentrations ranged from 42.0 to 127.0 μmol kg–1, while surface DON concentrations ranged from 1.0 μmol kg–1 to 11.3 μmol kg–1. At the surface, the highest concentrations of DOC and DON were observed mainly in the western sector of the Southern Atlantic (longitudes > 20° W), due to the proximity of coastal areas such as in the Gerlache Strait in the NAP and South Georgia and the Falklands Islands in the ASO. Increase in the surface concentrations of both DOC and DON were also associated to frontal systems. The accumulation of DOC and DON along the NAP and western sector of the southern Atlantic seem to confirm the link between the production of organic matter and the proximity of iron-supplying land-masses leading to enhanced primary production and plankton biomass (chlorophyll-a concentrations and particulate organic carbon). The production of nitrogen-rich organic matter by zooplankton seemed to be the main factor determining DON distributions. The wide spatial coverage of DOC and DON made it possible to identify significant differences in DOC and DON distributions between different regions, as well as interannual and seasonal differences from data collected in the same regions. DOC and DON can be considered important indicators for evaluating the coupling between physical, biogeochemical, and climate processes over time.

How to cite: Avelina, R., Klaas, C., Hamacher, C., O. Farias, C., Ludwichowski, K.-U., Burau, C., Kerr, R., P. Koch, B., M. Mata, M., and C. da Cunha, L.: Drivers of surface distribution of dissolved organic carbon and nitrogen along the northern Antarctic Peninsula and the Atlantic Southern Ocean, EGU General Assembly 2025, Vienna, Austria, 27 Apr–2 May 2025, EGU25-10829, https://doi.org/10.5194/egusphere-egu25-10829, 2025.

EGU25-10954 | Posters on site | OS1.6

Reconstructing wintertime surface layer fCO2 in the western Weddell Sea using summertime observations of Weddell Sea Bottom Water 

Mario Hoppema, Elise S. Droste, Dorothee C.E. Bakker, and Oliver Huhn

The dense waters formed on the broad continental shelves of the western Weddell Sea are the source of Weddell Sea Bottom Water (WSBW) found along the slope and at the bottom of the basin. WSBW is considered to be an effective conduit for carbon sequestration, eventually contributing to the redistribution of carbon around the global oceans. To quantify the efficiency of this carbon sequestration, it is necessary to have a good understanding of the processes that transform carbon within the ocean surface layer, as well as those occurring along the slope. Lack of biogeochemical data in the southern and western Weddell Sea is hindering progress. In situ observations are particularly necessary in the wintertime, when dense shelf waters and WSBW are formed and thus CO2 uptake is constrained. We present a method that reconstructs the wintertime fugacity (i.e., the adjusted partial pressure) of CO2 (fCO2) on the southwestern continental shelves from the dissolved inorganic carbon (DIC) and total alkalinity (TA) measurements made in the WSBW, but collected in the summertime, when most expeditions take place. The method relies on relationships between the contributions of different water masses to WSBW, and potential temperatures, as found in previous work. Results for reconstructed surface wintertime fCO2 are comparable to the very few other wintertime observations elsewhere in the Weddell Sea. Without in situ wintertime observations, validation of the results is challenging. The results suggest a negligible role for biogeochemical processes transforming DIC between wintertime shelf water and WSBW. Assumptions in the methodology need to be tested against in situ biogeochemical measurements on the shelves and along the slope. We applied our method to recent data and relate findings to other biogeochemical variables to narrow down the uncertainty in our assumptions. 

How to cite: Hoppema, M., Droste, E. S., Bakker, D. C. E., and Huhn, O.: Reconstructing wintertime surface layer fCO2 in the western Weddell Sea using summertime observations of Weddell Sea Bottom Water, EGU General Assembly 2025, Vienna, Austria, 27 Apr–2 May 2025, EGU25-10954, https://doi.org/10.5194/egusphere-egu25-10954, 2025.

EGU25-11096 | ECS | Posters on site | OS1.6

Understanding multi-millennial variability in the Southern Ocean  

Anna Höse, Matteo Willeit, Georg Feulner, and Alexander Robinson

Temperature reconstructions from Greenland and Antarctica during glacial times show anti-phased oscillations which are assumed to be connected to changes in ocean circulation patterns. However, the research focus of most studies is set to the Northern Hemisphere, connecting Dansgaard-Oeschger (DO) events to changes of the Atlantic Meridional Overturning Circulation (AMOC). Meanwhile, in the Southern Ocean (SO), millennial-scale oscillations, driven by changes in the formation of deep water, have been found in different climate model simulations, yet the exact mechanism leading to these changes is still not fully understood. These oscillations, diagnosed by the strength of Antarctic Bottom Water (AABW) formation, have been simulated under warmer climate conditions and also in experiments with additional freshwater input to the North Atlantic. Here we present results of multi-millennial experiments with the fast Earth system model CLIMBER-X and the coarse resolution General Circulation Model (GCM) CM2Mc in which the AMOC is collapsed by freshwater forcing in the north Atlantic and convection is eventually triggered in the SO. We aim to find the drivers of convection onset in the SO and the subsequent strengthening of AABW by analysing the changes of temperature and salinities in both models. Between the two models, we compare how the dynamics of features such as sea-ice, wind stress and thermodynamic ocean variables contribute to changes of SO convection and AABW formation. We also analyze additional sensitivity experiments with CLIMBER-X to explore which conditions lead to oscillations.

How to cite: Höse, A., Willeit, M., Feulner, G., and Robinson, A.: Understanding multi-millennial variability in the Southern Ocean , EGU General Assembly 2025, Vienna, Austria, 27 Apr–2 May 2025, EGU25-11096, https://doi.org/10.5194/egusphere-egu25-11096, 2025.

EGU25-11251 | ECS | Posters on site | OS1.6

The response of the Southern Ocean to freshwater hosing in an equilibrated 1º NEMO configuration with realistic ventilation 

Birte Gülk, Casimir de Lavergne, Jean-Baptiste Sallée, Gurvan Madec, and Clément Rousset

Under a warming climate ice sheets are releasing freshwater to the ocean and affecting the global ocean circulation. One important region where freshwater is released and impacts the global ocean is the Antarctic continental shelf, where Antarctic Bottom Water (AABW) is formed. The response of AABW formation and circulation to increased glacial melt is uncertain, because global ocean models struggle to capture AABW formation, sinking and spreading across the abyss. Here, we present an equilibrated 1º degree global ocean-ice configuration with AABW formation on the shelves and realistic abyssal ventilation. This configuration also includes dye and age tracers that track ventilation pathways and timescales. Using this model, we perform an idealized ‘antwater’ hosing experiment, releasing exactly 0.1 Sv of freshwater uniformly around the Antarctic coast for a century (without offset from surface salinity restoring). The response of Southern Ocean circulation and ventilation is analysed and discussed in the context of previous model studies.

How to cite: Gülk, B., de Lavergne, C., Sallée, J.-B., Madec, G., and Rousset, C.: The response of the Southern Ocean to freshwater hosing in an equilibrated 1º NEMO configuration with realistic ventilation, EGU General Assembly 2025, Vienna, Austria, 27 Apr–2 May 2025, EGU25-11251, https://doi.org/10.5194/egusphere-egu25-11251, 2025.

EGU25-12345 | ECS | Orals | OS1.6

The Impacts of an AMOC Collapse on Southern Ocean Multidecadal Variability 

Emma Smolders, René van Westen, and Henk Dijkstra

The interaction between ocean eddies and the large-scale ocean circulation results in a pronounced multidecadal variability in the Southern Ocean, with a dominant periodicity of 40-50 years, referred to as the Southern Ocean Mode (SOM) (Le Bars et al., GRL, 2016). The SOM plays a critical role in modifying the ocean heat content, thereby influencing both sea-ice extent and basal melt around Antarctica. Additionally, this multidecadal variability propagates northward into the Atlantic Ocean, modulating the Atlantic Meridional Overturning Circulation (AMOC) strength. The AMOC is one of the most prominent climate tipping elements on Earth and can potentially collapse as a consequence of surface freshwater input in the North Atlantic. Here, we investigate the impacts of an AMOC collapse on multidecadal variability in the Southern Ocean using the results of the first modeled AMOC collapse in a high-resolution and strongly eddying (0.1° horizontal resolution) ocean-only model, the Parallel Ocean Program (POP). Our findings indicate that the magnitude of the SOM reduces significantly following an AMOC collapse. An analysis of the SOM variability before and after an AMOC collapse allows us to study the role of background stratification, baroclinic instability, and convection in shaping the SOM.

How to cite: Smolders, E., van Westen, R., and Dijkstra, H.: The Impacts of an AMOC Collapse on Southern Ocean Multidecadal Variability, EGU General Assembly 2025, Vienna, Austria, 27 Apr–2 May 2025, EGU25-12345, https://doi.org/10.5194/egusphere-egu25-12345, 2025.

EGU25-13255 | ECS | Posters on site | OS1.6

Changes in ideal age distribution in response to coupled wind/sea ice perturbations in a Southern Ocean channel model  

Nelson Poumaëre, Graeme MacGilchrist, and Hemant Khatri

The Southern Ocean is known as the most prominent oceanic sink of anthropogenic carbon and heat (Khatiwala et al. 2009, Frölicher et al. 2015). Among the processes involved in the region's carbon and heat cycle, ventilation–defined as the transfer of water and tracers from the mixed layer to the stratified pycnocline–is recognised as being of prime significance (Morrison et al. 2022). Recent and future trends in Southern Ocean surface conditions (wind stress and sea ice cover) are likely to impact ventilation patterns and timescales, with concurrent effects on the ocean’s role as a climate mitigator.

Sea ice has been shown to be an important conveyor of heat and salinity throughout the Southern Ocean (Abernathey et al. 2016, Haumann et al. 2016).  Recent modelling (Waugh 2014, Waugh et al. 2019) and data analysis (Cerovečki et al. 2019) studies have revealed the impact of changing surface conditions on ventilation characteristics; however, the contribution of sea ice dynamics and thermodynamics, and their coupled interaction with wind stress changes, have not been specifically addressed.

In this study, we focus on this mechanism by making use of a coupled ocean/sea ice (MOM6/SIS2, Adcroft et al. 2019) reentrant channel model, with generic continental shelf and meridional ridge topography. Quasi-realistic seasonally varying, zonally invariant surface forcing fields of wind stress, heat flux and fresh water are imposed. A meridional overturning circulation is sustained by a sponge region at the domain’s northern boundary. Several diagnostics, including the ideal age, are used to quantify changes in ventilation intensity.

To investigate the impact on ocean ventilation of changing surface conditions and their interactions with sea ice dynamics, we run two configurations of the model: with and without an interactive sea ice component. In both configurations, the model is brought to statistical equilibrium and then perturbed by mimicking a Southern Annular Mode anomaly. By comparing the ventilation characteristics in the two configurations, we isolate and quantify the contribution of the freezing/melting dynamics and their interaction with changes in wind stress forcing. 

How to cite: Poumaëre, N., MacGilchrist, G., and Khatri, H.: Changes in ideal age distribution in response to coupled wind/sea ice perturbations in a Southern Ocean channel model , EGU General Assembly 2025, Vienna, Austria, 27 Apr–2 May 2025, EGU25-13255, https://doi.org/10.5194/egusphere-egu25-13255, 2025.

EGU25-15046 | Posters on site | OS1.6

SWOT reveals fine-scale balanced motions and dispersion properties in an energetic meander of the Antarctic Circumpolar Current 

Yann-Treden Tranchant, Benoit Legresy, Annie Foppert, Beatriz Pena-Molino, and Helen Phillips

The Southern Ocean (SO), dominated by the Antarctic Circumpolar Current (ACC), plays a key role in the global uptake and transport of heat and carbon. Interactions between the ACC and topographic features form standing meanders, hotspots of small-scale motions that enhance cross-frontal exchanges. In-situ observations are challenging and remain sparse in the SO, and hence progress in understanding the dynamics of eddies and their role in tracer exchanges readily relies on satellite altimetry data. An accurate representation of velocity and kinetic energy toward the smaller scales is thus needed to better understand the Southern Ocean's role in the global climate system. 

Launched in December 2022, the SWOT (Surface Water and Ocean Topography) satellite mission offers an unprecedented view of ocean dynamics at scales down to 15 km.  Ocean currents and kinetic energy budget are typically inferred by applying geostrophic balance to sea surface height (SSH) observations. However, at the small spatial scales resolved by SWOT, this balance may not hold anymore or shift to higher-order equilibrium, and validation steps are crucial before exploiting these observations in climatic studies. Using surface drifters deployed during the SWOT validation campaign FOCUS, we present the first analysis of velocities and dispersion derived from SWOT SSH, in an energetic meander of the ACC.

Introducing a fitting kernel method tailored to derive velocities from SWOT observations, we show that SWOT SSH remain primarily balanced and valid for inferring surface velocities at scales as small as 10 km in this region. At these scales, geostrophic balance alone becomes insufficient and leads to a 10-20% bias compared to drifter velocities in cyclonic eddies, which is effectively corrected by applying cyclogeostrophy to SWOT SSH. Then, we compute distance-averaged pair statistics from real drifter pairs and virtual particles and show that SWOT accurately captures dispersion properties over the 5-200 km range, unveiling distinct dispersion patterns between large and small separation scales. This suggests that balanced dynamics resolved by SWOT are still the main driver for ocean dispersion in this range. By capturing balanced dynamics with unprecedented accuracy, SWOT offers new opportunities to understand the impact of small scales on tracer exchange and better quantify the transport of heat and carbon in the Southern Ocean. 

How to cite: Tranchant, Y.-T., Legresy, B., Foppert, A., Pena-Molino, B., and Phillips, H.: SWOT reveals fine-scale balanced motions and dispersion properties in an energetic meander of the Antarctic Circumpolar Current, EGU General Assembly 2025, Vienna, Austria, 27 Apr–2 May 2025, EGU25-15046, https://doi.org/10.5194/egusphere-egu25-15046, 2025.

Antarctic Intermediate Water (AAIW), occupying a vast area in the intermediate depths of the southern hemisphere oceans, is important for heat and freshwater redistribution in the global oceans. However, questions remain regarding its sources at the surface and pathways to the intermediate depths. To answer these questions, a recently-defined distance metric, which can distinguish similar water parcels, is applied to Argo data. Results show that the Pacific and Atlantic AAIW originates from only limited regions at the surface, specifically near the Subantarctic Front in the southeast Pacific and the Falkland Plateau in the southwest Atlantic. Further investigation indicates that through subduction in the deep mixed layer in these regions, low-salinity water penetrates into the intermediate depths of the Pacific and Atlantic Ocean. In the Indian Ocean, such a fast pathway for low-salinity to reach the intermediate depths is absent. Instead, the AAIW here, characterized by lower oxygen concentrations, consists of a mixture of locally slow downward spreading low-salinity water and AAIW inflow carried by the Antarctic Circumpolar Current from the Atlantic Ocean. The AAIW in the three southern hemisphere oceans exhibits slightly different physical properties, reflecting their different origins. Additionally, results indicate that mixing with surrounding saline waters is crucial in the transformation of surface waters into the AAIW cores. Our findings confirm the reliability of the distance metric and emphasize the importance of localized physical processes in the penetration of AAIW into the ocean interior.

How to cite: Hong, Y.: Origin of the Antarctic Intermediate Water in the Southern Ocean identified by a distance metric, EGU General Assembly 2025, Vienna, Austria, 27 Apr–2 May 2025, EGU25-15079, https://doi.org/10.5194/egusphere-egu25-15079, 2025.

EGU25-15611 | ECS | Posters on site | OS1.6

Oceanographic and behavioral monitoring inferred from seal CTD tagging in the Ross Sea, Antarctica 

Hyunjae Chung, Jikang Park, Mijin Park, Yejin Kim, Unyoung Chun, Sukyoung Yun, Won Sang Lee, Hyun A Choi, Seung-Tae Yoon, Ji Sung Na, and Won Young Lee

Monitoring changes in the marine environment is important for both oceanography and ecology study as it helps us understand the process by which oceanic conditions influence the entire ecosystem. In Antarctica, marine mammals encounter substantial changes due to seasonal variation of water mass composition and the complicated submarine topography. However, unbroken observations on ocean conditions are highly restricted to the summer season only when research vessels are available. In this study, we explored how seasonal variations in oceanic conditions affect the foraging behaviors of Weddell seals (Leptonychotes weddellii) in the Ross Sea, Antarctica using miniaturized CTD tags. Over the course of three consecutive years, from 2021 to 2023, 64 adult individuals were instrumented to collect data on water temperature and salinity as well as head acceleration. From the head movement, we found that seals foraged more often in modified shelf water and ice shelf water compared to Antarctic surface water. Additionally, as the lower boundary of Antarctic surface water descends from March to July, the seal dived to greater depths. Additionally, CTD profiles from CTD tags were classified using machine learning methods. Temperature and salinity from each profile were linearly interpolated across depths from 1 to 600 meters. Principal Component Analysis was then applied to extract three principal components for each profile. These components were subsequently used as input for a Gaussian Mixture Model, which classified the profiles into four distinct clusters. Each cluster had distinct temperature and salinity profiles and showed spatial and temporal separation (Warm surface Cluster: Distributed near Terra Nova Bay, predominant in summer (February); Intermediate surface Cluster: Distributed near Terra Nova Bay, predominant in fall (March); Cold Cluster: Distributed near Terra Nova Bay, predominant in winter (May, June, and July); Warm subsurface Cluster: Distributed near the shelf break, predominant in April and May). Prey capture attempts of dives were highest in Warm surface Cluster (3.16) and lowest in Intermediate surface Cluster (2.91). This study reveals the spatial and temporal shifts of foraging behavior with the surrounding oceanographic conditions, and it further emphasize that these oceanic factors should be considered for estimating their foraging activities.

How to cite: Chung, H., Park, J., Park, M., Kim, Y., Chun, U., Yun, S., Lee, W. S., Choi, H. A., Yoon, S.-T., Na, J. S., and Lee, W. Y.: Oceanographic and behavioral monitoring inferred from seal CTD tagging in the Ross Sea, Antarctica, EGU General Assembly 2025, Vienna, Austria, 27 Apr–2 May 2025, EGU25-15611, https://doi.org/10.5194/egusphere-egu25-15611, 2025.

EGU25-16813 | ECS | Orals | OS1.6

Exploring Southern Ocean’s hidden drivers with direct numerical simulations 

Bajrang Chidhambaranathan, Bishakhdatta Gayen, and Catherine Vreugdenhil

The Southern Ocean is critical in regulating the global climate by playing a key role in absorbing, transporting, and storing atmospheric carbon dioxide and heat. This is largely due to the region's unique geography, which connects multiple ocean basins and forms a complex network of global ocean circulation. This network spans a wide range of scales, from planetary motions to small-scale processes. Major large-scale features within its circulation network include the Antarctic Circumpolar Current, Slope Current, Subpolar Gyres, and Bottom Water formation, layered over finer processes like convection and turbulence. Conventional research into the Southern Ocean relies on Global and Regional Ocean and Climate Models which can incorporate realistic forcing like wind, topography and bathymetry. While these models are effective for large-scale motions, they struggle to resolve smaller-scale dynamics, leaving an incomplete picture of the region’s physical processes. To address this, Direct Numerical Simulations (DNS) are used to solve the fundamental equations of fluid dynamics within a small, idealized domain resembling the Antarctic region. This domain is driven solely by surface density variations and planetary rotation. By leveraging dynamic similarity, the small-scale results are scaled to represent the full ocean. This approach successfully captures all scales of motion and reveals the emergence of all major oceanographic features. Remarkably, the simulations show that convection alone can drive a cascade of interconnected physical processes, recreating the Southern Ocean's complex circulation without additional complexities like wind or bathymetry. 

How to cite: Chidhambaranathan, B., Gayen, B., and Vreugdenhil, C.: Exploring Southern Ocean’s hidden drivers with direct numerical simulations, EGU General Assembly 2025, Vienna, Austria, 27 Apr–2 May 2025, EGU25-16813, https://doi.org/10.5194/egusphere-egu25-16813, 2025.

EGU25-17472 | ECS | Orals | OS1.6

Wind perturbation experiments to simulate the 1970s drop in the sea ice extent in the Southern Ocean 

Feba Francis, Hugues Goosse, and Pierre-Yves Barriat

The sea ice extent (SIE) in the Southern Ocean experienced a drop in the late 1970s, though less pronounced compared to the one post-2016. Though several studies explain the drop since 2016, the 1970s decline is critical in understanding the long-term variability of SIE. To investigate the underlying mechanisms for this decline, we conducted wind perturbation experiments using the general circulation model EC-Earth3. We perturb the model by adding wind stress anomalies derived from ERA5 to the model winds. Using this technique, we simulate the evolution of SIE over the period 1958-2023. Our analyses show that the perturbation induces a drop in the 1970s despite the control (no-perturbation) run showing no such trend. This strongly indicates the important role of winds in driving the drop, though ocean processes and other feedback mechanisms may also contribute to the decline. The SIE shows spatial heterogeneity in the variations driven by the wind. Presently, we are conducting multiple ensemble simulations to evaluate the influence of initial conditions on the results.

How to cite: Francis, F., Goosse, H., and Barriat, P.-Y.: Wind perturbation experiments to simulate the 1970s drop in the sea ice extent in the Southern Ocean, EGU General Assembly 2025, Vienna, Austria, 27 Apr–2 May 2025, EGU25-17472, https://doi.org/10.5194/egusphere-egu25-17472, 2025.

The global ocean has taken up an estimated 89% of excess heat and 26% of annual CO2 emissions resulting from anthropogenic activity in recent decades. Despite the crucial role of the ocean in the climate system, there remains significant uncertainty around ocean heat and carbon uptake. Processes of ocean carbon and heat uptake and redistribution are among the leading processes limiting scientists’ ability to predict the rate and magnitude of global climate change. Furthermore, despite being responsible for as much as 40–50% of global annual oceanic CO2 uptake, the Southern Ocean remains the most controversial ocean basin, with large differences in both the magnitude and variability of CO2 fluxes across various estimation methods. The disagreement regarding the magnitude and variability of Southern Ocean CO2 fluxes largely arises due to the sparsity and uneven distribution of in-situ observations of carbon in the ocean, a problem which also constrains estimates of ocean heat uptake. However, machine learning has been extensively demonstrated in recent years to be an effective tool for overcoming such data limitations through gap-filling methods.

We leverage existing expertise in machine learning methods from generating the SOM-FFN and MOBO-DIC ocean carbon data products and apply this expertise to the development of a novel machine learning generated ocean heat uptake data product for the Southern Ocean. We integrate new Earth Observation data from Copernicus satellites with in-situ observation data from the Southern Ocean as input for our new data products. Here, we present a beta-version of our new machine-learning based products of carbon and heat uptake in the Southern Ocean and a first analysis of the variability and trends of the carbon and heat uptake of these data products. This work presents our first steps towards data products which will allow us to identify transport pathways of carbon and heat within the ocean interior. The novel machine learning-based products will also be used to support the advancement of Earth System Models and climate change predictions.

How to cite: Burt, D. and Landschützer, P.: Filling the gaps in Southern Ocean carbon and heat: Machine learning-based products from sparse observations, EGU General Assembly 2025, Vienna, Austria, 27 Apr–2 May 2025, EGU25-18124, https://doi.org/10.5194/egusphere-egu25-18124, 2025.

EGU25-19210 | Posters on site | OS1.6

Trade-offs Between Migration and Foraging Success: Winter Behavior of Weddell Seals in the Ross Sea, Antarctica 

Won Young Lee, Jikang Park, Mijin Park, Yejin Kim, Unyoung Chun, Hyunjae Chung, Hyun A Choi, Seung-Tae Yoon, Ji Sung Na, Sukyoung Yoon, and Won Sang Lee

Wintering periods are vital for the survival and reproductive success of Antarctic animals, yet their winter behaviors remain poorly understood. This study investigates the winter movements and foraging behavior of Weddell seals (Leptonychotes weddellii), an indicator species for the Commission for the Conservation of Antarctic Marine Living Resources, at Terra Nova Bay in the Ross Sea. Using CTD-Satellite Relay Data Loggers, which record head movement and oceanographic data (temperature and salinity), we tracked 48 individuals for three consecutive years (2021–2023) over the migratory period. Of these, 23 seals migrated an average of 339 km (up to 911 km) northeast or southeast between March and early April, while 25 seals remained within 200 km from the summering site restricted at near Terra Nova Bay. Migratory seals exhibited higher prey capture attempts (4.88 ± 1.23 attempts per hour) compared to resident seals (3.86 ± 0.96 attempts per hour), suggesting that long-distance travel provides foraging benefits despite associated energetic costs and risks. Regions frequented by migrants, particularly near continental shelf edges, exhibited warmer water (-1.44 ± 0.37°C) intake at 200–350 m depth, indicative of nutrient-rich conditions. These findings reveal divergent wintering strategies in Weddell seals, highlighting a trade-off between migratory risks and feeding advantages. Long-term integrated monitoring of seal behavior and environmental changes is essential to advancing our understanding of their ecological adaptations and the Antarctic marine ecosystem.

How to cite: Lee, W. Y., Park, J., Park, M., Kim, Y., Chun, U., Chung, H., Choi, H. A., Yoon, S.-T., Na, J. S., Yoon, S., and Lee, W. S.: Trade-offs Between Migration and Foraging Success: Winter Behavior of Weddell Seals in the Ross Sea, Antarctica, EGU General Assembly 2025, Vienna, Austria, 27 Apr–2 May 2025, EGU25-19210, https://doi.org/10.5194/egusphere-egu25-19210, 2025.

EGU25-19855 | Orals | OS1.6

The Diatom Disconnect: Retention near surface waters limits carbon transfer to the deep ocean 

Sarah Lou Carolin Giering, Jack Rees Williams, Chelsey Baker, Katsiaryna Pabortsava, Sabena Blackbird, Adrian Martin, Alex Poulton, Nathan Briggs, Filipa Carvalho, Frederic Le Moigne, Maria Villa-Alfageme, Stephanie Henson, Benoit Espinola, Morten Iversen, Zonghua Liu, Mark Moore, Uta Passow, Elisa Romanelli, Thangavel Thevar, and Richard Sanders and the The following authors are missing

The Southern Ocean, a region highly vulnerable to climate change, plays a critical role in regulating global nutrient cycles and atmospheric CO₂ via the biological carbon pump. Diatoms, a group of photosynthetically active plankton with dense opal skeletons, are central to this process, as their exoskeletons are thought to enhance the transfer of particulate organic carbon to depth, making them main vectors of carbon storage. However, conflicting observations obscure the mechanistic link between diatoms, opal, and particulate organic carbon fluxes, especially in the twilight zone where the greatest flux losses occur.

Here we present direct springtime flux measurements from different sectors of the subpolar Southern Ocean, demonstrating that across large areas of the subpolar twilight zone, carbon is efficiently transferred to depth: however, not by diatoms. Instead, opal is retained near the surface ocean, indicating that processes such as diatom buoyancy regulation and grazer repackaging can negate the ballast effects of diatoms’ skeletons. Using image data, we further reveal species-specific differences in diatom flux dynamics, highlighting the complexity of their role in the carbon cycle.

Our findings challenge the assumption that diatom-rich surface waters are necessarily associated with effective carbon export and transport in the Southern Ocean. They suggest that shifts in phytoplankton community composition driven by climate change may have a smaller impact on biological carbon storage than current models predict.

How to cite: Giering, S. L. C., Williams, J. R., Baker, C., Pabortsava, K., Blackbird, S., Martin, A., Poulton, A., Briggs, N., Carvalho, F., Le Moigne, F., Villa-Alfageme, M., Henson, S., Espinola, B., Iversen, M., Liu, Z., Moore, M., Passow, U., Romanelli, E., Thevar, T., and Sanders, R. and the The following authors are missing: The Diatom Disconnect: Retention near surface waters limits carbon transfer to the deep ocean, EGU General Assembly 2025, Vienna, Austria, 27 Apr–2 May 2025, EGU25-19855, https://doi.org/10.5194/egusphere-egu25-19855, 2025.

EGU25-20050 | ECS | Posters on site | OS1.6

Natural Variability of Antarctic Bottom Water in the Pre-Industrial CESM-HR simulation 

Marina Noro, Ilana Wainer, Tiago Dotto, and Fernanda Marcello

Antarctic Bottom Water (AABW) plays a crucial role in the intensity and variability of the Global Overturning Circulation (GOC). AABW formation sustains the lower cell of the GOC, fundamentally regulating the storage and transport of heat and carbon, key properties influencing Earth’s climate. Changes in AABW have far-reaching implications for the stability of the GOC. However, the mechanisms governing the variability and potential changes in the strengthening of the AABW cell remains uncertain. Understanding the variability of AABW is crucial for projecting changes in ocean circulation and assessing associated climate impacts. This study aims to use the outputs of the high-resolution Community Earth System Model (CESM-HR) pre-industrial run to explore AABW natural variability and water mass transformation processes governing its formation. By analyzing the pre-industrial run, we aim to characterize baseline dynamics in the absence of anthropogenic forcing, focusing on how atmospheric variability drives changes in AABW properties and transport. Additionally, we investigate the role of surface cooling and salinization in shaping AABW characteristics through a water mass transformation framework. While small-scale processes are not fully resolved, CESM-HR offers an improved perspective on large-scale patterns and variability compared to coarser-resolution models. This study aims to provide insights into the baseline state of AABW dynamics under pre-industrial conditions. The results are expected to provide an enhanced understanding of AABW variability, offering insights into anthropogenic impacts and underscoring the need for complementary observational and modeling efforts to refine our understanding of AABW formation.

How to cite: Noro, M., Wainer, I., Dotto, T., and Marcello, F.: Natural Variability of Antarctic Bottom Water in the Pre-Industrial CESM-HR simulation, EGU General Assembly 2025, Vienna, Austria, 27 Apr–2 May 2025, EGU25-20050, https://doi.org/10.5194/egusphere-egu25-20050, 2025.

EGU25-118 | ECS | Orals | CR2.2

To what extent is climate change responsible for retreat of the Pine Island Glacier over the 20th century? 

Alex Bradley, David Bett, Paul Holland, Rob Arthern, and Rosie Williams

The relative contributions of anthropogenic climate change and internal variability in sea level rise from the Antarctic Ice Sheet are yet to be determined. This is primarily because of uncertainty arising from poorly constrained model parameters and chaotic forcing as well as a relatively short observation period. Using an established uncertainty quantification framework (known as calibrate-emulate-sample), we have quantified, for the first time, the role of anthropogenic climate change on retreat of a major Antarctic glacier. We find that anthropogenic trends in forcing, beginning in the 1960s, are only responsible for approximately 15% of the retreat of this glacier since its retreat began in the 1940s. Most of the retreat is attributable to the inertia associated with a slow retreat over the Holocene. We also find, however, that trends in forcing dominate retreat beyond the 21st century, with ice sheet retreat stabilized if anthropogenic trends plateau.

How to cite: Bradley, A., Bett, D., Holland, P., Arthern, R., and Williams, R.: To what extent is climate change responsible for retreat of the Pine Island Glacier over the 20th century?, EGU General Assembly 2025, Vienna, Austria, 27 Apr–2 May 2025, EGU25-118, https://doi.org/10.5194/egusphere-egu25-118, 2025.

EGU25-332 | ECS | Posters on site | CR2.2

Links between GRACE/GRACE-FO derived temporal mass variations in Greenland and climatic indices 

Florent Cambier, José Darrozes, Muriel Llubes, Lucia Seoane, and Guillaume Ramillien

The Greenland Ice Sheet (GIS) has been experiencing significant mass loss since the 1990s, driven by the intensifying effects of global warming. However, this global trend is modulated by distinct annual and interannual variations, highlighting the complex interplay between the ice sheet, atmospheric systems, and the ocean. In this study, we analyzed GIS mass changes from early 2002 to late 2023 using data from the GRACE and GRACE-FO missions, focusing on the dominant temporal cycles and their relationships with climatic indices and parameters.

Using Empirical Orthogonal Functions (EOF) applied to mass variation data from the COST-G solution, we identified five leading modes of variability, accounting for 67.5% of the total variance. The primary mode capture both the annual cycle and longer-term periodicities, while subsequent modes highlight interannual oscillations, with cycles ranging from 4 to 11 years.

We examined the interactions between GIS mass changes and six key climatic drivers: the North Atlantic Oscillation (NAO), Greenland Blocking Index (GBI), Atlantic Multidecadal Oscillation (AMO), temperature duration and intensity, precipitation, and surface albedo. Cumulative indices and parameters enabled direct comparisons with the accumulated mass changes since 2002. Through Wavelet Analysis and cross-correlations, we uncovered significant links with varying time lags. They lead to a complete annual cycle and some interannual relationship between them. For instance, a positive NAO phase enhances precipitation, while the AMO displays a surprising 3.5-year delayed response to mass variations.

Additionally, our findings reveal a connection between 11-year cycles in NAO, GBI, and temperature to solar activity, while 4 to 7-year cycles align with potential atmospheric oscillations and Earth’s internal geodynamics.

This study highlights the GIS as a dynamic system modulated by interrelated processes operating on annual to decadal timescales. We have only investigated Greenland in its globality, but we know that the response to external forcing at a scale of a basin or a glacier differs. It will be important to examine this point as the integrations of multi-scale climatic drivers is important to understand past variations and project future changes under a warming climate. Such understanding is vital for assessing global sea-level rise and formulating mitigation strategies.

How to cite: Cambier, F., Darrozes, J., Llubes, M., Seoane, L., and Ramillien, G.: Links between GRACE/GRACE-FO derived temporal mass variations in Greenland and climatic indices, EGU General Assembly 2025, Vienna, Austria, 27 Apr–2 May 2025, EGU25-332, https://doi.org/10.5194/egusphere-egu25-332, 2025.

The Marine Isotope Stage (MIS) 12-MIS 11 glacial cycle (490-396 Ka) has been recognized as anomalous by researchers due to the longevity of the interglacial interval.  MIS 12 sea level low stand is inferred to be similar to Last Glacial Maximum (LGM), however, due to limited geomorphological data, major uncertainties remain with respect to where the ice was distributed and the relative size of the ice sheets. With the lowest increase in insolation from glacial to interglacial of the past 800 kyrs, MIS 11 was almost twice as long as the other interglacials of the past 500 kyrs. A prevailing hypothesis for the duration of MIS 11 proposes that the large MIS 12 ice sheets, when exposed to a weak insolation increase, gradually released meltwater and deglaciated throughout the interglacial period, contributing to its extended duration. This freshwater influx triggered a positive feedback, promoting the release of oceanic CO2 into the atmosphere, which amplified insolation-driven warming and further prolonged the interglacial period.

Given the lack of terrestrial paleoclimate data, ice and climate modelling may offer a way to improve the understanding of this curious interval. Previous modeling work of this interval has been with either highly parameterized, low-resolution coupled ice-climate models, climate models with forced ice sheets, snapshot climate models with pre-industrial ice sheets, or ice sheet models with forced climate. Few models span the entire duration of the glacial cycle. For the first time, we transiently simulate the entire interval with the fully coupled ice sheet-climate LCIce model that resolves both atmospheric and ocean circulation. Parametric uncertainties are addressed by ensemble simulation. This presentation focuses on ensemble analysis of the ice sheets and climate of the glacial cycle as well as sensitivity testing of the two hypothesized drivers for length of MIS 11: meltwater flux during deglaciation and atmospheric CO2 concentration.

How to cite: Parnell, A. and Tarasov, L.: Ensemble simulation of the MIS 12-MIS 11 glacial cycle using a fully coupled climate-ice sheet model, EGU General Assembly 2025, Vienna, Austria, 27 Apr–2 May 2025, EGU25-577, https://doi.org/10.5194/egusphere-egu25-577, 2025.

EGU25-1396 | ECS | Orals | CR2.2

Modeled Greenland Ice Sheet evolution constrained by ice-core-derived Holocene elevation histories 

Mikkel Langgaard Lauritzen, Anne Munck Solgaard, Nicholas Mossor Rathmann, Bo Møllesøe Vinther, Aslak Grindsted, Brice Noël, Guðfinna Aðalgeirsdóttir, and Christine Schøtt Hvidberg

During the Holocene, the Greenland Ice Sheet (GrIS) experienced substantial thinning, with some regions losing up to 600 meters of ice.
Ice sheet reconstructions, paleoclimatic records, and geological evidence indicate that during the Last Glacial Maximum, the GrIS extended far beyond its current boundaries and was connected with the Innuitian Ice Sheet (IIS) in the northwest. We investigate these long-term geometry changes and explore several possible factors driving those changes by using the Parallel Ice Sheet Model (PISM) to simulate the GrIS thinning throughout the Holocene period, from 11.7 ka ago to the present. We perform an ensemble study of 841 model simulations in which key model parameters are systematically varied to determine the parameter values that, with quantified uncertainties, best reproduce the 11.7 ka of surface elevation records derived from ice cores, providing confidence in the modeled GrIS historical evolution. We find that since the Holocene onset, 11.7 ka ago, the GrIS mass loss has contributed 5.3±0.3 m to the mean global sea level rise, which is consistent with the ice-core-derived thinning curves spanning the time when the GrIS and the Innuitian Ice Sheet were bridged. Our results suggest that the ice bridge collapsed 4.9±0.5 ka ago and that the GrIS is still responding to these past changes today. Our results have implications for future mass-loss projections, which should account for the long-term, transient trend.

How to cite: Lauritzen, M. L., Solgaard, A. M., Rathmann, N. M., Vinther, B. M., Grindsted, A., Noël, B., Aðalgeirsdóttir, G., and Hvidberg, C. S.: Modeled Greenland Ice Sheet evolution constrained by ice-core-derived Holocene elevation histories, EGU General Assembly 2025, Vienna, Austria, 27 Apr–2 May 2025, EGU25-1396, https://doi.org/10.5194/egusphere-egu25-1396, 2025.

EGU25-3494 | ECS | Orals | CR2.2

Constraining the extent of the Greenland Ice Sheet during warmer climates of the Pliocene and Pleistocene: insights from subglacial geomorphology 

Guy Paxman, Stewart Jamieson, Kirsty Tinto, Jacqueline Austermann, Aisling Dolan, and Mike Bentley

The Greenland Ice Sheet is a key contributor to contemporary global sea-level rise, but its long-term history remains highly uncertain. The landscape covered by the ice sheet comprises ∼79% of Greenland and is one of the most sparsely mapped regions on Earth. However, sub-ice geomorphology offers a unique record of environmental conditions prior to and during glaciation, and of the ice sheet’s response to changing climate.

Here we use ice-surface morphology and radio-echo sounding data to identify, and quantify the morphology of, valley networks beneath the Greenland Ice Sheet. Our mapping reveals intricate subglacial valley networks beneath the ice-sheet interior that appear to have a fluvial origin. By contrast, in the southern and eastern coastal highlands, valleys have been substantially modified by glacial erosion. We use geomorphometric analysis and simple ice-sheet model experiments to infer that these valleys were incised beneath erosive mountain valley glaciers during one or more phases of Greenland’s glacial history when ice was restricted to the southern and eastern highlands.

These inferred early mountain ice masses contained ~0.5 metres of sea-level equivalent (compared to 7.4 metres in the modern Greenland Ice Sheet). We believe the most plausible time for the formation of this landscape was prior to the growth of a continental-scale ice sheet in the late Pliocene, with the possibility of further incision having occurred during particularly warm and/or long-lived Pleistocene interglacials. Our findings therefore provide new data-based constraints on early Greenland Ice Sheet extent and dynamics that can serve as valuable boundary conditions in models of regional and global palaeoclimate during past warm periods that are important analogues for climate change in the 21st century and beyond.

How to cite: Paxman, G., Jamieson, S., Tinto, K., Austermann, J., Dolan, A., and Bentley, M.: Constraining the extent of the Greenland Ice Sheet during warmer climates of the Pliocene and Pleistocene: insights from subglacial geomorphology, EGU General Assembly 2025, Vienna, Austria, 27 Apr–2 May 2025, EGU25-3494, https://doi.org/10.5194/egusphere-egu25-3494, 2025.

EGU25-4341 | ECS | Orals | CR2.2

Ice sheet-ocean interactions at 40 kyr BP : Insights from a coupled ice sheet-climate model of intermediate complexity. 

Louise Abot, Aurélien Quiquet, and Claire Waelbroeck

This study examines the interactions between the Northern Hemisphere ice sheets and the ocean during the last glacial period. Using the iLOVECLIM climate model of intermediate complexity coupled with the GRISLI ice sheet model, we explore the consequences of an amplification of the melt rates beneath ice shelves on ice sheet dynamics and the associated feedbacks. First, the amplification of oceanic basal melt rates leads to significant freshwater release from both increased calving and basal melt fluxes. Grounding line retreat and dynamic thinning occur over the Eurasian and Iceland ice sheets, while the oceanic perturbation fails to trigger a grounding line migration over the coasts of Greenland and the eastern part of the Laurentide ice sheet. Second, similarly to hosing experiments with no coupling between the climate and the ice sheets, the influx of fresh water temporarily increases sea-ice extent, reduces convection in the Labrador Sea, weakens the Atlantic meridional overturning circulation, lowers surface temperatures in the Northern Hemisphere, and increases the subsurface temperatures in the Nordic Seas. Third, the freshwater release and latent heat effect on ocean temperatures lead to a decrease in ice sheet discharge (negative feedback) for the Greenland and Eurasian ice sheets. In the experiments, the Laurentide ice sheet does not feature significant volume variations. Nonetheless, we show that we are able to trigger a grounding line retreat and a North American ice sheet volume decrease, by imposing ad-hoc constant oceanic melt rates in a second set of perturbation experiments. However, the Hudson Strait ice stream also does not exhibit the past dynamical instability indicated by the presence of Laurentide origin ice rafted debris in the North Atlantic sediment records.  This suggests that the fully coupled model is too stable, specifically in the Hudson Bay region. To help address this issue, different modelling choices regarding the basal ice sheet dynamics are considered. This emphasizes the need for further research using fully coupled models to explore the triggering mechanisms of massive iceberg discharges and to clarify the role of the ocean in these events.

How to cite: Abot, L., Quiquet, A., and Waelbroeck, C.: Ice sheet-ocean interactions at 40 kyr BP : Insights from a coupled ice sheet-climate model of intermediate complexity., EGU General Assembly 2025, Vienna, Austria, 27 Apr–2 May 2025, EGU25-4341, https://doi.org/10.5194/egusphere-egu25-4341, 2025.

EGU25-4663 | ECS | Orals | CR2.2

Greenland Ice Sheet under climate change: Perspective from a high-resolution modelling simulation from 1421-2024   

Aaquib Javed, Edward Hanna, Leanne Wake, Richard Wilkinson, Mathieu Morlighem, and Joe Mcconnell

The Greenland Ice Sheet (GrIS), a major driver of global sea-level rise, holds approximately 7 meters of sea-level equivalent. Despite its critical role, significant uncertainties remain about its mass balance and response to climate forcing over the past few centuries, particularly before the satellite era. This study aims to address these gaps by reconstructing a high-resolution (1x1 km) monthly surface mass balance (SMB) dataset spanning AD 1421–2024 and quantifying its contributions to historical and contemporary sea-level changes using the Positive Degree Day (PDD) modelling approach. 

The novel SMB dataset integrates long-term climate reanalysis inputs (ERA5 and ModE-RA). They are then validated and corrected against available ice-core records and weather station observations using a Bayesian approach to formally constrain the uncertainties. Preliminary analysis indicates signidficant SMB-driven mass loss due to climatic forcing during recent past, potentially offering new insights into the relative contributions of SMB and ice dynamics to GrIS total mass changes during latter half of the last millennium. 

These results represent a significant advancement in understanding the GrIS’s historical behaviour and links with climate change and can form a valuable baseline for improving the accuracy of future SMB and sea-level rise projections. By addressing critical knowledge gaps, this work enhances our ability to predict the long-term impacts of climate change on the GrIS and global sea levels.

How to cite: Javed, A., Hanna, E., Wake, L., Wilkinson, R., Morlighem, M., and Mcconnell, J.: Greenland Ice Sheet under climate change: Perspective from a high-resolution modelling simulation from 1421-2024  , EGU General Assembly 2025, Vienna, Austria, 27 Apr–2 May 2025, EGU25-4663, https://doi.org/10.5194/egusphere-egu25-4663, 2025.

EGU25-5578 | ECS | Posters on site | CR2.2

Snow accumulation rates at Concordia Station from stake farm observations 

Claudio Stefanini, Barbara Stenni, Mauro Masiol, Giuliano Dreossi, Massimo Frezzotti, Vincent Favier, Francesca Becherini, Claudio Scarchilli, Virginia Ciardini, and Gabriele Carugati

In this study, surface mass balance (SMB) is estimated from snow accumulation data collected in the nearby area of Concordia Station. Results from the Italian and French stake farms are jointly analyzed. The Italian stake farm is located ~800 m southwest of the Concordia Station and consists of 13 stakes; observations started at the end of 2010 with almost monthly sampling. Some measurements are also available for the 2006-2010 period from a previous stake farm which was located ~300 m east of the current site. The French stake farm is located ~2 km south of the base and consists of 50 stakes; observations started in 2004 with yearly sampling conducted during austral summer. Snow build-up measurements at individual stakes show a strong variability caused by the interaction of wind-driven snow with surface micro-relief. Over the period of common observations, the present Italian stake farm generally underestimates the snow accumulation with respect to the French one, except for three years in which an overestimation is observed. Over the 2011-2023 period, the mean yearly accumulation recorded by the Italian and French stake farms is 7.3±0.2 cm and 8.4±0.1 cm, respectively. Bootstrap simulation has been performed to: (i) assess the significance of the differences between the two datasets; (ii) evaluate the effect of the different size of the stake farms and their distance to the Station on the measurements. Comparison of the observations with reanalysis datasets (ERA5 and MERRA2) and regional models (RACMO, MAR) has been also performed, with the first ones providing the best agreement with the observations. The potential shadowing effect of the station has also been investigated by analyzing the wind direction during the snowfall events, suggesting that buildings may influence accumulation when they are upwind with respect to the stake farms. Additionally, two more stake farms, located 25 km north and south of Concordia Station, are also analyzed to study the accumulation gradient across Dome C, confirming previous results of a continentality effect. On average, yearly accumulation increases by 0.7±0.2 cm over the 50 km span between the southern and northern stake farms. Results should be valuable for validating SMB estimates obtained from reanalysis, regional climate models and remote-sensing data.

How to cite: Stefanini, C., Stenni, B., Masiol, M., Dreossi, G., Frezzotti, M., Favier, V., Becherini, F., Scarchilli, C., Ciardini, V., and Carugati, G.: Snow accumulation rates at Concordia Station from stake farm observations, EGU General Assembly 2025, Vienna, Austria, 27 Apr–2 May 2025, EGU25-5578, https://doi.org/10.5194/egusphere-egu25-5578, 2025.

The importance of employing a two-way coupled climate-ice sheet model for future sea level projection has been revealed by LOVECLIP simulation. However, it still has several limitations. LOVECLIM, the climate model used in LOVECLIP, is unsuitable for short-term simulation. Additionally, LOVECLIM with a low-resolution T21 cannot solve regional-scale changes over the Antarctic region. Therefore, we newly coupled CESM1.2 to the Penn State Ice Sheet Model (PSUIM). CESM1.2 consists of the Community Atmosphere Model (CAM) with a f09 resolution for the atmosphere and Parallel Ocean Program version 2 (POP2) with a gx1v6 resolution for the ocean. Using coupled CESM1.2-PSUIM, we projected the responses of Greenland and Antarctic ice sheets, as well as future climate and sea level rise under the Representative Concentration Pathway scenarios.

How to cite: Park, J.: Coupled CESM1.2 to Penn State University Ice Sheet Model and future sea level projection, EGU General Assembly 2025, Vienna, Austria, 27 Apr–2 May 2025, EGU25-6338, https://doi.org/10.5194/egusphere-egu25-6338, 2025.

EGU25-6677 | ECS | Orals | CR2.2

A combined radiostratigraphy- and ice-core- derived age scale for ice at the divide between the Amundsen, Bellingshausen and Weddell seas, West Antarctica 

Harry Davis, Robert Bingham, Andrew Hein, Anna Hogg, Carlos Martín, and Elizabeth Thomas

Despite ice cores providing high-resolution climate records, few ice cores extracted from the West Antarctic Ice Sheet (WAIS) cover the Holocene, nor extend into the last glacial period. Marine ice-sheet basins, such as those underlying the WAIS, have been shown to be particularly vulnerable to retreat and possible collapse during past warm periods, and thus have significant potential to contribute to global sea-level rise. Dynamic thinning and retreat of ice are underway in the Amundsen Sea and Bellingshausen Sea sectors of the WAIS, yet this Pacific-facing region remains relatively data-poor for informing estimates of past and future retreat rates and sea-level contributions.

In 2010/11, a 136 m ice core was drilled at the three-way ice divide between Ferrigno Ice Stream, Pine Island Glacier, and Evans Ice Stream catchments. To further investigate this region, we analyse the internal structure across this region imaged through three intersecting radar surveys: (1) a 2004/05 UK/BAS survey, conducted with the Polarimetric Airborne Survey INstrument (PASIN), (2) a 2009/10 ground-based survey of Ferrigno Ice Stream, carried out with 3 MHz radar; and (3) NASA Operation Ice Bridge airborne surveys acquired in 2016 and 2018, which utilised the Multichannel Coherent Radar Depth Sounder 2 (MCoRDS2). We provide dating control to the traced englacial stratigraphy from tying it to the age-depth profile provided by the WAIS Divide Ice Core in central West Antarctica.

We then utilise a 1-D numerical ice-flow model, optimised by shallow ice-core data and these dated internal reflection horizons at the three-way ice divide, to infer palaeo-accumulation rates throughout the Holocene, and place age constraints on the age of the oldest ice at a proposed deep ice-core drill site at Ferrigno Ice Stream. We show that the method is robust and effectively synthesises the shallow ice-core data and the dated internal reflection horizons to reconstruct past climate records. The modelled maximum age at the three-way ice divide is around 24.77 ka +/- 6.88 ka, with a resolution of around 0.6 ka m-1at the depth of the oldest ice, making this an ideal site for a new deep ice core in West Antarctica. In addition, the ice core would be located in a coastal area and may provide key insights glacial extent during deglaciation.

How to cite: Davis, H., Bingham, R., Hein, A., Hogg, A., Martín, C., and Thomas, E.: A combined radiostratigraphy- and ice-core- derived age scale for ice at the divide between the Amundsen, Bellingshausen and Weddell seas, West Antarctica, EGU General Assembly 2025, Vienna, Austria, 27 Apr–2 May 2025, EGU25-6677, https://doi.org/10.5194/egusphere-egu25-6677, 2025.

EGU25-7500 | Posters on site | CR2.2

Global High-Resolution Modeling: A New Lens on the Southern Ocean 

Mira Berdahl, Gunter Leguy, Eric J. Steig, William H. Lipscomb, and Bette L. Otto-Bliesner

Modern West Antarctic ice loss is generally driven by warm circumpolar deep water (CDW) reaching ice shelf grounding zones. Understanding what controls CDW delivery remains a challenge, in part because of the multiple scales involved. Most global models are too coarse to capture critical regional processes, while simulations with high-resolution regional models depend on imposed boundary conditions, precluding the possibility of capturing coupled processes across scales.  Here, we analyze a novel multi-member ensemble of global high-resolution (0.1° ocean, 0.25° atmosphere) Community Earth System Model (CESM) simulations over the historical period (1850-2005).   We compare the high-resolution runs to equivalent simulations at ~1 to 2° resolution, as well as to observational products (e.g. ECCO, WOA).  We show that biases in key ocean properties in the Southern Ocean are significantly improved in the high-resolution simulations.  This includes better representation of CDW in the high-resolution runs. We use these comparisons to explore new insights on the atmosphere and ice conditions that promote CDW delivery toward the ice shelves.

How to cite: Berdahl, M., Leguy, G., Steig, E. J., Lipscomb, W. H., and Otto-Bliesner, B. L.: Global High-Resolution Modeling: A New Lens on the Southern Ocean, EGU General Assembly 2025, Vienna, Austria, 27 Apr–2 May 2025, EGU25-7500, https://doi.org/10.5194/egusphere-egu25-7500, 2025.

EGU25-7794 | ECS | Posters on site | CR2.2

Short-term variations of spaceborne microwave brightness temperature on the Greenland ice sheet during the 2012 melting season. 

Takumi Suzuki, Rigen Shimada, Misako Kachi, and Tomonori Tanikawa

The accelerated melting of the Greenland ice sheet, driven by recent global warming, has attracted significant attention regarding the long-term variations in its mass balance. While several analyses have utilized snow melting indicators derived from microwave brightness temperatures observed through satellites, there is a lack of studies examining the diurnal behavior of these temperatures during the melting season. The Advanced Microwave Satellite Radiometer 2 (AMSR2) aboard the Global Change Observation Mission – Water (GCOM-W) satellite provides multiple daily observations on the Greenland ice sheet, enabling the investigation of diurnal changes in brightness temperature. This study aims to clarify the short-term relationship between snow melting and spaceborne microwave brightness temperatures during the summer of 2012, a period marked by extensive melting of the Greenland ice sheet. To examine the timing of snowmelt, snow surface temperature data collected by the Automated Weather Station (AWS) at a site on the ice sheet in north-west Greenland were utilized. The time series of snow surface temperatures from July to August 2012 were analyzed, revealing distinct patterns across three periods: Period A (early-July: snow temperature of 0°C only during the day), Period B (mid-July: snow temperature of 0°C throughout the day), and Period C (mid-August: snow temperature below 0°C all day). In the north-west regions, Snow Index (Tb18H − Tb36H: Difference in brightness temperature between 18 GHz-H and 36 GHz-H) values, indicative of snow cover, showed significantly different short-term variations between the periods. During Period A, Snow Index values were positive throughout the day and decreased towards the afternoon. In contrast, during Period B, Snow Index values were negative throughout the day, with no significant diurnal changes observed. During Period C, Snow Index values returned to positive again and, as in the previous period, no significant changes were observed during the day. These results suggest the possibility of monitoring diurnal melting with high temporal resolution through short-term variations in spaceborne microwave brightness temperature. These variations across the Greenland ice sheet, including other frequency channels, will be further discussed during the conference day.

How to cite: Suzuki, T., Shimada, R., Kachi, M., and Tanikawa, T.: Short-term variations of spaceborne microwave brightness temperature on the Greenland ice sheet during the 2012 melting season., EGU General Assembly 2025, Vienna, Austria, 27 Apr–2 May 2025, EGU25-7794, https://doi.org/10.5194/egusphere-egu25-7794, 2025.

EGU25-8670 | ECS | Orals | CR2.2

Unravelling abrupt transitions of Antarctic Ice Sheet dynamics during the mid-Pleistocene transition 

Christian Wirths, Antoine Hermant, Christian Stepanek, Thomas Stocker, and Johannes Sutter

A mechanistic understanding of the main drivers of Quaternary climate variability, especially during the mid-Pleistocene transition (MPT; around 1.2–0.8 million years ago) remains a significant challenge in paleoclimate research. Climate changes during that time include a pronounced shift from 41-kyr to 100-kyr periodicity of glacial cycles as imprinted on sea level reconstructions, and the emergence of much larger ice sheets. While several modeling studies have focused on the interplay between the climate system and northern hemispheric ice sheets during the MPT, the role of Antarctica in driving and responding to climate change at that time remains largely unknown.  

Here, we use the Parallel Ice Sheet Model (PISM) to simulate the transient evolution of the Antarctic Ice Sheet throughout the last 3 million years. PISM is forced by a climate index approach that is based on snapshots of climatic conditions in the past. Climate snapshots are derived from the Community Earth System Models (COSMOS), a general circulation model that simulates atmosphere, ocean, sea ice and land vegetation in dependence of reconstructions of paleogeography, orbital configuration, and greenhouse gas concentrations. Interpolation in times between snapshots is linear and based on a convolution of the EPICA Dome C record and the Lisiecki-Raymo benthic isotope stack.  

Our simulations indicate that between 1.9 Ma and 800 ka BP, several Antarctic drainage basins crossed critical thresholds at different times, for example leading to the formation of a stable marine-based West Antarctic Ice Sheet. We further examine the characteristics of these thresholds and their associated state transitions. Additionally, our findings suggest that these thresholds, and their interplay, amplified eccentricity-driven climate variability both before and during the MPT, providing new insights into the complex interactions between Antarctic ice sheet dynamics and climate during this period. 

How to cite: Wirths, C., Hermant, A., Stepanek, C., Stocker, T., and Sutter, J.: Unravelling abrupt transitions of Antarctic Ice Sheet dynamics during the mid-Pleistocene transition, EGU General Assembly 2025, Vienna, Austria, 27 Apr–2 May 2025, EGU25-8670, https://doi.org/10.5194/egusphere-egu25-8670, 2025.

EGU25-9305 | ECS | Orals | CR2.2

Stability of the Greenland and Antarctic ice sheets coupled by the Atlantic ocean circulation 

Sergio Pérez Montero, Jorge Alvarez-Solas, Alexander Robinson, and Marisa Montoya

Anthropogenic climate change poses a challenge to the stability of current ice sheets. Rising atmospheric temperatures accelerate surface melting in Greenland. Increased ocean temperatures can lead to ice loss at the margins of Antarctica, with positive feedbacks facilitating further ice loss. Both processes impact the Earth System by leading to rising sea level, increasing temperatures through albedo feedbacks, and altering global oceanic circulation. Past records indicate that there is a bipolar interaction between the ice sheets of the Northern and Southern Hemispheres modulated by the Atlantic Meridional Overturning Circulation (AMOC) that could ultimately affect their individual stability. Could the future response of the Greenland and Antarctic ice sheets perturb the AMOC in a manner that changes their own stability landscape? Here we will present the first results of the future evolution of the Greenland and Antarctic ice sheets as simulated with the ice-sheet model Yelmo coupled to a box model representing the oceanic circulation. We will show the coupled effects of the shrinking mass of the ice sheets on the AMOC stability and its feedback on the evolution of the ice sheets themselves.

How to cite: Pérez Montero, S., Alvarez-Solas, J., Robinson, A., and Montoya, M.: Stability of the Greenland and Antarctic ice sheets coupled by the Atlantic ocean circulation, EGU General Assembly 2025, Vienna, Austria, 27 Apr–2 May 2025, EGU25-9305, https://doi.org/10.5194/egusphere-egu25-9305, 2025.

EGU25-9630 | ECS | Posters on site | CR2.2

Modeling Antarctic Ice Sheet Dynamics in Response to Solar Radiation Management 

Marta Corrà, Antoine Hermant, Daniele Visioni, Paul Brent Goddard, Anthony Jones, Emma Spezia, and Johannes Sutter

The Antarctic Ice Sheet (AIS) could become the largest single contributor to future sea level rise (SLR). However, its response to rising global mean temperature remains highly uncertain, and potential Solar Radiation Modification (SRM) interventions during the 21st century further complicate the projections. Among these interventions, Stratospheric Aerosol Injections (SAI) have been proposed to limit atmospheric warming and potentially moderate or prevent AIS’ impact on SLR. This study examines the dynamic response of Antarctica to such SAI interventions, in the short-term (until the year 2100) and on centennial time scales. We use the Parallel Ice Sheet Model (PISM) forced by the Community Earth System Model 2 (CESM2) to compare the evolution of AIS under SAI scenarios with that under the Shared Socioeconomic Pathway 2-4.5 (SSP2-4.5). Our findings indicate that, on centennial timescales, SAI may be counterproductive in mitigating sea level rise due to the reduced Antarctic surface mass balance compared to the SSP2-4.5 scenario. Ice shelf thinning and grounding line dynamics emerge as dominant factors driving mid- and long-term AIS behavior, where ice dynamics dominate over the effects of constant climate forcing. Variations in the sliding law parameterization further influence simulated outcomes. Unsurprisingly, the results are highly dependent on the individual earth system model employed. To address this, we compare our findings with a suite of the Ice Sheet Model Intercomparison Project for CMIP6 (ISMIP6) scenarios, as well as additional SRM simulations performed using the Hadley Centre Global Environment Model version 2 (HadGEM2-ES).

How to cite: Corrà, M., Hermant, A., Visioni, D., Goddard, P. B., Jones, A., Spezia, E., and Sutter, J.: Modeling Antarctic Ice Sheet Dynamics in Response to Solar Radiation Management, EGU General Assembly 2025, Vienna, Austria, 27 Apr–2 May 2025, EGU25-9630, https://doi.org/10.5194/egusphere-egu25-9630, 2025.

EGU25-9731 | ECS | Orals | CR2.2

Simulated ice-ocean-bedrock interactions in Antarctica until year 3000 

Antonio Juarez-Martinez, Jan Swierczek-Jereczek, Javier Blasco, Jorge Alvarez-Solas, Alexander Robinson, and Marisa Montoya

The Antarctic Ice Sheet (AIS) is expected to be one of the dominant contributors to sea level rise in the near future. However, its future sea-level contribution is subject to substantial uncertainties related to modeling of physical processes. One key process is sub-shelf melting, which is particularly important in ice-shelf cavities, where warmer water intrusions could destabilize the corresponding ice shelves. This is of particular interest in the West Antarctic Ice Sheet, where many regions are marine based. Another fundamental process is Glacial Isostatic Adjustment, which is associated with the lithospheric rebound in response to changes in the ice load. Here, we use a 3D ice-sheet-shelf model coupled with a novel isostasy model to analyze the role of interactions between the ice, the ocean and the lithosphere in AIS projections during the next millennium. We combine experiments testing the sensitivity of several parameters concerning basal melting laws and different isostatic adjustment methods, under mean climatic conditions with high and low emissions scenarios. 


How to cite: Juarez-Martinez, A., Swierczek-Jereczek, J., Blasco, J., Alvarez-Solas, J., Robinson, A., and Montoya, M.: Simulated ice-ocean-bedrock interactions in Antarctica until year 3000, EGU General Assembly 2025, Vienna, Austria, 27 Apr–2 May 2025, EGU25-9731, https://doi.org/10.5194/egusphere-egu25-9731, 2025.

EGU25-10037 | ECS | Posters on site | CR2.2

Modelling the Northern Hemisphere ice sheet evolution during the last deglaciation and MIS-11 with an ice sheet-ice shelf coupled model 

Wei Liu, Qiuzhen Yin, Philippe Huybrechts, and Heiko Goelzer

Ice sheet models are essential tools for studying ice sheet dynamics in response to the climate evolution during the Quaternary glacial-interglacial cycles. Here, we develop a new version of the Northern Hemisphere ice sheet model (NHISM, Zweck and Huybrechts, 2005) by adding a user-friendly ice shelf module and other new characteristics, such as the configurable horizontal resolution and coupled sea level change. This new ice sheet-ice shelf coupled model is named NHISM1.1. The ice shelf module is based on the shallow shelf approximation, allowing simulation of ice stream advance into the ocean and the transformation between floating and grounded ice. NHISM1.1 is first used to conduct offline equilibrium ice-sheet simulations driven by observed present-day climate. It simulates a reasonable spatial distribution of the Northern Hemisphere ice sheets with a bias of less than 10% in the Greenland Ice Sheet volume compared to observation. We then use NHISM1.1 to perform offline transient ice sheet simulations for two distinct periods in the past, the Last Deglaciation and the entire MIS-11 period. In both cases, NHISM1.1 is driven by climate outputs of transient simulations performed with the LOVECLIM1.3 model. The performance of NHISM1.1 and the influence of various model configurations are evaluated by comparison with proxy reconstructions and other model simulations as well as sensitivity experiments. Our ice sheet simulations show that the NH ice sheets are largely consistent with geological evidence and that the incorporation of an ice shelf module is critical in properly reproducing glacial inception. By combining the analysis of climate simulations from LOVECLIM1.3 and offline ice sheet simulations from NHISM1.1, we propose that insolation plays a dominant role in driving the initial cooling of the Northern Hemisphere and the regrowth of its ice sheets during the MIS-11 glacial inception.

How to cite: Liu, W., Yin, Q., Huybrechts, P., and Goelzer, H.: Modelling the Northern Hemisphere ice sheet evolution during the last deglaciation and MIS-11 with an ice sheet-ice shelf coupled model, EGU General Assembly 2025, Vienna, Austria, 27 Apr–2 May 2025, EGU25-10037, https://doi.org/10.5194/egusphere-egu25-10037, 2025.

EGU25-10066 | ECS | Posters on site | CR2.2

Assessing Antarctic Ice Sheet dynamics under temporary overshoot and long-term temperature stabilization scenarios   

Emma Spezia, Marta Corrà, Julien Bodart, Vjeran Višnjević, Fabrice Kenneth Michel Lacroix, Thomas Frölicher, and Johannes Sutter

Current projections of Antarctic Ice Sheet dynamics during the next centuries are subject to large uncertainties both reflecting the ice sheet model setup as well as the climate pathways taken into consideration. Assessing both, we present ice sheet model projections of the Antarctic Ice Sheet’s evolution during the next centuries using PISM. We employ PISM at continental scale forced by Earth system model data tailored to specific global temperature scenarios via an adaptive greenhouse gas emissions approach. The scenarios reflect a range of transient temperature overshoot (during the 21st and 22nd century) and stabilization trajectories until the year 2500 resulting either in 1.5 °C or 3°C warming. We account for various ice sheet sensitivities and initialize PISM with a present-day state obtained by a paleo thermal spin-up and further tuned on present-day conditions. For each climate scenario, a wide range of physical parameterizations is explored, to consider different ice sheet responses. Comparing the results with a historical baseline control simulation, a relative loss of ice volume proportional to temperature rise is observed across all parameters in the various scenarios. Additionally, tipping points can be identified for certain parameterisations, beyond which no significant differences are observed between stabilization and overshoot scenarios indicating an already destabilised West Antarctic Ice Sheet at present. We compare these results with model projections based on a selection of the CMIP6 scenarios to illustrate the range of Antarctic Ice Sheet responses under uncertain future climate trajectories.

How to cite: Spezia, E., Corrà, M., Bodart, J., Višnjević, V., Lacroix, F. K. M., Frölicher, T., and Sutter, J.: Assessing Antarctic Ice Sheet dynamics under temporary overshoot and long-term temperature stabilization scenarios  , EGU General Assembly 2025, Vienna, Austria, 27 Apr–2 May 2025, EGU25-10066, https://doi.org/10.5194/egusphere-egu25-10066, 2025.

EGU25-10219 | ECS | Orals | CR2.2

Safety Bands of Thwaites Glacier 

Daniel Moreno-Parada, Violaine Coulon, and Frank Pattyn

Mass loss from the Antarctic Ice Sheet is the main source of uncertainty in projections of future sea-level rise. These uncertainties essentially stem from the fact that some regions, such as Thwaites Glacier, may reach a tipping point, defined as irreversible mass loss on human time scales, with a warming climate. The exact timing of when these tipping points may occur remains difficult to determine, allowing for a large divergence in timing of onset and mass loss in model projections. Previous studies have emphasized the difficulties assessing the most suitable observable and the record length necessary to predict such an abrupt collapse within the Early Warning Indicators (EWI) framework. In particular, Rosier et al. (2021) showed that EWI robustly detect the onset of the marine ice sheet instability in realistic geometries such as Pine Island Glacier. The goal of this work is to determine the physical processes that influence the rate of grounding-line retreat of Thwaites Glacier and to test the capability of EWI to predict the onset of such a collapse. Ultimately, this study aims at mapping potential safety bands of grounding-line positions where the glacier may still recover or alternatively reach a ‘stable’ state. 

How to cite: Moreno-Parada, D., Coulon, V., and Pattyn, F.: Safety Bands of Thwaites Glacier, EGU General Assembly 2025, Vienna, Austria, 27 Apr–2 May 2025, EGU25-10219, https://doi.org/10.5194/egusphere-egu25-10219, 2025.

EGU25-11215 | ECS | Posters on site | CR2.2

Extending our knowledge of Antarctic SMB further back in time 

Damien Maure, Christoph Kittel, Clara Lambin, Quentin Dalaiden, Hugues Goosse, and Xavier Fettweis

The reconstruction of Antarctic surface mass balance (SMB) is essential for understanding ice sheet dynamics and sea level rise, yet existing datasets are limited to the satellite era (1979-present) because little is known about the sea surface conditions (SSCs) before 1979. Using a new SSCs product derived from a particle filtering reconstruction of the southern climate before 1979 to constrain the regional atmospheric model MAR, we expand the known SMB time series up to 1958. The dataset has been evaluated against AWS and SMB measurement campaigns to ensure a good agreement throughout the simulation period, substantially better than when MAR is forced by ERA5 SSCs (HadISST2). We also investigate the influence of the sea ice extent drop on SMB observed between the 70s and the 80s, analogous to the one observed in 2016. This extended dataset offers improved insight into past ice sheet mass changes and highlights the importance of long-term SMB reconstructions for further understanding the role of the Antarctic ice sheet in Earth's climate system.

How to cite: Maure, D., Kittel, C., Lambin, C., Dalaiden, Q., Goosse, H., and Fettweis, X.: Extending our knowledge of Antarctic SMB further back in time, EGU General Assembly 2025, Vienna, Austria, 27 Apr–2 May 2025, EGU25-11215, https://doi.org/10.5194/egusphere-egu25-11215, 2025.

EGU25-11339 | ECS | Posters on site | CR2.2

A Greenland-wide Holocene deglaciation model and building an accompanying 14C database 

Astrid Rosenberg, Gregor Luetzenburg, Ole Bennike, Kristian Kjellerup Kjeldsen, and Nicolaj Krog Larsen

The timing of the Greenland Ice Sheet's retreat from its extent during the Last Glacial Maximum is a key element in constraining the sensitivity of the ice sheet to climate forcing. Although different deglaciation models have been published in previous years (Bennike, 2002; Funder et al., 2011; Sinclair et al., 2016; Leger et al., 2024), these models are limited by the number of samples used or their geographical extent. Therefore, the models have not been able to adequately resolve the deglaciation chronology of the Greenland Ice Sheet.

In this project, we aim to develop a Greenland-wide deglaciation model based on a new compilation of 14C dates, cosmogenic nuclide dates, OSL dates, and geomorphological evidence. The new compilation of 14C samples will be provided as an open-access database: GreenDated.

Within GreenDated, we aim to include all published 14C data from Greenland and the surrounding ocean shelf. All sample entries will as a minimum include information on location, and a categorization of the depositional environment and the sampled material. These steps will ensure accessibility for future users and enable easy extraction of data from the database. We will also recalibrate all the 14C data using the newest calibration curves (Heaton et al., 2020; Reimer et al., 2020) and adjust for differences in old normalization techniques, enabling easy recalibration of data for future users. Lastly, we will conduct a quality assessment based on the protocol used in the Dated (Hughes et al., 2016) and SvalHola (Farnsworth et al., 2020) databases, with the addition of an automated scoring system, seeking to limit bias from the authors.

Ultimately, the deglaciation model and the accompanying GreenDated database will provide a complete and thorough constraint on the Greenland Ice Sheet’s retreat from the Last Glacial Maximum position.

References:
Bennike, O. (2002) ‘Late Quaternary history of Washington Land, North Greenland’, Boreas, 31(3), pp. 260–272. https://doi.org/10.1111/j.1502-3885.2002.tb01072.x.
Farnsworth, W.R. et al. (2020) ‘Holocene glacial history of Svalbard: Status, perspectives and challenges’, Earth-Science Reviews, 208, p. 103249. https://doi.org/10.1016/j.earscirev.2020.103249.
Funder, S. et al. (2011) ‘The Greenland Ice Sheet During the Past 300,000 Years: A Review’, Developments in Quaternary Science, 15, pp. 699–713. https://doi.org/10.1016/B978-0-444-53447-7.00050-7.
Heaton, T.J. et al. (2020) ‘Marine20—The Marine Radiocarbon Age Calibration Curve (0–55,000 cal BP)’, Radiocarbon, 62(4), pp. 779–820. https://doi.org/10.1017/rdc.2020.68.
Hughes, A.L.C. et al. (2016) ‘The last Eurasian ice sheets – a chronological database and time-slice reconstruction, DATED-1’, Boreas, 45(1), pp. 1–45.  https://doi.org/10.1111/bor.12142.
Leger, T.P.M. et al. (2024) ‘A Greenland-wide empirical reconstruction of paleo ice sheet retreat informed by ice extent markers: PaleoGrIS version 1.0’, Climate of the Past, 20(3), pp. 701–755. https://doi.org/10.5194/cp-20-701-2024.
Reimer, P.J. et al. (2020) ‘The IntCal20 Northern Hemisphere Radiocarbon Age Calibration Curve (0–55 cal kBP)’, Radiocarbon, 62(4), pp. 725–757. https://doi.org/10.1017/rdc.2020.41.
 inclair, G. et al. (2016) ‘Diachronous retreat of the Greenland ice sheet during the last deglaciation’, Quaternary Science Reviews, 145, pp. 243–258. https://doi.org/10.1016/j.quascirev.2016.05.040.

How to cite: Rosenberg, A., Luetzenburg, G., Bennike, O., Kjellerup Kjeldsen, K., and Krog Larsen, N.: A Greenland-wide Holocene deglaciation model and building an accompanying 14C database, EGU General Assembly 2025, Vienna, Austria, 27 Apr–2 May 2025, EGU25-11339, https://doi.org/10.5194/egusphere-egu25-11339, 2025.

EGU25-11420 | ECS | Orals | CR2.2

New monthly maps of accumulation over the Greenland Ice Sheet 

Josephine Lindsey-Clark, Aslak Grinsted, and Christine Hvidberg

The Greenland Ice Sheet (GrIS) has become the single largest contributor to present day sea-level rise, with mass loss driven by changes in Surface Mass Balance (SMB). As the largest component of SMB, snow accumulation is critical to monitor as Arctic warming continues at an accelerated rate. Snowfall patterns across GrIS are influenced by a complex interaction of many interdependent climate variables, leading to high inter-annual spatial variability. As a result, regional climate models (RCMs) often fail to adequately capture this variability and carry substantial uncertainties, leading to biased estimations of ice mass loss. Here, we present a novel method to bias-adjust RCM precipitation output with in-situ SMB records from the SUMup dataset (2024 release), including over two million data points from radar, ice-core, snow pit and stake measurements. RCM output data is first decomposed into Empirical Orthogonal Functions (EOFs), reflecting different modes of spatial variability, and Principal Components (PCs), capturing temporal fluctuations correlating to various climate indices. The SUMup in-situ measurements are used to derive a set of coefficients to scale the model mean climatology and each EOF and PC through least-squares optimisation. We provide monthly bias-adjusted accumulation maps for HIRHAM5-ERA5 output between 1960-2023 and CARRA between 1991-2023, highlighting regional biases in the models through time. 

Preliminary mean bias maps for HIRHAM5 show that the model underestimates accumulation in the south and interiors of the ice sheet by 20-80% or 30-90 mm/year, while the west and east margins of the accumulation zone are overestimated by 20-60% or 30-150 mm/year. In the winter and spring, the model tends to underestimate accumulation overall by 50-100 mm/year, while the reverse is true for the summer and autumn, when accumulation is mostly overestimated, reaching up to 200 mm/year in the north west. 

How to cite: Lindsey-Clark, J., Grinsted, A., and Hvidberg, C.: New monthly maps of accumulation over the Greenland Ice Sheet, EGU General Assembly 2025, Vienna, Austria, 27 Apr–2 May 2025, EGU25-11420, https://doi.org/10.5194/egusphere-egu25-11420, 2025.

EGU25-11651 | ECS | Posters on site | CR2.2

Towards understanding the effects of extreme events on Antarctic ice-sheet dynamics  

Lena Nicola, Johanna Beckmann, Felicity McCormack, and Ricarda Winkelmann

Projections of Antarctica's future sea-level contribution are still subject to great uncertainties, especially with respect to changes in surface mass balance and sub-shelf melting. While the climatic forcing used as boundary condition for ice sheet models cover the average trend in mass balance with global warming, extreme events, such as heatwaves, are typically not yet considered. However, a number of record-breaking extreme events have been observed in recent years in Antarctica already and may become more frequent or extreme with ongoing climate change. Here we investigate the effects of heatwaves on ice-sheet dynamics: using a storyline approach for conducting a suite of numerical ice-sheet simulations, we explore the additional Antarctic contribution to future sea-level rise when atmospheric extreme events are considered in projections. We set this into perspective with anomalous freshwater fluxes from ocean-driven melting (and calving) and investigate the potential for abrupt shifts and tipping dynamics, which extreme events may cause or pre-condition.

How to cite: Nicola, L., Beckmann, J., McCormack, F., and Winkelmann, R.: Towards understanding the effects of extreme events on Antarctic ice-sheet dynamics , EGU General Assembly 2025, Vienna, Austria, 27 Apr–2 May 2025, EGU25-11651, https://doi.org/10.5194/egusphere-egu25-11651, 2025.

EGU25-11803 | Posters on site | CR2.2

Bridging the gap between the modern and historical: Extending the mass balance reconstruction of the Greenland Ice Sheet from 1421 to 2024 AD 

Leanne Wake, Aaquib Javed, Emily Hill, Edward Hanna, and Hilmar Gudmundsson

Bridging the knowledge gap between the recent decades and the preceding centuries of Greenland Ice Sheet (GrIS) history is essential for improving projections of its contribution to future sea-level rise. Evidence from relative sea-level reconstructions from salt marshes in southern Greenland suggests that GrIS mass loss began around 1850, well before significant anthropogenic warming—a pattern not yet captured in existing simulations of late Holocene GrIS evolution. Extending reconstructions of GrIS surface mass balance (SMB) as far back as possible, by leveraging newly available climate datasets from ~AD 1400 is critical to understanding its sensitivity to climate forcings during key periods such as the Little Ice Age. 

By addressing the underrepresentation of dynamic components and calculation of pre-20th century mass changes, this project aims to provide critical insights into GrIS-climate interactions and refine predictions of GrIS contributions to global sea-level rise. To achieve this aim, we will first  develop a 1x1-km resolution monthly SMB dataset using ModE-RA, a new palaeoclimate reanalysis product spanning 1421-2024.  This new SMB dataset will be used as input to ice sheet model simulations to assess the  spatial and temporal interplay between climate, SMB and ice dynamics.

Here we will present initial results of (1) GrIS temperature, precipitation and SMB fields for 1421 to 2024 AD and (2) historical simulations using the ice sheet model Úa to reconstruct ice thickness and margin changes outside of the observational period.

How to cite: Wake, L., Javed, A., Hill, E., Hanna, E., and Gudmundsson, H.: Bridging the gap between the modern and historical: Extending the mass balance reconstruction of the Greenland Ice Sheet from 1421 to 2024 AD, EGU General Assembly 2025, Vienna, Austria, 27 Apr–2 May 2025, EGU25-11803, https://doi.org/10.5194/egusphere-egu25-11803, 2025.

EGU25-12628 | ECS | Orals | CR2.2

Hysteresis of the Antarctic ice sheet with a coupled climate-ice-sheet model 

Gaëlle Leloup, Aurélien Quiquet, Didier Roche, Christophe Dumas, and Didier Paillard

Anthropogenic greenhouse gas emissions and resulting global warming raise uncertainties in the future of currently existing ice sheets. The Antarctic ice sheet, which contains the equivalent of 58 meters of potential sea level rise, is expected to have a relatively small role on sea level rise in this century, but is expected to continue to lose mass afterwards and could become a major driver of sea level rise on longer timescales (Van Breedam et al., 2020; Winkelmann et al., 2015).

The Antarctic ice sheet interacts with the solid Earth, the ocean and the atmosphere, resulting in various positive and negative feedbacks, enhancing or limiting ice sheet growth (Fyke et al., 2018). Positive feedback mechanisms, such as the albedo-melt and elevation-temperature feedbacks, enhance the ice sheet's response to an initial change in forcing, potentially resulting in nonlinear changes, and it is thus crucial to model these feedbacks on long timescales, when significant changes of the ice sheet’s topography can occur. Nonlinear changes can lead to a hysteresis behaviour, with widely different equilibrium states for a given CO2 level or temperature anomaly, depending on the initial condition (Pollard and de Conto, 2005; Garbe et al., 2020; Van Breedam et al., 2023).

In this study, we explore the hysteresis of the Antarctic ice sheet from the present-day configuration, using an intermediate complexity climate model, iLOVECLIM, representing the atmosphere, ocean and vegetation, coupled to an ice sheet model, GRISLI. Simulations start from either a pre-industrial ice sheet or an ice-free, isostatically rebounded geometry, and different CO2 levels are applied.

Crucially, the albedo-melt feedback is accounted for in our coupled setting, which strengthens nonlinear behaviour and leads to critical CO2 thresholds for the ice sheet melt or growth. This enhances the ice sheet hysteresis, with widely different equilibrium ice volumes at a given CO2 level, depending on the initial ice sheet geometry. The CO2 thresholds either trigger the complete Antarctic ice sheet loss or near-complete regrowth. The orbital configuration influences these CO2 thresholds : a higher (lower) summer insolation in the Southern Hemisphere decreases (increases) the CO2 threshold for Antarctic deglaciation (glaciation).

These findings highlight the importance of ice sheet-atmosphere interactions, notably the albedo-melt feedback, in projecting future long-term ice sheet behavior. Neglecting these feedbacks could lead to an overestimation of CO2 thresholds for the Antarctic ice sheet destabilization, with implications for future long-term sea level rise under high emission scenarios.

This study has recently been accepted in Geophysical Research Letters.

How to cite: Leloup, G., Quiquet, A., Roche, D., Dumas, C., and Paillard, D.: Hysteresis of the Antarctic ice sheet with a coupled climate-ice-sheet model, EGU General Assembly 2025, Vienna, Austria, 27 Apr–2 May 2025, EGU25-12628, https://doi.org/10.5194/egusphere-egu25-12628, 2025.

EGU25-13026 | Orals | CR2.2

Climate state dependence of ice sheet variability 

Georgia Grant

Cenozoic climate has evolved through stepwise quasi-equilibrium states in response to declining CO2 concentration. As a result, terrestrial polar ice sheets developed in Antarctica ~35 million years ago describing relatively large glacial-interglacial changes, prior to an increasing marine-based ice sheet component by ~15 Ma with lower glacial-interglacial variability, before returning to large glacial-interglacial amplitudes in response to the intensification of Northern Hemisphere Ice Sheets (~2.7 Ma). While mean surface temperature scales linearly with the total concentration of carbon in the atmosphere, this is not the case for past variations in global mean sea-level whose amplitudes are climate-state (CO2)-dependent. By examining past climate drivers (atmospheric CO2) and the response of ice volume (sea level), polar ice sheets are seen to demonstrate vastly different sensitivities under changing climate states highlighted by the ‘100-kyr’ problem of non-linear ice sheet change.

In this study, a new independent global ice volume (sea-level) record (X-PlioSeaNZ: 3.3 – 1.7 Ma) is used to evaluate the deep-sea oxygen isotope proxy record (δ18Obenthic).  An empirical, power-law relationship emerges between δ18Obenthic and sea-level in contrast to long-standing linear δ18Obenthic calibrations. This relationship suggests relatively higher deep-ocean temperature contribution to δ18Obenthic signal and correspondingly lower global ice volume estimates under warmer past climates. It also demonstrates the need for variable ice volume-δ18Obenthic calibrations in response to the evolving bipolar ice sheet geographies over the last ~3 million years (Myr). Consequently, as the Earth system adjusts to 2-3°C of global warming over the coming decades and centuries, a lower paleo-ice sheet sensitivity (compared to the Last Glacial Maximum) is expected for ice sheet configurations where marine based ice sheets act as a buffer to terrestrial based ice sheets and brings geologic reconstructions into agreement with current projections for future sea-level rise.

How to cite: Grant, G.: Climate state dependence of ice sheet variability, EGU General Assembly 2025, Vienna, Austria, 27 Apr–2 May 2025, EGU25-13026, https://doi.org/10.5194/egusphere-egu25-13026, 2025.

EGU25-13742 | Posters on site | CR2.2

Geomorphological and sedimentological evidence of past Greenland Ice Sheet advance and retreat on the continental shelf offshore of SE Greenland as revealed by ‘Kang-Glac’ cruise SD041  

Colm O Cofaigh, Kelly Hogan, Jeremy Lloyd, Matthew Hunt, Camilla Snowman Andresen, Robert Larter, and David Roberts

Cruise SD041 of the UK research vessel the RRS Sir David Attenborough to the continental shelf offshore of SE Greenland took place in July-August 2024. The cruise was part of the UK NERC-funded ‘Kang-Glac’ project, a large multi-disciplinary, international, research project jointly led by British Antarctic Survey and Durham University, UK. The cruise collected a range of geological, geophysical, oceanographic and biological data from the continental shelf offshore of Kangerlussuaq Fjord, SE Greenland, and in several adjoining fjords. The aim of the Kang-Glac project is to investigate the response of the Greenland Ice Sheet to ocean warming during the last 11,700 years of the Holocene. During the cruise marine geophysical data in the form of multibeam swath bathymetric imagery of seafloor landforms and sub-bottom profiler data of shallow acoustic stratigraphy were collected, in addition to a suite of sediment cores. Data collection targeted a large cross-shelf bathymetric trough (‘Kang-Trough’) which extended from the mouth of Kangerlussuaq Fiord to the edge of the continental shelf, as well as a series of smaller fjords to the northeast. These marine geophysical data and sediment cores provide a clear record of an extensive Greenland Ice Sheet (GrIS) which expanded and retreated across the shelf via Kang-Trough. Landforms comprise well developed streamlined subglacial bedforms which show convergent GrIS flow into the trough, as well as occasional transverse moraines recording episodic retreat. Sediment cores recovered subglacial tills recording a grounded ice sheet in the cross-shelf trough overlain by a range of deglacial glacimarine facies recording retreat by melting and iceberg calving. Cores from the adjacent trough mouth fan on the continental slope targeted glacigenic debris flows which likely were deposited when the GrIS was grounded at the shelf edge and delivered glacigenic debris onto the slope. Collectively the data provide new insights into past GrIS extent, dynamics, and the nature of associated glacigenic sediment delivery from the LGM through the Holocene in the SE sector of the Greenland continental margin.

How to cite: O Cofaigh, C., Hogan, K., Lloyd, J., Hunt, M., Snowman Andresen, C., Larter, R., and Roberts, D.: Geomorphological and sedimentological evidence of past Greenland Ice Sheet advance and retreat on the continental shelf offshore of SE Greenland as revealed by ‘Kang-Glac’ cruise SD041 , EGU General Assembly 2025, Vienna, Austria, 27 Apr–2 May 2025, EGU25-13742, https://doi.org/10.5194/egusphere-egu25-13742, 2025.

EGU25-14498 | ECS | Posters on site | CR2.2

Revisiting Antarctic surface melting under climate change by the end of the 21st century using a simple surface energy balance approach 

In-Woo Park, Emilia Kyung Jin, Won Sang Lee, and Kang-Kun Lee

Extensive surface melting has been observed during the austral summer, particularly in the Antarctic Peninsula and peripheral regions. A warming climate change is expected to further increase both precipitation and surface melting due to rising air temperatures. The precipitation, including both liquid and solid phases, contributes to maintaining ice mass, whereas surface melting reduces ice thickness and promotes hydrofracturing of ice shelves, resulting in acceleration of ice mass loss. The Surface Energy and Mass balance model of Intermediate Complexity (SEMIC) is a cost-effective and simplified model which emulates surface energy and mass balance processes. However, its application to Antarctica has not yet been fully explored. In this study, we assess the performance of SEMIC, forced with daily and monthly ERA5 reanalysis data, in reproducing current surface mass balance (SMB) and surface melting. Furthermore, we evaluate future projections of SMB and surface melting under the sustainable (SSP1-2.6) and high-warming (SSP5-8.5) climate scenarios from CMIP6, extending to the end of the 21st century. Our results reveal that SEMIC effectively represents current SMB and surface melting when driven by both daily and monthly forcing, although it underestimates the extent of surface melting in internal ice sheet. Projections indicate that total surface melting volume under SSP1-2.6 and SSP5-8.5 scenarios is projected to gradually increase to 170.1 ± 65.1 Gt yr-1 and 892.4 ± 505.2 Gt yr-1, respectively, during 2090-2100. Under the warming scenario, the area experiencing surface melting exceeding collapse threshold (> 725 mm yr-1) increases significantly by the mid-21st century. While total precipitation is projected to increase, this is offset by an increase in surface melting, resulting in minimal net changes in SMB by the end of the 21st century.

How to cite: Park, I.-W., Jin, E. K., Lee, W. S., and Lee, K.-K.: Revisiting Antarctic surface melting under climate change by the end of the 21st century using a simple surface energy balance approach, EGU General Assembly 2025, Vienna, Austria, 27 Apr–2 May 2025, EGU25-14498, https://doi.org/10.5194/egusphere-egu25-14498, 2025.

EGU25-15073 | Posters on site | CR2.2

Version 3 of the Community Ice Sheet Model 

Gunter Leguy, William Lipscomb, Kate Thayer-Calder, Samar Minallah, Michele Petrini, Heiko Goeltzer, Tim van den Akker, Bill Sacks, Mariana Vertenstein, and Mira Berdahl

Version 3 of the Community Ice Sheet Model (CISM) is scheduled for release later this year along with version 3 of the Community Earth System Model (CESM). CISM is a parallel, open-source ice flow code, written in Fortran and Python, which can be run as a standalone ice sheet or glacier model or as a coupled component of CESM and NorESM. The model supports several Stokes-flow approximations and has participated in many community intercomparison projects, including ISMIP6, CalvingMIP, and GlacierMIP3.

CISM3 will include new physics options for basal sliding, basal hydrology, iceberg calving, and extrapolating sub-ice-shelf temperature and salinity. A new initialization procedure allows the rate of ice mass change to match observations at the beginning of a projection simulation.  Coupled CISM–CESM simulations can include two-way climate coupling with multiple ice sheets, including Antarctica. CISM3 also has an exciting new capability to initialize and simulate mountain glaciers.

To improve user experience, CISM3 will include new Python tools for setting up glacier and ice sheet simulations and analyzing ice-sheet-relevant fields from other CESM components. CISM is now more integrated with CESM than ever before, by leveraging the Common Infrastructure for Modeling the Earth (CIME) case control and testing system for verification and validation. 

This presentation showcases examples and results using CISM3’s new tools and capabilities. 

How to cite: Leguy, G., Lipscomb, W., Thayer-Calder, K., Minallah, S., Petrini, M., Goeltzer, H., van den Akker, T., Sacks, B., Vertenstein, M., and Berdahl, M.: Version 3 of the Community Ice Sheet Model, EGU General Assembly 2025, Vienna, Austria, 27 Apr–2 May 2025, EGU25-15073, https://doi.org/10.5194/egusphere-egu25-15073, 2025.

EGU25-15269 | Orals | CR2.2

Study on the Instability of Two Large Glaciers in Northeast Greenland in Recent 60 Years 

Lu An, Litao Dai, Xingchen Liu, and Rongxing Li

The Nioghalvfjerdsfjorden glacier (NG) and Zachariae Isstrøm (ZI) are major contributors to the mass balance of northeast Greenland, which drain 12% of the Greenland Ice Sheet. Accurate measurements of these two glaciers are crucial to the estimation of the mass balance in northeast Greenland. They also serve as an important parameter for reflecting climate change and predicting future sea level rise. In the past, early ice velocity data were scarce, primarily due to challenges in difficulties in image orthorectification caused by large distortions and low quality in historical remote sensing imagery. We proposed a systematic process for orthorectification of CORONA KH-4A imagery, which has proven to be both efficient and accurate in velocity mapping at a precision of 25m. By employing a hierarchical network densification approach based on ARGON KH-5 and CORONA KH-4A imagery, we have successfully reconstructed the ice flow velocity fields for NG and ZI from 1963 to 1967. Combining with other ice velocity products, we have obtained the ice velocity of NG and ZI spanning a period nearly 60 years. The results indicate that the average ice flow velocity near the grounding line has increased by 12.4% for NG and a substantial 81.4% for ZI from 1963 to 2020. While ZI is experiencing accelerated mass loss, the NG is still in a relatively stable state under the similar climate condition. The slight fluctuations in ice velocity for NG may be due to the unique topography and the hindering effect of ice rises, suggesting the climate change may have a comparatively less impact on it.

How to cite: An, L., Dai, L., Liu, X., and Li, R.: Study on the Instability of Two Large Glaciers in Northeast Greenland in Recent 60 Years, EGU General Assembly 2025, Vienna, Austria, 27 Apr–2 May 2025, EGU25-15269, https://doi.org/10.5194/egusphere-egu25-15269, 2025.

EGU25-15319 | ECS | Posters on site | CR2.2

Modelling future Antarctic climate and surface mass balance with RACMO2.4p1 (2015-2100) 

Marte G. Hofsteenge, Willem Jan van de Berg, Christiaan T. van Dalum, Kristiina Verro, Maurice van Tiggelen, and Michiel van den Broeke

We present the first results of future Antarctic climate simulations with the polar-adapted Regional Atmospheric Climate Model (RACMO2.4p1). As part of the PolarRES project, two climate storylines are explored, examining the response of the Antarctic surface mass balance (SMB) to two plausible future climates with varying degree of Antarctic sea ice loss and changes to upper atmospheric circulation. For this RACMO2.4p1 is run on a 11 km horizontal grid forced with high emission scenario SSP3-7.0 simulations from CESM2 and MPI-ESM for the period 2015-2100. To evaluate the model performance using climate model data, we compare historical simulations (1985-2015) forced by CESM2 and MPI-ESM to those forced by ERA5. We examine shifts in Antarctic precipitation and SMB between the current and future climate, and relate those changes to changes in atmopsheric circulation, atmospheric moisture budget and presence of sea ice.

How to cite: Hofsteenge, M. G., van de Berg, W. J., van Dalum, C. T., Verro, K., van Tiggelen, M., and van den Broeke, M.: Modelling future Antarctic climate and surface mass balance with RACMO2.4p1 (2015-2100), EGU General Assembly 2025, Vienna, Austria, 27 Apr–2 May 2025, EGU25-15319, https://doi.org/10.5194/egusphere-egu25-15319, 2025.

EGU25-15980 | ECS | Posters on site | CR2.2

Preliminary insights into Miocene palaeoprecipitation and palaeotemperature using speleothem fluid inclusion isotopes from eastern North Greenland 

Lena Friedrich, Gabriella Koltai, Gina E. Moseley, György Czuppon, Attila Demény, Jian Wang, Hai Cheng, Anika Donner, Yuri Dublyansky, and Christoph Spötl

The Miocene epoch was a warm period characterised by elevated atmospheric CO₂ levels compared to the present day. These CO₂ concentrations are similar to those predicted for future climate scenarios, making the Miocene an important period to deepen our understanding of warmer climates. While Greenland ice cores have provided highly valuable data for the late Quaternary, terrestrial palaeoclimate archives extending deeper in time in the Arctic remain sparse, leaving a significant gap in our knowledge of Greenland's climate history.

Speleothems are an excellent archive for obtaining high-resolution terrestrial climate data. During speleothem formation, dripwater can be trapped as fluid inclusions, preserving the isotopic signature of ancient meteoric water. This study focuses on four speleothems from a cave in eastern North Greenland. U-Pb dating indicates that the speleothems were deposited during the middle and late Miocene. We analysed the stable H isotopic composition of primary fluid inclusions to reconstruct the isotopic composition of palaeo-dripwater. Carbon and oxygen isotopes of the speleothem calcite were also measured in order to estimate quantitative temperatures for eastern North Greenland during middle and late Miocene. Our initial results show that during such an elevated CO2 world, mean annual air temperatures were substantially elevated above modern values.

Macroscopically, all speleothems are comprised of translucent and light brown calcite. Microscopically, the dominant fabric is coarsely crystalline columnar calcite. Fluid inclusion petrography shows the presence of both fluid inclusion-rich and inclusion-poor areas in the late Miocene speleothems, while primary fluid inclusions are abundant in the two middle Miocene speleothems. The mean water content obtained from crushing varies from 0.2 µL to 1.0 µL between the speleothems.

How to cite: Friedrich, L., Koltai, G., Moseley, G. E., Czuppon, G., Demény, A., Wang, J., Cheng, H., Donner, A., Dublyansky, Y., and Spötl, C.: Preliminary insights into Miocene palaeoprecipitation and palaeotemperature using speleothem fluid inclusion isotopes from eastern North Greenland, EGU General Assembly 2025, Vienna, Austria, 27 Apr–2 May 2025, EGU25-15980, https://doi.org/10.5194/egusphere-egu25-15980, 2025.

EGU25-16025 | Orals | CR2.2

Greenland and Antarctica as Interacting Constitutes in AWI-ESM 

Christian Rodehacke, Lars Ackermann, Paul Gierz, Ahmadreza Masoum, and Gerrit Lohmann

It is highly challenging to include both the Antarctic and Greenland ice sheets in a state-of-the-art earth system model. Our presentation demonstrates our system's design, the essential steps before coupling the entire system, the challenges faced in the coupling process, and the initial findings from our series of simulations for warming scenarios spanning the next few centuries until 2500.

We will highlight the existing limitations in the computed climate conditions that affect the behavior of ice sheets. These motivate our system's design. For instance, ocean temperature biases in the marginal seas around Antarctica inhibit its direct use to determine basal melting of floating ice shelves fringing Antarctica despite extensive tuning efforts. As a result, we have developed a flexible framework deemed necessary to adequately represent the currently observed ice sheet state. The still delicate integration of ice sheets into climate models directs the spin-up procedure of ice sheet models. The procedure's results and its consequences are presented and discussed. In particular, the available iceberg calving mechanism has been demanding in our simulations because we allow for freely waxing or waning ice shelf edges around Antarctica, unprecedented in coupled climate-ice sheet model systems.

Finally, the first results of our fully coupled simulations complete the presentation. These focus on the interaction between the climate system and Antarctica or Greenland and its influence on primary climatic conditions. In our model system, interacting ice sheets shape the climate state, creating feedback loops that affect the ice sheet state itself. This interaction may ultimately counteract the disintegration of ice sheets. Supposed it is a robust result, it implies that standalone ice sheet simulations may overestimate future sea level contributions.

How to cite: Rodehacke, C., Ackermann, L., Gierz, P., Masoum, A., and Lohmann, G.: Greenland and Antarctica as Interacting Constitutes in AWI-ESM, EGU General Assembly 2025, Vienna, Austria, 27 Apr–2 May 2025, EGU25-16025, https://doi.org/10.5194/egusphere-egu25-16025, 2025.

EGU25-16564 | Posters on site | CR2.2

Exploring Antarctic Circulation-Ice Sheet Interactions in UKESM Climate Projections Through 2500 and Beyond 

Sarah Taylor, Andrew Orr, Stephen Cornford, Thomas Bracegirdle, and Robin Smith

Understanding how key regional circulation features respond to future global warming is essential for projections of Antarctic Ice Sheet dynamics, and future global sea level rise. The Southern Annular Mode (SAM) influences the strength and location of the mid-latitude tropospheric westerly jet, which controls the transport of warm air and moisture towards the AIS. The Amundsen Sea Low (ASL), a permanent low-pressure system off the coast Antarctica affects regional wind patterns, precipitation and ocean circulation. These features can also impact the exchange of heat and carbon dioxide between the ocean and atmosphere, impacting sea ice extent and the stability of ice shelves. Under global warming scenarios, changes in these atmospheric features may significantly alter surface mass balance, surface melt, temperature and precipitation patterns over the AIS.

This study uses UK Earth System Model (UKESM) overshoot experiments that explore future emission increase, stabilization, and reduction simulations to investigate the interactions between atmospheric circulation features and the Antarctic cryosphere. These idealised simulations are forced only by CO2 concentrations and currently extend up to 650 years duration, allowing exploration of the response of the AIS to a range of global warming scenarios, and asses potential reversibility under future CO2 reduction.

This research utilises these simulations to identify trends in the SAM, ASL and westerly jets. Initial results show a deepening of the absolute pressure of the ASL, a poleward shift and strengthening of the westerly jet, with trends increasing and reversibility diminishing with higher global warming scenarios. These simulations are then used to identify any relationship between these features and trends in temperature, precipitation and surface melt over regions of the AIS and ice shelves, providing insights into the long-term stability of the AIS under varying climate scenarios.

How to cite: Taylor, S., Orr, A., Cornford, S., Bracegirdle, T., and Smith, R.: Exploring Antarctic Circulation-Ice Sheet Interactions in UKESM Climate Projections Through 2500 and Beyond, EGU General Assembly 2025, Vienna, Austria, 27 Apr–2 May 2025, EGU25-16564, https://doi.org/10.5194/egusphere-egu25-16564, 2025.

EGU25-16952 | ECS | Orals | CR2.2

From short-term uncertainties to long-term certainties in the future evolution of the Antarctic Ice Sheet 

Ann Kristin Klose, Violaine Coulon, Tamsin Edwards, Fiona Turner, Frank Pattyn, and Ricarda Winkelmann

The future evolution of the Antarctic Ice Sheet with progressing warming constitutes one of the, if not the main uncertainty in projections of future sea-level change. As the largest potential source of sea-level rise and one of the key tipping elements in the climate system, robust projections are needed to inform coastal adaptation planning worldwide.

Using historically-calibrated perturbed-parameter ensembles of projections with two ice-sheet models, we assess the response of the Antarctic Ice Sheet and associated uncertainties to a wide range of climate futures extending to the year 2300 and beyond.

We show that the near-term projections of the Antarctic Ice Sheet are strongly influenced by ice-sheet model sensitivities, especially under limited warming, until strong changes in Antarctic climate beyond the end of the century, as projected under unmitigated emissions, clearly dominate the ice-sheet evolution. Irrespective of the wide range of uncertainties explored in our ensembles, large-scale ice loss is triggered in both West and East Antarctica under higher warming scenarios, but can be avoided by reaching net-zero emissions well before 2100. This leads to a multi-meter difference in the committed Antarctic sea-level contribution projected under low and very high emission pathways by the end of the millennium. Our results suggest that the next years and decades are decisive for the multi-centennial fate of the Antarctic Ice Sheet.

How to cite: Klose, A. K., Coulon, V., Edwards, T., Turner, F., Pattyn, F., and Winkelmann, R.: From short-term uncertainties to long-term certainties in the future evolution of the Antarctic Ice Sheet, EGU General Assembly 2025, Vienna, Austria, 27 Apr–2 May 2025, EGU25-16952, https://doi.org/10.5194/egusphere-egu25-16952, 2025.

EGU25-17048 | Posters on site | CR2.2

Stability of interior North Greenland – an assessment from GPS and satellite data 

Christine S. Hvidberg, Aslak Grinsted, Kristian Keller, Helle A. Kjær, Nicholas Rathmann, Mikkel L. Lauritzen, Dorthe Dahl-Jensen, Ruth Mottram, Nicolaj Hansen, Martin Olesen, Sebastian Simonsen, Louise S. Sørensen, Anne M. Solgaard, and Nanna B. Karlsson

The mass loss from the Greenland ice sheet has increased over the last two decades, and is now a major contributor to the global mean sea level rise. While the interior of the Greenland ice sheet has remained relatively stable, the mass loss from the ice sheet margins have spread to the north and since 2007 propagated into interior Greenland. We present here an assessment of the interior stability in North Greenland over the last three decades using GPS data, remote sensing data, and climate model output. We compile GPS survey data from interior ice core sites in North Greenland at GRIP (1992-1996), NorthGRIP (1996-2001), NEEM (2007-2015), and EastGRIP (2015-2022), and compare with surface mass balance estimates, and remote sensing observations to assess changes over the last decades. While the surface elevation has remained relatively stable at the northern ice divide sites, an inferred northward migration of the ice divide in Northwest Greenland observed in 2007-2015 coincided with the onset of thinning along the ice margin in the Baffin Bay area. The surface elevation near the summit of the Greenland ice sheet lowered slightly over the last 30 years, during a period of widespread thinning along the western margin. The observations are discussed in relation to regional changes in surface mass balance and the dynamical response to mass loss at the ice margin.

How to cite: Hvidberg, C. S., Grinsted, A., Keller, K., Kjær, H. A., Rathmann, N., Lauritzen, M. L., Dahl-Jensen, D., Mottram, R., Hansen, N., Olesen, M., Simonsen, S., Sørensen, L. S., Solgaard, A. M., and Karlsson, N. B.: Stability of interior North Greenland – an assessment from GPS and satellite data, EGU General Assembly 2025, Vienna, Austria, 27 Apr–2 May 2025, EGU25-17048, https://doi.org/10.5194/egusphere-egu25-17048, 2025.

EGU25-17469 | ECS | Posters on site | CR2.2

Modelling the evolution of the Greenland ice sheet over glacial-interglacial cycles 

Isabel Schwermer, Anne Munck Solgaard, Mikkel Langgaard Lauritzen, Brice Noël, Roman Nuterman, and Christine Schøtt Hvidberg

The Greenland ice sheet (GrIS) formed more than 1 Ma ago and has evolved over many glacial-interglacial cycles. As it still adjusts to past changes, correctly capturing its present-day state is essential to accurately predict its future evolution and contribution to sea level rise. Furthermore, the past offers numerous examples of the GrIS‘ response to warmer climates, possibly analogous to its future fate.

Here, the Parallel Ice Sheet Model (PISM) is utilized to investigate the evolution of the GrIS over past glacial-interglacial cycles. For simulations over such long timescales, the computationally inexpensive PDD scheme is commonly used to calculate surface melt. However, PDD schemes do not capture spatial and temporal differences in surface mass balance sensitivity to temperature and cannot drive glacial-interglacial ice volume changes as they neglect the positive feedback between melt and albedo. To address this, we instead use the Diurnal Energy Balance Model (dEBM-simple) module. It takes into account seasonally and latitudinally varying melt contributions from solar shortwave radiation and changes in albedo in addition to temperature-driven melt to achieve a better representation of orbital timescales.

We calibrate PISM-dEBM-simple with present-day melt rates from the regional climate model RACMO. The calibrated model is then used to investigate the different patterns of growth and retreat of the GrIS over the past glacial-interglacial cycles emerging from using the PDD or the dEBM module in PISM. The enhanced sensitivity of the dEBM to insolation results in an earlier and greater mass loss at the onset of the Holocene, primarily from low-elevation regions and ice shelves.

How to cite: Schwermer, I., Munck Solgaard, A., Langgaard Lauritzen, M., Noël, B., Nuterman, R., and Schøtt Hvidberg, C.: Modelling the evolution of the Greenland ice sheet over glacial-interglacial cycles, EGU General Assembly 2025, Vienna, Austria, 27 Apr–2 May 2025, EGU25-17469, https://doi.org/10.5194/egusphere-egu25-17469, 2025.

EGU25-17480 | ECS | Posters on site | CR2.2

Does the AMOC strength matter for the Antarctic ice sheet retreat during the penultimate deglaciation?  

Maxence Menthon, Pepijn Bakker, Aurélien Quiquet, and Didier Roche

The Antarctic Ice Sheet has contributed 0 to 7.7m to the global mean sea level during the Last Interglacial, according to recent publications (Barnett et al., 2023; Dyer et al., 2021; Dumitru et al., 2023; Shackleton et al., 2020). This large uncertainty suggests that the Antarctic ice sheet could have been similar to present-day geometry, but it could also have had a major retreat such as the collapse of the West Antarctic Ice Sheet and more. For example, Clark et al. 2020 simulate the West Antarctic Ice Sheet collapse in their modeling work. They suggest that a longer period of reduced Atlantic Meridional Overturning Circulation (AMOC) during the penultimate deglaciation compared to the last deglaciation could have led to greater subsurface warming and subsequent larger Antarctic Ice Sheet retreat. 

Here we study the response of the Antarctic ice sheet during the penultimate deglaciation ( 138–128 ka) to different evolutions of the AMOC. We use the ice sheet model GRISLI (Quiquet et al. 2018), including the recently implemented sub-shelf melt module PICO (Reese et al. 2018). The climate forcings, including Northern Hemisphere ice sheets evolution, are obtained from fully coupled Earth System Model simulations using the intermediate complexity model iLOVECLIM (Roche et al. 2014). We run 2 sets of ice sheet simulations. In the first set the Northern Hemisphere ice sheets are fully coupled and therefore provide freshwater fluxes directly to the oceans according to ice sheets melt (Quiquet and Roche 2024). In the second set the freshwater fluxes given in the North Atlantic Ocean are idealized. With the second set, we also test the impact of the timing and duration of the freshwater flux on the ice sheet retreat. We hypothesize that both the duration and timing of reduced AMOC can significantly affect the sensitivity of the Antarctic Ice Sheet. A larger subsurface warming in the Southern Ocean can be triggered by longer AMOC reduction, and the resilience of the ice sheet to this warming depends on its geometry during the deglaciation.   

How to cite: Menthon, M., Bakker, P., Quiquet, A., and Roche, D.: Does the AMOC strength matter for the Antarctic ice sheet retreat during the penultimate deglaciation? , EGU General Assembly 2025, Vienna, Austria, 27 Apr–2 May 2025, EGU25-17480, https://doi.org/10.5194/egusphere-egu25-17480, 2025.

EGU25-19292 | ECS | Posters on site | CR2.2

Mapping the stability of the Greenland Ice Sheet 

Lucía Gutiérrez-González, Jorge Álvarez-Solas, Marisa Montoya, and Alexander Robinson

In the coming century, the Greenland Ice Sheet (GrIS) is expected to be one of the main contributors to global sea-level rise. In addition, it is thought to be a tipping element due to the existence of positive feedbacks governing its mass balance. Previous studies have explored its stability across a range of temperatures, from present-day conditions to a global warming of 4°C, showing a threshold behavior in its response. However, it is known this threshold has already been exceeded in the past. During the Holocene Thermal Maximum, when Greenland temperatures were 2–4°C warmer than today, the ice sheet retreated beyond its present-day margin but did not fully disappear. Ice losses depend on the level of warming, but also on the rate of forcing and how long the forcing remains above the threshold.  Therefore, we propose studying the stability of the ice sheet over a broader temperature range: from the Last Glacial Maximum to a warming of +4°C,  and examining its current state within the bifurcation diagram. For this purpose, we use the ice-sheet model Yelmo coupled with the regional moisture-energy balance model REMBO and a linear parameterization of the oceanic basal melting.

How to cite: Gutiérrez-González, L., Álvarez-Solas, J., Montoya, M., and Robinson, A.: Mapping the stability of the Greenland Ice Sheet, EGU General Assembly 2025, Vienna, Austria, 27 Apr–2 May 2025, EGU25-19292, https://doi.org/10.5194/egusphere-egu25-19292, 2025.

EGU25-19646 | Orals | CR2.2

Early Results from KANG-GLAC: A Project to Understand Holocene Ice Sheet-Ocean Interaction and Marine Productivity in SE Greenland 

Kelly Hogan, O Cofaigh Colm, Povl Abrahamsen, John Howe, Mark Inall, Jeremy Lloyd, Clara Manno, Christian März, David Roberts, Geraint Tarling, Louise Sime, Jochen Voss, Lev Tarasov, and Camilla Andresen and the SD041 Shipboard Scientific Party

So far, melting of the Greenland Ice Sheet (GrIS) has been the biggest contributor from the Earth’s cryosphere to global sea-level rise. Major uncertainties remain about how oceanic heat is transported across the shelf and through the fjords to the faces of marine-terminating glaciers, and how this affects rates of ice melt and calving. In turn, the increasing supply of meltwater and nutrients to the ocean around Greenland is impacting marine ecosystems as primary productivity rises,  subsequently increasing the potential for  carbon to be buried as “blue carbon” in Greenland’s fjords as warming continues. In July-August 2024, the UK-funded KANG-GLAC project completed a 40-day multidisciplinary research cruise to SE Greenland where the 40-strong scientific party made a suite of integrated geological, ocean and biological observations. The main aims of the project are two-fold. First, it aims to better understand how marine-terminating glaciers respond to oceanic heat on longer timescales (decades to centuries) by reconstructing glacier and ice-sheet behaviour during the Holocene and in particular during the climatic warm period of the Holocene Thermal Maximum. Second, the project will quantify nutrient cycling in the water column and uppermost seafloor sediments in order to improve our knowledge of  marine ecosystem response to meltwater supply from the GrIS.  The cruise on the UK’s premier polar research vessel, the RRS Sir David Attenborough, is the start of a 3.5 year project. Here, we will present an overview of our field observations in this past-to-future project and outline the plans for future data-driven modelling of the Greenland Ice Sheet.

How to cite: Hogan, K., Colm, O. C., Abrahamsen, P., Howe, J., Inall, M., Lloyd, J., Manno, C., März, C., Roberts, D., Tarling, G., Sime, L., Voss, J., Tarasov, L., and Andresen, C. and the SD041 Shipboard Scientific Party: Early Results from KANG-GLAC: A Project to Understand Holocene Ice Sheet-Ocean Interaction and Marine Productivity in SE Greenland, EGU General Assembly 2025, Vienna, Austria, 27 Apr–2 May 2025, EGU25-19646, https://doi.org/10.5194/egusphere-egu25-19646, 2025.

EGU25-19795 | ECS | Posters on site | CR2.2

Investigating Osmium Isotopes and Sedimentological Records for the end of the Saalian Glacial from Northwest Baffin Bay 

Sirui Huang, David Selby, Jeremy Lloyd, and Paul Knutz

Understanding the dynamic response of the Greenland Ice Sheet (GrIS) during past climate warmings is essential for predicting its behaviour as global warming accelerates. However, detailed reconstructions of GrIS growth and retreat are limited due to lack of long high-resolution sedimentary records in proximity to its major glacial outlets. Here, new osmium isotope data are presented, from IODP Expedition 400 Hole U1604B, obtained from the lower slope of the Melville Bugt Trough Mouth Fan on the northwest Greenland margin. The osmium isotope analyses are integrated with shipboard sedimentary proxies to trace sediment sources and reconstruct glacial meltwater flux. Preliminary results from the studied interval show sediment proxy variations suggesting significant changes in sediment sources and depositional conditions. Between ~29 and 24 m CSF-A 187Os/188Os are radiogenic (~2.3 – 2.5). In contrast, immediately above this section between ~24 and 22 m CSF-A depth 187Os/188Os are distinctly less radiogenic (~1.3). The latter depth interval is also characterized by a peak in Ca/K ratios, decreased magnetic susceptibility and natural gamma radiation. The current preliminary age-model for Hole 1604B suggests that the studied core interval could represent the end of the Saalian Glacial. As such, we hypothesize the change in the sediment proxies is interpreted to record enhanced glacial meltwater and sediment delivery, potentially following ice sheet break-up at the end of the Saalian glacial and transition into the Eemian interglacial. Our multi-proxy findings provide new insight into the relationship between GrIS, Innuitian/Laurentide Ice Sheets, and regional sedimentation patterns during a significant glacial to interglacial transition, with important implications for understanding of GrIS response to abrupt climate warming.

How to cite: Huang, S., Selby, D., Lloyd, J., and Knutz, P.: Investigating Osmium Isotopes and Sedimentological Records for the end of the Saalian Glacial from Northwest Baffin Bay, EGU General Assembly 2025, Vienna, Austria, 27 Apr–2 May 2025, EGU25-19795, https://doi.org/10.5194/egusphere-egu25-19795, 2025.

EGU25-20400 | Posters on site | CR2.2

Coupling the polar ice sheets to the Norwegian Earth System Model: advances and challenges 

Michele Petrini, Mariana Vertenstein, Heiko Goelzer, William H. Lipscomb, Gunter R. Leguy, William J. Sacks, Katherine Thayer-Calder, David M. Chandler, and Petra M. Langebroek

The polar ice sheets are melting faster due to climate change, with the contribution of the Greenland and Antarctic ice sheets being the largest uncertainty in projecting future sea level rise. Understanding this is crucial for assessing impacts on the environment and ecosystems. Most of the existing modelling studies focus on ice sheet response to atmospheric and oceanic forcing. However, the ice sheets closely interact with and influence the Earth’s climate. With the goal of better representing ice sheet and climate processes and feedbacks, we aim to integrate Greenland and Antarctic dynamic ice sheet components into the Norwegian Earth System Model (NorESM). NorESM is a global, CMIP-type coupled model for the physical climate system and biogeochemical processes over land, ocean, sea ice and atmosphere. In its latest release, NorESM features interactive coupling with a dynamic Greenland Ice Sheet (GrIS) component, although this coupling does not explicitly include ocean forcing at the marine-terminating margins of the ice sheet. In this presentation, we will show preliminary results of NorESM simulations featuring (1) a new interactive coupling with the Community Ice Sheet Model (CISM) over both the Antarctic and Greenland domains, and (2) a new ocean and ice sheet coupling allowing us to force the ice sheets with horizontally and vertically resolved  NorESM ocean properties. We will discuss work in progress, highlighting recent advances and most pressing challenges of our coupling approach.

How to cite: Petrini, M., Vertenstein, M., Goelzer, H., Lipscomb, W. H., Leguy, G. R., Sacks, W. J., Thayer-Calder, K., Chandler, D. M., and Langebroek, P. M.: Coupling the polar ice sheets to the Norwegian Earth System Model: advances and challenges, EGU General Assembly 2025, Vienna, Austria, 27 Apr–2 May 2025, EGU25-20400, https://doi.org/10.5194/egusphere-egu25-20400, 2025.

EGU25-20846 | ECS | Orals | CR2.2

The role of Greenland ice sheet – climate interactions from 1000-year coupled simulations with MAR-GISM 

Chloë Paice, Xavier Fettweis, and Philippe Huybrechts

As the second largest ice body on Earth, comprising an ice volume of 7.4 m sea level equivalent, the Greenland ice sheet is one of the main contributors to global sea level rise. Though observational and modelling efforts have increased substantially in recent years, major uncertainties remain regarding the ice sheet – climate interactions and feedback mechanisms that drive the ice sheet’s long-term mass loss. To improve sea level projections and the representation of such interactions in model simulations, efforts are currently emerging to couple ice sheet and regional climate models. However, so far, only a few coupled ice sheet – regional climate model simulations have been performed, and these do not extend beyond the centennial timescale. They therefore provide limited insights into the evolution and critical thresholds of the ice sheet – climate system over longer timescales.

As such, to obtain a better understanding of the ice sheet – climate interactions and potential feedback mechanisms over Greenland, we coupled our Greenland Ice Sheet Model (GISM) with a high-resolution regional climate model, the Modèle Atmosphérique Régional (MAR), and performed millennial-length simulations. The global climate model forcing for MAR during these simulations consisted of the IPSL-CM6A-LR model output under the SSP5-8.5 scenario, which was available until 2300. After this date, the climate was held constant, and we prolonged our coupled simulations until the year 3000.

Specifically, we performed three coupled simulations for the period 1990-3000 with differing coupling complexity: full two-way coupling, one-way coupling and zero-way coupling. In the two-way coupled set-up, the ice sheet topography and surface mass balance were communicated yearly between both models, such that ice sheet – climate interactions were fully captured. In the one-way coupled set-up only the surface mass balance – elevation feedback was considered, through interpolation of the yearly SMB onto the changing ice sheet topography. And lastly, in the zero-way coupled set-up the ice sheet – climate interactions were entirely omitted.

The results show that the ice sheet evolution is determined by positive as well as negative feedback mechanisms, that act over different timescales. The main observed negative feedback in our simulations is related to changing wind speeds at the ice sheet margin, due to which the integrated ice mass loss remains fairly similar for all simulations up to 2300, regardless of the differently evolving ice sheet geometries. Beyond this time however, positive feedback mechanisms related to decreasing surface elevation and changing precipitation patterns dominate the ice sheet – climate system and strongly accelerate the integrated ice mass loss. Hence, over longer timescales and for a realistic representation of the evolving ice sheet geometry, it is indispensable to account for ice sheet – climate interactions as was done in our two-way coupled ice sheet – regional climate model set-up.

How to cite: Paice, C., Fettweis, X., and Huybrechts, P.: The role of Greenland ice sheet – climate interactions from 1000-year coupled simulations with MAR-GISM, EGU General Assembly 2025, Vienna, Austria, 27 Apr–2 May 2025, EGU25-20846, https://doi.org/10.5194/egusphere-egu25-20846, 2025.

EGU25-21018 | ECS | Orals | CR2.2

Mass Recharge of the Greenland Ice Sheet driven by an IntenseAtmospheric River 

Hannah Bailey and Alun Hubbard

Atmospheric rivers are transient channels of intense water vapor that account for up to 90% of the poleward moisture transport from mid-latitudes. Though short-lived, these events can deliver extreme amounts of heat and rainfall that have been widely reported to accelerate ablation and ice mass loss across the Arctic. However, the impact of atmospheric river fueled snowfall has received less attention, partly due to the limited availability of empirical evidence and direct observations. Here, we explore the potential of atmospheric rivers to deliver intense snowfall to the Greenland ice sheet and thereby replenish its health through enhanced mass accumulation. Specifically, we use new firn-core isotopic analyses and glacio-meteorological datasets from Southeast Greenland to examine the origin and impact of atmospheric rivers on regional mass balance. To this end, we sampled firn core stratigraphy from the upper accumulation area of Southeast Greenland and related it to meteorological observations, to demonstrate that an intense atmospheric river in mid-March 2022 delivered up to 11.6 gigatons per day of extreme snowfall to this region of the ice sheet. 
We show that this immense snowfall not only recharged the snowpack and offset Greenland ice sheet net mass loss by 8% in 2022, but also raised local albedo thereby delaying the onset of summer bare-ice melt by 11 days, despite warmer than average spring temperatures. Since 2010, synoptic analysis of ERA5 data reveals that snow accumulation across Southeast Greenland increased by 20 mm water equivalent per year, driven by enhanced Atlantic cyclonicity. Depending on their seasonal timing, our study demonstrates that the impact of atmospheric rivers on the mass balance of the Greenland ice sheet is not exclusively negative. Moreover, their capacity to contribute consequential ice mass recharge may become increasingly significant under ongoing Arctic amplification and predicted poleward intrusion of mid-latitude moisture.

How to cite: Bailey, H. and Hubbard, A.: Mass Recharge of the Greenland Ice Sheet driven by an IntenseAtmospheric River, EGU General Assembly 2025, Vienna, Austria, 27 Apr–2 May 2025, EGU25-21018, https://doi.org/10.5194/egusphere-egu25-21018, 2025.

A major obstacle in both paleo and future simulations of the Antarctic Ice Sheet is that most studies do not include interactive ice sheets. Although this is a current area of development, most studies use stand alone climate models to force separate ice sheet models to study the potential impacts of climate changes on ice sheets; however this method ignores consequent impacts of the ice sheets on the ocean-atmosphere system, leading to simulations that may under or over estimate retreat in a warmer climate. The few model simulations that do include ice sheet-climate feedbacks disagree on the overall sign of the these feedbacks.
Here we are developing a new coupling between an established ice sheet (PSU-ISM) and climate model (HadCM3) that has been used extensively for paleoclimate applications. These models are suitable for performing multiple simulations over thousands of years. The ice sheet model output will be used to update the ice sheet in the climate model. The climate model orography and land sea mask will be modified to match that in the ice sheet model and ice sheet discharge will be added as a freshwater flux, modelled via change in salinity around the Southern Ocean. The models have been coupled offline and we are next automating this process so that simulations can be repeated over shorter timescales. This will allow the model to develop feedbacks more quickly rather than being limited to the length of the run. The model has been developed using pre-industrial idealised simulations. The main focus of the work is on reproducing the AIS response and sea level rise during the middle Miocene warm interval that matches proxy records more closely without having to add unrealistic CO2 forcing.

How to cite: Byrne, L.: Development of a new coupled ice sheet-climate model for simulations of the Antarctic Ice Sheet under a warm climate, EGU General Assembly 2025, Vienna, Austria, 27 Apr–2 May 2025, EGU25-21116, https://doi.org/10.5194/egusphere-egu25-21116, 2025.

EGU25-736 | Orals | AS1.22

Isotopic Signatures of Precipitation: Linking Tropospheric and Surface Processes in India's Core Monsoon Zone 

Supriya Chakraborty, Neha Trivedi, and Rajendra Trivedi

The monsoon system is a dynamic and complex component of the atmospheric water cycle, profoundly impacting weather, climate, and human activities. A variety of meteorological observations are used to understand the monsoon system. The isotopic technique provides a unique perspective on moisture dynamics, enhancing our understanding of the monsoon system. The isotopic signature of precipitation is shaped by numerous geographical and environmental variables, making only select regions suitable for in-depth monsoon isotopic studies. The central Indian region, a pivotal monsoon zone, exhibits distinct characteristics ideal for studying monsoon dynamics. Key features include the passage of the monsoon trough- a modified Intertropical Convergence Zone, and frequent low-pressure systems (LPS) from the northern Bay of Bengal, contributing significantly to summer monsoon rainfall. Notably, rainfall variability in central India shows an out-of-phase relationship with northeastern India. Furthermore, central Indian rainfall strongly correlates with the All-India Summer Monsoon Rainfall, serving as a reliable proxy. Despite its potential, the isotopic technique remains underutilized in this core monsoon zone (CMZ: approximately defined by an area 18-28oN, 65-88oE) for monsoon research.

We report a multi-year (2016-2021) precipitation isotopic record obtained from Sagar, a site in the CMZ of India. We explore the relationship between isotopic signatures and regional-scale atmospheric processes mediated by diabatic heating and its vertical distribution pattern, the LPSs, moisture source dynamics, monsoon trough variability, and other meteorological conditions. We also examine the role of recycled rainfall in modulating the precipitation isotopic variability.

We have computed the diabatic heating profiles over India's CMZ. The calculated heating profiles are strongly associated with the monsoon rainfall variability expressed through a precipitation index over the CMZ. We observed a strong association between precipitation isotopic depletion and tropospheric heating. Our analysis reveals that LPSs significantly influence rainfall isotopic values through their origin, trajectory, and intensity. These systems and associated convective activity yield depleted isotopic signatures. A strong inverse relationship exists between LPS intensity and corresponding precipitation isotopic values.

Terrestrial evaporation, leading to substantial recycled rainfall, plays a pivotal role in modulating precipitation isotopic variability. A notable inverse correlation exists between precipitation isotopes and recycled rainfall. The isotopic depletions resulting from diabatic heating, LPSs, and recycled rainfall collectively manifest the amount effect, highlighting a common link among these processes.

The out-of-phase isotopic patterns observed in central and northeastern India mirror the region's dipolar rainfall variability, rendering the CMZ an optimal location for proxy-based reconstructions of past rainfall variability.

How to cite: Chakraborty, S., Trivedi, N., and Trivedi, R.: Isotopic Signatures of Precipitation: Linking Tropospheric and Surface Processes in India's Core Monsoon Zone, EGU General Assembly 2025, Vienna, Austria, 27 Apr–2 May 2025, EGU25-736, https://doi.org/10.5194/egusphere-egu25-736, 2025.

EGU25-1423 | Posters on site | AS1.22

Comparison of local and remote controlling factors on the precipitation isotopic variation in northwestern Ethiopia 

Shuang-Ye Wu, Zhaojun Zhan, Zelalem Bedaso, and Yonas Hagos

Investigating the mechanisms of precipitation isotope variation is essential for interpreting hydrological processes and reconstructing isotope-based paleoclimate records, especially in arid regions with complex precipitation patterns like Ethiopia. This study analyzed the seasonal and interannual variations of stable isotopes in precipitation at Addis Ababa, northwestern Ethiopia, using observed and simulated monthly δ18O data from GNIP and IsoGSM2, respectively. Results show a significant 18Op depletion during the rainy season (June to September, JJAS) compared to the dry season. Locally enhanced convection, intensified convective and large-scale precipitation, and higher relative humidity may contribute to this depletion. These local meteorological variables explained nearly half of the JJAS δ18Op variation. In addition, moisture contribution and rainout process along the path from the Southern Indian Ocean (SIO) to the western Ethiopian Highland also contribute to the JJAS 18Op depletion. This study also demonstrates the relationship between El Niño and the Southern Oscillation (ENSO) and the interannual variation of JJAS δ18Op in Ethiopia: the warm (cold) phase of ENSO modulates the enrichment (depletion) of JJAS 18Op via the less (more) JJAS rainfall. Warm SST anomalies in the Central Pacific weaken the intensity of the Indian Summer Monsoon (ISM), suppress the convective activities, and reduce the amount and intensity of JJAS rainfall over Ethiopia, causing significant 18Op enrichment during El Niño years. Our study provides insights into understanding hydrological processes and interpreting paleoclimate δ18Op records in East Africa.

How to cite: Wu, S.-Y., Zhan, Z., Bedaso, Z., and Hagos, Y.: Comparison of local and remote controlling factors on the precipitation isotopic variation in northwestern Ethiopia, EGU General Assembly 2025, Vienna, Austria, 27 Apr–2 May 2025, EGU25-1423, https://doi.org/10.5194/egusphere-egu25-1423, 2025.

EGU25-2539 | ECS | Orals | AS1.22

The Water Vapor Origin of a Rainstorm Event in the Taklamakan Desert 

Yongqi Gong and Haipeng Yu

In July 2021, the Taklamakan Desert (TD) experienced an unprecedented rainstorm with daily precipitation exceeding 61.1 mm, triggering mudslides and landslides, highlighting the increasing frequency of extreme precipitation events even in arid regions under global warming. The water vapor sources and transport paths of this rainstorm are still puzzling due to the insufficient representation of physical processes in previous analytical models, leading to possible deviations from reality. Here, using the online Eulerian Weather Research and Forecasting model with water vapor tracer (WRF-WVT), we aim for an improved understanding of water vapor sources of the rainfall event. Results demonstrate that the most important water source for this event is water vapor from local evapotranspiration, contributing to 32.77% of the rainstorm moisture. Water vapor from Upstream Westerlies (28.95%) and East Asian Drylands (28.54%) are transported over the precipitation area by the westerlies owing to the strong lower-level low-pressure system, being the second-most important precipitation source. These sources contribute significantly more than other regions, including the Arabian Sea (5.56%), the Tibetan Plateau (2.16%), and the South Asian Monsoon (0.77%). External moisture sources collectively provide over 65.98% of the precipitation, underscoring their important role. Notably, local evapotranspiration significantly influences precipitation, exceeding the contributions from other individual sources. By comparing with the 2016 precipitation event, it is found that a low-pressure trough extending southward to the west of the TD plays a significant role in the 2021 rainstorm event. The presence of the trough significantly enhances the moisture transport of the westerlies and the upward motion, contributing to the occurrence of extreme precipitation events.

How to cite: Gong, Y. and Yu, H.: The Water Vapor Origin of a Rainstorm Event in the Taklamakan Desert, EGU General Assembly 2025, Vienna, Austria, 27 Apr–2 May 2025, EGU25-2539, https://doi.org/10.5194/egusphere-egu25-2539, 2025.

EGU25-3310 | Orals | AS1.22

High-Frequency Isotopic Analysis Unveils the Complexity of Convective Rainfall Dynamics in the Central Amazon 

Didier Gastmans, Vinícius Santos, Shujiro Komiya, Ricardo Sánchez-Murillo, Sam Jones, Zayra Christine Sátyro Santos, Rafaela Rodrigues Gomes, Susan Trumbore, Gerd Gleixner, and Ana Maria Duran-Quesada

The Amazon region is recognized as one of the world's most significant active convective areas, generating precipitation systems that regulate the climate and weather across the region. Climate projections indicate increased convection over South America, expected to intensify extreme events and amplify their impacts on society. Stable water isotopes are a valuable tool for investigating the formation and evolution of extreme rainfall events in tropical regions. This study presents high-frequency (5-30 minutes) isotope data for rainfall (n=115) and vapor (Picarro Inc., USA L2140i analyzer) from 19 convective events at the ATTO tower site (25/Jan-08/Feb 2024), coupled with various meteorological data (Rain Micro Radar, ATTO tower, Reanalysis, GOES-16). Rainfall and vapor exhibited distinct isotopic signatures with similar temporal trends, with vapor being more depleted in 𝛿18O (-13.78 to -8.92‰) than rainfall (-6.28 to +1.03‰).  Rainfall events were short-lived (< 1 hour) and associated with lower cloud top temperature (-33ºC to +9°C). The averaged 𝛿18O variability within (intra-) and between events (intra: -6.28 to -4.03‰, between: -5.13‰ and +1.03‰), suggests a complex interplay of factors influencing precipitation formation. These factors likely include moisture transport, limited vertical development, and the incorporation of forest evapotranspiration. This study provides valuable insights into the intricate relationship between the Amazon rainforest and rainfall formation. The generated knowledge and data can contribute to improving atmospheric models and understanding the potential impacts of climate change on the Amazon's hydroclimatic system.

How to cite: Gastmans, D., Santos, V., Komiya, S., Sánchez-Murillo, R., Jones, S., Santos, Z. C. S., Gomes, R. R., Trumbore, S., Gleixner, G., and Duran-Quesada, A. M.: High-Frequency Isotopic Analysis Unveils the Complexity of Convective Rainfall Dynamics in the Central Amazon, EGU General Assembly 2025, Vienna, Austria, 27 Apr–2 May 2025, EGU25-3310, https://doi.org/10.5194/egusphere-egu25-3310, 2025.

EGU25-4013 | Orals | AS1.22

Acceleration of the Hydrological Cycle under Global Warming for the Poyang Lake Basin in Southeast China: An Age-Weighted Regional Water Tagging Approach 

Jianhui Wei, Joel Arnault, Thomas Rummler, Benjamin Fersch, Zhenyu Zhang, Patrick Laux, and Harald Kunstmann

Global warming is accelerating the global water cycle. However, quantification of the acceleration and regional analyses remain open. Accordingly, in this study we address the fundamental hydrological question: Is the water cycle regionally accelerating/decelerating under global warming? For our investigation we have implemented the age-weighted regional water tagging approach into the Weather Research and Forecasting WRF model, namely WRF-age, to follow the atmospheric water pathways and to derive atmospheric water residence times defined as the age of tagged water since its source. We apply a three-dimensional online budget analysis of the total, tagged, and aged atmospheric water into WRF-age to provide a prognostic equation of the atmospheric water residence times and to derive atmospheric water transit times defined as the age of tagged water since its source originating from a particular physical or dynamical process. The newly developed, physics-based WRF-age model is used to regionally downscale the reanalysis of ERA-Interim and the MPI-ESM Representative Concentration Pathway 8.5 scenario exemplarily for an East Asian monsoon region, i.e., the Poyang Lake basin (the tagged water source area), for historical (1980-1989) and future (2040-2049) times. In the warmer (+1.9 °C for temperature and +2% for evaporation) and drier (-21% for precipitation) future, the residence time for the tagged water vapor will regionally decrease by 1.8 hours (from 14.3 hours) due to enhanced local evaporation contributions, but the transit time for the tagged precipitation will increase by 1.8 hours (from 12.9 hours) partly due to slower fallout of precipitating moisture components. These findings reveal the physical mechanisms behind dry-getting-dryer at regional scales.

How to cite: Wei, J., Arnault, J., Rummler, T., Fersch, B., Zhang, Z., Laux, P., and Kunstmann, H.: Acceleration of the Hydrological Cycle under Global Warming for the Poyang Lake Basin in Southeast China: An Age-Weighted Regional Water Tagging Approach, EGU General Assembly 2025, Vienna, Austria, 27 Apr–2 May 2025, EGU25-4013, https://doi.org/10.5194/egusphere-egu25-4013, 2025.

The Ganga Basin, a region vital for agriculture and water resources, is heavily influenced by monsoonal rainfall patterns. Understanding the sources of this rainfall and their role in extreme weather events is critical. This study investigates the transport and contribution of moisture from two major sources the Bay of Bengal and the Arabian Sea on extreme rainfall events in the Ganga Basin from 2012 to 2023. We focus on analyzing the dynamics of moisture flow and the contributions of these sources during periods of heightened rainfall caused by cyclonic systems and other meteorological factors. Using a Lagrangian trajectory model, we track moisture fluxes and quantify water vapor transport from both the Bay of Bengal and the Arabian Sea. Our findings highlight the pivotal role of the Bay of Bengal in the Ganga Basin's rainfall, particularly during monsoon extremes. The Bay of Bengal's proximity to the Ganga Basin and its larger surface area make it the primary moisture source. The moisture generated in the Bay, aided by the monsoon winds, moves inland, directly influencing the seasonal and extreme rainfall patterns over the region. Additionally, cyclonic activity such as tropical storms and depressions further intensifies moisture transport, causing localized flooding and extreme rainfall events that alter the regular monsoon cycle. While the Arabian Sea does contribute to the Ganga Basin’s rainfall, especially during specific monsoonal periods, its influence is more intermittent and weaker compared to the Bay of Bengal. Moisture transport from the Arabian Sea is less direct, with its contributions more noticeable during particular timeframes, outside the peak monsoon season. This study provides a comprehensive understanding of how moisture recycling within the Ganga Basin interacts with moisture fluxes from the Bay of Bengal and the Arabian Sea. We assess how much each of these moisture sources influences extreme rainfall events, revealing the interconnectedness between the Ganga Basin’s moisture recycling processes and the external moisture inputs. This analysis is crucial in understanding the dependency of the Ganga Basin’s rainfall on these external moisture sources, as well as their combined contribution to extreme rainfall events. By examining these dynamics, the study contributes to a more precise understanding of the mechanisms that drive extreme rainfall in the Ganga Basin. It highlights the critical role of the Bay of Bengal in sustaining rainfall, especially during periods of heightened rainfall intensity, and offers insights into how these moisture sources affect the region’s water availability and agricultural productivity.

How to cite: Kumar, R. and Pathak, A.: Tracing Moisture Flow from the Bay of Bengal and Arabian Sea with its Impact on Ganga Basin during Monsoonal Extremes, EGU General Assembly 2025, Vienna, Austria, 27 Apr–2 May 2025, EGU25-4531, https://doi.org/10.5194/egusphere-egu25-4531, 2025.

EGU25-11440 | ECS | Posters on site | AS1.22

Bridging the Scale Gap: Leveraging EOF and Non-Parametric Correlation to Connect Meteorological Fields and Precipitation Isotopes 

Harsh Oza, Ludvig Löwemark, George Kontsevich, Akkaneewut Jirapinyakul, Sakonvan Chawchai, Helmut Duerrast, Mao-Chang Liang, Midhun Madhavan, and Chung-Ho Wang

In the fields of atmospheric and climate science, there is growing use of machine learning and global circulation models. These approaches are becoming increasingly sophisticated with the availability of extensive ground-based and remotely sensed datasets. However, both approaches rely on the availability of large spatial and temporal datasets. For over half a century, stable isotopes of oxygen and hydrogen have been used as robust proxies for understanding hydrometeorological processes, acting as conservative tracers of land-ocean-atmosphere interactions. However, these isotopic measurements are non-continuous and highly discreet. Although satellites such as ACE, TES, Aura, and SCIMACHY do measure the isotopic composition of atmospheric vapour, they carry high uncertainties, making them less reliable. Therefore, despite their promise, these approaches are not readily applicable for deciphering local hydrometeorological processes, primarily due to limited data availability and relatively coarser spatial resolution.

Here, we introduce a simple yet robust approach to link meteorological and atmospheric data with discreet and limited isotopic measurements, aiming to understand how large-scale ocean-atmosphere processes govern local hydrometeorology. We employed Empirical Orthogonal Function (EOF) to identify prominent oceanic and atmospheric patterns over large spatial domains and to reduce dimensionality, thus converting the 3D climate datasets (e.g., ECMWF reanalysis) into 2D representations. We then applied non-parametric correlation technique, specifically Spearman‘s rank correlation, to link the meteorological data with localized, discreet precipitation isotope measurements. Adopting a non-parametric correlation avoids strict assumptions about data distributions. This approach offers significant benefits over traditional and more complex, modern methods by handling non-linearity and spatial heterogeneity. It also provides an effective means of identifying and interpreting local hydroclimatic processes and their linkages to broader atmospheric and oceanic drivers, thereby bridging the gap between large-scale atmospheric factors and local hydrological responses. Consequently, it offers deeper insight into the complex interplay among numerous processes operating at varied spatiotemporal scales.

Our preliminary findings quantitatively highlight the roles of sea surface temperature gradient between the eastern Indian Ocean and the South China Sea, pressure, potential vorticity, boundary layer height, vertical transport, wind speeds, and specific humidity in driving precipitation isotope variability in the Malaya peninsula. These linkages were previously unknown or qualitatively estimated by traditional methods, highlighting the value of this synergistic approach in bridging the spatial data disparities and improving our understanding of the regional drivers in the local hydrological cycle.

How to cite: Oza, H., Löwemark, L., Kontsevich, G., Jirapinyakul, A., Chawchai, S., Duerrast, H., Liang, M.-C., Madhavan, M., and Wang, C.-H.: Bridging the Scale Gap: Leveraging EOF and Non-Parametric Correlation to Connect Meteorological Fields and Precipitation Isotopes, EGU General Assembly 2025, Vienna, Austria, 27 Apr–2 May 2025, EGU25-11440, https://doi.org/10.5194/egusphere-egu25-11440, 2025.

EGU25-12038 | ECS | Orals | AS1.22

Long-term isotopic monitoring in Southeast region of Brazil 

Amanda Soares, Didier Gastmans, and Vinicius dos Santos

Observations on the variability of the isotopic composition of rainfall have been used to understand the effects of climate change, but there is a gap in this type of analysis in tropical regions. Studies in tropical regions are extremely important to assess the influence of meteorological parameters on the isotopic composition of rainfall, as these regions have a unique climate that greatly influences the distribution of rainfall regimes. The aim of this study is to evaluate the historical series of isotopic data from the GNIP station at Rio Claro, located in Southeast region of Brazil, since the climate in this area is directly influenced by a variety of atmospheric systems that impact the variation in isotopic composition of rainfall. This study presents the analysis of a 10-year dataset of daily isotopic precipitation data (δ¹⁸O, δ²H, and d-excess). The isotopic signatures for δ¹⁸O ranged from -21.74‰ to 9.09‰ VSMOW, and for δ²H the variation was from -158.45‰ to 44.9‰ VSMOW, determining the Local Meteoric Water Line (LMWL) of Rio Claro as δ²H = 7.76 * δ¹⁸O + 10.97. The values of the LMWL are close to the Global Meteoric Water Line (GMWL), demonstrating a balance between evaporation and vapor recirculation processes. The rainy season LMWL (δ²H = 7.72 * δ¹⁸O + 10.3) is also close to the LMWL for Rio Claro. However, when considering data from the dry season, which represents 24% of the rainfall data, the LMWL indicates stronger vapor recirculation processes (δ²H = 7.7 * δ¹⁸O + 12.12), caused by rainfall initiated by cold fronts. Trend analysis using the Mann-Kendall test revealed a decreasing trend for δ²H and d-excess, while rainfall showed an increasing trend over the study period. These findings highlight the significance of determining the LMWL for Rio Claro, as it provides a valuable reference for isotopic studies in the region. Moreover, the analysis offers a comprehensive overview of the isotopic dataset, which can be further expanded and refined through the integration of synoptic meteorological data.

How to cite: Soares, A., Gastmans, D., and dos Santos, V.: Long-term isotopic monitoring in Southeast region of Brazil, EGU General Assembly 2025, Vienna, Austria, 27 Apr–2 May 2025, EGU25-12038, https://doi.org/10.5194/egusphere-egu25-12038, 2025.

Northern India receives rainfall from dual precipitation systems: Indian Summer Monsoon (ISM) and the Westerlies. Isotopic analysis of precipitation water and water vapor isotopes from the region can serve as a tracer to identify the moisture source and atmospheric phenomenon associated with the advection of moisture-laden air parcel. Water isotopic ratios (δ17O, δ18O) and secondary parameters (d-excess and 17O-excess) provide critical insights in understanding the monsoon dynamics of the region. 17O-excess enables us to estimate relative humidity conditions at the source region. This study presents the first continuous record of triple oxygen isotopes in the North Indian region (a low-latitude region but still having high heat exchange capacity due to extensive glacial mass).

Event based rainwater samples have been collected using a standard rain collector and high-resolution isotopic data of atmospheric vapor has been acquired using Picarro-L2140i installed at Manali station for June-July-August-September (JJAS) 2024. Hybrid Single-Particle Lagrangian Integrated Trajectory (HYSPLIT) back trajectory analysis suggests that moisture responsible for rainfall in Manali originates from Bay of Bengal, Arabian Sea, Westerlies and some local moisture sources. Specific humidity changes plotted along the back trajectories carry vital information regarding moisture percentage calculations from various sources. Local Meteoric Water Line (LMWL) have also been generated for the region which suggests significant influence of continental recycling and evaporative enrichment. Quantitative estimation of moisture contribution from various sources and effects of local meteorological parameters (e.g. wind speed & direction, relative humidity, temperature, rainfall amount) on isotopic values of atmospheric water observed in this study will be discussed at the time of presentation.

How to cite: Singh, A. and Dixit, Y.: Understanding summer monsoon variability in Northern India through isotopic signatures of precipitation water and water vapor isotopes , EGU General Assembly 2025, Vienna, Austria, 27 Apr–2 May 2025, EGU25-12645, https://doi.org/10.5194/egusphere-egu25-12645, 2025.

EGU25-12738 | Posters on site | AS1.22

Water Isotopologue Time Series across Tropical Sites during ENSO extremes 

Lucinda Bryce, Kim Cobb, Jessica Conroy, Samantha Levin, Manlin Xu, Germain Hernández, Ricardo Sánchez-Murillo, Madeleine Hardt, Nicole Murray, Elisabeth Holland, Wendy-Jane Powell, Xi-Kai Wang, and Syria Lejau

Potential anthropogenic shifts in the hydroclimate impacts of El Niño Southern Oscillation (ENSO) extremes are poorly resolved by available data. Water isotopologues provide valuable tracers of hydroclimatic processes, including the balance of precipitation versus evaporation and the relative importance of regional versus local drivers of hydroclimate variability  (Dee et al., 2023 and references therein; Moerman et al., 2013). However, very few water isotopologue datasets exist in the tropical Pacific, and those that do fail to resolve a full ENSO cycle. In this study, we present oxygen isotope (δ18O) and deuterium (δ2H) time series for precipitation, seawater, as well as sea-surface salinity time series from 5 sites spanning the tropical Pacific across the 2023/24 El Niño event and 2024/25 La Nina event.. Weekly seawater and daily rainwater δ18O time series from the Galapagos, Fiji, Hawaii, and Kiritimati Island, as well as rainwater δ18O time series from northern Borneo and Costa Rica reveal a distinct signature of the 2023/24 El Niño event. Preliminary analyses indicate that seawater δ18O values reflect both local and remote processes, with the relative balance being largely site-dependent. This study provides quantitative estimates of rainfall and seawater δ18O anomalies through a cycle of ENSO extremes, and investigates regional drivers of hydrologic circulation across space and time. Taken together, our results provide the first empirical dataset of ENSO-related δ18O anomalies spanning the tropical Pacific across a complete ENSO cycle, with applications to data-model intercomparison studies and investigations of tropical Pacific hydroclimatic processes. 

How to cite: Bryce, L., Cobb, K., Conroy, J., Levin, S., Xu, M., Hernández, G., Sánchez-Murillo, R., Hardt, M., Murray, N., Holland, E., Powell, W.-J., Wang, X.-K., and Lejau, S.: Water Isotopologue Time Series across Tropical Sites during ENSO extremes, EGU General Assembly 2025, Vienna, Austria, 27 Apr–2 May 2025, EGU25-12738, https://doi.org/10.5194/egusphere-egu25-12738, 2025.

EGU25-12895 | ECS | Posters on site | AS1.22

Understanding the environmental characteristics of frontal precipitation 

Hongsheng Wang and Jennifer Catto

Climatological studies have marked the important role of atmospheric fronts in the hydroclimate and water cycle of the Earth system, especially in the mid-latitudes. Precipitation associated with fronts is highly affected by the (spatially and temporally) co-existing weather systems with fronts such as atmospheric rivers (ARs) and mesoscale convective systems (MCSs) proved by previous studies. Current work discloses the environmental characteristics of frontal precipitation, which is less discussed, through analyzing the environmental variables including frontogenesis, moisture flux convergence (MFC), and convective available potential energy (CAPE) within the frontal zone. Results show that the extreme-precipitating fronts have higher mean positive frontogenesis and mean positive MFC than non-extreme-precipitating fronts. The study attempts to explicate the role of ARs and MCSs in frontal precipitation by analyzing the statistical distribution and cross-section in the cross-front direction of environmental variables of categorized fronts (co-occurring with ARs, MCSs, and both). There is a distinguishable shift of mean positive MFC distribution towards the high end when fronts co-occur with ARs (including both ARs and MCSs) compared with these with MCSs only, indicating the critical role of ARs in moisture transport to facilitate precipitation within the frontal zone. This work aims to highlight the environmental characteristics of fronts, especially those producing extreme precipitation, contributing to the theoretical understanding of precipitation from the perspective of weather phenomenon.

How to cite: Wang, H. and Catto, J.: Understanding the environmental characteristics of frontal precipitation, EGU General Assembly 2025, Vienna, Austria, 27 Apr–2 May 2025, EGU25-12895, https://doi.org/10.5194/egusphere-egu25-12895, 2025.

EGU25-12908 | Posters on site | AS1.22

The NISBO data set – high altitude daily precipitation stable isotope data since 2016 

Johannes Christoph Haas, Giorgio Höfer-Öllinger, and Elke Ludewig

Since August of 2016, daily precipitation samples for stable isotope analysis are collected at the Sonnblick Observatory (SBO). The SBO is located on the peak of Mt. Hoher Sonnblick, at an elevation of 3106 m above sea level, on the main ridge of the Alps in Austrias Hohe Tauern Region [1, 2]. These samples are analyzed using laser absorption spectroscopy (OA-ICOS, LGR T-LWIA-45-EP) at ISOLAB Salzburg, geoconsults in-house laboratory, producing data for the precipitations δ2H, δ18O and δ17O stable isotope composition.

To our knowledge, this data set, both in location (highly alpine) as well as in temporal resolution (daily data) and length of the data (multiple, full years) is unique. The aim of this Poster is to raise awareness about this data set and to discuss preliminary findings, before publishing the data for further work.

As expected, the data show pronounced seasonal variations (up to approx. 25 ‰ for δ18O, 10 ‰ for δ17O and 120 ‰ for δ2H) and notable differences between the various years in the data set, which compares well to the longterm observation from the nearby Böckstein Station of the Austrian Network of Isotopes in Precipitation and Surface Waters (ANIP) [3, 4]. However, the ANIP station, located in a valley, at 1014 m a s l, is collected in monthly intervals only.

Besides these seasonal and annual variations, significant differences in isotopy between single precipitation events can be observed. At a maximum, from December 27. to December 28. 2017 (21,6 mm of precipitation) δ18O and δ2H drop from ‑8.07 and ‑85.89 ‰ VSMOW to ‑30.14 and ‑224.60 ‰ VSMOW, a difference of -22.07 and -138.71 ‰ respectively, within a day. Similarly, from March 04. to March 05. 2020 (2.5 mm of precipitation), δ18O and δ2H rise from ‑22.10 and -172.04 ‰ VSMOW to ‑2.22 and ‑47.05 ‰ VSMOW, a difference of +19.88 and +124.99 ‰.

Such changes, reflecting a multitude of possible causes, such as for example altitude effect or different sources of the precipitating moisture (Mediterranean vs. Atlantic in case of the Sonnblick) are generally not seen in the prevailing monthly data and pose an interesting field for further research.

In general, most of the data follow both, the global mean water line (GMWL [5]) and the Austrian mean water line (AMWL [6]); but a trend towards higher δ18O and δ2H values, resulting in a local, daily, water line of approx. δ2H = 6.3 δ18O – 18.1 for this high-alpine environment can be distinguished.

[1] https://www.sonnblick.net/en/about-us/

[2] https://www.sonnblick.net/en/the-observatory/location/

[3] KRALIK, PAPESCH, & STICHLER (2003): Austrian Network of Isotopes in Precipitation (ANIP): Quality assurance and climatological phenomenon in one of the oldest and densest networks in the world. Isotope hydrology and integrated water resources management: 146-149.

[4] https://www.umweltbundesamt.at/wasser/informationen/isotope/isotopenmessnetz-anip

[5] CRAIG, H. (1961): Isotopic Variations in Meteoric Waters. Science, 133: 1072-1073

[6] HAGER, B. & FOELSCHE, U. (2015): Stable isotope composition of precipitation in Austria. AJES, 108: 2-13

How to cite: Haas, J. C., Höfer-Öllinger, G., and Ludewig, E.: The NISBO data set – high altitude daily precipitation stable isotope data since 2016, EGU General Assembly 2025, Vienna, Austria, 27 Apr–2 May 2025, EGU25-12908, https://doi.org/10.5194/egusphere-egu25-12908, 2025.

The age of water vapor in the atmosphere is often invoked to explain a well known discrepancy in the change of the hydrologic cycle with global warming. Although moisture increases at a rate of 7% per degree of global warming, precipitation increases only at a rate of 2% per degree of global warming. The difference between these rates can be explained by a 5% increase in water vapor age per degree of global warming. Although this explanation works on a global scale, it does not explain the spatial distribution in the increase of the age, or the dynamical mechanisms which are responsible for this increase in age.

In this project, we demonstrate the potential of a 3D Eulerian age tracking system for the age of water vapor in a simplified atmospheric general circulation model. The age tracking system works by computing the moments of the age distribution, which form a recursive system. The moments themselves exist as passive tracers, so they can be transported with the water vapor using a consistent transport calculation. This method allows us to track the age of water vapor online in any configuration where the model can be run, including both control and climate change simulations. Our intial tests with an aquaplanet model show a relative increase with age with height and towards the poles, with a decrease over the midlatitude eddies and an increase in the updraft of the Hadley cell. Additionally by resolving the standard deviation of the age distribution we can calculate the shape parameter of the distribution (raio of mean to standard deviation), which shows which regions of the atmosphere are affected by transport from a single pathway and which regions are affected by transport from multiple pathways. We further demonstrate the ability of our age tracking system in more realistic model configurations and climate change scenarios. 

How to cite: Fajber, R. and Boulanger, P.: 3D Eulerian Calculation of water vapor age moments for climate change and atmospheric dynamics studies, EGU General Assembly 2025, Vienna, Austria, 27 Apr–2 May 2025, EGU25-14470, https://doi.org/10.5194/egusphere-egu25-14470, 2025.

EGU25-14484 | ECS | Orals | AS1.22

Temporal Evolution of Diurnal Cycle of Rainfall Using Rain Gauge Data Over India 

Thanangka Chutia and Arindam Chakraborty

Hourly rainfall data from 81 Self Recording Rain Gauge stations were analyzed to study the temporal change of the diurnal cycle of rainfall across India between the two periods: 1969-1991 (past) and 1992-2014 (recent). Except east and northeast (ENE) and west India (WI), majority of the stations showed delayed phase of the diurnal cycle of rainfall in recent period.Both frequency and intensity diurnal cycle contributes to the delayed phase over central India (CI) whereas only the intensity diurnal cycle is responsible for advanced phase over WI. Decrease in the number of heavy rainfall events in the past phase contributes most to the delayed phase in CI while increase in the intensity of heavy rainfall events in the recent phase primarily contributes to the advanced phase over WI. Besides, increase in the number of break days over CI is also responsible its delayed phase. The decrease (increase) in CAPE over WI (CI) is responsible for advanced (delayed) phase.

How to cite: Chutia, T. and Chakraborty, A.: Temporal Evolution of Diurnal Cycle of Rainfall Using Rain Gauge Data Over India, EGU General Assembly 2025, Vienna, Austria, 27 Apr–2 May 2025, EGU25-14484, https://doi.org/10.5194/egusphere-egu25-14484, 2025.

EGU25-16758 | Posters on site | AS1.22

Dual-Isotope Eddy Covariance Measurements: Insights and Challenges in Ecosystem Water Flux Measurements Over Winter Wheat in Central Germany 

Anas Emad, Leo Oskar Franke, Gökben Demir, Christian Markwitz, Maren Dubbert, and Alexander Knohl

Dual-isotope eddy covariance measurements offer a novel approach for studying water fluxes in ecosystems, providing detailed insights into evapotranspiration (ET) and its components, evaporation (E) and transpiration (T). During the 2024 growing season, a dual-isotope eddy covariance system was deployed over a winter wheat cropland in central Germany, integrating a Los Gatos Research (LGR) Water Vapor Isotope Analyzer with a conventional eddy covariance setup. This system continuously measured isotopic fluxes (δD and δ18O) alongside water vapor, carbon dioxide, and energy fluxes at high temporal resolution. These measurements were supplemented by soil water profiles, biometeorological observations, and vegetation indices.

The isotopic flux data revealed diurnal and seasonal dynamics of water vapor isotopes, linked to environmental drivers such as vapor pressure deficit, soil moisture, and crop phenology. Preliminary results show a diurnal cycle of isotope fluxes of ET, characterized by isotopic enrichment during the middle of the day, with δ18OET reaching -12‰ and δDET reaching -110‰ (both against VSMOW). The results suggest that transpiration dominates ET during peak growth stages, while evaporation increases following precipitation events or during early crop development.

Key challenges include correcting for high-frequency dampening effects and addressing the analyzer’s sensitivity to water vapor concentration under different conditions, particularly during low-flux periods. Despite these challenges, dual-isotope techniques give valuable insights into crop water use strategies and responses to environmental drivers, offer the opportunity for isotope-based flux partitioning, and give a unique dataset for validating isotope-enabled land surface models.

How to cite: Emad, A., Franke, L. O., Demir, G., Markwitz, C., Dubbert, M., and Knohl, A.: Dual-Isotope Eddy Covariance Measurements: Insights and Challenges in Ecosystem Water Flux Measurements Over Winter Wheat in Central Germany, EGU General Assembly 2025, Vienna, Austria, 27 Apr–2 May 2025, EGU25-16758, https://doi.org/10.5194/egusphere-egu25-16758, 2025.

EGU25-18111 | Orals | AS1.22

Moisture sources and transport pathways of summertime intense extratropical cyclones in the North-Atlantic 

Frank Selten, Rikke Stoffels, Chris Weijenborg, and Imme Benedict

Extratropical cyclones are essential for the redistribution of energy, moisture, and momentum from the equator to the poles. Although wintertime extratropical cyclones are relatively well studied, less is known about summertime cyclones. Therefore, this research aims to improve our understanding of how summertime extratropical cyclones in the Northern Atlantic shape the global water cycle. More specifically, we focused on determining the moisture sources of these cyclones and analysed how precipitating air parcels were transported to the cyclone center. Changes in the moisture uptake and transport characteristics during the cyclone life cycle were also evaluated. To this end, 8-day backward trajectories were computed for the 20% most intense storms for three different stages in their life cycle: intensification, time of maximum intensity, and decay. Trajectory calculations were performed for all precipitating air parcels in a 500 km radius surrounding the cyclone center using the Lagrangian analysis tool LAGRANTO. Subsequently, moisture uptakes along the trajectories of only precipitating parcels were identified using the moisture source diagnostic WaterSip. We find that the bulk of the precipitation falls close to the cyclone center and along the fronts, mostly during the intensification phase. The origins of this moisture correspond to areas of high evaporation, with hotspots over the Gulf Stream region and its northeastern extension, and continental sources for cyclones in the Labrador Sea. The source distance is large during intensification, while local evaporation becomes more important during decay. Finally, we discuss the differences between summer and winter, as they have different dependencies on preceding "parent" cyclones for moisture supply.

How to cite: Selten, F., Stoffels, R., Weijenborg, C., and Benedict, I.: Moisture sources and transport pathways of summertime intense extratropical cyclones in the North-Atlantic, EGU General Assembly 2025, Vienna, Austria, 27 Apr–2 May 2025, EGU25-18111, https://doi.org/10.5194/egusphere-egu25-18111, 2025.

EGU25-18530 | ECS | Orals | AS1.22

Water vapour isotope anomalies during an atmospheric river event at Dome C, East Antarctica 

Niels Dutrievoz, Cécile Agosta, Amaëlle Landais, Cécile Davrinche, Camille Risi, Sébastien Nguyen, Christophe Leroy-Dos Santos, Inès Ollivier, Elise Fourré, Antoine Berchet, and Jonathan Wille

On December 19-21 2018, an atmospheric river hit the French-Italian Concordia station, located at Dome C, East Antarctic Plateau, 3 269 m above sea level. It induced a significant surface warming (+ 15°C in 3 days), combined with high specific humidity (multiplied by 3 in 3 days) and a strong isotopic anomaly in water vapour (+ 15 ‰ for δ18O). The isotopic composition of water vapour monitored during the event may be explained by (1) the isotopic signature of long-range water transport, and by (2) local moisture uptake during the event. In this study, we use continuous meteorological and isotopic water vapour observations, together with the atmospheric general circulation model LMDZ6iso, to describe this event and to quantify the influence of each of these processes. The presence of mixed-phase clouds during the event induced a significant increase in downward longwave radiative fluxes, which led to high turbulent mixing in the boundary layer. These fluxes are well represented by LMDZ6iso, as are the near-surface temperature and specific humidity. The surface vapour δ18O is accurately simulated during the event, despite an overestimated amplitude in the diurnal cycle outside of the event. Using this LMDZ6iso simulation, we perform a water vapour mass budget in the boundary layer and we show that the primary driver of the positive δ18O anomaly in vapour is surface sublimation, which becomes significantly stronger during the event compared to typical diurnal cycles. The second contribution arises from large-scale moisture advection associated with the atmospheric river. Consequently, the isotopic signal monitored in water vapour during this atmospheric river event reflects both long-range moisture advection and interactions between the boundary layer and the snowpack. Only specific meteorological conditions driven by the atmospheric river can explain these strong interactions. Enhancing the representation of local processes in climate models, especially by incorporating isotopic fractionation during sublimation, could substantially improve the simulation of the isotopic signal over Antarctica. Given the importance of air-snow vapour exchanges at the surface and in the atmosphere and their influence on the isotopic composition of surface snow, such simulations could provide valuable insights into how moisture advection events might affect the climate-scale isotope signal in ice cores.


How to cite: Dutrievoz, N., Agosta, C., Landais, A., Davrinche, C., Risi, C., Nguyen, S., Leroy-Dos Santos, C., Ollivier, I., Fourré, E., Berchet, A., and Wille, J.: Water vapour isotope anomalies during an atmospheric river event at Dome C, East Antarctica, EGU General Assembly 2025, Vienna, Austria, 27 Apr–2 May 2025, EGU25-18530, https://doi.org/10.5194/egusphere-egu25-18530, 2025.

EGU25-21252 | Posters on site | AS1.22

Dry periods amplify the Amazon and Congo forests’ rainfall self-reliance 

Lucie Bakels, Lan Wang-Erlandsson, Ruud van der Ent, Arie Staal, Patrick Keys, Delphine Clara Zemp, Ingo Fetz, Makoto Taniguchi, and Line J. Gordon

Moisture recycling is an important source of precipitation in the tropical forests of South America and Africa. Moisture is partly recycled from the tropical forests themselves (forest rainfall self-reliance) and is therefore subject to deforestation, which reduces evaporation. During the dry season, when water is already scarce, a further reduction in precipitation due to decreasing moisture recycling rates could potentially be fatal for already vulnerable ecosystems. It is therefore important to better understand the self-reliance of precipitation in tropical forests. For this reason, we present climatologies of precipitation dependence on evaporation in and from tropical forests using WAM2layers driven by ERA5 data. We find that forest rainfall self-reliance increases during the dry season in both the Amazon and Congo rain forests.

How to cite: Bakels, L., Wang-Erlandsson, L., van der Ent, R., Staal, A., Keys, P., Zemp, D. C., Fetz, I., Taniguchi, M., and Gordon, L. J.: Dry periods amplify the Amazon and Congo forests’ rainfall self-reliance, EGU General Assembly 2025, Vienna, Austria, 27 Apr–2 May 2025, EGU25-21252, https://doi.org/10.5194/egusphere-egu25-21252, 2025.

EGU25-733 | ECS | Orals | AS1.30

Wintertime Transarctic Warm and Moist Air Intrusions Tracked in Present and Future Climate 

Eva Lüdke, Jan Landwehrs, Johannes Riebold, Sofie Tiedeck, and Annette Rinke

The Arctic region is strongly impacted by climate change. Poleward transport of warm and moist air is one of the mechanisms contributing to accelerated Arctic wintertime warming. Warm and moist air intrusions (WAIs) into the Arctic are often associated with warm extremes and positive surface energy balance (SEB) anomalies by increased longwave downward radiation (LWD), impacting sea ice extent and recovery. WAIs are expected to increase in frequency in a warming climate until the end of the century, but uncertainties remain regarding their life cycle characteristics, as well as their local impacts and seasonality.

This study focusses on intrusion events that travel from the Greenland and Barents Seas far through the central Arctic. These transarctic WAIs are identified as anomalously high column-integrated water vapor transport (IVT) events and are tracked in space and time with the MOAAP algorithm (Prein et al. 2023).

Focusing on boreal winter (DJF) the occurrence, impacts and life-cycle characteristics of transarctic intrusion events along their path are initially studied using ERA5 data. A first analysis identified 14 transarctic WAIs between 1979-2022, which on average travel 7500 km within a common lifetime of five days. We show that these events are associated with increased integrated water vapor (IWV), LWD, precipitation, and near-surface wind speeds over Arctic sea ice and that these effects become less pronounced towards the end of the WAIs lifecycle. 

Furthermore, we find that during the transarctic WAI’s onset stage in the Greenland and Barents Seas, the associated transport of moist air masses towards the central Arctic is dynamically driven by a strong Icelandic low linked to a positive NAO state or a Scandinavian blocking. As these pressure patterns gradually shift northwards, the WAIs are directed through the Arctic, eventually reaching the Beaufort or East Siberian Seas.

The upcoming analysis will be extended by using data from regional Arctic model simulations with the atmospheric model ICON. Those are forced with ERA5 and two selected global CMIP6 climate models under the SSP370 scenario. The latter represent two distinct Arctic warming scenarios until the end of the century. This allows to assess future changes of transarctic WAIs and their impacts under different future Arctic warming storylines.

How to cite: Lüdke, E., Landwehrs, J., Riebold, J., Tiedeck, S., and Rinke, A.: Wintertime Transarctic Warm and Moist Air Intrusions Tracked in Present and Future Climate, EGU General Assembly 2025, Vienna, Austria, 27 Apr–2 May 2025, EGU25-733, https://doi.org/10.5194/egusphere-egu25-733, 2025.

Processes controlling the timing of the Arctic sea ice melt onset still remain unclear, but possible factors include variations in atmospheric circulation patterns and anomalies in clouds, moisture and surface energy budget, all of which are linked to narrow bands of warm and moist-air advection. These filaments, accounting for the majority of the poleward moisture transport, are called Atmospheric Rivers (ARs). Although spring is an important transition period for the sea ice evolution, there are hardly any in-situ observations in the Arctic Ocean for that period. To narrow down the knowledge gaps, the ARTofMELT expedition took place on the Swedish research Icebreaker Oden in the Fram Strait in May-June 2023 with two main objectives: to study processes leading up to the melt onset of Arctic sea ice and to investigate the role of ARs in affecting this timing. This study is motivated by the ARTofMELT expedition, during which the observed surface temperature exceeded the melting point on the 10th of June 2023 – much later than expected. Questions raised were “was this an anomalously late melt onset?” and “if yes, why?”. To address these questions, we put the year 2023 into a climatological (1981-2020) perspective by linking satellite-derived melt-onset (MO) dates with large-scale circulation features. Due to lack of MO-dates along the track in June 2023, the location of Oden during ARTofMELT is represented by a “Fram Strait sector”. Years are categorized into early and late MO-years based on the relative number of significant MO-anomalies within the sector.

The melt onset timing in the sector within the climatological period has a significant negative trend of -5 days in 10 years. In spring 2023, the average melt onset occurs on 8 June, corresponding to a MO-anomaly of almost 2 weeks relative to a transient climatology. As nearly 60 % of all grid-points obtain significant positive MO-anomalies and only a negligible fraction has significant negative MO-anomalies, we conclude that the melt onset in the sector region during ARTofMELT in spring 2023 was anomalously late.

The period before the MO in the sector was characterized by significant negative SLP anomalies over the whole Arctic Ocean and positive anomalies in SLP and atmospheric blocking over Eurasia. These circulation anomalies were associated with a strong cyclonic activity along the sea ice edge, directing warm and moist air, and most of the ARs, east of Svalbard into the BKS region – leading to an early MO there. The central Arctic Ocean was anomalously dry. The circulation patterns weakened and rather normal conditions prevailed during the MO period in the Fram Strait, where the MO was finally triggered by a transient AR on 10 June 2023.

Analysis between six most extreme early and late MO-years reveal that specific circulation patterns favoring moist and warm air transport towards and the occurrence of ARs within the Fram Strait sector are of more importance in determining the timing of MO for extreme early MO-years, whereas extreme late MO-years seem to be due to an absence of such large-scale features.

How to cite: Murto, S. and Tjernström, M.: ARTofMELT spring 2023 expedition: Investigating the Arctic sea ice melt onset in the context of climatology and atmospheric circulation, EGU General Assembly 2025, Vienna, Austria, 27 Apr–2 May 2025, EGU25-1741, https://doi.org/10.5194/egusphere-egu25-1741, 2025.

EGU25-2319 | ECS | Orals | AS1.30

Regional and Temporal Variability of Atmospheric River Seasonality: Influences of Detection Algorithms and Moisture Transport Dynamics 

Diya Kamnani, Travis A. O'Brien, Samuel Smith, Paul W. Staten, and Christine A. Shields

Understanding the regional and temporal variability of atmospheric river (AR) seasonality is crucial for preparedness and mitigation of extreme events. While ARs were thought to peak in winter, recent research shows they exhibit region-specific seasonality and are heavily influenced by the chosen detection algorithm. This study examines the link between the year-to-year consistency of peak AR activity to the presence of a dominant seasonal pattern, considering both location and algorithm choice. Regions are categorized by their temporal characteristics: consistent patterns (e.g., India, Central Asia), patterns with occasional outliers (e.g., British Columbia coast, Gulf of Alaska), and regions lacking a clear dominant peak season (e.g., South Atlantic, parts of Australia). Hence, not all regions display a consistent seasonal cycle of AR activity. This study quantifies the extent to which a region experiences a dominant peak season of AR activity (or lacks one) and offers insights to enhance decision-making in water management, natural hazard preparedness, and forecasting. Furthermore, given our finding that detection algorithms influence the peak season of AR activity, we also examine two diagnostic variables representative of moisture transport to corroborate our results. Integrated Vapor Transport, which captures meridional and zonal moisture transport, and Moist Wave Activity, representing moisture intrusions from lower to higher latitudes, are examined. Our analysis indicates that inconsistencies in the seasonal cycle of AR activity are not solely due to discrepancies in detection algorithms but also arise from changes in moisture transport.

How to cite: Kamnani, D., O'Brien, T. A., Smith, S., Staten, P. W., and Shields, C. A.: Regional and Temporal Variability of Atmospheric River Seasonality: Influences of Detection Algorithms and Moisture Transport Dynamics, EGU General Assembly 2025, Vienna, Austria, 27 Apr–2 May 2025, EGU25-2319, https://doi.org/10.5194/egusphere-egu25-2319, 2025.

EGU25-2964 | ECS | Orals | AS1.30 | Highlight

Global scale impact of atmospheric rivers on the severity of flooding  

Sucheta Pradhan, Conrad Wasko, and Murray Peel

Atmospheric rivers (ARs) are narrow, elongated corridors of concentrated moisture that transport substantial amounts of water vapour from the tropics to the mid-latitudes. These meteorological phenomena are known to significantly influence extreme precipitation events and are often linked to major flood occurrences. Despite their recognized importance in regional hydrology, the overall contribution of ARs to global flood risk—the hazard posed by extreme precipitation events—has not been comprehensively quantified. In this study, we assess the relationship between ARs and extreme hydrological events using data from 2686 largely regulation-free catchments distributed across the globe. Our findings reveal that on a regional scale, ARs are responsible for over 70% of the largest precipitation and streamflow events in the last four decades. Furthermore, AR-related precipitation leads to a significant reduction in the recurrence intervals of these extreme events, increasing the likelihood of large-scale flooding by a factor of 2 to 4. In certain regions, such as parts of North America, Europe, and Australia, rare flood events are up to 12 times more likely when ARs are present. These results underscore the critical role that ARs play in driving the frequency and severity of extreme hydrological events globally. Our findings highlight the need for greater attention to the influence of ARs on flood risk, particularly as climate change may alter their frequency and intensity in the future.

How to cite: Pradhan, S., Wasko, C., and Peel, M.: Global scale impact of atmospheric rivers on the severity of flooding , EGU General Assembly 2025, Vienna, Austria, 27 Apr–2 May 2025, EGU25-2964, https://doi.org/10.5194/egusphere-egu25-2964, 2025.

The Arctic has witnessed significant sea-ice melt and rising temperatures as major indicators of climate system alterations. As a severe weather event conveying heat and moisture from lower latitudes to the higher, atmospheric rivers (ARs) can lead to significant sea-ice loss and Arctic warming. Sea ice thickness is applied in this study to quantitatively explored the thermodynamic and dynamic impacts of ARs in winters from 2000 to 2020. ARs from the North Atlantic (AAR) and North Pacific (PAR) account for 44% of AR events and 40% of AR-driven sea-ice loss. The AR-induced melting process occurs in three successive stages. In Stage I, warm, moist air driven by dipole circulation anomalies ahead of AR causes sea ice melting, with thermal effects accounting for 53% for AAR and 58% for PAR. Stage II starts when the AR enters the Arctic and ends as its moisture transport weakens. Early sea-ice loss is driven by wind dynamics, while poleward progression elevates warm, moist air, forming clouds that intensify melting thermodynamically. This stage sees the most significant sea-ice melt, dominated by dynamic effects for AAR (59%) and thermodynamic effects for PAR (55%).In Stage III, as AR moisture dissipates, sea-ice melt continues for about a week, primarily driven by thermodynamic effects. Accompanied by the above three stages, the anticyclonic circulation anomaly on the right side of where AR is headed can also enhance downdrafts and melt perennial ice. By contrast, Pacific-channel ARs have a higher impact on the central Arctic than their Atlantic counterparts, suggesting extensive responses to climate variability.

How to cite: Gong, Z.: Dynamic and thermodynamic impacts of atmospheric rivers on sea-ice thickness in the Arctic since 2000, EGU General Assembly 2025, Vienna, Austria, 27 Apr–2 May 2025, EGU25-3436, https://doi.org/10.5194/egusphere-egu25-3436, 2025.

Atmospheric rivers (ARs) play an important role in both the global and regional climate systems. While there is extensive research on ARs and their relationship to precipitation in North America and East Asia, the role of ARs in the regional climate of Scandinavia remains understudied.

In this study, we investigated the characteristics of ARs making landfall over Scandinavia, their influence on regional precipitation, and how they are affected by the North Atlantic Oscillation (NAO). To achieve this, we analysed the ARs between 1980 and 2019 detected by four different AR Detection and Tracking algorithms (ARDT), from the Atmospheric River Tracking Method Intercomparison Project (ARTMIP). Combined with ERA5 reanalysis precipitation data, we quantified the AR related precipitation over the region.

We found that ARs are present during up to 35% of the total annual precipitation in Scandinavia, with the average AR-associated rainfall rate exceeding the non-AR rates. Clustering the ARs that intersect Scandinavia revealed four main AR patterns. For the two most frequent patterns, located in southern Scandinavia, ARs account for up to 32% of the total annual precipitation. Furthermore, for all patterns, AR activity reaches a maximum during autumn and whilst the NAO is in a strong positive phase. The results from the four ARDTs show similar spatial patterns, but with a notable difference in the magnitude of AR influence on precipitation. Our findings indicate that ARs are an important factor in Scandinavian precipitation, and highlight the value of using multiple ARDTs to obtain more robust results. 

How to cite: Holmgren, E. and Chen, H.: Spatial and temporal characteristics of atmospheric rivers in Scandinavia and their influence on the regional precipitation, EGU General Assembly 2025, Vienna, Austria, 27 Apr–2 May 2025, EGU25-3577, https://doi.org/10.5194/egusphere-egu25-3577, 2025.

EGU25-3695 | ECS | Posters on site | AS1.30

The Global Atmospheric River Network: A Complex Network Approach to Global Moisture Transport Dynamics 

Tobias Braun, Sara M. Vallejo-Bernal, Norbert Marwan, Juergen Kurths, Sebastian Sippel, and Miguel Mahecha

The increasing frequency and severity of hydrological extremes, such as heavy precipitation events, are significant challenges for human-environmental systems. Atmospheric rivers (ARs) are key drivers of these extremes, but the complex transport patterns of ARs at global scale remain underexplored. Our research introduces a novel network-based approach to studying global AR dynamics, applying methods from complexity science to reveal the “global road network” of ARs.

In analogy to terrestrial river networks, the pathways that ARs follow through the Earth’s atmosphere can be effectively represented by a transport network. Generally, the paradigm of complex networks encodes interactions between the units of a system through interlinked nodes. Recent applications illustrate that complex networks have provided novel insights into climate teleconnection patterns, synchronization of extremes and vegetation-atmosphere feedbacks. We draw on the vast array of existing methods from complex network theory to reveal the global atmospheric river network. We define it on a hexagonal grid to avoid distortions due to the Earth’s spherical geometry. Multiple AR catalogs can be integrated seamlessly. To quantitatively assess the significance of a transport property, the framework is equipped with a hierarchy of data-adaptive null models that are based on random walker ensembles.

We dissect the global transport infrastructure of ARs which reveals prominent AR pathways, regions of complex multi-directional transport, the predictability of single AR tracks, and scale-dependent spatial clusters. We demonstrate that there exists complexity above and beyond the previously identified four main branches of AR transport. These main oceanic bands can be decomposed into significant sub-branches. Exploiting all these novel tools to characterise AR transport, we unveil how the AR network is evolving in a changing climate. This talk underscores the potential of complexity science to advance our understanding of ARs as critical components of the integrated human-Earth system.

How to cite: Braun, T., Vallejo-Bernal, S. M., Marwan, N., Kurths, J., Sippel, S., and Mahecha, M.: The Global Atmospheric River Network: A Complex Network Approach to Global Moisture Transport Dynamics, EGU General Assembly 2025, Vienna, Austria, 27 Apr–2 May 2025, EGU25-3695, https://doi.org/10.5194/egusphere-egu25-3695, 2025.

EGU25-5904 | ECS | Orals | AS1.30

Investigating the Role of Anomalous Moisture Transport in Indian Subcontinent's Extreme Precipitation Events: A PIKART Perspective 

Sree Anusha Ganpathiraju, Sara M. Vallejo-Bernal, Norbert Marwan, and Maheswaran Rathinasamy

The dynamics of atmospheric moisture transport plays a dominant role in understanding the physical mechanisms that lead to extreme precipitation events (EPEs). In mid-latitudes, 90% of poleward moisture transport occurs along transient channels known as atmospheric rivers. However, due to the complex interactions of regional weather systems, they are challenging to define, detect, and analyze in tropical regions. In this context, the PIK Atmospheric River Trajectories (PIKART) catalog offers a unique capability to detect coherent channels of intense moisture transport, particularly in the tropical region. These are referred to as anomalous moisture transport pathways (AMTPs) to ensure clarity and avoid ambiguity. The existence of AMTPs in the tropics remains an open question and the role of their differentiated atmospheric dynamics in driving EPEs across the Indian subcontinent is yet unclear. To address this, we employ a novel database of EPEs created using the weather extremity index coalesced with the peak over threshold method, together with the PIKART catalog. We systematically identify the co-occurrence of AMTPs and EPEs in the Indian subcontinent. Our results reveal that among the top 100 EPEs, more than 47% displayed AMTPs. To understand the contribution of AMTPs to the severity of EPE, we also present a case study of the 2018 Kerala floods, for which the presence of an AMTP has been documented. Although previous studies identified an AMTP on August 13, 2018, we detected the occurrence of an earlier one on August 9, 2018, preceding the landfall of the event that unfolded between August 13 and 17, 2018. The decomposition of moisture contributions indicates that over 45% of the total moisture is attributed to this earlier AMTP trajectory, suggesting enhancement in the monsoon circulation. Our results shed light on the concept of AMTP in the tropics and contribute to comprehend its influence on climate extremes, a critical task to improve risk management and develop mitigation strategies.

How to cite: Ganpathiraju, S. A., M. Vallejo-Bernal, S., Marwan, N., and Rathinasamy, M.: Investigating the Role of Anomalous Moisture Transport in Indian Subcontinent's Extreme Precipitation Events: A PIKART Perspective, EGU General Assembly 2025, Vienna, Austria, 27 Apr–2 May 2025, EGU25-5904, https://doi.org/10.5194/egusphere-egu25-5904, 2025.

EGU25-6689 | Orals | AS1.30

The NCEI Climate Data Record for Atmospheric Rivers: Initial Results over the Western United States 

Emily Slinskey, Jonathan Rutz, Bin Guan, and F. Martin Ralph

The U.S. National Centers for Environmental Information (NCEI) is sponsoring development of an atmospheric river (AR) climate data record (CDR) to serve as a valuable resource for the scientific, water management, and decision-making communities across the Western US (and soon, globally). The CDR uses a novel combination of two techniques: (1) the AR Scale, which broadly characterizes the AR strength from 1-5 based on the peak integrated water vapor transport (IVT) and duration of AR conditions (i.e., IVT ≥ 250 kg m-1 s-1) at a given location, and (2) the tARget algorithm–a tool that uses climatological, geometric, and directional thresholds to identify ARs. Since the AR scale has no geometric criteria (and thus ranks non-AR events such as tropical cyclones, cutoff lows, and monsoons) and tARget does not provide characterization of AR strength, these two methods complement each other, with AR Scale-identified events “filtered” by tARget. This presentation highlights the resulting data and effects of this “filtering” through selected cases, long-term climatology, and interannual variability across various global regions. In addition, we explore attribution of precipitation to AR events identified in the CDR. All historical atmospheric data is sourced from the ERA5 reanalysis.

How to cite: Slinskey, E., Rutz, J., Guan, B., and Ralph, F. M.: The NCEI Climate Data Record for Atmospheric Rivers: Initial Results over the Western United States, EGU General Assembly 2025, Vienna, Austria, 27 Apr–2 May 2025, EGU25-6689, https://doi.org/10.5194/egusphere-egu25-6689, 2025.

EGU25-7213 | ECS | Orals | AS1.30

Identifying Antarctic Atmospheric River Families 

Michelle Maclennan, Jimmy Butler, Becca Baiman, Grant LaChat, and Christine Shields

Despite their rarity, atmospheric rivers (ARs) bring powerful impacts to Antarctica when they make landfall on the ice sheet. Antarctic ARs contribute 10% of the annual precipitation and are major drivers for heatwaves, foehn events, and surface melting on ice shelves. While snowfall is currently the dominant impact of Antarctic ARs, helping to offset sea level rise due to ice discharge from West Antarctica, the relative contribution of ARs to snowfall, rainfall, and surface melt may change in a warming climate, along with the frequency and intensity of AR events themselves, motivating the study of these rare, impactful events. In this study, we examine the occurrence of Antarctic AR families, in which two or more ARs occur in rapid succession in a region. While individual ARs have been shown to have pronounced and widespread impacts in Antarctica, latent heat release from ARs in a family can reinforce associated downstream high-pressure systems to produce extended, high impact AR conditions on the ice sheet, including multiple days of intense snowfall and temperatures above the melting point. Here we present initial results from an Antarctic-wide study of the occurrence and impacts of AR family events. First, we use a density-based clustering algorithm to classify AR events as objects from an Eulerian, Antarctic-specific detection tool based on MERRA-2 reanalysis. From this, we construct a database of AR events around Antarctica from 1980-2022, with information on the location, duration, and landfall (if it occurred) for each AR. Then, we cluster the AR events by location and time once more, to identify the occurrence of AR family events. We explore the sensitivity of the number of AR family events detected, and the number of ARs per family, to the chosen aggregation period (two to six days) and distance parameter (500 – 1000 km). Finally, we utilize a novel atmospheric Rossby wave breaking detection tool to compare the frequency of cyclonic and anticyclonic wave breaking events over the Southern Ocean to the frequency of AR family and non-family events. Ultimately, our study aims to diagnose the occurrence, synoptic drivers, characteristics, and impacts of AR family events on the Antarctic Ice Sheet in the last four decades, to provide a baseline assessment of how these extreme events can compound to produce lasting, high-impact conditions.

How to cite: Maclennan, M., Butler, J., Baiman, B., LaChat, G., and Shields, C.: Identifying Antarctic Atmospheric River Families, EGU General Assembly 2025, Vienna, Austria, 27 Apr–2 May 2025, EGU25-7213, https://doi.org/10.5194/egusphere-egu25-7213, 2025.

EGU25-8024 | Orals | AS1.30

Atmospheric rivers in the Mediterranean basin and heavy precipitation over northern Italy 

Silvio Davolio, Isacco Sala, Alessandro Comunian, Daniele Mastrangelo, Sante Laviola, Giulio Monte, Barbara Tomassetti, Annalina Lombardi, Marco Verdecchia, Federico Grazzini, and Valentina Colaiuda

Recent studies of extreme precipitation and flood events affecting the Alpine area in northern Italy have revealed that besides the local contribution due to evaporation from the Mediterranean Sea, a relevant amount of moisture may move from remote areas towards the Mediterranean within long and narrow filament-shaped structures, known as atmospheric rivers.

High-resolution numerical simulations have demonstrated that the presence of an intense atmospheric river, whether coming from Africa tropical areas or from the Atlantic, represented a distinguishing aspect of those events, superimposed on the well-known mesoscale dynamic mechanisms of heavy precipitation over the Alps. The orographic uplift of water vapour transported by the atmospheric rivers represented a critical ingredient for the occurrence of extreme rainfall, and the characteristics of the atmospheric rivers determined the distribution and the intensity of the precipitation.

In order to investigate further the possible link between atmospheric rivers across the Mediterranean basin and high-impact weather, a detection algorithm, designed for the open oceans, has been adapted to the peculiar complex morphology of the region. It has been applied to conduct a climatological analysis on the presence of atmospheric rivers in the Mediterranean, exploiting ERA5 reanalysis, and to assess their relationship with extreme rainfall events over northern Italy during the last decades, exploiting a precipitation dataset with raingauge observations aggregated over civil protection warning areas. The study is undertaken in the framework of the national project ARMEX, funded by the Italian Ministry of Universities and Research, which involves also expertise in remote sensing and hydrological modelling to fully investigate characteristics and hydro-meteorological impact of atmospheric river over the national territory.

How to cite: Davolio, S., Sala, I., Comunian, A., Mastrangelo, D., Laviola, S., Monte, G., Tomassetti, B., Lombardi, A., Verdecchia, M., Grazzini, F., and Colaiuda, V.: Atmospheric rivers in the Mediterranean basin and heavy precipitation over northern Italy, EGU General Assembly 2025, Vienna, Austria, 27 Apr–2 May 2025, EGU25-8024, https://doi.org/10.5194/egusphere-egu25-8024, 2025.

EGU25-9886 | ECS | Posters on site | AS1.30

Gulf Stream Ocean Conditions Influence on Atmospheric Rivers 

Ferran Lopez-Marti, Arnaud Czaja, Gabriele Messori, Lichuan Wu, and Anna Rutgersson

Extreme precipitation and wind events in Western Europe are driven by Atmospheric Rivers (ARs) developing over the North Atlantic Ocean. While extensive research has been conducted on the atmospheric dynamics of ARs in this region and their connection with the North Atlantic Storm Track, gaps persist in understanding how oceanic variability influences AR activity, particularly in the eddy-rich environment of the Gulf Stream extension. The enhanced ocean heat supply and high mesoscale eddy activity over these western oceanic currents increase the surface latent heat flux in the area, thereby increasing moisture availability in the lower atmosphere and potentially facilitating AR genesis.

This study focuses on evaluating the status of mesoscale eddies and oceanic conditions within the Gulf Stream extension and their downstream impact on AR activity. To achieve this, we employ a high-pass Fourier Filter Transformation to isolate and quantify the mesoscale eddy activity (smaller than ~500 km) of the Gulf Stream extension region in a high-resolution (0.125º) satellite product for the sea surface height. Additionally, we utilise different observational products (OAFlux, ARGO and RAPID) to quantify the surface heat fluxes, the ocean heat content in the Gulf Stream extension region and the oceanic heat supply through the Florida Straight. Finally, we identify and track Atmospheric Rivers in the ECMWF reanalysis ERA5 dataset over the North Atlantic.

Our analysis provides a spatial and temporal cross-correlation analysis between the Gulf Stream state and the AR activity downstream. Furthermore, we investigate temporal lags between various oceanic conditions and their impact on ARs, thereby identifying oceanic precursors for AR genesis. Consequently, our study establishes a novel statistical relationship between Gulf Stream state and AR activity, with a particular emphasis on the role of mesoscale features. This includes a comprehensive characterisation of mesoscale eddy activity within the region, contributing to a deeper understanding of the mechanisms driving AR formation and propagation in Western Europe.

How to cite: Lopez-Marti, F., Czaja, A., Messori, G., Wu, L., and Rutgersson, A.: Gulf Stream Ocean Conditions Influence on Atmospheric Rivers, EGU General Assembly 2025, Vienna, Austria, 27 Apr–2 May 2025, EGU25-9886, https://doi.org/10.5194/egusphere-egu25-9886, 2025.

EGU25-12461 | ECS | Orals | AS1.30

Unravelling the sources of moisture for precipitation in atmospheric rivers 

Alfredo Crespo-Otero, Damián Insua-Costa, and Gonzalo Míguez-Macho

Atmospheric rivers (ARs) are filaments of enhanced moisture in the atmosphere, which often produce intense or even extreme precipitation when the enormous amounts of water vapor in them are forced upwards. In this sense, one of their most studied and debated properties is the origin of the moisture they transport. Although some studies have identified sources using different diagnostic tools for specific AR cases, it remains unclear whether tropical or extratropical contributions are generally more prevalent, and even the AR definition in the Glossary of Meteorology reflects this lack of consensus.

To fill this gap, a climatology of moisture sources for precipitation in ARs is needed. There are a variety of moisture source diagnostics that can be employed to address this issue. Here we use the Lagrangian model FLEXPART together with an implementation of the Dirmeyer and Brubaker, (1999) methodology, which we previously validated using the WRF with Water Vapor Tracers (WRF-WVTs) model. This allows us to efficiently simulate air particle trajectories and compute moisture sources for precipitation within a wide range of ARs with a Lagrangian methodology, while maintaining consistency with the WRF-WVTs model, assumed to be one of the most accurate moisture tracking tools. Preliminary results reveal a wide diversity of moisture sources, including both oceanic and continental regions, with substantial variability in their contributions across different AR cases. Importantly, our findings also indicate a less relevant role of tropical moisture than previously known. Ultimately, this highlights the complexity of the moisture uptakes in ARs.

Dirmeyer, P. A. and Brubaker, K. L.: Contrasting evaporative moisture sources during the drought of 1988 and the flood of 1993, J. Geophys. Res. Atmospheres, 104, 19383–19397, https://doi.org/10.1029/1999JD900222, 1999.

How to cite: Crespo-Otero, A., Insua-Costa, D., and Míguez-Macho, G.: Unravelling the sources of moisture for precipitation in atmospheric rivers, EGU General Assembly 2025, Vienna, Austria, 27 Apr–2 May 2025, EGU25-12461, https://doi.org/10.5194/egusphere-egu25-12461, 2025.

EGU25-14595 | ECS | Posters on site | AS1.30

Atmospheric Rivers as Interacting Elements of the Earth System: A Complexity Science Perspective 

Sara M. Vallejo-Bernal, Tobias Braun, Norbert Marwan, Ana Bastos, Miguel D. Mahecha, and Jürgen Kurths

The critical role of atmospheric rivers (ARs) in the global water cycle, along with their intensification under global warming, underscores the urgency of understanding and predicting their dynamics and impacts at both regional and global scales. Despite significant advances, this endeavor remains challenging because ARs lie at the interface of weather and climate. These synoptic-scale systems produce short-term, localized impacts while shaping long-term global patterns of moisture, wind, and precipitation. AR genesis and evolution emerge from interactions within the coupled ocean-atmosphere system, while AR-induced precipitation can lead to natural disasters through land-atmosphere interactions. By transporting vast amounts of moisture over great distances, ARs establish teleconnections that influence weather across thousands of kilometers. At the same time, their activity is shaped by large-scale climate phenomena such as the El Niño–Southern Oscillation and the Pacific Decadal Oscillation. Advancing AR science, therefore, requires treating ARs as integral components of the Earth system and unraveling their interactions across a broad range of spatial and temporal scales.

In this talk, we present and discuss the paradigm of complexity science and the exciting opportunities it offers for advancing AR science. Building on a solid foundation of dynamical systems, stochastic climate theory, and network theory, complexity science integrates nonlinearities, feedbacks, and uncertainties into the study of ARs. By employing novel methods such as event synchronization, climate networks, and probabilistic causation, complexity science provides powerful tools to investigate non-local interactions, uncover hidden dynamics, and refine impact attribution in AR research. To ensure the robustness of findings, complexity science integrates null models, hypothesis testing, confidence bounds, and sensitivity analyses. Emerging research avenues, such as AR networks, community detection, low-order modeling, and tipping dynamics, can now be explored through the lens of complexity science. By establishing a rigorous theoretical and methodological foundation, complexity science paves the way for innovative research on AR dynamics, impacts, and prediction.


How to cite: Vallejo-Bernal, S. M., Braun, T., Marwan, N., Bastos, A., Mahecha, M. D., and Kurths, J.: Atmospheric Rivers as Interacting Elements of the Earth System: A Complexity Science Perspective, EGU General Assembly 2025, Vienna, Austria, 27 Apr–2 May 2025, EGU25-14595, https://doi.org/10.5194/egusphere-egu25-14595, 2025.

EGU25-14684 | Orals | AS1.30

Atmospheric River Over the Middle East  

Diana Francis, Ricardo Fonseca, and Narendra Nelli

Atmospheric Rivers (ARs) are narrow and long bands of high water vapour content, which largely originate in the tropics or subtropics and propagate into mid- and high-latitudes. They can bring beneficial rain and snow but, in particular the most intense, can lead to catastrophic flooding and loss of life. One of such occurrences in the Middle East in mid-April 2023 is investigated using model and observational data. The high-resolution (2.5 km) simulation put in evidence narrow (5-15 km) and long (100-200 km) convective structures within the AR, known as AR rapids, which produced heavy precipitation (>4 mm hr-1), further enhanced by gravity waves that developed over the high terrain in western Saudi Arabia, and propagated at high speeds (>30 m s-1). ARs are occurring more frequently in the Middle East as they are globally, and with increased atmospheric water vapour in a warming climate, AR rapids may be even more destructive.

How to cite: Francis, D., Fonseca, R., and Nelli, N.: Atmospheric River Over the Middle East , EGU General Assembly 2025, Vienna, Austria, 27 Apr–2 May 2025, EGU25-14684, https://doi.org/10.5194/egusphere-egu25-14684, 2025.

Atmospheric Rivers (ARs) play a critical role in the Arctic climate system, providing the majority of water vapor transport into the Arctic. The potential of such events to impact especially the ice-covered regions of the Arctic have been explored in recent studies: ARs can trigger surface melt of the Greenland ice sheet and slow the seasonal recovery of the Arctic ice sheet. Furthermore, the low Arctic sea-ice extents of the years 2012 and 2020 could be linked to a more frequent occurrence of ARs. These case studies highlight the warming effect of individual cases of ARs.

We statistically investigate the warming effect of ARs on the Arctic sea-ice and ocean surface by examining anomalies in the atmospheric part of the surface energy budget (SEB). This climatological analysis is based on the ERA5 reanalysis from 1979 to 2021. ARs are detected using the algorithm by Guan and Waliser. Overall, a net energy gain of the surface associated with the occurrence of ARs is found, with the highest anomalies in winter over the open ocean. For a deeper understanding of the impact, complementary information on the climatological relevance of these events for the SEB is provided. Furthermore, we analyze the physical processes leading to the AR-related SEB anomalies, explaining the seasonal changes and the dependence of the anomalies on the surface type.

Within the rapidly changing Arctic climate, also changes in AR occurrence and their impact on the SEB can be expected. We investigate these changes by comparing the “old Arctic” (1979-1999) with the “new Arctic” (2000-2021). An overall increase in the occurrence frequency of ARs is found. Changes in the AR-related SEB anomalies are mostly linked to sea-ice decline.

How to cite: Tiedeck, S. and Rinke, A.: Arctic Atmospheric Rivers: An in-depth Investigation of their Impact on the Surface Energy Budget, EGU General Assembly 2025, Vienna, Austria, 27 Apr–2 May 2025, EGU25-18198, https://doi.org/10.5194/egusphere-egu25-18198, 2025.

EGU25-18254 | ECS | Orals | AS1.30

Relationship between atmospheric rivers and aerosol atmospheric rivers in the Iberian Peninsula 

Diogo Luís, Irina Gorodetskaya, and Carla Gama

Recently, the water vapour atmospheric river (AR) concept was extended to aerosols, introducing the term aerosol atmospheric river (AAR) into the literature. Equivalently to ARs, AARs are narrow and transient filaments of intense aerosol transport in the lower troposphere. The Iberian Peninsula (IP) is one of the regions regularly affected by ARs and is also frequently impacted by Saharan dust outbreaks. While the impacts of ARs in the IP were extensively studied, there is a lack of regional studies on the impact of AARs in the IP. Moreover, the relationship between ARs and AARs in the IP has not yet been investigated. Therefore, this work aims to better understand the relationship between ARs and AARs in the IP and to quantify the co-occurrence of these phenomena. In this sense, a modified algorithm originally designed to detect ARs was applied to the Modern-Era Retrospective analysis for Research and Applications, version 2 (MERRA-2) reanalysis in order to identify the AARs that affected the IP over a 20-year period. Five aerosol types were used: dust, sea salt, sulphate, organic carbon and black carbon. In this presentation, we will show and discuss the climatology, the seasonality, and the characteristics of each type of Iberian AAR and how often these events are associated with ARs. This work contributes to a better understanding of the differences between ARs and AARs, as these phenomena share similarities but can also have different origins and trajectories.


This work was supported by the Portuguese Foundation for Science and Technology (FCT) through a PhD grant (2023.03574.BD) for Diogo Luís.

How to cite: Luís, D., Gorodetskaya, I., and Gama, C.: Relationship between atmospheric rivers and aerosol atmospheric rivers in the Iberian Peninsula, EGU General Assembly 2025, Vienna, Austria, 27 Apr–2 May 2025, EGU25-18254, https://doi.org/10.5194/egusphere-egu25-18254, 2025.

EGU25-20603 | ECS | Orals | AS1.30

Response of sea surface temperature to atmospheric rivers 

Tien-Yiao Hsu, Matthew Mazloff, Sarah Gille, Mara Freilich, Rui Sun, and Bruce Cornuelle

Atmospheric rivers (ARs), responsible for extreme weather conditions, are mid-latitude systems that can cause significant damage to coastal areas. While forecasting ARs beyond two weeks remains a challenge, past research suggests potential benefits may come from properly accounting for the changes in sea surface temperature (SST) through air–sea interactions. In this paper, we investigate the impact of ARs on SST over the North Pacific by analyzing 25 years of ocean reanalysis data using an SST budget equation. We show that in the region of strong ocean modification, ocean dynamics can offset over 100% of the anomalous SST warming that would otherwise arise from atmospheric forcing. Among all ocean processes, ageostrophic advection and vertical mixing (diffusion and entrainment) are the most important factors in modifying the SST tendency response. The SST tendency response to ARs varies spatially. For example, in coastal California, the driver of enhanced SST warming is the reduction in ageostrophic advection due to anomalous southerly winds. Moreover, there is a large region where the SST shows a warming response to ARs due to the overall reduction in the total clouds and subsequent increase in total incoming shortwave radiation.

How to cite: Hsu, T.-Y., Mazloff, M., Gille, S., Freilich, M., Sun, R., and Cornuelle, B.: Response of sea surface temperature to atmospheric rivers, EGU General Assembly 2025, Vienna, Austria, 27 Apr–2 May 2025, EGU25-20603, https://doi.org/10.5194/egusphere-egu25-20603, 2025.

CL5 – Tools for Climate Studies

EGU25-646 | ECS | Posters on site | CL5.1

Progress exploring the characteristics of yellow stimulated luminescence on potassium feldspar  

Gwynlyn Buchanan, Frank Preusser, Kathryn Fitzsimmons, and Tobias Lauer

We investigate the characteristics of low-temperature yellow stimulated luminescence (YSL), to compare its utility for dating with infrared stimulated luminescence (IRSL) stimulated at 50 °C (IR50), post-IR50 yellow stimulated luminescence (pIR-YSL) and pIRIR290. Altogether, eleven samples from a range of depositional environments and known ages were tested. Thermal stability, bleachability, dose recovery, fading tests and equivalent dose estimation were undertaken. The pIR-YSL signal is stable up to 150 °C but susceptible to thermal transfer at higher temperatures and both the pIR-YSL and YSL50 signals bleach out at a rate and extent that is similar to the IR50 signal. Dose recovery tests on four of the young intermediate samples illustrate that the pIR-YSL signal can be both recovered and fully reset. Fading tests show that all three signals suffer from significant fading and equivalent dose estimations of the saturated samples IR50, IR-YSL and YSL50 signals significantly underestimate relative to the pIRIR290 signal. Elevated temperature signal combinations are additionally evaluated with the aim of further understanding the effect of elevated temperatures on the fading rate and ultimately the utility of YSL signals for dating.

How to cite: Buchanan, G., Preusser, F., Fitzsimmons, K., and Lauer, T.: Progress exploring the characteristics of yellow stimulated luminescence on potassium feldspar , EGU General Assembly 2025, Vienna, Austria, 27 Apr–2 May 2025, EGU25-646, https://doi.org/10.5194/egusphere-egu25-646, 2025.

EGU25-1384 | ECS | Posters on site | CL5.1

Optically Stimulated Luminescence and in situ 10Be / 26Al cosmogenic dating of the Upper and Lower Units from ‘La Falaise de la Mine d'Or’ at Pénestin (SW Brittany, France) within the cron-BRET Project. 

Carlos Arce Chamorro, Benjamin Sautter, Guillaume Guérin, François Guillocheau, Steven Binnie, Tibor Dunai, and David Menier

The sedimentary units overlying the so-called ‘Falaise de la Mine d'Or’ on the South-East coast of Brittany (France) have been studied for decades to reconstruct the evolution of fossil fluvial valleys in Brittany during the Pliocene and Quaternary (Guillocheau et al., 1998; Menier et al., 2006). However, published numerical ages are insufficient to provide a precise age of each of the units described, whose chronology relies on correlations with ESR dating of fluvial sediments from the interior of Central Brittany (Laurent et al., 1996). Thanks to the cron-BRET Project of the MSCA-Bienvenüe Bretagne Programme carried out by the Geo-Ocean Laboratory of the Université de Bretagne Sud in collaboration with the Cosmogenic Nuclide Laboratory of the University of Cologne (Germany), it has been possible to date the lower unit (U1), mainly composed of quartzite gravels and pebbles. In situ 10Be and 26Al concentrations produced within the quartz of these clasts become controlled by differential rates of decay when shielded from production at the surface (Dunai, 2010). The fact that the sediments are buried under a sedimentary shield of more than three metres, allows for the calculation of a burial age from the concentration of 10Be and 26Al by using the isochron method (Balco and Rovey, 2008; Granger et al., 2022). Preliminary results provide numerical data that place the formation of this unit 2.72 ± 0.19 million years ago, at the Plio-Quaternary boundary. Our study also includes the dating of the upper unit (U3) mainly composed of sand-sized materials (90-2000 µm), by analysis of the optically stimulated luminescence (OSL) signal of quartz (Murray et al., 2021) at the RenDaL Luminescence Laboratory (Géosciences- Univ. Rennes). The calculation of the palaeodose using Bayesian procedures (BayLum; Philippe et al., 2019) and of the natural dose rate from high-resolution gamma spectrometry (HRGs) measurements provides a burial age range between 263 and 408 ky. These data will be complemented by the dating of the materials composing unit U2 by analysing the infrared stimulated luminescence signal (IRSL) of potassium feldspar to extend the available dates and the knowledge of the landscape evolution of this coastal area linked to glacioeustatic oscillations and neotectonics during the Pleistocene.

How to cite: Arce Chamorro, C., Sautter, B., Guérin, G., Guillocheau, F., Binnie, S., Dunai, T., and Menier, D.: Optically Stimulated Luminescence and in situ 10Be / 26Al cosmogenic dating of the Upper and Lower Units from ‘La Falaise de la Mine d'Or’ at Pénestin (SW Brittany, France) within the cron-BRET Project., EGU General Assembly 2025, Vienna, Austria, 27 Apr–2 May 2025, EGU25-1384, https://doi.org/10.5194/egusphere-egu25-1384, 2025.

EGU25-1725 | ECS | Posters on site | CL5.1

Volcanogenic CO2 emissions affect radiocarbon dating in a case study from the Laacher See crater lake, Germany 

Lola Claeys, Stijn Albers, Irka Hajdas, and Marc De Batist

Lake sediments form a valuable and often continuous record for reconstructing past climate and the occurrence and impact of natural hazards. The interpretation of this record, however, relies heavily on a robust chronology formed by age-dating the sediments. For recent (i.e. Quaternary) lake sediments, radiocarbon dating of organic material is a fundamental dating technique. However, constructing a lake sediment chronology can be challenging, since the use of radiocarbon dating is dependent on many factors, including the type of material to be dated, depositional circumstances and possible contamination of 14C. Volcanogenic CO2, for instance, is depleted in 14C. This implies that in regions with surface exhalations of volcanic CO2 the concentration of 14C in the surrounding atmosphere is diluted. For this study, the effect of volcanogenic CO2 gas emissions on the use of radiocarbon dating was investigated in the Laacher See volcanic crater in western Germany. This crater was formed after the eruption of the Laacher See Volcano around 13 ka BP. It contains multiple degassing vents emitting CO2 of magmatic origin, in the form of underwater bubble seeps in the lake (“wet mofettes”) and onshore soil degassing (“dry mofettes”). Living plant material, i.e. leaves of Taraxacum genus plants, were sampled in several locations in the crater and dated to examine their range in radiocarbon ages and spatial variability. Additionally, a > 4 m long sediment core taken in the lake was sampled for organic material and bulk sediment to assess the offset of radiocarbon ages to their true or expected ages. Our results show that all dated samples exceed their true or expected ages, with the Taraxacum samples giving variable radiocarbon ages of up to 9000 a BP. Along a transect of sampled Taraxacum plants, the radiocarbon ages decrease with an increasing distance from the degassing vents along the lake shore. The radiocarbon ages of the sediment core samples show that organic material deposited in the lake is also affected by volcanogenic CO2 emissions, with some radiocarbon ages exceeding the age of the Laacher See eruption that formed the crater, although no regular offset could be determined for these samples with regard to their depth in the core. Furthermore, the radiocarbon ages do not correspond to a 210Pb/137Cs age-depth model that was established for the top of the core. Radiocarbon dating is shown to not provide reliable results for establishing a chronology for the sedimentary infill of Laacher See. Further research is required to better understand the influence of volcanogenic CO2 on organic material, such as effects of temporal and spatial variations in CO2 flux. In the case of Laacher See, other age-dating techniques should be considered to establish an age-depth model with reliable, non-14C dependent ages.

How to cite: Claeys, L., Albers, S., Hajdas, I., and De Batist, M.: Volcanogenic CO2 emissions affect radiocarbon dating in a case study from the Laacher See crater lake, Germany, EGU General Assembly 2025, Vienna, Austria, 27 Apr–2 May 2025, EGU25-1725, https://doi.org/10.5194/egusphere-egu25-1725, 2025.

EGU25-1998 | Orals | CL5.1

Chronology and environmental changes from a sediment core spanning the last 487 kafrom Lake Acıgöl (SW Anatolia) 

Hüseyin Çaldırak, Zeki Bora Ön, Serkan Akkiraz, M. Namık Çağatay, Bassam Ghaleb, Sabine Wulf, K. Kadir Eriş, Dursun Acar, Jerome Kaiser, and Sena Akçer Ön

This study details the construction of an age-depth model for the uppermost 128 meters of the 600 m long Acıgöl2009-B03 sediment core, retrieved from hypersaline Lake Acıgöl in southwestern Anatolia. The model matches the arboreal pollen record from Acıgöl2009-B03 with the LR04 benthic δ18O stack marine oxygen isotope record. Initial correlation employs the Dynamic Time Warping algorithm, refined through manual tuning. Validation of the model's accuracy incorporates multiple chronological constraints, including three radiocarbon dates, three U/Th dates, and the Kos Plateau Tuff, dated at 161.3 ± 0.1 ka. According to this model, the upper 128 meters of the Acıgöl2009-B03 sequence spans approximately the last 487,000 years, encompassing Marine Isotope Stages (MIS) 1 to 12 and part of MIS 13. Our model serves as an update to the previously published, linearly constructed, age model as being used more anchor point and an efficient algorithm for similarity measurements which lies on a robust statistical foundation. In this period, arboreal pollen data suggest increasing (decreasing) arboreal vegetation input during interglacial (glacial) periods.

How to cite: Çaldırak, H., Ön, Z. B., Akkiraz, S., Çağatay, M. N., Ghaleb, B., Wulf, S., Eriş, K. K., Acar, D., Kaiser, J., and Akçer Ön, S.: Chronology and environmental changes from a sediment core spanning the last 487 kafrom Lake Acıgöl (SW Anatolia), EGU General Assembly 2025, Vienna, Austria, 27 Apr–2 May 2025, EGU25-1998, https://doi.org/10.5194/egusphere-egu25-1998, 2025.

EGU25-2273 | ECS | Posters on site | CL5.1

Luminescence dating of feldspar using a novel infra-red photoluminescence signal – first dating results from loess samples 

Janina J. Nett, Tony Reimann, and Svenja Riedesel

Luminescence dating has long been used for dating sediments both in geological as well as archaeological context. Following numerous advances in feldspar and quartz luminescence dating in recent decades, a new method for feldspar dating is currently under development: Infrared photoluminescence (IRPL) is a novel technique, which allows the direct and non-destructive measurement of luminescence emitted by trapped electrons in feldspars (Prasad et al., 2017). IRPL arises from radiative excited state to ground state relaxation of trapped electrons within the principal trap in feldspar.

IRPL measurements enable the investigation of two emissions, one at 880 nm and another one at 955 nm (Kumar et al., 2018, 2021). Whilst most research on IRPL has focussed on understanding the physical processes leading to the IRPL emission in feldspars, yet little is known with regard to the application of IRPL as a dating technique. We build upon a first measurement protocol for sediment dating developed by Kumar et al. (2021) and combine the IRPL measurements with a modified post-IR IRSL protocol (pIRIR225 with IR stimulation at 50°C, 90°C, 225°C), which allows a comparison of the IRPL signals with three IRSL signals. This integration of the IRPL measurements in a pIRIR protocol might possibly reduce fading to a negligible level due to the successive IRSL and IRPL measurement steps.

First promising results on loess samples with known (independent) age from the Balta Alba Kurgan loess-paleosol sequence in Romania (Scheidt et al., 2021) will be presented. We conducted dose recovery tests, bleaching experiments and equivalent dose measurements using different test doses and will show first results of fading measurements. The dose recovery tests are within 10% of unity for most of the measurements suggesting sufficient performance of our novel IRPL/pIRIR protocol. However, IRPL equivalent doses seem to slightly underestimate previously measured pIRIR290 equivalent doses. Possible reasons will be discussed within the EGU presentation.


References

Kumar, R., Kook, M., Murray, A.S. & Jain, M. (2021). Towards direct measurement of electrons in metastable states in K-feldspar: Do infrared-photoluminescence and radioluminescence probe the same trap? Radiation Measurements 120, P. 7-13.

Kumar, R., Kook, M., & Jain, M. (2021). Sediment dating using infrared photoluminescence. Quaternary Geochronology 62, 101147.

Prasad, A.K., Poolton, N.R.J., Kook, M. et al. (2017) Optical dating in a new light: A direct, non-destructive probe of trapped electrons. Sci Rep 7, 12097.

Scheidt, S., Berg, S., Hambach, U., Klasen, N., Pötter, S., Stolz, A., ... & Nett, J. J. (2021). Chronological assessment of the Balta Alba Kurgan loess-paleosol section (Romania)–a comparative study on different dating methods for a robust and precise age model. Frontiers in Earth Science, 8, 598448.

How to cite: Nett, J. J., Reimann, T., and Riedesel, S.: Luminescence dating of feldspar using a novel infra-red photoluminescence signal – first dating results from loess samples, EGU General Assembly 2025, Vienna, Austria, 27 Apr–2 May 2025, EGU25-2273, https://doi.org/10.5194/egusphere-egu25-2273, 2025.

EGU25-3717 | Posters on site | CL5.1

Rock Luminescence Dating Method for Studying the Temporal and Spatial Evolution of the Maying River, Qilian Mountains 

Furong Cui, Huiping Zhang, Jinfeng Liu, and Jintang Qin

    Fluvial depositional systems are critical for understanding the interplay between tectonics and climate. Accurately determining the ages of these formations is essential for exploring the spatial and temporal evolution of river deposits. In arid and semi-arid regions, these systems predominantly consist of coarse materials and cobbles. Traditional age determination methods often focus on well-sorted fine sediments, while dating poorly sorted cobble layers presents a significant challenge. Recently, optically stimulation luminescence (OSL) is increasingly are used to determine the burial age of rocks. This new method relies on resetting of the latent geological OSL signals with depth into the rock surface, and the re-accumulation of new signals after the burial (Sohbati et al.,2015).

     This study aims to investigate buried cobbles from terrace and alluvial gravel profiles along the Maying River, located at the foothills of the Qilian Mountains. We will utilize a Risø Luminescence Imager, complemented by in-situ measurement techniques (Sellwood et al.,2022). This integrated methodology will enhance our understanding of luminescence signal bleaching characteristics on rock surfaces, allowing for the rapid and accurate selection of samples for age dating. This approach not only mitigates the limitations of cobble dating across millennial to hundred-thousand-year timescales, but also provides novel insights into the late Quaternary geomorphology and tectonic evolution of rivers at the front of the Qilian Mountains.

Key words: Rock surface luminescence dating, Risø Luminescence Imager, Buried age

References

  • Sohbati, R., Murray, A.S., Porat, N., Jain, M., Avner, U., 2015. Age of a prehistoric “Rodedian” cult site constrained by sediment and rock surface luminescence dating techniques. Quat. Geochronol. 30, 90-99.
  • Sellwood, E. L., Kook, M., Jain, M., 2022, A 2D imaging system for mapping luminescence-depth profiles for rock surface dating. Radiat. Meas. 150, 106697.


How to cite: Cui, F., Zhang, H., Liu, J., and Qin, J.: Rock Luminescence Dating Method for Studying the Temporal and Spatial Evolution of the Maying River, Qilian Mountains, EGU General Assembly 2025, Vienna, Austria, 27 Apr–2 May 2025, EGU25-3717, https://doi.org/10.5194/egusphere-egu25-3717, 2025.

EGU25-4772 | Orals | CL5.1

Reconstructing dike history using luminescence dating 

Chang Huang, Roy van Beek, Elizabeth Chamberlain, Jakob Wallinga, Jelle Moree, Frédéric Cruz, Pieter Laloo, and Eric Norde

Dikes are among the most significant ancient human-made earthworks for flood control, land reclamation, and water management for millennia. However, determining the age of dike construction and development based on traditional dating methods (e.g., historical documents, archaeological find materials, and radiocarbon dating), is challenging, due to the paucity of materials and historical records. Luminescence dating may provide an alternative as it uses ubiquitous quartz or feldspar minerals to directly determine the burial age of sediments. In this study, we applied quartz optically stimulated luminescence (OSL) and feldspar single-grain post-infrared infrared stimulated luminescence (pIRIR) dating on two dikes: the Waal dike (near Wolferen-Sprok) in the Netherlands and the Scheldt dike (near Bornem) in Belgium. Our results confirm that luminescence dating provides reliable age estimates, consistent with other independent proxy data such as radiocarbon dating, archaeological artifacts, and historical evidence, and may refine site chronologies. Based on the age results, the history of dike construction and evolution was reconstructed. Additionally, the well-reset OSL signals for dike-related sediments suggest that fresh flood deposits were used for construction. This study highlights the potential of luminescence dating as a robust tool for reconstructing the history of dike construction and understanding ancient engineering.

How to cite: Huang, C., van Beek, R., Chamberlain, E., Wallinga, J., Moree, J., Cruz, F., Laloo, P., and Norde, E.: Reconstructing dike history using luminescence dating, EGU General Assembly 2025, Vienna, Austria, 27 Apr–2 May 2025, EGU25-4772, https://doi.org/10.5194/egusphere-egu25-4772, 2025.

EGU25-5262 | Orals | CL5.1

Cosmogenic exposure dating the Pre-Columbian archaeological structures at Tiwanaku, Bolivia  

David Fink, Vladimir Levchenko, and Toshiyuki Fujioka

We use in-situ cosmogenic 10Be in an attempt to date the construction of the Kalasasaya Platform temple at the UNESCO Heritage archaeological site at the ancient city of Tiwanaku, Bolivia. The unique site is located within the altiplano valley of Tiwanaku at 3870 masl near the southern shores of Lake Titicaca. The monuments at Tiwanaku were constructed as ceremonial and civic buildings of exceptional precision and quality by an Andean civilization, who were precursors of the Inca Empire. The date of construction of Tiwanaku is unknown. Earliest settlement is believed to be at least ~3,000 years ago and archeological evidence supports a drought-based empire collapse in the first half of the 12th century. Radiocarbon dating of construction material and other debris range from 300 to 950 AD (ie 1700 to 1050 years ago). At its apogee Tiwanaku is estimated to have extended over an area of as much as 6km2 and to have housed between 70,000 and 125,000 inhabitants.We gained permission to sample the very tops of 3 of the Kalasasaya pillars, and multi-meter sized excavated sandstone blocks and adjacent unmodified bedrock outcrop at a known quarry site which was used for sourcing material for Tiwanaku construction.  The pillars, ~5 meters tall and of square meter section, frame the outer perimeter wall of the 120m square Kalasasaya Platform and are made of andesite and sandstone. Samples at the quarry site, about 15 km distant and at 4300 masl,   were taken from  surfaces of the cavity from where blocks originated, select faces from the extracted blocks and  unmodified  bedrock outcrop. We were able to re-orient extracted blocks back into their original excavated cavity and thus determine pre-excavated buried and post-excavated exposed faces which allowed us to measure how long ago the block was carved out of bedrock and rotated in the process. Our results show that the cosmogenic signal in platform pillar tops is dominated by inheritance but that blocks had been quarried as recently as 1500-3000 tears ago, the age range depending on choice of attenuation length and estimating shielding. Details of sampling, site descriptions and 10Be-age calculations will be presented.

How to cite: Fink, D., Levchenko, V., and Fujioka, T.: Cosmogenic exposure dating the Pre-Columbian archaeological structures at Tiwanaku, Bolivia , EGU General Assembly 2025, Vienna, Austria, 27 Apr–2 May 2025, EGU25-5262, https://doi.org/10.5194/egusphere-egu25-5262, 2025.

EGU25-6277 | Orals | CL5.1

Optimized U-Th Chronometry for Carbonates Using MC-ICP-MS: Advancements in Precision and Applications 

Altug Hasözbek, Ali Pourmand, Arash Sharifi, Ana Isabel Ortega, Josep Parés Casanova, Josep Vallverdú Poch, and Silviu Constantin

U-Th geochronology is a key tool in Quaternary geology, widely applied to carbonate matrices with significant advancements achieved through MC-ICP-MS technology. However, 230Th dating remains challenging for samples with low-uranium concentrations and high-detrital thorium content which often reflecting open-system behavior. These factors increase uncertainties in age calculations. This study introduces an optimized U-Th dating methodology that integrates refined wet chemistry protocols and 10¹³-ohm amplifiers, significantly reducing expanded uncertainties.

The study employs a four-step validation process: i) testing 10¹³-ohm amplifiers using the NBL U-reference material (CRM 112A), and Th-reference material (IRMM035) of IRMM, ii) application to low-U (10–15 ppb) speleothem samples from the Cueva Fantasma (Atapuerca paleontological-archeological site, Burgos, Spain), iii) analysis of open-system shell samples from Turkey, iv) analysis of the internal speleothem standard (BSS2) of CENIEH.

Initial results using CRM 112A and IRMM035 reveal a tenfold improvement in signal-to-noise ratios with the 10¹³-ohm amplifiers. This configuration enables the use of Faraday cups instead of SEM detectors for U and Th-standard analyses, even at very low intensities (0.002–0.007V), a critical improvement for minimizing uncertainty budgets during bracketing sequences in U-Th dating. Comparative analyses of real samples from Atapuerca, Turkey, and the CENIEH speleothem standard (BSS2) show that the refined methodology reduces U-Th age uncertainties from 2–3% to 0.5–1%.

Beyond improved precision for younger, low-U samples, the method reduces the required sample size from ~100-150 mg to 40–50 mg, substantially lowering the influence of detrital Th contamination. The broader significance of this optimized approach lies in its application to environmental reconstruction during the Quaternary, offering robust tools for deciphering climate archives, paleoenvironments, and archaeological contexts.

How to cite: Hasözbek, A., Pourmand, A., Sharifi, A., Isabel Ortega, A., Parés Casanova, J., Vallverdú Poch, J., and Constantin, S.: Optimized U-Th Chronometry for Carbonates Using MC-ICP-MS: Advancements in Precision and Applications, EGU General Assembly 2025, Vienna, Austria, 27 Apr–2 May 2025, EGU25-6277, https://doi.org/10.5194/egusphere-egu25-6277, 2025.

EGU25-6728 | Orals | CL5.1

The Paleochrono-1.1 probabilistic model to derive a common age model for several paleoclimatic sites using absolute and relative dating constraints 

Frédéric Parrenin, Bouchet Marie, Buizert Christo, Capron Emilie, Corrick Ellen, Russell Drysdale, Kenji Kawamura, Amaëlle Landais, Robert Mulvaney, Ikumi Oyabu, and Sune Rasmussen

Past climate and environmental changes can be reconstructed using paleoclimate archives such as ice cores, lake and marine sediment cores, speleothems, tree rings and corals. The dating of these natural archives is crucial for deciphering the temporal sequence of events and rates of change during past climate changes. It is also essential to provide quantified estimates of the absolute and relative errors associated with the inferred chronologies. However, this task is complex since it involves combining different dating approaches at different paleoclimatic sites and often on different types of archives. Here we present Paleochrono-1.1, a new probabilistic model to derive a common and optimised chronology for several paleoclimatic sites with potentially different types of archives. Paleochrono-1.1 is based on the inversion of an archiving model: a varying deposition rate (also named growth rate, sedimentation rate or accumulation rate) and also, for ice cores, a lock-in-depth of air (since, in the absence of significant surface melt, the air is trapped in the ice at about 50-120 m below the surface) and a thinning function (since glacier ice undergoes flow). Paleochrono-1.1 integrates several types of chronological information: prior knowledge of the archiving process, independently dated horizons, depth intervals of known duration, undated stratigraphic links between records, and, for ice cores, Δdepth observations (depth differences between events recorded synchronously in the gas and solid phases of a certain core). The optimization is formulated as a least-squares problem, assuming that all probability densities are near-Gaussian and that the model is nearly linear in the vicinity of the best solution. Paleochrono-1.1 is the successor of IceChrono, which produces common and optimized chronologies for ice-cores. Paleochrono-1.1 outperforms IceChrono in terms of computational efficiency, ease of use, and accuracy. We demonstrate the ability of Paleochrono-1.1 in an experiment involving only the MSL speleothem in Hulu Cave (China) and compare the resulting age model with the SISALv2 age models. We then demonstrate the multi-archive capabilities of Paleochrono in a new ice-core–speleothem dating experiment, which  combines the Antarctic Ice Core Chronology 2023 dating experiment, based on records from five polar ice cores, with data from two speleothems from Hulu Cave dated using uranium/thorium radiometric techniques. We analyse the performance of Paleochrono-1.1 in terms of computing time and memory usage in various dating experiments. Paleochrono-1.1 is freely available under the MIT open-source license.

How to cite: Parrenin, F., Marie, B., Christo, B., Emilie, C., Ellen, C., Drysdale, R., Kawamura, K., Landais, A., Mulvaney, R., Oyabu, I., and Rasmussen, S.: The Paleochrono-1.1 probabilistic model to derive a common age model for several paleoclimatic sites using absolute and relative dating constraints, EGU General Assembly 2025, Vienna, Austria, 27 Apr–2 May 2025, EGU25-6728, https://doi.org/10.5194/egusphere-egu25-6728, 2025.

EGU25-8761 | Orals | CL5.1

Using OTOR(X) fit functions to improve estimation of high natural luminescence doses 

Barbara Mauz, Sebastian Kreutzer, and John L. Lawless

While highly desired, it remains a challenge for luminescence dating to determine high doses, hence high ages (e.g., >300 ka). The challenge is to project a natural dose close to saturation to a dose-response curve generated with high laboratory doses. The single saturating exponential (SSE) function mostly delivers poor fits to this type of dose responses. Other functions, e.g., the single saturating exponential plus linear function, are then often employed, but these include constants that have no direct physical meaning. Such an approach is inconsistent with the OSL/IRSL measurement parameters (e.g. detection wavelength) by which the signal from a dosimeter’s specific trap-hole pair is targeted out of a broad light spectrum. It is therefore beneficial to employ a physically based model that allows to interpret observations obtained from high laboratory dose responses.

Here we employ the analytical expression, Lambert W, developed by Pagonis et al. (2020) which is an exact solution of the well-studied OTOR (one trap one recombination centre) model, and extended by Lawless and Timar-Gabor (2024) to the OTORX model. We compare results obtained from SSE fits, in particular the characteristic saturation dose (“D0”) parameter, with those obtained from the OTOR(X) functions. Well-bleached fine-grained polymineral samples irradiated up to ~5000 Gy were used and measured using the pIRIR225 protocol.

For the SSE function the results point to the 80% rule of thumb: at ca 80% of the saturation dose the SSE-fitted dose response tend to underestimate the natural dose. The OTOR(X) functions reveal that this is due to the ratio of trapping rate versus recombination rate of free electrons which changes as the regenerated dose response approaches saturation. Consequently, the shape of the dose response curve flattens out in a way that the SSE function is unable to predict. We show here how the change of shape affects the dose interpolation point and how the accuracy of dose estimate is tested using the 63% (D0) and 80% dose values. We conclude that the OTOR(X) functions provide accurate estimates of natural doses close to saturation.

How to cite: Mauz, B., Kreutzer, S., and Lawless, J. L.: Using OTOR(X) fit functions to improve estimation of high natural luminescence doses, EGU General Assembly 2025, Vienna, Austria, 27 Apr–2 May 2025, EGU25-8761, https://doi.org/10.5194/egusphere-egu25-8761, 2025.

EGU25-12582 | Orals | CL5.1

Reconstructing Late Glacial–Early Holocene dune formation and wildfire dynamics using radiocarbon and OSL dating: Łaskarzew, Poland 

Natalia Piotrowska, Piotr Moska, Robert J. Sokołowski, Grzegorz Poręba, Paweł Zieliński, Przemysław Mroczek, Michał Łopuch, Zdzisław Jary, Alicja Ustrzycka, Andrzej Wojtalak, Agnieszka Szymak, Konrad Tudyka, Jerzy Raczyk, Marcin Krawczyk, Grzegorz Adamiec, and Jacek Skurzyński

The chronology of Late Glacial and Early Holocene dune formation and wildfire activity at the Łaskarzew site, eastern Poland, was established using AMS radiocarbon (14C) and optically stimulated luminescence (OSL) dating. Situated within the European Sand Belt, the profile preserves 13 aeolian-soil cycles characterised by alternating phases of aeolian deposition, soil formation, and wildfire episodes, demonstrating the dynamic response of aeolian systems to short-term climatic oscillations. A total of 26 charcoal samples, collected from palaeosols and charcoal layers, were radiocarbon-dated, and cross-referenced with OSL ages of quartz grains, resulting in a robust chronological framework. Dune formation began during the Oldest Dryas, with intensified aeolian activity and four wildfire events recorded during the Allerød interstadial, a period marked by rapid vegetation regeneration and recurring fire episodes. The absence of Younger Dryas sediments reflects extreme environmental conditions, including aridity, limited vegetation, and intensified aeolian erosion. The Holocene sequence, enriched with charcoal-rich deposits, records nine independent wildfire episodes over approximately 4500 years, linked to warm climatic conditions that favoured the expansion of fire-prone pine forests and shaped dune environments. Aeolian activity persisted through this period, accumulating approximately three metres of sediment, before ceasing around 7 ka BP as vegetation stabilised the landscape. The integration of radiocarbon and luminescence dating techniques provided a detailed Late Quaternary chronology, offering valuable insights into the interplay of fire, vegetation, and aeolian processes within the European Sand Belt.

How to cite: Piotrowska, N., Moska, P., Sokołowski, R. J., Poręba, G., Zieliński, P., Mroczek, P., Łopuch, M., Jary, Z., Ustrzycka, A., Wojtalak, A., Szymak, A., Tudyka, K., Raczyk, J., Krawczyk, M., Adamiec, G., and Skurzyński, J.: Reconstructing Late Glacial–Early Holocene dune formation and wildfire dynamics using radiocarbon and OSL dating: Łaskarzew, Poland, EGU General Assembly 2025, Vienna, Austria, 27 Apr–2 May 2025, EGU25-12582, https://doi.org/10.5194/egusphere-egu25-12582, 2025.

EGU25-12656 | ECS | Posters on site | CL5.1

Investigating the cyclicity of Neanderthal occupations at Chez-Pinaud, SW France, using high-resolution OSL dating and Bayesian analysis. 

Elaine Sellwood, Hugues Malservet, and Guillaume Guérin

The Middle Palaeolithic site of Chez-Pinaud in Jonzac (SW France) provides an unparalleled insight into the hunting and butchering behaviour of Neanderthals from ~60 ka 1 ago. Excavations in the late 1990’s and early 2000’s uncovered a 6-meter sedimentary sequence comprising apparently alternating thin sterile layers and artefact-rich deposits, hosting densely packed accumulations of large ungulate bone fragments and lithics of the Quina Mousterian industry 2 . These periodic deposits suggest repeated occupation and abandonment of the site, where Neanderthals were not inhabiting for long periods.  Despite these observations we are still limited in a obtaining a full occupational history of the site, predominantly due to limitations in existing dating methods.

In this study a novel sampling approach was applied to improve the chronological resolution of this site, combining high-resolution Optically stimulated luminescence (OSL) dating and Bayesian modelling. A 40 x 40 x 40 cm sediment block was removed from the main Quina-bearing layer (Layer 22 2). Under controlled orange light at the RenDaL OSL laboratory at Université de Rennes, the block was carefully excavated by scraping away sediment in horizontal layers. Coordinates of artefacts were recorded and samples for OSL dating were collected at ~1 cm intervals down the block.  Single-grain quartz OSL data were analysed using the BayLum R package 3, incorporating Bayesian statistical modelling to reduce age uncertainties and to investigate the models capacity to handle OSL ages in close temporal and spatial distribution.

Our results indicate that the top of the section represents more modern deposits (~2 ka), which are void of bone fragments. These ages suggest sediment mixing from surface disturbances such as collapsing limestone or anthropogenic activities. Beyond this modern layer, two artefact-rich occupational layers separated by a thin sterile layer are identified through plotting the 3D distribution of the artefacts. The corresponding Bayesian ages for these layers vary between 58 – 80 ka, and do not increase linearly with depth and are thus difficult to correlate directly with the individual artefact bearing layers. These varying ages raise questions over dose rates when we consider the complexity of the heterogeneous sediments in the block. Continuing modelling will be conducted with BayLum as well as further investigation into the dose rate of the samples in attempts to further investigate and increase precision of the ages.

This work underscores the value of combining precise excavation methods with Bayesian analytical approaches for OSL data to construct precise chronologies, especially in important prehistoric archaeological contexts which host well preserved and challenging chronologies.


References:

1 Richter, D. et al. Thermoluminescence dates for the Middle Palaeolithic site of Chez-Pinaud Jonzac (France). Journal of Archaeological Science 40, 1176–1185 (2013).

2 Airvaux, J. & Soressi, M. Le site paléolithique de chez-Pinaud à Jonzac, Charente-Maritime. Prehistoire du Sud-Ouest 8, (2004).

3 Philippe, A., Guérin, G. & Kreutzer, S. BayLum - An R package for Bayesian analysis of OSL ages: An introduction. Quaternary Geochronology 49, 16–24 (2019).

How to cite: Sellwood, E., Malservet, H., and Guérin, G.: Investigating the cyclicity of Neanderthal occupations at Chez-Pinaud, SW France, using high-resolution OSL dating and Bayesian analysis., EGU General Assembly 2025, Vienna, Austria, 27 Apr–2 May 2025, EGU25-12656, https://doi.org/10.5194/egusphere-egu25-12656, 2025.

EGU25-12755 | ECS | Posters on site | CL5.1

Sediment provenance and erosion rates in the Andes-Amazon fluvial system: a study using luminescence and cosmogenic nuclides technics 

Gabriella Brandino de Campos, Carolina Barbosa Leite Cruz, Priscila Emerich Souza, Anarda Luísa Souza Simões, Caio Breda, Renan Cassimiro Brito, Bodo Bookhagen, Andre Oliveira Sawakuchi, and Fabiano Nascimento Pupim

Continental sedimentary deposits are essential geological records for understanding landscape evolution over time. In this context, the “modern analog” approach is employed in the Andes-Amazon system to deepen the understanding of past changes and the factors influencing them. This methodology involves studying contemporary fluvial deposits using advanced techniques and methods to identify how natural processes shape the current landscape. The main objective of this study is to determine the spatial variability and environmental controls of the sediment provenance and the erosion rates in modern deposits of the Ucayali, Maranõn, Napo, Madre de Dios, Huallaga, and Solimões rivers in the Andes-Amazon fluvial system. This approach will involve luminescence sensitivity signatures of quartz and feldspar grains, which can indicate grain source and transport process; the latitudinal gradient of erosion rates using in situ cosmogenic nuclides; the relationship between sedimentary variability and tectonic, topographic, lithologic, and climatic controls using Geographic Information Systems (GIS). The new cosmogenic nuclide and luminescence data will be used together to evaluate the compatibility of these methods in analyzing sediment provenance and erosion rates. This comparison will assess whether these methods and approaches can be consistently integrated, contributing to a more comprehensive understanding of sedimentary and erosive processes in the Andes-Amazon fluvial system. (FAPESP #2023/16318-1)

How to cite: Brandino de Campos, G., Barbosa Leite Cruz, C., Emerich Souza, P., Luísa Souza Simões, A., Breda, C., Cassimiro Brito, R., Bookhagen, B., Oliveira Sawakuchi, A., and Nascimento Pupim, F.: Sediment provenance and erosion rates in the Andes-Amazon fluvial system: a study using luminescence and cosmogenic nuclides technics, EGU General Assembly 2025, Vienna, Austria, 27 Apr–2 May 2025, EGU25-12755, https://doi.org/10.5194/egusphere-egu25-12755, 2025.

EGU25-12806 | Posters on site | CL5.1

Different 14C ages for various fractions of peat 

Irka Hajdas, Jochem Braakhekke, Giovanni Monegato, Franco Gianotti, Marcus Christl, and Susan Ivy Ochs

Since the 19th century, various authors have assigned the glacial landforms in the lower valleys of northern Italy to different ice ages (Penck and Brückner 1909). This study was part of a project that involved a broad geomorphological analysis and the first-time absolute in-situ exposure dating of erratic boulders using 10Be and 36Cl (Braakhekke et al. 2020). In addition to the cosmogenic analysis, seven radiocarbon samples were taken from a fluvial terrace outcropping 6 meters high along the Ticino River. Where possible, the samples were sieved to separate a bulk fraction (<125 μm) from the undefined organic fragments. Some samples were partly dissolved during the subsequent ABA preparation of all fractions. This way, we obtained up to four ages per initial sample: one each for the insoluble bulk fraction, the humic acid of the bulk, the organic fragments, and the humic acid of the organic fragments. The obtained radiocarbon ages vary significantly, with the extreme being thousands of 14C years between the insoluble bulk fraction and the organic fragments for the same sample. For all samples, radiocarbon analysis of the bulk fractions gave much younger ages than the hand-selected macro remains. Here, we discuss the age differences and possible sources of old and young carbon found in samples. The ages of the organic fragments showed the most consistency over the whole profile, and these fragments are least likely contaminated by younger material. Based on our results obtained on macro remains, this deposit is dated to MIS3 age. About 3 meters of fine-grained sediment were deposited here during ca. 8 ky. This could tell us more about the sediment budgets during some of the (Greenland) stadial-interstadial oscillations at the outlet of a major lake (e.g., Lake Maggiore) and the erosive power of glaciers during a phase preceding the global Last Glacial Maximum.

References

Braakhekke J, Ivy‐Ochs S, Monegato G, Gianotti F, Martin S, Casale S, and Christl M. 2020. Timing and flow pattern of the Orta glacier (European Alps) during the last glacial maximum. Boreas 49: 315-332.

Penck A, and Brückner E. 1909. "Die alpen im Eiszeitalter." Tauchnitz.

How to cite: Hajdas, I., Braakhekke, J., Monegato, G., Gianotti, F., Christl, M., and Ivy Ochs, S.: Different 14C ages for various fractions of peat, EGU General Assembly 2025, Vienna, Austria, 27 Apr–2 May 2025, EGU25-12806, https://doi.org/10.5194/egusphere-egu25-12806, 2025.

Anthropogenic carbonates such as lime mortars and plasters have been receiving growing attention as they are an invaluable source of information for archaeologists, conservators, and restorers of cultural heritage. Taking into account the production process, the age of mortars reflects the age of the building. Two physical dating methods currently enable us to date mortars: radiocarbon (14C) dating and optically stimulated luminescence (OSL). Fast development in 14C and OSL mortar dating naturally widens the scope of performed analysis, and promotes the search for different methods which may be applied to these materials. In this study we present the analysis of historical lime mortars in order to assess the possibility of future dating by Electron Spin Resonance (ESR) spectroscopy. ESR dating has been applied to various geological and archaeological materials, but there are virtually no examples of dating carbonates younger than 10 000 years. Since carbonate crystals are formed during the mortar production, this moment can be regarded as the zero point for the accumulation of trapped charges, and their concentration in a measured sample should reflect the age of the mortar.

Our previous works on samples from Sveta Petka church in Budinjak, Croatia, and an ancient settlement Hippos, Israel, show the growth of signals related to the paramagnetic centres with the dose of laboratory radiation. However, in order to obtain the age of the samples the natural material should exhibit measurable ESR signals of the centres suitable for dating. In the relatively young (as far as ESR dating is concerned) materials the signals are very weak, however detailed analyses showed presence of such signals in several investigated mortar samples. In this work we investigate ESR signals in natural and laboratory-irradiated carbonate lime binders from several different archaeological sites, with ages ranging from about 2000 to 500 years old. The samples have been previously dated by 14C method, which means they had undergone extensive characterisation and preparation, ensuring the selection of binder, which reflects the true age of the mortar. We analyse the spectra with the aid of ESR simulations in order to identify the paramagnetic centres present in the samples, and compare them to the centres commonly found in carbonates and used for ESR dating. The goal of this work is a qualitative analysis of the natural signals found in a variety of mortars, assessing their potential suitability for ESR dating. This study is a first part of the ongoing project focused on establishing ESR as a method of dating anthropogenic carbonates in a form of lime mortars, and comprises the preliminary analysis of the subject, which will be followed by future in-depth studies.

How to cite: Kabacińska, Z. and Michalska, D.: Towards Electron Spin Resonance dating of anthropogenic carbonates: ESR signals of 14C-dated historical lime mortars, EGU General Assembly 2025, Vienna, Austria, 27 Apr–2 May 2025, EGU25-13244, https://doi.org/10.5194/egusphere-egu25-13244, 2025.

EGU25-13277 | ECS | Posters on site | CL5.1

High resolution luminescence dating of the Khovaling Loess Plateau sites (Tajikistan) 

Natalia Taratunina, Jan-Pieter Buylaert, Amélie Challier, Andrew Murray, Peter Sosin, and Redzhep Kurbanov

We have studied the loess-palaeosol sequences of the Khovaling Loess Plateau in Tajikistan, which form the most complete record of subaerial sedimentation in Central Asia. Studied sections contain several layers with Early and Middle Palaeolithic tools, and therefore record some of the earliest events of hominin dispersal into Central Asia.

As part of a major NordForsk funded project ‘Timing and Ecology of the Human Occupation in Central Asia’ (THOCA; www.thoca.org), we applied high-resolution luminescence dating to the upper parts of three sections of Khovaling loess plateau (Khonako-II, Kuldara, and Obi-Mazar) in order to: (1) provide an independent timescale for palaeoclimatic studies; (2) assess the completeness of the sedimentary record; and (3) investigate the main stages of dust accumulation over this interval.

The luminescence chronology extends back to ~250 ka and reveals distinct erosional hiatuses ranging in duration from ~7 ka to a full glacial-interglacial cycle (~100 ka). Some of these breaks were not identifiable in the field. These discontinuities had not been previously recognized, potentially leading to significant errors in palaeosol identification and, consequently, in the presumed chronology. Now, we have a better understanding of the aeolian sedimentation in the region and the stages of loess/palaeosol formation. The new chronology provides a reliable correlation of regional features with global events and relates them to climate change, soil cover development, and the evolution of Early and Middle Paleolithic.

How to cite: Taratunina, N., Buylaert, J.-P., Challier, A., Murray, A., Sosin, P., and Kurbanov, R.: High resolution luminescence dating of the Khovaling Loess Plateau sites (Tajikistan), EGU General Assembly 2025, Vienna, Austria, 27 Apr–2 May 2025, EGU25-13277, https://doi.org/10.5194/egusphere-egu25-13277, 2025.

EGU25-14514 | Orals | CL5.1

“Ice carbon” as a possible source of apparent age in paleosol dating 

Elya Zazovskaya, Nikita Mergelov, Andrey Dolgikh, Sofiia Turchinskaia, Alexandr Dobryanskiy, and Maria Bronnikova

Surface and buried paleosols are a significant archive of information about environmental change and are widely used in paleogeographic reconstructions. Soil features and their profiles change over time as a result of environmental change. The soil memory is the palimpsest-like, as opposed to the book-like, sedimentary record (Targulian and Goryachkin, 2004). The palimpsest-like memory of the soil requires informed and well-adapted strategies for deciphering and interpreting the information it contains. The question of soil age and its synchronization with reconstructed events remains one of the most controversial issues in paleosol interpretations. The complexity of the interpretation of obtained radiocarbon dates is related to the heterogeneous and heterochronous of soil organic matter (SOM). At present, there are many approaches to dating SOM, but for the paleosol for paleogeographic reconstructions, 14C dating is most often performed on total organic carbon (bulk carbon). This choice of dating fraction is usually related to the poor preservation of SOM and its low carbon concentration in paleosols. Dates obtained for SOM in buried soils are based on the assumption that SOM was formed "in situ". However, due to various natural processes, paleosols can contain carbon from a number of potential sources.
For buried soils formed in periglacial landscapes, a significant source of carbon is the supraglacial material: cryoconites and other organo-mineral formations that form on the surface and in the body of the glacier and enter the landscape during glacial melting. Our studies on glaciers and in periglacial landscapes of different natural zones (Svalbard, Franz Josef Land Archipelago, Polar Urals, Altai, Kamchatka) have shown that supraglacial material can have a radiocarbon age ranging from modern to very ancient (several thousand, sometimes tens of thousands of years). The largest dataset we have obtained for supraglacial objects is represented by carbon pools aged 1000 to 10,000 radiocarbon years, BP and >10,000 radiocarbon years, BP. The pool with an age of >10,000 radiocarbon years is associated with the presence of a "dead carbon" source near the studied glacier. Dates in the range of 10,000-20,000 radiocarbon years may also reflect the age of soils and sediments formed during the last deglaciation and buried within the body of the glacier as it advanced. Soils formed in the periglacial zone inherit the isotopic composition of SOM from supraglacial material and become carriers of "apparent" / inherited 14C age. The presence of cryoconite material in buried paleosols can be diagnosed by studying their micromorphology and identifying morphological structures characteristic of cryoconites. We have shown this for soils formed on cryoconite material in Svalbard and for lenses of buried fine-grained material in marginal glacial formations (Keiva) on the Koly Peninsula.  When 14C dating paleosol series (traditional paleoarchives are studied in foothills and mountainous areas), it is necessary to consider the ice-carbon contribution to SOM in order to make correct paleo-reconstruction.

How to cite: Zazovskaya, E., Mergelov, N., Dolgikh, A., Turchinskaia, S., Dobryanskiy, A., and Bronnikova, M.: “Ice carbon” as a possible source of apparent age in paleosol dating, EGU General Assembly 2025, Vienna, Austria, 27 Apr–2 May 2025, EGU25-14514, https://doi.org/10.5194/egusphere-egu25-14514, 2025.

EGU25-15342 | ECS | Orals | CL5.1

Performance of SAR-SGC method for equivalent dose determination of quartz OSL 

Xiaojun Zhou, Yuexin Liu, Xinqi Feng, and Zhongping Lai

Abstract: The SAR-SGC method, integrating single aliquot regenerative (SAR) and standardised growth curve (SGC) protocols with advantages of saving machine measurement time. It has gained widespread application in recent years over diverse sediment types, including glacial, aeolian, fluvial, lacustrine, deltaic, and marine sediments. The method constructs inter-aliquot SGCs using conventional SAR measurements and determines SGC Des by inserting the LN/TN values of additional aliquots into the SGC. The final SAR-SGC De is obtained by calculating the arithmetic mean of the SAR Des and SGC Des. However, the optimal number of SAR and SGC aliquots for reducing machine time while retaining precision, is still ambiguous. To address this issue, we systematically investigated how varying the number of SAR aliquots and additional LN/TN​ measurements influences the stability and consistency of equivalent dose derived from SAR-SGC method with SAR protocol. We examined the minimal SAR-SGC combinations for three samples (JNZK01-G09, MW10-G16 and XBG06-G07, with an equivalent dose of ~44 Gy (with largest scatter in inter-aliquot SAR growth curves), ~46Gy and ~55Gy (with marginal scatter in inter-aliquot SAR growth curves) in the lower Yellow River plain, utilizing a Risø TL/OSL-DA-20 reader with a 90Sr/90Y beta source. Through extensive statistical evaluations, SAR-SGC estimation of the equivalent dose obtained with differing aliquot combinations shows that equivalent dose could be accurately estimated within acceptable uncertainty (<10%) using 6–15 SAR aliquots and additional 12–30 LN/TN aliquots. For samples with dispersed growth curves, we recommend a minimum of 6 SAR and 12 LN/TN aliquots for reliable age determination. And samples with concentrated growth curves may suffice with 4 SAR and 10 LN/TN aliquots. This study demonstrates that the combined SAR-SGC method significantly reduces machine time (at least 70%) compared to the SAR protocol alone while maintaining acceptable precision. These findings provide valuable guidance for luminescence dating laboratories and researchers in optimizing instrument usage under time constraints.

Key words: SAR-SGC method; Standardized growth curve; Single aliquot regenerative protocol; Equivalent dose; Luminescence dating; Statistical analysis; Machine time optimization

How to cite: Zhou, X., Liu, Y., Feng, X., and Lai, Z.: Performance of SAR-SGC method for equivalent dose determination of quartz OSL, EGU General Assembly 2025, Vienna, Austria, 27 Apr–2 May 2025, EGU25-15342, https://doi.org/10.5194/egusphere-egu25-15342, 2025.

EGU25-19154 | ECS | Posters on site | CL5.1

A way to date stone fish weirs ? Some perspectives. 

Arthur Jumaucourt, Guillaume Guérin, Daniel Le Bris, Pierre Stephan, Iness Bernier, and Yvan Pailler

Stone fish traps and weirs are the most common archaeological remains in fluvial and coastal environments. In Brittany, almost 800 of them were identified by Daire and Langouët (2014). Usually, these are made of numerous erected stones, that more or less precisely outline an alignment. Dating these remains represents a real archaeological issue, since stone fish traps have been raised for millennia, presumably from the early Neolithic to the Middle Ages. However, it is also a challenge as there is no organic matter preserved in the core of these structures.


In this presentation, we assess the age of fish weirs found in Brittany by comparing their altitude with the sea-level rise estimation curve since the last glaciation 20 000 years ago. A software named CHRONOE was developed in R in order to improve the reliability of the data, among which tidal curves (García-Artola et al. 2018). Statistical analysis – using the R package ArchaeoPhases (Philippe and Vibet 2020) – of the ages determined by CHRONOE for a corpus of    diverse stone fishing weirs, identifies periods of intensification and rarefaction of fishing using such structures. Thus, it is possible to discuss the evolution of fishing practices in human societies along the coasts of Brittany.


This work is the first step of a PhD Thesis; it will be followed by direct dating of stone fish traps. Indeed, rock surface luminescence dating \autocite{soh12} has been shown to reliably estimate the last time a rock surface was exposed to light (Sohbati et al. 2012) has been shown to reliably estimate the last time a rock surface was exposed to light (Freiesleben et al. 2015). Therefore, it will be applied to a few of these structures, after careful selection based on their presumed age. The bottom surface of sampled rocks from fish weirs will be sampled for OSL intensity profiling and burial dating. The numerical absolute ages given by obtained with OSL will then be compared to those assessed with CHRONOE, to discuss the reliability of the underlying assumptions and refine the model. Eventually, CHRONOE may hold the potential to date any submerged object whose utility (or existence) is linked with the intertidal zone.

Keywords : geochronology, OSL, archaeology, fish weirs.


References

Daire, M.-Y., & Langouët, L. (2014). Se nourrir le long des côtes bretonnes : Réflexions à partir d'une analyse diachronique des barrages de pêcheries. Actes des congrès nationaux des sociétés historiques et scientifiques, 138 (2), 105133.

Freiesleben, T., et al. (2015). Mathematical model quantifies multiple daylight exposure and burial events for rock surfaces using luminescence dating. Radiation Measurements, 81, 1622.

García-Artola, A., et al. (2018). Holocene sea-level database from the atlantic coast of europe. Quaternary Science Reviews, 196, 177192.

Philippe, A., & Vibet, M.-A. (2020). Analysis of archaeological phases using the R package ArchaeoPhases. Journal of Statistical Software, 93, 125.

Sohbati, R., et al. (2012). Optically stimulated luminescence (OSL) as a chronometer for surface exposure dating. Journal of Geophysical Research: Solid Earth, 117, 2012JB009383.

How to cite: Jumaucourt, A., Guérin, G., Le Bris, D., Stephan, P., Bernier, I., and Pailler, Y.: A way to date stone fish weirs ? Some perspectives., EGU General Assembly 2025, Vienna, Austria, 27 Apr–2 May 2025, EGU25-19154, https://doi.org/10.5194/egusphere-egu25-19154, 2025.

EGU25-21256 | ECS | Posters on site | CL5.1

Applying portable OSL to obtain a detailed chronology of littoral sedimentary sequences from the northern shore of Lake Schweriner See, Germany 

Maksim Ruchkin, Sebastian Lorenz, Marie-Luise Adolph, and Torsten Haberzettl

Holocene sedimentary sequences lacking organic remnants or containing redeposited organic material pose a challenge for detailed chronological investigations, as radiocarbon dating is unsuitable. Optically stimulated luminescence (OSL) can be used instead, but high-resolution OSL is costly. A more cost-effective and efficient approach involves the combination of low-resolution OSL dating with portable OSL (pOSL) profiling in 5–10 cm increments (e.g. Sanderson and Murphy, 2010; Brill et al. 2016). This method has been employed in the analysis of cored lacustrine sedimentary sequences from the northern shore of Lake Schweriner See, Germany.

In well-bleached Holocene sediments, quartz equivalent doses and portable post-infrared blue-light stimulated luminescence signals (further pOSL) from the polymineral fraction are linearly correlated (e.g. Brill et al., 2016). We used the obtained linear functions to estimate equivalent doses (Des) in quartz for each pOSL signal. The dose rates were then interpolated between full OSL samples, and the ages were calculated by dividing the Des by the corresponding dose rates. Finally, both the quartz full OSL ages and the ages derived from the pOSL signals were incorporated into a Bayesian age-depth model to obtain a continuous chronology.

The pOSL-to-De ratio is also a useful tool in the identification of incompletely bleached samples. Poorly bleached sediments exhibit a higher pOSL-to-De ratio in comparison to well bleached sediments because pOSL is a composite of signals from quartz and feldspars, which require a greater exposure time for complete bleaching than OSL from pure quartz (e.g. Murray et al., 2012). In the littoral sequences studied, elevated pOSL-to-De ratios were found to correspond with high quartz Deoverdispersion (OD), which is another indicator of poor bleaching. One particular sample was observed to exhibit a high pOSL-to-De ratio yet low OD (15%), which may be attributed to distinct OSL sensitivity linked to a specific sediment source.

Our results demonstrate that the proposed approach suits littoral sediments and improves chronological frameworks for lacustrine sequences. A potential avenue for further refinement of age-depth models lies in the measurement of dose rates for all pOSL samples, as opposed to their estimation through interpolation.

References

Brill, D., Jankaew, K., & Brückner, H. (2016). Towards increasing the spatial resolution of luminescence chronologies – Portable luminescence reader measurements and standardized growth curves applied to a beach-ridge plain (Phra Thong, Thailand). Quaternary Geochronology, 36, 134–147.

Murray, A. S., Thomsen, K. J., Masuda, N., Buylaert, J.-P., & Jain, M. (2012). Identifying well-bleached quartz using the different bleaching rates of quartz and feldspar luminescence signals. Radiation Measurements, 47(9), 688–695.

Sanderson, D. C. W., & Murphy, S. (2010). Using simple portable OSL measurements and laboratory characterisation to help understand complex and heterogeneous sediment sequences for luminescence dating. Quaternary Geochronology, 5(2–3), 299–305.

How to cite: Ruchkin, M., Lorenz, S., Adolph, M.-L., and Haberzettl, T.: Applying portable OSL to obtain a detailed chronology of littoral sedimentary sequences from the northern shore of Lake Schweriner See, Germany, EGU General Assembly 2025, Vienna, Austria, 27 Apr–2 May 2025, EGU25-21256, https://doi.org/10.5194/egusphere-egu25-21256, 2025.

EGU25-319 | ECS | Posters on site | CL5.3

Variability of condensed water path and precipitation over Africa. 

Kwame Karikari Yamoah, Petr Štěpánek, and Aleš Farda

To gain a deeper understanding of precipitation variability, it is essential to also examine the variability of the condensed water path, which is vertically integrated mass of condensed liquid (LWP) and ice water (IWP) in a column, divided by the column's area. This analysis provides valuable insight into the dynamics and physics driving temporal variations in precipitation. Additionally, since cloud formation is heavily influenced by the atmosphere's liquid and ice water content, such an evaluation will aid in addressing uncertainties related to cloud-radiation interactions in global climate models (GCM).

In this study, we analyze the spatial pattern of the condensed water path (CWP) and precipitation over Africa from 1970 to 2005, examining each season individually. We also address the performance of global climate models (CMIP5 and CMIP6) and regional climate models (CORDEX-Africa, AFR-22 and AFR-44) in simulating these patterns. Additionally, we investigate the temporal variations of these variables over the study period. 

All models successfully captured seasonal variations in CWP and precipitation, though with some differences in their magnitude. For the condensed water path, results showed a bimodal pattern in West Africa (June-July-August and September-October-November), and in Central and East Africa (March-April-May and September-October-November), aligning with the seasonal migration of the intertropical convergence zone (ITCZ). A similar bimodal pattern was observed for precipitation, except in East Africa ’s minor rainfall season (September-October-November), which was not captured. 

Trend analysis revealed a positive trend for all CWP datasets during the JJA season, as well as in the RCM precipitation. Conversely, GCM data showed a negative trend in the same season. In the SON season, all model outputs (except ERA5 datasets which indicated a negative trend for both CWP and precipitation) showed a positive trend for both variables.

When comparing models, CMIP5 was found to overestimate CWP over Africa, whereas CMIP6 demonstrated better performance, accurately reproducing spatial patterns with correlations ranging from 0.9 to 0.94 across seasons. Precipitation data showed a similar pattern, with CMIP6 achieving correlations between 0.87 and 0.94.  Taylor skill scores further confirmed CMIP6’s improved skill, with scores exceeding 0.75 for CWP simulation and over 0.7 for precipitation in all seasons, suggesting notable progress in climate modelling.

The CORDEX-Africa models, however, demonstrated a lower correlation for spatial patterns of CWP, with AFR-44 models scoring between 0.55 and 0.68 and a slight improvement in AFR-22 models (0.61 to 0.74). For precipitation, the correlation was higher, with AFR-44 models achieving 0.74 to 0.8 and AFR-22 models reaching 0.75 to 0.85 in representing spatial patterns.

The consistent spatial variations in these variables, as shown by the ERA5, CMIP, and CORDEX models, offer valuable insights into the physics and dynamics underlying precipitation variations across Africa. However, the observed inconsistency in temporal variations warrant further investigation. A deeper understanding of these dynamics could substantially enhance our comprehension of climate change impacts in Africa.

How to cite: Yamoah, K. K., Štěpánek, P., and Farda, A.: Variability of condensed water path and precipitation over Africa., EGU General Assembly 2025, Vienna, Austria, 27 Apr–2 May 2025, EGU25-319, https://doi.org/10.5194/egusphere-egu25-319, 2025.

EGU25-800 | Orals | CL5.3

Assessing the performance of climate reanalysis datasets in capturing hot and cold extremes and their trends in India. 

Suman Bhattacharyya, Marwan Hassan, S Sreekesh S Sreekesh, and Vandana Choudhary

A significant portion of the Earth's surface lacks long-term in-situ measurement of essential meteorological variables. Climate reanalysis serves as a valuable alternative to historical observations by providing homogenous and complete records of several atmospheric variables, especially in data-sparse regions.  Reanalysis is produced by assimilating sparse observational data from a variety of sources into numerical weather prediction models that solve the dynamics of land, ocean, and atmospheric processes for analyzed periods. Recent generation reanalysis is now available at finer spatial and temporal resolutions, making them lucrative for hydrological and climatological studies. However, reanalysis has inherent biases that necessitate their evaluation before such application. While the assessment of reanalysis datasets is common in representing mean climatology on a daily, monthly, or seasonal scale, their ability to capture the spatial pattern of extreme temperature events and their trends remains controversial.

By comparing seven such reanalysis datasets over India (ERA5-Land, ERA5, MERRA2, CFSR, JRA55, IMDAA, and EARS) it is found that the newest generation reanalysis having a higher resolution, better captures the magnitude, frequency, and duration of hot and cold extremes. The reanalysis datasets are compared with a gauge-based gridded temperature dataset from the India Meteorological Department (IMD) to assess their suitability in representing extreme temperature events and their trends over India. For evaluation, several extreme temperature indices are calculated based on the recommendation of ETCCDI, covering the frequency, intensity, and duration of hot and cold extreme temperature events. It is also found that in response to global warming, extreme hot events are rising, and extreme cold events are decreasing in India which is also captured by most of the reanalysis. However, the reanalysis estimated trend areas and magnitudes are not similar when compared to trends with a regional station-based gridded dataset. Thus, care should be taken in selecting datasets for such applications and interpreting their trends.

How to cite: Bhattacharyya, S., Hassan, M., S Sreekesh, S. S., and Choudhary, V.: Assessing the performance of climate reanalysis datasets in capturing hot and cold extremes and their trends in India., EGU General Assembly 2025, Vienna, Austria, 27 Apr–2 May 2025, EGU25-800, https://doi.org/10.5194/egusphere-egu25-800, 2025.

EGU25-1853 | ECS | Orals | CL5.3

Assessment of Near-Future Temperature Extremes Using CMIP5 Ensembles Over Gujarat, India 

Sandeep Kumar and Bhawana Pathak

The variability in hydro-climatological indicators severely affects environmental regulation, ecosystem sustainability and the occurrence of extreme events at a large scale. Determination of the extreme climatic indices is crucial for understanding the trend and severity of such events within a given period. Therefore, this study analyses the ETCCDI-defined temperature extreme indices using five CMIP5 models (BNU-ESM, canESM2, CNRM-CM5, MPI-ESM-LR and MPI-ESM-MR) under RCP4.5 and 8.5 scenarios for the period 2025 to 2050 in Gujarat, India. The Mann-Kendall and Sen’s slope estimator test was applied for the trend significance. The findings show that maximum and minimum temperature will increase by >1℃ under the RCP8.5 scenario by 2050. Cold spells are expected to decline significantly in both scenarios, while the multi-model mean (MMM) for warm spells exhibits an increasing trend in the RCP8.5 scenario. A significant decreasing trend is observed in cool nights and cool days in all models under both scenarios. Notably, except for the BNU-ESM and canESM2, other models project an increasing trend in warm nights however, MMM shows a significant increasing trend in the frequency of warm nights and days. Furthermore, the frequency of days with cool nights and days will decrease by >10% and ~20% respectively by the end of 2050. Spatially distribution analysis shows that the south-eastern part of Gujarat is likely to be more vulnerable to extreme events, as a higher frequency of such events has been observed over this area. It was also observed that the MPI-ESM-MR model demonstrated better predictive performance and outperformed other ensembles in the Gujarat region, as it shows a closer alignment with the MMM results.

How to cite: Kumar, S. and Pathak, B.: Assessment of Near-Future Temperature Extremes Using CMIP5 Ensembles Over Gujarat, India, EGU General Assembly 2025, Vienna, Austria, 27 Apr–2 May 2025, EGU25-1853, https://doi.org/10.5194/egusphere-egu25-1853, 2025.

EGU25-2182 | Posters on site | CL5.3

An Advanced Cloud Detection Approach for Creating Diurnally Consistent Geostationary Satellite Cloud Climate Data Records 

Qing Trepte, William Smith, Rabindra Palikonda, Christopher Yost, Benjamin Scarino, Sarah Bedka, and David Painemal

Geostationary satellites (GEOsats) provide continuous cloud and meteorological observations over fixed portions of the Earth’s surface, allowing them to monitor the development and movement of storm systems and their diurnal variation. For climate studies, geostationary observations provide added insight into cloud formation and evolution and how they influence the diurnal cycle of Earth’s radiation budget.

A long and consistent cloud record can be a valuable resource for evaluating changes in cloud systems and properties across the globe. Integrating observations from different geostationary instruments poses challenges due to their distinct characteristics, such as different spectral channels and calibrations as well as varying spatial resolutions to list a few.  As a result, deriving consistent cloud properties from multiple sensors without introducing artificial discontinuities in a time series remains a complex and challenging endeavor.

A homogenized GEOsats cloud retrieval system is being developed to create cloud climate data records (CDR’s) for NASA’s CERES (Clouds and the Earth’s Radiant Energy System) mission from a long record of GEOsats that uses spectral channels common to most satellites. Thus, a 3-channel (0.6, 3.9, 11 µm) algorithm for daytime cloud detection, and a 2-channel (3.9 and 11 µm) algorithm for nighttime have been implemented and tested. Recent advances to the 3-channel processing framework include refined radiative transfer models specific to each GEOsats’ spectral bands to provide more accurate and consistent computed clear-sky TOA radiances. Machine learning approaches are also developed and implemented for estimating the a priori land surface skin temperature, and to improve cloud detection in the solar terminator and in oceanic areas with sunglint. It is anticipated that these changes will lead to more accurate and diurnally consistent derived cloud properties across satellite platforms.

This paper describes the CERES 3-channel cloud detection approach and presents results of initial cross-platform consistency and accuracy tests and evaluations with independent data from active sensors, such as CALIOP data, as well as from GEOsats analyses that utilize more spectral information. Remaining challenges and future work will be discussed.

How to cite: Trepte, Q., Smith, W., Palikonda, R., Yost, C., Scarino, B., Bedka, S., and Painemal, D.: An Advanced Cloud Detection Approach for Creating Diurnally Consistent Geostationary Satellite Cloud Climate Data Records, EGU General Assembly 2025, Vienna, Austria, 27 Apr–2 May 2025, EGU25-2182, https://doi.org/10.5194/egusphere-egu25-2182, 2025.

EGU25-2554 | Orals | CL5.3

Towards using radar data to understand changes in sub-daily rainfall extremes: An Australian case study 

Simon Tett, Joshua Soderholm, Alain Protat, Annabel Bowden, and Lisa Alexander

One expected impact of climate warming is an increase in sub-daily extreme rainfall. A simple thermodynamic argument suggests that  extremes should increase at a rate of about 7.5%/K of warming. Convective permitting models and some in situ gauge data  suggests sub-daily extreme intensity increases by more than 7.5%/K.  In situ gauge data is sparse and so will miss many small-scale extreme rainfall events. Radar rainfall can sample a large region with high space and time resolution but has its own problems.  Australian radar data has been homogenised through comparison with the Tropical Rainfall Measuring and Global Precipitation Missions. This gives 20+ year records for about ten sites in Eastern Australia. Radar reflectivity is converted to rainfall intensity using power-law behaviour estimates from distrometer data. Rainfall data is then averaged to 30 minute, 1hour, 2 hour and 4 hour accumulations and seasonal maxima extracted.  For each radar a GEV fit with covariates on local temperature was fit to samples from the seasonal maxima.  No strong evidence is found that extreme rainfall intensity increases by more than 7.5%/K.

How to cite: Tett, S., Soderholm, J., Protat, A., Bowden, A., and Alexander, L.: Towards using radar data to understand changes in sub-daily rainfall extremes: An Australian case study, EGU General Assembly 2025, Vienna, Austria, 27 Apr–2 May 2025, EGU25-2554, https://doi.org/10.5194/egusphere-egu25-2554, 2025.

NOAA interactive snow and ice cover charts of the Northern Hemisphere present a key input to operational weather prediction models and are widely used  in climate change studies. Since 1997 charts are generated daily within Interactive Multisensor Snow and Ice Mapping System (IMS). When creating a snow map, analysts use the previous day map as a first guess and update it manually using satellite imagery in the optical bands. Because of clouds obscuring the view and limited time allocated for the analysis only a portion of the entire land area may be closely examined on a given day. Otherwise the snow cover is assumed unchanged since the day before. Inability to update the map over its entire domain on a daily basis results in a delayed reproduction of snow cover dynamics in the map and, hence, in degraded map accuracy. Over time various image and data analysis tools as well as several auxiliary snow cover datasets have been added to the IMS to facilitate the work of human analysts. The spatial resolution of the maps has substantially increased, and it is believed that the snow mapping time lag or the map timeliness might have also improved owing to the system enhancements. However, the extent of this latter improvement and whether it actually occurred remains uncertain. 
In this work we sought to estimate the time interval between consecutive updates of the IMS snow cover map (or the revisit time interval) and to understand whether the frequency of updates and, hence the map timeliness, has improved over time.  IMS snow maps at 24km spatial resolution over the 1997-2024 time period have been used. We examined daily snow extent records over several relatively small test regions and estimated the time interval between consecutive updates of the map. The focus was on the period of the most active seasonal snow melt when the rate of the snow cover retreat required daily updates of the snow map. We have found that at the inception of the IMS system in 1997, the mean frequency of updates of the IMS snow map fluctuated between once every 4 - 6 days rather than daily. By 2024 the revisit time interval dropped to about 2 days with most of the decrease occurring in the first decade of the century. With the frequency of updates improved by 2 to 4 days, the mean time lag to reproduce snow cover dynamics in the IMS snow cover map, or the map latency decreased by 1-2 days.  Somewhat greater improvement in the update time interval and, hence, in the snow map latency was observed over mountainous areas as compared to predominantly flat terrains. 
While decreasing snow mapping time lag and, hence, improved timeliness of IMS snow maps is certainly beneficial for operational applications, it poses challenges for the climatological use of the dataset. In the presentation we estimate and discuss the effect of improved timeliness of the product on the snow extent and snow phenology trends inferred from the IMS snow dataset. 

How to cite: Romanov, P.: NOAA Interactive Snow Charts (IMS), 1997-2024:  Is the snow mapping lag decreasing over time ? Implications for operational applications and snow climatology., EGU General Assembly 2025, Vienna, Austria, 27 Apr–2 May 2025, EGU25-2938, https://doi.org/10.5194/egusphere-egu25-2938, 2025.

EGU25-3014 | ECS | Orals | CL5.3

Regional Climate Dynamics in the Arabian Peninsula: A Study of Temperature Trends and Precipitation Uncertainty 

Fayma Mushtaq, Adyan Ul Haq, Simran Bharti, Luai Muhammad Alhems, and Majid Farooq

The Arabian Peninsula (AP), with its harsh, arid climate, severe water scarcity, and dependence on fossil fuels, is particularly vulnerable to the impacts of climate change, amplifying risks to ecosystems, water resources, agriculture, and human health. This study explores the historical climate variability across key countries of the Arabian Peninsula, including Saudi Arabia, Oman, Kuwait, Bahrain, Qatar, the UAE, Yemen Jordan and Iraq using the ERA5 reanalysis dataset from the European Centre for Medium-Range Weather Forecasts (ECMWF). An in-depth analysis of long-term climatic trends and anomalies from 1960 to 2020 has been conducted on temperature and precipitation variables using high-resolution (0.5° x 0.5°) ERA5 climate data. The trend analysis was performed using the Mann-Kendall test and Sen's slope estimator to assess the statistical significance and rate of change of the variables over time. The results show a consistent and statistically significant warming trend across all countries, with minimum (Tmin), and maximum (Tmax) temperatures exhibiting an increasing trend at 95% confidence level. Among all the countries, the total change in Tmax with respect to the base year of 1960 was highest for Iraq, showing an increase of 1.49°C, followed by Saudi Arabia and Yemen with an increase of 1.39°C. In comparison, Tmin has shown more significant warming than Tmax. Notably, UAE experienced a substantial increase of 2.91°C in Tmin from the 1960 base year, where the Tmin temperature was 20.04°C. Similarly, Yemen and Saudi Arabia have also exhibited significant increases in Tmin, with Saudi Arabia showing a rise of 2.36°C and Yemen experiencing a rise of 2.23°C compared to the base year. In contrast, precipitation trends exhibit notable variability across the countries, with Iraq, Saudi Arabia, UAE, and Yemen showing a decline in precipitation, as indicated by Sen Slope values of -0.01, -0.27, -0.16, and -0.46, respectively. On the other hand, Bahrain, Kuwait, Qatar, and Jordan show an increase in precipitation. However, the changes observed in precipitation are not statistically significant, suggesting that the shifts in precipitation are less reliable and may not reflect consistent long-term trends. Across all the countries, Tmax and Tmin exhibits a significant increase on a seasonal basis at p = 0.05, except for December, January, and February (DJF) season in Bahrain, where the results are not statistically significant. On a seasonal basis the precipitation observed variability across all the countries, with some showing an increase and others a decrease, though most trends are not statistically significant. The most significant change was observed in Kuwait's June, July, August (JJA) season, where an increase in rainfall was detected at the 95% confidence level. The analysis revealed significant warming trends across the region, particularly in Tmin with statistically significant upward shifts observed in all countries. In contrast, precipitation trends exhibit high variability, with some countries experiencing slight increases and others facing decreases, though the changes remain largely non-significant. The study contributes valuable insights into the historical climatic changes in the AP, which are critical for developing future climate adaptation strategies and policy frameworks.

How to cite: Mushtaq, F., Ul Haq, A., Bharti, S., Alhems, L. M., and Farooq, M.: Regional Climate Dynamics in the Arabian Peninsula: A Study of Temperature Trends and Precipitation Uncertainty, EGU General Assembly 2025, Vienna, Austria, 27 Apr–2 May 2025, EGU25-3014, https://doi.org/10.5194/egusphere-egu25-3014, 2025.

Hourly extreme precipitation is expected to intensify with global warming following Clausius-Clapeyron (CC) relationship. In this research, we utilized hourly precipitation and dew point temperature (DPT) data from over two thousand in-situ gauge observations spanning 1950–2018, as well as ERA5 and MERRA2 datasets, during the warm season across mainland China. Our observations clarify the spatial distribution and trend of hourly extreme precipitation in China mainland, derive the precipitation-temperature scaling relationship, and, for the first time, explore the diurnal cycle of scaling from observations, which has received limited attention in previous studies. Hourly extreme precipitation increases more significantly than at daily time scale, enhancing the probability and risk of short-term extreme precipitation events.

 For hourly precipitation-temperature scaling relationship, 88.7% of stations exhibit super-CC scaling with notable regional differences. Extreme precipitation intensity increases monotonically with DPT and no ‘hook’ structure is observed in the regional scaling curve. However, ERA5 and MERRA2 predominantly show stations with sub-CC scaling, and exhibited a ‘hook’ structure at DPT about 22℃ in regional scaling curve, suggests that reanalysis datasets underestimate changes in hourly extreme precipitation in response to DPT. Noticeably, The scaling shows a pronounced diurnal cycle and exceed all-hours scaling, indicating that the mix of precipitation from different hours ultimately affects overall scaling results. Over a 39-year period, changes in extreme precipitation intensity were closely aligned with DPT throughout the diurnal cycle in inland regions. These result provides valuable insight into the shift of extreme precipitation to morning/night in some regions under climate change.

How to cite: Lei, M. and Wang, S.: Reassessing Hourly Precipitation-Temperature Scaling: The Diurnal Cycle in a Warming China, EGU General Assembly 2025, Vienna, Austria, 27 Apr–2 May 2025, EGU25-3940, https://doi.org/10.5194/egusphere-egu25-3940, 2025.

EGU25-6408 | ECS | Posters on site | CL5.3

Optimization of homogenization algorithms to detect discontinuities in near-surface (2m) temperature time series 

Emanuele Roberto, Fabio Madonna, Faezeh Karimian Sarakhs, and Gessica Cosimato

The study of global warming using near-surface temperature measurements requires homogenization algorithms to detect and correct inhomogeneities in time series through statistical analysis. Homogenization improves data quality and stability, enabling more reliable climate analysis and modeling. However, homogenization poses challenges, particularly the need for benchmarking datasets to ensure consistent adjustments. The recent development of reference networks, as defined by the GCOS framework, provides datasets where homogenization algorithms can be tested using metadata and measurement uncertainties that identify potential discontinuities. 

This study is part of the project "Strumenti per la Mitigazione dell’Isola di Calore e il Recupero delle Aree Boschive" (SMICRAB) which integrates georeferenced data and advanced statistical modelling to develop geostatistical models and to assess vulnerability of urban and wooded areas useful for urban planning, biodiversity conservation and natural disaster risk reduction.

This study aims to optimize homogenization algorithms using data from the U.S. Climate Reference Network (USCRN). While USCRN datasets lack uncertainty estimates, these have been made available through a Copernicus project via the Climate Data Store (CDS).

The focus is on detecting breakpoints in monthly near-surface (2m) temperature series using the Standard Normal Homogeneity Test (SNHT), where breakpoints correspond to abrupt changes in time series combined with uncertainty measurements.

This work will show the results obtained from the optimization process, which examined the original series alongside trends derived using moving-average decomposition, ARIMA, and LOESS models with various spans. By comparing SNHT-detected breakpoints with those in uncertainty series, the analysis evaluates accuracy and delay in breakpoint detection. The work is supported by metadata to explain the breakpoints nature. The analysis of uncertainty measurement allows to identify a breakpoint since the uncertainty increases or decreases in correspondence with a change in the instruments or measurement setup.

The ultimate goal is to reduce false positives and enhance the reliability of adjustments, contributing to more accurate climate datasets for modeling and analysis.

How to cite: Roberto, E., Madonna, F., Karimian Sarakhs, F., and Cosimato, G.: Optimization of homogenization algorithms to detect discontinuities in near-surface (2m) temperature time series, EGU General Assembly 2025, Vienna, Austria, 27 Apr–2 May 2025, EGU25-6408, https://doi.org/10.5194/egusphere-egu25-6408, 2025.

EGU25-6467 | ECS | Posters on site | CL5.3

A serially complete daily precipitation dataset for South America: quality control, gap-filling, and homogeneity 

Adrian Huerta, Roberto Serrano-Notivoli, and Stefan Brönnimann

This study presents the Serially Complete Precipitation dataset for South America (SC-PREC4SA), a reliable daily precipitation dataset (1960-2015) that overcomes observational gaps and maintains temporal consistency across climates. SC-PREC4SA consolidates data from 7799 weather stations, employing advanced quality control, gap-filling, and homogenization methods to improve accuracy and reliability. The quality control process addressed common and overlooked issues, resulting in considerable improvements in data integrity. Gap-filling achieved a mean prediction accuracy of 70% (60%) for wet/dry days (wet-day magnitude). These findings illustrate the reliability of the gap-filling procedure, especially in mixed climates with sparse station networks. The homogenization approach which focuses mostly on wet days, effectively reduces inhomogeneities while preserving precipitation variability and resolving any biases created during the gap-filling. The compiled dataset captures daily precipitation patterns with moderate to high accuracy, enabling the temporal coherence required for climate research. The comprehensive SC-PREC4SA framework generates multiple outputs, making it useful for a variety of applications such as climate research, hydrological modeling, and water resource management, as well as addressing long-standing issues with precipitation data availability and quality in South America. By addressing limitations in observational datasets and strengthening spatiotemporal consistency, SC-PREC4SA sets a standard for future precipitation datasets in regions with diverse climates and complex terrain. The SC-PREC4SA data collection is publicly available on figshare: https://doi.org/10.6084/m9.figshare.c.7588178.

How to cite: Huerta, A., Serrano-Notivoli, R., and Brönnimann, S.: A serially complete daily precipitation dataset for South America: quality control, gap-filling, and homogeneity, EGU General Assembly 2025, Vienna, Austria, 27 Apr–2 May 2025, EGU25-6467, https://doi.org/10.5194/egusphere-egu25-6467, 2025.

Long-term changes in stratospheric temperatures are important for climate trend monitoring and interpreting the radiative effects of anthropogenic emissions of ozone-depleting substances and greenhouse gases. The Stratospheric Sounding Unit (SSU) onboard the historical NOAA Polar Orbiting Environmental Satellite (POES) series was a three-channel infrared radiometer designed to measure temperature profiles in the middle and upper stratospheres. Although the SSU observations were designed primarily for weather monitoring; however, due to continuity, long-term availability, and global coverage, they comprised an indispensable climate data record that had been playing a key role in estimating temperature trends in the middle and upper stratospheres for the period of 1979–2006 (Wang et al. 2012; Zou et al. 2014).  On the other hand, since 2002, the hyperspectral infrared sounding measurements including the Atmospheric Infrared Sounder (AIRS), the Infrared Atmospheric Sounding Interferometer (IASI), and the Cross-track Infrared Sounder (CrIS) provides decades of infrared hyperspectral observations. Owing to their hyperspectral nature and accurate radiometric and spectral calibration, these datasets provide modern period measurements of stratospheric temperature with high data quality.

This study presents recent efforts of merging of the SSU stratospheric temperature data with AIRS. We generated the training datasets of SSU and AIRS from the UMBC 48 profiles with different scan angles using the Community Radiative Transfer Model (CRTM). A linear regression method with considering weighting function and instrument noise as constrains is developed to convert AIRS into equivalent SSU based on training datasets.  By taking advantage of their overlapping period of SSU and AIRS in 2003-2006, the residual biases are further removed along the scan angels. The effects of increases in atmospheric CO2 concentration on stratosphere temperature records are also removed to make the dataset suitable for stratospheric temperature monitoring. Finnlay, the SSU-AIRS dataset is compared with the existing SSU/AMSU/ATMS dataset (Zou and Qian 2016). The differences of their variability and trend are presented. The new SSU/AIRS dataset provides another long-term observation for stratospheric temperature monitoring.

How to cite: Wang, L.: Extending Stratospheric Temperature Climate Data Records by Merging SSU with AIRS , EGU General Assembly 2025, Vienna, Austria, 27 Apr–2 May 2025, EGU25-6603, https://doi.org/10.5194/egusphere-egu25-6603, 2025.

EGU25-6907 | Orals | CL5.3

Extreme temperature in the Mediterranean basins 

Gessica Cosimato, Fabio Madonna, Marco Rosoldi, Faezeh Karimian Sarakhs, and Emanuele Roberto

This study analyses daily maximum and minimum temperature extremes in the Mediterranean basin using the EOBS and ERA5-Land datasets for the period 2011–2023. EOBS is a daily gridded land-only observational dataset over Europe while ERA5-Land is a global climate reanalysis dataset with hourly resolution and global coverage, both with a spatial resolution of 0.1°x0.1°.

In this study, climatic extremes were analysed. All values exceeding the 90th percentile of the data distribution or falling below the 10th percentile were used to identify extreme warm and cold temperatures, respectively. The main objective is to compare the distributions of temperature extremes for the two datasets to identify differences in the amount and magnitude.

The analysis was conducted on five climatic sub-regions of the Mediterranean Basin, including the Iberian Peninsula, Southern France–Balearic Islands, Northeastern Mediterranean, and the Southeastern Mediterranean with Turkey.

Preliminary results reveal that the number of temperature extreme detected simultaneously by the two datasets is about 80%. The best agreement between EOBS and ERA5-Land is found in the regions densely covered by near-surface measurement stations. More specifically, EOBS identifies more intense warm extremes than ERA5-Land, with most of the values ranging between 31–34 °C. For warm extremes, EOBS also captures a broader range of extreme temperature values compared to ERA5-Land in some areas, such as the Iberian Peninsula and the Southeastern Mediterranean. In both datasets, the values are characterized by temperatures ≥40°C, which represent 20% of the value above the percentile threshold. For cold extremes, the two distributions show a good agreement with approximately 25% of the values ​​on average between -4°C and 0°C, in areas such as the Iberian Peninsula and the Western Mediterranean, while lower values between -10°C e -6°C are observed in the Eastern Mediterranean. In the Iberian Peninsula and Western Mediterranean, EOBS shows a higher cumulative probability for values lower than -10 °C, while ERA5-Land has a higher cumulative probability in the range from 0°C to -2 °C. In the Northeastern Mediterranean, the cumulative probability for temperatures < -10 °C is approximately 25% for both datasets.

Further consideration will be presented regarding the influence of orography on the differences observed between ERA5-Land and EOBS, to better understand the representation of climatic extremes in both datasets.

How to cite: Cosimato, G., Madonna, F., Rosoldi, M., Karimian Sarakhs, F., and Roberto, E.: Extreme temperature in the Mediterranean basins, EGU General Assembly 2025, Vienna, Austria, 27 Apr–2 May 2025, EGU25-6907, https://doi.org/10.5194/egusphere-egu25-6907, 2025.

Using the changepoints identified and adjusted to produce the homogenized monthly precipitation dataset, this study developed a homogenized daily precipitation dataset for Canada, in which all data gaps are infilled for the period back to 1900 for southern stations (south of 60˚˚ N), and back to the first day of 1948 or the first day of observation before 1948 for northern stations using advanced spatial interpolation of both monthly and daily values from other stations in the region. The homogenized daily precipitation dataset was then used to assess trends in a set of precipitation extreme indices, including annual maximum one-day (RX1day) and five-day (RX5day) precipitation, as well as annual number of heavy precipitation days, R10mm (annual count of days when precipitation >=10mm). The results show that both annual maximum one-day and five-day precipitation have increased significantly at most stations across Canada over their data record periods, with most stations in the Rocky Mountains and southern Prairies showing insignificance decreases over the period of 1948-2022. Increases in the annual maximum one-day and five-day precipitation are largest and significant in central to northern Canada and in the Maritimes provinces. Annual number of heavy precipitation days has increased significantly at most stations in northern Canada.


How to cite: Wang, X. L. and Feng, Y.: Observed trends in precipitation extreme indices as inferred from a homogenized daily precipitation dataset for Canada, EGU General Assembly 2025, Vienna, Austria, 27 Apr–2 May 2025, EGU25-7686, https://doi.org/10.5194/egusphere-egu25-7686, 2025.

EGU25-8526 | Orals | CL5.3

Homogenization of GNSS integrated water vapour time series using statistical machine learning 

Emilie Lebarbier, Ninh Nguyen, and Olivier Bock

We present a novel approach to homogenize daily GNSS water vapour time series using statistical methods and machine learning techniques. The procedure involves three main steps:

  • Segmentation. The aim is to detect the number and position of change-points in a time series of Integrated Water Vapour (IWV) differences (GNSS minus reference), modelled as a constant (mean) value per segment superposed with a fourth order Fourier series and white noise with a monthly varying variance. The model parameters are estimated by penalized maximum likelihood algorithm, implementing Dynamic Programming search in an iterative scheme [1].
  • Attribution. The aim is to predict, for each and every change-point, in which of the GNSS (G) or reference (E) series the jump in mean occurred. Information from nearby stations is introduced as additional G' and E' series, which are combined with G and E into six series of differences. A Feasible Generalized Least Squares regression is used to estimate the size of the jumps in the six series and a Random Forest classifier is used to predict which of the four base series caused the jump. The classifier is trained and validated beforehand with a large data set by using a resampling strategy [2].
  • Correction. The raw G and E series are corrected for the corresponding shifts in mean that were detected and attributed to G and/or E.

The paper will present recent improvements of the attribution method, namely: i) the optimization of detection skill scores, both for the training of the classifier and application; ii) the optimization of the sample size for the resampling; iii) a refined nearby-aggregation method based on inverse distance weighting. The method is applied to a new, enhanced, data set based on more than 6000 globally-distributed GNSS stations. The impact of homogenization on IWV trends over the period 1994-2022 is presented.

[1] Quarello et al., 2022, https://doi.org/10.3390/rs14143379

[2] Nguyen et al., 2024, https://doi.org/10.1002/joc.8441

How to cite: Lebarbier, E., Nguyen, N., and Bock, O.: Homogenization of GNSS integrated water vapour time series using statistical machine learning, EGU General Assembly 2025, Vienna, Austria, 27 Apr–2 May 2025, EGU25-8526, https://doi.org/10.5194/egusphere-egu25-8526, 2025.

EGU25-8850 | ECS | Posters on site | CL5.3

Harmonizing Multi-Source Meteorological Data: A Reproducible Approach for Drought Monitoring 

Eirini Trypidaki, Amanda Batlle-Morera, Lluís Pesquer, and Cristina Domingo-Marimon

Meteorological, environmental, and geophysical measurements are essential for climate analysis and modelling, including weather forecasting and assessing extreme weather events such as drought and floods (WMO, 2008). Accurate meteorological data are critical, as erroneous data can significantly affect climate analyses and model validity (Llabrés-Brustenga et al., 2019). Harmonization and quality control (QC) are necessary to achieve reliable datasets.

Improved datasets can subsequently calculate drought indicators, such as the Standardized Precipitation Index (SPI) (McKee et al., 1993), and the Standardized Precipitation Evapotranspiration Index (SPEI) (Vicente-Serrano et al., 2010), which rely on meteorological data. By enhancing these indices, this work aims to improve strategies for monitoring and mitigating drought impacts.

As a case study, mean monthly temperature (Tmean °C) and cumulative precipitation (P, mm) data were collected from Ebro basin, Spain's largest catchment. Data from multiple organizations, including , were compiled for the period 1950–2023 to ensuring the highest possible accuracy and maximum station coverage. The QC process involves several steps, including test for temporal and spatial consistency, outlier detection, duplicate detection, missing data analysis, and cross-validation. Homogenization and outlier detection are the primary procedures for the monthly data series (Szentimrey, 2006; Venema et al., 2012). Proper merging of datasets from multiple providers required reprojection to align with a common spatial reference system and datum (EPSG:25830).

The workflow included the following steps: (a) Exclusion of short-length series to remove unstable or poorly accurate data; (b) Retention of stations installed before 2000 with ≥5 years of data and those installed after 2000 with ≥1 year of data, with all other stations removed; (c) Examination of temporal gaps and percentage of missing (NA) values for each station; (d) Detection of outliers, where extreme monthly temperature (>10°C) or precipitation values (>500 mm) were flagged, plotted, and compared to nearby stations. Erroneous values were removed based on expert judgment following visualisation in each subsequent step.

The QC script was developed in R and is openly accessible on GitHub: https://github.com/grumets/QCMeteoData/blob/QCMeteoData/Quality_Control.R, ensuring transparency and reproducibility.

The harmonisation process revealed challenges, including inconsistent formats across data sources and issues such as duplicated stations and measurements particularly in AEMET and XEMA datasets. Following QC, 0.35% of precipitation and 0.42% of temperature data from AEMET were removed, while only 0.13% of records from Météo France were affected, Despite assurance of dataset completeness and homogeneity by providers, the inconsistencies found showed the necessity of a more exhaustive QC procedure. 

How to cite: Trypidaki, E., Batlle-Morera, A., Pesquer, L., and Domingo-Marimon, C.: Harmonizing Multi-Source Meteorological Data: A Reproducible Approach for Drought Monitoring, EGU General Assembly 2025, Vienna, Austria, 27 Apr–2 May 2025, EGU25-8850, https://doi.org/10.5194/egusphere-egu25-8850, 2025.

EGU25-10348 | Orals | CL5.3

The Comprehensive Upper Air Observation Network (CUON) Dataset 

Leopold Haimberger, Ulrich Voggenberger, Federico Ambrogi, Markel Garcia Diez, and Paul Poli

The Copernicus Climate Change Service (C3S) has developed the Comprehensive Upper Air Observation Network (CUON) dataset. The main geophysical variables included in CUON are temperature, humidity, and wind. The input observation data are the NOAA Integrated Global Radiosonde Archive (IGRA), the NCAR Upper-Air Database (UADB), the ERA5 observation feedback archive, and additional ascents from smaller collections, including in particular the African Monsoon Multidisciplinary Analysis (AMMA) and the World Ozone and Ultraviolet Radiation Data Centre (WOUDC). Available radiosonde, ozonesonde, and pilot-balloon (PILOT) platforms are included, even if the station record contains only a single launch. Key improvements over the aforementioned data input are the following: balloon drift estimates, observation error estimates and homogeneity adjustments for the main variables. The actual launch times were also refined as far as possible from the nominal times of reporting plus available metadata (e.g., IGRA release times). These unique features make CUON particularly suitable as an input for climate reanalysis, in particular the upcoming ERA6 reanalysis, but also other climate applications.

Comparison with ERA5 gridded data shows a sizeable reduction of representation errors and biases across all main variables, in particular in the early 2000s but also at other time periods back to the 1940s. The offline calculated observation minus background (obs-bg) departures are sometimes 30% smaller than those calculated during ERA5 assimilation. This may be explained by the offset of radiosondes during ascent as compared to their launch position, which can reach several 100km, i.e. several reanalysis gridboxes. 

The obs-bg departures form the basis for comprehensive statistics-based adjustment of biases in temperature, wind direction and also humidity, using the RAOBCORE/RICH method. The corresponding software has been further improved compared to the past year, with a better treatment of data gaps. 

Results from bias-adjusted temperature records indicate realistic spatial trend heterogeneity and a better fit to reprocessed satellite data products than what could be achieved in preparation to the present operational reanalysis ERA5. Temperature background departures from ERA5 increase substantially, both in terms of mean and standard deviations when going back to the early 1950s and 1940s. The present investigated whether this increase comes from poorer quality observations or from issues arising due to the less strongly observationally constrained ERA5 state during this period.

Humidity bias adjustments prove to be more delicate to implement, since it is not sufficient to shift the distributions by a mean value. Instead, it turns out to be important to adjust also the shape of the distributions. To achieved this, a quantile matching approach has been adopted, taking into account the size of the change of background departures in the time intervals before and after a potential breakpoint. The adjustment led to a reduction of obs-bg departures with respect to ERA5 but also reduced the strong spurious drying trends over continental-scale networks such as the US and China in the period 1990-2020.

The CUON dataset goes back to 1905 and will be updated at least annually. It will be made available from: https://cds.climate.copernicus.eu/datasets/insitu-comprehensive-upper-air-observation-network?tab=overview.

How to cite: Haimberger, L., Voggenberger, U., Ambrogi, F., Garcia Diez, M., and Poli, P.: The Comprehensive Upper Air Observation Network (CUON) Dataset, EGU General Assembly 2025, Vienna, Austria, 27 Apr–2 May 2025, EGU25-10348, https://doi.org/10.5194/egusphere-egu25-10348, 2025.

EGU25-11097 | ECS | Orals | CL5.3

A Unified Framework for Trend Uncertainty Assessment in Climate Data Record: Application to the Analysis of the Global Mean Sea Level Measured by Satellite Altimetry 

Kevin Gobron, Roland Hohensinn, Claire E. Bulgin, Xavier Loizeau, Emma R. Woolliams, Christopher J. Merchant, Jon Mittaz, Adam C. Povey, Mary Langsdale, Wouter Dorigo, Maurice G. Cox, Michael Ablain, Anna Klos, Alexander Gruber, and Janusz Bogusz

Estimating trends from Climate Data Records (CDRs) of Essential Climate Variables (ECVs) is necessary to detect persistent changes in Earth’s climate and geophysical processes and states. Accurately describing trend uncertainty is also essential to determining the significance of observed changes and attributing drivers. However, despite the importance of uncertainty, no established trend assessment approach properly accounts for all known sources of trend uncertainty. Most approaches either neglect part of known measurement uncertainty, such as measurement system instability, or ignore the influence of natural climate variability on trend estimation. Such neglect can result in over-confidence in trend estimates. 

With the intent of providing the most realistic uncertainty intervals for climate data record time series data, this study discusses problems and limitations of current approaches. It emphasizes the need to account for the combined influence of measurement uncertainties (i.e., stability of the observational system) and natural climate variability on trend uncertainty. This study proposes a novel trend-uncertainty assessment approach unifying available measurement uncertainty information with empirical modelling of natural climate variability within the same trend-estimation framework. As a proof of concept, the proposed approach is applied to the analysis of trends in a Global Mean Sea Level (GMSL) time-series. This GMSL application demonstrates that combining available measurement uncertainty assessment with variance modelling is expected to lead to more realistic uncertainty evaluations in sea-level trends. This unified approach is potentially applicable to virtually any CDR and could enhance the reliability of climate change analysis through an improved trend uncertainty assessment in climate studies.

How to cite: Gobron, K., Hohensinn, R., Bulgin, C. E., Loizeau, X., Woolliams, E. R., Merchant, C. J., Mittaz, J., Povey, A. C., Langsdale, M., Dorigo, W., Cox, M. G., Ablain, M., Klos, A., Gruber, A., and Bogusz, J.: A Unified Framework for Trend Uncertainty Assessment in Climate Data Record: Application to the Analysis of the Global Mean Sea Level Measured by Satellite Altimetry, EGU General Assembly 2025, Vienna, Austria, 27 Apr–2 May 2025, EGU25-11097, https://doi.org/10.5194/egusphere-egu25-11097, 2025.

Diurnal asymmetric warming, a critical feature of climate change, significantly impacts water-carbon exchange in terrestrial ecosystems. This study analyzes the spatiotemporal characteristics and long-term trends of the global diurnal temperature range (DTR) from 1961 to 2022 using ensemble empirical mode decomposition (EEMD). Our results reveal a trend reversal in global averaged DTR around 1988, shifting from a decrease to an increase, affecting 47% of global land areas. Subsequent to the reversal, the most pronounced increases were observed in temperate regions. Seasonal analysis shows earlier reversals in spring and summer, with accelerated change rates following the reversal. Additionally, increased surface solar radiation from reduced cloud cover caused daily maximum (Tmax) temperatures to warm faster than the minimum (Tmin), leading to a reversal and intensified DTR. These complex patterns underscore the need for targeted climate policies and adaptation strategies to tackle global warming.

How to cite: Xia, H.: Increase Asymmetric Warming Rates Between Daytime and Nighttime Temperatures Over Global Land During Recent Decades, EGU General Assembly 2025, Vienna, Austria, 27 Apr–2 May 2025, EGU25-11241, https://doi.org/10.5194/egusphere-egu25-11241, 2025.

EGU25-11317 | ECS | Posters on site | CL5.3

Assessment of global upper-air wind speed: a comparison between radiosonde observations and reanalysis, 1979-2023 

Hairong Li, Cesar Azorin-Molina, Fabio Madonna, Song Yang, and Kaiqiang Deng

Upper-air wind speed (UWS) is a crucial variable in climate change assessments and is also necessary in various socioeconomic areas such as evaluating wind energy production at the turbine height and optimizing commercial aviation routes. While reanalysis datasets have been widely utilized as essential tools for climate change analysis due to their comprehensive spatial coverage and temporal continuity, their performance in representing global UWS remains uncertain. This study evaluates four major reanalysis datasets (i.e., ERA5, ERA-Interim, MERRA-2, and JRA-55) by assessing their performance in capturing the spatio-temporal characteristics of global UWS, including climatological mean, variability, and linear trends seasonally and annually. The assessment is conducted through comparisons with radiosonde observations from two datasets: the Integrated Global Radiosounding Archive version 2 (IGRA-v2) and the homogenized Radiosounding HARMonization (RHARM) dataset distributed by the Copernicus Climate Change Service (C3S) for 1979-2023. The radiosonde observations reveal that UWS exhibits distinct vertical and zonal patterns. In the lower and middle troposphere, UWS generally remains below 10 m s⁻¹ with relatively weak non-significant trends in most stations. In contrast, the upper troposphere and lower stratosphere show pronounced zonal patterns with values up to 45 m s⁻¹, accompanied by significant increasing trends reaching 3.412 m s⁻¹ per decade. These zonal patterns demonstrate clear seasonal variations, appearing more linear in winter and wave-like in summer. While all four reanalysis datasets successfully capture the climatological patterns and seasonal variations of UWS, they show varying degrees of biases in trend estimation. These comparisons provide valuable insights for understanding UWS characteristics.

How to cite: Li, H., Azorin-Molina, C., Madonna, F., Yang, S., and Deng, K.: Assessment of global upper-air wind speed: a comparison between radiosonde observations and reanalysis, 1979-2023, EGU General Assembly 2025, Vienna, Austria, 27 Apr–2 May 2025, EGU25-11317, https://doi.org/10.5194/egusphere-egu25-11317, 2025.

EGU25-12009 | Posters on site | CL5.3

Enhancing Climate Studies with High-Quality Reference Observations: Insights from the Copernicus Programme 

Monica Proto, Fabio Madonna, Kalev Rannat, Hannes Keernik, and Tom Gardiner

Accurate and reliable observational data are essential for understanding climate dynamics, assessing climate change impacts, and supporting informed adaptation strategies. This work highlights the pivotal role of reference measurements and climate data records accompanied by robust uncertainty quantification, in ensuring the quality and consistency of observational datasets. These datasets underpin scientific analyses and decision-making processes, particularly in the context of climate studies and applications. Within the framework of the Copernicus program, the European Centre for Medium-Range Weather Forecasts (ECMWF) operates the Copernicus Climate Change Service (C3S) with funding from the European Union. The Institute of Methodologies for Environmental Analysis (IMAA) of the National Research Council (CNR) has been engaged by ECMWF to implement the C3S2 311 Lot2 project, which builds on previous efforts in Copernicus contracts to enhance access to high-quality baseline and reference observations. This project underscores the importance of standardized measurement protocols and rigorous uncertainty assessment methodologies. The study introduces three types of datasets made available on the Copernicus Climate Data Store (CDS), which serves as a key platform for disseminating reference datasets, ensuring accessibility for researchers and stakeholders (1) upper-air reference measurements for GRUAN, (2) near-surface reference measurements from USCRN, and (3) precipitable water vapor derived from reference and reprocessed GNSS time series. The potential applications of these measurements in characterizing atmospheric conditions and investigating climate variability are discussed. 

How to cite: Proto, M., Madonna, F., Rannat, K., Keernik, H., and Gardiner, T.: Enhancing Climate Studies with High-Quality Reference Observations: Insights from the Copernicus Programme, EGU General Assembly 2025, Vienna, Austria, 27 Apr–2 May 2025, EGU25-12009, https://doi.org/10.5194/egusphere-egu25-12009, 2025.

EGU25-12496 | ECS | Orals | CL5.3

Comprehensive pixel-level Level 1 Uncertainty Characterization for SPOT-VGT1, SPOT-VGT2, and PROBA-V following the FIDUCEO guidelines. 

Nicolas Misk, Marta Luffarelli, Yves Govaerts, Iskander Benhadj, Sindy Sterckx, Roberto Biasutti, and Fabrizio Niro

Producing Fundamental Data Records (FDRs) with well-defined uncertainty estimates is crucial for the development of relevant Essential Climate Variables (ECV), as prescribed by the Quality Assurance framework for Earth Observation (QA4EO) and the FIDUCEO guidelines. An FDR is a record, of sufficient duration for its application, of uncertainty-quantified sensor observations calibrated to physical units and located in time and space, together with all ancillary and lower-level instrument data used to calibrate and locate the observations and to estimate uncertainty.

However, satellite operators often do not provide contextual uncertainty products for their missions. This is particularly evident for the PROBA-V, VGT1, and VGT2 sensors, where uncertainty is typically expressed as global upper bounds rather than pixel-specific measures. Furthermore, such uncertainty information is frequently inaccessible to the broader scientific community or inconsistently formatted. This lack of clear uncertainty information constrains researchers’ ability to propagate uncertainty to higher-level ECV models accurately.

The ESA FDR4VGT project led by VITO Remote Sensing addresses this gap by producing pixel-level uncertainty estimates for two decades of harmonized satellite data. The project employs an uncertainty propagation method grounded in metrology principles. Special care has been given to the redaction of FIDUCEO compliant Digital Effect Tables (DETs) for the characterization of digital counts, calibration coefficients and ancillary information. The proposed method exposes the uncertainty estimates as an explicit analytical equation, differentiable and optimized for large scale computing. This comprehensive approach ensures adherence to FIDUCEO guidelines while balancing computational efficiency and accuracy.

Reprocessing 20+ years of Level 1A data to propagate uncertainty estimates to Level 2A projected reflectance images poses several technical challenges. Performance constraints must be considered for the propagation method, and Monte-Carlo uncertainty propagation approaches can only be done for sub-problems limited in terms of time range or scope. An uncertainty quantization using a statistical approach for the less impactful solar geometry uncertainty has been performed on the year 2021 of Proba-V Level 1 data. Level 1A uncertainties have been propagated using an analytical expression of the Law of Propagation of Uncertainty (Guide to the expression of uncertainty in measurement). DETs are prepared to characterise each identified source of uncertainty in the uncertainty diagram.

The uncertainty characterisation at Level-1 is expected to improve the retrieval of ECVs from the VGT and PROBA-V archive, as discussed in previous studies, such as the ESA SPAR@MEP project, underlying the role of improved satellite observation uncertainty characterization in enhancing image inversion performances. This enhancement will be assessed thorough the application of the CISAR algorithm to a diagnostic dataset; a comparison against a reference datases, retrieval uncertainties and ground-based measurements will be performed.

This study demonstrates the feasibility of delivering pixel-level uncertainty maps for Level-1 satellite observations using computationally efficient models. The work highlights the partial or inadequate characterization of several uncertainty contributors, which should be addressed in the preparation of future mission aiming at 1% accuracy. Additionally, this study sets the groundwork for advancing uncertainty analysis in Level 2 and Level 3 data and fulfilling key prerequisites for the delivery of FRM and higher-level CDR.

How to cite: Misk, N., Luffarelli, M., Govaerts, Y., Benhadj, I., Sterckx, S., Biasutti, R., and Niro, F.: Comprehensive pixel-level Level 1 Uncertainty Characterization for SPOT-VGT1, SPOT-VGT2, and PROBA-V following the FIDUCEO guidelines., EGU General Assembly 2025, Vienna, Austria, 27 Apr–2 May 2025, EGU25-12496, https://doi.org/10.5194/egusphere-egu25-12496, 2025.

EGU25-13840 | ECS | Orals | CL5.3

Contrasting Berkeley Earth’s New High Resolution Temperature Dataset with ERA5 

Devin Rand and Robert Rohde

Surface air temperature is among the most fundamental data for studying historical climate change.  Two major categories of historical surface air temperature data products exist, the observational datasets produced by statistically interpolating direct thermometer measurements from weather stations, ships, and buoys (e.g. NASA, NOAA, HadCRU, and Berkeley Earth products) and the reanalysis datasets (e.g. ERA5, JMA-3Q) that use weather models to merge various data (e.g. pressure, temperature, wind) from surface, atmospheric, and satellite measurements.

Most observational datasets are relatively low resolution, but Berkeley Earth has recently introduced a new high-resolution version (0.25° x 0.25° latitude-longitude gridding, 1850-present).  This presentation will compare and contrast Berkeley Earth’s high resolution temperature dataset with the similarly resolved near-surface temperature component of ERA5 reanalysis (1940-present).  The Berkeley Earth high resolution dataset is an extension of Berkeley Earth’s prior work, and is derived directly from weather station and ocean temperature measurements.  It maintains the substantial efforts to quality control and correct for systematic biases in surface temperature measurements, but adds machine learning and other techniques to improve the spatial resolution and accuracy of interpolated temperature fields.

Reanalysis systems, like ERA5, are a modern marvel that provide spatially complete weather estimates across many variables at relatively high spatial and temporal resolution.  However, to reach their full potential, they require extensive data input streams, with generally greater accuracy in the modern satellite era than the pre-satellite era (e.g. 1940-1970).  This heavy reliance on satellite data also increases the risk of systematic drift in accuracy due to changes in satellite availability or undiagnosed changes in satellite accuracy.  In the specific context of surface air temperature, though ERA5 uses weather station pressure and humidity to directly refine atmospheric conditions, the weather station temperatures are only used indirectly via the estimates of surface/soil conditions.  Because ERA5 is not directly constrained by weather station temperatures, systematic biases of 1-2 °C between measured surface air temperature and reanalysis estimates are common, with larger errors sometimes occurring.

Berkeley Earth and ERA5 are broadly similar, but also exhibit interesting differences.  Predictably, those differences are larger in the pre-satellite era.  In some regions, this gives rise not just to quasi-random variations, but also systematic differences in both seasonality and the apparent global warming trends.  Large differences are more common in regions of limited data (e.g. Antarctica, Greenland, Tibet), but can also occur in other environments.

We will discuss the differences between Berkeley Earth’s new high resolution dataset and ERA5, as well as identify the contexts where we believe observational data sets are likely to be more accurate than reanalysis or vice versa.

How to cite: Rand, D. and Rohde, R.: Contrasting Berkeley Earth’s New High Resolution Temperature Dataset with ERA5, EGU General Assembly 2025, Vienna, Austria, 27 Apr–2 May 2025, EGU25-13840, https://doi.org/10.5194/egusphere-egu25-13840, 2025.

EGU25-14076 * | ECS | Orals | CL5.3 | Highlight

Sea breeze changes in the western Mediterranean mainly driven by climate warming (1981-2021) 

Shalenys Bedoya-Valestt, Cesar Azorin-Molina, Lorenzo Minola, Nuria Pilar Plaza Martin, Luis Gimeno, Miguel Andrés-Martín, Sergio Vicente-Serrano, and Deliang Chen

The Mediterranean warming is reshaping land-sea temperature gradients and related weather phenomena driven by differential heating, such as sea breezes (SB). Despite their importance, the response of SB to climate change remains poorly understood due to a lack of long-term studies. Changes in SB characteristics could have significant socioeconomic implications, particularly for sectors like wind power and agriculture, through shifts in the hydrological cycle and associated reductions in summer storms. This work evaluates trends in the occurrence (days) and magnitude (near-surface wind speeds) of SB across the western Mediterranean basin between 1981 and 2021. Using an objective and robust method, we identified SB events from meteorological data collected at 39 stations spanning Spain, France, Italy, Tunisia and Algeria. Daily wind speed data were homogenized to analyze annual and seasonal trends. To explore the influence of Mediterranean warming, we examined correlations between SB characteristics and anomalies in key thermal variables, including surface and low-level air temperature, land-sea air temperature contrasts, sea surface temperatures, heatwaves and solar radiation. Our results reveal basin-wide increase in SB frequency but a reduction in intensity over all timescales since 1981. Approximately 60% of regional variability in SB occurrence is linked to increased solar radiation, while Mediterranean warming accounts for a seasonal increase of up to 10% in SB days per decade. Conversely, SB intensity has weakened, particularly in Spain and the Balearic and Eastern Islands. This weakening is thought to be caused by a reinforced thermal contrast, which explains 70% of the variability in SB magnitude, with heatwaves contributing an additional 10% to the decline.

How to cite: Bedoya-Valestt, S., Azorin-Molina, C., Minola, L., Plaza Martin, N. P., Gimeno, L., Andrés-Martín, M., Vicente-Serrano, S., and Chen, D.: Sea breeze changes in the western Mediterranean mainly driven by climate warming (1981-2021), EGU General Assembly 2025, Vienna, Austria, 27 Apr–2 May 2025, EGU25-14076, https://doi.org/10.5194/egusphere-egu25-14076, 2025.

EGU25-14309 | Orals | CL5.3

Regional analysis for the purposes of designing a reference climate station network in New Zealand 

Raghav Srinivasan, Trevor Carey-Smith, Andrew Harper, Nicolas Fauchereau, and Sam Dean

The aim of this study is to contribute to the design of a reference climate station network that captures the regional variability in the climate and climatology of New Zealand (NZ).

We performed our analysis using New Zealand Re-Analysis which is a high resolution (1.5km) convection-permitting atmospheric regional reanalysis dataset over NZ spanning ~20 years. We analysed the dataset to identify climate regions that are co-varying, have similar climatology and are likely to have a similar response to climate change. To identify co-varying climate regions, we performed a Principal Component Analysis on the dataset and reconstructed it to retain 95% variance. The reconstructed data is then clustered using techniques such as k-means and self-organising maps, with the number of k-means clusters chosen based on a combination of Silhouette score and gap statistics. Secondly, we cluster on daily climatologies to isolate regions with similar climate. Finally, we cluster the differences between present daily climatology with respect to the future climatology using the Coupled Model Intercomparison Project to identify the regions which are likely to have similar climate change signals.

Using the regions derived, we present a method to optimally select a reference network representing the components of covariance, climatology and climate change.

How to cite: Srinivasan, R., Carey-Smith, T., Harper, A., Fauchereau, N., and Dean, S.: Regional analysis for the purposes of designing a reference climate station network in New Zealand, EGU General Assembly 2025, Vienna, Austria, 27 Apr–2 May 2025, EGU25-14309, https://doi.org/10.5194/egusphere-egu25-14309, 2025.

EGU25-20319 | Orals | CL5.3

Observing changes of India's summer monsoon 

Mariette Vreugdenhil, Rob Roebling, Pavan Sanjeevamurthy, Sebastian Hahn, and Wolfgang Wagner

The United Nations' Intergovernmental Panel on Climate Change (IPCC) has reported an increase in the frequency and intensity of heavy precipitation events globally, primarily driven by human-induced climate change. The South and Southeast Asian Monsoon, particularly over India, is one of the affected regions, which has experienced significant changes in precipitation patterns. Characterized by a seasonal reversal of wind and rainfall, the Indian summer monsoon is driven by land-sea thermal contrasts and atmospheric dynamics influenced by the Himalayas, the Tibetan Plateau, and the Indian Ocean. Recent studies attribute the increased intensity of the monsoon to higher sea surface temperatures and enhanced atmospheric moisture fluxes.

Observational data and climate models indicate a general trend of increasing monsoon rainfall, although with regional variability, alongside simultaneous rises in dry spells and extreme rainfall events. Between 1951 and 2015, localized heavy rainfall events have become more frequent, while moderate rainfall events have declined, leading to more severe droughts in central India. Since the 1990s, monsoon rainfall has exhibited an upward trend, consistent with projections of enhanced land-sea thermal contrasts and warming in the Indian Ocean.

In this study, satellite-based climate datasets, such as those provided by EUMETSAT's H SAF and LSA SAF, were used to analyze monsoon dynamics. Key indicators like precipitation, soil moisture, and vegetation coverage revealed complex interactions between rainfall, surface temperature, and evapotranspiration. While the short-term period from 2008 to 2020 shows variability without clear long-term trends, notable correlations emerged, such as increased rainfall leading to cooler temperatures and enhanced soil moisture. Conversely, warmer temperatures had mixed effects on vegetation, moderated by factors such as water availability and land cover.

The observed trends align with global patterns of climate change, with both thermodynamic and dynamic processes contributing to extreme events. Future projections suggest a stronger summer monsoon and a weaker winter monsoon as global warming intensifies, driven by anthropogenic forcing and enhanced land-sea thermal contrasts. These findings highlight the intricate interplay of climatic drivers and underscore the growing need for monitoring and adaptation in response to a changing monsoon regime.

How to cite: Vreugdenhil, M., Roebling, R., Sanjeevamurthy, P., Hahn, S., and Wagner, W.: Observing changes of India's summer monsoon, EGU General Assembly 2025, Vienna, Austria, 27 Apr–2 May 2025, EGU25-20319, https://doi.org/10.5194/egusphere-egu25-20319, 2025.

It is well known that the results of climate model simulations differ from observations, and accordingly such projections can lead to different future temperature characteristics for the same region of interest. While the relative changes described by different climate models are of similar magnitude, the absolute temperature characteristics (based on their relative performance compared to observations) can be so different. At different warming levels (WLs, where a given temperature threshold can be calculated from temperature projections relative to a reference period or observations) global climate models (GCMs) can provide valuable information on climate change at the global scale. The main uncertainty factor for different WLs is time relative to a reference period (e.g. 1976-2005). Moving from global to regional scales, from coarser (~150 km) to finer (~12 km) resolution, regional climate models (RCMs) are expected to provide more detailed information than GCMs. For example, RCMs can better capture precipitation extremes at finer resolutions than the driving GCMs, especially over regions with complex topography, illustrating the benefits of high-resolution modelling. Thus, the timing of reaching a given WL can be assessed at regional and local scales based on high-resolution RCM simulations and high-resolution observations available for the region of interest. The REtuning Climate Model Outputs (RECMO) method helps to reduce differences between different RCM simulations by reducing uncertainties arising from the different climates described by different climate models under different WLs. It should be noted that the reference is based on observations and not on the model outputs from which the WLs are determined.  It can be argued that the RECMO method may be too selective depending on the performance of the climate models over the region (as RCMs with a relatively large cool bias may never reach that WL). Accordingly, the high-resolution raw and bias-corrected EURO-CORDEX and Med-CORDEX outputs are also used in the present work following the RECMO method for the Carpathian Region. Overall, the new concept helps to reduce differences between climate model simulations and leads to more reliable results with respect to possible future climatic temperature conditions for the region of interest. It should be emphasized that the concept is generally applicable to climate models over any region of the globe, the only limitation being the availability of data.

How to cite: Torma, C. Z.: Connecting climate model projections of temperature change with observations at regional and local scales – REtuning Climate Model Outputs (RECMO method): the Carpathian Region, EGU General Assembly 2025, Vienna, Austria, 27 Apr–2 May 2025, EGU25-1179, https://doi.org/10.5194/egusphere-egu25-1179, 2025.

EGU25-3181 | ECS | Posters on site | CL5.4

Improving 1-month forecasts in South Korea through the dynamical downscaling of machine learning based global predictions 

Subin Ha, Xiaohui Zhong, Jina Hur, and Eun-Soon Im

Operational weather forecasts in South Korea currently extend up to 10 days but often fall short of adequately addressing the needs of weather-dependent sectors, such as agriculture, for longer-term meteorological predictions. However, extending forecasts beyond this timeframe remains a significant challenge. While traditional physical models have long been the foundation of weather forecasting, recent advancements in machine learning (ML) models for weather prediction have demonstrated promising forecasting skills that are comparable to, or even surpass, those of physical models. In particular, FuXi-ENS, an ML model trained on ECMWF ERA5 reanalysis data, provides global 6-hourly ensemble forecasts at a 0.25° resolution and shows great potential for one-month forecasts. To evaluate the forecasting performance of FuXi-ENS in South Korea and overcome its coarse spatial resolution, dynamical downscaling of multiple ensemble members is conducted using a regional climate model specifically tailored for Korea. For benchmarking purposes, dynamical downscaling of NOAA CFSv2 is also performed using the same regional climate model. Forecasting skill is comprehensively evaluated from both quantitative and qualitative analyses. Based on this comparative assessment, this study aims to provide valuable insights for enhancing subseasonal-to-seasonal forecasts in South Korea, offering practical benefits for various sectors reliant on extended-range forecasts.


Keywords: extended-range forecasting, dynamical downscaling, ML-based global predictions


(Acknowledgments) This study was supported by the “Research Program for Agricultural Science & Technology Development (Project No. RS-2024-00399847)”, National Institute of Agricultural Sciences, Rural Development Administration, Republic of Korea.

How to cite: Ha, S., Zhong, X., Hur, J., and Im, E.-S.: Improving 1-month forecasts in South Korea through the dynamical downscaling of machine learning based global predictions, EGU General Assembly 2025, Vienna, Austria, 27 Apr–2 May 2025, EGU25-3181, https://doi.org/10.5194/egusphere-egu25-3181, 2025.

Agriculture in East Africa is rain-fed and, thus, depends on the occurrence of precipitation. Given its location around the equator, the occurrence of precipitation in East Africa is characterized by marked seasonality with either one rainy season centred around local summer in the regions that are further away from the equator (except for the Horn of Africa) and two rainy seasons in the regions near the equator and at the Horn of Africa in boreal autumn and boreal spring.
In this study, the extent to which the simulations contributing to the CORDEX-CORE experiment Africa represent the seasonal variation of rainfall in East Africa realistically is investigated. These are simulations for recent decades with three different regional climate models, either forced with observed lateral meteorological boundary conditions or with data from global climate simulations with three different models. The CHIRPS data are considered as observational data of daily rainfall. The seasonal variation of rainfall is described by the characteristics of the mean annual cycle of daily rainfall, e.g., whether it is dominated by an annual or a semi-annual variation, as well as by the timing, i.e., the onset and cessations dates, and the length of the prominent rainy seasons.
The realistic representation of the seasonal variation of rainfall in East Africa in the regional climate simulations is crucial for the validity of future climate scenarios simulated by the respective models and, thus, the potential future impacts of climate change on agriculture in East Africa.

How to cite: May, W.: How well do the CORDEX-CORE simulations capture the seasonal variation of rainfall in East Africa?, EGU General Assembly 2025, Vienna, Austria, 27 Apr–2 May 2025, EGU25-4020, https://doi.org/10.5194/egusphere-egu25-4020, 2025.

The EURO-CORDEX CMIP5-based model simulation ensemble is very large, with 8 GCMs being downscaled by 11 RCMs for three different RCP scenarios, resulting in a total of 136 simulated GCM-RCM-Scenario combinations at the time of this work. Still, the GCM-RCM-Scenario 3-dimensional combination matrix is not at all complete.

With a simple linear ANOVA-based technique some missing simulations can be emulated simply by taking appropriate combinations of linear terms calculated from the matrix of existing simulations. This means that approximate ensemble averages can be calculated, where all GCMs as well as all RCMs have the same weight in the averaging.

We aim at emulating values of various fields for combinations, which have not actually been performed, in order to get a more “democratic” picture
of ensemble means. We will show results for a number of standard variables: Seasonal means of temperature, precipitation, and wind strength as well as some extremes. Also, a complete sub-matrix has been systematically analysed with successive numbers of simulations being left out, in a bootstrap procedure, to estimate variability and errors of ensemble members as well as averages using the ANOVA technique as compared to the complete sub-matrix.

We will demonstrate use and necessary adaptations of this technique for filling the entire EURO-CORDEX matrix based on large sub-sets of all existing simulations.

How to cite: Christensen, O. B.: Estimating democratic averages across GCMs, RCMs, and scenarios in the CMIP5-based EURO-CORDEX simulation ensemble, EGU General Assembly 2025, Vienna, Austria, 27 Apr–2 May 2025, EGU25-4176, https://doi.org/10.5194/egusphere-egu25-4176, 2025.

EGU25-4222 | ECS | Posters on site | CL5.4

Combinatorial Optimization of Cumulus Convection Scheme Parameters in RegCM5 Using a Micro-Genetic Algorithm for Extreme Precipitation Event Simulations in Southeast Asia 

Zixuan Zhou, Thanh Nguyen-Xuan, Eun-Soon Im, Ji Won Yoon, and Seon Ki Park

Extreme precipitation presents a significant environmental challenge that threatens the economic and social stability of Southeast Asian countries, highlighting the critical need for reliable model simulations for early warnings and impact mitigations. Recently, the fifth version of the regional climate model (RegCM5) has been released, featuring updates in multiple model components including the physical parameterizations, which is expected to advance the simulation capability for extreme precipitation events. However, optimizing the model parameterization remains challenging due to the vast array of parameters that require fine-tuning. Traditional approaches that use random-based sensitivity tests to identify optimal scheme combinations are constrained by computing power and often fail to explore the complete range of possible combinations needed for accurate regional climate representation. Moreover, parameters within each scheme exist on a continuous spectrum rather than as discrete options, exponentially increasing model optimization's complexity and computational demands.

To overcome these limitations, advanced optimization techniques have emerged to efficiently explore the complete range of possible combinations, without relying solely on random-based sensitivity tests. In this study, we employ a micro-genetic algorithm (micro-GA) for combinatorial optimization of key parameters within the cumulus convection schemes in RegCM5. The model, driven by ECMWF Reanalysis version 5 (ERA5), covers most of Southeast Asia at a 0.22-degree resolution. This study aims to:

(1) validate the capability and efficiency of the coupled RegCM5-micro-GA interface in improving the simulation of extreme precipitation events in Southeast Asia

(2) investigate the sensitivity of the RegCM5-micro-GA algorithm to different fitness functions and different physical parameters

(3) reveal the mechanism of model optimization by examining physical processes improved by the tuned cumulus convection parameters.

The findings will provide valuable insights to facilitate the wider use of RegCM5 and benefit the broad community in model optimization, fostering more accurate and timely predictions of extreme weather events.


[Acknowledgements]

This research was supported by project GRF16308722, which was funded by the Research Grants Council (RGC) of Hong Kong. This study was also supported by the “Research Program for Agricultural Science & Technology Development (Project No. RS-2024-00399847)”, National Institute of Agricultural Sciences, Rural Development Administration, Republic of Korea.

How to cite: Zhou, Z., Nguyen-Xuan, T., Im, E.-S., Yoon, J. W., and Park, S. K.: Combinatorial Optimization of Cumulus Convection Scheme Parameters in RegCM5 Using a Micro-Genetic Algorithm for Extreme Precipitation Event Simulations in Southeast Asia, EGU General Assembly 2025, Vienna, Austria, 27 Apr–2 May 2025, EGU25-4222, https://doi.org/10.5194/egusphere-egu25-4222, 2025.

EGU25-4536 | Posters on site | CL5.4

Potential changes applying the pseudo-global warming (PGW) approach in the relationship between tropical cyclones (TC) and the Caribbean Low-Level Jet (CLLJ). 

Jose Antonio Salinas, Erika Coppola, Jose Abraham Torres, Francesca Rafaelle, and Graziano Giuliani

Tropical cyclone (TC) activity in the Caribbean Sea from May to October is related to the structure and dynamics of the Caribbean- Low-Level jet (CLLJ), which has great temporal variability and a maximum of 15 m/s during July, at 15°N, 75°W and 925 hPa. The vertical shear generated by this CLLJ has great seasonal and interannual variability and modulates the inhibition of tropical cyclones, whose vertical movement is essential for their development.

To estimate the potential changes associated with pseudo global warming (PGW) conditions of both TC and the CLLJ, as well as their relationship, analysis of regional numerical simulations was applied using both dynamical and statistical methods to identify local atmospheric structures and processes associated with TC and the CLLJ.

The application of this regional dynamical analysis to evaluate simulations for the Caribbean is analyzed, this under the hypothesis that in active (inactive) years associated to TC, the CLLJ is weak (intense), due to weak (strong) vertical shear in the core of the jet. The dynamical methodology in which this hypothesis will be explained is by correlating the convergence of momentum associated with perturbations and how these perturbations contribute to the acceleration of this low-level jet between of May and July and how this jet contributes to the intensification of cyclones between August and September.

To evaluate the interannual variability of TC on seasonal and interannual scales and their impacts on precipitation, numerical simulations were carried out (control simulations) using the RegCM model in the convection permitting mode with a resolution of 4.5 km and 41 vertical levels from 1 June - 31 October for the years: 1980, 1988, 1995, 1996, 1998, 2004, 2005, 2007, 2008, 2017, years with greater TC activity in the Caribbean Sea. To apply this analysis, two numerical experiments were evaluated, the first one is a control period driven by ERA5 data and the second one a pseudo global warming approach (PGW), based on 19 CMIP5 RCP8.5 models. This is an evaluation of how well a regional numerical model can reproduce the interaction of processes of different spatial and temporal scales in the tropics.

The results of the analysis indicate that the RegCM model adequately reproduces the structure of the CLLJ and its seasonal variability, as well as the TC activity through the kinetic energy associated with perturbations (PKE) between 3 and 9 days of period.

Under PGW conditions there is an increase in the CLLJ (compared to the control simulations) and a decrease in the PKE, this being associated with the increase in vertical shear in the region close to the core of the CLLJ.

The implications of the inverse relationship between TC and CLLJ are discussed in terms of impacts on precipitation in Central America and southern Mexico.

How to cite: Salinas, J. A., Coppola, E., Torres, J. A., Rafaelle, F., and Giuliani, G.: Potential changes applying the pseudo-global warming (PGW) approach in the relationship between tropical cyclones (TC) and the Caribbean Low-Level Jet (CLLJ)., EGU General Assembly 2025, Vienna, Austria, 27 Apr–2 May 2025, EGU25-4536, https://doi.org/10.5194/egusphere-egu25-4536, 2025.

EGU25-5006 | Orals | CL5.4

Performance of the RegCM5-CP in simulating a rainfall extreme event on the northern coast of São Paulo state, Brazil, in 2023 

Michelle Reboita, Thales Baldoni, Pedro Silva, Geovane Miguel, Raul Chaves, Rosmeri da Rocha, and Leidinice Silva

In February 2023, the northern coast of São Paulo state (Brazil) experienced the highest 24-hour rainfall ever recorded at meteorological stations operated by the National Institute of Meteorology and the National Center for Monitoring and Early Warning of Natural Disasters (CEMADEN). The Barra da Una station (23.758°S, 45.764°W), for instance, recorded 633 mm of rainfall in 24 hours between 18 and 19 February 2023 (from 1200 to 1200 UTC). Rainfall estimates from the Salesópolis radar also indicated precipitation exceeding 450 mm/day along the coast between the municipalities of Bertioga and São Sebastião. On the other hand, satellite estimates, such as CHIRPS, were unable to capture this precipitation event. In this context, the objective of the study is to analyze the performance of the Regional Climate Model version 5 (RegCM5) in convection-permitting (CP) mode in simulating this extreme daily precipitation event on the northern coast of São Paulo state. A simulation with a horizontal resolution of 4 km, nested in the ERA5 reanalysis, was conducted with a domain over southeastern Brazil. This simulation started  on February 17 at 00 UTC. The simulation results were compared with rainfall data measured at CEMADEN stations and precipitation estimates obtained from the Salesópolis radar. The comparisons indicated that RegCM5-CP underestimates precipitation along the coast and misplaces the maximum precipitation. For instance, radar data of accumulated precipitation from 0000 UTC on February 18 to 0000 UTC on February 20, 2023, show the maximum precipitation occurring at the sea-land interface, whereas RegCM5-CP shifts it to the mountainous region inland. Additionally, the model displays other cores with maximum precipitation, such as along the border with Minas Gerais state, which are not observed in the radar data. New experiments are being conducted to test different physical parameterizations to improve the representation of the studied event. The authors thank CNPq, FAPESP and FAPEMIG for the financial support.

How to cite: Reboita, M., Baldoni, T., Silva, P., Miguel, G., Chaves, R., da Rocha, R., and Silva, L.: Performance of the RegCM5-CP in simulating a rainfall extreme event on the northern coast of São Paulo state, Brazil, in 2023, EGU General Assembly 2025, Vienna, Austria, 27 Apr–2 May 2025, EGU25-5006, https://doi.org/10.5194/egusphere-egu25-5006, 2025.

This study examines the characteristics of convective and stratiform precipitation in three runs of the high-resolution (2.3 km) regional climate model ALADIN-CLIMATE/CZ, operated by the Czech Hydrometeorological Institute, over the Czech Republic for the period 1990–2014. The first run (reanalysis run) is driven by ERA5 boundary conditions and includes station data assimilation, the second run (evaluation run) is similarly forced by ERA5 but without station data assimilation, and the third run (historical run) is driven by the global climate model CNRM-ESM2-1. types.  These model runs are compared againts station measurements and ERA5 reanalysis to evaluate the model’s skill in simulating both convective and stratiform events across the Czech Republic. Spatial distribution and trends of precipitation characteristics are also assessed.

Results show that the ALADIN-CLIMATE/CZ model overestimates both stratiform and convective precipitation in all months. In summer, convective precipitation is better captured by the modelthan stratiform precipitation. Among the three simulations, the reanalysis run,which includes data assimilation, exhibits the closest alignment with observations. By identifying and understanding the strengths and limitations of each model run, this research provides valuable insights into the reliability of high-resolution regional climate models and theirs applications for future climate assessments.

How to cite: Rulfova, Z. and Beranova, R.: Evaluation of Convective and Stratiform Precipitation in High-Resolution Regional Climate Model Runs over the Czech Republic, EGU General Assembly 2025, Vienna, Austria, 27 Apr–2 May 2025, EGU25-6393, https://doi.org/10.5194/egusphere-egu25-6393, 2025.

EGU25-6439 | ECS | Posters on site | CL5.4

Projected changes of mean and extreme precipitation in Hungary: comparison of raw and bias-adjusted EURO-CORDEX simulations 

Csilla Simon, Csaba Zsolt Torma, and Anna Kis

Climate change is one of the biggest threads to humanity, and its effects are already detected. According to the IPCC, not only hot extremes, but droughts and precipitation-related extremes have also become more frequent. The lack of precipitation means severe problem to the ecosystems, agriculture and human health, however, intense rainfalls can also cause damages, e.g. flash floods, which are one of the most devastating natural disasters. Therefore, it is important to know, how the precipitation is likely to change in the future.

The main goal of our research is to investigate the projected changes of precipitation over Hungary for the near future (2021–2050) and the far future (2070–2099) with respect to the reference period of 1976–2005. In addition, the aim of our study is to investigate how the choice of the reference dataset and different calibration periods affects the changes. For this purpose, the results of different datasets are compared: raw and bias-corrected RCM projections. In total three bias-corrected RCM based datasets are included in the present study: RCM projections available from the EURO-CORDEX initiative (using MESAN as reference data), the FORESEE-HUN database and an additional bias-corrected database, newly created for this research (referred to as BC-HUCLIM in the following). The bias-correction was carried out by applying the internationally widely used percentile-based quantile mapping method on a monthly level using the most accurate, quality controlled HuClim dataset as a reference. Each database contains the simulations of 5 RCMs (CCLM, HIRHAM, RACMO, RCA, REMO) from the framework of EURO-CORDEX at a horizontal resolution of 0.11° (about 12.5 km). Two Representative Concentration Pathway (RCP) scenarios are used: RCP4.5 and RCP8.5, respectively.

Beside the assessment of the mean precipitation characteristics on different time scales, the following extreme precipitation-related climate indices are analyzed: wet days, very heavy precipitation days, frequency of at least 50 mm 5-day precipitation total, the highest daily precipitation sum and extremely wet days. According to our results, the mean annual precipitation is expected to increase by 10% on lowland areas and by 30% in mountainous areas on average under the RCP8.5 scenario by the end of the 21st century. In the Northern Mountains, the most pronounced changes are shown by BC-HUCLIM, and the raw and bias-corrected RCM simulations using MESAN project the smallest increase. Under the RCP4.5 scenario, the changes remain below 20% and negligible differences are found between the databases. The greatest increase in the annual number of very heavy precipitation days is expected by BC-HUCLIM for the far future in the south-western part of Hungary.

How to cite: Simon, C., Torma, C. Z., and Kis, A.: Projected changes of mean and extreme precipitation in Hungary: comparison of raw and bias-adjusted EURO-CORDEX simulations, EGU General Assembly 2025, Vienna, Austria, 27 Apr–2 May 2025, EGU25-6439, https://doi.org/10.5194/egusphere-egu25-6439, 2025.

EGU25-6558 | Orals | CL5.4

Effects of increasing spatial resolution towards convection permitting scales  in the Mediterranean area 

Maria Vittoria Struglia, Alessandro Anav, Marta Antonelli, Sandro Calmanti, Franco Catalano, Alessandro Dell'Aquila, Emanuela Pichelli, and Giovanna Pisacane

Similarly to weather forecasting techniques, climate projections also aim to achieve very high spatial and temporal resolutions, which are needed both as inputs to impact models and to perform reliable risk assessment studies. This is all the more true for the Mediterranean region and the Italian territory in particular, whose heterogeneous and complex morphology do affect the local climate (highly sensitive to global warming), making this area particularly vulnerable to hydrogeological risks, such as heavy rainfall, landslides and flooding with serious losses of both human lives and economic. We present the results of downscaling CMIP6 global climate projections to local scales for the Mediterranean and Italian regions, aiming to produce high-resolution climate information for assessing climate change signals, with a particular focus on small-scale phenomena and extreme events. We performed hindcast (i.e. ERA5-driven) and historical simulations (driven by the MPI-ESM1-2-HR model) to simulate the present (1980-2014) and future (2014-2100) climate under three different emission scenarios (SSP1-2.6, SSP2-4.5, SSP5-8.5). For each experiment, we used a double nesting approach to downscale global data first to a regional domain, covering the whole of Europe (EURO-CORDEX domain) with a spatial resolution of 15 km, and subsequently to a fine spatial scale domain centered over Italy and the north-western Mediterranean with a resolution of 5 km, (i.e. close to the convection permitting limit resolution).  We explore the effects of pushing the resolution to km-scale while still falling within the so-called “gray zone” (5-10 km), where deep convection can still be insufficiently resolved and a parameterization of the deep convection is still needed to fully represent it. We present the analysis of the most relevant Essential Climate Variables (ECVs), and the statistics of extreme events for both the current climate and for end of the century scenarios. Results highlight that the gray-zone model in the configuration here implemented mimics the behavior of a convection permitting model and improves the representation of the mean precipitation field over the entire domain. This improvement is also detectable for heavy precipitation, represented through high percentile of daily precipitation (p95 – p99). We show the multi-scenario projection of the climate signal for both the simulations on the common domain.

This study was carried out within: RETURN Extended Partnership and received funding from the European Union Next-GenerationEU (National Recovery and Resilience Plan – NRRP, Mission 4, Component 2, Investment 1.3 – D.D. 1243 2/8/2022, PE0000005);

ICSC Italian Research Center on High-Performance Computing, Big Data and Quantum Computing and received funding from the European Union Next-GenerationEU (National Recovery and Resilience Plan – NRRP, Mission 4, Component 2, Investment 1.4 – D.D: 3138 16/12/2021, CN00000013)

How to cite: Struglia, M. V., Anav, A., Antonelli, M., Calmanti, S., Catalano, F., Dell'Aquila, A., Pichelli, E., and Pisacane, G.: Effects of increasing spatial resolution towards convection permitting scales  in the Mediterranean area, EGU General Assembly 2025, Vienna, Austria, 27 Apr–2 May 2025, EGU25-6558, https://doi.org/10.5194/egusphere-egu25-6558, 2025.

EGU25-7307 | Orals | CL5.4

Regional winds over the Iberian Peninsula: evaluation and future projections from an ensemble of regional climate models 

Enrique Sanchez, Claudia Gutierrez, Noelia Lopez-Franca, María Ofelia Molina, William Cabos, Dmitry Sein, and Maria Ortega

This work investigates the capacity of several regional climate models to describe the main characteristics of Cierzo, Levante and Poniente, the main regional winds over the Iberian Peninsula, using as the evaluation period 1995-2011, by comparing them against reanalysis. For this purpose, regional wind classification algorithms have been proposed, based on previous detailed studies made. Then three models (REMO, MPIOM-REMO and CNRM-RCSM4) have been selected based their capability to describe those winds for present conditions, to inspect their projections for future climate conditions, under the RCP 8.5 emissions scenario (2006-2099), using MPI-ESM-LR and CRNM-CM5 as the forcing global models for them. Changes are obtained comparing them with the historical period (1950-2005) simulation results. Several results are obtained related to the sensitivity of resolution and parameterizations employed by the models. Thus, spatial resolution seems to be a key aspect to detect these winds, especially in terrestrial flows such as Cierzo. The internal physics of each model also causes increased variability for spatial resolutions larger than 10 kilometres. A low subdaily temporal resolution introduces inaccuracies in the calculation of regional wind events. The effect of using atmosphere-ocean coupled simulations does not show robust results, as it depends on the analzyed flows. In general, models are able to simulate historical frequencies of Cierzo events (100-130 days), Levante and Poniente (150-160 days), which is similar to what has been seen with observations and previous studies. Temporal trends shows that Cierzo extension could decrease by 1.5% of the valley in a statistically significant way by the end of the century. The results also indicate a strong increase of 10-20 annual Levante events depending on the model. Poniente wind shows a weakening of its characteristics for all models, specifically a decrease in the number of annual Poniente events by 5-20 days.

How to cite: Sanchez, E., Gutierrez, C., Lopez-Franca, N., Molina, M. O., Cabos, W., Sein, D., and Ortega, M.: Regional winds over the Iberian Peninsula: evaluation and future projections from an ensemble of regional climate models, EGU General Assembly 2025, Vienna, Austria, 27 Apr–2 May 2025, EGU25-7307, https://doi.org/10.5194/egusphere-egu25-7307, 2025.

EGU25-7692 | ECS | Posters on site | CL5.4

Assessing the Irrigation Impact in North China Plain Using Regional Climate Models with Dynamic Vegetation and Groundwater Pumping 

Yuwen Fan, Yadu Pokhrel, Jina Hur, and Eun-Soon Im

Intensive irrigation in the North China Plain (NCP) has raised significant environmental concerns. Recent research highlights the bidirectional and regional-dependent feedback between irrigation and climate, prompting studies that utilize regional climate models to assess these impacts in mesoscale. However, inconsistencies in results persist across current modeling efforts, particularly regarding summer precipitation and extreme heat. These discrepancies may arise from diverse model choices and inherent limitations in existing regional climate models, such as the lack of dynamic vegetation simulations, neglect of double cropping rotation,  omission of groundwater pumping, and inappropriate parameter selection for the NCP.

To address these challenges, we selected two widely used regional climate models: the Weather Research and Forecasting model version 4 with Noah-MP land surface model (WRF4 with Noah-MP) and the Regional Climate Model version 5 with Community Land Model (RegCM5 with CLM). We enhanced these two models to better simulate large-scale irrigation practices in the NCP by incorporating dynamic double-cropping vegetation, interactive irrigation, and groundwater pumping. Parameters were recalibrated using local data, and validation was conducted across hydrological, agricultural, and atmospheric sectors. The improved models allow for a comprehensive examination of the mutual feedback between irrigated crops and the atmosphere.

By comparing the outputs of these two enhanced models, we gain greater confidence in our conclusions regarding the irrigation impact on the NCP and its surrounding areas, particularly concerning the alterations to the hydrological cycle, groundwater depletion, and extreme weather events. Additionally, the differences in model results will elucidate the extent to which irrigation impacts are model-dependent and provide insights into the reasons for inconsistencies found in previous studies. Overall, our study enhances land representation and its coupling with regional climate models, offering valuable implications for future model development.

This study was supported by the Research Program for Agricultural Science & Technology Development (Project No. RS-2024-00399847) from the National Institute of Agricultural Sciences, Rural Development Administration, Republic of Korea.

How to cite: Fan, Y., Pokhrel, Y., Hur, J., and Im, E.-S.: Assessing the Irrigation Impact in North China Plain Using Regional Climate Models with Dynamic Vegetation and Groundwater Pumping, EGU General Assembly 2025, Vienna, Austria, 27 Apr–2 May 2025, EGU25-7692, https://doi.org/10.5194/egusphere-egu25-7692, 2025.

EGU25-7868 | ECS | Posters on site | CL5.4

Impacts of Spectral Nudging and Domain Size on Heavy Precipitation Simulations in Korea using a Convection-Permitting Model 

Dabeen Song, Eun-Soon Im, Daeun Kwon, Ga-Yeong Seo, and Seung-Ki Min

While the added value of Convection-Permitting Models (CPMs) in precipitation simulations compared to regional climate models with typical horizontal resolutions has been gradually recognized across various regions, systematic investigations of CPMs' ability to capture the major characteristics of extreme precipitation in South Korea remain limited. To address this gap, this study aims to develop a Weather Research and Forecasting (WRF)-based Convection-Permitting Model (CPM) with a 3 km horizontal resolution and to optimize its performance in reproducing historical extreme events by adjusting the domain size and turning spectral nudging on/off. For this purpose, we selected three record-breaking extreme rainfall cases in South Korea caused by quasi-stationary fronts. Using the peak date as the center, simulations are conducted for a total of 15 days, including a 7-day spin-up period both before and after the peak. We design three domains with expanding sizes, all centered over the Korean Peninsula with a uniform horizontal resolution of 3 km. Their differences in the lateral boundary conditions allow us to perform sensitivity tests to determine the optimal domain size and lateral boundaries for accurately reproducing heavy precipitation events. Their lateral boundary conditions derived from ECMWF-ERA5 reanalysis data at 6-hour intervals. In addition, we assess the effectiveness of spectral nudging by comparing the model performance with and without spectral nudging. A coefficient of 0.0003 s-1 is applied to winds above the planetary boundary layer, showing improvements in reproducing time-series, synoptic patterns, and vertical structures against observations. If the optimal configuration of the CPM contributes to reproducing extreme precipitation events over the Korean Peninsula, it will be helpful for understanding their physical mechanisms.


Acknowledgments

This study was supported by the Korea Meteorological Administration Research and Development Program under Grant RS-2024-00403386, Republic of Korea.

How to cite: Song, D., Im, E.-S., Kwon, D., Seo, G.-Y., and Min, S.-K.: Impacts of Spectral Nudging and Domain Size on Heavy Precipitation Simulations in Korea using a Convection-Permitting Model, EGU General Assembly 2025, Vienna, Austria, 27 Apr–2 May 2025, EGU25-7868, https://doi.org/10.5194/egusphere-egu25-7868, 2025.

EGU25-7875 | ECS | Posters on site | CL5.4

Quantifying the contribution of human activities to marine heatwaves around the Korean Peninsula using the WRF-ROMS regional coupled model 

Young-Hyun Kim, Dong-Hyun Cha, Woojin Cho, and Taehun Kang

Marine heatwaves (MHWs), prolonged periods of abnormally high ocean temperature, have more than doubled globally since the 1980s, with their frequency and intensity projected to increase further due to global warming, according to the Special Report on Ocean and Cryosphere in a Change Climate (SROCC). In particular, the Korean Peninsula has experienced noticeably more frequent and intense MHWs in recent years amidst ongoing climate change. To improve our understanding of these changes, this study quantitatively investigates the impact of human activities on the MHWs around the Korean Peninsula using Weather Research and Forecasting (WRF) and Regional Ocean Modeling System (ROMS) regional coupled models. To achieve this, we conduct control (CTL) and pseudo-NAT (NAT) experiments. The CTL experiment uses reanalysis data as the initial and boundary conditions of WRF and ROMS models. In contrast, the NAT experiment uses reanalysis data with anthropogenic influences removed. Anthropogenic influences are estimated as the difference between the Coupled Model Intercomparison Project Phase 6 (CMIP6) hist-nat simulation with natural forcing only and historical simulation with both natural and anthropogenic forcing over 1985–2014. Although the WRF and ROMS models tend to underestimate sea surface temperatures, they reasonably capture their spatial patterns, with higher temperatures in the order of Jeju Island, the South Sea, the West Sea, and the East Sea. Our findings reveal that anthropogenic forcing raised SSTs by approximately 0.3 to 0.6°C in the major waters of Korea. As a result, the frequency, intensity, duration, and spatial extent of MHWs have significantly increased in the major waters of Korea. These results highlight the critical role of human activities in driving recent changes in MHW characteristics around the Korean Peninsula and underscore the importance of mitigating anthropogenic climate change impacts.

How to cite: Kim, Y.-H., Cha, D.-H., Cho, W., and Kang, T.: Quantifying the contribution of human activities to marine heatwaves around the Korean Peninsula using the WRF-ROMS regional coupled model, EGU General Assembly 2025, Vienna, Austria, 27 Apr–2 May 2025, EGU25-7875, https://doi.org/10.5194/egusphere-egu25-7875, 2025.

The East Asian Summer Monsoon (EASM) presents a formidable challenge for regional climate modeling due to its intricate interactions between atmospheric dynamics, oceanic variability, and regional processes. This study explored how different Planetary Boundary Layer (PBL) and Cumulus Parameterization Schemes (CPS), alongside horizontal resolution, influence the simulation of EASM precipitation in 2022. Using the Weather Research and Forecasting (WRF) model, simulations were conducted over the CORDEX-East Asia domain at 12 km resolution with a nested 4 km domain, incorporating four distinct PBL-CPS combinations.

Comparisons with satellite and ground-based observations reveal that Multi-scale Kain-Fritsch (MSKF)-based schemes consistently outperform KIM Simplified Arakawa-Schubert (KSAS)-based schemes, offering more reliable representations of monsoon precipitation. High-resolution simulations more effectively capture localized terrain effects and convective processes. However, specific combinations, such as the Asymmetric Convective Model version 2 (ACM2)-KSAS, tend to overestimate convection in lower latitudes. Conversely, MSKF-based schemes exhibit reduced sensitivity to resolution changes and provide a more accurate representation of monsoon frontal progression. This highlights the critical role of parameterization choices in modulating large-scale monsoon dynamics and local-scale variability.

These findings offer valuable insights into the interactions between parameterizations, resolution, and large-scale monsoon processes, contributing to the enhancement of regional climate model performance. Moreover, this study emphasizes the importance of carefully optimized modeling strategies to improve EASM precipitation forecasts, particularly in the context of climate change and its influence on extreme events.

How to cite: Park, J., Cha, D.-H., and Lee, D.-K.: Influence of PBL-CPS Combinations and Resolution on the Simulation of East Asian Summer Monsoon Precipitation in 2022 Using WRF, EGU General Assembly 2025, Vienna, Austria, 27 Apr–2 May 2025, EGU25-8015, https://doi.org/10.5194/egusphere-egu25-8015, 2025.

EGU25-8019 | Orals | CL5.4

Impact of extreme high temperature on future photovoltaic potential over East Asia 

Changyong Park and Dong-Hyun Cha

The increasing frequency and intensity of extremely high temperatures anticipated in the future are likely to introduce greater uncertainty and complexity in the development of renewable energy policies. Countries in East Asia, located in the mid-latitudes, are particularly vulnerable to extreme climatic conditions intensified by global warming. Consequently, it is essential to assess recent trends in PVpot (Photovoltaic power potential) and project future changes under scenarios of extremely high temperatures, as temperature plays a critical role in determining solar panel efficiency. This study evaluates the impact of the increasing frequency and intensity of extremely high temperatures driven by global warming on current PVpot, utilizing high-resolution regional climate models over the East Asian domain.

Over the past 44 years, the PVpot associated with extremely high temperature days across East Asia has been consistently higher than the summer mean across all regions. Recent changes in PVpot for extremely high temperature days have shown increases in Korea, central China, southern China, and Japan, whereas no significant changes have been observed in the PV hotspot areas. However, the recent rise in the mean temperature of extremely high temperature days has contributed to a reduction in the proportion of these days occurring during high PVpot conditions across East Asia.

Future projections indicate that the East Asia-averaged summer mean PVpot and PVpot for extremely high-temperature days will decline under all scenarios and future periods. These decreases are expected to intensify toward the late 21st century, with a more pronounced reduction under the high-carbon emissions scenario compared to the low-carbon emissions scenario. Notably, by the mid-and late 21st century, the PVpot for extremely high temperature days is projected to decline significantly in hotspot areas, particularly in northern China and southern Mongolia.

How to cite: Park, C. and Cha, D.-H.: Impact of extreme high temperature on future photovoltaic potential over East Asia, EGU General Assembly 2025, Vienna, Austria, 27 Apr–2 May 2025, EGU25-8019, https://doi.org/10.5194/egusphere-egu25-8019, 2025.

EGU25-9326 | Orals | CL5.4

Current and future climate conditions over Canary islands and Madeira: an overview of two different km-scale COSMO-CLM simulations 

Marianna Adinolfi, Leo Luca Loprieno, Marie-Estelle Demory, Christian Zeman, and Christoph Schär

Islands, especially those with complex topography, are exceptionally vulnerable to climate change due to the dependency of their economies on climate-sensitive sectors like tourism and agriculture. These regions face significant challenges, including rising sea levels, tropical and extratropical cyclones, increasing temperatures, and shifting rainfall patterns. Despite these pressing threats, global climate models (GCMs) often lack the necessary resolution to capture the critical local processes that shape island climates. Similarly, conventional regional climate models (RCMs) frequently fall short in providing the robustness required to address the unique dynamics of these areas. This study seeks to explore two new km-scale regional climate simulations prepared through the European Climate Prediction project over the Madeira and Canary Islands, which are Portuguese and Spanish archipelagos located in the North Atlantic, off the African coast. The simulations are based on two models using different modelling approaches. One simulation was run by the Euro-Mediterranean Center on Climate Change (CMCC) Foundation with a horizontal grid spacing of around 3 km, based on a time slice approach. The RCM COSMO-CLM is used with a three-step nesting at 50, 25 and 3 km grid spacing based on a time-slice approach driven by a global climate model. The other simulation was run by the Swiss Federal Institute of Technology (ETH) in Zurich. The RCM COSMO-crCLIM is used with a two-step nesting at 12 and a grid spacing of around 1 km. This model was using the pseudo-global warming approach for the future-climate simulation, while the current-day simulations are driven by ERA-Interim reanalysis. Both models parameterize shallow convection, while the parameterization is switched off for deep convection. 

The analyses focus on the representation of hourly precipitation and temperature indices for the current and future climate: frequency, intensity, mean, and extreme values for the former, and mean and daily maximum values for the latter.

Although the modelling approaches are different, several findings are highlighted: (1) the use of km-scale simulation is essential to properly represent temperature and precipitation mean and extremes over small islands that are characterized by complex topography; (2) the projected changes in temperature and precipitation mean and extremes are qualitatively similar in all seasons except autumn; (3) the differences in the autumn projections are shown to be due to the large-scale driving conditions, which are different for the three simulations. The differences when comparing the signals between the two experimental designs might be related to the configuration of the respective forcing models and parameterizations. This suggests a careful selection of the former and opens up possible extensions of the analysis to other important factors. 

The results hope to set the cornerstone in filling an important gap for local climate services, highlighting the need for further coordinated kilometer-scale projections over regions of similar character, that are often neglected by large modelling initiatives. The presented work contributes to filling this gap for local policy makers, stakeholders and climate services. 

How to cite: Adinolfi, M., Loprieno, L. L., Demory, M.-E., Zeman, C., and Schär, C.: Current and future climate conditions over Canary islands and Madeira: an overview of two different km-scale COSMO-CLM simulations, EGU General Assembly 2025, Vienna, Austria, 27 Apr–2 May 2025, EGU25-9326, https://doi.org/10.5194/egusphere-egu25-9326, 2025.

EGU25-9361 | Posters on site | CL5.4

New CORDEX Flagship Pilot Study on Island processes in the Macaronesian Archipelagos (FPS-I-Mac): Objectives and challenges 

Juan P. Diaz, Esteban Rodríguez-Guisado, Maialen Iturbide, Jesus Fernandez, Marianna Adinolfi, Helena Vasconcelos, Maria Meirelles, Enrique Sánchez, Miguel Angel Gaertner, Daniel Argüeso, and Pedro M.M. Soares

Small islands, particularly those with complex topography and fragile economies reliant on climate-sensitive sectors like tourism and agriculture, are highly vulnerable to climate change. Challenges such as rising sea levels, tropical and extratropical cyclones, increasing temperatures, and shifting rainfall patterns significantly affect these territories. However, current global climate models (GCMs) lack the resolution needed to capture critical local processes essential for these regions. The “FPS on Macaronesian Archipelagos. Convection Permitting projections focused on island processes (FPS-I-Mac)” is a Flagship Pilot Study (FPS) initiative focuses on Macaronesia, an Atlantic region comprising the Azores, Madeira, Cape Verde, and the Canary Islands archipelagos.

Each archipelago exhibits unique climatic characteristics, influenced by its topography and geographical location. For instance, the Azores are the rainiest, while the Canary Islands are more influenced by continental air masses. All four archipelagos experience distinct annual cycles, with heavier rainfall during autumn and winter. Unlike other regions, intense summer convective rain is uncommon.

This communication presents the main objectives and challenges of this FPS: 

  • Investigate multiscale climatic processes and their interactions to improve climate projections in Macaronesia.
  • Assess the influence of sea surface temperature (SST) and aerosols in these oceanic regions.
  • Compare high-resolution simulations with standard-resolution models to evaluate their added value in extreme event analysis.
  • Create a shared database and produce ensembles of climate projections generated by different dynamical techniques (as models, empirical-statistical downscaling, hybrid techniques as emulators) tailored for Vulnerability, Impacts, and Adaptation (VIA) communities.
  • Foster collaboration between scientific communities and end-users.

Expected Impact are, between others: 

  • Enhanced understanding and modeling of climate in islands with complex topographies.
  • Reduction of uncertainties in 21st-century climate projections for the Macaronesian region.
  • Provision of accurate data for key sectors such as agriculture, health, energy meteorology, and risk management.
  • Strengthened synergies among stakeholders, promoting a fair ecological transition in these vulnerable regions.

The FPS aligns with CORDEX objectives by improving regional climate projections for small islands, which are underexplored in current studies. We will use different regional climate models (RCMs) at convection-permitting resolution, but also empirical-statistical downscaling (ESD), and hybrid strategies for high-resolution simulations, enabling detailed analysis of extreme events. Local and satellite observations associated with reanalysis products will validate these processes. By contributing to global discussions and integrating end-user needs from the outset, this initiative will support both local decision-making and broader climate research in the area during the next 5 years. The current team includes research groups from Portugal, Switzerland, Italy, and Spain, but it is open to new participants in different topics.

How to cite: Diaz, J. P., Rodríguez-Guisado, E., Iturbide, M., Fernandez, J., Adinolfi, M., Vasconcelos, H., Meirelles, M., Sánchez, E., Gaertner, M. A., Argüeso, D., and Soares, P. M. M.: New CORDEX Flagship Pilot Study on Island processes in the Macaronesian Archipelagos (FPS-I-Mac): Objectives and challenges, EGU General Assembly 2025, Vienna, Austria, 27 Apr–2 May 2025, EGU25-9361, https://doi.org/10.5194/egusphere-egu25-9361, 2025.

Increases in surface temperatures and changes in precipitation patterns due to climate change affect crop yields and require adaptation of agricultural systems. High-resolution climate data, especially precipitation, are critical for impact modelling in agriculture and difficult to obtain from general circulation models. Dynamical downscaling with regional climate models (RCM), such as the Weather and Research Forecasting (ARW/WRF) model, is widely used to generate such data. Despite their improvements, RCM rainfall simulations still contain biases that make it difficult, if not impossible, to use them directly in impact models. To address this, bias correction methods have been proposed to improve the performance of rainfall simulations, but they introduce additional sources of uncertainty (e.g. changes in the state of the climate regime) and remain controversial. These persistent problems in the RCM outputs are due to inherited biases in the forcing data, the limitations of the physical schemes and the downscaling protocol itself. The resolution and reliability of the ERA5 reanalyses lead us to compare one- and two-domain downscaling protocols to reproduce the local climate regime and variability over the main French agricultural production basins.

Both protocols share the Euro-Cordex geographical area as their first domain, while the second protocol adds another domain around France. The target grid cell resolution is 8 km. ERA5 reanalyses data forced the WRF parent domain every six hours along (1) the 1979-1985 period, (2) the yield-damaging summer drought of 2003, and (3) the low rainfall spring of 2011 for five agroclimatic zones in mainland France. Spectral nudging is applied only to the first domain, and subgrid-scale cloud-radiation interactions are activated. The study focuses on five agriculturally relevant variables: maximum and minimum temperatures (Tmax and Tmin), potential evapotranspiration (PET), and the annual amount and cycle of precipitation. These variables are critical for crop growth stages, irrigation management, and yield prediction.

The single-domain simulation, although computationally efficient (time, cost), overestimates summer precipitation, both in terms of amount and number of rainy days, and fails to capture drought events in croplands. In particular, this protocol produces more summer convective rain, associated with a higher summer cloud fraction than for the two-domain downscaling, particularly on low clouds. The two-domain downscaling performs better, accurately reproducing annual cycles, precipitation variability and the extreme 2003 drought, although it struggles with the less severe 2011 event. However, the two-domain downscaling amplifies positive biases in Tmax and PET, possibly due to overestimation of incoming shortwave radiation passing through reduced cloud cover and no nudging in the second domain. Bias correction for these variables may be necessary to avoid accelerated crop growth in impact models.

The performance of a direct downscaling of reanalyses to reproduce the local climate at less than 12 km (0.11°) over the Euro-CORDEX domain is questionable for territorial studies in Europe. Despite the limitations on Tmax and PET, the two-domain downscaling is a credible approach for agricultural studies and provides a reliable basis for analysing precipitation extremes and their impact on crops.

How to cite: Cournault, Q. and Castel, T.: Two domains vs single-domain ERA5 dynamical downscaling with WRF over Euro-Cordex improves precipitation hindcast: A 6-year case study over mainland France for agricultural studies, EGU General Assembly 2025, Vienna, Austria, 27 Apr–2 May 2025, EGU25-10200, https://doi.org/10.5194/egusphere-egu25-10200, 2025.

EGU25-10693 | ECS | Posters on site | CL5.4

From GCMs to RCMs: Consistency Assessment of Surface Water and Energy Fluxes 

Eleonora Cusinato, Christoph Braun, Hendrik Feldmann, Beate Geyer, Patrick Ludwig, Katja Trachte, and Joaquim G. Pinto

Understanding the interaction between energy and water fluxes at the atmosphere-surface interface is essential for advancing knowledge of climate dynamics and variability. This study evaluates the surface water (including soil moisture) and energy flux components, alongside air temperature, in global and regional climate model (GCM and RCM) simulations  applied in the NUKLEUS project (funded by the German Federal Ministry of Education and Research, BMBF). The analyses aim to enhance the understanding of the consistency of the process representation between RCMs and their driving global climate models.

In this study, biases are assessed for winter and summer between RCMs and their driving GCMs, using ERA5 as a reference to explore model behavior over both land and ocean. Historical and future climatologies under the SSP3-7.0 scenario are examined as well to explore climate change signal patterns. The work addresses two main research questions: (1) How consistent are biases between GCMs and RCMs? (2) Do GCMs and RCMs exhibit similar climate change signal patterns?

The study evaluates nine simulations: three GCMs from the CMIP6 framework (EC-Earth3-Veg, MIROC6, and MPI-ESM1-2-HR) and their corresponding downscaled simulations with two RCMs (COSMO-CLM6 and ICON-CLM, version 2.6.5). Analyses focus on the European domain at 12 km grid resolution, with detailed assessments of the Mediterranean and Mid-Europe regions, which represent different climate conditions.

Our results reveal partly low consistency in biases and climate change signal patterns across GCMs and RCMs, with significant variations both within and between models. These discrepancies are often seasonal- and variable-specific. Notably, the Mediterranean region exhibits stronger biases compared to Mid-Europe, particularly over oceanic areas. Contrary to expectations of bias propagation from GCMs to RCMs, the study identifies cases where biases are amplified or newly introduced in RCMs. This is particularly evident in MIROC6-driven simulations, where the RCMs react in a plausible way to strong biases of the sea surface temperature, inherited from the GCM.

In summary, this study provides a clearer understanding of biases in RCMs and their underlying causes. Furthermore, the study highlights the importance of assessing surface fluxes across different domains to fully capture the complexity of model performance and enhance the accuracy of future climate extreme projections.

How to cite: Cusinato, E., Braun, C., Feldmann, H., Geyer, B., Ludwig, P., Trachte, K., and Pinto, J. G.: From GCMs to RCMs: Consistency Assessment of Surface Water and Energy Fluxes, EGU General Assembly 2025, Vienna, Austria, 27 Apr–2 May 2025, EGU25-10693, https://doi.org/10.5194/egusphere-egu25-10693, 2025.

EGU25-11286 | ECS | Posters on site | CL5.4

Sensitivity of the Regional Climate Model MAR to Vegetation Dynamics in Forested Areas 

Thomas Dethinne, Nicolas Ghilain, Benjamin Lecart, Xavier Fettweis, and François Jonard

Climate change is having profound effects on forest ecosystems. Forests, as major carbon sinks, play a vital role in regulating the Earth’s climate. However, climate-induced disturbances threaten these ecosystems, creating feedback loops that exacerbate global warming. Monitoring vegetation dynamics and simulating future conditions are crucial for sustainable ecosystem management.

While global climate models or Earth System models (ESMs) are useful for large-scale assessments, they often fail to capture local phenomena. Regional Climate Models (RCMs), offer higher-resolution simulations but also face challenges in accurately representing biosphere-atmosphere interactions.

In this study, we explore the sensitivity of the Modèle Atmosphérique Régional (MAR) to vegetation changes to support the future coupling of MAR with the dynamic vegetation model CARAIB. We conducted multiple simulations by perturbing the MAR Leaf Area Index (LAI) input. The perturbations consist of varying scenarios of vegetation growth and decline and changes in dynamics by using MODIS satellite LAI observations varying weekly as input instead of fixed monthly climatology from MERRA2 reanalysis LAI data and applying Gaussian noise.

Our results show that the impact of LAI perturbations is non-linear, with distinct differences between increased and decreased vegetation. For instance, when vegetation was decreased by an average of 92%, evapotranspiration (ET) rates dropped by 83.4%. In contrast, a scenario with a 178.4% increase in LAI showed less drastic changes, with an increase of 29.8%. This behavior of the model suggests an asymmetric response to vegetation perturbations.
Further analysis highlighted how MAR simulates daily ET when used with an observed LAI instead of a climatology. The study reveals a moderate correlation between MAR ET and observation data (r²=0.37) overall with MAR performing slightly better during drought conditions (r²=0.38) than in moist periods (r²=0.36). The model tends to underestimate ET in drought conditions and often overestimates it during moist periods.

These findings provide valuable insights into the influence of vegetation dynamics on regional climate simulations. They emphasize the importance of accounting for vegetation-climate interactions in RCMs to improve local-scale predictions and understand feedback mechanisms under various climate scenarios.

How to cite: Dethinne, T., Ghilain, N., Lecart, B., Fettweis, X., and Jonard, F.: Sensitivity of the Regional Climate Model MAR to Vegetation Dynamics in Forested Areas, EGU General Assembly 2025, Vienna, Austria, 27 Apr–2 May 2025, EGU25-11286, https://doi.org/10.5194/egusphere-egu25-11286, 2025.

EGU25-11692 | ECS | Orals | CL5.4

Exploring Summer Compound Heatwaves in North Africa: Insights from Reanalysis and RCMs 

Khadija Arjdal, Fatima Driouech, and Saloua balhane

Climate hazards triggered by extreme events have recently gained growing attention due to their potential socioeconomic and environmental risks (Luo et al., 2022).  Heatwaves can be categorized into: those occurring only during the day, only at night, and those encompassing both day and night. Although prior studies have extensively explored the independent heatwaves, the compound day-night events and related atmospheric conditions remain underexplored, in particular over North Africa. 

This study focuses on analyzing summer compound heatwaves (CHW) in North Africa as represented by ERA5 and the CORDEX-CORE ensemble of regional climate models (RCMs) data in the historical period (1979–2005). According to reanalysis data, CHWs predominantly occur over Morocco, except in the Atlas mountains, as well as in eastern Algeria and Egypt, with an annual average of approximately one event per year lasting 3 to 4 days. The CORDEX-CORE multimodel mean shows CHWs across most of the region, with the exception of the Atlas mountains. RCMs multimodel gives a relatively higher annual duration ranging from 4 to 7 days and a frequency, averaging 1.5 events per year.

Our composite diagnostic analyses of near-surface variables suggest that compound heatwaves are associated with increased solar radiation and clear sky during daytime, combined with an increase in the downward longwave radiation along with the specific humidity during the night. In fact, the increased water vapor during the night enhances the absorption of outgoing longwave radiation and increases the re-emission of longwave radiation back to the surface (Luo et al.,2022; Wu et al., 2023), contributing to nighttime surface warming. The composite of geopotential height at mid-troposphere (500 hPa) and upper-troposphere (200 hPa) show pronounced positive anomalies, associated with extreme daytime and nighttime temperatures during compound heatwaves especially on coastal areas. 

The wider spatial distribution of events identified in the multimodel ensemble compared to the reanalysis can be attributed to the overestimation of downward solar radiation in the RCMs across the entire region, in contrast to ERA5 where positive solar radiation anomalies are more localized in coastal areas. A similar pattern is also observed in the specific humidity.


References: 

Luo, M., Lau, N.-C. & Liu, Z. Different mechanisms for daytime, nighttime, and compound heatwaves in Southern China. Weather Clim. Extremes 36, 100449 (2022).

Wu, S., Luo, M., Zhao, R. et al. Local mechanisms for global daytime, nighttime, and compound heatwaves. npj Clim Atmos Sci 6, 36 (2023). https://doi.org/10.1038/s41612-023-00365-8

How to cite: Arjdal, K., Driouech, F., and balhane, S.: Exploring Summer Compound Heatwaves in North Africa: Insights from Reanalysis and RCMs, EGU General Assembly 2025, Vienna, Austria, 27 Apr–2 May 2025, EGU25-11692, https://doi.org/10.5194/egusphere-egu25-11692, 2025.

EGU25-12420 | ECS | Posters on site | CL5.4

Projected Changes in Severe Storm Environments in the Eastern Mediterranean: A Convective Permitting Simulation Approach 

Onur Hakan Doğan, Barış Önol, Abdullah Kahraman, and Mikdat Kadıoğlu

Due to the ongoing climate change, there has been an observed increase in atmospheric and sea surface temperatures. This has led to a rise in the frequency of extreme weather events, including excessive precipitation and tornadoes. This study aims to examine the potential changes in extreme weather cases that will amplify their effects, specifically during November, in the Eastern Mediterranean, one of the two regions in Europe most affected by climate change. The analysis is planned to be carried out with the help of high-resolution simulations produced by the numerical weather model WRF-ARW using CMIP6 MPI-ESM1.2 projections. Initially, the months of November with a significant potential for extreme weather events were identified within the MPIESM1.2 global model projection using the SeveR index, a metric designed to estimate the likelihood of severe storm environments characterized by convective rainfall. A series of high-resolution simulations were produced for November in the years 2039, 2057, 2069, 2077, 2079, 2082, and 2097 identified as having high extreme weather potential based on SeveR index. To compare these simulations with the climatic conditions of the November months from 2004 to 2014, additional simulations were produced. A detailed analysis of the monthly total precipitation for November revealed that the highest estimated total precipitation amounts were 683.5 mm and 680.2 mm in Rize Çayeli in 2039 and 2097, respectively, and 959.1 mm and 614.6 mm in Muğla Köyceğiz in 2057 and 2079, respectively. Notably, the mountainous region west of Crete was predicted to accumulate 1,397.7 mm and 598.3 mm in 2077 and 2082, respectively. Additionally, 555.1 mm was predicted to accumulate over the sea off the coast of Antalya Kumluca in 2069. Conversely, an analysis of the reference years demonstrated that 2008 and 2014 were the wettest years. In 2008, the maximum monthly total precipitation was predicted to be 933.4 millimeters in Gazipaşa, Antalya. In 2014, 1224.8 millimeters of rainfall were forecasted in Arta, Greece. A detailed analysis of future daily maximum rainfall amounts reveals a prediction of 184.2 millimeters of rainfall over the sea south of Rhodes Island on November 19, 2097, and 237.3 millimeters over the sea in the northeast of Crete on November 24, 2077. Finally, on November 25, 2069, 144.4 millimeters of daily precipitation was predicted in the mountainous region in the western part of Crete. In addition to precipitation patterns, a comprehensive examination of wind speeds reveals that, according to the simulation for November 2077, a maximum wind speed of 59.3 m/s is predicted in the southwest of Crete. 

How to cite: Doğan, O. H., Önol, B., Kahraman, A., and Kadıoğlu, M.: Projected Changes in Severe Storm Environments in the Eastern Mediterranean: A Convective Permitting Simulation Approach, EGU General Assembly 2025, Vienna, Austria, 27 Apr–2 May 2025, EGU25-12420, https://doi.org/10.5194/egusphere-egu25-12420, 2025.

EGU25-12824 | Posters on site | CL5.4

Performance of the PolarRES and Arctic CORDEX regional climate ensemble 

Priscilla Mooney, Chiara de Falco, Alok Samantaray, Willem Jan van de Berg, John Cassano, Christiaan van Dalum, Xavier Fettweis, Ella Gilbert, Clara Lambin, Oskar Landgren, Jan Landwehrs, Heidrun Matthes, Ruth Mottram, Andrew Orr, and Annette Rinke

Within the Horizon 2020 project PolarRES, a new ensemble of regional climate simulations has been developed using the latest generation of regional climate models (RCMs) for the Arctic. These state-of-the-art RCMs downscale the ERA5 reanalysis over the period 2001-2020, covering the entire Arctic region at a grid spacings of approximately 12km. Furthermore, all simulations follow the Polar CORDEX protocol for the next generation of regional climate projections of the polar regions. This new ensemble of high-resolution climate simulations offers considerable opportunities to advance our understanding of the present-day climate of the Arctic. However, a first step to realising this potential is to evaluate the performance of the regional climate models, highlighting their strengths and limitations. This is also necessary for understanding and interpreting the future projections that will be generated by these RCMs using a novel storylines approach to downscale CMIP6 models.

The work presented here will focus on the simulations of the present-day climate driven by the ERA5 reanalysis. As part of the evaluation process, a clustering technique is applied to reanalysis data to identify regions with similar annual and seasonal characteristics of surface temperature and precipitation. This approach allows for a better understanding of the regional climates of the Arctic, provides a more physically consistent basis for model evaluation, and eases the investigation of model deficiencies in simulating regional scale forcings. This work will focus on the regionalisation of the Arctic for model evaluation and present preliminary results of the application of this regionalisation to the aforementioned Arctic climate simulations.

How to cite: Mooney, P., de Falco, C., Samantaray, A., van de Berg, W. J., Cassano, J., van Dalum, C., Fettweis, X., Gilbert, E., Lambin, C., Landgren, O., Landwehrs, J., Matthes, H., Mottram, R., Orr, A., and Rinke, A.: Performance of the PolarRES and Arctic CORDEX regional climate ensemble, EGU General Assembly 2025, Vienna, Austria, 27 Apr–2 May 2025, EGU25-12824, https://doi.org/10.5194/egusphere-egu25-12824, 2025.

EGU25-12846 | Orals | CL5.4

Performance of the Arctic CORDEX simulations over land analysed from comparison with in situ observations 

Heidrun Matthes, Priscilla Mooney, Chiara de Falco, Ruth Mottram, Jan Landwehrs, Annette Rinke, Xavier Fettweis, Clara Lambin, Ella Gilbert, Willem Jan van de Berg, Christiaan van Dalum, and Oskar Landgren

The current phase of Arctic CORDEX, facilitated by the PolarRES project, provides an ensemble of five regional climate models downscaling two CMIP6 global climate simulations selected using a novel storyline approach. The simulations are provided by MAR (University of Liège), ICON (Alfred Wegener Institute), RACMO (University of Utrecht), HCLIM (Metrological Institute of Norway) and WRF (NORCE Norwegian Research Centre). The models provide a hindcast simulation driven by ERA5 data for the period 2001-2020 and scenario simulations for the period 1985-2100 driven by global CNRM-ESM2-1 and NorESM2-MM simulations.

We use the Global Summary of the Day (GSOD) land station data set to analyse the performance of the regional models for five different variables: daily minimum, mean and maximum temperature, daily mean wind speed and daily mean sea level pressure. We use percentiles of seasonal distributions as a measure of comparison, as well as direct comparison of daily time series between models and observations. For precipitation, we use the Global Historical Climate Network land station dataset to analyse model performance based on seasonal mean precipitation. 

In the ERA5-driven hindcast simulations, averaged daily root mean square errors show high agreement with station data for both daily mean wind speed (below 2.5 m/s) and daily mean sea level pressure (below 4 hPa), with similar performance for all seasons and percentiles. Except for MAR, temperatures deviate less than 3 K, with the best performance in summer and autumn. The comparison of the percentiles between the ERA5-driven simulations and the averaged daily root mean square errors are in broad agreement.

The ERA5-driven simulations clearly outperform the GCM-driven simulations for all percentiles, seasons and variables in all models for temperature, wind speed and sea level pressure. However, the GCM-driven simulations also outperform the GCMs themselves, again for all percentiles, seasons and variables. Neither the bias patterns of the ERA5-driven simulations nor the bias patterns of the GCMs themselves translate directly into the bias patterns of the GCM-driven RCM simulations, highlighting the added value of the regional simulations. Comparing the pan-Arctic performance of the RCMs, we find that for temperature and mean sea level pressure, the 10th percentile is most often the worst fit compared to observations, with an improvement in performance towards the 90th percentile, independent of forcing, in autumn, winter and spring. For wind speed, however, performance is most often best at the 10th percentile and declines towards the 90th percentile.

For precipitation, the ERA5-driven simulations also tend to be closer to the observations than the GCM-driven simulations, but there are exceptions. For example, in autumn, the NorESM-driven WRF simulation outperforms the ERA5-driven simulation, and the CNRM-driven MAR simulation also outperforms the ERA5-driven MAR simulation.

How to cite: Matthes, H., Mooney, P., de Falco, C., Mottram, R., Landwehrs, J., Rinke, A., Fettweis, X., Lambin, C., Gilbert, E., van de Berg, W. J., van Dalum, C., and Landgren, O.: Performance of the Arctic CORDEX simulations over land analysed from comparison with in situ observations, EGU General Assembly 2025, Vienna, Austria, 27 Apr–2 May 2025, EGU25-12846, https://doi.org/10.5194/egusphere-egu25-12846, 2025.

EGU25-13820 | ECS | Orals | CL5.4

Extreme Precipitation Scaling with Temperature in the Alpine region for historical and future CORDEX-FPS simulations 

Luna Santina Lehmann, Erich Fischer, Christoph Schär, and Reto Knutti

Recent studies have highlighted the intensification of heavy precipitation events in a warming climate, particularly over orographically complex regions such as the Alps. This study builds on our previous work, which analyzed precipitation scaling rates in kilometer-scale convection-permitting climate models (CPMs) with respect to the Clausius–Clapeyron (CC) relation. Here, we first investigate whether hourly precipitation extremes consistently follow the expected CC scaling in the Alpine region or show deviations indicative of super-CC behavior. Second, we assess the regional variability of precipitation scaling by examining four subdomains in the Greater Alpine Region, each characterized by distinct topographical features and climatic regimes. Third, we explore whether and how present-day observations can be extrapolated into the future.

To address these questions, we use a ten-year, multi-model ensemble of kilometer-scale CPM simulations from the CORDEX-FPS over the Greater Alpine Region, with resolutions of approximately 2.2 to 4 km. This high resolution is crucial for accurately capturing convective processes and extreme events in mountainous terrain. We condition hourly precipitation on local daily temperature within a 25 km radius.

We find that the models in the ensemble show consistent scaling rates in the ERA-Interim–driven evaluation runs. Comparing historical simulation runs to future simulations reveals regional differences in the shift of precipitation scaling curves. Our findings provide insights into the physical drivers of precipitation scaling rates, and the results suggest that local scaling rates can be used to approximate future changes in heavy precipitation.

How to cite: Lehmann, L. S., Fischer, E., Schär, C., and Knutti, R.: Extreme Precipitation Scaling with Temperature in the Alpine region for historical and future CORDEX-FPS simulations, EGU General Assembly 2025, Vienna, Austria, 27 Apr–2 May 2025, EGU25-13820, https://doi.org/10.5194/egusphere-egu25-13820, 2025.

Regional Climate Models (RCMs) are dependent on boundary conditions provided by Global Climate Models (GCMs). A significant challenge in regional climate modelling is the "Garbage in – garbage out" problem. Specifically, if the input boundary conditions from a GCM are unrealistic, the RCM cannot rectify this and will consequently produce inaccurate results. While we can avoid using unrealistic GCMs, this issue is critical as all GCMs, even the best performing, exhibit biases. Here we explore whether bias correction of GCM boundary conditions can mitigate this problem and enhance RCM simulations.

In this presentation, we provide evidence that bias correction of boundary conditions leads to improved RCM simulations. We investigate the impact of various bias correction techniques including multivariate bias correction, the role of the relaxation zone in propagating these corrections to the interior of the domain, the importance of maintaining physical consistency within the boundary conditions, and the impact of sub-daily corrections. Our findings demonstrate that corrected boundary conditions enhance multiple aspects of the simulated climate, including the mean climate, extremes, compound events, and synoptic systems. It is worth noting that even with these enhancements, errors in the simulated climate remain, and continued improvements in global and regional climate models are required to produce the most useful and reliable climate projections.

How to cite: Evans, J., Kim, Y., and Sharma, A.: Enhancing Regional Climate Model Simulations through Bias Correction of Global Climate Model Boundary Conditions, EGU General Assembly 2025, Vienna, Austria, 27 Apr–2 May 2025, EGU25-13856, https://doi.org/10.5194/egusphere-egu25-13856, 2025.

EGU25-14486 | Posters on site | CL5.4

The impact of soil texture on hydrological processes in South Korea based on WRF-Hydro simulations 

Subin Kang, Pamela Sofia Fabian, Eun Soon Im, and Hyun-Han Kwon

The accurate estimation of soil texture is crucial as it significantly impacts soil moisture and other hydrological variables. While the Weather Research and Forecasting Hydrological Extension (WRF-Hydro) model is a useful tool for investigating various aspects of hydrological processes and their interactions with the atmosphere, the default soil map provided by USGS and MODIS exhibits potential issues associated with coarse resolution and limited accuracy. To address this deficiency, this study conducts a series of sensitivity experiments that consider additional data sources or alternative soil mapping approaches within WRF-Hydro model framework. A comparative analysis is performed by focusing on hydrological variables such as soil moisture and runoff. The study will enhance our understanding of how changes in soil properties influence key hydrological processes and shed light on the impact of diverse soil conditions on the robustness of simulation results.

[Acknowledgment]

This work was supported by Korea Environment Industry & Technology Institute(KEITI) through Water Management Program for Drought, funded by Korea Ministry of Environment(MOE) (2480000175).

How to cite: Kang, S., Fabian, P. S., Im, E. S., and Kwon, H.-H.: The impact of soil texture on hydrological processes in South Korea based on WRF-Hydro simulations, EGU General Assembly 2025, Vienna, Austria, 27 Apr–2 May 2025, EGU25-14486, https://doi.org/10.5194/egusphere-egu25-14486, 2025.

EGU25-14880 | ECS | Orals | CL5.4

High-resolution regional climate modeling of coastal jets and their future evolution in the Peruvian Upwelling System 

Adolfo Chamorro, Francois Colas, Vincent Echevin, and Jorge Tam

Coastal jets, characterized by wind maxima at low atmospheric levels, are a prominent feature of Eastern Boundary Upwelling Systems (EBUS) and play a crucial role in regional ocean dynamics and climate. These jets significantly affect environmental processes and human activities, particularly in marine ecosystems and fisheries. Despite their importance, the coastal jet in the Peruvian Upwelling System remains one of the least studied phenomena within EBUS.

This study employs high-resolution (7 km) regional climate simulations using the Weather Research and Forecasting (WRF) model to analyze the characteristics of coastal jets off the coast of Peru. We performed a retrospective simulation for the period 1994–2003, driven by NCEP2 reanalysis data, to characterize the baseline conditions of coastal jets in terms of their frequency of occurrence, intensity, vertical structure, and directional patterns. The identification of coastal jets was based on a detailed analysis of vertical wind and temperature profiles, focusing on wind speed maxima at low atmospheric levels and their association with upwelling events and coastal features. The vertical profiles of wind and temperature were examined at multiple altitudes (from 10 m to 1000 m a.s.l.) to determine the spatial distribution, intensity, and vertical extent of these jets.

In addition to the retrospective analysis, we conducted future climate projections for the period 2086–2095 under the RCP8.5 climate change scenario. The future simulations were forced with climate change signals derived from the CMIP5 ensemble, which includes the differences between monthly mean climatologies for the periods 2080–2100 and 1989–2009. These climate change forcings were added to the NCEP2 reanalysis data to simulate future atmospheric conditions. The future projections focus on the potential changes in the frequency, intensity, and altitude of coastal jets, as well as shifts in their seasonal patterns and directional tendencies.

Results indicate that coastal jets occur year-round, with variations in frequency and spatial distribution. In summer, jets are more frequent and concentrated near the coastline, with intensities between 8 and 10 m.s⁻¹ and altitudes ranging from 200 to 300 m a.s.l. In contrast, winter coastal jets are less frequent but cover larger areas, with intensities between 9 and 11 m.s⁻¹ and altitudes of 400–500 m a.s.l. The predominant direction of the jets is south-southeast, parallel to the coastline, throughout the year, except in winter when significant occurrences are also observed from the southeast.

Under the climate change scenario, the frequency of coastal jets is projected to increase, particularly along the northern and central coasts of Peru. A notable increase of up to 20% in frequency is expected during June, July, August, September, and October, especially north of the Paracas Peninsula (14°S). While the intensity of the jets remains largely unchanged, the vertical distribution of coastal jets is expected to shift, with a tendency towards lower altitudes in future projections.

How to cite: Chamorro, A., Colas, F., Echevin, V., and Tam, J.: High-resolution regional climate modeling of coastal jets and their future evolution in the Peruvian Upwelling System, EGU General Assembly 2025, Vienna, Austria, 27 Apr–2 May 2025, EGU25-14880, https://doi.org/10.5194/egusphere-egu25-14880, 2025.

Cities play a fundamental role in climate at local to regional scales through modification of heat and moisture fluxes, as well as affecting local atmospheric chemistry and composition, alongside air-pollution dispersion. Vice versa, regional climate change impacts urban areas and is expected to increasingly affect cities and their citizens in the upcoming decades. Simultaneously, the share of the population living in urban areas is growing and is projected to reach about 70 % of the world population by 2050. This is especially critical in connection to extreme events, for instance, heat waves with extremely high temperatures exacerbated by the urban heat island effect, in particular during night-time, with significant consequences for human health. Thus, cities are becoming one of the most vulnerable environments under climate change.

Additionally, from the perspective of recent regional climate model development with increasing resolution down to the city scale within convection permitting RCMs, proper parameterization of urban processes plays an important role to understand local/regional climate change. The inclusion of the individual urban processes affecting energy balance and transport (i.e. heat, humidity, momentum fluxes, emissions) via special urban land-surface interaction parameterization of local processes becomes vital to simulate the urban effects properly. This will enable improved assessment of climate change impacts in cities and inform adaptation and/or mitigation options, as well as adequately prepare for climate-related risks (e.g. heat waves, smog conditions, etc.). Actually, IPCC is preparing the Special Report on Cities and Climate Change in 7th assessment cycle, where these aspects will be considered.

We introduced this topic to the CORDEX platform, within the framework of so-called flagship pilot studies on challenging issues and gaps in regional climate change knowledge. The main aims and progress of this activity will be presented, especially an analysis of Stage-0 experiments using case studies of heat wave and convection episode within ensemble simulations for City of Paris with convection permitting RCMs from different groups over the world. Further outlook with preliminary results will be presented as well for long term (10 years) climate simulation with these models, in common strategy to IMPETUS4CHANGE Horizon Europe Project.

How to cite: Halenka, T., Langendijk, G., and Hoffmann, P.: CORDEX Flagship Pilot Study URB-RCC: Urban Environments and Regional Climate Change – Where We Are and Where We Are Going, EGU General Assembly 2025, Vienna, Austria, 27 Apr–2 May 2025, EGU25-15667, https://doi.org/10.5194/egusphere-egu25-15667, 2025.

EGU25-15839 | ECS | Posters on site | CL5.4

Evaluation of Minimum and Maximum Temperatures in Convection-Resolving Climate Models (CORDEX-FPS Convection) 

Isabella Kohlhauser, Alzbeta Medvedova, Douglas Maraun, and Nikolina Ban

In the evaluation of high-resolution climate model output, most research focuses on the variables and time-scales where added value is usually expected, e.g. short-term precipitation extremes. Simple temperature characteristics such as means of minimum and maximum temperatures are rarely evaluated, even though shortcomings in the representation of temperature might negatively influence multiple physical processes in the models.

In our research we analyse the representation of minimum and maximum temperatures in convection-resolving models in Austria. We make use of the ERA-Interim driven CORDEX-FPS Convection ensemble in the period 2000-2009, covering the greater Alpine region, and compare it against several available observation-based datasets - ERA5, EOBS, EMO-5 and SPARTACUS. 

Using the Austrian climate dataset SPARTACUS as the main reference, we compute the seasonal means of maximum and minimum temperatures and identify season dependent biases. We find notable differences between the CORDEX-FPS simulations and SPARTACUS, however the observations exhibit a certain spread as well. While maximum temperatures are underestimated in winter and spring, minimum temperatures are overestimated in summer and autumn. Consequently, we find that the diurnal temperature range is underestimated throughout the year. We presume that these biases are caused by parameterizations of radiation and cloud-related properties.

Additionally, we investigate the elevation-temperature relationship in the model ensemble and the observations. We identify an elevation-dependent bias in the convection-resolving models for both minimum and maximum temperatures. The difference between the model ensemble and SPARTACUS becomes more negative with higher elevations. As a consequence, the near-surface temperature lapse rate is constantly overestimated in the model ensemble. We assume this might be caused by inadequate parameterizations as well, and potentially the representation of the annual snow cover.

We explore the correlations between the aforementioned properties and parameterized processes like radiation and cloud cover, in order to get a deeper understanding of the physical processes in the models.

How to cite: Kohlhauser, I., Medvedova, A., Maraun, D., and Ban, N.: Evaluation of Minimum and Maximum Temperatures in Convection-Resolving Climate Models (CORDEX-FPS Convection), EGU General Assembly 2025, Vienna, Austria, 27 Apr–2 May 2025, EGU25-15839, https://doi.org/10.5194/egusphere-egu25-15839, 2025.

EGU25-15870 | ECS | Orals | CL5.4

What do warming-adjusted CORDEX RCM projections tell us about climate change in central Europe? 

Stefanie Börsig, Dominik L. Schumacher, Mathias Hauser, and Sonia I. Seneviratne

The majority of CORDEX RCMs show an underestimation of historical warming compared to observations, as well as an underestimation of projected warming compared to global climate models. This is in part due to a lack of consideration of changing aerosol concentrations, with a particularly strong effect in Europe leading to a delayed warming. We have developed a new method to address this issue and present the results of the warming-adjusted data. The method adjusts the CORDEX RCM simulations by using a mapping based on large scale warming with only few parameters and minimal interventions, preserving time monotony. The impact of the method is strongest for high emission scenarios but can be demonstrated for all emission scenarios.

An application is shown for a central European region and within this framework we analyze adjusted climate projections. Compared to global climate model experiments, warming-adjusted RCM simulations better capture fine-scale details such as complex orography, yet – by design – feature the same overall temperature evolution across Western Europe. The presented method could also be useful for CORDEX projections for other regions and can provide information for upcoming assessment reports.

How to cite: Börsig, S., Schumacher, D. L., Hauser, M., and Seneviratne, S. I.: What do warming-adjusted CORDEX RCM projections tell us about climate change in central Europe?, EGU General Assembly 2025, Vienna, Austria, 27 Apr–2 May 2025, EGU25-15870, https://doi.org/10.5194/egusphere-egu25-15870, 2025.

The intensification of the water cycle with climate change not only affects hydroclimatic extremes but also water resources, i.e., water availability, with implications for natural and managed systems, including agricultural, industrial and domestic water use. As part of the ongoing Coordinated Regional Downscaling Experiment European initiative (EURO-CORDEX) downscaling CMIP6 GCMs, we contribute with the fully coupled TSMP1 to the EURO-CORDEX regional climate model ensemble. TSMP1 consists of the atmospheric model COSMO, the Community Land Model, and the integrated hydrologic model ParFlow, connected through the OASIS3-MCT coupler. TSMP1 simulates the complete terrestrial water cycle from the groundwater (down to -60m) to the atmosphere. We show initial results from a transient climate run from 1950 to 2100, downscaling the MPI ESM1.2-HR CMIP6 GCM historical and SSP1-2.6 and SSP3-7.0 scenarios over the 12km pan-European CORDEX domain (EUR-12). Simulations are aligned with the CORDEX-CMIP6 simulation protocol and further extend the balanced GCM-RCM matrix. We investigate the future evolution of essential variables related to the terrestrial water cycle, such as the total water storage, groundwater recharge, and water table depth for 30-year mid- and end-of-the-century time slices over PRUDENCE regions. Past hydroclimatic extremes, decadal variability, and future trends are well reflected in the TSMP1 groundwater to top-of-atmosphere representation, which provides physically consistent 4D images of the coupled terrestrial water and energy cycles.

How to cite: Goergen, K., Poll, S., Zhang, Y., and Kollet, S.: Future evolution of European terrestrial water resources in the groundwater-to-atmosphere regional climate system model TSMP1, EGU General Assembly 2025, Vienna, Austria, 27 Apr–2 May 2025, EGU25-17892, https://doi.org/10.5194/egusphere-egu25-17892, 2025.

EGU25-17903 | Orals | CL5.4

Stakeholder relevant hazard indicators in regional climate models from the EU-Impetus4Change project 

Stephen Outten, Francesca Raffaele, Natalia Zazulie, Silius Mortensønn Vandeskog, and Stefan Sobolowski

Extreme events cause great financial loss and loss of life across Europe every year, and while the impacts of these events are increasing due to society’s increasing exposure, the hazardous events themselves are projected to change. Accurate projections of these changes are invaluable for the stakeholders responsible for preparing the European cities to withstand future extreme events. They are also of great value and interest to many industries which are heavily exposed to the impacts of extreme events, including insurance, construction, and energy. However, any adaptation requires information that is tailored to the needs and workflow of the decision makers.

In the EU-funded Impetus4Change (I4C) project, we worked with stakeholders to select hazard indicators that are directly applicable to their ongoing work in adapting to climate change in four major European cities. The cities, Barcelona, Paris, Prague and Bergen, were selected because they face different hazardous events and represent a wide range of climates across Europe. There are 19 indicators in total, which primarily focus on extreme temperatures and precipitation, but which also include indices on drought and fire weather. These indicators have now been calculated in 67 models from the 0.11° simulations of EURO-CORDEX, covering all of Europe for the period of 1980 to 2100. They have also been calculated in numerous available convection-permitting simulations over sub-domains of Europe, at the higher horizontal resolution of 3 km. These indices are analyzed for both their changes over the timeseries but also at Global Warming Levels of 1, 1.5, 2, 3, and 4 degrees. In this talk we will present the first analysis of selected indices for the European domain. The full dataset of these indices is planned to be made openly available through an online, user-friendly toolkit as part of the I4C project.

How to cite: Outten, S., Raffaele, F., Zazulie, N., Vandeskog, S. M., and Sobolowski, S.: Stakeholder relevant hazard indicators in regional climate models from the EU-Impetus4Change project, EGU General Assembly 2025, Vienna, Austria, 27 Apr–2 May 2025, EGU25-17903, https://doi.org/10.5194/egusphere-egu25-17903, 2025.

EGU25-18283 | Orals | CL5.4

Projected changes of tourism comfort in northern Spain under climate change 

Ana Casanueva, Francisco Conde-Oria, Joaquín Bedia, and Domingo F. Rasilla-Alvarez

Cantabria, a region in the north of Spain, known for offering the possibility of skiing and enjoying the beach in less than an hour, has experienced a remarkable growth in tourism in the last 15 years. Although the region only accounts for 1.80% of tourists in Spain, such an influx is remarkable in relation to its size (1.05% of the national territory) and population (approximately 1.23% of the country's population), and the arrival of tourists has a considerable impact on its local economy. Most visitors are nationals, attracted by a mild climate, green landscapes and numerous natural resources. For that reason, attendance displays a clear seasonality, also conditioned by the official holiday schedule, which concentrates most of the visitors in late summer and other key dates, such as Easter. This concentration at specific times of the year, in a context of climate change, poses challenges for the well-being of visitors and the management of tourism infrastructures.

The objective of this study is to analyze the changes in tourists' comfort under different global warming scenarios of up to 4°C through the calculation of a well-known bioclimatic index such as the Universal Thermal Climate Index (UTCI). For this purpose, projected daily climate data of temperature (maximum and minimum values), wind speed, solar radiation and relative humidity have been used through several simulations from Regional Climate Models (RCMs) driven by several General Circulation Models (GCMs). These simulations, belonging to the CORDEX initiative, represent the largest data set available for Europe at a spatial resolution of approximately 12.5 km. Due to the systematic biases in the models, a bias correction method has been applied using ERA5-Land as observational reference. 

The results reveal significant changes in tourists’ comfort compared to the historical period, mainly associated with the increase in temperatures. Although variations in other climatic variables are also observed, these are less marked and/or have a lesser effect on comfort. Some specific examples are presented in key tourist locations in the region, related to both sun and beach tourism and winter tourism, among others. This study provides a basis for understanding how climate change will affect the comfort of tourists in the north of Spain, facilitating the development of adaptation strategies to mitigate negative impacts and the identification of emerging opportunities, to ensure the sustainability of the tourism sector in the region of Cantabria.

A.C. and J.B. acknowledge support from PID2023-149997OA-I00 funded by MICIU/AEI/10.13039/501100011033 and by ERDF/EU.

How to cite: Casanueva, A., Conde-Oria, F., Bedia, J., and Rasilla-Alvarez, D. F.: Projected changes of tourism comfort in northern Spain under climate change, EGU General Assembly 2025, Vienna, Austria, 27 Apr–2 May 2025, EGU25-18283, https://doi.org/10.5194/egusphere-egu25-18283, 2025.

EGU25-18394 | Orals | CL5.4 | Highlight

Impact of cities on the diurnal precipitation and temperature cycle in a changing climate 

Erika Coppola, Johannes de Leeuw, Rita Nogherotto, Natalia Zazulie, and Francesca Raffaele

The relationship between urban areas and higher temperatures, commonly referred to as the urban heat island effect, is well-established within the scientific community and holds critical relevance for policymakers, given that a significant portion of the global population resides in urban regions. However, much less is understood about how cities may influence precipitation patterns in their vicinity. For instance, temperature changes above urban areas could alter atmospheric stability and potentially trigger convective precipitation.

This study examines the impact of urbanization on the diurnal cycle of both precipitation and temperature using the high-resolution CORDEX FPS-CONV convective-permitting model simulation ensemble over the ALP-3 European domain. The ensemble provides kilometer-scale resolution, offering a robust tool to study the urban climate effect. Analyses of current and future climate scenarios reveal that large cities, such as Paris or Barcellona, can significantly influence the diurnal cycles of both temperature and precipitation and differences are highlighted between costal and continental cities in the Mediterranean region.

The ensemble members exhibit considerable variability in how urbanization affects precipitation, with discrepancies not only across ensemble members but also among different cities within the same model simulation. This variability underscores the challenges in precisely quantifying the impact of urbanization on precipitation patterns and highlights the need for more detailed future studies leveraging high-resolution kilometer-scale model ensembles to better understand the complex interplay between urbanization and local climate dynamics.

How to cite: Coppola, E., de Leeuw, J., Nogherotto, R., Zazulie, N., and Raffaele, F.: Impact of cities on the diurnal precipitation and temperature cycle in a changing climate, EGU General Assembly 2025, Vienna, Austria, 27 Apr–2 May 2025, EGU25-18394, https://doi.org/10.5194/egusphere-egu25-18394, 2025.

EGU25-20339 | ECS | Posters on site | CL5.4

Specialized climate indices for the energy sector in Ukraine based on the Euro-CORDEX projections 

Lidiia Kryshtop, Svitlana Krakovska, Tetiana Shpytal, Svitlana Savchuk, Anastasiia Chyhareva, and Liudmyla Palamarchuk

In Ukraine, the consequences of climate change are exacerbated by the military aggression of the Russian Federation (RF) not only in the temporarily occupied territories but also for the entire country, since all resources are primarily directed at strengthening defense capabilities and confronting the enemy. Nevertheless, climate change has not stopped and rather intensified in recent years. At the same time, due to the massive and targeted shelling of RF, almost all generating capacities at thermal power plants in Ukraine have been destroyed, the largest hydroelectric power plants have also been damaged and destroyed, and nuclear plants often cannot operate at full capacity, especially in the summer due to the heatwaves, when temperature in water cooling reservoirs increases significantly and the efficiency of nuclear power plants decreases. On the other hand, due to the same heatwaves, the demand for electricity increases significantly due to the need for air conditioning, which requires redistribution and other planning of electricity generation in the system. That is why Ukraine needs to solve problems simultaneously and plan development strategically, taking into account changed climatic conditions. Moreover, renovation of the country's infrastructure, in particular the energy and communal sectors, needs thorough consideration of the climate changes that are inevitable in the future.

To analyze climate change to date, the E-Obs database of the European ECA&D project was used, and to estimate future changes in indicators, data from 34 regional climate models of the International Coordinated Scaling Experiment for Europe (Euro-CORDEX) were used, which were calculated under two scenarios RCP 4.5 and RCP 8.5 until 2100 with a high resolution of 0.1o.

We analyzed specialized indicators (Climatic Impact-Drivers – CIDs) for the energy sector as follows: heating period (in Ukraine with t<8oC) duration, start and end dates; number of days per year which require the air conditioning (t>22oC); mean temperatures of the heating and cooling periods and heating and cooling degree days (HDD and CDD); as well as the temperatures of the warmest and coldest 5-day periods to determine peak loads on the power system for 3 future periods (2021-2040, 2041-2060, and  2081-2100) vs 1991-2010.

In general by the end of the century, under the RCP 4.5 scenario in Ukraine, all analyzed CIDs may be the same as in the middle of the century under the RCP 8.5 scenario. As for degree days, their decrease in HDD does not compensate for the increase in CDD in the warm period for the high-concentration scenario. Moreover, the changes will occur in different regions differently with a significant decrease in the demand for thermal energy in winter in the north-eastern regions and a significant increase in costs during the air conditioning period in the southern and south-eastern regions with maximum values in the Autonomous Republic of Crimea.

The results obtained are the basis for the development of climate change adaptation strategies for almost all sectors of the economy and should become the basis for further assessment of risks and vulnerabilities of the energy and other economic sectors in Ukraine.

How to cite: Kryshtop, L., Krakovska, S., Shpytal, T., Savchuk, S., Chyhareva, A., and Palamarchuk, L.: Specialized climate indices for the energy sector in Ukraine based on the Euro-CORDEX projections, EGU General Assembly 2025, Vienna, Austria, 27 Apr–2 May 2025, EGU25-20339, https://doi.org/10.5194/egusphere-egu25-20339, 2025.

Climate change-induced disease occurrences are one of the major factors that affect sustainable rice production across the globe. The adoption and use of tailored climate information services (CIS) through mobile applications can assist farmers by providing actionable information for climate-smart disease management. This study assesses the impacts of using tailored CIS on farmers’ pesticide usage and income benefits and suggests design principles for co-producing the service regarding rice disease forecasts and management in coastal Bangladesh. The experiment followed a participatory approach for co-producing tailored CIS to provide farmers with rice disease forecast and management information for better decision-making. The access, understanding, and use of the DROP app and associated capacity-building training greatly assist farmers in managing diseases in advance. Results show that 77% of the farmers found that using this agrometeorological service helped them improve their understanding of pesticide application, timeliness on when to spray, maintaining pesticide dose, and decreased farmers’ frequency and purchase of pesticides. The majority of them (89%) also mentioned that understanding and uptake of disease forecast, and management information also benefits farmers by minimizing pesticide usage, and cost and thereby increasing crop yields due to on-time application of pesticides with other agricultural activities such as applying fertilizer and irrigation considering weather conditions. Furthermore, this study recommends design principles for co-producing tailored CIS for similar regions across the globe where smallholder farmers face similar issues such as climate-induced disease occurrence and rice yield reduction. The development of CIS to forecast and manage diseases using ICT media required strong collaboration among farmers, agricultural extension officers, meteorologists, plant pathologists, and ICT specialists.  Capacity-building training is crucial for farmers which helps them improve climate knowledge, and ability to apply CIS in decision-making, enabling farmers to follow climate-smart disease management techniques. Department of Agricultural Extension (DAE) should come forward to disseminate and adopt the service among other farmers in the country for sustainable rice production and make them more resilient to the changing climate.

How to cite: Mousumi, M. A.: Impacts of Tailored Climate Information Services on Pesticide Usage and Farmers’ Income in Relation to Rice Disease Management in Coastal Bangladesh, EGU General Assembly 2025, Vienna, Austria, 27 Apr–2 May 2025, EGU25-1296, https://doi.org/10.5194/egusphere-egu25-1296, 2025.

EGU25-2566 | PICO | CL5.7

Operationalising a National Framework for Climate Services in Ireland 

Claire Scannell, Padraig Flattery, Jordan Delmar, Catriona Duffy, Seanie Griffin, and Keith Lambkin

Ireland’s National Framework for Climate Services (NFCS), established in 2022, facilitates collaboration between climate information providers and users to deliver user-driven climate services. It promotes knowledge exchange, integrates robust scientific advances, and supports Ireland’s climate resilience efforts by signposting relevant climate information and promoting existing tools to avoid duplication of effort.

It is built on the outputs from across the climate services community, including the TRANSLATE project which provides standardised bias-corrected climate change projections for Ireland. The TRANSLATE program was the seed that led to the formation of this permanent national framework. 

The establishment of an NFCS in Ireland followed a low-risk, high-impact, “project-first” approach to understand the national relevance and appetite for a coordinated approach to climate services. Rather than begin with an NFCS, and be unsure of its interest or value, this “project-first” approach allowed Met Éireann, (the national met service in Ireland), to identify relevant stakeholders, evaluate engagement and discover potential problems. As projects are time bound, this was a low-risk method of determining appetite for a more permanent national solution to provision and sharing of climate information.

Here we describe an “all-of-government” approach to building permanent mechanisms and structures for developing and maintaining sustainable and scalable climate services and partnerships across the science-policy-user interface by establishing an inclusive NFCS. We explore the successes, challenges, barriers and lessons learned in forming and operationalising of an NFCS in Ireland, offering insights for climate service providers internationally.

By the end of 2024, (the first year of an operational NFCS), some notable achievements include:

  • The NFCS has hosted two national forums, the first to identify NFCS priorities, and the second on addressing uncertainty in climate information.
  • NFCS Annual Forum: Spanning two days for producers and users, it highlighted key directions for the NFCS for the coming years. It also highlighted the key role the NFCS can play in in supporting and facilitating knowledge transfer and learning across the community.
  • NFCS National Forum: Handling uncertainty in climate information.
  • A permanent identity has been established through a dedicated webpage, branding, an operational online help desk and a quarterly newsletter.
  • Thematic hubs have been created, pulling together relevant data, services and communications from across the climate services community.
  • It has supported and facilitated the development of key national climate change programs. These include the National Adaptation Framework, the National Climate Change Risk Assessment and sectoral adaptation plans.
  • Ireland’s NFCS was featured in the WMO’s 2024 State of Climate Services report as a case study, showcasing its impact across sectors like the built environment, transport, water, and agriculture.

How to cite: Scannell, C., Flattery, P., Delmar, J., Duffy, C., Griffin, S., and Lambkin, K.: Operationalising a National Framework for Climate Services in Ireland, EGU General Assembly 2025, Vienna, Austria, 27 Apr–2 May 2025, EGU25-2566, https://doi.org/10.5194/egusphere-egu25-2566, 2025.

EGU25-6227 * | PICO | CL5.7 | Highlight

Governing climate services: Strategic directions for benchmarking fit-for-purpose climate services  

Asun Lera St.Clair, Marina Baldissera Paccheti, Carlo Buontempo, Paula Checchia, Francisco Doblas-Reyes, Sam Grainger, Eelco Kruizinga, Nakiete Msemo, Marta Terrado, Saioa Zorita, Kjersti Aalbu, and Edwin Aalders

It is urgent to mature a set of standards and best practice guidance that can provide a baseline for assessing the quality, salience and effectiveness of climate services and to identify knowledge gaps. Climateurope2, dedicated to advancing the development and uptake of climate services and informing their ongoing standardisation, proposes a holistic perspective and emphasizes the importance of accounting for four interconnected components: the decision context, the actors and the co-production processes, the different knowledge systems, and the delivery mode and evaluation. The complex environmental challenges facing our society, alongside recent examples of inefficiencies in current climate services implementation and lack of cohesive co-governance across scales, highlight the importance of considering all components of climate services holistically as a point of departure for their standardisation. We argue that governing climate services can be achieved through a combination of formal standards, best practice guidance, partnerships across all actors of a climate services value chain for addressing knowledge gaps, and engagement of national, European and international science-policy actors.

A viable strategy for the standardisation of climate services can be focused on identifying the interconnected i) technical, ii) procedural and iii) performance criteria that would be required for fit-for-purpose climate services to ensure their complexity is captured and to ensure evaluation and eventual certification by accredited actors. In addition to well-known practices in data management, dealing with uncertainty, documentation and traceability of climate data, we have explored other types of criteria such as the use of storylines and diverse forms of citizen engagement.  Inclusion of local knowledge, civic institutions and all users is crucial for understanding climate impacts and for effective risk communication. We have also explored the criterion of subsidiarity, which emphasises addressing social and political issues at the most immediate or local level consistent with their resolution. Other key criteria for fit-for-purpose climate services explored and summarised in this document include accessibility, adaptability and flexibility, transparency of the scope and limits of the climate service, reflexivity, visual design, literacy, capacity building, and the use of diverse communication channels. Many of these criteria need to be simultaneously present for a climate service to be fit-for-purpose. While some of these criteria are related to technical specifications, others are associated with processes or performance.

Furthermore, we recommend parallel efforts to mature more flexible and open-source best practice guidance that can be made available in a shorter time than standards.  Knowledge gaps for standardisation remain requiring research executed in partnership with public and private providers and relevant policy, industry, and community stakeholders. The European Commission is in a position to lead the effort to build suitable governance mechanisms for climate services supporting and complementing standardisation, facilitating networking across stakeholders, and promoting a culture of enhanced climate risk perception across communities through a dedicated engagement programme. The World Meteorological Organisation (WMO), and Copernicus-ECMWF are central for strengthening climate services governance and involve National Hydrological and Meteorological organisations in Europe.

How to cite: Lera St.Clair, A., Baldissera Paccheti, M., Buontempo, C., Checchia, P., Doblas-Reyes, F., Grainger, S., Kruizinga, E., Msemo, N., Terrado, M., Zorita, S., Aalbu, K., and Aalders, E.: Governing climate services: Strategic directions for benchmarking fit-for-purpose climate services , EGU General Assembly 2025, Vienna, Austria, 27 Apr–2 May 2025, EGU25-6227, https://doi.org/10.5194/egusphere-egu25-6227, 2025.

This study contributes an accessible, comprehensive database of interpolated climate data for Europe that includes monthly, annual, decadal, and 30-year normal climate data for the last approximately 120 years (1901 to present) as well as multi-model CMIP6 climate change projections for the 21st century. The database includes variables relevant for ecological research and infrastructure planning, and comprises more than 25,000 climate grids that can be queried with a provided ClimateEU software package to extract time series for lists of sample locations, or custom grids for specific study areas at any resolution and projection. In addition, continent-wide 1km resolution gridded data are available for download (http://tinyurl.com/ClimateEU). The climate grids were developed with a three-step approach, using thin-plate spline interpolations of weather station data as a first approximation (replacing otherwise needed lengthy pre-training of the neural network). Subsequently, a novel deep learning approach is used to model orographic precipitation, rain shadows, lake and coastal effects at moderate resolution (2.5 arcmin). Lastly, lapse-rate based downscaling is applied to generate high-resolution grids (up to a useful resolution of 250 m in mountenous terrain). The climate estimates were optimized and cross-validated with a checkerboard approach to ensure that training data was spatially distanced from validation data. We conclude with a discussion of applications and limitations of this database.

How to cite: Hamann, A., Namiiro, S., and Wang, T.: ClimateEU: A high-resolution database of historical and future climate for Europe developed with deep neural networks, EGU General Assembly 2025, Vienna, Austria, 27 Apr–2 May 2025, EGU25-7022, https://doi.org/10.5194/egusphere-egu25-7022, 2025.

EGU25-7424 | PICO | CL5.7

Partnering for Resilience: The Pacific Drought Knowledge Exchange 

Abby Frazier, Ryan Longman, Christian Giardina, Derek Ford, Cherryle Heu, Harmony Yomai, and Ashley McGuigan

Droughts in the Pacific Islands can be extremely severe, causing drinking water shortages, extensive crop damage, and increases in the size, severity, and extent of wildfires that burn incredibly large percentages of island land areas. A recent analysis of historical drought in Hawai‘i found that drought duration, magnitude, and frequency have all increased significantly, consistent with trends found in other Pacific Islands. While land managers are tasked with utilizing the “best available science”, they often are confronted with data products that are difficult to access and there is no facilitated communication process with researchers to meet the needs of resource managers.

The Pacific Drought Knowledge Exchange (PDKE) was established in 2019 to facilitate drought knowledge exchange and enable collaborative relationships among drought stakeholders in Hawai‘i and in Pacific Island Nations and territories. We use an iterative approach to co-produce site-specific, customized drought data and products based on the needs of our partners, including factsheets and decision support tools. Through active engagement between researchers and end users, we strive to make drought and climate data products more accessible to managers for drought planning and management.

Since the pilot phase in 2019, the PDKE has expanded to work with over 130 partners across Hawai‘i and Guam, and has begun building relationships in other Pacific Islands. The PDKE has worked with partners across various sectors, including natural resource management, water resource management, and ranching. The PDKE is governed by a stewardship team and regularly seeks input from an advisory council and steering committee through quarterly and annual meetings. The PDKE has co-developed numerous products, including site-specific climate portfolios and a decision support dashboard for ranchers. PDKE output products have been used by partners in various capacities, including in funding proposals, climate change education, and management activity planning. The PDKE can serve as a model for how a successful knowledge exchange process can improve drought management and planning.

How to cite: Frazier, A., Longman, R., Giardina, C., Ford, D., Heu, C., Yomai, H., and McGuigan, A.: Partnering for Resilience: The Pacific Drought Knowledge Exchange, EGU General Assembly 2025, Vienna, Austria, 27 Apr–2 May 2025, EGU25-7424, https://doi.org/10.5194/egusphere-egu25-7424, 2025.

EGU25-8948 | PICO | CL5.7

Blueprinting for collaborative climate service design 

Lottie Woods, James Pope, Fai Fung, and Neha Mittal

Since the launch of the UK Climate Projections (UKCP) in 2018, the UK Met Office has continually updated the underlying climate model datasets and operated a supported climate service on behalf of the UK government. In addition to providing technical support for its datasets, the UKCP Climate Service monitors the evolving user need, supports activities to enable knowledge sharing, improve understanding and co-design additional services. This work has resulted in the release of new datasets, reports and user guidance as well as a community-contributed monthly webinar series led by the co-chairs of its user group, the Development and Knowledge Sharing network. In 2023, a user consultation process was conducted and has revealed data needs that are not satisfied by the current UKCP18 corpus of information. As the UK Met Office assesses how to meet these data needs through new scientific capabilities and services, understanding their impact on climate action and their priority is of great importance.

New climate service design often focuses on the delivery system, leaving much of the user requirements defined in terms of climate variables, uncertainty, scenarios, data formats and visualisations. This can lead to misinterpretation by producers of the need and users of the most appropriate scientific tools available. We present the application of service blueprinting, which allows the explicit co-design between producers and users of a climate service which is outcome focused, i.e. it outlines the steps on how new information provision can potentially affect user actions. We will show draft blueprints co-designed with industry partners through interviews and focus group sessions, addressing user needs for information on extreme events, ocean chemistry, uncertainty and hydrological variables. The blueprints provide a holistic view of the whole climate service production process, starting at the potential outcome and working through the steps to information delivery and formats, data processing and interpretation as well as climate model simulation requirements. The blueprints offer a shared understanding for all stakeholders of the climate service.

How to cite: Woods, L., Pope, J., Fung, F., and Mittal, N.: Blueprinting for collaborative climate service design, EGU General Assembly 2025, Vienna, Austria, 27 Apr–2 May 2025, EGU25-8948, https://doi.org/10.5194/egusphere-egu25-8948, 2025.

EGU25-9114 | ECS | PICO | CL5.7

Developing a Climate Resilience Tool for Coastal Tourism: Local Adaptation on the Catalan Coast  

Anna Boqué-Ciurana, Iván Céster Lozano, Angelos Vasileiou, Emmanouil Dermitzakis, Christos Nikoloudis, and Enric Aguilar

Climate change presents significant challenges to coastal tourism, making adaptation essential to ensure resilience and sustainability. This study, conducted as part of the IMPETUS project funded by the European Union's Horizon 2020 program, focuses on fostering climate-resilient tourism along the Catalan coast by transforming climate data into actionable information to support informed decision-making. Although tourism is not a priority sector under the Global Framework for Climate Services (GFCS), its dependency on climate variability and change highlights the urgent need for locally focused adaptation measures. 

Using a participatory co-creation process with local stakeholders, we developed tailored climate indicators to assess the climate potential for tourism activities. Our work included identifying relevant datasets, computing robust indicators, and presenting the results through a user-friendly visualization tool. This tool empowers stakeholders to evaluate local climate risks and opportunities, enabling adaptive decision-making that aligns with regional needs and sector-specific challenges. 

This study underscores the critical importance of addressing climate adaptation at a local scale, where the impacts of climate change are most directly felt and actionable solutions can be implemented effectively. It highlights how co-designed, user-oriented climate services can bridge gaps in global frameworks like the GFCS, offering scalable methodologies for climate-sensitive sectors such as tourism. By providing tools to integrate localized adaptation into planning, our work supports building resilient, sustainable tourism systems capable of navigating the complexities of a changing climate. 

How to cite: Boqué-Ciurana, A., Céster Lozano, I., Vasileiou, A., Dermitzakis, E., Nikoloudis, C., and Aguilar, E.: Developing a Climate Resilience Tool for Coastal Tourism: Local Adaptation on the Catalan Coast , EGU General Assembly 2025, Vienna, Austria, 27 Apr–2 May 2025, EGU25-9114, https://doi.org/10.5194/egusphere-egu25-9114, 2025.

EGU25-13112 | ECS | PICO | CL5.7

Climate information tailored for the German coast provided by the DAS core service – the example of regional sea level projections 

Corinna Jensen, Tim Kruschke, Frank Janssen, Gabriel Ditzinger, Jens Moeller, Ina Lorkowski, Janna Meyer, Birte-Marie Ehlers, Wibke Duesterhoeft-Wriggers, and Jennifer Brauch

The DAS core service “Climate and Water” provides monitoring and projection data to evaluate requirements for climate change adaptation, which were defined through the German Strategy for Adaptation to Climate Change (Deutsche Anpassungsstrategie - DAS).

Sea level rise (SLR) is an inevitable consequence of climate change and leads to an increased risk of flooding, erosion, and infrastructure damage in low-lying and vulnerable areas. This increase will therefore require adaptive strategies for mitigation along the coasts.

To support adaptation efforts, we provide high-resolution projections of relative sea level change, optimized specifically for the Northern European Coastal Region (‘DASNordicSLR’).

Most drivers of sea level change operate on a continental or global scale, but vertical land motion is a regional phenomenon — especially significant in northern Europe — driven by glacial isostatic adjustment and localized geological processes.

The sea level projections from IPCC 6th Assessment Report (AR6) were therefore optimized for this specific region by changing the vertical land motion component to an elevation model created for Fennoscandia by the Nordic Geodetic commission (NKG).

A subset of these SLR projections for only the German North and Baltic Seas is available via the “DAS Climate Data Coast” application (https://das.bsh.de). Additionally, projections for multiple oceanographic variables, such as sea surface temperature, sea surface salinity or extreme water levels, based on a small ensemble of regional ocean climate simulations are presented and can be easily visualised for the entire area and multiple stations along the coast.

How to cite: Jensen, C., Kruschke, T., Janssen, F., Ditzinger, G., Moeller, J., Lorkowski, I., Meyer, J., Ehlers, B.-M., Duesterhoeft-Wriggers, W., and Brauch, J.: Climate information tailored for the German coast provided by the DAS core service – the example of regional sea level projections, EGU General Assembly 2025, Vienna, Austria, 27 Apr–2 May 2025, EGU25-13112, https://doi.org/10.5194/egusphere-egu25-13112, 2025.

EGU25-15652 | PICO | CL5.7

 Climate Change Information for Regional Impact and Risk Assessment in the Mediterranean area: a climatic impact-driver (CID) framework.  

Giovanna Pisacane, Maria Vittoria Struglia, Emanuela Pichelli, Alessandro Anav, Marta Antonelli, Sandro Calmanti, Franco Catalano, and Alessandro Dell'Aquila

The increasing availability of reliable climate-change information at the regional scales is prompting an ever-growing demand for impact and risk indicators suitable for policy planning and implementation. As highlighted in IPCC AR6, the latter also benefit from the recent advances in attribution and sectoral vulnerability studies, which now enable to identify the most relevant climatic variables and to investigate their past and future trends, characterizing the response of both environmental and socio-economic systems to climate-induced stress. Climate services aim to complement and combine up-to-date scientific knowledge and bottom-up contributions, including stakeholder needs, interests and expectations, to deliver user-oriented information and enhance awareness, preparedness, risk reduction and recovery strategies. Recognizing that climate-proofing our societies cannot be further postponed, the IPCC proposed a synergistic “Climatic Impact-Driver (CID) Framework” as a tool to preliminarily foster and feed physical climate science applications whenever specific information is lacking on the context where climate-change-induced phenomena can emerge as hazardous, beneficial, or inconsequential. Within the generic category of “impact-drivers” (e.g., climate change, population growth, viral outbreaks, technological change, social conflict), IPCC AR6 defined CIDS as “physical climate system conditions (e.g., means, events, and extremes) that affect an element of society or ecosystems”, the extent of their impact depending on system tolerance across interacting elements and regions. Despite their being based on characteristics (intensity, frequency, duration, timing, and spatial extent) that solely depend on complex, scale-spanning physical processes, CIDs are designed to represent the perspective of the affected system or sectoral asset and to provide stakeholders with a more exhaustive and purposeful reckoning of changing, potentially threatening climate conditions. Such an approach allows to evaluate potential impacts and to inter-compare regions, helping prioritize adaptation strategies, while maintaining climate information neutrality until more complex, intrinsically local, risk assessments are conducted, hazard and system specific thresholds defined, and decision-making processes brought into being. 

There is a nearly unanimous scientific consensus that current climate in many regions of the Earth has already changed with respect to the early or mid-20th century and that climate change has already critically altered CID characteristics, shifting the magnitude, frequency, duration, seasonality and spatial extent of their associated impact indices and indicators. In particular, the Mediterranean basin is experiencing significant changes in temperature and precipitation patterns, which can affect vital economic and environmental sectors in the surrounding countries. Here, the need for systematic and inter-comparable assessments of the expected impacts is particularly urgent, and action prioritization calls for progressively zooming analyses across regional and local scales and across multiple hazards, ideally accounting for interactions and superpositions between both CIDs and sectors, as well as for sector tolerance thresholds. In this context, we present temperature and precipitation related CID indicators at the NUTS-1, NUTS-2 and NUTS-3 aggregation levels, derived from new high-resolution (5 km) climate projections over the Italian peninsula, for both present climate and future scenarios (SSP1-2.6, SSP2-4.5 and SSP5-8.5), as obtained by downscaling the corresponding global ERA5 and MPI-ESM1-2-HR driven CMIP6 experiments. 

How to cite: Pisacane, G., Struglia, M. V., Pichelli, E., Anav, A., Antonelli, M., Calmanti, S., Catalano, F., and Dell'Aquila, A.:  Climate Change Information for Regional Impact and Risk Assessment in the Mediterranean area: a climatic impact-driver (CID) framework. , EGU General Assembly 2025, Vienna, Austria, 27 Apr–2 May 2025, EGU25-15652, https://doi.org/10.5194/egusphere-egu25-15652, 2025.

EGU25-16279 | PICO | CL5.7

Rethinking EFSA pest risk assessment from the SEED: the next generation tools for climate suitability analysis 

Andrea Maiorano, Giovanna Abelli, Sofia Bajocco, Simone Ugo Maria Bregaglio, Riccardo Ceccotto, Giancarlo Franco Costa, Diego Guidotti, Mario Monguidi, Giovanni Maria Poggi, and Iride Volpi

The European Food Safety Authority (EFSA) conducts plant pest risk assessment (PRA) under the mandate of the European Commission, the European Parliament, and the Member States. The analysis of pest climate suitability in the EU is a key element of PRA, and it is based on multiple layers of analysis, spanning from the evaluation of the presence of suitable hosts in the area under assessment to the analysis of climate suitability for the pest. We present the ongoing EFSA SEED project (Spatially Explicit Environmental Data) for climate suitability analysis to support EFSA staff, experts and contractors. 
The SEED project will release operational cloud-based, user-friendly, digital services to support climate suitability analysis. It will release tools to develop climate suitability maps based on agro-climatic indicators, and on process-based and species distribution models.
Key objectives of the project are improving analysis capability, quality and speed of assessments, ensuring traceability and reproducibility of results, and removing the technical barriers inherent the use of geospatial data (GIS software and/or coding). The combination of state-of-art cloud technologies and science-based products are being developed in the EFSA cloud environment leveraging on the Databricks platform to allow and enhance “citizen development”, hence fostering collaboration with the external scientific experts supporting EFSA. The tools are under development and are aimed to support EFSA scientists, experts, working groups on the development of the PRAs, but will also be freely available to external institutions, and experts working with maps based on agrometeorological indicators.

How to cite: Maiorano, A., Abelli, G., Bajocco, S., Bregaglio, S. U. M., Ceccotto, R., Costa, G. F., Guidotti, D., Monguidi, M., Poggi, G. M., and Volpi, I.: Rethinking EFSA pest risk assessment from the SEED: the next generation tools for climate suitability analysis, EGU General Assembly 2025, Vienna, Austria, 27 Apr–2 May 2025, EGU25-16279, https://doi.org/10.5194/egusphere-egu25-16279, 2025.

EGU25-19158 | PICO | CL5.7

Lessons learnt from triple-A climate services co-development and applications in 7 European cities 

Ad Jeuken, Gaby Langendijk, and Hasse Goosen

REACHOUT (Home - Reachout)  is a H2020 research and innovation project aimed at ‘bridging the last mile in climate service delivery’ by developing user-oriented climate services. It responds to a call, issued by the EC as part of the Green Deal to enhance climate-service uptake across Europe.


A suite of 18 existing and new tools has been compiled into a web-based toolkit (triple-a-toolkit.eu, Triple-A Toolkit - Reachout).  In addition to analysis tools for vulnerability and risks, it consists of tools that support adaptation action and as a new element also tools that support the setting of ambition for adaptation and urban resilience. Hence, a ‘Triple-A’ approach (Analysis; Ambition; and Action) was established, supported by climate service tools. The ambition setting step was added to shift the lens of from prevention of risks, often leading to incremental adaptation, to promotion of positive change, allowing better for transformational adaptation. It is defined as a policy process that entails developing visions coupled with identifying goals and actions working towards the visions.


The triple-A toolkit covers tools for heat and different flood hazards, social vulnerability, tools for identifying opportunities for adaptation, selecting appropriate options, designing pathways and several ‘soft tools’ to build capacity for adaptation.  Some of them build upon the EU-climate service infrastructure, such as Copernicus. For most of them additional local data are needed. To improve the uptake of the services municipalities, climate service providers and scientists were brought together in seven city hubs that served as living labs to co-develop and test a set of improved services in three consecutive development cycles.


The toolkit is accessible for resilience officers, urban planners, consultants  world-wide in a user friendly manner. The use of combinations of different tools, covering analysis, ambition setting and action planning for different adaptation policy questions has been presented  in 6 demonstrators: i) support dealing with floods in a fast growing city; ii) facing the heat in large cities; iii) Prioritizing locations to implement nature-based solutions; iv) approaches cities can use which are in their early stages of adaptation; v) How can just and resilient urban development be combined?; and vi) Climate risk assessments for institutional and real estate investors across Europe. Each demonstrator shows how tools and climate data can be applied to support these questions and presents lessons from the city hubs Amsterdam, Cork, Logrono, Gdynia, Lillestrom, Milan and Athens.


The presentation will introduce the project legacy and share main lessons from the project with respect to climate service development and deployment for further discussion. In brief we find that to effectively reach the "last mile" of climate services, we must work from both ends: a top-down approach driven by EU-level data infrastructure, and a bottom-up approach based on local and national data provision. The brokerage function (experts) is key in this process as well as the maturity of the cities capacity to utilize the outcomes of the climate services. Not only the services itself asks for co-development but also the triple-A process that they ought to support.

How to cite: Jeuken, A., Langendijk, G., and Goosen, H.: Lessons learnt from triple-A climate services co-development and applications in 7 European cities, EGU General Assembly 2025, Vienna, Austria, 27 Apr–2 May 2025, EGU25-19158, https://doi.org/10.5194/egusphere-egu25-19158, 2025.

EGU25-19306 | PICO | CL5.7

Advancing C3S Energy Services in support to Europe’s energy transition: co-development of the Pan-European Climate Database with ENTSO-E. 

Nube Gonzalez-Reviriego, Giovanni Aldrigo, Rodrigo Amaro e Silva, Carlo Buontempo, Chiara Cagnazzo, Stefano Cordeddu, Laurent Dubus, Polyneikis Kanellas, Matti Juhani Koivisto, Letizia Lusito, Elena Restivo, Yves-Marie Saint-Drenan, Laurens Stoop, Alberto Troccoli, Marcus Zanacchi, Mattia Zaramella, and Aron Zuiker

The Copernicus Climate Change Service (C3S), which is fully funded by the European Union and implemented by the European Centre for Medium-Range Weather Forecasts (ECWMF), has traditionally provided authoritative information about the past, present, and future climate through datasets, tools, and applications. The service facilitates the development of adaptation and mitigation strategies for society in the face of climate change.

C3S has been consolidated as one of the most relevant providers of climate data and information both in Europe and globally. Its implementation has evolved contemporaneously with the evolution of the climate services arena. C3S has historically prioritized user requirements in shaping sectoral datasets and information delivered by the service. In recent years, however, it has taken additional measures to advance this commitment. These efforts include the development of customized climate datasets in partnership with core users. These users utilize and amplify the climate information supplied by C3S and disseminate it further through their own organizations and partners. This initiative involves prominent European institutions, such as the European Network of Transmission System Operators for Electricity (ENTSO-E), which plays an outstanding role in operating and securing the European electricity system and market integrations.

In the context of Europe's energy transition towards a more environmental-friendly electricity supply system, the power sector is increasingly vulnerable to weather and climate variability. This heightened exposure underscores the need for collaborative efforts among climate and energy experts to develop information at the European level. In this context, the present contribution aims to illustrate the process of co-development undertaken by C3S and ENTSO-E for the preparation of the latest Pan-European Climate Database (PECD) version, that encompass both climate and energy data, considering for the first time, future climate projections. PECD is a dataset that has underpinned most studies conducted by TSOs ever since and plays an important role for the resilience of energy systems and optimization of their performance in response to climate change. In this contribution we will delve into the TSO's needs, engagement, and co-development process up to the final PECDv4.2 dataset, which is readily available at the Copernicus Climate Data Store, as well as the evolution towards the new version. This co-development has combined both academic and grid operators' needs and resulted in a dataset that is fit for research and industry alike. The contribution will highlight the lessons learned in the process, the features accomplished, and the remaining gaps.

How to cite: Gonzalez-Reviriego, N., Aldrigo, G., Amaro e Silva, R., Buontempo, C., Cagnazzo, C., Cordeddu, S., Dubus, L., Kanellas, P., Koivisto, M. J., Lusito, L., Restivo, E., Saint-Drenan, Y.-M., Stoop, L., Troccoli, A., Zanacchi, M., Zaramella, M., and Zuiker, A.: Advancing C3S Energy Services in support to Europe’s energy transition: co-development of the Pan-European Climate Database with ENTSO-E., EGU General Assembly 2025, Vienna, Austria, 27 Apr–2 May 2025, EGU25-19306, https://doi.org/10.5194/egusphere-egu25-19306, 2025.

EGU25-19610 | ECS | PICO | CL5.7

Sea level change and adaptation: linking climate services needs and territorial realities (France, Netherlands, Maldives, Greenland) 

Xenia Philippenko, Dewi Le Bars, Vanessa Völz, Gonéri Le Cozannet, Jochen Hinkel, Robert Nicholls, Arno Hammann, Kristy Langley, Adrien Privat, Robert Vos, and Ahmed Waheed

In the face of rising or falling sea levels, adaptation is unavoidable. However, the extent of the action required depends on the scale of this rise or drop, determined to within a few centimetres that people and stakeholders will have to cope with. To determine adaptation strategies, stakeholders need climate services. However, scientific information does not always coincide with users’ needs. As part of the PROTECT European programme, we focus on users’ needs in four countries: France, the Netherlands, the Maldives and Greenland. We present the context of each country, as well as the partners with whom we work in each of these countries: the Conservatoire du littoral (France), the Rijkswaterstaat (Netherlands), the Ministry of Environment (Maldives) and ASIAQ (Greenland). Based on more than thirty interviews and several workshops, we present results concerning the need for sea-level rise scenarios. We assess the extent to which the produced services meet the needs and realities of users. We note that territorial realities and the decision-making context have a strong influence on the type of needs of adaptation stakeholders. The Conservatoire du littoral favours a 'soft' approach on land with predominantly agricultural or nature conservation issues, associated with a medium-term vision, thus moving towards probabilistic scenarios. The Rijkswaterstaat, which manages areas with a high population density and strong socio-economic issues needs for their sea defence large and complex infrastructure like storm surge barriers or dams. For this purpose, they have a marked demand for long-term scenarios (100 years), a low tolerance of uncertainty and a need for higher scenarios. The Maldives sees sea rise as a major challenge and requests precise short- and medium-term scenarios, as well as data and tools enabling to measure coastal vulnerability and put in place adaptation measures, such as raising or creating islands. Finally, sea level rise is not a major concern for Greenland: other more pressing issues are caused by climate change. The local culture makes it more difficult for stakeholders to project themselves into the future, favouring a short-term approach and probabilistic scenarios. The needs for climate services also depends on the stakeholder’s level of expertise. Overall, we finally observe a request for integrated climate services, taking adaptation choices and social data into account.

How to cite: Philippenko, X., Le Bars, D., Völz, V., Le Cozannet, G., Hinkel, J., Nicholls, R., Hammann, A., Langley, K., Privat, A., Vos, R., and Waheed, A.: Sea level change and adaptation: linking climate services needs and territorial realities (France, Netherlands, Maldives, Greenland), EGU General Assembly 2025, Vienna, Austria, 27 Apr–2 May 2025, EGU25-19610, https://doi.org/10.5194/egusphere-egu25-19610, 2025.

EGU25-168 | Posters on site | CL5.9

Deep Learning Postprocessing to Enhance Subseasonal Soil Moisture Forecasts Across Europe 

Noelia Otero Felipe, Atahan Özer, and Jackie Ma

Flash droughts are a unique natural hazard characterized by their sudden onset and rapid intensification. Accurate and reliable forecasts on subseasonal-to-seasonal (S2S) timescales are crucial for effective preparation and mitigation of the impacts of these events. To enhance the accuracy of soil moisture predictions—a key factor in identifying flash droughts—we propose a hybrid modeling approach that integrates state-of-the-art dynamical forecasts from the European Centre for Medium-Range Weather Forecasts (ECMWF) with deep learning techniques (DL).

We use a set of DL models of different complexity for post-processing soil moisture forecasts to not only improve S2S forecasts by correcting systematic errors inherent in numerical weather prediction models, but also to enhance the spatial resolution of the forecasts.  This downscaling process is crucial as it addresses a common limitation in S2S forecasts, the coarse spatial resolution that can overlook some variations in soil moisture at a higher spatial scale. By using deterministic inputs, such as the mean and spread from the ensemble forecasting system, we further assess forecast uncertainty through dropout neural networks via Monte Carlo (MC) sampling. This technique allows us to generate probabilistic forecasts by applying MC dropout during the testing phase, thereby generating probabilistic forecasts. Our results show that the DL models outperform the S2S forecasts and lead to skillful S2S forecasts. This advanced modeling framework aims to deliver skillful soil moisture S2S forecasts, ultimately contributing to more effective strategies for managing and mitigating the effects of flash drought events.

How to cite: Otero Felipe, N., Özer, A., and Ma, J.: Deep Learning Postprocessing to Enhance Subseasonal Soil Moisture Forecasts Across Europe, EGU General Assembly 2025, Vienna, Austria, 27 Apr–2 May 2025, EGU25-168, https://doi.org/10.5194/egusphere-egu25-168, 2025.

EGU25-369 | ECS | Orals | CL5.9

A machine learning-based backward extension of IMERG daily precipitation over the Greater Alpine Region 

Iman Goudarzi, Davide Fazzini, Claudia Pasquero, Agostino N Meroni, and Matteo Borgnino

An accurate knowledge of precipitation data at high spatio-temporal resolution is crucial for hydrological forecasting, meteorological analysis, and climate studies. This is especially true in  mountainous areas, where traditional climate models struggle to accurately predict precipitation due to factors such as low spatial resolution and where rain gauges are sparse. High-elevation areas are particularly relevant as they act as reservoirs of water resources and are characterized by elevation-dependent climate change signals (Pepin et al., 2022). By leveraging the good performances of the satellite-based IMERG (Integrated Multi-satellitE Retrievals for GPM) rainfall product and the realism of the ERA5 atmospheric reanalysis, we aim to produce a multi-decadal daily rainfall product at the IMERG spatial resolution (roughly 8 km) over the Greater Alpine Region (GAR). To achieve this, we employ advanced machine learning techniques designed to capture the complex, non-linear relationships inherent in atmospheric processes.  

Twenty years of IMERG data (from 2001 to 2020) are used to train and test various types of machine learning algorithms to estimate daily precipitation maps starting from some ERA5 atmospheric fields including mid-tropospheric temperature and winds; vertically integrated ice, liquid water and water vapour contents; total precipitation, and other relevant variables. In addition to these atmospheric fields, a high-resolution elevation dataset (ETOPO) is used to represent the intricate terrain of the Alps. The Recursive Feature Elimination (RFE) technique is employed to select key input variables, introducing effective predictors and enhancing the understanding of the influence of physical atmospheric variables and their inter-relationships in mountainous regions. ERA5 total precipitation, vertically integrated ice and water vapour content appear to be the three most relevant input fields for an optimal estimate of IMERG precipitation. Among the algorithms tested (XGBoost, Random Forest, Convolutional Neural Networks, Deep Neural Networks), XGBoost (XGB) is found to be the most reliable and computationally efficient.

The results show a spatiotemporal RMSE improvement of approximately 15 percent, decreasing from 5.18 mm/day (between ERA5 and IMERG) to 4.37 mm/day (between XGB and IMERG). On a seasonal basis, the RMSE is higher in summer and fall, where higher mean precipitation intensities are observed. Also, in terms of changes with the terrain height, the RMSE follows quite tightly the mean precipitation elevation dependence. The XGB model is used to backward extend the IMERG dataset so that precipitation biases and trends can be computed over a multi-decadal time range. These findings demonstrate the potential of machine learning to improve the accuracy of ERA5 rainfall data, which can be exploited to advance our understanding of the emerging elevation-dependent climate change signal. 

How to cite: Goudarzi, I., Fazzini, D., Pasquero, C., Meroni, A. N., and Borgnino, M.: A machine learning-based backward extension of IMERG daily precipitation over the Greater Alpine Region, EGU General Assembly 2025, Vienna, Austria, 27 Apr–2 May 2025, EGU25-369, https://doi.org/10.5194/egusphere-egu25-369, 2025.

EGU25-1037 | ECS | Posters on site | CL5.9

Enhancing Hyperlocal 3-Hourly Rainfall Forecasting for Mumbai Using a Hybrid CNN-LSTM Model. 

Puja Tripathy, Raghu Murtugudde, Subhankar Karmakar, and Subimal Ghosh

The increasing frequency and severity of extreme weather events, such as heavy rainfall and flooding, emphasize the urgent need for advanced early warning systems. Short-duration rainfall extremes, exacerbated by climate change, significantly increase flood risks, particularly in urban coastal cities like Mumbai. Mumbai's vulnerability arises from rapid urbanization, its coastal location, and variable topography, which contribute to significant spatial variability in rainfall. We have used Global Forecast System (GFS) data to identify key predictors for high-resolution, 3-hour rainfall forecasts for Mumbai. The GFS variables were selected using a correlation matrix. We have used past 3-hour observed rainfall data from Automatic Weather Stations (AWS) across 15 locations in Mumbai (2015–2023) along with selected GFS variables, which include Precipitable Water, Precipitation Rate, Relative Humidity, and Total Cloud Cover, to forecast rainfall for one timestep ahead. The dataset was divided into 80% for training and 20% for testing. We employed a hybrid Convolutional Neural Network-Long Short-Term Memory (CNN-LSTM) model to enhance forecast accuracy. The CNN captures spatial features, while the LSTM models temporal dependencies, effectively addressing the challenges of hyperlocal rainfall forecasting. Further, we incorporated a weighted Mean Squared Error (MSE) loss function to prioritize extreme rainfall events (≥95th percentile). The results indicate that using CNN-LSTM models reduced the Root Mean Square Error (RMSE) by 9.41% -12.38% and increased the Correlation Coefficient (CC) by 70.4%-113% compared to GFS models. At the 95th percentile, the Hit Rate (HR) improved by 233% -483.3%, while the False Alarm Rate (FAR) decreased by 7%-16.2%. Using weighted MSE also enhanced performance, increasing the HR by 255.5%-583.3% at the 95th percentile and reducing the FAR by 7% -13.2%. Implementing weighted MSE as a loss function resulted in a reduction in RMSE by 9.94% -12.86% and an increase in CC by 85.2%-126%. This study highlights that the hybrid CNN-LSTM model, combined with a weighted MSE loss function, demonstrates superior capability in accurately forecasting 3-hourly extreme rainfall events in Mumbai, providing critical advancements for early warning systems and flood risk mitigation.

How to cite: Tripathy, P., Murtugudde, R., Karmakar, S., and Ghosh, S.: Enhancing Hyperlocal 3-Hourly Rainfall Forecasting for Mumbai Using a Hybrid CNN-LSTM Model., EGU General Assembly 2025, Vienna, Austria, 27 Apr–2 May 2025, EGU25-1037, https://doi.org/10.5194/egusphere-egu25-1037, 2025.

We present Prithvi-Typhoon, an innovative adaptation of the Prithvi WxC weather foundation model for tropical cyclone intensity prediction. Through a novel three-stage progressive fine-tuning framework, we bridge the gap between general weather forecasting and specialized tropical cyclone prediction. The model integrates multi-source data from tropical cyclones (1987-2023), incorporating satellite observations, reanalysis products, and historical records. Our architecture features domain-specific feature extraction and multi-scale integration, enabling adaptive balance between local storm features and global atmospheric patterns.

Evaluation results demonstrate substantial improvements over existing methods. Notably, Prithvi-Typhoon shows enhanced skill in predicting rapid intensification events, outperforming both traditional numerical models and existing deep learning approaches. This work represents a advancement in applying foundation models to extreme weather prediction, offering a computationally efficient solution while maintaining physical consistency.

How to cite: Meng, F.: Prithvi-Typhoon: A Foundation Model Approach for Enhanced Tropical Cyclone Intensity Prediction, EGU General Assembly 2025, Vienna, Austria, 27 Apr–2 May 2025, EGU25-1738, https://doi.org/10.5194/egusphere-egu25-1738, 2025.

EGU25-1879 | ECS | Posters on site | CL5.9

Regional High-Resolution Weather Forecasting over the Arabian Peninsula: A Data-Driven Approach 

Sofien Resifi, Elissar Al Aawar, Hari Dasari, Hatem Jebari, and Ibrahim Hoteit

Accurate high-resolution spatio-temporal weather forecasting is vital for advancing our understanding of regional weather dynamics and improving meteorological applications. Traditional forecasting relies on numerical weather prediction (NWP) models, which are computationally demanding, particularly when implemented for large domains and high-resolution grids. Recently, Deep Learning (DL) has emerged as a powerful alternative, leveraging historical data to identify patterns and predict future atmospheric conditions. In this work, we develop a regional DL-based forecasting system tailored for the Arabian Peninsula (AP), a region with unique climatic conditions characterized by extreme temperatures and high wind energy potential. Therefore, it serves as an ideal case study for regional weather forecasting. The developed system forecasts hourly meteorological variables such as wind speed, wind direction, and temperature at a 5 km spatial resolution up to 48 hours ahead, with a focus on key vertical levels relevant to wind energy applications. Two forecasting approaches are explored: recursive forecasting, which iteratively advances fine-scale spatio-temporal states over time, and downscaling, which refines coarse-resolution forecasts of the meteorological variables into their high-resolution counterparts.  Additionally, we propose a combined approach that integrates these methods by combining fine-scale dynamics propagation with coarse-scale to fine-scale refinement. The frameworks were evaluated both qualitatively and quantitatively, demonstrating that while recursive forecasting accumulates errors over time, the downscaling approach effectively produces high-resolution forecasts. The combined approach significantly improves the forecasting precision, offering robust performance at early time steps and reduced error accumulation over extended forecasting horizons.

How to cite: Resifi, S., Al Aawar, E., Dasari, H., Jebari, H., and Hoteit, I.: Regional High-Resolution Weather Forecasting over the Arabian Peninsula: A Data-Driven Approach, EGU General Assembly 2025, Vienna, Austria, 27 Apr–2 May 2025, EGU25-1879, https://doi.org/10.5194/egusphere-egu25-1879, 2025.

EGU25-2013 | Orals | CL5.9

Addressing the US Tropical Cyclone-Storm Surge risk using RAFT-DeepSurge, an advanced AI-based approach  

Karthik Balaguru, Julian Rice, David Judi, Ning Sun, and Brent Daniel

Extreme climate events or tails of natural hazard distributions tend to be the most damaging in terms of societal impacts. While traditional physics-based approaches are suitable for gaining mechanistic understanding and for process-based studies, they may not be adequate for characterizing probabilistic risk from extreme events. Here, we demonstrate a ML/AI-based approach for estimating probabilistic risk from tropical cyclones (TCs) and the associated coastal flooding. First, we simulate nearly one million TCs for the current and future climates using the Risk Analysis Framework for Tropical Cyclones (RAFT), a hybrid model that combines physics with deep neural networks. Subsequently, we apply RAFT-simulated TC tracks to DeepSurge, an AI-based storm surge model that is trained on a large number of ADCIRC simulations in the North Atlantic. Our results suggest a significant increase in storm surge risk for the northern Gulf Coast, Florida and some areas near the mid-Atlantic. Also importantly, we show that ML/AI can be leveraged effectively to address the potential issue of ‘Grey Swan’ TCs and their impacts.

How to cite: Balaguru, K., Rice, J., Judi, D., Sun, N., and Daniel, B.: Addressing the US Tropical Cyclone-Storm Surge risk using RAFT-DeepSurge, an advanced AI-based approach , EGU General Assembly 2025, Vienna, Austria, 27 Apr–2 May 2025, EGU25-2013, https://doi.org/10.5194/egusphere-egu25-2013, 2025.

EGU25-3286 | Posters on site | CL5.9

Emulation and S2S probabilistic prediction of 2-m temperature and precipitation over the global domain using linear inverse modeling 

Sergey Kravtsov, Andrew Robertson, Jing Yuan, and Mohammad Ghadamidehno

We developed a data-driven system for joint prediction of daily precipitation (Pr) and near-surface temperature (T2m) over the global domain by utilizing NASA’s satellite observations and the associated reanalysis products, with the focus on S2S hydrologic forecasting. Our approach is based on a well-established methodology of linear inverse modeling modified and adapted by our science team for high-resolution modeling of precipitation. The key element of this new methodology is the usage of a so-called pseudo-precipitation (PP) variable, equal to the actual Pr where precipitation is occurring and, otherwise, equal to the (negative) air-column integrated water-vapor saturation deficit — the amount of water vapor to be added to the air column to achieve saturation at each vertical level. The model’s jointly obtained Pr and T2m forecasts are then validated against the observed fields as usual.

The above model is shown to be an efficient tool for emulating daily sequences of global coupled T2m and Pr fields with spatiotemporal characteristics strikingly similar to the observed characteristics. We used a large (100-member) ensemble of our statistical model’s hindcasts of precipitation over global domain to predict probabilities of weekly and biweekly precipitation amounts in one of the three categories (below normal, normal, and above normal) and compared these hindcasts with those based on the NASA GEOSS2S v2p1 model (4-member ensemble), calibrated using extended logistic regression. While the statistical model’s S2S precipitation forecast skill is somewhat lower than that of the reference NASA state-of-the-art system, it exhibits similar geographical and seasonal distributions, which warrants further research. We are currently looking into incorporating automated ML/AI feature identification techniques into our existing set up (with a linear activation function), to fine-tune the model learning and improve its predictive potential.

How to cite: Kravtsov, S., Robertson, A., Yuan, J., and Ghadamidehno, M.: Emulation and S2S probabilistic prediction of 2-m temperature and precipitation over the global domain using linear inverse modeling, EGU General Assembly 2025, Vienna, Austria, 27 Apr–2 May 2025, EGU25-3286, https://doi.org/10.5194/egusphere-egu25-3286, 2025.

EGU25-4576 | ECS | Posters on site | CL5.9

On the robustness of AI model forecast skill and initial condition uncertainty of the 2021 Pacific Northwest Heatwave 

Osamu Miyawaki, Cuiyi Fei, Siyu Li, Dhruvit Patel, Giorgio Sarro, Huan Zhang, Adam Marchakitus, Pedram Hassanzadeh, Dorian Abbot, Jonathan Weare, Noboru Nakamura, and Tiffany Shaw

AI weather models are becoming valuable tools for predicting the weather. While AI models’ general forecasts are known to be skillful, their forecast skill of extreme events is not fully understood. The 2021 Pacific Northwest (PNW) heatwave is a good case study for AI models because it falls outside of the distribution of heat waves in AI model training datasets.

Here, we investigate the forecast performance of 8 AI models (AIFS, Gencast, NeuralGCM, Graphcast, Fuxi, Pangu, Fourcastnet, FourcastnetV2) of the 2021 PNW heatwave. Despite the event being out of the training dataset distribution, their forecast performance is comparable to that of a state-of-the-art numerical weather prediction model (IFS). Specifically, AI models and IFS can accurately forecast the heatwave for lead times less than 7 days.

Two recent studies suggest the predictability barrier of the PNW heatwave may be due to an initial condition observation error. Leach et al. (2024) found that the 26th ensemble member of a 250 member IFS forecast accurately forecasts the heatwave 12 days in advance. Vonich and Hakim (2024) used backpropagation in Graphcast to find an optimal initial condition that leads to an accurate forecast 10 days in advance. Are these initial conditions robust across an ensemble of AI models? And do these initial conditions point to a unique solution?

We find a large spread in forecast accuracy when running the 8 AI models with the Leach et al. (2024) and Vonich & Hakim (2024) initial conditions. Furthermore we ran 1000 member ensembles in NeuralGCM and find initial conditions that lead to an accurate long-term forecast are not unique. These results suggest that the improvement in forecast accuracty to certain initial conditions may not necessarily be due to the initial conditions being closer to ground truth but rather they are due to cancelation of model error.

How to cite: Miyawaki, O., Fei, C., Li, S., Patel, D., Sarro, G., Zhang, H., Marchakitus, A., Hassanzadeh, P., Abbot, D., Weare, J., Nakamura, N., and Shaw, T.: On the robustness of AI model forecast skill and initial condition uncertainty of the 2021 Pacific Northwest Heatwave, EGU General Assembly 2025, Vienna, Austria, 27 Apr–2 May 2025, EGU25-4576, https://doi.org/10.5194/egusphere-egu25-4576, 2025.

EGU25-4735 | ECS | Orals | CL5.9

Application of a novel deep learning model for precipitation nowcasting  

Fereshteh Taromideh, Giovanni Francesco Santonastaso, and Roberto Greco

In recent decades, the prediction of precipitation has become a central focus for atmospheric scientists and weather forecasters. In particular, improving the predictability of rapidly forming rainfall events is critical for protecting lives and property. The island of Ischia, located in the Campania region of Italy, has experienced several landslides and flash floods in recent years with catastrophic effects. To mitigate these geohydrological hazards on this island, we propose a method for short-term rainfall forecasting, with "short-term" defined as a time frame up to six hours. Accurate predictions are essential, as they enable timely implementation of protective measures to safeguard the population.

Accurately predicting rainfall is a complex task influenced by numerous factors, including humidity, temperature, pressure, and wind speed. Historically, rainfall nowcasting has primarily relied on numerical weather prediction (NWP) models. However, this approach has notable limitations, such as high computational requirements and significant processing time, which make NWP models less practical for short-term forecasts.

In the past decade, machine learning (ML) models have revolutionized the way complex problems are addressed and solved, offering solutions that are both fast and highly efficient. Within this domain, deep neural networks (DNNs) a subset of ML have become increasingly prevalent for tackling complex problems using large datasets. Among these, U-Net, a specific DNNs architecture, has proven to be one of the most effective and accurate models for prediction tasks when the input data is image-based. However, achieving high accuracy with such models requires careful preprocessing of the dataset to enhance the model’s ability to effectively learn from the data. Additionally, properly tuning the model's hyperparameters is crucial for optimizing its performance.

In this study, we propose an enhanced U-Net model for nowcasting rainfall with a 120-minute lead time. The input data consists of rainfall radar data and rain gauge measurements. Furthermore, the study evaluates the model's performance under different training scenarios, comparing its efficacy when using only rainfall radar data versus an integrated dataset combining radar and rain gauge data. It is worth noting that the model operates in a regression framework, where the labels or outputs are the rain gauge readings with a 120-minute lead time.


How to cite: Taromideh, F., Santonastaso, G. F., and Greco, R.: Application of a novel deep learning model for precipitation nowcasting , EGU General Assembly 2025, Vienna, Austria, 27 Apr–2 May 2025, EGU25-4735, https://doi.org/10.5194/egusphere-egu25-4735, 2025.

Accurate air temperature (Ta)  forecasting in urban areas is crucial for various socio-economic aspects, including risk warning and optimization of electricity systems. However, forecasting within urban environments faces substantial challenges due to the coarse spatial resolution and inadequate urban representation in numerical weather prediction (NWP) models. In this study, we present a novel multimodal deep learning framework that learns local dynamics from ground-level weather stations while effectively informing large-scale weather patterns for short-range (1- 24  hour lead time) Ta forecasting. The framework first employs graph neural networks (GNNs) to model intra-city spatiotemporal dynamics across 35 weather stations, achieving over 12% forecast improvement compared to modeling individual time series, primarily through mean state regularization. We further develop an end-to-end multimodal framework by integrating the GNN with synoptic weather patterns, achieving an additional 23% improvement, with particular expertise in winter and capturing cold spell events. Our study demonstrates the effectiveness of incorporating multi-scale information from diverse data sources and reveals that weather patterns within approximately 2000 km are critical for local city-scale forecasting. This framework can be readily adapted to other urban areas and will benefit significantly from the increasing deployment of smart IoT sensors to effectively address intra-city temperature heterogeneity.

How to cite: Wang, H. and Yang, J.: Multimodal Deep Learning Framework for Urban Air Temperature Forecasting: Bridging Local and Synoptic Scales, EGU General Assembly 2025, Vienna, Austria, 27 Apr–2 May 2025, EGU25-4940, https://doi.org/10.5194/egusphere-egu25-4940, 2025.

EGU25-5319 | ECS | Posters on site | CL5.9

Precipitation nowcasting diffusion model based on turbulence theory and multi-source data 

Dawei Li, Kefeng Deng, Di Zhang, Hongze Leng, Kaijun Ren, and Junqiang Song

Precipitation nowcasting is a long-standing challenge due to the inherent unpredictability, which often lead to significant risks and damage. While traditional approaches focus on modeling the nonlinear relationship between initial precipitation states and future states, these methods often fail to capture accurate precipitation dynamics, such as its distribution and intensity. The absence of guidance from physical theory limits data-driven methods in disclosing the chaotic nature of precipitation. To address this, we integrate Prandtl’s mixing length theory from fluid dynamics with diffusion models commonly used in computer vision to enhance the prediction of precipitation distributions and details over the next 200 minutes. This integration accounts for the turbulent properties of precipitation, improving both accuracy and granularity in forecasts. Additionally, we leverage multi-source data, particularly lightning observations, to train a control network for our diffusion model. This enhancement allows for more accurate and controllable predictions of precipitation initiation, decay, and overall spatial-temporal patterns. Our approach advances the state of the art in precipitation nowcasting, offering a robust framework that bridges physical theory with modern deep learning techniques.

How to cite: Li, D., Deng, K., Zhang, D., Leng, H., Ren, K., and Song, J.: Precipitation nowcasting diffusion model based on turbulence theory and multi-source data, EGU General Assembly 2025, Vienna, Austria, 27 Apr–2 May 2025, EGU25-5319, https://doi.org/10.5194/egusphere-egu25-5319, 2025.

EGU25-7021 | ECS | Posters on site | CL5.9

Uncertainty-aware precipitation generation for Earth system models with diffusion models 

Michael Aich, Sebastian Bathiany, Philipp Hess, Yu Huang, and Niklas Boers

Earth system models (ESMs) play a vital role in understanding and forecasting the dynamics of the Earth's climate system. Accurate simulation of precipitation is especially critical for evaluating the impacts of anthropogenic climate change, anticipating extreme weather events, and devising sustainable strategies to manage water resources and mitigate related risks. However, ESMs often exhibit significant biases in precipitation simulation due to the wide range of scales involved in these processes and the substantial uncertainties they encompass. Moreover, due to computational constraints, ESM simulations still have low horizontal resolution compared to the scales relevant for precipitation.
    In this work, we present a novel framework to improve the representation of precipitation in ESMs by integrating physically modeled circulation variables with state-of-the-art generative diffusion models. Based on large-scale (1 degree) circulation fields, our method produces accurate high-resolution (0.25 degree) precipitation estimates at global scale. Our approach introduces stochasticity into the precipitation field, significantly improving the representation of extreme events and fine-scale variability while maintaining the fidelity of large-scale patterns. Our proposed methods thus provides an alternative to traditional column-based parameterization, avoiding the need for a posteriori bias correction and downscaling.
    Preliminary results highlight the ability of our generative model to produce precipitation fields with substantially smaller biases compared to those derived from classical parameterizations of the GFDL model, while achieving higher spatial resolution. In future climate scenarios, precipitation derived from parameterizations often becomes increasingly uncertain, whereas circulation variables, being more directly tied to large-scale dynamics, may provide a more stable foundation for generating high-resolution precipitation fields. Building on this, we demonstrate the application of our framework to generate daily high-resolution precipitation maps for future climate projections, offering an improved and robust tool to address critical challenges in climate impact studies.

How to cite: Aich, M., Bathiany, S., Hess, P., Huang, Y., and Boers, N.: Uncertainty-aware precipitation generation for Earth system models with diffusion models, EGU General Assembly 2025, Vienna, Austria, 27 Apr–2 May 2025, EGU25-7021, https://doi.org/10.5194/egusphere-egu25-7021, 2025.

EGU25-7075 | Posters on site | CL5.9

Use of NVIDIA FourCastNet model to improve tropical cyclones risk modelling.  

Remi Meynadier, Xavier Renard, Marius Koch, Hugo Rakotoarimanga, Georg Ertl, Jussi Leinonen, and Marcin Detyniecki

AXA is developing in-house Natural Hazard models (or Natural Catastrophe models) in order to gain a deeper understanding of, evaluate, and monitor the climate risks underpinning (re)insurance portfolios. Such models simulate large numbers of synthetic weather events to estimate the probability of rare and extreme events, enabling more robust risk management and informed decision-making.

AI-driven weather models offer the capability to rapidly produce thousands of unique ensemble scenarios of low-likelihood high-impact weather events such as tropical cyclones. This study specifically utilizes tropical cyclones (TCs) as a primary illustration of the potential of AI-based weather models for risk management.

In this study we use FourCastNet SFNO, the global data-driven weather forecasting model developed by NVIDIA available on the NVIDIA Earth-2 platform to simulate historical but also synthetic (i.e. never observed) hurricanes. SFNO trained on ECMWF ERA5 reanalysis data provides short to medium-range global predictions at 0.25° resolution. A large ensemble of hurricane simulations is performed using the HENS method, developed at Berkeley, the NVIDIA leveraging Earth2Studio from NVIDIA’s Earth-2 platform.

HENS-SFNO performance is first assessed by evaluating the model's ability to reproduce post-2017 historical hurricanes (intensity, track, landfall location). HENS-SFNO capabilities in simulating synthetic hurricanes are then assessed in a second step by evaluating track density and landfall frequencies by categories of hurricanes against the historical tropical cyclone IBTrACS database.

How to cite: Meynadier, R., Renard, X., Koch, M., Rakotoarimanga, H., Ertl, G., Leinonen, J., and Detyniecki, M.: Use of NVIDIA FourCastNet model to improve tropical cyclones risk modelling. , EGU General Assembly 2025, Vienna, Austria, 27 Apr–2 May 2025, EGU25-7075, https://doi.org/10.5194/egusphere-egu25-7075, 2025.

EGU25-7861 | Posters on site | CL5.9

Subseasonal to Seasonal Forecast Using Neural Ordinary Differential Equations 

Jonghan Lee and Woosok Moon

While short-term weather forecasting has benefited from extensive data and research, leading to high predictive accuracy, long-term forecasts, particularly medium-range predictions, lag significantly due to data scarcity. This research aims to bridge this gap by leveraging the advancements in Artificial Intelligence (AI), particularly Deep Learning. We propose a novel approach using Neural Ordinary Differential Equations (NODEs), which represents a transformative step in dynamic systems modeling. Neural ODEs offer a flexible and powerful framework for continuous-time models, which is particularly beneficial for handling sparse or irregularly sampled data prevalent in climate studies. Our methodology utilizes the Empirical Orthogonal Function (EOF) to extract principal component time series from limited climate data. These components serve as inputs for NODEs to predict future climatic conditions. This approach is innovative in its ability to handle non-linearities and temporal dependencies in climatic data, making it highly suitable for medium-range weather forecasting. The potential of NODEs in this context is significant, as they provide a means to accurately predict weather patterns with less data, a common limitation in long-term forecasting. By enhancing the precision of medium-range forecasts, this research contributes to more effective climate change adaptation and mitigation strategies, ultimately aiding in the safeguarding of ecosystems and human societies against the adverse effects of extreme weather conditions.

How to cite: Lee, J. and Moon, W.: Subseasonal to Seasonal Forecast Using Neural Ordinary Differential Equations, EGU General Assembly 2025, Vienna, Austria, 27 Apr–2 May 2025, EGU25-7861, https://doi.org/10.5194/egusphere-egu25-7861, 2025.

EGU25-8890 | ECS | Orals | CL5.9

Using deep neural networks for thunderstorm risk prediction. 

Mélanie Bosc, Adrien Chan Hon Tong, Aurélie Bouchard, and Dominique Béréziat

Airliners, struck by lightnings on average once a year, sometimes sustain structural or electrical damage. Even if these incidents generally do not compromise safety onboard due to existing certifications, they lead to costly downtimes and mandatory maintenance operations for the aviation industry. Anticipating the presence of thunderstorm risk areas could help minimize these impacts. Nowadays, predict the exact location of electrical activity in the atmosphere is a complex task because lightning is a non-linear phenomenon which is related to chaotic stormy environments. Numerous variables influence the initiation of electrical discharges, making their modeling using physical equation very challenging. This motivates the use of neural networks to establish relationships between various atmospheric parameters and electrical activity. In the context of aviation safety, this study focuses on the development of a very short term (less than one hour and every five minutes) thunderstorm risk forecasting method above oceans. The proposed methodology is based on computer vision techniques such as neural networks to generate lightning occurrence’s probability maps in the following hour. An encoder-decoder network named ED-DRAP (Che, H et al. 2022) is employed and adapted to the data. In addition to integrating convolutional operations, it also uses spatial and temporal attention mechanisms to process spatio-temporal sequences. Input data come from NOAA’s geostationary GOES-R satellite, including brightness temperature measured by the Advanced Baseline Imager sensor and past electrical activity detected by the Geostationary Lightning Mapper sensor. Outputs from the Numerical Weather Prediction model, Global Forecasting System, are also employed to complement the information provided by satellite imagery. Finally, the model’s outputs are calibrated to produce lightning risk probability maps which are representative of the physical reality, enabling better risk interpretation.

How to cite: Bosc, M., Chan Hon Tong, A., Bouchard, A., and Béréziat, D.: Using deep neural networks for thunderstorm risk prediction., EGU General Assembly 2025, Vienna, Austria, 27 Apr–2 May 2025, EGU25-8890, https://doi.org/10.5194/egusphere-egu25-8890, 2025.

EGU25-9087 | ECS | Orals | CL5.9

Coupling AI Emulators and Rare Event Algorithms to Sample Extreme Heatwaves 

Amaury Lancelin, Alex Wikner, Pedram Hassanzadeh, Dorian Abbot, Freddy Bouchet, Laurent Dubus, and Jonathan Weare

Heatwaves are among the most impactful extreme weather events, posing significant risks to human health, ecosystems, and energy systems. Understanding the return times of these events and assessing how climate change alters their frequency and intensity are critical for effective adaptation strategies. However, the rarity of record-breaking heatwaves in observational datasets makes this task highly challenging. Climate models, while capable of simulating such rare events, require prohibitively long simulations to generate robust statistics for events with return times on the order of centuries.

Our study addresses these challenges by leveraging a dual approach combining rare event simulation algorithms and AI-driven climate model emulators. Rare event algorithms, such as genetic algorithms, efficiently target the extreme trajectories leading to heatwaves while avoiding typical weather conditions, allowing for a more focused exploration of the event space. Although effective for long-duration events, these approaches are less suited to capturing shorter-term phenomena, necessitating novel methodologies for finer temporal scales.

In parallel, we leverage the advancements of deep learning in climate science by training neural networks-based climate model emulators based on Vision Transformers. These emulators drastically reduce computational costs and generate realistic climate simulations, including heatwave dynamics. Here, we explore coupling emulators with a new rare event algorithm specifically designed to sample short and extreme heatwaves. We demonstrate the efficiency of this method by calculating return times for unprecedented heatwave events.

In this work, we use data from PlaSim, a cheap-to-run climate model of intermediate complexity, which enables the verification of return periods spanning up to thousands of years. The next steps involve utilizing more state-of-the-art climate models at finer spatial resolutions and evaluating how the statistics of heatwaves may evolve under various climate change scenarios.

How to cite: Lancelin, A., Wikner, A., Hassanzadeh, P., Abbot, D., Bouchet, F., Dubus, L., and Weare, J.: Coupling AI Emulators and Rare Event Algorithms to Sample Extreme Heatwaves, EGU General Assembly 2025, Vienna, Austria, 27 Apr–2 May 2025, EGU25-9087, https://doi.org/10.5194/egusphere-egu25-9087, 2025.

EGU25-9541 * | ECS | Posters on site | CL5.9 | Highlight

Benchmarking Deep Learning Models for Probabilistic Subseasonal Forecasting of Heat Extremes 

Cas Decancq, Thomas Mortier, Daniel Hagan, Victoria Deman, Damián Insua Costa, Gustau Camps-Valls, Dim Coumou, and Diego Miralles

Predicting climate extremes such as droughts, heatwaves, and heat stress episodes remains a critical challenge in Earth system sciences. Current state-of-the-art methods often fail to deliver reliable forecasts, especially at subseasonal-to-seasonal (S2S) timescales (i.e., from two weeks to two months in advance). As global climate variability continues evolving, the need for advanced, trustworthy, data-driven forecasting methodologies has never been more pressing.

Extended numerical weather prediction systems, such as those led by the European Centre for Medium-Range Weather Forecasts (ECMWF), remain the primary method for S2S prediction (Vitart & Robertson, 2018). While recent deep learning approaches have demonstrated remarkable competitive performance (e.g. Olivetti & Messori, 2024), proposed models predominantly focus on global-scale average weather predictions, overlooking critical local-scale extreme events (Pasche et al., 2024). Moreover, creating accurate probabilistic forecasts conditioned on the initial state remains a significant challenge within the scientific community. In the context of weather forecasting, traditional statistical methods, such as ensemble-based techniques that generate multiple forecasts to estimate uncertainty, are commonly used. These approaches include techniques such as introducing noise into initial states, varying neural network parameters, or training generative models. While generative models offer the most robust solutions, they demand substantial computational resources and extensive data availability.

Here, we evaluate several state-of-the-art dynamical weather forecasting systems, such as those of ECMWF and the National Centers for Environmental Prediction (NCEP), together with recently-proposed deep learning models on their ability to predict extreme heatwaves across all continents at S2S timescales. Since uncertainty quantification is essential for supporting practical decision-making, we focus on deep learning models that provide probabilistic forecasts and have publicly available source code. These include FourCastNet, proposed by Kurth et al. (2023), as well as ArchesWeather and ArchesWeatherGen, developed by Couairon et al. (2024). This analysis underscores the limitations of contemporary deep learning and dynamical weather forecasting systems in reliably and probabilistically predicting S2S extremes, while also providing a valuable benchmark to guide future research efforts.


References:

Couairon, G., Singh, R., Charantonis, A., Lessig, C., & Monteleoni, C. (2024). ArchesWeather & ArchesWeatherGen: a deterministic and generative model for efficient ML weather forecasting. arXiv preprint arXiv:2412.12971.

Kurth, T., Subramanian, S., Harrington, P., Pathak, J., Mardani, M., Hall, D., Miele, A., Kashinath, K., & Anandkumar, A. (2023). FourCastNet: Accelerating global high-resolution weather forecasting using adaptive Fourier neural operators. Proceedings of the Platform for Advanced Scientific Computing Conference (PASC '23), Article 13, 1–11. https://doi.org/10.1145/3592979.3593412

Olivetti, L., & Messori, G. (2024). Do data-driven models beat numerical models in forecasting weather extremes? A comparison of IFS HRES, Pangu-Weather, and GraphCast. Geoscientific Model Development17(21), 7915-7962.

Pasche, O. C., Wider, J., Zhang, Z., Zscheischler, J., & Engelke, S. (2025). Validating Deep Learning Weather Forecast Models on Recent High-Impact Extreme Events. Artificial Intelligence for the Earth Systems4(1), e240033. https://doi.org/10.1175/AIES-D-24-0033.1

Vitart, F., & Robertson, A. W. (2018). The sub-seasonal to seasonal prediction project (S2S) and the prediction of extreme events. npj climate and atmospheric science1(1), 3.

How to cite: Decancq, C., Mortier, T., Hagan, D., Deman, V., Insua Costa, D., Camps-Valls, G., Coumou, D., and Miralles, D.: Benchmarking Deep Learning Models for Probabilistic Subseasonal Forecasting of Heat Extremes, EGU General Assembly 2025, Vienna, Austria, 27 Apr–2 May 2025, EGU25-9541, https://doi.org/10.5194/egusphere-egu25-9541, 2025.

EGU25-11549 | ECS | Orals | CL5.9

Improving Spatial Uncertainty Representation in Sub-seasonal Wind Speed Forecasts Using Quantile Regression, VAE and Diffusion 

Ganglin Tian, Anastase Alexandre Charantonis, Camille Le Coz, Alexis Tantet, and Riwal Plougonven

The uncertainty quantification in sub-seasonal wind speed forecasting is important for risk assessment and decision-making. One way to improve dynamical forecast skills is to regress information from forecasts of large-scale fields to surface fields by a supervised learning model. For such a statistical downscaling approach, Tian et al. (2024) demonstrated that spatially independent stochastic perturbations based on model residuals can improve the representation of ensemble dispersion. However, this method is limited in fully representing complex spatial correlations and maintaining physical consistency across meteorological fields. Recent advances in probabilistic deep learning models offer promising new approaches for uncertainty quantification, particularly in capturing spatial dependencies.


This study investigates how different statistical downscaling methods can better represent dynamic spatial uncertainty in sub-seasonal ensemble forecasts compared to the independent stochastic perturbation approach. We examine three probabilistic deep learning methods with distinct uncertainty quantification mechanisms: the Quantile Regression for direct modeling of distribution quantiles, the Variational Autoencoders (VAE) for latent space sampling, and the Diffusion model for iterative denoising-based distribution modeling. Our two-stage framework first trains these regression models on the ERA5 reanalysis to establish their capacity for spatial uncertainty representation from the 500hPa geopotential height (Z500) to the surface wind speeds (U100), then applies these probabilistic models to the ECMWF Z500 hindcasts to regress U100 ensembles.


Comprehensive verification reveals distinct characteristics of each method. First, in terms of grid point-wise metrics (the MSE and the CRPS), all these probabilistic methods achieve comparable forecasting skills to independent stochastic perturbations, despite their different approaches to uncertainty representation. Second, spatial structure analysis through Empirical Orthogonal Functions (EOF) analysis and zonal energy spectra demonstrates notable differences: while all methods effectively capture large- and medium-scale features, they differ significantly in representing small-scale spatial correlations. The grid-independent nature of independent stochastic perturbations leads to over-representation of small-scale variations, whereas the Diffusion model shows superior performance across all spatial scales. The Quantile Regression and the VAE show relatively limited skill in capturing small-scale spatial features. These findings suggest that probabilistic downscaling methods, particularly the Diffusion model, can better reconstruct spatial characteristics while maintaining comparable forecasting skills.


Our results indicate that probabilistic downscaling methods can provide more realistic representations of spatial uncertainty compared to the independent stochastic approach, particularly in reconstructing spatial correlations and maintaining physical consistency. This study advances our understanding of how deep learning methods can improve uncertainty quantification in sub-seasonal forecasting.


Tian, Ganglin, et al. "Improving sub-seasonal wind-speed forecasts in Europe with a non-linear model." arXiv preprint arXiv:2411.19077 (2024).

How to cite: Tian, G., Charantonis, A. A., Le Coz, C., Tantet, A., and Plougonven, R.: Improving Spatial Uncertainty Representation in Sub-seasonal Wind Speed Forecasts Using Quantile Regression, VAE and Diffusion, EGU General Assembly 2025, Vienna, Austria, 27 Apr–2 May 2025, EGU25-11549, https://doi.org/10.5194/egusphere-egu25-11549, 2025.

EGU25-11905 | ECS | Orals | CL5.9

Feature selection for data-driven seasonal forecasts of European heatwaves 

Ronan McAdam, Jorge Pérez-Aracil, Antonello Squintu, Cesar Peláez-Rodríguez, Felicitas Hansen, Verónica Torralba, Harilaos Loukos, Eduardo Zorita, Matteo Giuliani, Leone Cavicchia, Sancho Salcedo-Sanz, and Enrico Scoccimarro

The early-warning of heatwaves using seasonal forecasting systems has the potential to mitigate economic losses and loss of life. Because of the limited reliability and computational expense of dynamical forecast systems, efforts in recent years have turned to exploiting the power of Machine Learning. Recent years have seen data-driven methods of forecasting deliver added-value for short-term forecasting, yet work on the seasonal scale is not yet as mature. Within the framework of the European Horizon project “CLINT - Climate Intelligence”, a purely data-driven approach to forecasting summer heatwaves on seasonal timescales has been developed. This approach is based on a novel optimisation-based feature selection framework that detects the optimal combination of variables, domains and lag times used to predict heatwaves. The feature selection is performed on multi-millennial paleo-simulation, ensuring sufficient training data, and it is demonstrated that predictors in the model-world are relevant to predictions of the recent past (1993-2016). For forecasts of summer heatwave propensity initialised in May, the data-driven approach matches the skill of the state-of-the-art dynamical multi-model product over Europe, and even outperforms individual systems, at a considerably lower cost. Moreover, low skill over Scandinavia and northern Europe, a long-term issue common to most dynamical systems, is improved in the data-driven approach. Besides forecasts, the data-driven approach also provides insight into the key predictors of European summer heatwave tendency; in particular most-commonly selected predictors correspond to 1-2 months prior to the start of summer (i.e., March) and some have not yet been discussed in existing literature. 

How to cite: McAdam, R., Pérez-Aracil, J., Squintu, A., Peláez-Rodríguez, C., Hansen, F., Torralba, V., Loukos, H., Zorita, E., Giuliani, M., Cavicchia, L., Salcedo-Sanz, S., and Scoccimarro, E.: Feature selection for data-driven seasonal forecasts of European heatwaves, EGU General Assembly 2025, Vienna, Austria, 27 Apr–2 May 2025, EGU25-11905, https://doi.org/10.5194/egusphere-egu25-11905, 2025.

EGU25-11955 | ECS | Orals | CL5.9

Enhancing Subseasonal Precipitation Forecasting with Foundation Models: A Performance-Driven Study 

Francesco Bosso, Riccardo Musto, and Loris Panza

Sub-seasonal to seasonal (S2S) precipitation forecasting, the forecasting of precipitation from 2 weeks up to 1 month in advance, is crucial to support early warning and decision-making operations in real-world scenarios. To correctly allocate water resources or plan mitigation strategies at sub-seasonal lead times, high-quality precipitation forecasting can be game-changing to prevent phenomena such as droughts or floods. One of the main sources of uncertainty affecting state-of-the-art models comes from the overlapping of phenomena at different spatiotemporal scales. At sub-seasonal lead-time, the timeframe is short enough for the atmosphere to retain some influence from its initial state but also long enough for oceanic variability to affect atmospheric circulation. This turns into an overlapping of different effects that state-of-the-art models struggle to relate.

Foundation Models (FMs) are emerging as a transformative paradigm in artificial intelligence, revolutionising remote sensing and Earth observation through their ability to build general and high-level representations from large-scale datasets. These models leverage Self-Supervised Learning (SSL) techniques to address fundamental challenges in Earth observation, most notably the scarcity of labelled data and the dynamic nature of environmental phenomena. By employing pre-training on vast amounts of unlabeled geospatial data, FMs generate informative representations that can be effectively adapted to multiple downstream tasks with minimal supervised fine-tuning. Once trained, FMs can achieve high performance across diverse applications while adapting to various spatial and temporal contexts with minimal additional training.

In this study, we aim to perform sub-seasonal precipitation prediction by leveraging the general climatic data representations derivable from FMs, augmented with region-specific fine-tuning. The approach focuses on adapting the global-level representation encoded within the model to a specific region, enabling a blending effect in the model’s parameters that captures information across multiple spatial scales and generates a more informed view to predict S2S precipitation. The process is currently focused on model training and calibration, with insights to be shared upon achieving stable performance.

How to cite: Bosso, F., Musto, R., and Panza, L.: Enhancing Subseasonal Precipitation Forecasting with Foundation Models: A Performance-Driven Study, EGU General Assembly 2025, Vienna, Austria, 27 Apr–2 May 2025, EGU25-11955, https://doi.org/10.5194/egusphere-egu25-11955, 2025.

The rise of deep learning weather prediction (DLWP) models promises to improve short- to mid-ranged weather forecasts out to 14 days. Deep learning models, however, are known in general to perform poorly in conditions that are represented sparsely in the training data and to generalize poorly out of the distribution of the training data. Translated to weather forecasting, this suggests that DLWP models are inaccurate when predicting extreme events that occur only rarely. These extreme events, however, are of highest interest when preventing danger and damage to societies. Here, we therefore inspect how state-of-the-art DLWP models compare to the numerical weather prediction (NWP) model from the European Center for Medium-Ranged Weather Forecasts (ECMWF) on extreme cold and hot spells over North America and Europe. Our results speak not only for DLWP forecasts under normal conditions, but also promise significant skill improvements when forecasting extreme events with DLWP models, emphasized most stongly on cold spells over North America. Similar but weaker trends are observed in cold spell conditions over Europe, as well as in hot spells over North America and Europe. In general, our findings encourage further research in data driven models, such as Pangu-Weather, GraphCast, Aurora, and ECMWF's AIFS. Notably, the advances in DLWP is directly related to decades of research on NWP models. In future research, we will explore the response of DLWP models to warmer climate scenarios that are expected in the later 21st century.

How to cite: Schaible, A., Karlbauer, M., and Butz, M. V.: Deep Learning Weather Prediction Models Exhibit Outstanding Accuracy when Predicting Cold and Hot Spells over North America and Europe, EGU General Assembly 2025, Vienna, Austria, 27 Apr–2 May 2025, EGU25-11969, https://doi.org/10.5194/egusphere-egu25-11969, 2025.

EGU25-12021 | ECS | Posters on site | CL5.9

Meteorological Analysis and Prediction of Gusts at Istanbul Airport Using Machine Learning Algorithms 

ibrahim akbayır, veli yavuz, Deniz Demirhan, and Berk Münci İnanç

Wind gust is a sudden meteorological weather phenomenon. It can cause many material and moral accidents, especially if it occurs during aircraft take-off and landing at airports. In this study, gust analysis and gust prediction for Istanbul Airport were performed using machine learning algorithms. Metar data of Istanbul Airport between 01.11.2018 and 31.12.2024 were used in the study. When this Metar data was analysed, it was found that on average between 250 and 300 Gust events were reported annually.  Gust values were found to vary between 11 and 65 knots. It was reported that the highest number of gust events was reported in November with 179 times and the lowest number was reported in August with 38 times. When the gust intensities are analyzed, it is seen that the strongest gusts occurred in February. When the gusts were analyzed hourly, it was found that most gusts occurred between 01.00 and 03.00 hours. The most severe gusts occurred between 15.00 and 20.00. In the study, the relationship between gusts and other meteorological variables such as temperature, pressure, dew point temperature was analyzed. In the other part of the study, three different machine learning methods Random Forest (RF), long-short term memory (LSTM) and extreme gradient boosting (XGB) were used to predict gusts. In these methods, models were derived and evaluated on 1000 different randomly selected subsets, 70% for training and 30% for testing. It was observed that the prediction success of the three different models used in the study increased at times of high wind gust values (≥ 30 knots), while the prediction success was lower at times of low wind gust values.


How to cite: akbayır, I., yavuz, V., Demirhan, D., and İnanç, B. M.: Meteorological Analysis and Prediction of Gusts at Istanbul Airport Using Machine Learning Algorithms, EGU General Assembly 2025, Vienna, Austria, 27 Apr–2 May 2025, EGU25-12021, https://doi.org/10.5194/egusphere-egu25-12021, 2025.

We present a machine learning based method for predicting extreme precipitation events. This method uses dynamical and thermodynamical variables at coarse resolution as input and the probability of extreme precipitation at higher resolution as the ground truth. Preliminary results show that our detection method, trained on historical EC-Earth3 global climate data and an extreme precipitation mask calculated from the 99th percentile of precipitation from the HCLIM regional model, achieves an accuracy of over 90% for the 2050–2100 period under the SSP126 and SSP370 scenarios within the European domain.
We are working on further improving the method, testing its performance on reanalysis datasets (e.g., ERA5 and CERRA), and adapting it for statistical downscaling and regional climate model emulation.

How to cite: Ivanov, M. and Fuentes Franco, R.: DETEX – Detection of Extreme Precipitation Events in Present and Future Climates at High Resolution Using Machine Learning, EGU General Assembly 2025, Vienna, Austria, 27 Apr–2 May 2025, EGU25-12676, https://doi.org/10.5194/egusphere-egu25-12676, 2025.

EGU25-12774 | ECS | Orals | CL5.9

From Weather Data to River Runoff: Using Spatiotemporal Convolutional Networks for Discharge Forecasting 

Florian Börgel, Sven Karsten, Karoline Rummel, and Ulf Gräwe

The quality of the river runoff determines the quality of regional climate projections for coastal oceans or other estuaries. This study presents a novel approach to river runoff forecasting using Convolutional Long Short-Term Memory (ConvLSTM) networks. Our method accurately predicts daily runoff for 97 rivers within the Baltic Sea catchment by modeling runoff as a spatiotemporal sequence defined by atmospheric forcing. The ConvLSTM model predicts river runoff with an accuracy of ±5% when compared to the hydrological model. Compared to more complex process-based hydrological models, ConvLSTM offers fast processing times and easy integration into climate models, demonstrating its potential as a powerful tool for climate simulation and water resource management.

How to cite: Börgel, F., Karsten, S., Rummel, K., and Gräwe, U.: From Weather Data to River Runoff: Using Spatiotemporal Convolutional Networks for Discharge Forecasting, EGU General Assembly 2025, Vienna, Austria, 27 Apr–2 May 2025, EGU25-12774, https://doi.org/10.5194/egusphere-egu25-12774, 2025.

EGU25-13004 | ECS | Orals | CL5.9

Analysis of optimal atmospheric predictability using machine learning-based forecasting models 

Robert Brunstein, Christian Lessig, Thomas Rackow, and Jakob Schlör

With the development of highly skillful, machine learning-based weather prediction models over the last 2-3 years, many new possibilities have emerged. These include applications, such as downscaling, temporal interpolation, or generating climate storylines, but also a wide range of scientific questions can be (re)examined with the models. One of these is the study of predictability limits by leveraging the full differentiability of the models. For instance, Vonich and Hakim (2024) demonstrated that optimizing initial conditions using the pre-trained GraphCast model significantly reduces forecasting error, even when used with another machine learning-based forecasting model. While this suggests that the improvement in the initial conditions is not only due to compensation in model error, it remains currently unclear to which extent the initial conditions are enhanced by physically meaningful features.

In our work, we aim to address this shortcoming. As a first step, we analyze whether optimized initial conditions can be identified for a broad range of cases by assessing the forecast skill of the model for a larger set of examples. We evaluate the improvement of the forecasts for several variables dependent on the number of optimization steps, the forecast lead time, and for different models. Subsequently, we consider case studies over Europe and compare the optimized initial conditions with data from independent, high quality datasets, in particular local reanalyses and conventional observations. In this way, we examine if the optimized states are physically better aligned with reference data than the original ERA5 initial conditions. To better understand which of the features in the optimized initial conditions lead to the improved forecast, we analyze the null space of the given machine learning-based weather prediction models. This allows us to obtain insight into the information that is exploited by the models for a forecast. 

Our work will shed light on the intrinsic predictability limits of weather forecasts and also how MLWP can provide forecasts that outperform equation-based weather prediction models.

How to cite: Brunstein, R., Lessig, C., Rackow, T., and Schlör, J.: Analysis of optimal atmospheric predictability using machine learning-based forecasting models, EGU General Assembly 2025, Vienna, Austria, 27 Apr–2 May 2025, EGU25-13004, https://doi.org/10.5194/egusphere-egu25-13004, 2025.

EGU25-13581 | Posters on site | CL5.9

Enhancing European heatwave characterization: deep learning-based downscaling of global climate data 

Tian Tian, Hortense Ronzani, Maxime Beauchamp, Jian Su, Kristofer Krus, Shuting Yang, and Ramon Fuentes-Franco

As part of the OptimESM project, this work aims to prototype a framework for downscaling post-CMIP6 Earth System Models (ESMs) to refine long-term projections up to 2300. This effort focuses on understanding regional climate impacts and extreme events, including heatwaves, droughts, and precipitation extremes, with the goal of supporting robust regional climate projections and informing adaptation strategies across Europe. Within this broader context, our study investigates the application of deep learning techniques to downscale daily temperature fields, enhancing the detection and characterization of European heatwaves through improved spatial resolution. Utilizing the open-source DeepR library based on Transformer architecture, we obtained a five-fold downscaling from ERA5 to CERRA datasets. Performance evaluation highlighted significant improvements in detecting heatwaves, particularly in mountainous areas. Integrating high-resolution orography data increases accuracy by 53%, improving the detection rates of heatwave days from 18% (ERA5) to 27% (DeepR) in regions like southern Norway during the validation period 2015-2020. Despite some perceptual improvement, challenges remain in generalizing across spatial domains and accurately modeling temperature distribution tails, which are critical for extreme events. To address these limitations, we explore advanced architectures such as UNet and Diffusion Models, alongside high-resolution land-cover data and enhanced land-sea masks.

How to cite: Tian, T., Ronzani, H., Beauchamp, M., Su, J., Krus, K., Yang, S., and Fuentes-Franco, R.: Enhancing European heatwave characterization: deep learning-based downscaling of global climate data, EGU General Assembly 2025, Vienna, Austria, 27 Apr–2 May 2025, EGU25-13581, https://doi.org/10.5194/egusphere-egu25-13581, 2025.

EGU25-14049 | Orals | CL5.9

Application and Evaluation of Data-Driven Weather Prediction (DWP) Model for Climate Modeling 

Chia-Ying Tu, Yu-Chi Wang, Chung-Cheh Chou, and Zheng-Yu Yan

Recent advancements in AI/ML weather prediction models have attracted significant attention for their innovative approaches to forecasting. These models, leveraging deep learning techniques applied to the European Centre for Medium-Range Weather Forecasts (ECMWF) ERA5 reanalysis data, predict future states of meteorological variables iteratively over specific time steps to generate forecasts. Known as Data-Driven Weather Prediction (DWP), this methodology has demonstrated comparable accuracy to Numerical Weather Prediction (NWP) models for certain variables while requiring substantially less computational effort. Despite its advantages, DWP’s reliance on historical data patterns limits its ability to predict extreme or evolving weather phenomena influenced by global warming and climate change. These limitations present challenges for its application in climate simulations and projections.

To address these limitations, this study explored the application of the GraphCast DWP model in climate research, focusing on global climate downscaling and bias correction. Preliminary experiments with 24-hour GraphCast integrations spanning 36 years (1979–2014) demonstrated that GraphCast’s climate integrations closely align with the mean state and trends of the HiRAM climate simulation. Additionally, the model demonstrates variance in precipitation and surface temperature comparable to ERA5. The primary objective of this study is to demonstrate that this innovative approach to global climate modeling provides both computational efficiency and robust performance, effectively capturing climate phenomena while preserving critical information from climate simulations. Furthermore, the proposed methodology underscores the potential of GraphCast to advance global climate modeling, indicating its suitability for future projections conducted by low-resolution climate models.

How to cite: Tu, C.-Y., Wang, Y.-C., Chou, C.-C., and Yan, Z.-Y.: Application and Evaluation of Data-Driven Weather Prediction (DWP) Model for Climate Modeling, EGU General Assembly 2025, Vienna, Austria, 27 Apr–2 May 2025, EGU25-14049, https://doi.org/10.5194/egusphere-egu25-14049, 2025.

EGU25-14190 | Posters on site | CL5.9

Development of a Deep Learning-Based Weather Forecasting Model Using Short-Term Neighborhood Forecast Data 

Sangbeom Jang, Ju-Young Shin, Jiyeon Park, Seoyoung Kim, and Gayoung Lee

Weather forecasting plays a critical role in preventing natural disasters and improving convenience in daily life. However, traditional physics-based numerical weather prediction models have limitations in real-time and high-resolution predictions due to computational complexity and restricted computational resources. This study aims to enhance the predict skill of short-term weather forecasting by utilizing deep learning technologies. Particularly, this study attempts to seek developing methodologies to improve the skill of short-term rainfall forecasts produced by the Korea Meteorological Administration through artificial intelligence. By addressing systemic biases and errors in rainfall prediction data, this research aims to enhance predictive performance. Weather forecast data collected at 1-hour intervals—including temperature, wind speed, humidity, and precipitation—was preprocessed and used as input for the deep learning model. A deep neural network-based architecture was designed for building the forecast model. The model was trained, validated, and evaluated using data spanning the past three years. This study is expected to improve the skill of short-term weather forecasts while enhancing computational efficiency compared to conventional physics-based numerical weather prediction models. Furthermore, the proposed model demonstrates high potential for application in various fields, including disaster management, agriculture, and energy management.

How to cite: Jang, S., Shin, J.-Y., Park, J., Kim, S., and Lee, G.: Development of a Deep Learning-Based Weather Forecasting Model Using Short-Term Neighborhood Forecast Data, EGU General Assembly 2025, Vienna, Austria, 27 Apr–2 May 2025, EGU25-14190, https://doi.org/10.5194/egusphere-egu25-14190, 2025.

EGU25-14537 | Orals | CL5.9

Developing Extreme Weather Event training datasets to accelerate Machine Learning Applications 

Adrian McDonald and Gokul Vishwanathan

Climate change is increasing the frequency and intensity of Extreme Weather Events (EWEs), which causes widespread disruption globally. As these events intensify, the need for better hazard identification becomes critical. While machine learning (ML) is already enhancing forecasts, and has huge potential for identifying future hazards. To unlock this potential, we need comprehensive training datasets of historic EWEs that integrate and harmonize diverse datasets, account for data collection discrepancies, and address gaps in temporal and spatial records.

This presentation initially discusses the development of an Aotearoa New Zealand EWE database from 1996 to 2021, which currently includes occurrence data derived from subjective classifications from the national weather service, research organizations, and insurance information. Careful analysis of that database and ancillary reanalyses output can successfully characterise rainfall extreme intensities by deriving duration, peak rainfall, and total accumulation.

Building on that work, this presentation will discuss the development and testing of a methodology to integrate extreme weather event (EWE) occurrence, intensity, and storm track data into a unified database. By processing this combined dataset, we aim to harmonise data from the disparate sources and improve data accuracy and reliability, making it robust for future ML analyses. We also use our experience of applying ML classification schemes in climate research to provide proof-of-concept applications demonstrating the value of our harmonisation methodology.

How to cite: McDonald, A. and Vishwanathan, G.: Developing Extreme Weather Event training datasets to accelerate Machine Learning Applications, EGU General Assembly 2025, Vienna, Austria, 27 Apr–2 May 2025, EGU25-14537, https://doi.org/10.5194/egusphere-egu25-14537, 2025.

EGU25-15547 | Orals | CL5.9

AI- enhanced seasonal predictions of Mediterranean cyclones 

Leone Cavicchia, Guido Ascenso, Luca Proserpio, Enrico Scoccimarro, Silvio Gualdi, Matteo Giuliani, and Andrea Castelletti

Intense cyclones form frequently in the Mediterranean region, with the potential to cause damage to life and property when they hit highly populated coastal areas. Cyclone impacts are caused by the associated strong winds, flash flooding and storm surge. The social and economic impacts are not limited to the Mediterranean area, as cyclones forming in the region can affect Central Europe. While the skill of weather models to forecast such events has dramatically improved over the last decade, the seasonal predictability of Mediterranean cyclones lags behind due to the limitations on horizontal resolution in probabilistic forecasts requiring a large ensemble of simulations. Improving the prediction at a seasonal scale of those extreme events would be of great benefit for society, enabling better disaster risk management and reducing the economic losses they cause. A better prediction of climate extremes would also directly benefit a number of economic sectors such as the insurance and re-insurance industry.

The goal of this work, within the CLINT Horizon project, is to use Artificial Intelligence techniques to enhance the skill of a state-of-the-art seasonal prediction system for predicting Mediterranean cyclones. Here we present results making use of a hybrid AI approach linking the occurrence of those extreme events to their large-scale drivers. The training and validation of different machine learning models is performed using ERA5 reanalysis data. The trained models are then applied to the output of the CMCC operational seasonal forecasts in hindcast mode, and the skill of the modelling chain is assessed. The performance of machine learning models of varying complexity (e.g. random forest, gradient boosting, convolutional neural networks) is evaluated.

How to cite: Cavicchia, L., Ascenso, G., Proserpio, L., Scoccimarro, E., Gualdi, S., Giuliani, M., and Castelletti, A.: AI- enhanced seasonal predictions of Mediterranean cyclones, EGU General Assembly 2025, Vienna, Austria, 27 Apr–2 May 2025, EGU25-15547, https://doi.org/10.5194/egusphere-egu25-15547, 2025.

EGU25-15750 | ECS | Posters on site | CL5.9

Sub-seasonal Prediction of Agricultural Drought in India Using Long-Short-Term Memory Networks 

Saurabh Verma and Karthikeyan Lanka

Agricultural drought (AGD), defined by a deficit in soil moisture, is a complex natural hazard phenomenon that causes extreme damage to water supply, food production, and socio-economic loss at different time scales. India is a developing country, and 60% of its population depends on agriculture. India has experienced frequent extreme drought conditions in the last few decades, for example, the 2015-16 North Indian and 2017-18 Southern Indian drought, where more than 330 million people were affected due to food unavailability and shortage in groundwater resources. The spatial patterns of AGD vary significantly in India due to uncertainty in regional climatic conditions caused by the immense increase in global warming. The prediction of agricultural drought at a sub-seasonal scale would help the farming community to plan appropriate crops for the season and conserve water for irrigation.

This study proposes a statistical framework to predict the agricultural drought with 1-, 2-, and 3-month lead times over the Indian subcontinent. Soil moisture percentiles (SMP) are utilised as a drought index where values less than 20th percentiles represent drought conditions. SMP is a widely used drought index in research because it directly represents the water content in the soil and responds relatively quickly to changes in soil water content due to variations in rainfall and irrigation. The variation of SMP depends on various hydroclimatic parameters at local and non-local scales. Thus, this study has considered the air temperature (max. and min.), Potential Evapotranspiration, Vapour Pressure Deficit, Rainfall, soil moisture percentile, Normalised Difference Vegetation Index, El-Nino southern oscillation, North Atlantic Oscillation, Indian Ocean Dipole, Pacific Decadal Oscillation, and Madden Julian Oscillation as a predictor (or feature) from the various satellite (NOAA-19, 20, and AVHRR) and observational (IMD – Indian Meteorological Department) data sources. The Long-Short-Term Memory (LSTM) model, with an MSE custom loss function, is used to forecast agricultural drought. The model was trained from June 1981 to May 2015 and tested at each grid point cell between June 2015 and May 2022. The model performance is examined using Pearson’s correlation > 0.6 for a 1-month lead and further decreased for a 2 and 3-month lead. The forecasting matrices such as percentage porrect, POD, FAR, and ETS indicated that the predictability of AGD is comparably high over northern, southern, and north-eastern India. At last, the trained models are used to discover variables that, depending on feature relevance, influence agricultural drought predictability on a sub-seasonal scale. The result shows that vapour pressure deficit followed by maximum temperature, Pacific decadal oscillation, and soil moisture percentile are the primary features that control drought predictability.

How to cite: Verma, S. and Lanka, K.: Sub-seasonal Prediction of Agricultural Drought in India Using Long-Short-Term Memory Networks, EGU General Assembly 2025, Vienna, Austria, 27 Apr–2 May 2025, EGU25-15750, https://doi.org/10.5194/egusphere-egu25-15750, 2025.

EGU25-17884 | ECS | Orals | CL5.9

Predicting Hot Spell Duration with Random Forests 

Duncan Pappert, Mathieu Vrac, Dim Coumou, Alexandre Tuel, and Olivia Martius

High summer temperatures place significant stress on human and natural systems, often leading to severe impacts. Summer hot spells vary widely in terms of intensity and duration, yet event duration is often overlooked or considered a secondary aspect when it comes to studying and predicting such extremes. Different sectors in society, the economy, and the environment are vulnerable to extreme heat on different timescales; therefore, knowing  the likelihood of a heat event lasting only a few days or surviving over many weeks is crucial for developing more effective adaptation strategies.

In the last decade, machine learning (ML) techniques have increasingly been used to tackle extreme weather forecasting. Among these, Random Forests (RF) have emerged as an effective tool proven to have some skill in predicting the occurrence and mean amplitude of extreme near-surface temperature events. To the best of our knowledge, such statistical models have yet to be used for the purpose of predicting hot spell duration. This study aims to fill that gap.

The objective of this research is to assess whether a random forest (RF) model can predict the duration of a hot spell from its first day. Specifically, we aim to determine if the model can distinguish between short and long durations, covering both synoptic and subseasonal timescales. To achieve this, we develop a statistical model using data from the Community Earth System Model version 2 Large Ensemble (CESM2-LE) historical runs. For two regions in Western Europe, hot spells are defined as periods when the region-averaged deseasonalised and detrended anomalies exceed 1.5 standard deviations. The model is trained with a number of local and remote predictors, incorporating variables from the land, sea, and atmosphere. These features are provided for the days, weeks and months leading up to the event, as well as for the first day of the event itself.

We perform both a RF classification to predict different duration cohorts (short, medium, long) and a Quantile Random Forest (QRF) to model the full conditional distribution of the response variable (event duration). A key challenge is handling a highly imbalanced dataset, with 3-day events far outnumbering events lasting beyond 10 days.

In addition to shedding light on the statistical and dynamical relationships that drive the persistence of hot spells, the results could be relevant for climate adaptation and policy planning.

How to cite: Pappert, D., Vrac, M., Coumou, D., Tuel, A., and Martius, O.: Predicting Hot Spell Duration with Random Forests, EGU General Assembly 2025, Vienna, Austria, 27 Apr–2 May 2025, EGU25-17884, https://doi.org/10.5194/egusphere-egu25-17884, 2025.

EGU25-18929 | ECS | Posters on site | CL5.9

Sphere Fusion Forecast (SFF): A Neural Operator–Based Model for Global Weather Forecasting 

Qilong Jia, Zhixiang Dai, Chenyu Wang, Ivan Au Yeung, Hao Jing, Rita Zhang, Jian Sun, and Wei Xue

Weather forecasting is crucial for human activities, yet traditional numerical models often face limitations due to complex physical processes and high computational cost. Deep learning–based neural networks offer a promising alternative. The Spherical Fourier Neural Operator (SFNO) model introduces the Spherical Harmonic Transform to maintain SO(3) rotational invariance, ensuring long-term stability in forecasts and preventing early collapse. However, we have identified two key shortcomings in SFNO: high memory consumption and limited ability to capture high-frequency information due to the truncated of spectrum.

To address these issues, we propose the SFF model, which improves upon the well-known SFNO model primarily in the following ways:

  • a) U-Structure: We add up-sampling and down-sampling operators between SFNO blocks, allowing the initial and final stages of the SFNO block chain to handle broader frequency spectra, while the middle layers focus on relatively low-frequency information. Under a limited memory budget, this design enables us to increase the number of SFNO blocks or enlarge the embedding dimension, thereby enhancing forecast accuracy.
  • b) Vision Transformer-like Residual Connection: We introduce a Vision Transformer–like architecture between the encoder and decoder as the skip connection, and specialize it to focus on local features. This strengthens the model's ability to capture high-frequency information, enhances its capacity for local feature learning, and leads to more robust and accurate predictions.


Considering the discontinuous occurrence and development of precipitation, SFF employs an independent precipitation model which can be easier to learn the physical processes of precipitation and leverages classification weighting to improve the detection and prediction accuracy of heavy rainfall, further extending the effective lead time of precipitation forecasts through joint training.


We conducted experiments on ERA5 dataset, using data from 1979–2017 for training, 2018 for validation, and 2020 for testing. The experiment results demonstrate that SFF can generate  stable 30-day forecasts cost-effectively on a single NVIDIA H20 GPU, with key metrics—such as the root mean square error (RMSE) and anomaly correlation coefficient (ACC) for Z500/t2m/t850 comparable to the well-established IFS model, and better than the SFNO model. Meanwhile, for precipitation predictions, SFF also exhibits a forecast skill level comparable to that of the IFS model. Moreover, for heavy rainfall prediction, SFF achieves a Threat Score (TS) of over 0.25 in single-step forecasts for 70 mm of precipitation. After joint training of SFF and the precipitation model, the precipitation score within 10-day forecasts can be improved by 5% compared to direct coupling. This study underscores the potential of Neural Operator–Based AI models in advancing weather forecasting and extreme weather prediction.

How to cite: Jia, Q., Dai, Z., Wang, C., Au Yeung, I., Jing, H., Zhang, R., Sun, J., and Xue, W.: Sphere Fusion Forecast (SFF): A Neural Operator–Based Model for Global Weather Forecasting, EGU General Assembly 2025, Vienna, Austria, 27 Apr–2 May 2025, EGU25-18929, https://doi.org/10.5194/egusphere-egu25-18929, 2025.

EGU25-19014 | Orals | CL5.9

Building a high-resolution machine learning weather model 

Karolina Stanisławska and Olafur Rognvaldsson

After numerous successful applications of machine-learning-based global weather models, a new interesting direction of application is to seek high-resolution regional ML-based models that could complement high resolution numerical models serving day-to-day purposes. Development of such a model would combine speed and resource efficiency of ML models with high-resolution capabilities available so far only in the numerical models. Most ML-based models created so far are restricted to the resolution of underlying ERA5 data, often further downsampled due to various constraints, leaving substantial room for further research. With the objective of building a high-resolution ML model for Iceland and equipped with 30 years of 2-km reanalysis data covering Iceland and the surrounding ocean, we are exploring possibilities of the applications of existing ML architectures to our domain. The model we are currently building is based on ClimaX architecture from Microsoft, which we are modifying to best serve our objectives. Understanding the unique needs of regional models during training is one of the key factors in generating a successful regional model. While some of the architectures of the available global models can be applied directly to build a local model, many questions arise: do we need to adjust the cost function during training to handle domain boundaries? Which model levels should we prioritize during training — would it be better to focus on lower levels if the resolution is high and the timescale is short? To what extent can we use transfer learning (leveraging pre-trained weights from the global experiment) and how much will it guide the model toward the optimum? In this talk, we will discuss some of the above considerations for successfully running a regional model and present our high-resolution model for Iceland. The successful development of large machine-learning-based weather models has given weather and climate scientists confidence that models and reanalysis data built over decades are capable of capturing enough variability for ML-based inference. This now opens a new world of possibilities for model improvements and scientific advancements.

How to cite: Stanisławska, K. and Rognvaldsson, O.: Building a high-resolution machine learning weather model, EGU General Assembly 2025, Vienna, Austria, 27 Apr–2 May 2025, EGU25-19014, https://doi.org/10.5194/egusphere-egu25-19014, 2025.

EGU25-19963 | Posters on site | CL5.9

AI-based Short-Term Wind Speed Forecasting for Real-Time Applications. 

Marcos Martínez-Roig, Nuria P. Plaza-Martín, César Azorín-Molina, Kevin Monsalvez-Pozo, Miguel Andrés-Martin, Deliang Chen, Zhengzhong Zeng, Sergio M. Vicente-Serrano, Tim R. McVicar, Jose A. Guijarro, and Amir Ali Safaei-Pirooz

The generation of accurate and reliable short-term forecasts (<12 hours) of near-surface (~10 m above ground level) gridded wind speed data, hereinafter called NSWS, are crucial for various socioeconomic and environmental applications. For instance, in the face of climate change, accurate wind speed predictions can contribute to the decarbonization of the electricity grid by optimizing the wind energy generation

Traditional NSWS forecasting methods relies on Numerical Weather Prediction (NWP) models, which require significant computational resources, particularly when high spatial and temporal resolution are required. Moreover, these models often yield inaccurate results, especially in regions with complex topography. As a more efficient alternative to this pressing issue, the Climatoc-Lab, as part of the PTI+Clima, is exploring Artificial Intelligence (AI) methods to enhance the efficiency and accuracy of short-term NSWS predictions. We propose the use of two deep learning methods:

  • A U-Net architecture based on Partial Convolutions to generate high-resolution hourly NSWS maps from station-based observations.

  • An encoder-decoder architecture based on mixed convolutional and recurrent (ConvLSTM) layers to predict short-term NSWS maps using the generated infilled data as input.

This AI-based product, designed as an early warning system, generate high-resolution (~3/9-km) short-term (12 h; 1-h resolution) NSWS forecasts in near real-time (seconds) using a GPU.

Measurements from meteorological station networks provide accurate site-specific observations, capturing local wind effects, but with limited spatial coverage, being sparse and almost absent in mountainous and remote areas. Conversely, reanalysis and simulation products offer complete spatial coverage at low resolution but fail to accurately reproduce local NSWS. Our AI-based tool combine the strenghts of both worlds, as it is trained using both, observation and simulation data. The observations are provided by the Spanish Meteorological State Agency (AEMET), while the simulation data comes from reanalysis like ERA5-Land (9-km).

The AI-based tool achieves a high correlation of 0,96 for Infilling and 0,849 for Prediction for the year 2020 of ERA5-Land data used for validation, with potential for further improvements. This also shows a reasonably high correlation of 0,84 with the AEMET meteorological observations. This scalable AI-based approach promises to enhance short-term NSWS forecasting for AEMET and other meteorological services, highlighting the promising role of AI to improve both forecast precision and operational efficiency in meteorology applications.

How to cite: Martínez-Roig, M., Plaza-Martín, N. P., Azorín-Molina, C., Monsalvez-Pozo, K., Andrés-Martin, M., Chen, D., Zeng, Z., Vicente-Serrano, S. M., McVicar, T. R., Guijarro, J. A., and Safaei-Pirooz, A. A.: AI-based Short-Term Wind Speed Forecasting for Real-Time Applications., EGU General Assembly 2025, Vienna, Austria, 27 Apr–2 May 2025, EGU25-19963, https://doi.org/10.5194/egusphere-egu25-19963, 2025.

EGU25-20607 | ECS | Orals | CL5.9

Beyond the Unseen: Assessing AI Climate Emulators’ Capacity to Simulate Very Rare Events 

Alexander Wikner, Troy Arcomano, Amaury Lancelin, Karan Jakhar, Dhruvit Patel, Freddy Bouchet, and Pedram Hassanzadeh

The risk of extreme weather under climate change is of paramount importance, but remains one of the most difficult problems to study using conventional physics-based global climate models (GCMs). This is due to the high uncertainty in estimates of extreme weather return times owing to the computational cost of evolving these models for long enough to observe very rare events. AI models trained on historical reanalysis to emulate the dynamics of the global atmosphere have demonstrated both high forecast accuracy and greatly reduced computational cost. Some of these AI emulators can generate stable, decades-long trajectories, which, in conjunction with their affordability, have the potential to greatly reduce extreme weather uncertainties. However, it is impossible to validate if AI emulations can accurately estimate the risk of extreme weather events with return times longer than the historical record. In a first-of-its-kind experiment to assess this capability, we simulate 100,000 years of a stationary climate using PlaSim, a coarse resolution GCM. We then train a selection of stable AI emulators using only 100 years of data, and compare the emulated and true return times of extreme heat waves over Western Europe and the Pacific Northwest. We finally assess how the addition of a land moisture component to these AI emulators improves the accuracy of return time estimates.

How to cite: Wikner, A., Arcomano, T., Lancelin, A., Jakhar, K., Patel, D., Bouchet, F., and Hassanzadeh, P.: Beyond the Unseen: Assessing AI Climate Emulators’ Capacity to Simulate Very Rare Events, EGU General Assembly 2025, Vienna, Austria, 27 Apr–2 May 2025, EGU25-20607, https://doi.org/10.5194/egusphere-egu25-20607, 2025.

EGU25-1212 | Orals | GI4.3

Mapping horizontal wind speed using a single Doppler Wind Lidar scanning horizontally: a test case over Paris 

Clement Toupoint, Jonnathan Cespedes, Simone Kotthaus, Ludovic Thobois, Martial Haeffelin, and Janna Preissler

Scanning Doppler Wind Lidars are used in a variety of applications, thanks to the versatility brought by their scanning head. Their principal output is the wind speed along the lidar beam, termed the radial wind speed. When used for vertical profiling, the horizontal wind speed and wind direction are obtained from a wind field reconstruction algorithm (DBS or VAD) applied to the radial wind speed along several high-elevation lines of sight.

However, for other scanning strategies (i.e., with low elevation or horizontal scans), the use of such algorithms is not common, making the radial wind speed the sole output of the Doppler Wind Lidar. The radial wind speed is more difficult to interpret visually for a human user, harder to compare with numerical models, and requires more work to be used into advanced algorithms.

Thus, we showcase the Volume Wind wind field reconstruction algorithm, capable of reconstructing the horizontal wind speed and wind direction from measurement points taken at the same elevation and varying azimuth.

We present data taken from the PANAME2022 campaign, in which a Doppler Wind Lidar (WindCube Scan 400S) was set up on an 88m-high tower in Paris city. The lidar performs scans at 0° elevation above the urban area of Paris, measuring radial wind speed from within the Urban Boundary Layer.  Then, we create maps of horizontal wind speed and direction, spanning a large part of the Paris urban area, using the Volume Wind wind field reconstruction algorithm.

This allows us to study the influence of the topography on the wind field at the height of the urban canopy. The effect of the bed of the Seine river is of particular interest, as it is thought to be an important ventilation corridor in periods of extreme heat. These results highlight the potential of remote sensors for studying the Urban Boundary Layer, and the added value of advanced processing algorithms.

How to cite: Toupoint, C., Cespedes, J., Kotthaus, S., Thobois, L., Haeffelin, M., and Preissler, J.: Mapping horizontal wind speed using a single Doppler Wind Lidar scanning horizontally: a test case over Paris, EGU General Assembly 2025, Vienna, Austria, 27 Apr–2 May 2025, EGU25-1212, https://doi.org/10.5194/egusphere-egu25-1212, 2025.

EGU25-2757 | Orals | GI4.3

Multi product comparison during BELLA-ABL Campaign across different Lidar System 

Donato Summa, Paolo Di Girolamo, Marco Di Paolantonio, Benedetto De Rosa, Ilaria Gandolfi, Giuseppe D'amico, Marco Rosoldi, Michail Mytilinaios, Christina Anna Papanikolaou, Nikolaos Papagiannopoulos, Frabrizio Marra, and Lucia Mona

The BELLA measurement campaign took place at the CNR-IMAA Atmospheric Observatory (CIAO), where a large ensemble of instruments, including ceilometers, a Raman lidar, a wind Doppler lidar, a Ka band Doppler radar, a microwave radiometer and different types of in-situ sensors, were operated on a continuous basis over the period April-June 2024. The measurement effort also benefitted from the continous operation throughout the campaign duration of the Raman lidar system CONCERNIG Lidar, located approx. 7 km south-eastward of CIAO, at University of Basilicata in Potenza. All lidar systems involved in the measurement campaign were operated with high space and time resolution, typically 5-10 m and 10 sec, respectively, with vertical profiling capability both in daytime and nighttime for different atmospheric components/variables, including water vapour mixing ratio, CO2 mixing ratio, temperature and particle (aerosol and clouds) optical (backscatter/extinction) properties. This measurement capability, relying on different ABL tracers/properties is very effective in the characterization of the Atmospheric Boundary Layer structure and depth. Estimates of the ABLH obtained from the different parameters measured by CONCERNING are compared with those obtained from the radiosonde and Raman lidar measurements at CIAO, properly revealing differences associated with the different approaches and with atmospheric variability. In this work our attention is focused on two specific case studies (15-16 April 2024 and 28 April-01 May 2024), with results revealing a good agreement, quantified in terms of absolute and percentage BIAS, between the different sensors and approaches. 

Acknowledgment
The authors acknowledge Next Generation EU Mission 4 “Education and Research” - Component 2: “From research to business” - Investment 3.1: “Fund for the realization of an integrated system of research and innovation infrastructures” - Project IR0000032 – ITINERIS.  

How to cite: Summa, D., Di Girolamo, P., Di Paolantonio, M., De Rosa, B., Gandolfi, I., D'amico, G., Rosoldi, M., Mytilinaios, M., Papanikolaou, C. A., Papagiannopoulos, N., Marra, F., and Mona, L.: Multi product comparison during BELLA-ABL Campaign across different Lidar System, EGU General Assembly 2025, Vienna, Austria, 27 Apr–2 May 2025, EGU25-2757, https://doi.org/10.5194/egusphere-egu25-2757, 2025.

EGU25-2855 | ECS | Orals | GI4.3

3D Wind Field Retrieval within Thunderstorm Clouds over Piedmont 

Priya Kumari, Massimiliano Burlando, Renzo Bechini, Djordje Romanic, and Alessandro Battaglia

Windstorm, particularly driven by thunderstorms, are among the most destructive natural hazards in Europe causing significant economic losses and causalities. Despite various research, the understanding of thunderstorm outflows and their interaction with built and natural environments remains incomplete, especially in regions prone to intense convective activity, such as the northern Italy. This study focuses on the three-dimensional (3D) structure and dynamics of thunderstorm clouds, emphasizing the formation of downburst and gust fronts that generates damaging surface winds. To construct the 3D wind structure, dual Doppler radar systems are utilized, combining data from operational C-band radar and X-Band radar within the study area. A LiDAR instrument was also operational during the investigated event; however, the scanning LiDAR and C-band radar volume do not overlap due to sheltered positioning of the LiDAR relative to the radar. The inclusion of the X-band radar resolves this issue by covering areas that are blind to C-band radar, thereby re-establishing continuity in measurements across the three instruments. This configuration ensures continuous and comprehensive spatial coverage of wind field measurements, spanning from surface to maximum observation altitude.  To carry this out, historical thunderstorm events that occurred in the Piedmont region, Italy, in 2024 are analysed to enhance present understanding of convective dynamics, and the development of severe wind phenomena. This research will also help identify patterns associated with gust fronts and downbursts, hence facilitating improved nowcasting and risk mitigation strategies for these localized windstorms.

How to cite: Kumari, P., Burlando, M., Bechini, R., Romanic, D., and Battaglia, A.: 3D Wind Field Retrieval within Thunderstorm Clouds over Piedmont, EGU General Assembly 2025, Vienna, Austria, 27 Apr–2 May 2025, EGU25-2855, https://doi.org/10.5194/egusphere-egu25-2855, 2025.

EGU25-3198 | ECS | Orals | GI4.3

An airborne Raman lidar to sample horizontal meteorological fields in the framework of MAESTRO 

Hélène Cassan, Patrick Chazette, Julien Totems, Frédéric Laly, Jeremy Lagarrigue, Valentin Guillet, Laurent Forges, and Sandrine Bony

The Airborne Weather and Aerosol Lidar (A-WALI) is the first airborne meteorological lidar using Raman technology to measure the horizontal fields of water vapour, temperature, clouds and aerosols, as key weather and climate parameters (https://metclim-lidars.aeris-data.fr/). Based on lidar technologies tested in WALI (Totems et al., 2021; Chazette et al., 2014)) and ALiAS (Chazette et al., 2020), it was developed to meet the scientific objectives of ERC project MAESTRO (Mesoscale Organisation of Tropical Convection, https://maestro.aeris-data.fr). This experiment was motivated by the scarcity of observations of convective clouds organisation and their environment over the oceans, whereas this spatial organisation of mesoscale clouds, i.e. the tendency of convective clouds to aggregate and form clusters of varying horizontal and vertical extent, plays an important role in climate and meteorology. One of the objectives of the MAESTRO airborne campaign was therefore to sample the horizontal distribution of meteorological temperature and humidity fields, as well as the spatial distribution of aerosols and clouds. A-WALI was flown on board the ATR-42 aircraft of the SAFIRE unit (https://www.safire.fr/), departing from Sal in Cape Verde. The experiment, which took place between 10 August and 10 September 2024, was part of the international campaign ORCESTRA (Organised Convection Experiments in the Tropical Atlantic) supported by the World Climate Research Programme.

We will give examples of the measurements made by A-WALI and estimates of the associated uncertainties. We will discuss the calibration approach, the lidar sampling capabilities and limitations. Depending on the geophysical parameter under consideration, we will show at which spatial scales the lidar measurement provides relevant information and what its range can be.

How to cite: Cassan, H., Chazette, P., Totems, J., Laly, F., Lagarrigue, J., Guillet, V., Forges, L., and Bony, S.: An airborne Raman lidar to sample horizontal meteorological fields in the framework of MAESTRO, EGU General Assembly 2025, Vienna, Austria, 27 Apr–2 May 2025, EGU25-3198, https://doi.org/10.5194/egusphere-egu25-3198, 2025.

In May 2024 the ESA/JAXA satellite mission EarthCARE was launched into a low Earth orbit. The satellite combines a high spectral resolution lidar and a cloud radar with doppler capability as key instruments on one single platform. Additionally, it is equipped with a multi spectral imager and a broad band radiometer. This unique combination makes EarthCARE the most complex single satellite mission to study aerosol, clouds and precipitation. The successful use of these new data for science application needs a thorough validation of the measurements and the derived data products. A similar EarthCARE-like payload was implemented onboard the German research aircraft HALO (High Altitude and Long range).

This instrumentation was flown during PERCUSION (Persistent EarthCARE underflight studies of the ITCZ and organized convection) campaign. Within its scientific component this field experiment aimed to test factors assumed to control the organization of deep maritime convection, and to investigate the influence of convective organization on the larger-scale environment. The validation part of PERCUSION focused on an as close as possible spatial and temporal co-location of the airborne with the space-borne measurement, which can only be done using an aircraft.

Thus, we included an EarthCARE underpass within each research flight. HALO measurements were performed during the EarthCARE commissioning phase in August 2024 out of Sal, Cape Verde, and out of Barbados in September 2024. In addition, we performed pure validation flights out of Oberpfaffenhofen, Germany in November 2024 for the validation under atmospheric conditions that could not be captured in the two first campaign parts. Altogether, 33 EarthCARE underpasses were performed in different aerosol and cloud situations. Some of the flights were coordinated with in-situ measurements onboard other aircraft (e.g. the French ATR42), with shipborne measurements onboard the German research vessel METEOR, or with ground-based radar and lidar measurements at Mindelo (Cape Verde), Barbados, and the ACTRIS stations Antikythera, Leipzig, Lindenberg and Munich.

In our presentation we will give a short overview of the HALO PERCUSION field experiment. Selected EarthCARE underpasses will be used to exemplify the merits and limitations of the level 1 and some level 2 data products of the ATLID lidar onboard EarthCARE.

How to cite: Wirth, M. and Groß, S.: Validation of EarthCARE lidar products using airborne measurements with the research aircraft HALO during the PERCUSION campaign, EGU General Assembly 2025, Vienna, Austria, 27 Apr–2 May 2025, EGU25-3255, https://doi.org/10.5194/egusphere-egu25-3255, 2025.

EGU25-3463 | Orals | GI4.3

Horizontal wind profiling with Doppler lidars: long-term evaluation of the perpendicular vertical sweeps reconstruction method 

Elsa Dieudonné, Pauline Haezebrouck, Perrine Maynard, Anton Sokolov, Hervé Delbarre, Patrick Augustin, and Marc Fourmentin

Over the last 30 years, the demand for wind profile observations in the lower troposphere has rocketed, carried by weather agencies, airports and the wind energy industry. Doppler lidars are favoured for their compactness, easiness of operation, and versatility in the scanning strategy. Several methods have been developed to reconstruct the horizontal wind profile from the raw radial wind observations recorded in different directions. The most common is the Doppler Beam Swinging (DBS) technique, which is implemented in commercial lidars software. However, DBS leaves a blind zone near the ground that can damper the observation of very low-altitude phenomena like certain low-level jets. 
Another horizontal wind reconstruction method consists in combining observations from two vertical sweeps of the Range-Height Indicator (RHI) type recorded in perpendicular directions, by binning the data into horizontal layers. To our knowledge, this cross-RHI technique has only been used twice [1, 2] and applied to only a few tenth  of hours of lidar scans, so that this method still needs to be fully validated over a longer period and under more varied conditions.
In this study, the cross-RHI and DBS techniques were compared using observations recorded by two Doppler scanning lidars from the Leosphere/Vaisala company, installed at two contrasting sites in France: a flat coastal site (Dunkerque, North Sea coast) for four months, and an urban hilly site (Paris) for two months. Compared to the previous studies and to the DBS method, the cross-RHI technique was improved by adding filtering steps designed to remove range-folded echoes from middle-level clouds. In addition, the flow inclination on the hilly site was taken into account by tilting the wind binning layers and minimizing the total intra-layer variance. 
The horizontal wind speed values retrieved using both techniques were in very good agreement on both sites, with correlation coefficients ~0.92 in the first 200 m above the lidar. The regression slope was 0.93 and the intercept was below 0.4 m/s on both sites, drawn by a small share of points where the DBS grossly overestimated the wind speed due to range-folded echoes. This problem disappeared at higher altitudes, where the correlation coefficients exceeded 0.97, with slopes ~0.97 and intercepts lower than 0.1 m/s. In Dunkerque, where the DBS were averaged over 10 consecutive cycles, the horizontal wind direction difference was smaller than 5° (resp. 10°) for 61% (resp. 83%) of observations in the first 200 m above the lidar, and these numbers also improved with increasing altitude. Additionally, the cross-RHI technique proved to be more efficient to reconstruct the wind in pristine conditions yielding low lidar signal. 
This method’s ability to capture very low-altitude phenomena while providing turbulence information opens new perspectives for urban studies and wind farm site assessment. 

References
[1]    R. M. Banta et al., “Nocturnal Low-Level Jet Characteristics Over Kansas During Cases-99,” Bound.-Lay. Meteorol., 105(2), 221–252, 2002, doi: 10.1023/A:1019992330866.
[2]    T. A. Bonin et al., “Evaluation of turbulence measurement techniques from a single Doppler lidar,” Atmos. Meas. Tech., 10(8), 3021–3039, 2017, doi: 10.5194/amt-10-3021-2017.

How to cite: Dieudonné, E., Haezebrouck, P., Maynard, P., Sokolov, A., Delbarre, H., Augustin, P., and Fourmentin, M.: Horizontal wind profiling with Doppler lidars: long-term evaluation of the perpendicular vertical sweeps reconstruction method, EGU General Assembly 2025, Vienna, Austria, 27 Apr–2 May 2025, EGU25-3463, https://doi.org/10.5194/egusphere-egu25-3463, 2025.

EGU25-3558 | ECS | Posters on site | GI4.3

How can the Latent Heat Flux in a Convective Boundary Layer be Described?  

Linus von Klitzing, Diego Lange, David D. Turner, Andreas Behrendt, and Volker Wulfmeyer

We present ongoing work within the Land-Atmosphere Feedback Initiative (LAFI) [1]. LAFI is funded by the Deutsche Forschungsgemeinschaft (DFG) and is located at the University of Hohenheim, Stuttgart. LAFI's objective is to quantify and understand land-atmosphere feedbacks by utilizing synergetic observations and simulations in an interdisciplinary way. One aspect is covered by this work, which aims to provide a better understanding of fluxes in the convective boundary layer (CBL), especially the latent and sensible heat flux. The focus lies on entrainment fluxes in the interfacial layer (IL), the uppermost layer of the CBL, which marks the transition to the free atmosphere (FA).

A key aspect of this work is setting up a comprehensive dataset. This should capture all relevant variables such as temperature, humidity, and wind of the lower atmosphere at high spatial and temporal resolutions for as many cloud-free CBL situations as possible. Accordingly, simultaneous and high-resolution data from the synergetic use of different lidar systems will be used (see [2]) and processed (see [3]). Next, we will analyze this data for the driving variables and possible parameterizations of the latent and sensible heat flux.

We have already started this work by building a dataset containing data from the Atmospheric Radiation Measurement Climate Research Facility (ARM) Southern Great Plains (SGP) site in Oklahoma, USA, and testing a similarity relationship for the latent heat flux in the IL in [4].

Corresponding first results could not confirm the proposed similarity relationship for the latent heat flux in the IL from [2] and will be presented at the conference. Additionally, correlations of the flux with other measured variables, as well as an example case representative for the pool of selected cases will be shown.

In the coming months, we will expand the dataset to other measurement campaigns, like the synergy of Raman and Doppler lidar systems within LAFI in 2025.

References:

[1] https://www.lafi-dfg.de/

[2] Wulfmeyer, Volker et al. (2016): Determination of Convective Boundary Layer Entrainment Fluxes, Dissipation Rates, and the Molecular Destruction of Variances: Theoretical Description and a Strategy for Its Confirmation with a Novel Lidar System Synergy. In Journal of the Atmospheric Sciences 73 (2), pp. 667–692. DOI: 10.1175/JAS-D-14-0392.1

[3] Behrendt, Andreas et al. (2020): Observation of sensible and latent heat flux profiles with lidar. In Atmos. Meas. Tech. 13 (6), pp. 3221–3233. DOI: 10.5194/amt-13-3221-2020

[4] von Klitzing, Linus (2024): Latent Heat Entrainment Flux Similarity Relationships for the Convective Boundary Layer. Master's dissertation. University of Hohenheim, Stuttgart. Institute of Physics and Meteorology

How to cite: von Klitzing, L., Lange, D., Turner, D. D., Behrendt, A., and Wulfmeyer, V.: How can the Latent Heat Flux in a Convective Boundary Layer be Described? , EGU General Assembly 2025, Vienna, Austria, 27 Apr–2 May 2025, EGU25-3558, https://doi.org/10.5194/egusphere-egu25-3558, 2025.

EGU25-4141 | ECS | Orals | GI4.3

Raman lidar derived WVMR profiles compared to ERA5 - A WaLiNeAs application  

Frédéric Laly and Patrick Chazette

Vibrational Raman lidar measurements of the water vapour mixing ratio (WVMR) were conducted during the WaLiNeAs (Water Vapor Lidar Network Assimilation) field campaigns in the western Mediterranean during autumn and winter 2022–2023 and in southwestern France (Toulouse) between June and September 2023. These campaigns, which spanned different seasons and geographical locations, provided an opportunity to sample various meteorological phenomena, including a dry winter, rainstorms, long-range aerosol transport, and an intense heat wave. Consequently, the water vapour content recorded in the lower troposphere showed significant variability during WaLiNeAs, ranging from less than 1 g kg-1 to more than 17 g kg-1. For operational purposes, a vertical resolution of 100 m and a temporal resolution between 15 and 60 min have been chosen. These resolutions are aligned with the spatio-temporal resolution of the ERA5 dataset from ECMWF's Integrated Forecasting System (IFS) global numerical weather prediction models. The processing of the lidar data has resulted in a scientific publication explaining the methods used to invert the lidar data and recover various atmospheric parameters. Lidar measurements address a critical gap left by operational instruments, which struggle to capture the diurnal cycle of water vapour from the planetary boundary layer to the lower free troposphere. The primary aim of this study is to compare ERA5 data with lidar-derived WVMR profiles. The results reveal altitude-dependent differences in Pearson correlation coefficient (COR), mean bias (MB), and root mean square deviation (RMSD), particularly during periods of high-water vapour content (> 10 g kg⁻¹). Over all periods the MB ranges from 0.1 to 3 g kg⁻¹, and the RMSD varies between 0.6 and 3.7 g kg⁻¹. COR ranges from 0.16 to 0.94, with lower values observed in the free troposphere during warmer periods. These variations underline the differences in the performance of the reanalysis model over different periods and altitudes when compared to lidar profiles. We show that the reanalysis constantly underestimated the WVMR at all altitudes. This study highlights the importance of scrutinising WVMR and the challenges faced by models during high water vapour meteorological events. The results provide valuable insights into the performance of operational numerical weather prediction models and highlight the need to refine their representation of WVMR vertical profiles in the lower troposphere by incorporating ground-based lidar measurements.

We give special thanks to the ANR grant #ANR-20-CE04-0001 for its contribution to the WaLiNeAs programme, to Meteo-France for its help with the measurements in Toulouse, and to the CNRS INSU national LEFE programme for its financial contribution to this project.

How to cite: Laly, F. and Chazette, P.: Raman lidar derived WVMR profiles compared to ERA5 - A WaLiNeAs application , EGU General Assembly 2025, Vienna, Austria, 27 Apr–2 May 2025, EGU25-4141, https://doi.org/10.5194/egusphere-egu25-4141, 2025.

EGU25-4413 | ECS | Posters on site | GI4.3

Evaluating Wind Velocity Measurement Errors in Ground-Based Doppler LiDAR Using Virtual Doppler LiDAR and Large Eddy Simulation 

Veronica Escobar-Ruiz, Janet Barlow, and Zheng-Tong Xie

Doppler Wind LiDARs (DWLs) are remote sensing devices that measure wind speed and direction by analysing the Doppler shift of the light backscattered from atmospheric particles along the lidar beam's line of sight. Hence, DWLs are extensively employed in boundary layer meteorology to analyse wind flow due to their ability to provide high-resolution wind measurements. Recently, there has been growing interest in deploying DWLs in urban environments, where mast-based cup anemometers or sonic anemometers face challenges. However, DWL scanning techniques typically assume a homogeneous, stationary wind field, assumptions which often break down in urban boundary layers due to turbulence caused by buildings and complex topography that significantly influences wind profiles. Moreover, the selection of DWL scanning patterns and their configuration should be carefully tailored to the specific application.

One of the most-used scanning methods for measuring vertical wind velocity profiles is the Velocity Azimuth Display (VAD). The technique involves scanning the laser beam around the zenith in a conical pattern at a fixed elevation angle. However, completing the full 360° requires a finite time, during which the wind speed is assumed to be constant. Additionally, if the wind varies significantly within the sampling volume (e.g., due to turbulence or flow inhomogeneity) the calculated wind profiles may be inaccurate.

Large-Eddy Simulation (LES), with a sufficiently high grid resolution to resolve turbulent motions, provides a means to evaluate potential errors in DWL sampling strategies. This study uses a Virtual Doppler LiDAR (VDL) tool (Rahlves et al., 2022) within the Parallelized Large-Eddy Simulation Model (PALM, version 6.0) to estimate velocity profiles derived from simulated radial velocities along virtual laser beam paths under the VAD scheme. The research is part of the ASSURE Project (Across-Scale Processes in Urban Environments), which focuses on Bristol, UK. The project investigates urban wind flow using DWLs deployed across the city, employing scanning strategies utilised during a one-year field campaign beginning in May 2024.

Bristol was chosen for its compact urban layout and distinct topographic features, including the Avon Gorge and a central valley. The city serves as a case study for examining urban wind dynamics. This study's objectives are twofold: (1) to identify and quantify errors between the vertical wind profile derived from a VAD scan using the VDL and the profile directly taken from the PALM model and (2) to facilitate comparisons between PALM-simulated wind profiles and observations from ground-based DWL. By addressing the discrepancies arising from topographically induced flow, this research aims to enhance the reliability of DWL data in urban settings and improve our understanding of urban boundary layer processes. Results will be presented for a case study of flow channelled by a deep valley interacting with a city-centre boundary layer.

Rahlves, C., Beyrich, F., and Raasch, S. (2022). ‘‘Scan strategies for wind profiling with Doppler lidar – an large-eddy simulation (LES)-based evaluation’’, Atmospheric Measurement Techniques, 15(9), 2839-2856

How to cite: Escobar-Ruiz, V., Barlow, J., and Xie, Z.-T.: Evaluating Wind Velocity Measurement Errors in Ground-Based Doppler LiDAR Using Virtual Doppler LiDAR and Large Eddy Simulation, EGU General Assembly 2025, Vienna, Austria, 27 Apr–2 May 2025, EGU25-4413, https://doi.org/10.5194/egusphere-egu25-4413, 2025.

Atmospheric lidar has become a powerful tool for atmospheric detection due to its advantages of high spatiotemporal resolution, multiple parameters and high-precision detection. In this paper, the application status of lidar in China’s meteorological observation is introduced, and the prospects for the development of lidar applications are presented. For better observation of atmospheric clouds, aerosol, and water vapor parameters, the China Meteorological Administration(CMA) has laid out and constructed a Raman-Mie aerosol lidar network with 49 stations from 2021 to 2024 and has solved several key technical problems such as data quality control, parameter inversion, and quantitative calibration. In order to achieve high-precision observations with a time resolution at the minute level, more than 10 standard specifications have been formulated for calibration, observation, and data transmission. The lidars for network applications normally use a three-wavelength laser covering 355 nm, 532 nm, and 1064 nm,and they can achieve a detection distance of more than 10 km, an accuracy of aerosol backscattering coefficient of less than 20%(0.5-2 km)and 40%(2-5 km), and an accuracy of water vapor concentration of less than 1g/kg (0.5-3 km).In the field of wind observation, the CMA has laid out and constructed a wind lidar network with 372 stations by 2024. The lidars use the coherent detection with a laser wavelenth of 1550nm, and they can achieve a maximum detection distance of more than 3km, a horizontal wind speed error less than 0.8m/s, and a horizontal wind direction error less than 8°.The layout and application of aerosol lidar network and wind lidar network have greatly improved China's meteorological observation capability and application levels in aerosol and wind fields. In recent years, the CMA has actively cooperated with various universities and scientific research institutes to carry out key technological studies in atmospheric temperature and humidity lidar, high spectral resolution lidar, middle and upper atmosphere lidar, and airborne/spaceborne lidar. Through planning and constructing meteorological business application platforms in the future, the comprehensive three-dimensional observation of multiple parameters such as temperature, humidity, wind and aerosols will be developed to improve China's meteorological observation ability and provide strong support for research in meteorological services, atmospheric science and climate change.

How to cite: Chen, Y.: Status and Development of Lidar applications in China's Meteorological Observation, EGU General Assembly 2025, Vienna, Austria, 27 Apr–2 May 2025, EGU25-5725, https://doi.org/10.5194/egusphere-egu25-5725, 2025.

EGU25-5758 | Orals | GI4.3

Aerosol impacts on cirrus cloud formation and properties using in-situ and lidar measurements during CIRRUS-HL campaign  

Qiang Li, Silke Gross, Martin Wirth, Tina Jurkat-Witschas, Christiane Voigt, Elena De La Torre Castro, and Daniel Sauer

Cirrus clouds cover about 30% of the Earth’s surface and play a crucial role in the Earth’s radiation balance. They are composed of ice crystals with various sizes and nonspherical shapes. Ice crystals can form through either homogeneous freezing or heterogeneous freezing depending on the ambient temperature, humidity, updraft, and the availability of INPs, and hence possess different properties. Their radiative effects strongly depend on the formation processes and cloud microphysical, thermal, and optical properties. Furthermore, global aviation affects the Earth’s radiation balance by increasing cloudiness due to contrail formation and exerting an indirect effect on the microphysical properties of naturally-formed cirrus clouds. Aviation is responsible for 3-4% of anthropogenic effective radiative forcing and more than half of them stems from contrails and contrail-induced cirrus. Experimental and numerical studies have been carried out in the past years to understand contrails and contrail-induced cirrus as well as their climate effects. Unfortunately, however, the parameterization of ice crystal properties in global climate model and the estimate of radiation forcings are still inadequate. Compared with the intensive studies on cirrus clouds in the tropics and midlatitude regions, cirrus cloud measurements and model studies at high latitudes are sparse, although cirrus clouds at high latitudes attract more attention in recent years because the Arctic undergoes faster warming than other regions of the globe. The airborne measurements from the ML-CIRRUS mission revealed that cirrus clouds with enhanced PLDR appear in areas of high aviation emissions. Nevertheless, observational evidence of indirect effects of aviation exhaust on the changes of cirrus properties is still missing. Thanks to the foundational work of ML-CIRRUS, the CIRRUS-HL mission in June-July, 2021, with upgraded instrumentation was designed to characterize cirrus cloud at both high- and midlatitudes and to investigate aviation impact, radiation, and aerosol-cloud interactions. It collected more details in the simultaneous profiling of cirrus cloud and aerosol properties. In this study, we focus on the comparison of particle linear depolarization ratios (PLDR) of cirrus clouds with the airborne lidar WALES from two specific flights under similar cloud formation processes during CIRRUS-HL. Their microphysical properties (i.e. ice crystal size and number concentration) are also determined and compared based on the analysis of simultaneous in-situ measurements. The analysis is also extended to all the flights for statistical results. Furthermore, the characterization of aerosol load, especially aviation soot, will be identified in the regions of ice crystal formation and evolution and their correlations with cirrus cloud properties are finally able to be further determined.  

How to cite: Li, Q., Gross, S., Wirth, M., Jurkat-Witschas, T., Voigt, C., De La Torre Castro, E., and Sauer, D.: Aerosol impacts on cirrus cloud formation and properties using in-situ and lidar measurements during CIRRUS-HL campaign , EGU General Assembly 2025, Vienna, Austria, 27 Apr–2 May 2025, EGU25-5758, https://doi.org/10.5194/egusphere-egu25-5758, 2025.

EGU25-6889 | Orals | GI4.3

Desert dust profiling and applications 

Vassilis Amiridis

Atmospheric remote sensing from space and surface has been advanced during the last decade. Mineral dust is an atmospheric target that provides a strong signature on active and passive polarimetric remote sensing observations, due to its irregular shape. Nowadays, advanced lidar systems operating in the framework of ACTRIS provide quality assured, calibrated multi-wavelength linear particle depolarization ratio measurements, while new developments will provide us elliptical polarization recordings in the near future. Passive polarimeters are already part of ACTRIS and AERONET and their integration in operational algorithms is expected in the near future. This wealth of new information combined with updated scattering databases and sophisticated inversion schemes provide the means towards an improved characterization of desert dust in the future. This kind of information can be used for space-borne lidars such as CALIPSO, CATS, Aeolus, EarthCARE and the future AOS missions.

We present here some examples of how remote sensing facilitates desert dust research during the last decade, aiming to demonstrate the progress on issues such as: (a) the discrimination of desert dust in external mixtures, (b) the estimation of the fine and coarse particle modes, (c) the synergy of passive and active remote sensing for the derivation of dust properties, (d) the provision of dust-related CCN and IN particle concentrations for aerosol-cloud interaction studies, (e) the development of new scattering databases based on realistic particle shapes, (e) the application of these techniques on space lidar datasets for the provision of climatological datasets, and (f) the use of these datasets in data assimilation for improving dust representations in models.

How to cite: Amiridis, V.: Desert dust profiling and applications, EGU General Assembly 2025, Vienna, Austria, 27 Apr–2 May 2025, EGU25-6889, https://doi.org/10.5194/egusphere-egu25-6889, 2025.

EGU25-7172 | Posters on site | GI4.3

Recent Advances in Automated Temperature and Humidity Lidar 

Andreas Behrendt, Diego Lange, and Volker Wulfmeyer

We will give an update of our recent activities regarding automated high-resolution temperature and humidity lidar.

The Raman lidar ARTHUS (Atmospheric Raman Temperature and HUmidity Sounder) of University of Hohenheim is an automated instrument with continuous operation (Lange et al., 2019; Wulfmeyer and Behrendt, 2022). Besides being operated during several field campaigns elsewhere, ARTHUS is usually located at the LAFO (Land Atmospheric Feedback Observatory) near the agricultural research fields of our university. Here, in addition, three scanning Doppler lidars, a Doppler cloud radar, two meteorological 10-m towers with eddy-covariance stations, as well as surface and sub-surface sensors are collecting routinely data. These data are combined with detailed vegetation analyses.

ARTHUS is an eyesafe Raman lidar using a diode-pumped Nd:YAG laser as transmitter. Only the third-harmonic radiation at 355 nm is – after beam expansion – transmitted into the atmosphere. The laser power is about 20 W at 200 Hz repetition rate. The receiving telescope has a diameter of 40 cm. A polychromator extracts the elastic backscatter signal and four inelastic signals, namely the vibrational Raman signal of water vapor and CO2 molecules, and two pure rotational Raman signals. The raw data is stored with a resolution of 7.5 m and typically 1 to 10 s. All five signals are simultaneously analyzed and stored in both photon-counting (PC) mode and voltage (so-called “analog” mode) in order to make optimum use of the large intensity range of the backscatter signals covering several orders of magnitude. Primary data products are temperature, water vapor mixing ratio, carbon dioxide mixing ratio, particle backscatter coefficient, and particle extinction coefficient. The high resolution allows studies of boundary layer turbulence (Behrendt et al, 2015) and - in combination with the vertical pointing Doppler lidar - sensible and latent heat fluxes (Behrendt et al, 2020).

Further refined lidars like ARTHUS are offered by the company Purple Pulse Lidar Systems (www.purplepulselidar.com). Meanwhile three more systems have been built and are operating.

At the conference, we will present the recent advances in these powerful automated temperature and humidity lidars and show highlights of the measurements.


References:

Behrendt et al. 2015, https://doi.org/10.5194/acp-15-5485-2015

Behrendt et al. 2020, https://doi.org/10.5194/amt-13-3221-2020

Lange et al. 2019, https://doi.org/10.1029/2019GL085774

Wulfmeyer and Behrendt 2022, https://doi.org/10.1007/978-3-030-52171-4_25

How to cite: Behrendt, A., Lange, D., and Wulfmeyer, V.: Recent Advances in Automated Temperature and Humidity Lidar, EGU General Assembly 2025, Vienna, Austria, 27 Apr–2 May 2025, EGU25-7172, https://doi.org/10.5194/egusphere-egu25-7172, 2025.

EGU25-7552 | Posters on site | GI4.3

Scanning Measurements With an Automated Temperature and Moisture Lidar in the Atmospheric Boundary Layer 

Diego Lange Vega, Andreas Behrendt, and Volker Wulfmeyer

Despite significant advancements in atmospheric observation techniques, the thermodynamic structure of the atmospheric boundary layer (ABL) remains largely unexplored due to the scarcity of suitable high-resolution remote sensing measurements. Over the past six years, the Atmospheric Raman Temperature and Humidity Sounder (ARTHUS), an automated profiler based on the Raman lidar technique (Lange et al., 2019), has participated in several ground- and ship-based measurement campaigns (Stevens et al., 2021; Flamant et al., 2021). These campaigns have demonstrated ARTHUS's capability to resolve critical atmospheric features, such as turbulent fluctuations and their statistics with high temporal and spatial resolution.

In combination with Doppler lidars, ARTHUS enables profiling of sensible and latent heat fluxes within the convective ABL, thereby supporting the investigation of flux-gradient relationships (Wulfmeyer et al. 2016, Behrendt et al., 2020). These capabilities make ARTHUS a powerful tool for advancing process studies of land-atmosphere interactions, enhancing weather and climate monitoring, validating atmospheric models, and improving data assimilation techniques. We present examples from several field campaigns with respect to the observation of diurnal cycles of profiles of mean and turbulent variables.

An eye-safe Nd:YAG laser with 20 W at 355-nm is used as transmitter. A 40-cm receiving telescope collects backscattered light providing independent measurements of temperature (T), water vapor mixing ratio (WVMR), CO2 concentration, particle extinction coefficient, and particle backscatter coefficient.

ARTHUS has proven its reliability during extended operations at the Land Atmosphere Feedback Observatory (LAFO) at the University of Hohenheim and across various field campaigns under diverse atmospheric conditions. As part of the Land-Atmosphere Feedback Initiative (LAFI, Wulfmeyer et al. 2024), ARTHUS will extend its capabilities to include scanning measurements from the surface through the ABL, capturing three-dimensional turbulent structures with a focus on entrainment processes. The campaign will take place between March and August 2025 at the LAFO site. For the first time, ARTHUS will deliver comprehensive maps of T, WVMR, and CO₂, especially near the surface and canopy but also up to the top of the ABL offering unprecedented insights into land-atmosphere feedback. At the conference, highlights of the first LAFI measurements will be shown.

References:

Lange et al. 2019, https://doi.org/10.1029/2019GL085774

Stevens et. al. 2021, https://doi.org/10.5194/essd-2021-18

Flamant et al. 2021, https://doi.org/10.1007/s42865-021-00037-6

Behrendt et al. 2020, https://doi.org/10.5194/amt-13-3221-2020

Wulfmeyer et al. 2016, https://doi.org/10.1175/JAS-D-14-0392.1

Wulfmeyer et al. 2024, https://doi.org/10.5194/egusphere-egu24-10102

How to cite: Lange Vega, D., Behrendt, A., and Wulfmeyer, V.: Scanning Measurements With an Automated Temperature and Moisture Lidar in the Atmospheric Boundary Layer, EGU General Assembly 2025, Vienna, Austria, 27 Apr–2 May 2025, EGU25-7552, https://doi.org/10.5194/egusphere-egu25-7552, 2025.

EGU25-8390 | Orals | GI4.3

New operational perspective to identify aerosol in real-time with a pioneering algorithm (CONIOPOL) based on CL61 data 

Quentin Laffineur, Alexander Mangold, Karen De Causmaecker, and Andy Delcloo

In recent years, there has been an increase in the intensity and frequency of smoke plume events over North America (sometimes reaching Europe) and dust plume events reaching Europe from Africa. As these can potentially affect surface air quality, environmental agencies are increasingly interested in being able to identify the nature of aerosol plumes, monitor it in real time and determine whether its interaction with the atmospheric boundary layer will impact surface air quality. The automatic LIDAR-ceilometer (ALC) primarily designed for cloud base height detection has greatly improved over the last years and now provides vertical profiles of backscatter from aerosols and clouds. Recently, a new type of ALC with a depolarization function (VAISALA CL61) is commercially available for distinguishing cloud phase (which is useful for weather forecasting) and also makes it possible to support the type identification of aerosols.

At the Royal Meteorological Institute of Belgium (RMI), we have been developing a new pioneering algorithm (CONIOPOL: CONIOlogy + POLarization) based only on CL61 measurements (backscatter and depolarization profiles) to provide in real-time automatic identification of cloud phase, precipitation type and aerosol type. CONIOPOL cannot provide an independent and unambiguous identification of the aerosol type because the CL61 operates with a single wavelength. Although, CONIOPOL is a very useful operational support allowing a quick identification in real time of the type of aerosols in combination with forecasts and backward trajectories models.

The effectiveness and robustness of CONIOPOL will be demonstrated in different ways, through case studies comparing its output with CAMS forecast and air quality measurements, through statistical analysis of CONIOPOL output and by a comparison analysis between CONIOPOL output and CAMS forecasts. In addition to its operational use, it is capable of assembling a climatology of cloud phase, precipitation type and aerosol type. Further, it can contribute to the validation of EarthCARE (ESA) space-borne products.

How to cite: Laffineur, Q., Mangold, A., De Causmaecker, K., and Delcloo, A.: New operational perspective to identify aerosol in real-time with a pioneering algorithm (CONIOPOL) based on CL61 data, EGU General Assembly 2025, Vienna, Austria, 27 Apr–2 May 2025, EGU25-8390, https://doi.org/10.5194/egusphere-egu25-8390, 2025.

EGU25-8397 | Posters on site | GI4.3

A Study Mass Extinction Efficiency (MEE) Calculation and Variability Analysis by Aerosol Source Identification: Application of Horizontal Scanning Lidar and HYSPLIT Model 

Jihyun Yoon, Juseon Shin, Sohee Joo, Gahyeon Park, Dukhyeon Kim, and Youngmin Noh

South Korea faces complex air quality challenges arising from domestic emission sources driven by industrialization and urbanization, as well as seasonally influenced long-range transport pollutants from overseas. In particular, springtime dust storms and wintertime heating emissions both domestic and foreign converge to create a multifaceted air pollution environment. To effectively understand and manage these issues, accurately determining the Mass Extinction Efficiency (MEE) based on optical observations is essential. In this study, we refined MEE calculations by integrating LiDAR-based observations with ground-level measurements, analyzed variability as a function of aerosol origin, and simultaneously assessed the potential for indirect evaluation of atmospheric composition. Using a horizontal SCANNING LiDAR, we derived high-resolution, two-dimensional extinction coefficients near the surface and combined these data with hourly Particulate Matter (PM) observations from the AirKorea monitoring network. Employing the Ångström exponent to differentiate coarse mode particles (Ångström exponent ≈ 0) from fine mode particles (Ångström exponent ≈ 3), we calculated extinction coefficients for total, coarse, and fine aerosols. We then derived MEE values through three approaches: total extinction coefficient relative to PM10, coarse extinction coefficient relative to (PM10 – PM2.5), and fine extinction coefficient relative to PM2.5. To analyze aerosol origins, we used the HYSPLIT (Hybrid Single-Particle Lagrangian Integrated Trajectory) model of NOAA(National Oceanic and Atmospheric Administration), which allowed us to evaluate mesoscale and regional source contributions and investigate their impact on MEE variability. Data from December 2021 to the present revealed substantial variations in MEE values depending on aerosol source regions and compositions. By offering a refined analytical framework tailored to South Korea’s unique climatic and geographical characteristics, this study provides valuable insights for improved air quality monitoring and predictive modeling.

"This research was supported by Particulate Matter Management Specialized Graduate Program through the Korea Environmental Industry & Technology Institute(KEITI) funded by the Ministry of Environment(MOE)"

How to cite: Yoon, J., Shin, J., Joo, S., Park, G., Kim, D., and Noh, Y.: A Study Mass Extinction Efficiency (MEE) Calculation and Variability Analysis by Aerosol Source Identification: Application of Horizontal Scanning Lidar and HYSPLIT Model, EGU General Assembly 2025, Vienna, Austria, 27 Apr–2 May 2025, EGU25-8397, https://doi.org/10.5194/egusphere-egu25-8397, 2025.

EGU25-8530 | Orals | GI4.3

 Improvement of DQ-1/ACDL in Global Thin Cirrus Cloud Detection 

Sijie Chen, Bo Li, and Kai Zhang

Lidar is an essential and unique tool in the current integrated spaceborne remote sensing observation system. From CALIPSO-CloudSat in the A-Train constellation to China’s Daqi-1 (DQ-1) and the latest EarthCARE mission, lidar’s ability to detect thin cirrus and low clouds with fine vertical resolution has significant implications. The effective combination of lidar and CPR provides a complete cloud vertical structure for related studies and an accurate validation for passive remote sensors.

Launched successfully on April 16, 2022, the DQ-1 satellite carries the Aerosol Carbon Detection Lidar (ACDL), a three-wavelength  (532, 1064, and 1572 nm) lidar for comprehensive measurements of atmosphere composition. is technically a combination of two lidars with different mechanisms: a high-spectral-resolution lidar (HSRL) measuring clouds and aerosols and an integrated-path differential absorption (IPDA) lidar measuring carbon dioxide. The mechanism of HSRL allows the separation of aerosol contribution from the molecular backscatter, therefore removing the lidar ratio assumption in the traditional Mie-scattering lidar like CALIOP. Initial validation results indicate an accuracy better than 20% for a strong signal backscatter profile with 24 m vertical resolution. The cloud-top and base height, phase, and classification products have been processed accordingly.

Positioned time-wise between CALIPSO and EarthCARE missions, DQ-1 fills a critical gap in the observation and cross-validation. This report contains results from a one-year-long comparison between DQ-1/ACDL and CALIPSO/CALIOP from June 2022 to June 2023, till the end of CALIPSO operation. The analysis includes case studies from different latitudes and scenarios, and overall gridded global thin cirrus cloud distributions. The results show good consistency between the two systems, with DQ-1/ACDL demonstrating better coherence and performance. Depending on data availability, the report might also include preliminary comparisons with EarthCARE/ATLID data. The report will highlight key improvements of the DQ-1/ACDL system in thin cirrus cloud detection, for better monitoring and valuable insights of cloud properties, atmospheric dynamics, and climate modeling.

How to cite: Chen, S., Li, B., and Zhang, K.:  Improvement of DQ-1/ACDL in Global Thin Cirrus Cloud Detection, EGU General Assembly 2025, Vienna, Austria, 27 Apr–2 May 2025, EGU25-8530, https://doi.org/10.5194/egusphere-egu25-8530, 2025.

The Cloud and Aerosol Lidar for Global Scale Observations of the Ocean-Land-Atmosphere System (CALIGOLA) is an advanced multi-purpose space lidar mission with a focus on atmospheric and oceanic observation aimed at characterizing the Ocean-Earth-Atmosphere system and the mutual interactions within it. This mission has been conceived by the Italian Space Agency (ASI) with the aim to provide the international scientific community with an unprecedented dataset of geophysical parameters capable of increasing scientific knowledge in the areas of atmospheric, aquatic, terrestrial, cryospheric and hydrological sciences. The Italian Space Agency is partnering with NASA on this exciting new space lidar mission. The mission is planned to be launched in the time frame 2031-2032, with an expected lifetime of 3-5.

Exploiting the three Nd:YAG laser emissions at 354.7, 532 and 1064 nm and the elastic (Rayleigh-Mie), depolarized, Raman and fluorescent lidar echoes from atmospheric and ocean constituents, CALIGOLA will carry out multi-wavelength profile measurements of the backscatter, extinction and fluorescent coefficient and the depolarization ratio of atmospheric and ocean particles. These measurements will enable determinations of the microphysical and dimensional properties of atmospheric aerosols and clouds and their typing. Measurements of ocean optical properties will document phytoplankton seasonal and inter-annual dynamics and will improve understanding on marine biogeochemistry, the global carbon cycle, and responses of plankton ecosystems to climate variability. One specific measurement channel at 685 nm will be dedicated to fluorescence measurements from atmospheric aerosols and marine chlorophyll, for the purpose of aerosol typing and characterization of phytoplankton nutrient stress and primary production. CALIGOLA will provide accurate measurements of small-scale variability in earth surface elevation, primarily associated with variations in the ice and snow, terrain, and terrestrial vegetation height (e.g., forest canopies).

Phase A studies, commissioned by the Italian Space Agency to Leonardo S.p.A. and focusing of the technological feasibility of the laser source and the receiver, were conducted from October 2022, while Phase A/B1 activities for the payload, platform, and end-to-end system will start in January-February 2025. Scientific studies in support of the mission are ongoing, commissioned by the Italian Space Agency to University of Basilicata (KO: November 2021) and ISMAR-CNR (KO: September 2023). In September 2023, NASA-LARC initiated a pre-formulation study to assess the feasibility of a possible contribution to the CALIGOLA mission focused on development of the detection system and sampling chain and the implementation of data down link capabilities. The pre-formulation study ended in September 2024, the Mission Concept Review was successfully completed, and a phase A/formulation study has been finalized in preparation for a System Requirements Review, which should start shortly. This presentation will provide details on current status and future steps of this groundbreaking multidisciplinary lidar mission.

How to cite: Di Girolamo, P. and the CALIGOLA Team: The Cloud and Aerosol Lidar for Global Scale Observations (CALIGOLA): Overview of the current status and future steps of a groundbreaking multidisciplinary Mission, EGU General Assembly 2025, Vienna, Austria, 27 Apr–2 May 2025, EGU25-8567, https://doi.org/10.5194/egusphere-egu25-8567, 2025.

EGU25-8872 | ECS | Posters on site | GI4.3

CO2 Measurements with Raman Lidar in the Lower Troposphere  

Moritz Schumacher, Diego Lange, Andreas Behrendt, and Volker Wulfmeyer

Carbon dioxide is the most important greenhouse gas caused by emissions from human activities. Nevertheless, little is known about its distribution in the atmposphere. Thus, continuous CO2 measurements not only on the ground but also in higher altitudes are key to improve our understanding of radiative forcing. Therefore, ground-based lidar systems with their ability of range-resolved CO2 measurements are particularly interesting. In the recent two years, we have developed and incorporated a new channel to our ground-based Raman lidar system ARTHUS ("Atmospheric Raman Temperature and HUmidity Sounder") [1] and successfully collected more then 70 days of CO2 profiles at the “Land-Atmosphere Feedback Observatory” (LAFO), in Stuttgart, Germany [2]. We utilize the 2ν2 CO2 Raman line, which is well separated from Raman lines of other atmosphere gases, especially O2. With the current setup, we profile CO2, temperature and humidity as well as particle extinction and particle backscatter coefficients in five receiver channels. The first CO2measurements in 2023 with a preliminary calibration where already presented at the EGU24 [3]. Since then, the laser power has been doubled while still being an eye-safe system. With some other improvements in addition, the integration times needed at night and for a resolution of 300 m are for example 1.5 hours for an uncertainty of 1.5 ppm and 2 hours for an uncertainty of 2 ppm at altitudes of 500 m and 1 km, respectively.

We are currently (January 2025) adding a 2-mirror scanner to the system. With this, we will much better calibrate our CO2 mixing ratio with low-level scans near our ground-based in-situ sensors located at the LAFO site. The scanning measuements of the CO2 concentration will provide insights in its distribution around the surface sensors and enable us to identify and quantify local carbon sources and sinks. We will present the recent approaches and first scanning measurements at the EGU25.

References: 

[1] Lange, D. et al.: Compact Operational Tropospheric Water Vapor and Temperature Raman Lidar with Turbulence Resolution. Geophys. Res. Lett. (2019). DOI: 10.1029/2019GL085774 

[2] Späth, F., S. Morandage, A. Behrendt, T. Streck, and V. Wulfmeyer, 2021: The Land-Atmosphere Feedback Observatory (LAFO). EGU21-7693 (2021). DOI: 10.5194/egusphere-egu21-7693 

[3] Schumacher, M., D. Lange, A. Behrendt, V. Wulfmeyer, 2024: Measurements of CO2Profiles in the Lower Troposphere with the new Raman Lidar Channel of ARTHUS. EGU24-9219 (2024). DOI: 10.5194/egusphere-egu24-9219 

How to cite: Schumacher, M., Lange, D., Behrendt, A., and Wulfmeyer, V.: CO2 Measurements with Raman Lidar in the Lower Troposphere , EGU General Assembly 2025, Vienna, Austria, 27 Apr–2 May 2025, EGU25-8872, https://doi.org/10.5194/egusphere-egu25-8872, 2025.

EGU25-9052 | ECS | Posters on site | GI4.3

Evaluating the MONARCH Model with Lidar Data: A Step Toward Improving Global Dust Surface Concentrations 

Carlotta Gilè, Emanuele Emili, Jeronimo Escribano, Luka Ilic, Oriol Jorba Casellas, and Carlos Perez Garcia Pando

The Barcelona Dust Regional Center (BDRC) provides daily forecasts of dust optical depth and dust surface concentrations, as part and coordination entity of the Northern Africa, Middle East and Europe (NAMEE) node of the World Meteorological Organization Sand and Dust Storm Warning Advisory and Assessment System (WMO SDS-WAS). Dust optical depth forecasts from the NAMEE SDS-WAS ensemble show a relatively good agreement, while the forecasts of dust surface concentrations show larger variability between models. Moreover, the consistency between dust optical depth, as an integrated column quantity, and surface concentration forecasts remains challenging. 

Since July 2024, vertical profiles of dust concentrations from the Multiscale Online Nonhydrostatic AtmospheRe Chemistry (MONARCH) model of the SDS-WAS ensemble have been made public on the BDRC website. This study presents the first evaluation of this new forecast product through comparisons with lidar observations, focusing on vertical profiles of total and dust extinction coefficients. Specifically, we used lidar measurements from the NASA Micro-Pulse Lidar Network (MPLNET) in the Mediterranean and North Africa area. While the comparison of the total extinction coefficient between MONARCH (550 nm) and MPLNET (532 nm) can be performed directly but is affected by unaccounted aerosols (e.g. sea salts, anthropogenic aerosols), the extraction of dust extinction coefficient from MPLNET products required additional processing. To this purpose, the POLIPHON algorithm was exploited to obtain the lidar-derived dust component from the total aerosol load and enable a fair intercomparison with modeled dust profiles. Initial descriptive and quantitative results confirm the model’s reliability in forecasting and predicting dust vertical profile characteristics.

Building on this evaluation, we explore the potential of leveraging lidar data to improve the dust ground concentration estimates of the MONARCH model forecasts. The proposed approach explores empirical adjustments of the model's surface concentration using lidar observations and validates these improvements against independent ground-based PM10 measurements collected by the European Environment Agency (EEA). The analysis is performed for three European sites, namely Tenerife, Barcelona, and El Arenosillo, for the period from July 2024 to January 2025.

The expanded aim of this work is to assess the feasibility of utilizing next-generation space-borne lidar systems, such as EarthCARE (Cloud, Aerosol, and Radiation Explorer), to enhance global dust surface concentration estimations from model forecasts.

This study highlights the synergy between observations and modeling, demonstrating how lidar observations could be exploited for correcting and improving model performance at both regional and global scales.

How to cite: Gilè, C., Emili, E., Escribano, J., Ilic, L., Jorba Casellas, O., and Perez Garcia Pando, C.: Evaluating the MONARCH Model with Lidar Data: A Step Toward Improving Global Dust Surface Concentrations, EGU General Assembly 2025, Vienna, Austria, 27 Apr–2 May 2025, EGU25-9052, https://doi.org/10.5194/egusphere-egu25-9052, 2025.

EGU25-10120 | ECS | Orals | GI4.3

Comparison of fresh and aged smoke particles simultaneously observed at the ACTRIS Potenza observatory  

Benedetto De Rosa, Nikolaos Papagiannopoulos, Michail Mytilinaios, Aldo Amodeo, Giuseppe D'Amico, Marco Rosoldi, Donato Summa, Ilaria Gandolfi, Christina–Anna Papanikolaou, Pilar Gumà-Claramunt, Teresa Laurita, Francesco Cardellicchio, Igor Veselovskii, Paolo Di Girolamo, and Lucia Mona

This study presents a detailed analysis of the optical and microphysical properties of biomass burning aerosols from two distinct smoke plumes observed on 16 July 2024 at the CIAO atmospheric observatory in Potenza, Italy. The lower layer corresponds to a local wildfire, while the upper layer correspond to  a long-range transported plume from Canada. The objective is to highlight significant differences in their characteristics and atmospheric impacts.

The local fire was characterized not only with lidar measurements, but with all the remote sensing instruments present in the observatory. The fire, ignited around 16:00 UTC approximately 2 km from the observatory, was detected within an hour. Ceilometer lidar and radar data showed that wildfire particles ascended to 3 km, where elevated humidity facilitated the formation of condensation nuclei, confirmed by a radiometer-observed peak in liquid water content. The ACSM (Aerosol Chemical Speciation Monitor) and aethalometer measurements show a significant peak around 20:00 UTC, which coincides with the deposition of the particles. The inversion results from lidar measurements revealed a low contribution of black carbon and fine-mode particles, consistent with incomplete combustion typical of small-scale fires. Furthermore, a strong dependence on humidity variations was observed, emphasizing the dynamic interaction between local fires and atmospheric conditions.

In contrast, the Canadian wildfire plume, transported at altitudes between 5.5 and 6.5 km, exhibited different characteristics. Due the complete combustion particles have a higher absorption properties. The lidar ratio at 532 nm exceeded that at 355 nm, similar with previous observations of aged wildfire plumes. During long-range transport, aging processes such as coagulation significantly altered the particles, increasing their effective radius. Microphysical analysis indicated the presence of larger, more absorbent particles compared to the local plume.

This study underscores the importance of integrating remote sensing and in-situ measurements to capture the lifecycle of wildfire events. The results reveal a great variability in smoke plume properties, which must be accounted for in radiative transfer models to accurately assess their atmospheric and climatic impacts.

How to cite: De Rosa, B., Papagiannopoulos, N., Mytilinaios, M., Amodeo, A., D'Amico, G., Rosoldi, M., Summa, D., Gandolfi, I., Papanikolaou, C., Gumà-Claramunt, P., Laurita, T., Cardellicchio, F., Veselovskii, I., Di Girolamo, P., and Mona, L.: Comparison of fresh and aged smoke particles simultaneously observed at the ACTRIS Potenza observatory , EGU General Assembly 2025, Vienna, Austria, 27 Apr–2 May 2025, EGU25-10120, https://doi.org/10.5194/egusphere-egu25-10120, 2025.

EGU25-10454 | ECS | Orals | GI4.3

Raman lidar water vapor observations to assess the uncertainty of MLS and ERA5 at the upper troposhere 

Dunya Alraddawi, Philippe Keckhut, Florian Mandija, Guillaume Payen, Jean Charles Dupont, Christophe Pietras, Abdenour Irbah, Alain Sarkissian, Alain Hauchecorne, and Jacques Porteneuve

Water vapor information in the upper troposphere (UT) is crucial for understanding the thermodynamic conditions leading to the formation of cirrus clouds and persistent contrails. Both phenomena significantly contribute to aviation-induced radiative forcing, driving global mitigation efforts. Raman lidars provide high-resolution humidity profiles, describing altitudes prone to ice supersaturation—conditions that are challenging to detect and accurately represent in current models.

In this study, Raman lidar Water Vapor Mixing Ratio (WVMR) measurements from various sites in France were used to evaluate the performance of the ERA5 model in assessing humidity at typical aircraft altitudes. Additionally, the uncertainties in Microwave Limb Sounder (MLS) WVMR measurements at the same altitudes were assessed. Raman lidar profiles were aggregated into pseudo-monthly datasets to facilitate comparison with the limited number of MLS overpasses at each site, enabling validation of spatio-temporal pseudo-monthly lidar-matched MLS and ERA5 WVMR profiles.

The MLS dataset offers one of the longest records of WVMR, making it a valuable resource for trend assessment. This investigation enables the validated use of these datasets for studying UT humidity trends and variability on seasonal and annual scales over the past decade.

How to cite: Alraddawi, D., Keckhut, P., Mandija, F., Payen, G., Dupont, J. C., Pietras, C., Irbah, A., Sarkissian, A., Hauchecorne, A., and Porteneuve, J.: Raman lidar water vapor observations to assess the uncertainty of MLS and ERA5 at the upper troposhere, EGU General Assembly 2025, Vienna, Austria, 27 Apr–2 May 2025, EGU25-10454, https://doi.org/10.5194/egusphere-egu25-10454, 2025.

EGU25-10784 | Posters on site | GI4.3

Real-Time Monitoring of Air Pollution and Detection of Illegal Emissions Using Advanced Scanning LiDAR Technology 

Seong-min Kim, Kwanchul Kim, Gahye Lee, Jeong-min Park, Sea-ho Oh, Min-kyung Sung, Sangcheol Kim, Youndae Jung, Ilkwon Yang, Byung-Jin Choi, Sungchul Choi, and Changgi Choi

Air pollution is a persistent environmental and public health challenge, particularly in industrial areas characterized by diverse and diffuse emission sources. This study demonstrates the application of an advanced scanning LiDAR system for real-time monitoring of particulate matter (PM2.5, PM10) and the detection of illegal emissions in Gyeonggi Province, South Korea. The system employs advanced remote sensing technology, enabling 360° atmospheric scans within a 5 km radius at 30-minute intervals, with a spatial resolution of 30 meters.

During its deployment in the Sihwa National Industrial Complex, home to over 978 industrial facilities, the LiDAR system identified 192 potential illegal emission sources. Subsequent investigations confirmed 22 violations of environmental regulations, resulting in regulatory actions such as facility shutdowns and legal proceedings. The deployment led to a measurable improvement in air quality, evidenced by a reduction of 2.4 μg/m³ in PM2.5 levels during the operational period.

The integration of LiDAR data with complementary environmental datasets enabled precise spatiotemporal analyses, enhancing the efficiency of regulatory enforcement and fostering effective inter-agency collaboration. The results underscore the system’s potential to overcome limitations of conventional point-source monitoring, offering an innovative tool for large-scale industrial air pollution management.

This study highlights the scalability and precision of scanning LiDAR technology as a critical asset for real-time air quality monitoring and regulatory compliance. The findings advocate for broader adoption of this technology in industrial settings globally, emphasizing its ability to address complex environmental challenges and promote sustainable industrial practices.

Acknowledgement: This research was supported by a grant (2023-MOIS-20024324) of Ministry-Cooperation R&D Program of Disaster-Safety funded by Ministry of Interior and Safety (MOIS, Korea) and Climate & Environment Division Scientific Environment Surveillance Team in Gyeonggi-do Province, Korea.

How to cite: Kim, S., Kim, K., Lee, G., Park, J., Oh, S., Sung, M., Kim, S., Jung, Y., Yang, I., Choi, B.-J., Choi, S., and Choi, C.: Real-Time Monitoring of Air Pollution and Detection of Illegal Emissions Using Advanced Scanning LiDAR Technology, EGU General Assembly 2025, Vienna, Austria, 27 Apr–2 May 2025, EGU25-10784, https://doi.org/10.5194/egusphere-egu25-10784, 2025.

EGU25-10819 | Posters on site | GI4.3

Advanced Scanning LiDAR for Real-Time Detection of Wildfires and Industrial Fires 

Kwanchul Kim, Seong-min Kim, Gahye Lee, Jeong-Min Park, Sea-ho Oh, Min-Kyung Sung, Youngmin Noh, Kwonho Lee, Young J. Kim, Woosuk Choi, Sungchul Choi, Changgi Choi, Chun-Sang Hong, Sangcheol Kim, Youndae Jung, Ilkwon Yang, and Byung-Jin Choi

This study introduces the development and application of the advanced scanning LiDAR system, SMART LiDAR MK-II(Samwoo TCS co., Ltd), designed for the early detection of wildfires and industrial fires. Traditional fire detection methods face limitations due to diverse atmospheric conditions, topographical factors, and variability in fire and smoke characteristics. To address these challenges, monitoring systems with spatial resolutions below 30 meters are essential. The SMART LiDAR MK-II employs dual wavelengths (532 nm and 1064 nm) and provides 360° observations with an angular resolution of approximately 3° within a 30-minute interval, enabling the real-time detection of smoke and particulate matter under various environmental conditions.


The system was validated through field deployment in the Sihwa Industrial Complex, South Korea, during a fire at an automotive painting factory on July 22, 2024. Positioned at a monitoring height of 55 meters and approximately 20 meters from the fire source, the SMART LiDAR MK-II detected smoke with peak PM10 and PM2.5 concentrations of 724 µg/m³ and 334 µg/m³, respectively. The smoke plume was observed dispersing over 5 km northward, influenced by prevailing winds. Furthermore, the system successfully captured the temporal reduction in particulate matter concentrations following fire suppression, demonstrating its capability to monitor emission dynamics and dispersion patterns.


Currently, SMART LiDAR MK-II is undergoing rigorous waterproof and dustproof testing to ensure operational reliability under diverse conditions, with commercialization in progress. This cutting-edge technology represents a significant advancement in LiDAR-based fire detection, offering high spatial resolution, sensitivity, and reliability for real-time monitoring of smoke emissions and atmospheric impacts. The results highlight the transformative potential of SMART LiDAR MK-II to enhance global fire detection and environmental monitoring capabilities.


Acknowledgment: This research was supported by a grant (2023-MOIS-20024324) from the Ministry-Cooperation R&D Program of Disaster-Safety funded by the Ministry of Interior and Safety (MOIS, Korea).

How to cite: Kim, K., Kim, S., Lee, G., Park, J.-M., Oh, S., Sung, M.-K., Noh, Y., Lee, K., Kim, Y. J., Choi, W., Choi, S., Choi, C., Hong, C.-S., Kim, S., Jung, Y., Yang, I., and Choi, B.-J.: Advanced Scanning LiDAR for Real-Time Detection of Wildfires and Industrial Fires, EGU General Assembly 2025, Vienna, Austria, 27 Apr–2 May 2025, EGU25-10819, https://doi.org/10.5194/egusphere-egu25-10819, 2025.

EGU25-11218 | ECS | Posters on site | GI4.3

Relationships Between Surface Fluxes and Boundary Layer Dynamics: Statistics at the Land-Atmosphere Feedback Observatory (LAFO) 

Syed Saqlain Abbas, Andreas Behrendt, Oliver Branch, and Volker Wulfmeyer

We studied the convective boundary layer (CBL) processes and surface fluxes long-term statistics by using a combination of two Doppler lidars (DLs) and an eddy-covariance station (EC) at the Land-Atmosphere Feedback Observatory (LAFO), Stuttgart, Germany (Abbas et al., 2024). At LAFO (Späth et al, 2023), one DL is continuously operated in vertical pointing mode, while the second is in six-beam scanning mode, both providing high-resolution data with resolutions of 1 s and 30 m. From this combination of DLs, we derived the profiles of vertical wind variance (Lenschow et al, 2000; Wulfmeyer et al, 2024), horizontal wind variance and turbulent kinetic energy (TKE) as well as CBL depth 𝑧𝑖 (Bonin et al., 2017; Bonin et al., 2018). The surface turbulent fluxes are acquired from an EC station in the agricultural fields of our university ~500 m away from the DLs. Daytime statistics are derived from 20 convective days from May to July 2021 with cloud cover < 40%. In this data set, we found a maximum of the CBL height averaged over all these days ⟨𝑧𝑖⟩ of (1.53 ±0.07) km at 13:30 UTC, which is about 2 hours after local noon. We found counter-clockwise hysteresis patterns between the CBL height and the surface fluxes. In the development phase, these relationships were approximately linear. In the early afternoon, the relationships reached a peak phase with both large fluxes and high values of ⟨𝑧𝑖⟩. At 12:00 UTC, just after local noon, the maximum values of vertical, horizontal, and total TKE were 0.55 m2s-2, 1.26 m2s-2 and 1.71 m2s-2 at heights of (0.30±0.06)⟨𝑧𝑖⟩ , (0.56±0.06)⟨𝑧𝑖⟩, and (0.40±0.06)⟨𝑧𝑖⟩, respectively. In the decay phase in the later afternoon, the relationships show non-linear patterns with larger values of ⟨𝑧𝑖⟩ for the same surface fluxes than in the morning. Furthermore, we analyzed relationships between the vertical and horizontal wind components and total TKE. Also, here, we found non-linear patterns in the three CBL phases.


Abbas, S. S., et al., 2024, https://doi.org/10.5194/egusphere-2024-3878
Späth et al., 2023, https://doi.org/10.5194/gi-12-25-2023
Lenschow et. al., 2000, https://doi.org/10.1175/1520-0426(2000)017<1330:MSTFOM>2.0.CO;2
Wulfmeyer et al., 2024, https://doi.org/10.5194/amt-17-1175-2024
Bonin et. al., 2017, https://doi.org/10.5194/amt-10-3021-2017
Bonin et. al., 2018, https://doi.org/10.1175/JTECH-D-17-0159.1

How to cite: Abbas, S. S., Behrendt, A., Branch, O., and Wulfmeyer, V.: Relationships Between Surface Fluxes and Boundary Layer Dynamics: Statistics at the Land-Atmosphere Feedback Observatory (LAFO), EGU General Assembly 2025, Vienna, Austria, 27 Apr–2 May 2025, EGU25-11218, https://doi.org/10.5194/egusphere-egu25-11218, 2025.

EGU25-11468 | ECS | Posters on site | GI4.3

Network Doppler Lidar for simultaneous multi-parameter observations 

Jan Froh, Josef Höffner, Alsu Mauer, Thorben Mense, Ronald Eixmann, Gerd Baumgarten, Alexander Munk, Sarah Scheuer, and Michael Strotkamp

We present the development progress of our compact multi-field-of-view lidar units for investigating small- to large-scale processes in the atmosphere. Matched narrowband laser and receiver enable precise daylight aerosol measurements with high aerosol visibility and high Doppler wind sensitivity in the troposphere/stratosphere and above. We present recent results with focus on extended measurement capabilities of our transportable systems.

Daylight capable Doppler lidars are complex systems particularly as lidar arrays require compact units with automated functionality. To study the 3-dimensional structure of small- to large-scale atmospheric processes we developed a universal Doppler lidar platform with multiple fields of view. All required technologies are included for studying Mie scattering (aerosols), Rayleigh scattering (air molecules), and resonance fluorescence (potassium atoms) from the troposphere (5 km) to the thermosphere (100 km). We developed unique frequency scanning laser and filter techniques that enable multiple observations (wind, temperature, aerosols, metal density). The combination of narrowband emitter and receiver allow a spectral high resolved characterization of the backscattered Doppler signals with a high wind sensitivity and aerosol visibility. Our current developments focus on enhancing lidar measurement capabilities of multiple parameters together with transferring the technology into industry (Project LidarCUBE) and demonstration of lidar array with enhanced daylight capability (EULIAA – European Lidar Array for Atmospheric Climate Monitoring). We will show recent results of our unique lidar technique with focus on aerosol measurements and more.

How to cite: Froh, J., Höffner, J., Mauer, A., Mense, T., Eixmann, R., Baumgarten, G., Munk, A., Scheuer, S., and Strotkamp, M.: Network Doppler Lidar for simultaneous multi-parameter observations, EGU General Assembly 2025, Vienna, Austria, 27 Apr–2 May 2025, EGU25-11468, https://doi.org/10.5194/egusphere-egu25-11468, 2025.

EGU25-11819 | Posters on site | GI4.3

Estimation of optical and microphysical characteristics of contrails using Lidar at SIRTA observatory, Paris 

Cheikh Dione, Jean-Charles Dupont, Karine Caillault, Nicolas Gourgue, Christophe Pietras, and Martial Haeffelin

Contrails are local and thin anthropogenic clouds that are difficult to predict by numerical weather forecasting models. Given their local radiative impact, it is urgent to properly document their characteristics in order to improve their parametrization in weather models and evaluate their contribution to global warming. In the framework of the Climaviation project (Funded by the French Direction Générale de l’Aviation Civile (DGAC)), this study aims to quantify the optical, geometrical and microphysical characteristics of contrails at the SIRTA observatory in Palaiseau, France. We used a co-localised instrumental synergy composed of the Lidar IPRAL (a multichannel raman Lidar), a total sky camera, and aircraft flight altitudes to detect the occurrence of contrails over the site during the 2018-2023 period. Based on three (3) case studies, the particular and molecular integration methods are applied on the Lidar backscatter, to estimate the optical depth of contrails. Vertical profiles of temperature and relative humidity from Trappes radiosoundings are used to characterize the atmospheric conditions classified into three (3) categories of contrail evolution (non-persistent, persistent, and spreading). The results show that the optical thickness of contrails can reach 0.3 for contrails formed in a thick persistent layer. It is lower for contrails developing in a non-persistent layer. During daytime, the contrails contribute to reducing the surface downwelling and upwelling measured shortwave radiation in the order of 218 and 50 W m-2 respectively. Their impact on longwave radiation is relatively negligible.

How to cite: Dione, C., Dupont, J.-C., Caillault, K., Gourgue, N., Pietras, C., and Haeffelin, M.: Estimation of optical and microphysical characteristics of contrails using Lidar at SIRTA observatory, Paris, EGU General Assembly 2025, Vienna, Austria, 27 Apr–2 May 2025, EGU25-11819, https://doi.org/10.5194/egusphere-egu25-11819, 2025.

EGU25-12416 | Orals | GI4.3

Building a Long-Term Cloud Record from Spaceborne Lidars: Bridging CALIOP to ATLID 

Artem Feofilov, Hélène Chepfer, Vincent Noël, and Marius Dahuron

Clouds exert multifaceted radiative effects on Earth's energy budget, serving as both insulators and reflectors of incoming solar radiation while also trapping outgoing infrared radiation. Consequently, clouds contribute to both surface cooling and warming processes, profoundly influencing regional and global climate dynamics. Despite their crucial role in Earth's energy balance, uncertainties persist regarding their feedback mechanisms.

A comprehensive understanding of clouds, including their spatial coverage, vertical distribution, and optical properties, is imperative for accurate climate prediction. Satellite-based observations, particularly those from active sounders, have offered continuous monitoring of clouds with high vertical and horizontal resolution since 2006. However, comparing cloud data from different spaceborne lidars presents challenges due to variations in wavelength, pulse energy, detector type, and local observation times.

This study discusses a methodology aimed at reconciling cloud data derived from several disparate spaceborne lidar platforms: CALIPSO (Cloud-Aerosol Lidar and Infrared Pathfinder Satellite Observation), which operated from 2006 to 2023; ALADIN/Aeolus (Atmospheric Laser Doppler Instrument), which operated from 2018 to 2023; IceSat-2, operational since 2018; and ATLID/EarthCARE (ATmospheric LIDar), launched last year.

For historical reasons, we use the Scattering Ratio at 532 nm (SR532) as a baseline for defining clouds across all lidars. The numerator contains the Attenuated Total Backscatter at 532 nm (ATB532), while the denominator includes a calculated Attenuated Molecular Backscatter at 532 nm (AMB532), assuming a cloud-free atmospheric profile. For measurements at other wavelengths, we convert the retrieved optical properties to SR532 and ATB532 to enable direct comparison. We demonstrate that this approach facilitates the retrieval of comparable cloud data for CALIOP and ALADIN using real measurements and for CALIOP and ATLID using synthetic measurements.

For lidars overlapping in time, the aforementioned cloud detection parameters can be fine-tuned to ensure a seamless transition between datasets. Collocated data are analyzed with respect to cloud fraction at different latitudes, altitudes, and seasons, and any differences are explored and corrected for, potentially accounting for instrument sensitivity or noise. However, when instruments do not overlap in time, an additional inter-calibrational procedure is necessary. We show how IceSat-2 can serve as a reference to align CALIOP and ATLID cloud datasets.

How to cite: Feofilov, A., Chepfer, H., Noël, V., and Dahuron, M.: Building a Long-Term Cloud Record from Spaceborne Lidars: Bridging CALIOP to ATLID, EGU General Assembly 2025, Vienna, Austria, 27 Apr–2 May 2025, EGU25-12416, https://doi.org/10.5194/egusphere-egu25-12416, 2025.

EGU25-12490 | Orals | GI4.3

 d13C carbon isotopic composition of CO2 in the atmosphere by Lidar 

Fabien Gibert, Dimitri Edouart, Didier Mondelain, Thibault Delahaye, Claire Cénac, and Camille Yver

Our understanding of the global carbon cycle needs for new observations of CO2 concentration at different space and time scales but also would benefit from observations of additional tracers of intra-atmospheric or surface-atmosphere exchanges to characterize sources and sinks. Lidar is a well-known promising technology for this research as it can provide, at the same time, structure of the atmosphere, dynamics and composition of several trace gas concentration. In this framework, a coherent differential absorption lidar (CDIAL) has been developed at LMD to measure simultaneously and separately 12CO2 and 13CO2 isotopic composition of CO2in the atmosphere. It also provides the wind speed along the line of sight of the laser with an additional Doppler ability. This paper investigates the methodology of three wavelengths DIAL in the spectral domain of 2-µm to obtain range-resolved CO2 isotopic ratio d13C. The set-up of the lidar as well as the signal processing is described in details. First atmospheric measurements along three days are achieved in the surface layer above the suburban area of Ecole Polytechnique campus, Palaiseau, France. Typical performances of the instrument (median values along 70h of measurement) with 10 min of time averaging show: (1) a precision around 0.6% for 1.2 km range resolution for 12CO2 mixing ratio (2) a precision around 3.2% for 1.6 km range resolution for 13CO2 mixing ratio. In situ co-located gas analyser measurements are used to correct for biases that are explained neither by the spectroscopic database accuracy nor the signal processing and will need further investigation. Nevertheless, this preliminary study enables to make a useful state of the art for current lidar ability to provide d13C measurements in the atmosphere with respect to geophysical expected anomalies and to predict the necessary performances of a future optimized instrument.

How to cite: Gibert, F., Edouart, D., Mondelain, D., Delahaye, T., Cénac, C., and Yver, C.:  d13C carbon isotopic composition of CO2 in the atmosphere by Lidar, EGU General Assembly 2025, Vienna, Austria, 27 Apr–2 May 2025, EGU25-12490, https://doi.org/10.5194/egusphere-egu25-12490, 2025.

EGU25-12573 | ECS | Orals | GI4.3

Calibration of water vapour Raman lidar using GNSS precipitable water vapour and reanalysis model data 

Arlett Díaz Zurita, Daniel Pérez Ramírez, David Neil Whiteman, Onel Rodríguez Navarro, José Antonio Bravo Aranda, María José Granados Muñoz, Juan Luis Guerrero Rascado, Jesus Abril Gago, Sol Fernández Carvelo, Ana del Águila Pérez, Manuel Antón Martínez, Javier Vaquero Martínez, Alexander Haefele, Giovanni Martucci, Inmaculada Foyo Moreno, José Antonio Benavent Oltra, Lucas Alados Arboledas, and Francisco Navas Guzmán

Water vapour is a crucial and highly variable greenhouse gas in the Earth's atmosphere, which can significantly influence radiative balance, energy transport, and photochemical processes. It can also affect the radiative budget indirectly through cloud formation and by altering the size, shape, and chemical composition of aerosol particles. Accurate and systematic observations are essential for understanding its impacts and improving climate projections. Raman lidar technique is widely used for obtaining water vapour mixing ratio (WVMR) profiles with high vertical and temporal resolution. It relies on Raman scattering from water vapour and nitrogen molecules and is usually calibrated by reference to one or more external measurements of water vapour.

This study presents a hybrid methodology for obtaining high temporal resolution calibration constants for Raman lidar measurements, and posteriorly retrieves high accuracy WVMR profiles. It combines correlative measurements of precipitable water vapour (PWV) for calibrating lidar measurements with Numerical Weather Prediction (NWP) data to reconstruct the profile within the incomplete lidar overlap region. This methodology is applied to the MULHACEN Raman lidar system, operational at UGR station of the University of Granada (Spain) for the long period of 2009-2022. The hybrid method was optimized for the station by selecting Global Navigation Satellite System (GNSS) PWV data as the most appropriate due to its better agreement with correlative radiosondes (R2 of 0.95). Furthermore, the ERA5 model was selected as the most appropriate for reconstructing the incomplete lidar overlap region due to its better temporal and spatial resolution and its accuracy when evaluated against radiosonde data. The advantages of the hybrid calibration methodology are evaluated compared to traditional radiosonde-based methods or PWV data assuming a constant WVMR in the incomplete overlap region. Although all methods generally provide good calibration constants, the hybrid approach presented the best performance, as quantified by an R2 of 0.85, a slope of 0.97, and an intercept of -0.05 g/kg, particularly under conditions where atmospheric layers are not well-mixed. Comparison with radiosonde data revealed excellent agreement, with a mean bias error of -0.11 ± 0.38 g/kg and a standard deviation of 1.04 ± 0.35 g/kg across the entire period and vertical range (0 – 6.0 km agl). The most important result of this study is the ability to continuously evaluate calibration constants during 14 years of MULHACEN operation. The posterior application of the hybrid methodology to all MULHACEN measurements enabled the generation of a comprehensive long time database of WVMR profiles.

How to cite: Díaz Zurita, A., Pérez Ramírez, D., Neil Whiteman, D., Rodríguez Navarro, O., Bravo Aranda, J. A., Granados Muñoz, M. J., Guerrero Rascado, J. L., Abril Gago, J., Fernández Carvelo, S., del Águila Pérez, A., Antón Martínez, M., Vaquero Martínez, J., Haefele, A., Martucci, G., Foyo Moreno, I., Benavent Oltra, J. A., Alados Arboledas, L., and Navas Guzmán, F.: Calibration of water vapour Raman lidar using GNSS precipitable water vapour and reanalysis model data, EGU General Assembly 2025, Vienna, Austria, 27 Apr–2 May 2025, EGU25-12573, https://doi.org/10.5194/egusphere-egu25-12573, 2025.

We present a Doppler lidar designed to detect the molecular spectrum characteristics, which are attributed to the Rayleigh-Brillouin scattering, in the atmospheric boundary layer. The suggested system is a continuous-wave, infrared Doppler lidar based on a bi-static transceiver and a coherent in-phase/quadrature detection scheme. For the detection of the features of the Rayleigh-Brillouin spectrum we use fiber-coupled, balanced photodetectors and a digitizer with a 1.6 GHz bandwidth. This broad bandwidth is necessary for the detection of Doppler shifts not only at frequencies of atmospheric winds, but also of the ones corresponding to molecular and acoustic speed that extend over several hundred megahertz. We demonstrate that using this configuration it is possible to detect the molecular Rayleigh-Brillouin spectrum over 30-minute time periods. The observational range of this system is focused on the lower part of the atmosphere (< 200 m) and the objective is to investigate if the resolved features of the Rayleigh-Brillouin spectrum can be related to the temperature, which could lead to the development of a novel vertical profiler of atmospheric temperature.

How to cite: Angelou, N. and Mann, J.: On the measurement of the Rayleigh-Brillouin spectrum and atmospheric temperature using a coherent Doppler lidar, EGU General Assembly 2025, Vienna, Austria, 27 Apr–2 May 2025, EGU25-12657, https://doi.org/10.5194/egusphere-egu25-12657, 2025.

EGU25-12951 | Posters on site | GI4.3

Gravity waves observed by lidar at the center and edge of the Southern polar vortex 

Natalie Kaifler and Bernd Kaifler

Our Rayleigh lidar systems provide temperature profiles up to 100 km altitude at both a site at southern hemisphere mid-latitudes and at South Pole. Very strong orographic gravity waves dominate in the lee of the Southern Andes in winter, a region proximate to the polar vortex edge where strong winds prevail. In contrast, despite being situated within the stable polar vortex core, continuous but weaker gravity waves are observed above Amundsen-Scott station at South Pole. Potential sources for these waves include catabatic winds flowing across the Transantarctic Mountains – which also give rise to polar stratospheric clouds-, polar vortex dynamics, or lateral progagation from mid-latitudes. We present examples of gravity wave measurements and statistical analyses derived from our multi-year, ongoing datasets.

How to cite: Kaifler, N. and Kaifler, B.: Gravity waves observed by lidar at the center and edge of the Southern polar vortex, EGU General Assembly 2025, Vienna, Austria, 27 Apr–2 May 2025, EGU25-12951, https://doi.org/10.5194/egusphere-egu25-12951, 2025.

EGU25-14705 | ECS | Orals | GI4.3

The calibration and validation of XCO2 measured by Lidar onboard DQ-1 

Lu Zhang and Xifeng Cao Cao

Atmospheric carbon dioxide (CO2) is the primary anthropogenic driver of climate change, accounting for more than half of the total effective radiative forcing (ERF). The accurate monitoring of carbon dioxide is essential to study the global carbon cycle and radiation budget on Earth.The Aerosol and Carbon Detection Lidar (ACDL) instrument, as the first space-borne integrated path differential absorption (IPDA) light detection and ranging (Lidar) for XCO2, was successfully launched in April 2022 onboard the DaQi-1 (DQ-1) satellite.During the two years of on-orbit operation, we constantly updated the processing methods, including the spectral broadening of CO2 caused by water vapor, etc. Finally, we calibrated and validated  the CO2 retrieved by DQ-1 usingTCCON and COCOON, and the results showed that the deviation reached the satellite design demand (1ppm).

How to cite: Zhang, L. and Cao, X. C.: The calibration and validation of XCO2 measured by Lidar onboard DQ-1, EGU General Assembly 2025, Vienna, Austria, 27 Apr–2 May 2025, EGU25-14705, https://doi.org/10.5194/egusphere-egu25-14705, 2025.

EGU25-15242 | ECS | Posters on site | GI4.3

A field intercomparison of inter-instrument variability of six co-located Vaisala CL61 lidar-ceilometers 

Dana Looschelders, Andreas Christen, Sue Grimmond, Simone Kotthaus, Jean-Charles Dupont, Daniel Fenner, Martial Haeffelin, and William Morrison

With the advances in ground-based remote sensing technology, measurement networks of automatic aerosol lidar-ceilometers are developing rapidly across Europe and worldwide. Characterising inter-instrument variability of sensors is crucial to assessing uncertainties in observational campaigns, networks, and for data assimilation. It allows the determination of thresholds that need to be exceeded for the detection of meaningful atmospheric differences between observations obtained at different locations (e.g. urban vs rural).

We co-locate six Vaisala CL61 automatic lidar-ceilometers at the SIRTA atmospheric observatory (Palaiseau, France) for a period of ten days to quantify instrument-related differences in several observed variables: profiles of attenuated backscatter and the linear depolarisation ratio (LDR), as well as derived cloud variables, such as cloud base height (CBH) and cloud cover fraction (CCF), and mixed-layer height. Analysing intervals between 5 and 60 min, median absolute differences between sensors are used to quantify inter-instrument uncertainties. For backscatter and LDR, we differentiate between conditions with rain, clear sky, and clouds, respectively.

The agreement between instruments is capable of resolving climatological differences in mesoscale conditions (5 - 50 km, e.g. across cities) for both profile variables and derived cloud variables and layer heights. However, differences exist and can be linked to signal-to-noise ratio (SNR) and atmospheric conditions. The median absolute inter-sensor differences for 15 min aggregation intervals (AD50) are 1.9 % for total CCF (excluding clear sky and fully overcast conditions) and 7.3 m for CBH. Cloud variables agree better for boundary layer clouds where the first (of five) cloud layer < 4 km agl. The mixed-layer height AD50 is 0 m. Median differences smaller than two instrument range gates (9.6 m) highlight the close inter-instrument agreement.

How to cite: Looschelders, D., Christen, A., Grimmond, S., Kotthaus, S., Dupont, J.-C., Fenner, D., Haeffelin, M., and Morrison, W.: A field intercomparison of inter-instrument variability of six co-located Vaisala CL61 lidar-ceilometers, EGU General Assembly 2025, Vienna, Austria, 27 Apr–2 May 2025, EGU25-15242, https://doi.org/10.5194/egusphere-egu25-15242, 2025.

EGU25-15290 | ECS | Orals | GI4.3

AIRflows - a novel airborne Doppler lidar for high resolution wind measurements 

Philipp Gasch, Andreas Wieser, Thomas Feuerle, Franziska Winter, and Christoph Bollig

Wind is a core state variable of the atmosphere. Extending the capabilities of ground-based measurement systems, airborne Doppler lidar (ADL) onboard research aircraft allows for targeted and spatially resolved wind measurements, which are crucial for localized severe weather events or in inaccessible regions such as over water and complex terrain.

A novel ADL system – AIRflows (‘AIRborne fixed-beam lidar fowind measurements‘)  – has been developed by the Karlsruhe Institute of Technology (KIT) in collaboration with scientific and industrial partners during the last two years.
Up to now, ADL systems use a single Doppler lidar attached to a scanner to provide radial velocity measurements under multiple viewing angles. Multiple viewing angles are needed to reconstruct the 3D wind from the unidirectional radial velocity measurements. Due to cost and size reductions of Doppler lidar units over the recent years, it has now become possible to construct an ADL system that uses multiple lidars with fixed-direction beams, instead of a single lidar with a scanning beam. The simultaneous availability of multiple viewing angles brings advantages: Simulation results have demonstrated that a multi-lidar system can achieve approximately one order of magnitude improved spatial wind measurement resolution as well as higher accuracy, compared to existing scanning systems.

This contribution presents the novel AIRflows system developed by KIT. AIRflows implements the novel fixed-beam, multi-lidar concept onboard the TU Braunschweig Cessna F406 research aircraft. The system uses five modified Doppler lidar modules manufactured by Abacus Laser, one pointing nadir and the other four pointing forward, aft, left and right at an elevation of 30° from nadir.
The first flights deploying AIRflows have been successfully completed during summer 2024. Initial analysis demonstrates wind profiles at 100 m spatial resolution, allowing to resolve fine-scale 3D winds inside the PBL for the first time. As part of the tests, flights to the Alps were conducted in preparation for the upcoming international TEAMx campaign. AIRflows measurements across Alpine valleys and crests provide previously unattainable insight into vertical wind and valley circulations in complex terrain. Similarly, AIRflows measurements across a wind farm in the North Sea provide novel vertically resolved insight into wind farm wake behavior.

Overall, AIRflows revolutionizes the field of airborne wind measurements by providing an order of magnitude improved spatial resolution as well as higher measurement accuracy, compared to previously existing ADL.

How to cite: Gasch, P., Wieser, A., Feuerle, T., Winter, F., and Bollig, C.: AIRflows - a novel airborne Doppler lidar for high resolution wind measurements, EGU General Assembly 2025, Vienna, Austria, 27 Apr–2 May 2025, EGU25-15290, https://doi.org/10.5194/egusphere-egu25-15290, 2025.

EGU25-15418 | ECS | Posters on site | GI4.3

Estimation of the Optical properties of Arctic Cirrus Clouds: Insights fromLIDAR measurements and Monte Carlo simulations 

Gopika Gupta, Peter Voleger, Thomas Kuhn, and Janos Stenszky

Cirrus clouds play a critical role in Earth's energy balance by influencing radiative
processes, reflecting incoming solar radiation, and trapping outgoing infrared radiation. In the
Arctic, extreme conditions limit the observational networks and hinder direct measurements.
However, among various remote sensing tools, LIght Detection And Ranging (LIDAR)
emerges as one of a reliable tool for long-term monitoring of cirrus cloud optical properties
over the Arctic region. The extinction coefficient, derived from LIDAR measurements and
essential for evaluating the radiative effects of cirrus clouds, is strongly impacted by the
Multiple Scattering Factor (MSF). In this regard, the present study aims to estimate the MSF
by simulating LIDAR signals using the Monte Carlo method. The input parameters for the
Monte Carlo simulations include the geometry of the atmosphere and optical properties
(including extinction and Mueller matrix). Furthermore, the Mueller matrix is estimated based
on the size distribution and particle shape information acquired through the in-situ measurement
from the Balloon-borne Ice Cloud Particle Imager (B-ICI) instrument. The MSF contribution,
at least in part, depends on the characteristics of the LIDAR, particularly its Field of View. As
a result, new simulations are required, and previous results from older studies cannot be directly
applied.
The photon backscatter information obtained from the Analog and Photon
counting channels of the ground-based LIDAR instrument installed at IRF, Kiruna (68ºN,
20ºE), is utilised to estimate the cirrus cloud's optical properties. To address the instrument’s
non-linear behaviour at higher signal intensities, a glueing procedure is performed to merge the
Analog and the Photon counting signal. The resulting glued signal undergoes multiple
corrections, including background noise subtraction, signal-to-noise ratio enhancement, and
range corrections. The Dynamic Wavelet Covariance Transform (DWCT) technique is
deployed to the corrected LIDAR signal to estimate the cloud top and base altitude information.
Subsequently, an inversion technique incorporating MSF, such as the Sassen method, is chosen
for the current analysis.
The estimated cirrus cloud optical properties using the ground-based LIDAR will
subsequently be validated against EarthCARE’s ATmospheric LIDar (ATLID) satellite
observations. This study enhances the accuracy of cirrus cloud parameterisation, contributing
to improved climate models and a deeper understanding of Arctic cloud-radiative interactions.

How to cite: Gupta, G., Voleger, P., Kuhn, T., and Stenszky, J.: Estimation of the Optical properties of Arctic Cirrus Clouds: Insights fromLIDAR measurements and Monte Carlo simulations, EGU General Assembly 2025, Vienna, Austria, 27 Apr–2 May 2025, EGU25-15418, https://doi.org/10.5194/egusphere-egu25-15418, 2025.

In August 2022, China successfully launched the Terrestrial Ecosystem Carbon Inventory Satellite (TECIS). The primary payload of this satellite is an onboard multi-beam lidar system, which is capable of observing aerosol optical parameters on a global scale. This pioneering study used the Fernald forward integration method to retrieve aerosol optical parameters based on the Level 2 data of the TECIS, including the aerosol depolarization ratio, aerosol backscatter coefficient, aerosol extinction coefficient, and aerosol optical depth (AOD). The validation of the TECIS-retrieved aerosol
optical parameters was conducted using CALIPSO Level 1 and Level 2 data, with relative errors within 30%. A comparison of the AOD retrieved from the TECIS with the AERONET and MODIS AOD products yielded correlation coefficients greater than 0.7 and 0.6, respectively. The relative error
of aerosol optical parameter profiles compared with ground-based measurements for CALIPSO was within 40%. Additionally, the correlation coefficients R2 with MODIS and AERONET AOD were approximately between 0.5 and 0.7, indicating the high accuracy of TECIS retrievals. Utilizing the TECIS retrieval results, combined with ground air quality monitoring data and HYSPLIT outcomes, a typical dust transport event was analyzed from 2 to 7 April 2023. The results indicate that dust was transported from the Taklamakan Desert in Xinjiang, China, to Henan and Anhui provinces, with a gradual decrease in the aerosol depolarization ratio and backscatter coefficient during the transport process, causing varying degrees of pollution in the downstream regions. This research verifies the accuracy of the retrieval algorithm through multi-source data comparison and demonstrates the potential application of the TECIS in the field of aerosol science for the first time. It enables the fine-scale regional monitoring of atmospheric aerosols and provides reliable data support for the three-dimensional distribution of global aerosols and related scientific applications.

How to cite: Chen, B.: The First Validation of Aerosol Optical Parameters Retrieved from the Terrestrial Ecosystem Carbon Inventory Satellite (TECIS) and Its Application, EGU General Assembly 2025, Vienna, Austria, 27 Apr–2 May 2025, EGU25-15492, https://doi.org/10.5194/egusphere-egu25-15492, 2025.

EGU25-16068 | ECS | Orals | GI4.3

Comprehensive Study of Cloud Characteristics over a High Altitude Station - Leh, India using Ground-Based Lidar and Satellite Observations 

Ruchita Shah, Som Sharma, Dharmendra Kamat, Shantikumar Ningombam, Dorje Angchuk, and Rohit Srivastava

A rise of approximately 1°C in global average temperature is influencing sea surface temperature, sea-level, intensity of storms, frequency and severity of hydro-meteorological extreme events. Such effects are comparatively more pronounced in tropical and sub-tropical zones, wherein Leh-Ladakh region of Indian subcontinent, is peculiar and characterized by extreme weather conditions. The present work unravels the cloud characteristics over the Leh region using ground-based ceilometer lidar (3255 m above mean sea level), remote-sensing, and reanalysis data sets for one-year (September 2022–August 2023). Variations in cloud base height (CBH) was observed with lidar, enabling the measurement of CBH up to three distinct layers, designated as CBH1, CBH2, and CBH3, respectively. This study reveals distinct seasonal and altitudinal variations in CBH, with cloud occurrence frequencies peaking during the pre-monsoon (67.94%) and monsoon (98%) seasons, reflecting the onset and active phases of the Indian summer monsoon. Month of July was recorded with the highest prevalence of multi-layered clouds (84.03%), which includes triple-layered clouds (CBH3, 42.13%) dominating over double-layered (CBH2, 25.98%) and single-layered (CBH1, 15.92%) clouds. Seasonal analysis showed a dominance of mid-level clouds (~3–6 km, 77.53%), while high-level clouds (~6–18 km, 4.43%) were less frequent. Altostratus and altocumulus clouds were particularly prominent across all seasons, with their variability linked to topographic and climatic factors. The ceilometer's high-resolution measurements captured the temporal dynamics of CBH, which aligned with satellite and reanalysis data, demonstrating the value of ground-based instruments in complementing remote sensing technologies. These findings provide valuable insights into cloud dynamics and their role in extreme weather events such as cloudbursts and intense rainfall, which are increasingly frequent in the Himalayan region. By improving our understanding of cloud–precipitation interactions, this study offers critical information for enhancing weather forecasting, informing rainfall prediction models, and supporting climate adaptation strategies in climatically vulnerable high-altitude regions.   

How to cite: Shah, R., Sharma, S., Kamat, D., Ningombam, S., Angchuk, D., and Srivastava, R.: Comprehensive Study of Cloud Characteristics over a High Altitude Station - Leh, India using Ground-Based Lidar and Satellite Observations, EGU General Assembly 2025, Vienna, Austria, 27 Apr–2 May 2025, EGU25-16068, https://doi.org/10.5194/egusphere-egu25-16068, 2025.

EGU25-16402 | Posters on site | GI4.3

1.65 µm CH4 ground-based differential absorption lidar measurements in the atmosphere 

Dimitri Edouart, Fabien Gibert, and Claire Cénac

Methane (CH4) is the second anthropogenic greenhouse gas (GHG) in the atmosphere that contributes to the global warming after CO2. If the methane emissions have a unique sink by OH oxidation, the various different sources, both anthropogenic (around 2/3) and natural, make complex the understanding of its atmospheric concentration. On the anthropogenic side (mainly gas exploitation and burning) it is fundamental to have a tool to verify inventories at different scales (from local methanizer to megacity) and prevent production network leakage in the atmosphere. As for surface-atmosphere exchanges of CO2, it is fundamental to study at different scales the spatial pattern and magnitude of the natural CH4 sources (biogenic anaerobic degradation of organic matter in wetlands, landfill and waste, livestock, rice cultivation, thermite, geological sources) and to understand their evolution with the global warming.

Lidar has an important role to play in such topic as it can make: (i) a 3D mapping of CH4 concentration in anthropogenic plumes, (ii) vertical profiles to study transport processes in the atmosphere, (iii) even measure direct flux and (iv) provide CH4 Earth global measurements from a space platform as it will be for MERLIN CH4 integrated path differential absorption lidar CNES/DLR ongoing mission.

A new ground-based Differential Absorption Lidar (DIAL) for atmospheric methane (CH4) profiling has been developed at LMD. The lidar emitter relies on a new hybrid fibered/bulk Er:YAG laser that delivers dual On/Off 8 mJ/ 300 ns pulses at a repetition frequency of 1 kHz in the methane line triplet at 1645.55 nm and out of at 1645.3 nm. It is associated with a direct detection receiver with a 50cm diameter telescope, a 2-nm linewidth interference optical filter, a near infrared photomultiplier (PMT) and a data acquisition and real time signal processing system working both in analogic and photon counting mode depending the application. First horizontal and vertical measurements in the atmosphere have been achieved and compared with in situ sensor and will be presented at the conference.

How to cite: Edouart, D., Gibert, F., and Cénac, C.: 1.65 µm CH4 ground-based differential absorption lidar measurements in the atmosphere, EGU General Assembly 2025, Vienna, Austria, 27 Apr–2 May 2025, EGU25-16402, https://doi.org/10.5194/egusphere-egu25-16402, 2025.

EGU25-16832 | ECS | Orals | GI4.3

Integration of Doppler Wind Lidars in E-Profile wind profiling network 

Eric Sauvageat, Rolf Rüfenacht, Maxime Hervo, Myles Turp, Markus Kayser, Ronny Leinweber, Volker Lehmann, Steven Knoop, Alexander Gohm, and Alexander Haefele

E-Profile is the EUMETNET Programme coordinating the measurements of vertical profiles of wind, aerosols and clouds from radars and lidars in Europe. The E-Profile wind network provides near real-time vertical profiles of wind from weather radars and dedicated wind profilers with the main goal to promote the usability of these data for operational meteorology and provide expertise to both the data provider and the end-user.

Ground-based scanning Doppler Wind Lidars (DWLs) are capable of measuring wind profiles in the atmospheric boundary layer (ABL) at a high spatial and temporal resolution and they have the potential to improve the short-term wind forecast. With the availability of commercial DWLs in the last decade, many meteorological services and scientific institutions are now operating such instruments or are planning to do so in the future in Europe.

To extend the benefit of these observations and promote data sharing, these instruments have recently been integrated in E-Profile wind profiling network. Using an open-source code developed at the Deutscher Wetterdienst (DWD), instrument’s data from different manufacturers are processed in a harmonized way to provide 10 minutes averaged wind profiles in the ABL. Data are converted to BUFR and distributed in near real-time on the Global Telecommunication System (GTS), making them available globally for data assimilation. At the moment, 12 DWLs from 4 European countries are being processed operationally and more instruments are expected to join the network in 2025.

Here, we present the integration of DWL into the E-Profile wind network, its associated challenges and the requirements for the scan strategies. We also show comparisons at different sites against other wind profiling instruments (e.g. radar wind profilers) and against model data. Finally, we also discuss the future improvements to the network.

How to cite: Sauvageat, E., Rüfenacht, R., Hervo, M., Turp, M., Kayser, M., Leinweber, R., Lehmann, V., Knoop, S., Gohm, A., and Haefele, A.: Integration of Doppler Wind Lidars in E-Profile wind profiling network, EGU General Assembly 2025, Vienna, Austria, 27 Apr–2 May 2025, EGU25-16832, https://doi.org/10.5194/egusphere-egu25-16832, 2025.

EGU25-16880 | ECS | Posters on site | GI4.3

The desert dust impact on the Boundary Layer in the Atlantic 

Ioanna Tsikoudi, Eleni Marinou, Maria Tombrou, Eleni Giannakaki, Emmanouil Proestakis, Konstantinos Rizos, and Vassilis Amiridis

The study investigates the dynamics of the Boundary Layer (BL) over the Atlantic Ocean, with a focus on the region surrounding Cabo Verde, using a combination of ground-based PollyXT lidar, satellite lidar data from Cloud-Aerosol Lidar and Infrared Pathfinder Satellite Observations (CALIPSO), radiosondes, and European Centre for Medium-Range Weather Forecasts (ECMWF) model output. The comparison of CALIPSO lidar profiles with ECMWF reanalysis revealed strong correlations for BL top over open ocean regions but less agreement in dust-affected areas closer to the African continent. In these regions, satellite lidar indicated higher BL tops than those estimated by ECMWF, likely due to the existence of high of aerosol concentrations, which play a crucial role in shaping dynamics. Observations in Cabo Verde highlight distinctive Marine Atmospheric Boundary Layer (MABL) characteristics, such as limited diurnal evolution, but also show the potential for BL heights to reach up to 1 km, driven by factors like strong winds that increase mechanical turbulence. Additionally, this study illustrates the challenges in accurately determining the BL height using lidar and radiosondes, examining cases with strong inversions that prevent vertical mixing, but also weaker inversions that allow for the penetration of dust particles within BL. Integrating multiple observational sources and techniques is essential for validating remote sensing data and enhancing BL characterizations. The findings underscore the complex interactions between marine and dust-laden air masses over the Atlantic, which are essential for understanding the dynamic processes in aerosol-cloud interactions.

How to cite: Tsikoudi, I., Marinou, E., Tombrou, M., Giannakaki, E., Proestakis, E., Rizos, K., and Amiridis, V.: The desert dust impact on the Boundary Layer in the Atlantic, EGU General Assembly 2025, Vienna, Austria, 27 Apr–2 May 2025, EGU25-16880, https://doi.org/10.5194/egusphere-egu25-16880, 2025.

EGU25-17781 | ECS | Orals | GI4.3

Using the ESA eVe reference lidar system for the cal/val of lidar instruments onboard ESA satellite missions 

Peristera Paschou, Eleni Marinou, Kallopi Artemis Voudouri, Nikolaos Siomos, Antonis Gkikas, Jonas von Bismarck, Thorsten Fehr, and Vassilis Amiridis

The eVe lidar is ESA’s ground reference lidar system for the calibration and validation (cal/val) of ESA satellite missions. eVe is a combined linear/circular polarization lidar with Raman capabilities operating at 355 nm and deriving the profiles of the optical properties of aerosols and thin clouds, namely the particle backscatter and extinction coefficients, the lidar ratio, and the linear and circular depolarization ratios. The system is implemented in a dual-laser/dual-telescope configuration and it can be rotated to perform lidar measurements using different pointing geometries. As such, eVe can simultaneously reproduce the operation of any lidar system that uses linearly (e.g traditional polarization lidars; ATLID onboard EarthCARE mission) or circularly (e.g. ALADIN lidar onboard Aeolus mission) polarized emission.

The eVe lidar has been deployed in ASKOS, the ground-based component of the Joint Aeolus Tropical Atlantic Campaign in Cabo Verde (2021 and 2022), for performing targeted circular polarization lidar measurements for the validation of the Aeolus aerosol products (i.e. the Aeolus L2A products). The eVe-Aeolus comparisons reveal that the Aeolus co-polar backscatter coefficient is the most accurate L2A product followed by the noisier particle extinction coefficient with the larger discrepancies for the Aeolus profiles to be observed in lower altitudes where the aerosol load is larger. The Aeolus co-polar lidar ratio is the noisiest L2A product with the largest discrepancies from the corresponding eVe profiles. Currently the eVe lidar is under upgrade with main components of enabling the profiling of water vapor mixing ratio and extending the retrieval of the extinction coefficient towards daytime conditions, aiming to further enhance its measuring capabilities as well as to meet the requirements for the cal/val of the ATLID lidar products onboard EarthCARE mission which is currently in orbit. After the upgrade, eVe lidar will perform targeted measurements during the nearest EarthCARE overpasses from eVe’s location for the evaluation of the ATLID L2A products.

Acknowledgements:

This research is financially supported by the PANGEA4CalVal project (Grant Agreement 101079201) funded by the European Union and the “Best practice protocol for validation of Aerosol, Cloud, and Precipitation Profiles” ESA project (ACPV; Contract no. 4000140645/23/I-NS). The ASKOS campaign was funded by an ESA project (Contract no. 4000131861/20/NL/IA) and the acquired dataset can be accessed via https://evdc.esa.int/publications/askos-campaign-dataset/. The eVe lidar upgrade and the deployment for the cal/val of EarthCARE products are funded by an ESA project (Contract no. 4000146416/24/NL/FFi).

How to cite: Paschou, P., Marinou, E., Voudouri, K. A., Siomos, N., Gkikas, A., von Bismarck, J., Fehr, T., and Amiridis, V.: Using the ESA eVe reference lidar system for the cal/val of lidar instruments onboard ESA satellite missions, EGU General Assembly 2025, Vienna, Austria, 27 Apr–2 May 2025, EGU25-17781, https://doi.org/10.5194/egusphere-egu25-17781, 2025.

EGU25-18284 | ECS | Orals | GI4.3

Assessment of horizontally-oriented ice crystals with a combination of multiangle polarization lidar and cloud Doppler radar 

Zhaolong Wu, Patric Seifert, Yun He, Holger Baars, Haoran Li, Cristofer Jimenez, Chengcai Li, and Albert Ansmann

The orientation of ice crystals plays a significant role in determining their radiative and precipitating effects, horizontally oriented ice crystals (HOICs) reflect up to ~40 % more short-wave radiation back to space than randomly oriented ice crystals (ROICs). This study for the first time introduces an automatic pixel-by-pixel algorithm for HOIC identification using a combination of ground-based zenith- and 15-degree off-zenith-pointing polarization lidars. The lidar observations provided high-resolution cloud phase information. The data were collected in Beijing over 354 days in 2022. A case study from 13 October 2022 is presented to demonstrate the effectiveness and feasibility of the detection method. The synergy of lidars and collocated Ka-band cloud radar, radiosonde, and ERA5 data provide phenomenological insights into HOIC events. While cloud radar Doppler velocity data allowed the estimation of ice crystal size, Reynolds numbers, and turbulent eddy dissipation rates, corresponding environmental and radar-detected variables are also provided. HOICs were present accompanying with weak horizontal wind of 0–20 ms−1 and relatively high temperature between −8 °C to −22 °C. Compared to the ROICs, HOICs exhibited larger reflectivity, spectral width, turbulent eddy dissipation rate, and a median Doppler velocity of about 0.8 ms−1. Ice crystal diameter (1029 µm to 1756 µm for 5th and 95th percentiles) and Reynolds numbers (28 to 88 for 5th and 95th percentiles) are also estimated with the help of cloud radar Doppler velocity using an aerodynamic model. One interesting finding is that the previously found switch-off region of the specular reflection in the region of cloud base shows a higher turbulence eddy dissipation rate, probably caused by the latent heat released due to the sublimation of ice crystals in cloud-base region. The newly derived properties of HOICs have the potential to aid to derive the likelihood of their occurrence in output from general circulation models (GCMs) of the atmosphere.

How to cite: Wu, Z., Seifert, P., He, Y., Baars, H., Li, H., Jimenez, C., Li, C., and Ansmann, A.: Assessment of horizontally-oriented ice crystals with a combination of multiangle polarization lidar and cloud Doppler radar, EGU General Assembly 2025, Vienna, Austria, 27 Apr–2 May 2025, EGU25-18284, https://doi.org/10.5194/egusphere-egu25-18284, 2025.

EGU25-18566 | Posters on site | GI4.3

Enhancing lidar aerosol typing schemes: a lidar/photometer synergy 

Nikolaos Papagiannopoulos, Michail Mytilinaios, Aldo Amodeo, Giuseppe D'Amico, Pilar Gumà-Claramunt, Christina Anna Papanikolaou, and Lucia Mona

In this study we present a synergistic approach between lidar and photometer to separate volcanic ash and desert dust and, ultimately, to enhance lidar-based aerosol typing schemes. Typically, the lidar depolarization ratio measurements can be used to distinguish dust and ash with ash depolarization ratio reaching higher values. However, the variability of aerosol depolarization ratio makes it difficult to use it in automatic typing techniques. The imaginary part of refractive index when using in situ data shows stronger absorption than mineral dust; therefore, here, we make use of microphysical AERONET data to define the two aerosol classes (i.e., ash/dust). Then, trivariate Mahalanobis distance is estimated based on the real and imaginary parts of the refractive index and the single scattering albedo for any given AERONET measurement and the type is assigned. This information is then passed on in lidar aerosol typing algorithms and the aerosol type is allocated in the vertical dimension. The methodology is applied to the Potenza ACTRIS site in Italy during an intense desert dust event where an AERONET photometer and an ACTRIS lidar are collocated.

How to cite: Papagiannopoulos, N., Mytilinaios, M., Amodeo, A., D'Amico, G., Gumà-Claramunt, P., Papanikolaou, C. A., and Mona, L.: Enhancing lidar aerosol typing schemes: a lidar/photometer synergy, EGU General Assembly 2025, Vienna, Austria, 27 Apr–2 May 2025, EGU25-18566, https://doi.org/10.5194/egusphere-egu25-18566, 2025.

EGU25-19403 | Orals | GI4.3 | Highlight

Forecasting Climate Adaptation Through Cirrus Cloud Radiative Forcing Analysis Using 20 Years of MPLNET Lidar Measurements 

Simone Lolli, Andreu Salcedo-Bosch, Jasper R. Lewis, Erica K. Dolinar, James R. Campbell, and Ellsworth J. Welton

Cirrus clouds play a critical role in Earth's radiation budget and are key to understanding and forecasting climate adaptation in response to global warming. Leveraging 20 years of high-resolution lidar data from NASA's MPLNET network, we analyze and forecast cirrus cloud radiative forcing with the aim of projecting how the climate system will adapt to changing atmospheric conditions. Using ensemble learning methods, we simulate the monthly radiative impacts of cirrus clouds, emphasizing their variability and feedback mechanisms. The study also integrates future climate scenarios under shared socio-economic pathways ( CMIP6SSP2-4.5 and SSP5-8.5) to explore potential shifts in regional climate patterns driven by cirrus cloud interactions. Results highlight how increased temperatures and altered precipitation regimes may influence the climate's adaptive processes, particularly in regions currently sensitive to radiative forcing fluctuations. This research underscores the importance of long-term lidar data for advancing climate adaptation modeling and identifying critical atmospheric feedbacks.

[1] Lolli, S., 2023. Machine Learning Techniques for Vertical Lidar-Based Detection, Characterization, and Classification of Aerosols and Clouds: A Comprehensive Survey. Remote Sensing15(17), p.4318.

How to cite: Lolli, S., Salcedo-Bosch, A., Lewis, J. R., Dolinar, E. K., Campbell, J. R., and Welton, E. J.: Forecasting Climate Adaptation Through Cirrus Cloud Radiative Forcing Analysis Using 20 Years of MPLNET Lidar Measurements, EGU General Assembly 2025, Vienna, Austria, 27 Apr–2 May 2025, EGU25-19403, https://doi.org/10.5194/egusphere-egu25-19403, 2025.

EGU25-19850 | Orals | GI4.3

Estimating Planetary Boundary Layer Height Using CALIPSO Lidar Data: A Machine Learning Approach 

Francesc Rocadenbosch, Andreu Salcedo-Bosch, and Simone Lolli

The planetary boundary layer height (PBLH) is a critical atmospheric parameter influencing air quality, pollutant dispersion, and weather forecasting. Traditional methods for PBLH retrieval rely on radiosondes and ground-based sensors, but their spatial and temporal coverage is limited. In this study, we present a novel application of Random Forest (RF) machine learning to estimate PBLH using lidar measurements from the CALIPSO satellite's Level 1 data spanning a decade. Our RF model is trained with an extensive dataset of radiosonde-derived PBLH values coinciding with CALIPSO overpasses. This approach leverages CALIOP's lidar backscatter profiles to achieve robust performance (R² = 0.6, RMSE = 333.59 m) across a range of atmospheric conditions, including cloudy and dust-laden scenarios, without requiring atmospheric typing or ancillary data. The results surpass state-of-the-art methods in global applicability and accuracy, offering improved spatial and temporal resolution of PBLH estimates. We also discuss the model's performance variations between day- and nighttime scenarios and highlight challenges, such as data bias and surface reflection contamination, which inform future model refinements. This study underscores the potential of integrating machine learning and lidar remote sensing for advancing atmospheric science [1-2].


REFERENCES

[1] S. Lolli, W. Y. Khor, M. M. Z. Matjafri, and H. S. Lim, "Monsoon season quantitative assessment of biomass burning clear-sky aerosol radiative effect at surface by ground-based lidar observations in Pulau Pinang, Malaysia in 2014," Remote Sensing, vol. 11, no. 22, 2019.

[2] C. Sivaraman, S. McFarlane, E. Chapman, M. Jensen, Toto, S. Liu, and M. Fischer, Planetary Boundary Layer Height (PBL) Value Added Product (VAP): Radiosonde Retrievals, Tech. Rep., DOE Office of Science Atmospheric Radiation Measurement (ARM) Program, United States, Aug. 2013.

ACKNOWLEDGEMENTS
This research is part of the project PID2021-126436OB-C21 funded by Ministerio de Ciencia e Investigación (MCIN)/Agencia Estatal de Investigación (AEI)/ 10.13039/501100011033 y FEDER “Una manera de hacer Europa” and part of the PRIN 2022 PNRR, Project P20224AT3W funded by Ministero dell’Universit`a e della Ricerca. The European Commission collaborated under projects H2020 ATMO-ACCESS (GA-101008004) and H2020 ACTRIS-IMP (GA-871115).

How to cite: Rocadenbosch, F., Salcedo-Bosch, A., and Lolli, S.: Estimating Planetary Boundary Layer Height Using CALIPSO Lidar Data: A Machine Learning Approach, EGU General Assembly 2025, Vienna, Austria, 27 Apr–2 May 2025, EGU25-19850, https://doi.org/10.5194/egusphere-egu25-19850, 2025.

EGU25-20478 | ECS | Orals | GI4.3

Proof-of-Concept of a Short-Range High Spectral Resolution Lidar using a Compact High Repetition Rate Fiber Laser 

Manuela Hoyos Restrepo, Romain Ceolato, and Yoshitaka Jin

In recent years, several climate and air quality applications have required to understand the impact of aerosols close to their source, leading to the development of novel Short-Range Elastic Backscatter Lidars (SR-EBLs), which enable measuring the radiative properties of aerosols at high spatiotemporal resolutions (<10cm, 1s) in the short-range (3 to 500m). However, the elastic lidar equation is an ill-posed problem, having one equation for two atmospheric variables: the backscatter β(r) and extinction α(r) coefficients. Solving this equation requires assuming a value for the lidar ratio, i.e., a linear relationship between β and α, reducing the accuracy of the retrievals. Advanced lidar techniques, like the High Spectral Resolution Lidar (HSRL), measure molecular and particle scattering separately. Having a direct measurement of the molecular component allows for solving the lidar problem without assumptions about the lidar ratio. However, the existing atmospheric HSRLs cannot perform short-range measurements because i) they are usually blind in the first hundredths of meters (overlap restrictions), and ii) they prioritize spectral performance using ultranarrow band (and thus long-pulse) lasers, resulting in an insufficient spatiotemporal resolution.

This work presents a proof-of-concept of a Short-Range High Spectral Resolution Lidar (SR-HSRL) optimized for aerosol characterization in the first kilometer of the atmosphere. This SR-HSRL uses a compact high-repetition rate fiber laser source with a 300 MHz linewidth and 5 ns pulse length. Since these two parameters are inversely proportional, and both are required for performing SR-HSRL measurements, a compromise had to be found to optimize the overall performance. The main challenge was to prove that, despite its relatively large linewidth, this laser has a satisfactory spectral performance so that it can be used for future implementations of the short-range HSRL. We chose this model after evaluating several laser sources because it has the right compromise between pulse length, linewidth, spectral stability, and size. The laser housing is 270 x 270 x 40 mm and weighs 2.9 kg, making it ideal for future integration on a portable short-range HSRL system.

In the receiver part, a 10:90 beam splitter transmits 10% of the backscattered light to the total channel and reflects 90% of it to the HSR channel. A 40-cm-long iodine cell is used as the spectral filter for separating the Mie and Rayleigh aerosol components. We used two thermoelectrically cooled SiPM Multi-Pixel Photon Counter (MPPC) sensors and a 160MHz analog-to-digital converter to measure the signals. The spatiotemporal resolution, limited by the acquisition system, is 7.5 m and 1 s.

To test the lidar, a two-day measurement campaign was performed at NIES in Tsukuba, Japan, in July 2024. We demonstrate that, despite having a relatively large laser linewidth, we can successfully remove the Mie aerosol component, retrieving aerosol backscatter coefficient profiles from as low as 80 m. We also compare the HSRL retrieval method to a non-conventional forward Fernald inversion method previously reported for SR-EBL. We found that the forward method normally sub-estimates β (up to 30% discrepancy) in aerosol layers and overestimates it in cloud zones (60 to >100% difference).

How to cite: Hoyos Restrepo, M., Ceolato, R., and Jin, Y.: Proof-of-Concept of a Short-Range High Spectral Resolution Lidar using a Compact High Repetition Rate Fiber Laser, EGU General Assembly 2025, Vienna, Austria, 27 Apr–2 May 2025, EGU25-20478, https://doi.org/10.5194/egusphere-egu25-20478, 2025.

EGU25-21151 | Orals | GI4.3

Simulation and assessment of spaceborne hybrid Doppler wind lidar 

Songhua Wu, Guangyao Dai, Wenrui Long, Kangwen Sun, Xiaochun Zhai, Na Xu, and Xiuqing Hu

Accurately measuring wind field is crucial for studying the dynamical structure and evolutionary characteristics of the atmosphere, as well as heat-momentum-matter exchange and balance. According to the World Meteorological Organization (WMO), global observation of the 3D wind field is the primary factor for improving the accuracy of numerical weather prediction. Due to the absence of aeronautical data, meteorological observation and forecasting capabilities are notably deficient in sparsely populated areas, the southern hemisphere, the polar regions, and the vast oceans. Spaceborne Doppler wind lidar has become an important instrument for observing the vertical profile of the global wind field, with the successful operation of Aeolus. The third generation of FengYun polar-orbiting meteorological satellites are initially designed to develop a dual-system Doppler wind measurement lidar technology programme that integrates direct and coherent detection lidar, making full use of the observational advantages of the two methods to detect the global wind field with high resolution. Incoherent detection is used in the middle and upper troposphere and lower stratosphere, where molecules scatter strongly. Coherent detection is used for the observation of the middle and lower troposphere and boundary layer. This research analyses the key parameters of the spaceborne hybrid wind lidar for future satellite missions. The incoherent detection module operates at 355 nm and uses the dual-edge detection technique based on Fabry?Pérot etalon. And the coherent detection module uses heterodyne detection technique operating at 1064 nm. This paper presents a simulation model for wind measurement lidar that realizes gridded atmospheric parameters, scanning observation, and forward-inversion simulation. And a method for detecting horizontal wind field based on dual-beam observation was developed to ensure the response of the lidar for wind speed detection in both meridional wind component and zonal wind component.

How to cite: Wu, S., Dai, G., Long, W., Sun, K., Zhai, X., Xu, N., and Hu, X.: Simulation and assessment of spaceborne hybrid Doppler wind lidar, EGU General Assembly 2025, Vienna, Austria, 27 Apr–2 May 2025, EGU25-21151, https://doi.org/10.5194/egusphere-egu25-21151, 2025.

EGU25-21533 | Posters on site | GI4.3

Cloud Condensation Nuclei (CCN) and Ice Nucleating Particles (INP) conversion factors based on Thessaloniki AERONET station 

Eleni Giannakaki, Karageorgopoulou Archontoula, Georgoulias Aristeidis, and Koutounidis Ioannis

Several studies [1,2] have shown the potential of polarization lidar to provide vertical profiles of aerosol parameters from which cloud condensation nuclei (CCN) and ice-nucleating particles (INP) number concentrations can be retrieved. The results are based on reliable of conversion factors between aerosol optical thickness and column-integrated particle size distribution based on Aerosol Robotic Network (AERONET) photometer observations. A crucial point regarding the efficacy of aerosol particles to act as CCN or INP depends on aerosol type.

AERONET Inversion Data (Level 1.5) for Thessaloniki station were analyzed over the period 2006-2021. Following ‎[1,2], the Ångström exponent was used to separate the particles into pollution (AE > 1.6) and dust (AE < 0.5) dominated cases. To obtain a better classification of aerosols we utilize aerosol typing from CALIPSO. Only cases which are classified as either purely dust or polluted continental aerosols within 100km from Thessaloniki are selected. The Aerosol Optical Depth (AOD) at 440 nm and the Ångström exponent (AE) 440-870 were used to calculate the AOD at 532 nm, while the AOD at 1020 nm and the AE between 870-1020 nm were used to estimate the AOD at 1064 nm. The particle volume size distribution is derived for 22 discrete radius points, spaced logarithmically at equidistant intervals. The particle number concentration (n) for each radius interval is calculated by dividing the volume concentration by the particle volume and multiplying by the spectral integral width of 0.2716. The column value of n60 is the sum of number concentrations for radius classes 2 to 22 (>57 nm), while n100 is the sum for radius classes 4 to 22 (>98 nm). The INP-relevant column n250 is the sum of intervals 8–22 plus the mean of intervals 7 and 8, while n290 the sum of 8-22. To obtain particle extinction coefficient σ (or sigma) and n60, the AOD at 532 nm and the column n60 are divided by 1000 m. For urban particles, n60 (reservoir of CCN) and n250 (reservoir of INP) were used, while n100 (CCN) and n250 (INP) were used for dust particles. Following CALIPSO aerosol typing dust conversion factors was found equal to c100= 24.3±7.0 Mm cm-3, xd=0.78 ± 0.13 and c250= 0.30±0.03 Mm cm-3, while for polluted continental particles, were c60= 31.4 ± 9.0 Mm cm-3, xc= 0.94 ± 0.12 and c290= 0.089±0.002 Mm cm-3.


References:

[1] Mamouri, R.E. and Ansmann, A. Potential of polarization lidar to provide profiles of CCN- and INP-relevant aerosol parameters. Atmos. Chem. Phys. 2016, 16, 5905–5931. doi:10.5194/acp-16-5905-2016

[2] Georgoulias, A.; Marinou, E.; Tsekeri, A.; Proestakis, E.; Akritidis, D.; Alexandri, G.; Zanis, P.; Balis, D.; Marenco, F.; Tesche, M. and Amiridis, V. A First Case Study of CCN Concentrations from Spaceborne Lidar Observations. Remote Sens. 2020, 12, 1557. doi:10.3390/rs12101557


Acknowledgments: The research work was supported by the Hellenic Foundation for Research and Innovation (H.F.R.I.) under the “Basic Research Financing (Horizontal support for all Sciences), National Recovery and Resilience Plan (Greece 2.0)” (Project Number: 015144).

How to cite: Giannakaki, E., Archontoula, K., Aristeidis, G., and Ioannis, K.: Cloud Condensation Nuclei (CCN) and Ice Nucleating Particles (INP) conversion factors based on Thessaloniki AERONET station, EGU General Assembly 2025, Vienna, Austria, 27 Apr–2 May 2025, EGU25-21533, https://doi.org/10.5194/egusphere-egu25-21533, 2025.

EGU25-21736 | Orals | GI4.3

Simultaneous observations of meteoric Ca and Ca+ by employing the Ti:sapphire-laser-based resonance-scattering Ca/Ca+ lidar 

Masayuki Katsuragawa, Mitsumu K. Ejiri, Ayaka Hashimoto, Sota Kobayashi, Sayako Miyoshi, Hikaru Miyagi, Chiaki Ohae, and Takuji Nakamura3

The upper atmosphere located at an altitude of 80 - 120 km above the ground is a crucial region for comprehensively understanding the behavior of Earth's entire atmosphere, because it is the region where the atmosphere transitions from neutral to ionospheric. In this transitional region, meteoroids are continually supplying metallic atoms and ions. The resonant-scattering lidar, which emits laser beams from the ground and then detect on the ground again how much atoms and ions cause resonant scattering of the laser radiations, is one of the significant measurement methods of observing such transitional region. While Fe and Na are selected as the major targets, we have focused on Ca and have developed a specific lidar system to detect it. This is because Ca has uniquely preferable resonance transitions for neutral atoms and ions (Ca: 422.7918 nm and Ca+: 393.4770 nm) for performing lidar measurements from the ground. The core of the developed resonant-scattering Ca/Ca+ lidar system is the injection-locked Ti:sapphire solid-state laser, which has the remarkable ability to simultaneously emit the two laser beams from a single resonator at a variety of combinations of two wavelengths, including the above resonant transitions of neutral Ca and Ca+.
    Here, we report on the first results of the long-term observations, where the developed resonant-scattering Ca/Ca+ lidar system was operated for an entire night. The averaged laser power, time resolution, and altitude resolution of the Ca/Ca+ lidar system are set to 0.2 W, 30 s, and 15 m, respectively, for Ca, and 0.4 W, 30 s, and 30 m , respectively, for Ca+ in this operation. Both neutral Ca and Ca ions distributed in the identical spatio-temporal regions could be measured in detail over an entire night. It was clearly observed that the neutral Ca and Ca ions had almost the same spatio-temporal structures with complex time and space dependences in the main layer at an altitude of 80 - 100 km, and Ca ions also had an additional high-density thin layer with a few kilometers deep at the highest altitude in the main layer. This high-density layer of Ca ions, which was not seen with the neutral Ca, suggests that it is to be related to the sporadic E layer. In our presentation, we will also report on the progress of this ongoing project.

How to cite: Katsuragawa, M., Ejiri, M. K., Hashimoto, A., Kobayashi, S., Miyoshi, S., Miyagi, H., Ohae, C., and Nakamura3, T.: Simultaneous observations of meteoric Ca and Ca+ by employing the Ti:sapphire-laser-based resonance-scattering Ca/Ca+ lidar, EGU General Assembly 2025, Vienna, Austria, 27 Apr–2 May 2025, EGU25-21736, https://doi.org/10.5194/egusphere-egu25-21736, 2025.

The Global Navigation Satellite System radio occultation (GNSS-RO) technique has been demonstrated to significantly enhance our understanding of the free atmosphere, with particular emphasis on the Upper Troposphere and Lower Stratosphere. We present improved estimations of global three-dimensional wind fields derived from low-pass filtered monthly mean geopotential height data. Geostrophic, gradient, and equatorial balance winds were estimated to provide foundational wind estimates, consistent with methodologies employed in previous studies. To advance beyond the traditional reliance on geostrophic and gradient wind, higher-order terms in the horizontal momentum equations, specifically advection and curvature, were considered. Newly derived wind fields were systematically evaluated against original winds from the European Center for Medium-Range Weather Forecast (ECMWF) Reanalysis 5 (ERA5), using a best-estimate algorithm. Building upon this methodology, the application of the best-estimate algorithm revealed that geostrophic winds incorporating advection were most applicable in the troposphere, while gradient winds with advection showed superior estimates in the stratosphere. Thus, the tropopause acts as a physical boundary delineating the domains of applicability for geostrophic and gradient-based wind approximations. Compared to their fundamental formulations, advection significantly improved both geostrophic and gradient wind estimates relative to the original ERA5 winds. In tropical regions, equatorial balance winds considering curvature provided the most accurate estimates across the entire vertical extent. Our findings emphasize the significant potential of GNSS-RO geopotential height data to move beyond the limitations of traditional geostrophic and gradient wind approximations. The results pave the way for creating a comprehensive global three-dimensional wind field climatology by leveraging the unique advantages of GNSS-RO, such as long-term consistency, high vertical resolution, and global coverage. This dataset will be a valuable resource for the scientific community, supporting climate monitoring and enhancing the understanding of atmospheric dynamics, particularly in the stratosphere, where data assimilation in reanalyses remains limited.

How to cite: Unegg, J.: Beyond Geostrophic and Gradient Wind: Enhancing Radio Occultation Wind Field Estimation, EGU General Assembly 2025, Vienna, Austria, 27 Apr–2 May 2025, EGU25-869, https://doi.org/10.5194/egusphere-egu25-869, 2025.

EGU25-926 | ECS | Orals | G5.1

3-D water vapor field retrieval by GNSS tomography for InSAR observation correctionapplied to deformations of Piton de la Fournaise in Réunion Island 

Hugo Gerville, Joël Van Baelen, Laurent Morel, Fabien Albino, Frédéric Durand, Aline Peltier, and Patrice Boissier

On one hand, current processing of GNSS signals has the ability to provide the amount of
water vapor between the satellite and the ground. This information is of major interest
because these observations have good temporal resolution and are insensitive to weather
conditions. Furthermore, when the station network is dense enough, it is possible to retrieve
the 3-D water vapor field through GNSS tomography.
Although this method has already proven effective, this presentation will first detail new
approaches development to adapt to the Reunion Island context and particularly over the
Piton de la Fournaise. Indeed, this area has a dense distribution of stations while the rest of
the island shows a weaker distribution. Hence, a classic grid mesh is therefore not suited for
this situation and we developed a Voronoï adaptive mesh scheme to better account for the
irregular network geometry. Likewise, the inversion scheme used is being upgraded to a
Single Value Decomposition (SVD) approach shown to be more effective in the literature.
On the other hand, InSAR technique consists of measuring ground deformation by difference
between two radar measurements of satellite/ground distance. However, these two
measurements are not carried out at the same time and, thus, the water vapor field which
impact such observations is different for each measurement, notably in tropical regions
where water vapor variability is very important.
Hence, a second aspect of our work will be to apply the improved 3-D water vapor retrieval
obtained with the new approaches defined above in order to propose a better correction
scheme for InSAR retrieval of slow ground deformation signals at Piton de la Fournaise, a
precursor sign of possible volcanic activity.

How to cite: Gerville, H., Van Baelen, J., Morel, L., Albino, F., Durand, F., Peltier, A., and Boissier, P.: 3-D water vapor field retrieval by GNSS tomography for InSAR observation correctionapplied to deformations of Piton de la Fournaise in Réunion Island, EGU General Assembly 2025, Vienna, Austria, 27 Apr–2 May 2025, EGU25-926, https://doi.org/10.5194/egusphere-egu25-926, 2025.

EGU25-965 | ECS | Posters on site | G5.1

Assessment of GNSS-based PWV against radiosonde observation and reanalysis datasets in Antarctica 

Bilal Mutlu and Serdar Erol

Global warming phenomena lead to melting glaciers, rising sea levels, droughts, and irregular seasonal patterns, especially in polar regions. Besides, water vapor plays a significant role in these processes, contributing to about 60% of the natural greenhouse effect. Increasing temperature raises the atmosphere's capacity for water vapor, creating a positive feedback loop that aggravates global warming and extreme weather events. In polar regions, global warming is causing increased annual rainfall. Despite low overall precipitation, this phenomenon accelerates the melting of snow and ice, impacting local ecosystems. Future projections indicate that precipitation along Antarctica's coastline is expected to increase over the next 80 years. This increase may enhance surface melting through various processes. Consequently, monitoring atmospheric water vapor is crucial for understanding global climate dynamics and weather patterns. However, due to the harsh conditions in the polar regions, there is a shortage of conventional measurements, which makes global atmospheric reanalysis models crucial. The specific humidity and air pressure from the reanalysis models can be used to calculate Precipitable Water Vapor (PWV) (measured in meters), which is one of the most commonly used parameters for measuring atmospheric water vapor. Nevertheless, biases and discrepancies in the models may influence the data, particularly in polar regions where observations are scarce. In addition, the estimation of meteorological parameters can be acquired not only based on meteorological station data but also with the help of geodetic satellite data. Global Navigation Satellite Systems (GNSS) signals are subject to tropospheric refraction as they pass through the Earth's atmosphere, and the resulting zenith delays are divided into two components: hydrostatic (ZHD) and wet delay (ZWD). Moreover, the ZWD can be utilized to compute the PWV by multiplying a conversion factor. PWV can also be obtained by using air temperature and dew point temperature data from radiosonde observations at specific pressure levels. In this study, it is aimed to investigate and compare PWV values produced from GNSS-based, radiosonde-based, and global meteorological reanalysis models. Within the scope of the study, International GNSS Service (IGS) stations, which are located in the Antarctica continent, were used to calculate GNSS-based PWV. Besides, the radiosonde dataset retrieved from the Integrated Global Radiosonde Archive version 2.2 (IGRA 2.2) was used to obtain radiosonde-based PWV. As reanalysis datasets, the most recent reanalysis from the European Centre for Medium-Range Weather Forecasts (ECMWF), and the National Aeronautics and Space Administration (NASA) were used. The fifth-generation reanalysis product from the ECMWF called ERA-5 and the second-generation version of NASA’s Modern-Era Retrospective analysis for Research and Applications called MERRA-2 data were used to obtain reanalysis based PWV. As a result of the study, root mean square errors (RMSE) and correlation values of GNSS-based PWV compared to radiosonde-based and reanalysis-based PWV were investigated for each IGS station. Besides, it was evaluated whether the GNSS technique could be used as an alternative to other methods in studies related to the troposphere and meteorology in the Antarctic continent.

How to cite: Mutlu, B. and Erol, S.: Assessment of GNSS-based PWV against radiosonde observation and reanalysis datasets in Antarctica, EGU General Assembly 2025, Vienna, Austria, 27 Apr–2 May 2025, EGU25-965, https://doi.org/10.5194/egusphere-egu25-965, 2025.

A three-dimensional water vapor density field has advantages in monitoring atmospheric water vapor, especially for reflecting the vertical motion. The existing multi-source tomography models are around a fusion of single-source remote-sensing signal and Global Navigation Satellite System (GNSS) data. However, different remote-sensing data have advantages and disadvantages regarding spatiotemporal resolution and accuracy. When only single-source remote-sensing data is integrated for tomography, the model's available scenarios are severely limited by weather conditions. Therefore, we construct a tomography model by fusing multi-band spaceborne remote-sensing data and high-precision ground GNSS data, the former includes near-infrared MODIS image, long-wave infrared FengYun-4A image, and morphed integrated microwave image MIMIC. The equations system of the tomographic model is solved based on different strategies of weight determination using the weighted least square algorithm. In addition, to consider the dynamic variations of tropopause height in the research area, the tropopause detection products of Fengyun-4B with high spatial coverage are used to determine the boundary of the tomographic region, and the constraints of model is built by historical GNSS occultation observations. To verify our method, the proposed model is validated by water vapor density from reanalysis and radiosonde data, respectively. The results show that the reasonable prior weights are essential when using multi-source data to perform tightly coupled tomography, the RMSEs of water vapor density are less than 2 g/m3 in most epochs. Compared to the tomographic model based on only GNSS data, the accuracy improvement of the tomographic model fusing multi-band remote sensing data is higher than that of any tomographic model using single-source remote-sensing data. Also, the proposed tomography model can better compensate for the shortcomings of poor time continuity of integrated individual remote-sensing data to expand the application scenarios of the fusion tomographic model.

Acknowledgments: This work was supported by Natural Science Foundation of China (42192534 and 42388102).

How to cite: Xu, T. and Li, S.: Atmospheric Water Vapor Tomography based on GNSS and Multi-band Remote Sensing Measurements Combination, EGU General Assembly 2025, Vienna, Austria, 27 Apr–2 May 2025, EGU25-2480, https://doi.org/10.5194/egusphere-egu25-2480, 2025.

EGU25-5428 | ECS | Orals | G5.1

Extraction and Application of Subcarrier Phase Measurements in GNSS-R Altimetry 

Yunqiao He, Fan Gao, Xinyue Meng, and Tianhe Xu

Subcarrier modulated signals, such as BDS-3 B2 and Galileo E5, are widely used to improve the spectral compatibility and ranging accuracy of Global Navigation Satellite Systems (GNSS). However, designing signal processing and observation extraction techniques for subcarrier modulated signals is still challenging for the navigation community. In GNSS-R application, GNSS-R phase altimetry is proposed to provide sea surface height information as an economical and accurate technology to solve the resolution problem. However, phase unwrapping and phase integer ambiguity pose significant challenges for the application of GNSS-R phase altimetry. To overcome these obstacles, the utilization of subcarrier modulated signals is noticed for the first time, presenting a novel opportunity for GNSS-R phase altimetry due to the substantial subcarrier wavelength of 19.5 meters. In the work, we developed a subcarrier modulated signal processing strategy that can track both the upper and lower band signals. By combining the two signals, we construct virtual signals whose phase matches the subcarrier phase. These virtual signals undergo processing using long-time coherent integration and sliding filtering to enhance the signal-to-noise ratio and minimize errors. Subsequently, subcarrier phase measurements are extracted from these virtual signals. To validate the effectiveness, subcarrier phase measurements are applied to a GNSS-R altimetry station and drone platform. When compared with accurate in-situ SSH results, it is evident that the phase is much easier to unwrap and the phase integer ambiguity is easier to fix. Furthermore, the accuracy can achieve centimeter-level precision.

How to cite: He, Y., Gao, F., Meng, X., and Xu, T.: Extraction and Application of Subcarrier Phase Measurements in GNSS-R Altimetry, EGU General Assembly 2025, Vienna, Austria, 27 Apr–2 May 2025, EGU25-5428, https://doi.org/10.5194/egusphere-egu25-5428, 2025.

Chile's diverse climate spans a remarkable range, from the hyper-arid desert in the north to a Mediterranean climate in the center, temperate humid conditions in the south, and polar tundra in Patagonia. This climatic gradient provides a unique opportunity to study the synchronized variability of tropospheric water vapor (TWV) and precipitation processes. In recent years, GNSS has emerged as a powerful satellite-based tool capable of capturing not only tectonic deformation but also meteorological processes. One of the key parameters derived from GNSS processing is Zenith Total Delay (ZTD), which represents the delay in GNSS signal propagation caused by the troposphere. ZTD is composed of the hydrostatic and wet delays, with the wet delay closely linked to TWV, making it an essential metric for studying atmospheric water vapor dynamics. We use GNSS ZTD observations, spanning between 15 and 28 years, to analyze the intra-seasonal and interannual probability density functions (PDFs) of TWV. Additionally, we examine the co-variability between daily average TWV and accumulated precipitation to establish links between TWV peaks and precipitation events.

Our results reveal significant differences in TWP PDFs across Chile, ranging from log-normal to normal and inverse log-normal distributions. Notably, the relationship between TWV and precipitation is stronger in central, southern, and Patagonian regions, suggesting regional variability in underlying atmospheric processes. Potential mechanisms driving these differences, such as climatic controls and local meteorological dynamics, are discussed in detail.

These findings provide a benchmark for evaluating the representativeness of general circulation models (GCMs) by comparing observed and modeled TWV distributions. Furthermore, they lay the groundwork for future research into the TWV-precipitation relationship at daily and sub-daily timescales, critical for improving weather forecasts and understanding hydrological processes.

How to cite: Valenzuela, R. and Jara, J.: GNSS-derived tropospheric water vapor and precipitation co-variability along continental Chile, EGU General Assembly 2025, Vienna, Austria, 27 Apr–2 May 2025, EGU25-7362, https://doi.org/10.5194/egusphere-egu25-7362, 2025.

Tropospheric delay is one of the main sources of error affecting high-precision positioning and navigation and is a key parameter for detecting water vapour in the Global Navigation Satellite System (GNSS).

This delay is typically divided into wet and hydrostatic components. ZTD is described as the sum of the Zenith Hydrostatic Delay (ZHD) and the Zenith Wet Delay (ZWD) and can be combined with surface pressure and temperature to estimate the integrated content of water vapour above GNSS station.

In climate change context, the precipitable water vapour (PW) is key parameter of atmospheric process and dynamics and its variation is very high in space and time. Its accuracy is paramount for any geodetic or climatic study.

In recent years, data from atmospheric reanalysis products such as ERA-Interim, ERA5 (the fifth generation of reanalysis from the European Centre for Medium-Range Weather Forecasts) have been widely used to obtain information on tropospheric delay and water vapour   (Li et al., 2015; Zhou et al., 2020...)

The main objective of this study is to compute precipitable water vapour from ERA5 reanalysis for four stations in Algeria, which have different types of climate. We opt for using integration method for different level of pressure with ERA5.

The values of water vapour are also compared with radiosondes profiles and GNSS data. The results of this work shows good agreement with a correlation that is not less than not 0.95 and 0.70 compared as radiosondes profiles (Namaoui et al., 2022). The first results are encouraging, in particular for meteorological applications with good hope to introduce another dataset as GNSS to more understand the variation and behaviour of water vapour over a long period of observation.

How to cite: Houaria, N.: Evaluation of atmospheric water vapour based on ERA5 Reanalysis Products and GNSS Observations in Algeria., EGU General Assembly 2025, Vienna, Austria, 27 Apr–2 May 2025, EGU25-8874, https://doi.org/10.5194/egusphere-egu25-8874, 2025.

EGU25-8951 | ECS | Posters on site | G5.1

A Ground-based GNSS-R Marine Environment Dynamic Monitoring Station 

Xinyue Meng, Fan Gao, Tianhe Xu, and Nazi Wang

Global navigation satellite system-reflectometry (GNSS-R) is considered a promising technology for monitoring marine environments. However, there is still a lack of GNSS-R stations that provide comprehensive data. For this reason, a stationary marine information dynamic monitoring platform using GNSS-R method was constructed in Weihai City, Shandong Province, China. This station consists of two antennas, an intermediate frequency (IF) data collector, a wind sensor and a laptop computer with GPUs. The up-looking antenna is used for direct signal receiving and the down-looking antenna serves for reflected signals. The wind sensor records wind speed and wind direction simultaneously at 1Hz. The collector can export IF data with 62MHz sampling rate which covers signals including GPS L1/L5, BDS B1I/B1C/B2a and Galileo E1/ E5a. The laptop with self-developed software defined receiver (SDR) is employed for processing large amounts of IF data and outputting sea surface height observations based on dual-antennas method in real-time. In the preliminary study, the results based on code-delay method show that the accuracy of BDS B2a can realize centimeter altimetry after post-processing while the accuracy of GPS L5 is approximately in the decimeter range due to the limited number of satellites within the visible range. Additionally, these observations can be also used to retrieve wind speed. We look forward to more research on GNSS-R in the future, for which we can provide data collected by this GNSS-R station.

How to cite: Meng, X., Gao, F., Xu, T., and Wang, N.: A Ground-based GNSS-R Marine Environment Dynamic Monitoring Station, EGU General Assembly 2025, Vienna, Austria, 27 Apr–2 May 2025, EGU25-8951, https://doi.org/10.5194/egusphere-egu25-8951, 2025.

EGU25-8993 | ECS | Posters on site | G5.1

Stacking machine learning model for vertical interpolation of precipitable water vapor using GNSS networks and radio occultation data 

Jiaqi Shi, Min Li, Wenwen Li, Kefei Zhang, and Andrea Steiner

This study proposes a stacking machine learning (SML) model for the vertical interpolation of precipitable water vapor (PWV), addressing the issue of missing near-surface water vapor information in radio occultation (RO) profiles, where measurements do not reach the surface. The model integrates data from over 1500 ground-based Global Navigation Satellite System (GNSS) stations and more than 300,000 profiles from the Constellation Observing System for Meteorology, Ionosphere, and Climate-2 (COSMIC-2), and is trained and validated in two regions of the Northern Hemisphere. Results show that in the North American region, the SML model reduces the root-mean-square error (RMSE) of PWV estimates by over 33% compared to conventional models. In China and Southeast Asia, the RMSE reduction is about 42%, demonstrating notable improvements over conventional model approaches. External validation with radiosondes shows close agreement between the SML-interpolated RO-PWV and radiosonde-PWV. Additionally, the SML-interpolated RO-PWV exhibits high consistency with PWV estimates from RO profiles of the Meteorological Operational satellites (Metop by ROMSAF), which contain complete (background) near-surface information. The SML model performs reliably across various terrains and climatic conditions. This study also preliminarily explores the model performance for extreme weather conditions, providing insights for future enhancements. The new SML model provides a high-accuracy and effective solution for PWV estimation and contributes to advancements in water vapor monitoring, weather forecasting, and atmospheric science research.

How to cite: Shi, J., Li, M., Li, W., Zhang, K., and Steiner, A.: Stacking machine learning model for vertical interpolation of precipitable water vapor using GNSS networks and radio occultation data, EGU General Assembly 2025, Vienna, Austria, 27 Apr–2 May 2025, EGU25-8993, https://doi.org/10.5194/egusphere-egu25-8993, 2025.

EGU25-9979 | Posters on site | G5.1

Consistency and Homogeneity of ZTD Estimates from IGS Repro3 

Hugo Breton, Olivier Bock, and Samuel Nahmani

In 2019-2020, the International GNSS Service (IGS) coordinated its third reanalysis of the complete history of GNSS data collected by the IGS global network since 1994. Ten analysis centers (ACs) participated in this so-called “Repro3” effort, using the latest models and methodologies. Several of them provided, among other products, zenith tropospheric delay (ZTD) estimates.

In this study, we analyze the quality of ZTD estimates from four ACs (COD, GFZ, GRG, and TUG) along three different aspects: 1) the number and size of ZTD outliers, 2) the mean ZTD differences (or biases), and the standard deviation of ZTD differences between ACs as well as with respect to the ERA5 reanalysis, and 3) the homogeneity of the ZTD time series at individual sites. Overall statistics and case studies are presented for 200 sites.

We find an overall agreement between ACs at the sub-millimeter (bias) and sub-centimeter (standard deviation) level. However, a notable number of outliers and inhomogeneities are observed at individual sites. These are attributed to differences in metadata, particularly antenna information, and, to a lesser extent, to differences in processing strategies and software-specific features (e.g., outlier editing). Controlling the quality of metadata and optimizing the processing strategy are two major pathways for improving the quality of GNSS ZTD estimates for use in climate analysis.

This work is part of the activities of a Joint Working Group of the IAG Inter-Commission Committee on “Geodesy for Climate Research” (ICCC), in cooperation with the IGS ACs.

How to cite: Breton, H., Bock, O., and Nahmani, S.: Consistency and Homogeneity of ZTD Estimates from IGS Repro3, EGU General Assembly 2025, Vienna, Austria, 27 Apr–2 May 2025, EGU25-9979, https://doi.org/10.5194/egusphere-egu25-9979, 2025.

EGU25-10034 | ECS | Posters on site | G5.1

Polarimetric GNSS-Reflectometry data over sea ice during the MOSAiC expedition 

Baojian Liu, Ruibo Lei, Wei Wan, Junming Xia, Maximilian Semmling, Jie Zhang, Yue Xu, Yueqiang Sun, Hongjie Xie, and Gunnar Spreen

Global Navigation Satellite System Reflectometry (GNSS-R) has long been explored for retrieving sea ice properties, but in-situ validation in the central Arctic during the freezing season is rare, limiting its application. The primary objective of this study is to advance the current understanding of multi-polarization GNSS-R remote sensing for sea ice. This paper presents observations from the full-polarization GNSS-R(FpolGNSSR) prototype  during the MOSAiC expedition. FpolGNSSR, with four polarization channels and high antenna gain (11.3 dB), aims to assess the impact of sea-ice thickness and permittivity on GNSS-R data, with observations from October 2019 to January 2020, the onset period of ice growth. A four-layer model simulates reflectivity, and the sensitivity of multi-polarization GNSS-R to sea ice is qualitatively analyzed. Subsequently, a simplified model reveals a linear relationship between reflectivity and ice thickness, with regression showing a correlation of 0.74 (P<0.01). The optimal RMSE of sea ice thickness retrieval is 0.13 m for first-year ice in freezing season (0.3–1.0 m thick). 

How to cite: Liu, B., Lei, R., Wan, W., Xia, J., Semmling, M., Zhang, J., Xu, Y., Sun, Y., Xie, H., and Spreen, G.: Polarimetric GNSS-Reflectometry data over sea ice during the MOSAiC expedition, EGU General Assembly 2025, Vienna, Austria, 27 Apr–2 May 2025, EGU25-10034, https://doi.org/10.5194/egusphere-egu25-10034, 2025.

EGU25-10048 | ECS | Orals | G5.1

High-resolution zenith delay and tropospheric gradient fields track precipitation during heavy local-scale rainfall events  

Andreas Kvas, Stephanie Haas, Jürgen Fuchsberger, and Gottfried Kirchengast

Global Navigation Satellite System (GNSS) meteorology has proven to be a useful tool for the study of weather phenomena and climate change. The sensitivity of GNSS signals to the distribution of water vapor and liquid water in the atmosphere has led to numerous applications of tropospheric delay data products, ranging from the evaluation of numerical weather prediction (NWP) models via data assimilation into NWP models, to the observation-driven analysis of rainfall events. In this study, we investigate the behavior of non-hydrostatic zenith delay (ZWD), integrated water vapor (IWV), and tropospheric gradients before, during, and after heavy short-duration local-scale convective precipitation events. The study area located in the WegenerNet 3D Open-Air Laboratory for Climate Change Research Feldbach Region (WEGN3D Open-Air Lab) is situated in the Alpine forelands of southeastern Austria and covers an extent of about 22 km by 16 km. The WEGN3D Open-Air Lab consists of a six-station GNSS network with baselines between 5 km and 10 km, 156 closely spaced meteorological stations, an X-band precipitation radar, and a microwave and broadband infrared radiometer for tropospheric profiling and cloud structure observations, respectively.  We generate non-hydrostatic zenith delay maps for the study region with a temporal resolution of 150 seconds by combining estimated ZWD and tropospheric gradients. These high-resolution ZWD maps are then used to derive IWV maps using surface meteorological measurements and tropospheric profile statistics. We further exploit the approximate relationship between the spatial derivatives of ZWD with tropospheric gradients to compute gradient fields for the entire ZWD map domain.  We compare the spatial patterns of these high-resolution datasets with X-band radar-derived precipitation during heavy convective precipitation events with small spatial extent and high spatial variability. In line with previous studies, we find that the location of precipitation cells is well reflected in the ZWD, IWV, and gradient maps before, during, and after the event, even for very localized, short-lived precipitation events with an extent of only a few kilometers. This shows that GNSS meteorology can provide insights into heavy precipitation events approaching the microscale.

How to cite: Kvas, A., Haas, S., Fuchsberger, J., and Kirchengast, G.: High-resolution zenith delay and tropospheric gradient fields track precipitation during heavy local-scale rainfall events , EGU General Assembly 2025, Vienna, Austria, 27 Apr–2 May 2025, EGU25-10048, https://doi.org/10.5194/egusphere-egu25-10048, 2025.

EGU25-10658 | ECS | Orals | G5.1

Impact of assimilating GNSS Tropospheric Gradients along with Zenith Total Delays for Severe Weather Prediction 

Rohith Muraleedharan Thundathil, Florian Zus, Thomas Schwitalla, Matthias Aichinger-Rosenberger, Galina Dick, and Jens Wickert

The Global Navigation Satellite System (GNSS) tropospheric gradients offer valuable information about how moisture is distributed in the atmosphere. These gradients are determined by studying variations in how the atmosphere refracts signals, which are measured based on delays from satellites positioned at different angles. Zus et al. (2023) developed a tropospheric gradient operator that has been added to the Weather Research and Forecasting (WRF) model. Thundathil et al. (2024) conducted several impact experiments showing promising improvements using this operator.

We are currently integrating data from MPG-NET, a multi-purpose GNSS station network in the Swiss Alps (Aichinger-Rosenberger, Matthias, et al., 2023), and data from the Swabian MOSES (Modular Observation Solutions for Earth Systems) field campaign of 2023, which focused on extreme hydro-meteorological events in southwestern Germany. As part of this work, we are simulating the occurrence of hailstorm activity in July 2023. We plan to present initial results from the assimilation of ZTD and gradients for this event.

References:

Zus, F., Thundathil, R., Dick, G., & Wickert, J. (2023). Fast Observation Operator for Global Navigation Satellite System Tropospheric Gradients. Remote Sensing15(21), 5114.

Thundathil, R., Zus, F., Dick, G., & Wickert, J. (2024). Assimilation of GNSS tropospheric gradients into the Weather Research and Forecasting (WRF) model version 4.4. 1. Geoscientific Model Development17(9), 3599-3616.

Aichinger-Rosenberger, M., Wolf, A., Senn, C., Hohensinn, R., Glaner, M. F., Moeller, G., ... & Rothacher, M. (2023). MPG-NET: A low-cost, multi-purpose GNSS co-location station network for environmental monitoring. Measurement216, 112981.

How to cite: Thundathil, R. M., Zus, F., Schwitalla, T., Aichinger-Rosenberger, M., Dick, G., and Wickert, J.: Impact of assimilating GNSS Tropospheric Gradients along with Zenith Total Delays for Severe Weather Prediction, EGU General Assembly 2025, Vienna, Austria, 27 Apr–2 May 2025, EGU25-10658, https://doi.org/10.5194/egusphere-egu25-10658, 2025.

EGU25-10677 | ECS | Posters on site | G5.1

Comparisons between GAMIT-derived Zenith Tropospheric Delay (ZTD) values from AWS and GNSS met sensor values 

Drishti Agarwal, Somnath Mahato, Pramod Balasaheb Gandugade, Balasubramanian Nagarajan, and Onkar Dikshit

Precise estimation of Zenith Tropospheric Delay (ZTD) is crucial for improving the accuracy of data from Continuously Operating Reference Stations (CORS), particularly in applications requiring high-precision GNSS positioning. This study focuses on evaluating various ZTD models to identify the most accurate approach for mitigating atmospheric delays in CORS data. The research compares ZTD values derived from Automatic Weather Stations (AWS), GNSS meteorological sensors, and temperature-pressure-humidity-based models calculated using the GAMIT software with reference values obtained from co-located weather stations and global atmospheric models.

The methodology involves processing GNSS observations from selected CORS sites using multiple ZTD estimation models, including empirical approaches. The accuracy of these models is assessed using key performance metrics such as root mean square error (RMSE), mean bias, and correlation with actual weather conditions.

Preliminary results indicate that empirical models show better consistency in stable atmospheric conditions. Additionally, comparisons between GAMIT-derived ZTD values and those from AWS and GNSS met sensors reveal insights into the reliability and precision of each data source under different atmospheric conditions.

The study highlights that precise ZTD estimation is essential for reducing atmospheric errors in CORS data, thereby enhancing GNSS-based applications such as geodesy, surveying, and real-time positioning. The research concludes that combining inputs from various meteorological data sources offers the best accuracy across diverse CORS networks, particularly in regions with varying climatic conditions and atmospheric dynamics.

How to cite: Agarwal, D., Mahato, S., Gandugade, P. B., Nagarajan, B., and Dikshit, O.: Comparisons between GAMIT-derived Zenith Tropospheric Delay (ZTD) values from AWS and GNSS met sensor values, EGU General Assembly 2025, Vienna, Austria, 27 Apr–2 May 2025, EGU25-10677, https://doi.org/10.5194/egusphere-egu25-10677, 2025.

EGU25-11277 | Posters on site | G5.1

Ground-GNSS ZTD trends for climate models 

Marcelo C. Santos, Rosa Pacione, Kyriakos Balidakis, Sharyl Byrant, Galina Dick, Riley Hughes, Jonathan Jones, Hanes Keernik, Anna Klos, Yidong Lou, Haroldo Marques, Samuel Nahmani, Thalia Nikolaidou, Kalev Rannat, Raul Valenzuela, Zhang Weixing, Yibin Yao, and Peng Yuan

GNSS Zenith Total Delay (ZTD) estimates are quantities of great interest by climate modellers since atmospheric water vapour is the major greenhouse gas. Therefore, the importance of its accurate, long-term monitoring and evaluation of trends and variability, potentially serving as independent benchmarks to climatological models, both on longer trends derived from GNSS, but also shorter trends, which could be used for assimilation and validation of climate models. ZTD estimates are determined on a regular basis by several processing centers as well as by demand. It has also been demonstrated that series of ZTD estimates can be used for quality control purposes. At the same time, GNSS reached the “maturity age” of 30 years when climate normals of ZTD and gradients can be derived. But what would be the best ZTD series to serve the climate community? What series would offer the most realistic trends? This poster discusses an on-going investigation under the auspices of the International Association of Geodesy, through a joint working group nested within the Inter-Commission Committee on Geodesy for Climate Research. In a previous study, we made use of the ZTD series derived by the third reprocessing campaign (REPRO3), based on a variety of processing modes and models. But this study was partial as the ZTD times series estimated by the Analysis Centers were not covering the same periods. This time, ZTD time series are generated using dedicated PPP scientific software suites. The generated trends are to be compared and analysed.

How to cite: C. Santos, M., Pacione, R., Balidakis, K., Byrant, S., Dick, G., Hughes, R., Jones, J., Keernik, H., Klos, A., Lou, Y., Marques, H., Nahmani, S., Nikolaidou, T., Rannat, K., Valenzuela, R., Weixing, Z., Yao, Y., and Yuan, P.: Ground-GNSS ZTD trends for climate models, EGU General Assembly 2025, Vienna, Austria, 27 Apr–2 May 2025, EGU25-11277, https://doi.org/10.5194/egusphere-egu25-11277, 2025.

EGU25-12037 | ECS | Orals | G5.1

From ground- to space-based GNSS tomography - initial results and concepts 

Adam Cegła, Sebastian Makuch, Witold Rohm, Gregor Moeller, Estera Trzcina, Paweł Hordyniec, Samia Gurmani, and Natalia Hanna

Monitoring the Earth's atmosphere is a fundamental activity aimed at understanding its structure and the processes occurring within it. These efforts contribute significantly to improving the quality of numerical weather models and forecasts.

In recent years, GNSS (Global Navigation Satellite System) observations have emerged as one of the primary sources of information about the troposphere, the lowest layer of the atmosphere. The use of electromagnetic wave properties, which respond to changing atmospheric conditions, is gaining recognition due to its stability, availability in all weather conditions, and the density of observations. GNSS observations are increasingly considered a viable alternative to traditional weather stations, radiosondes, and microwave satellites. However, their application is limited by challenges in deploying receivers in aquatic or mountainous regions. Furthermore, the effectiveness of ground-based GNSS observations is hindered by poor vertical resolution.

An alternative to ground-based GNSS observations is their space-based counterpart—radio occultations (RO). These observations, which are independent of ground infrastructure, serve as an ideal complement to traditional ground-based methods. However, their horizontal and temporal resolution is very limited. Their exclusive use in experiments, such as ROMEX, may not demonstrate their full potential, which can be better realized through integration with other tools, particularly GNSS tomography.

Recent studies have shown that integrating ground-based and space-based GNSS observations in a tomographic solution improves solution quality by approximately 10% on average and reduces total solution errors by about 5%. In regions without GNSS ground stations, the error reduction can reach as much as 30%.

Therefore, in this study, we extend this research by testing the feasibility of using a modified INTOMO (INtegrated TOMOgraphy) software with space-based observations only. The program employs 3D ray tracing to simulate RO ray paths between Low Earth Orbit (LEO) and Global Positioning System (GPS) satellites, along with a Kalman filter to calculate the variability of the system of equations. The observation errors are assessed using a pre-defined formula based on RO geometries.

The results presented in this study are derived from the initial phase of research conducted over five days in sea and water-land areas using RO observations from publicly available UCAR services as well as ROMEX data. Each day represents different atmospheric conditions, ranging from sunny weather to tropical cyclones. Additionally, we estimate the errors in the tomographic solution and validate our results using the European Centre for Medium-Range Weather Forecasts (ECMWF) ERA5 and Weather Research and Forecasting (WRF) models and RO processing package (ROPP), with the GPT2 model serving as the a priori data input for tomography. 

How to cite: Cegła, A., Makuch, S., Rohm, W., Moeller, G., Trzcina, E., Hordyniec, P., Gurmani, S., and Hanna, N.: From ground- to space-based GNSS tomography - initial results and concepts, EGU General Assembly 2025, Vienna, Austria, 27 Apr–2 May 2025, EGU25-12037, https://doi.org/10.5194/egusphere-egu25-12037, 2025.

EGU25-12098 | Posters on site | G5.1

GNSS for Weather Forecast and Climate Research at GFZ 

Galina Dick, Florian Zus, Rohith Thundathil, Aurélie Panetier, and Jens Wickert

Global Navigation Satellite System (GNSS) is an established atmospheric observing system for atmospheric water vapour with high spatiotemporal resolution. Water vapour is under-sampled in the current meteorological and climate-observing systems, and thus obtaining and exploiting more high-quality humidity observations is essential.


The operational GNSS data processing at GFZ provides all tropospheric products, zenith total delays (ZTD), precipitable water vapour (PWV), slant total delays (STD) and tropospheric gradients in the framework of different meteorological projects like e.g. E-GVAP ("The EUMETNET EIG GNSS Water Vapour Programme", http://egvap.dmi). E-GVAP is in charge of the collection and quality control of operational GNSS tropospheric products for numerical weather prediction. GFZ is one of the E-GVAP Analysis Centres and processes about 600 GNSS stations in near real-time. The tropospheric products provided by GFZ are used by European weather services for operational forecasts.


GFZ contributes to climate research within the Global Climate Observing System (GCOS) Reference Upper Air Network (GRUAN). Established in 2006, GRUAN, is an international reference observing network of sites measuring essential climate variables above the Earth's surface. Currently, this network comprises 33 reference sites worldwide, designed to detect long-term trends of key climate variables such as temperature and humidity. GFZ hosts a central processing facility for the GNSS data and is responsible for the installation of GNSS hardware, data transfer, processing and archiving, as well as derivation of GNSS-PWV products according to the GRUAN requirements. A complementary small scale regional climate station network is the Austrian WegenerNet, which provides since 2007 measurements of hydrometeorological variables with very high spatial and temporal resolution. GNSS-PWV measurements have been included as a priority one measurement of the essential climate variable water vapour to both GRUAN and WegenerNet climate station networks.

GNSS-derived tropospheric products and results of selected validation studies will be presented.

How to cite: Dick, G., Zus, F., Thundathil, R., Panetier, A., and Wickert, J.: GNSS for Weather Forecast and Climate Research at GFZ, EGU General Assembly 2025, Vienna, Austria, 27 Apr–2 May 2025, EGU25-12098, https://doi.org/10.5194/egusphere-egu25-12098, 2025.

EGU25-14650 | Posters on site | G5.1

A ground-based GNSS-R station for soil moisture monitoring  

Fan Gao, Cheng Qian, Xiao Li, Jiqiang Wei, Jilei Mao, Xinyue Meng, Nazi Wang, Yue Zhu, and Yunqiao He

GNSS-R is an emerging technology for remote sensing of soil moisture with the advantages of high tempo spatial resolutions at low cost. Most of the current research has been carried out on the basis of space borne observations, and a large number of results have been obtained. Due to the high altitude of satellites, the Fresnel reflection zone is usually a few kilometers in diameter, which does not meet the requirements of fine agriculture. Ground-based and UAV-borne GNSS-R, due to their low altitude, can provide effective observations to address above problem. We have built a ground-based GNSS-R observatory at the Experimental Farm of Weihai Academy of Agricultural Sciences, Shandong Province China. The site is equipped with mainly high gain a downward facing left-handed circularly polarized antenna, an upward facing right-handed circularly polarized antenna, an IF signal collector and a computer platform for running the SDR. Currently the main observables that can be output include: SNR, Power Ratio, DDM, etc. The retrievals were evaluated by the in-suit measurements from TDR and the results show that the accuracy of the solutions can reach 3%. In addition, a UAV-based GNSS-R setups are also built and effective measurements were obtained.

How to cite: Gao, F., Qian, C., Li, X., Wei, J., Mao, J., Meng, X., Wang, N., Zhu, Y., and He, Y.: A ground-based GNSS-R station for soil moisture monitoring , EGU General Assembly 2025, Vienna, Austria, 27 Apr–2 May 2025, EGU25-14650, https://doi.org/10.5194/egusphere-egu25-14650, 2025.

EGU25-14987 | ECS | Orals | G5.1

Advancing Sea Ice Thickness Retrieval with Spire GNSS-R Observations 

Seho Kim, Nereida Rodriguez-Alvarez, Xavier Bosch-Lluis, and Kamal Oudrhiri

Monitoring sea ice thickness (SIT) is essential for understanding the role of polar sea ice in the Earth system and addressing the challenges posed by its rapid changes. Arctic sea ice regulates global temperatures, supports ecosystems, and drives ocean circulation. Its decline disrupts ecosystems, intensifies coastal hazards, and impacts indigenous communities. Similarly, Antarctic Sea ice influences ocean stratification, buffers ice shelves from disintegration, sustains marine food webs, and affects human activities such as shipping and fisheries. Comprehensive SIT monitoring in both polar regions is vital for advancing climate science and assessing polar ecosystem health.

This study develops novel algorithms for SIT retrieval using dual-polarimetric and multi-incidence angle GNSS-R data from the Spire Global Inc. constellation. Spire’s GNSS-R receivers collect forward-scattered reflections over ice surfaces in grazing-angle configurations with right-hand circular polarization (RHCP) antennas and near-nadir configurations with left-hand circular polarization (LHCP) antennas. These datasets are utilized in a multi-parameter optimization framework based on a sea ice coherent reflection model to characterize SIT in the critical range of 0.5 m to 1.5 m, where existing remote sensing techniques show significant relative errors. The proposed two-layer model leverages the sensitivity of GNSS-R reflectivity to variations in sea ice dielectric properties, salinity, and density and was validated with data from the Soil Moisture Active Passive (SMAP) mission in its reflectometer configuration (SMAP-R). The algorithms address the measurement gap between thin and thick ice while enhancing spatial and temporal resolution, enabling weekly coverage of the Arctic and Antarctic Oceans. These advancements provide critical insights into SIT dynamics across both regions, addressing gaps in existing techniques.

This research highlights the potential of GNSS-R technology in sea ice monitoring, contributing to the development of robust SIT retrieval algorithms. By advancing SIT retrieval capabilities, this work lays the foundation for improving climate models, informing navigation and resource management, and aiding in the conservation of fragile polar ecosystems facing environmental changes.

© 2025 California Institute of Technology. Government sponsorship acknowledged.

How to cite: Kim, S., Rodriguez-Alvarez, N., Bosch-Lluis, X., and Oudrhiri, K.: Advancing Sea Ice Thickness Retrieval with Spire GNSS-R Observations, EGU General Assembly 2025, Vienna, Austria, 27 Apr–2 May 2025, EGU25-14987, https://doi.org/10.5194/egusphere-egu25-14987, 2025.

EGU25-15298 | ECS | Posters on site | G5.1

Synergy of GNSS Tomography and Radio Occultation: Methods for Assimilating Refined Water Vapor Fields 

Natalia Hanna, Samia Gurmani, Estera Trzcina, Witold Rohm, Adam Cegła, Paweł Hordyniec, Sebastian Makuch, Gregor Möller, Maciej Kryza, and Robert Weber

Global Navigation Satellite Systems (GNSS) tomography is a rapidly developing method in meteorology that provides 3D grid-based information about water vapour distribution in the lower troposphere. The standard tomographic solutions are derived by processing signal delays between satellites and ground-based GNSS receiver networks. As the technique has advanced, additional observational data sources have been integrated into the process, enhancing its accuracy and applicability.

Low Earth orbit (LEO) satellites can provide signal delays similar to those from ground-based networks by tracking GNSS signals. This technique is known as GNSS radio occultation (RO) and relies on radio transmissions from GNSS satellites, where signals pass through the atmosphere and undergo refraction. The degree of refraction is influenced by atmospheric temperature and water vapor concentration. With the exponential increase in the number of LEOs satellites over the past 30 years, this technique has been a cornerstone for atmospheric measurements. It is widely used in meteorological offices as a tool for weather forecasting and shows strong potential for improving tomographic applications. 

The Weather Research and Forecasting (WRF) Model, equipped with its tomographic operator tomoref, facilitates the integration of tomographic products into meteorological fields. In recent years, several studies have explored available practices for tomographic data assimilation. In this work, we present two variants for assimilating combined RO and tomographic solutions. 

In the first approach, radio occultation-derived wet refractivity profiles from the UCAR COSMIC program were incorporated into the tomographic solution using the ATom tomographic software, enhanced with its RO extension. The 3DVar assimilation of tomographic wet refractivity fields into the WRF Data Assimilation system was performed for both combined and ground-based solutions at selected epochs when radio occultation events occurred within the defined domain. The model’s performance was further validated by comparing it to a solution that assimilated conventional GNSS observations. For ground-based stations, GNSS signal delays, expressed as Zenith Total Delays (ZTDs), were assimilated using the gpsztd operator, while space-derived total refractivity profiles were incorporated using the gpsref operator. The resulting meteorological parameters were then compared to external data sources, including radiosondes, meteorological sites, and ERA5 data.

As part of the ongoing OPUS NCN project, an alternative approach to observation integration is being developed. This integrated tomographic solution combines ground-based GNSS observations with RO excess phase data from SPIRE Global within a unified tomography model on the phase observation level. Since RO events are often unevenly distributed across space and time, the combined tomographic observations address these limitations by filling data gaps with ground-based observations. The resulting wet refractivity fields are then assimilated using a variational approach, incorporating the tomographic data into the model over a broader assimilation window. With further fine-tuning, the presented methodology for assimilating tomographic products demonstrates significant potential for future testing in meteorological centres.

How to cite: Hanna, N., Gurmani, S., Trzcina, E., Rohm, W., Cegła, A., Hordyniec, P., Makuch, S., Möller, G., Kryza, M., and Weber, R.: Synergy of GNSS Tomography and Radio Occultation: Methods for Assimilating Refined Water Vapor Fields, EGU General Assembly 2025, Vienna, Austria, 27 Apr–2 May 2025, EGU25-15298, https://doi.org/10.5194/egusphere-egu25-15298, 2025.

EGU25-15408 | Posters on site | G5.1

New horizon of tropospheric studies using the next generation GNSS, Network of Satellite Constellations and AI 

Witold Rohm, Paweł Hordyniec, Jan Kapłon, Estera Trzcina, Saeid Haji-Aghajany, Peng Sun, Longijang Li, and Kefei Zhang

We present a collaborative research project between Polish and Chinese scientists, supported by national research funding agencies, to advance GNSS remote sensing (RS) for atmospheric studies. Recent advancements in space technologies, artificial intelligence (AI), and information and communication technologies (ICT) have significantly enhanced our ability to observe, model, and predict atmospheric processes. AI-powered GNSS RS offers robust capabilities for acquiring essential atmospheric parameters, such as water vapor content and profiles, rain rates, wind speeds, and cloud composition.

This project focuses on bridging mathematical models, physical processes, and space- and ground-based observations to achieve the following objectives:

  • Data Fusion: Standardize and integrate GNSS RS measurements from ground- and space-based platforms.
  • Innovative Methods: Exploit advanced observation techniques, including signal polarimetry and reflectometry.
  • Network Integration: Harness the potential of multi-constellation satellite networks, including GNSS, LEO satellites, and Starlink-like constellations, for atmospheric studies.
  • AI-Driven Modeling: Develop seamless connections between GNSS observations and weather and climate models using AI and Digital Twin technologies to investigate interactive atmospheric mechanisms.

This research is supported by NCN project UMO-2023/48/Q/ST10/00278, fostering Polish-Chinese scientific collaboration.

How to cite: Rohm, W., Hordyniec, P., Kapłon, J., Trzcina, E., Haji-Aghajany, S., Sun, P., Li, L., and Zhang, K.: New horizon of tropospheric studies using the next generation GNSS, Network of Satellite Constellations and AI, EGU General Assembly 2025, Vienna, Austria, 27 Apr–2 May 2025, EGU25-15408, https://doi.org/10.5194/egusphere-egu25-15408, 2025.

EGU25-15774 | ECS | Posters on site | G5.1

Investigation on systematic deviations of absolute and double differential partial wet delay between GNSS, PS-InSAR, and ERA-5 model observations 

Alfredo Zárate, Andreas Schenk, Bettina Kamm, and Michael Mayer

Interferometric Synthetic Aperture Radar (InSAR) data stacks offer a means to derive integrated water vapor (IWV) from phase delay observations along the satellite line of sight with high spatial resolution. Since interferometric observations are differential in both space and time, they capture relative IWV changes but lack absolute values, which is the variable integration constant. Existing approaches to obtain absolute IWV from InSAR are typically validated against GNSS observations, weather models, or other remote sensing datasets. However, these validations primarily assess the integration methods rather than the observed interferometric phase delay representing partial wet delay.

In this study we investigate the reverse approach by comparing native differential partial wet delay observations from Persistent Scatterer InSAR (PSI), mapped to zenith wet delay (ZWD), with forward-modeled double differential ZWD (DsDt ZWD) derived from GNSS and ERA-5 data. The analysis focuses on a region in Central Europe spanning the France-Germany-Switzerland border from March 2015 to July 2019.

The methodology incorporates data from 4.2 million persistent scatterer (PS) points, ERA-5 ZWD interpolated to these locations, and hourly tropospheric wet delay data from 16 GNSS stations. Temporal and spatial differences were computed to generate synthetic DsDt ZWD data stacks, enabling direct comparison of GNSS and ERA-5 ZWD. Analyses were conducted in single differential (temporal) and double differential (temporal and spatial) domains, with evaluations performed at GNSS stations using statistical metrics such as the coefficient of determination (R²) and the Kling-Gupta Efficiency (KGE) index. Seasonal variability was also assessed. Additionally, the study examines how local distances around GNSS stations affect the correlation (R² and KGE) between GNSS-InSAR and GNSS-ERA data, evaluating their impact on measurement consistency.

Results reveal valuable insights into the performance of InSAR, GNSS, and ERA-5 ZWD. In the single differential domain, the variance of Dt ZPWD from InSAR aligns closely with GNSS and ERA-5 data. While scatter plots confirm a linear relationship between GNSS and ERA-5, GNSS vs. InSAR trends appear nonlinear. Applying double differences significantly enhances the correlation between GNSS and InSAR, surpassing that of GNSS and ERA-5. The KGE index highlights improved GNSS-InSAR performance, particularly in correlation (R) and variability ratio (Alpha). Seasonal analyses show that GNSS-InSAR excels during summer, with mean R² values twice those of GNSS-ERA, whereas GNSS-ERA performs better in winter. Regional variability is observed, with higher differences in R² and KGE values at stations in the Rhine Valley.

In conclusion, this study demonstrates the capability of PS-InSAR to provide high-resolution, accurate differential ZWD estimates, particularly during summer. PS-InSAR shows a stronger correlation with GNSS data in the double differential domain compared to ERA-5, underscoring the value of high-resolution ZWD data. Systematic variations in GNSS-InSAR correlation, identified as potential quality indicators for GNSS ZWD products, further highlight the importance of integrating multi-source geodetic data to enhance ZWD monitoring.

How to cite: Zárate, A., Schenk, A., Kamm, B., and Mayer, M.: Investigation on systematic deviations of absolute and double differential partial wet delay between GNSS, PS-InSAR, and ERA-5 model observations, EGU General Assembly 2025, Vienna, Austria, 27 Apr–2 May 2025, EGU25-15774, https://doi.org/10.5194/egusphere-egu25-15774, 2025.

EGU25-15927 | ECS | Posters on site | G5.1

Near Real-Time Tropospheric Delay Assessment Through theVariometric Approach: A Comparative Study of Two-Variable and Separate-Variable Functional Models for ZTD Estimation 

Rachele Fratini, Alessandra Maria De Pace, Augusto Mazzoni, and Mattia Crespi

The variometric approach leverages the use of dual-frequency combinations of time-single differences of GNSS phase observations. Successfully applied in GNSS seismology (VADASE, [1,2]) and GNSS ionospheric seismology (VARION, [3]), this methodology is explored in this study for its potential in near real-time tropospheric delay tracking. Its application to weather forecasting could significantly improve current tools, allowing for a timely detection of severe weather events through real-time tropospheric delay monitoring. This research investigates the retrieval of absolute ZTD trends from variometric zenith tropospheric delay (VZTD) estimates, derived through two different approaches. The first strategy employs a two-unknown weighted least-squares-based functional model to estimate VZTD and receiver clock offset (VCLKR). Reseach shows that this approach may lead to potential ill-conditioning of the design matrix in the least-squares process, possibly due to the correlation between the estimated parameters. To address this issue, a second approach is introduced that utilizes a dedicated functional model to separate the estimation of the two parameters. The comparative analysis of VZTD estimates on permanent station data highlights significant discrepancies between the two approaches, with pronounced differences in the magnitude of the retrieved absolute ZTD trends. This study provides evidence of the sensitivity of the two-variable estimation approach to the correlation between VZTD and VCLKR. Separate variable estimation offers improved results, with the ZTD trend being more consistent with the reference Precise Point Positioning (PPP) estimates. This analysis demonstrates that separating the estimation of VZTD and VCLKR parameters enhances the reliability of absolute ZTD estimates through the variometric approach.

[1] Benedetti, Elisa, et al. ”Global Navigation Satellite Systems seismology for the 2012 M w 6.1 Emilia earthquake: Exploiting the VADASE algorithm.” Seismological Research Letters 85.3 (2014):649-656
[2] Colosimo, Gabriele, et al. ”Realˆatime GPS seismology with a stand−alone receiver: A preliminary feasibility demonstration” Journal of Geophysical Research: Solid Earth 116.B11 (2011).
[3] Savastano, Giorgio, et al. ”Real−time detection of tsunami ionospheric disturbances with a stand-alone GNSS receiver: A preliminary feasibility demonstration.” Scientific reports 7.1 (2017): 46607

How to cite: Fratini, R., De Pace, A. M., Mazzoni, A., and Crespi, M.: Near Real-Time Tropospheric Delay Assessment Through theVariometric Approach: A Comparative Study of Two-Variable and Separate-Variable Functional Models for ZTD Estimation, EGU General Assembly 2025, Vienna, Austria, 27 Apr–2 May 2025, EGU25-15927, https://doi.org/10.5194/egusphere-egu25-15927, 2025.

EGU25-16138 | ECS | Posters on site | G5.1

Optimizing GNSS Tomographic Node Distribution Using Signal Geometry for Enhanced Tropospheric Sensing 

Estera Trzcina, Witold Rohm, and Kamil Smolak

Global Navigation Satellite Systems (GNSS) are a powerful tool for high-resolution tropospheric sensing, offering valuable data for weather forecasting and climate monitoring. One of the key techniques for estimating three-dimensional fields of humidity-related parameters in the troposphere using GNSS data is tomography. Recent studies revealed its potential for application in data assimilation into numerical weather prediction models. However, the accuracy of the tomographic models depends heavily on the approach to the distribution of the tomographic nodes. Traditionally, the nodes are placed on a regular grid, without accounting for the uneven distribution of GNSS signal information in the troposphere, which often leads to suboptimal results.


In this study, we propose a novel approach to optimize the spatial arrangement of tomographic nodes, based on the geometry of the GNSS signals and the non-uniformity of the information they provide. The proposed algorithm is based on four steps to define the optimal arrangement of the tomographic nodes: 1) selecting the most valuable GNSS signals in terms of geometry (those that cross with other signals), 2) identification of the intersection spots, 3) cluster analysis of the defined intersections using DBSCAN algorithm, 4) introducing regularly-distributed nodes in the locations with lower-density of the GNSS signals to increase stability of the model. The final solution is performed using a node-based parameterization approach with interpolation of wet refractivity based on natural cubic splines. To evaluate the effectiveness of the optimized node distribution, we compare the performance of our approach with that of three conventional parameterization methods (both voxel-based and node-based with trilinear and spline-based interpolation), using cross-validation based on outputs from the Weather Research and Forecasting (WRF) model and radiosonde observations. The methodology was tested in an urban area, using zenith tropospheric delay estimates from a dense network of 16 low-cost multi-GNSS receivers located in Wrocław, Poland, with an average inter-receiver distance of 3 km.


The results show that the optimized node placement improves the accuracy of wet refractivity estimation, with a reduction in RMSE of 0.5–2 ppm, especially in the altitude range of 0.5–2.0 km. The proposed solution gave the best results compared to the other parameterization approaches (both voxel-based and node-based). The largest impact was noticed in the areas where the highest number of the GNSS signals’ intersections occurred. This study highlights the importance of considering the geometry of GNSS signals when designing tomographic networks and suggests that optimizing node distribution is a promising avenue for future research in GNSS-based tropospheric sensing.

How to cite: Trzcina, E., Rohm, W., and Smolak, K.: Optimizing GNSS Tomographic Node Distribution Using Signal Geometry for Enhanced Tropospheric Sensing, EGU General Assembly 2025, Vienna, Austria, 27 Apr–2 May 2025, EGU25-16138, https://doi.org/10.5194/egusphere-egu25-16138, 2025.

Neutral atmospheric bending angles derived from GNSS Radio Occultation (GNSS-RO) data are essential for estimating atmospheric properties such as temperature, humidity, and pressure. The region of interest for atmospheric properties extends up to 80 km, where ionospheric effects remain and require ionospheric corrections for accurate RO bending angle retrievals. First-order ionospheric terms are typically removed using a linear combination of L1 and L2 bending angles. However, this approach leaves behind higher-order terms, known as residual ionospheric errors (RIEs), which introduce systematic biases into the RO data.

Healy and Culverwell (2015) demonstrated that RIEs are theoretically proportional to the square of the difference between L1 and L2 bending angles, scaled by a coefficient, kappa, which varies with ionospheric conditions. Kappa correction is a convenient method to estimate RIEs directly from bending angle data without relying on external ionospheric data such as electron density profiles. Angling et al. (2018) proposed a simple linear model to estimate kappa as a function of altitude, F10.7, and solar zenith angle. They used the NeQuick model to generate electron density profiles and derived the linear model for kappa estimation. However, since NeQuick is a monthly median ionospheric electron density model, it has limitations in representing real-world ionospheric variability, leading to discrepancies between the kappa values from the NeQuick-based model and those estimated from actual data. Therefore, a more realistic derivation of kappa using actual RO data is needed to develop an improved kappa model.

This study aims to enhance kappa correction by using real electron density profiles derived from GNSS-RO data. A double Chapman layer is fitted to electron density profiles from COSMIC-II data, incorporating the characteristics of the E and F layers to provide continuous representations of the real electron density profiles. Ray-tracing simulations are conducted to obtain L1 and L2 ionospheric bending angles, which are then used to derive kappa values. These kappa values are analyzed under various ionospheric conditions, characterized by user-end parameters such as F10.7, local time, geomagnetic latitude, and altitude.

To examine more accurately the numerical relationship between kappa and these parameters, kappa data is classified by F10.7 to represent different solar activity conditions (e.g., solar minimum and maximum), and is also divided by local time (e.g., noon, midnight, and transition periods). Kappa values for each class are then fitted to the remaining parameters. The findings suggest that kappa values from the model proposed by Angling et al. (2018) differ from those estimated using observational data in this study. By directly deriving kappa values from real data and applying separate fits for different classes of solar activity and local time periods, the modeling accuracy can be enhanced. This study shows the necessity of tailored kappa corrections for different ionospheric conditions, improving techniques for correction of RIEs in GNSS-RO data. 

References

Healy,S.B., & Culverwell,I.D. (2015). A modification to the standard ionospheric correction method used in GPS radio occultation. Atmospheric Measurement Techniques, 8(8), 3385–3393.https://doi.org/10.5194/amt-8-3385-2015

Angling,M.J., Elvidge S., & Healy,S.B. (2018). Improved model for correcting the ionospheric impact on bending angle in radio occultation measurements. Atmospheric Measurement Techniques, 11(4), 2213–2224.https://doi.org/10.5194/amt-11-2213-2018

How to cite: Park, J., Chang, J., Sun, K., and Lee, J.: Residual Ionospheric Error Correction in GNSS Radio Occultation Bending Angles: Parametric Analysis using Electron Density Profiles Derived from COSMIC-II Data, EGU General Assembly 2025, Vienna, Austria, 27 Apr–2 May 2025, EGU25-18658, https://doi.org/10.5194/egusphere-egu25-18658, 2025.

EGU25-19045 | ECS | Orals | G5.1

AI for GNSS Reflectometry: Setting a New Benchmark for Earth Surface and Atmospheric Monitoring 

Milad Asgarimehr, Daixin Zhao, Tianqi Xiao, Hamed Izadgoshasb, and Jens Wickert

GNSS Reflectometry (GNSS-R) satellite constellations offer unprecedentedly large datasets. This creates a unique opportunity to harness the power of AI for Earth system monitoring using GNSS-R. By using these vast datasets, AI models can “learn” effectively and adaptively. The AI for GNSS-R (AI4GNSS-R) project unlocks the potential of deep learning to produce high-quality and innovative data products.

Previously, we introduced CyGNSSnet, a deep learning model based on a CNN-LSTM architecture, which achieved an RMSE of 1.36 m/s—representing a substantial 28% improvement over the officially operational retrieval algorithm. Building on this success, we now present an advanced version of the model that incorporates external precipitation data through data fusion. This enhanced approach achieves an RMSE of 1.57 m/s for rain-affected data, significantly improving wind speed predictions under extreme weather conditions. For land monitoring, we demonstrate the retrieval of Vegetation Water Content (VWC) from GNSS-R data. Using architectures such as LeNet, our models achieve RMSEs below 0.6 kg/m² compared to SMAP VWC data, validating GNSS-R's capability for  global vegetation moisture monitoring. A highlight of our research is the development of a GNSS-R general foundation model using self-supervised learning. This model facilitates the fusion of multimodal data and enables scalable and accurate retrieval of variety of parameters such as wind speed, soil moisture, and VWC with limited labeled data. Our findings emphasize the scalability, adaptability, and applicability of next-generation AI models for GNSS-R. These advancements establish a new benchmark for the achievable quality and extends application spectrum of spaceborne GNSS-R.

How to cite: Asgarimehr, M., Zhao, D., Xiao, T., Izadgoshasb, H., and Wickert, J.: AI for GNSS Reflectometry: Setting a New Benchmark for Earth Surface and Atmospheric Monitoring, EGU General Assembly 2025, Vienna, Austria, 27 Apr–2 May 2025, EGU25-19045, https://doi.org/10.5194/egusphere-egu25-19045, 2025.

EGU25-20963 | ECS | Posters on site | G5.1

Evaluating the Performance of Numerical Weather Prediction Models for Precipitation and Temperature in Luxembourg and the Greater Region: Insights from WRF and WRFDA 3D-Var 

Haseeb Ur Rehman, Felicia Norma Teferle, Addisu Hunegnaw, Guy Schumann, Jens Wickert, Florian Zus, and Rohith Muraleedharan Thundathil

Compared to alluvial floods, flash or pluvial floods are difficult to predict because they result from intense and brief periods of extreme precipitation. Luxembourg has a history of being impacted by floods, with notable occurrences in January 2011, May 2016, December 2017, January 2018, February 2019, and February 2020. However, July 2021 stands out as the most severe flood year on record in the region. In this study we aim to develop, a high-resolution numerical weather predicRon (NWP) model for effective local heavy rainfall prediction in a nowcasting scenario and provide real-time for flood simulation. The modeling relies on the Weather Research and ForecasRng (WRF) model, which incorporates local Global Navigation Satellite System (GNSS) zenith total delays and precipitation observations to simulate small-scale, high-intensity convective precipitation. As part of this, we will also test run the LISFlood flood model in an operational inundation forecast mode, meaning that the flood model will be run with the WRF precipitation forecasts as inputs. The WRF model was configured for the Greater Region, utilizing a horizontal grid resolution of 12 km and incorporating high-resolution static datasets. Meteorological data, i.e., June 20 -July 20, 2021, from the Global Forecast System (GFS) were employed in the model setup as initial boundary condition. Zenith Total Delay (ZTD) data collected from various GNSS stations (245) across Germany and Luxembourg were assimilated into the model. Additionally, observational datasets, including Surface Synoptic Observations (SYNOP), Upper Air Data, Radiosonde measurements (TEMP), and Tropospheric Airborne Meteorological Data Reporting (TAMDAR) were assimilated. Following this integration, an sensitivity analysis of various meteorological parameters such as precipitation, surface temperature (T2), and relative humidity was performed.

How to cite: Rehman, H. U., Teferle, F. N., Hunegnaw, A., Schumann, G., Wickert, J., Zus, F., and Muraleedharan Thundathil, R.: Evaluating the Performance of Numerical Weather Prediction Models for Precipitation and Temperature in Luxembourg and the Greater Region: Insights from WRF and WRFDA 3D-Var, EGU General Assembly 2025, Vienna, Austria, 27 Apr–2 May 2025, EGU25-20963, https://doi.org/10.5194/egusphere-egu25-20963, 2025.

EGU25-1294 | Posters on site | ESSI2.13

A new sub-chunking strategy for fast netCDF-4 access in local, remote and cloud infrastructures.  

Flavien Gouillon, Cédric Penard, Xavier Delaunay, and Sylvain Herlédan

NetCDF (Network Common Data Form) is a self-describing, portable and platform-independent format for array-oriented scientific data which has become a community standard for sharing measurements and analysis results in the fields of oceanography, meteorology but also in the space domain.

The volume of scientific data is continuously increasing at a very fast rate. Object storage, a new paradigm that appeared with cloud infrastructures, can help with data storage and parallel access issues, but NetCDF may not be able to get the most out of this technology without some tweaks and fine tuning.

The availability of ample network bandwidth within cloud infrastructures allows for the utilization of large amounts of data. Processing data       where the data is located is preferable as it can result in substantial resource savings. But for some use cases downloading data from the cloud is required (e.g. processing also involving confidential data) and results still have to be fetched once processing tasks have been executed on the cloud.

Networks      exhibit significant variations in capacity and quality (ranging from fiber-optic and copper connections to satellite connections with poor reception in degraded conditions on boats, among other scenarios). Therefore, it is crucial for formats and software libraries to be specifically designed to optimize access to      data by minimizing the transfer to only what is strictly necessary.

In this context, a new approach has emerged in the form of a library that indexes the content of netCDF-4 datasets. This indexing enables the retrieval of sub-chunks, which are pieces of data smaller than a chunk, without the need to reformat the existing files. This approach targets access patterns such as time series in netCDF-4 datasets formatted with large chunks.

This report provides a performance assessment of netCDF-4 datasets for varied use cases. This assessment executes these use cases under various conditions, including POSIX and S3 local filesystems, as well as a simulated degraded network connection. The results of this assessment may provide guidance on the most suitable and most efficient library for reading netCDF data in different situations.

How to cite: Gouillon, F., Penard, C., Delaunay, X., and Herlédan, S.: A new sub-chunking strategy for fast netCDF-4 access in local, remote and cloud infrastructures. , EGU General Assembly 2025, Vienna, Austria, 27 Apr–2 May 2025, EGU25-1294, https://doi.org/10.5194/egusphere-egu25-1294, 2025.

EGU25-4155 | Orals | ESSI2.13

How open software, data and platforms are transforming Earth observation data science 

Wolfgang Wagner, Matthias Schramm, Martin Schobben, Christoph Reimer, and Christian Briese

One of the most time-consuming and cumbersome tasks in Earth observation data science is finding, accessing and pre-processing geoscientific data generated by satellites, ground-based networks, and Earth system models. While the much increased availability of free and open Earth observation datasets has made this task easier in principle, scientific standards have evolved according to data availability, now emphasizing research that integrates multiple data sources, analyses longer time series, and covers larger study areas. As a result of this “rebound effect”, scientists and students may find themselves spending even more of their time on data handling and management than in the past. Fortunately, cloud platform services such as Google Earth Engine can save significant time and effort. However, until recently, there were no standardized methods for users to interact with these platforms, meaning that code written for one service could not easily be transferred to another (Schramm et al., 2021). This created a dilemma for many geoscientists: should they use proprietary cloud platforms to save time and resources at the risk of lock-in effects, or rely on publicly-funded collaborative scientific infrastructures, which require more effort for data handling? In this contribution, we argue that this dilemma is about to become obsolete thanks to rapid advancements in open source tools that allow building open, reproducible, and scalable workflows. These tools facilitate access to and integration of data from various platforms and data spaces, paving the way for the “Web of FAIR data and services” as envisioned by the European Open Science Cloud (Burgelman, 2021). We will illustrate this through distributed workflows that connect Austrian infrastructures with European platforms like the Copernicus Data Space Ecosystem and the DestinE Data Lake (Wagner et al., 2023). These workflows can be built using Pangeo-supported software libraries such as Dask, Jupyter, Xarray, or Zarr (Reimer et al., 2023). Beyond advancing scientific research, these workflows are also valuable assets for university education and training. For instance, at TU Wien, Jupyter notebooks are increasingly used in exercises involving Earth observation and climate data, and as templates for student projects and theses. Building on these educational resources, we are working on an Earth Observation Data Science Cookbook to be published on the Project Pythia website, a hub for education and training in the geoscientific Python community.

References

Burgelman (2021) Politics and Open Science: How the European Open Science Cloud Became Reality (the Untold Story). Data Intelligence 3, 5–19. https://doi.org/10.1162/dint_a_00069

Reimer et al. (2023) Multi-cloud processing with Dask: Demonstrating the capabilities of DestinE Data Lake (DEDL), Conference on Big Data from Space (BiDS’23), Vienna, Austria. https://doi.org/0.2760/46796

Schramm et al. (2021) The openEO API–Harmonising the Use of Earth Observation Cloud Services Using Virtual Data Cube Functionalities. Remote Sensing 13, 1125. https://doi.org/10.3390/rs13061125

Wagner et al. (2023) Federating scientific infrastructure and services for cross-domain applications of Earth observation and climate data, Conference on Big Data from Space (BiDS’23), Vienna, Austria. https://doi.org/10.34726/5309

How to cite: Wagner, W., Schramm, M., Schobben, M., Reimer, C., and Briese, C.: How open software, data and platforms are transforming Earth observation data science, EGU General Assembly 2025, Vienna, Austria, 27 Apr–2 May 2025, EGU25-4155, https://doi.org/10.5194/egusphere-egu25-4155, 2025.

EGU25-4277 | Posters on site | ESSI2.13

BEACON Binary Format (BBF) - Optimizing data storage and access to large data collections 

Tjerk Krijger, Peter Thijsse, Robin Kooyman, and Dick Schaap

As part of European projects, such as EOSC related Blue-Cloud2026, EOSC-FUTURE and FAIR-EASE, MARIS has developed and demonstrated a software system called BEACON with a unique indexing system that can, on the fly with high performance, extract data subsets based on the user’s request from millions of heterogeneous observational data files. The system returns one single harmonised file as output, regardless of whether the input contains many different data types or dimensions. 

Since in many cases the original data collections that are imported in a BEACON installment contain millions of files (e.g. Euro-Argo, SeaDataNet, ERA5, World Ocean Database), it is hard to achieve fast responses. Next to this, these large collections also require a large storage capacity. To mitigate these issues, we wanted to optimize the internal file format that is used within BEACON. With the aim of reducing the data storage size and speeding up the data transfer, while guaranteeing that the information of the original data files is maintained. As a result, the BEACON software has included a unique file format called the “BEACON Binary Format (BBF)” that meets these requirements. 

The BBF is a binary data format that allows for storing multi-dimensional data as apache arrow arrays with zero deserialization costs. This means that computers can read the data stored on disk, as if it were computer memory, significantly reducing computational access time by eliminating the cost for a computer to translate what’s on disk, to computer memory.

Together with making the entire data format “non-blocking”, which means that all computer cores can access the file at the same time and simultaneously use the jump table to read millions of datasets in parallel. This enables a level of performance which reaches speeds of multiple GB/s, making the hardware the bottleneck instead of the software.

Furthermore, the format takes a unique approach to compressing data by adjusting the way it compresses and decompresses on a per dataset level. This means that every dataset is compressed in a slightly different manner, making it much more effective in terms of size reduction and time to decompress the data which can get close to the effective memory speed of a computer.

It does this while retaining full data integrity. No data is ever lost within this format, nor is any data adjusted. If one were to import a NetCDF file into BBF, one could fully rebuild the original NetCDF file from the BBF file itself. In the presentation the added benefits of using the BBF will be highlighted by comparing and benchmarking it to traditional formats such as NetCDF, CSV, ASCII, etc.

In January 2025, BEACON 1.0.0 was made publicly available as an open-source software, allowing everyone to set-up their own BEACON node to enhance the access to their data, while at the same time being able to reduce the storage size of their entire data collection without losing any information. More technical details, example applications and general information on BEACON can be found on the website https://beacon.maris.nl/.

How to cite: Krijger, T., Thijsse, P., Kooyman, R., and Schaap, D.: BEACON Binary Format (BBF) - Optimizing data storage and access to large data collections, EGU General Assembly 2025, Vienna, Austria, 27 Apr–2 May 2025, EGU25-4277, https://doi.org/10.5194/egusphere-egu25-4277, 2025.

EGU25-5977 | Orals | ESSI2.13

A comparative study of algorithms for lossy compression of 2-d meteorological gridded fields 

Uwe Ehret, Jieyu Chen, and Sebastian Lerch

Meteorological observations (e.g. from weather radar) and the output of meteorological models (e.g. from reanalyses or forecasts) are often stored and used in the form of time series of 2-d spatial gridded fields. With increasing spatial and temporal resolution of these products, and with the transition from providing single deterministic fields to providing ensembles, their size has dramatically increased, which makes use, transfer and archiving a challenge. Efficient compression of such fields - lossy or lossless - is required to solve this problem.

The goal of this work was therefore to apply several lossy compression algorithms for 2d spatial gridded meteorological fields, and to compare them in terms of compression rate and information loss compared to the original fields. We used five years of hourly observations of rainfall and 2m air temperature on a 250 x 400 km region over central Germany on a 1x1 km grid for our analysis.

In particular, we applied block averaging as a simple benchmark method, Principal Component Analysis, Autoencoder Neural Network (Hinton and Salakhutdinov, 2006) and the Ramer-Douglas-Peucker algorithm (Ramer, 1972; Douglas and Peucker, 1973) known from image compression. Each method was applied for various compression levels, expressed as the number of objects of the compressed representation, and then the (dis-)similarity of the original field and the fields reconstructed from the compressed fields was measured by Mean Absolute Error, Mean Square Error, and the Image Quality Index (Wang and Bovik, 2002). First results indicate that even for spatially heterogeneous fields like rainfall, very high compression can be achieved with small error.


References

Douglas, D., Peucker, T.: Algorithms for the reduction of the number of points required to represent a digitized line or its caricature. In: The Canadian Cartographer. Bd. 10, Nr. 2, 1973, ISSN 0008-3127, S. 112–122, 1973.

Hinton, G. E., & Salakhutdinov, R. R.: Reducing the dimensionality of data with neural networks. science, 313(5786), 504-507, 2006.

Ramer, U.: An iterative procedure for the polygonal approximation of plane curves, Computer Graphics and Image Processing, 1, 244-256, http://dx.doi.org/10.1016/S0146-664X(72)80017-0, 1972.

Zhou Wang, and A. C. Bovik: A universal image quality index, IEEE Signal Processing Letters, 9, 81-84, 10.1109/97.995823, 2002.

How to cite: Ehret, U., Chen, J., and Lerch, S.: A comparative study of algorithms for lossy compression of 2-d meteorological gridded fields, EGU General Assembly 2025, Vienna, Austria, 27 Apr–2 May 2025, EGU25-5977, https://doi.org/10.5194/egusphere-egu25-5977, 2025.

EGU25-7371 | ECS | Orals | ESSI2.13

Evaluating Advanced Scientific Compressors on Climate Datasets 

Robert Underwood, Jinyang Liu, Kai Zhao, Sheng Di, and Franck Cappello

    As climate and weather scientists strive to increase accuracy and understanding of our world, models of weather and climate have increased in their resolution to square kilometers scale and become more complex increasing their demands for data storage. A recent study SCREAM run at 3.5km resolution produced nearly 4.5TB of data per simulated day, and the recent CMIP6 simulations produced nearly 28PB of data. At the same time, storage and power capacity at facilities conducting climate experiments are not increasing at the same rate as the volume of climate and weather datasets leading to a pressing challenge to reduce data volumes. While some in the weather and climate community have adopted lossless compression, these techniques frequently produce compression ratios on the order of 1.3$\times$, which are insufficient to alleviate storage constraints on facilities. Therefore, additional techniques, such as science-preserving lossy compression that can achieve higher compression ratios, are necessary to overcome these challenges.

    While data compression is an important topic for climate and weather applications, many of the current assessments of the effectiveness of climate and weather datasets do not consider the state of the art in compressor design and instead, asses scientific compressors that are 3-11 years old, substantially behind the state of the art. In this report: 


  •  We assess the current state of the art in advanced scientific lossy compressors against the state of the art in quality assessment criteria proposed for the ERA5 dataset to assess the current gaps between needed performance requirements and the capabilities of the current compressors.
  • We present new capabilities that allow us to build an automated, user-friendly, and extensible pipeline for quickly finding compressor configurations that maximize compression ratios while preserving scientific integrity of the data using codes developed as part of the NSF FZ project.
  • We demonstrate a number of capabilities that facilitate use within in the weather and climate community including NetCDF, HDF5, and GRIB file format support; support for innovation via Python, R, and Julia as well as low level languages such as C/C++; and the implementations of commonly used climate quality metrics including dSSIM, and the ability to extend to add new metrics in high-level languages
  • Utilizing this pipeline, We find that with advanced scientific compressors, it is possible to achieve a 6.4x improvement or more in compression ratio over previously evaluated compressors

How to cite: Underwood, R., Liu, J., Zhao, K., Di, S., and Cappello, F.: Evaluating Advanced Scientific Compressors on Climate Datasets, EGU General Assembly 2025, Vienna, Austria, 27 Apr–2 May 2025, EGU25-7371, https://doi.org/10.5194/egusphere-egu25-7371, 2025.

EGU25-11118 | Orals | ESSI2.13

Too Big to Handle? Hexagonizing LIDAR and Satellite Data in Geoscience Applications 

Bo Møller Stensgaard, Casper Bramm, Marie Katrine Traun, and Søren Lund Jensen

The exponential growth of LIDAR and satellite data in geoscience presents both opportunities and challenges for users. Traditional data handling methods often struggle with the sheer volume and complexity of these datasets, hindering easy accessibility, efficient analysis and decision-making processes. This presentation introduces the Scandinavian Highlands HEX-Responder platform and database structure, a cutting-edge solution that leverages the power of hexagonal discrete global grid system, Uber H3, and developed processes to revolutionize geospatial data management, fast responsive visualization and analysis.

We will showcase real-world applications, highlighting the platform's potential to accelerate scientific discovery and improve decision-making processes using satellite and remote sensing data.

The platform’s approach offers several advantages over conventional methods:

  • Efficient data organization and retrieval
  • Improved advanced spatial data analyses opportunities
  • Seamless integration of multi-scale and multi-dimensional data without losing information
  • Enhanced, responsive and fast visualisation capabilities

Our ELT (extract, load, transform) and subsequent visualisation procedure can be applied to any big raster data formats. First, the raw raster data is transformed into optimised parquet files through chunked reading and compression based on a low-resolution H3 hexagon cell index (hexagonization), enabling rapid data import to a column-oriented database management system for big data storage, processing and analytics. The H3 cell organisation is preserved in the database through partitioned fetching for visualisation on the platform. This method allows for horizontal scaling and accurate multi-resolution aggregation, preserving data integrity across scales and significantly overcomes typical computational memory limitations.

The platform's capabilities are exemplified by its approach to LIDAR and satellite emissivity data processing using the H3 grid. High-resolution LIDAR data is efficiently gridded and visualized to H3 resolution level 15 hexagons (0.9m2 hexagon cells). The gridding preserves all original pixel raster points while providing aggregated views for seamless zooming.

Another prime example of the capabilities is the handling of NASA’s ASTER Global Emissivity Data (100m resolution). Here, our pipeline transformed 2.1 terabytes of extracted raw CSV-data derived from NASA’s emissivity data into a compressed format based on the H3 index occupying only 593 gigabytes in the database.

This approach not only saves data storage space but also dramatically improves data accessibility and processing speed for the users, allowing users to work in a responsive environment with this massive dataset in ways previously not possible. Each hexagon represents an opportunity to store unlimited amount, types and categories of pre-processed data for more integrative analyses and data insight.

By hexagonizing LIDAR and satellite data, the HEX-Responder platform enables users to explore massive datasets with ease and efficiency in a responsive environment. The integrated procedures allow for detailed information maintenance and retrieval, paving the way for advanced predictive modelling in geoscience applications using earth observation data in a new way.  

How to cite: Stensgaard, B. M., Bramm, C., Traun, M. K., and Jensen, S. L.: Too Big to Handle? Hexagonizing LIDAR and Satellite Data in Geoscience Applications, EGU General Assembly 2025, Vienna, Austria, 27 Apr–2 May 2025, EGU25-11118, https://doi.org/10.5194/egusphere-egu25-11118, 2025.

EGU25-12760 | ECS | Posters on site | ESSI2.13

Tree-Based Adaptive Data Reduction Techniques for Scientific Simulation Data 

Niklas Böing, Johannes Holke, Achim Basermann, Gregor Gassner, and Hendrik Fuchs

Large-scale Earth system model simulations produce huge amounts of data. Due to limited I/O bandwidth and available storage space this data often needs to be reduced before written to disk or stored permanently. Error-bounded lossy compression is an effective approach to tackle the trade-off between accuracy and storage space.

We are exploring and discussing lossless as well as error-bounded lossy compression based on tree-based adaptive mesh refinement/coarsening (AMR) techniques. Our lossy compression schemes allow for absolute and relative error bounds. The data reduction methods are closely linked to an underlying (adaptive) mesh which easily permits error regions of different error tolerances and criteria – in particular, we allow nested domains of varying error tolerances specified by the user. Moreover, some of the compressed data structures allow for an incremental decompression in the resolution of the data which may be favorable for transmission and visualization.

We implement these techniques as the open source tool cmc, which is based on the parallel AMR library t8code. The compression tool can be linked to and used by arbitrary simulation applications or executed as a post-processing step. We show different application results of the compression in comparison to current state-of-the-art compression techniques on several benchmark data sets.

How to cite: Böing, N., Holke, J., Basermann, A., Gassner, G., and Fuchs, H.: Tree-Based Adaptive Data Reduction Techniques for Scientific Simulation Data, EGU General Assembly 2025, Vienna, Austria, 27 Apr–2 May 2025, EGU25-12760, https://doi.org/10.5194/egusphere-egu25-12760, 2025.

EGU25-13394 | ECS | Orals | ESSI2.13

Challenges and perspectives of climate data compression in times of kilometre-scale models and generative machine learning 

Milan Klöwer, Tim Reichelt, Juniper Tyree, Ayoub Fatihi, and Hauke Schulz

Climate data compression urgently needs new standards. The continuously growing exascale mountain of data requires compressors that are widely used and supported, essentially hiding the compression details from many users. With the advent of AI revolutionising scientific computing, we have to set the rules of this game. Minimizing information loss, maximising compression factors, at any resolution, grid and dataset size, for all variables, with chunks and random access, while preserving all statistics and derivatives, at a reasonable speed — are squaring the compression circle. Many promising compressors are hardly used as trust among domain scientists is hard to gain: The large spectrum of research questions and applications using climate data is very difficult to satisfy simultaneously.

Here, we illustrate the motivation behind the newly defined climate data compression benchmark ClimateBenchPress, designed as a quality check in all those dimensions of the problem. Any benchmark will inevitably undersample this space, but we define datasets from atmosphere, ocean, and land as well as evaluation metrics to pass. Results are presented as score cards, highlighting strengths and weaknesses for every compressor.

The bitwise real information content shows a systematic way in case no error bounds are known. In the case of the ERA5 reanalysis, errors are estimated and allow us to categorize many variables into linear, log and beta distributions with values bounded from zero, one or both sides, respectively. This allows us to define error thresholds arising from observation and model errors directly, providing another alternative to the still predominant subjective choices. Most error-bounded compressors come with parameters that can be automatically chosen following this analysis.

Also new data formats are on the horizon: Chunking and hierarchical data structures allow and force us to adapt compressors to spatially or length-scale dependent information densities. Extreme events, maybe counterintuitively, often increase the compressibility through higher uncertainties, but lie on the edge or outside of the training data for machine learned-compressors. This again increases the need for well-tested compressors. Benchmarks like ClimateBenchPress are required to encourage new standards for safe lossy climate data compression.

How to cite: Klöwer, M., Reichelt, T., Tyree, J., Fatihi, A., and Schulz, H.: Challenges and perspectives of climate data compression in times of kilometre-scale models and generative machine learning, EGU General Assembly 2025, Vienna, Austria, 27 Apr–2 May 2025, EGU25-13394, https://doi.org/10.5194/egusphere-egu25-13394, 2025.

EGU25-13567 | Posters on site | ESSI2.13

Tables as a way to deal with a variety of data formats and APIs in data spaces 

Joan Masó, Marta Olivé, Alba Brobia, Nuria Julia, Nuria Cartell, and Uta Wehn

The Green Deal Data Space is born in the big data paradigm where there is a variety of data formats and data models that are exposed as files or web APIs. As a result, we need to default in simple data structure that is transversal enough to be able to represent most of the more specific data models, formats and API payloads. Many data models present a structure that can be represented as tables.

TAPIS stands for "Tables from APIS". It is a JavaScript code that uses a common data model that is an array of objects with a list of properties that can contain a simple or a complex value. In TAPIS offers a series of operations that use one or more arrays of objects as inputs and produce a new array of objects as an output. There are operations that create the arrays of objects from files or API queries (a.k.a. data import), others that manipulate the objects (e.g. merge two arrays in a single one) and some operations that generate visual representations of the common data structure including tabular, a map, a graph, etc.

TAPIS is limited by its own data model. While many of the data models can be mapped to the common data model, a multidimensional data cube or a data tree cannot be represented in a single table in an efficient way. In the context of the Green Deal Data Space, most of the sensor data, statistical data, geospatial feature based data and administrative data can be considered object based data and can be used in TAPIS. TAPIS is able to connect to Sensor Things API (the sensor protocol selected in AD4GD and CitiObs), S3 buckets (the internal cloud repository used in AD4GD), GeoNetwork (the geospatial metadata catalogue selected in AD4GD and more4nature), and the OGC API features and derivates (the modern web API interfaces standardized by the OGC) but other data inputs will be incorporated, such as Citizen Science data sources and other popular APIs used in the more4nature project. More analytical functionalities are going to be incorporated in the CitiObs project. As part of the AD4GD Green Deal Information Model, there is an operation to associate semantics to each column of a table by linking it to a URI that defines the concept in an external vocabulary (as well as units of measure if appropriate). In order to be compatible with the data space architecture recommended by the International Data Space Association, we are working on supporting the catalogue of the Eclipse Data Connector, and to be able to negotiate a digital contract as a previous step to request access to the relevant data offered in the data space. To do so, we are working on incorporating the data space protocol as part of the TAPIS operations for data import. TAPIS is available as open source at https://github.com/joanma747/TAPIS.

AD4GD, CitiObs and more4nature are Horizon Europe projects co-funded by the European Union, Switzerland and the United Kingdom.

How to cite: Masó, J., Olivé, M., Brobia, A., Julia, N., Cartell, N., and Wehn, U.: Tables as a way to deal with a variety of data formats and APIs in data spaces, EGU General Assembly 2025, Vienna, Austria, 27 Apr–2 May 2025, EGU25-13567, https://doi.org/10.5194/egusphere-egu25-13567, 2025.

Early career scientists rarely have the resources to work with earth observation data at continental to global scale. This is caused by a combination of factors: large scale data analysis often involves teamwork, connecting data scientists, code developers, IT specialists, statisticians and geoscientists. Young researchers are rarely able to coordinate such a team. Meanwhile, all scientists can have relevant ideas or pose powerful research questions that merit investigation. Copernicus Data Space Ecosystem provides a public, free platform for large-scale processing of earth observation data. It combines instant access to all Sentinel satellite imagery with cloud-based processing in the form of API requests and a powerful browser-based viewing interface. This new approach is enabled by storing the data in a different way: uncompressed formats such as JPEG2000, COG or ZARR support subsetting and querying the image rasters without first unzipping the file, thereby allowing direct streaming of only the area and bands that the user requests. Additionally, this means that most calculations and visualization tasks can be carried out on the server side, directly within the request process. The backend tasks of data storage and management are taken care of by the system, while the user can concentrate on the research itself.

Copernicus Data Space Ecosytem supports several API families. OGC API-s directly enable the creation of Open Geospatial Consortium compatible map products such as WMS, WMTS, WFS or WCS services. These can be accessed with GIS software or displayed in web map tools. OData, STAC, and OpenSearch are Catalog API-s, supporting the querying and of datasets in preparation for analysis. Sentinel Hub is an API family that can handle queries, raster operations, and raster-vector integration for deriving statistics. The main advantages of Sentinel Hub API-s are their efficient use and integration with advanced visualization in the Copernicus Browser.

OpenEO is a fully open-source data analysis framework designed specifically to support FAIR principles. It is independent from data formats with its own data cube format, and can be edited using several coding languages. openEO connects to all STAC-compliant repositories, enabling integration between Sentinel data and other sources. Processing tools include many mathematical operations, but also standard machine learning processes. The system is designed with upscaling in mind: the command structure is the same for small and large areas, with storage and asynchronous processing managed by the backend.

Both API families come with a comprehensive scheme of tutorials and documentation to allow step-by-step learning, and an online Jupyter Lab virtual machine facility. Therefore, early-career scientists with a basic understanding of programming can quickly learn to apply their domain knowledge, while creating solutions that are easy to share and replicate.

All in all, Copernicus Data Space Ecosystem is a transformative tool for earth observation, significantly lowering the bar for applying earth observation at large scale in the geosciences.

How to cite: Zlinszky, A. and Milcinski, G.: Copernicus Data Space Ecosystem empowers early-career scientists to do global scale earth observation data analysis, EGU General Assembly 2025, Vienna, Austria, 27 Apr–2 May 2025, EGU25-15282, https://doi.org/10.5194/egusphere-egu25-15282, 2025.

EGU25-15672 | ECS | Posters on site | ESSI2.13

Scaling Down ESS Datasets: Lessons from the EERIE Project on Compression 

Oriol Tinto, Xavier Yepes, and Pierre Antoine Bretonniere

The rapid growth of Earth System Sciences (ESS) datasets, driven by high-resolution numerical modeling, has outpaced storage and data-sharing capabilities. To address these challenges, we investigated lossy compression techniques as part of the EERIE project, aiming to significantly reduce storage demands while maintaining the scientific validity of critical diagnostics.

Our study examined two key diagnostics: Sea Surface Height (SSH) variability and ocean density, essential for understanding climate dynamics. Leveraging tools such as SZ3 and enstools-compression, we achieved data volume reductions by orders of magnitude without compromising the diagnostics' accuracy. Compression-induced differences were found to be negligible compared to the inherent variability between model outputs and observational datasets, underscoring the robustness of these methods.

Additionally, our work highlighted inefficiencies in current workflows, including the prevalent use of double precision in post-processing. We proposed improvements to align data precision with the original model outputs, further optimizing storage and computation. Integrating lossy compression into existing workflows via widely used formats like NetCDF and HDF5 demonstrates a practical path forward for sustainable ESS data management.

This study showcases the transformative potential of lossy compression to make high-resolution datasets more manageable, ensuring they remain accessible and scientifically reliable for stakeholders while significantly reducing resource demands.

How to cite: Tinto, O., Yepes, X., and Bretonniere, P. A.: Scaling Down ESS Datasets: Lessons from the EERIE Project on Compression, EGU General Assembly 2025, Vienna, Austria, 27 Apr–2 May 2025, EGU25-15672, https://doi.org/10.5194/egusphere-egu25-15672, 2025.

EGU25-15864 | Posters on site | ESSI2.13

The Sentinels EOPF Toolkit: Driving Community Adoption of the Zarr data format for Copernicus Sentinel Data 

Sabrina H. Szeto, Julia Wagemann, Emmanuel Mathot, and James Banting

The Standard Archive Format for Europe (SAFE) specification has been the established approach to publishing Copernicus Sentinel data products for over a decade. While SAFE has pushed the ecosystem forward through new ways to search and access the data, it is not ideal for processing large volumes of data using cloud computing. Over the last few years, data standards like STAC and cloud-native data formats like Zarr and COGs have revolutionised how scientific communities work with large-scale geospatial data and are becoming a key component of new data spaces, especially for cloud-based systems.

The ESA Copernicus Earth Observation Processor Framework (EOPF) will be providing access to “live” sample data from the Copernicus Sentinel missions -1, -2 and -3 in the new Zarr data format. This set of reprocessed data allows users to try out accessing and processing data in the new format and experiencing the benefits thereof with their own workflows.

This presentation introduces a community-driven toolkit that facilitates the adoption of the Zarr data format for Copernicus Sentinel data. The creation of this toolkit was driven by several motivating questions: 

  • What common challenges do users face and how can we help them overcome them? 
  • What resources would make it easier for Sentinel data users to use the new Zarr data format? 
  • How can we foster a community of users who will actively contribute to the creation of this toolkit and support each other?

The Sentinels EOPF Toolkit team, comprising Development Seed, SparkGeo and thriveGEO, together with a group of champion users (early-adopters), are creating a set of Jupyter Notebooks and plug-ins that showcase the use of Zarr format Sentinel data for applications across multiple domains. In addition, community engagement activities such as a notebook competition and social media outreach will bring Sentinel users together and spark interaction with the new data format in a creative yet supportive environment. Such community and user adoption efforts are necessary in order to overcome adoption and uptake barriers and to build up trust and excitement to try out new technologies and new developments around data spaces.

In addition to introducing the Sentinels EOPF Toolkit, this presentation will also highlight lessons learned from working closely with users on barriers they face in adopting the new Zarr format and how to address them. 

How to cite: Szeto, S. H., Wagemann, J., Mathot, E., and Banting, J.: The Sentinels EOPF Toolkit: Driving Community Adoption of the Zarr data format for Copernicus Sentinel Data, EGU General Assembly 2025, Vienna, Austria, 27 Apr–2 May 2025, EGU25-15864, https://doi.org/10.5194/egusphere-egu25-15864, 2025.

EGU25-16791 | ECS | Posters on site | ESSI2.13

Development and performance evaluation of dissolved oxygen climatology in the Northwestern Pacific 

Jae-Ho Lee, Yong Sun Kim, and Sung-Dae Kim

This study developed a monthly regional atlas for dissolved oxygen (DO) with a quarter-degree horizontal resolution and 73 vertical levels over the northwestern Pacific. We used observed profiles of 586,851 and gridded World Ocean Atlas 2023 (WOA23) with 1° resolution by adopting simple kriging horizontal interpolation and vertical stabilizing techniques to produce the new atlas. This approach efficiently mitigates artificial water masses and statistical noise. The new DO climatology provides detailed information along coasts and renders realistic oxygen distribution associated with the current system in the western North Pacific compared to WOA23. A meridional section demonstrates that the newly developed atlas does not yield artificial noise-like spikes frequently observed in WOA23 in the East Sea. This study expects that this new atlas can allow bio-geochemical numerical models to enhance diagnostic and forecasting performance.

How to cite: Lee, J.-H., Kim, Y. S., and Kim, S.-D.: Development and performance evaluation of dissolved oxygen climatology in the Northwestern Pacific, EGU General Assembly 2025, Vienna, Austria, 27 Apr–2 May 2025, EGU25-16791, https://doi.org/10.5194/egusphere-egu25-16791, 2025.

EGU25-17102 | Posters on site | ESSI2.13

Calculation of Gridded Surface Current from Observed Lagrangian Trajectories in the East Sea 

Mi-Jin Jang, Jae-Ho Lee, and Yong Sun Kim

Surface ocean current is crucial for enhancing the safety and efficiency of maritime logistics and transportation, boosting fisheries production and management, and supporting military operations. This study analyzed 25,342 trajectories from NOAA’s Global Drifter Program (1991–2020), 12 from KIOST, and 63 from KHOA (2015–2024). The surface drifters entering the East Sea were extracted, and a five-step quality control process was implemented. Unobserved values were removed, quality control was applied based on drogue lost, abnormally speed or stuck, unrealistic acceleration. To estimated the gridded oceanic current with high-resolution, we removed the Ekman current and tides from the observed velocity and took advantage of a simple kriging approach. The validation against existing datasets confirmed that major ocean currents exhibited similar patterns compared to absolute geostrophic current from the satellite-based altimetry. The constructed dataset is expected to contribute to the accurate identification of surface current movements and the development of realistic models that incorporate regional characteristics based on data assimilation.

How to cite: Jang, M.-J., Lee, J.-H., and Kim, Y. S.: Calculation of Gridded Surface Current from Observed Lagrangian Trajectories in the East Sea, EGU General Assembly 2025, Vienna, Austria, 27 Apr–2 May 2025, EGU25-17102, https://doi.org/10.5194/egusphere-egu25-17102, 2025.

The Copernicus Program is the largest and most successful public space program globally. It provides continuous data across various spectral ranges, with an archive exceeding 84 petabytes and a daily growth of approximately 20 TB, both of which are expected to increase further. The openness of its data has contributed to the widespread use of Earth observation and the development of commercial products utilizing open data in Europe and worldwide. The entire archive, along with cloud-based data processing capabilities, is available free of charge through the Copernicus Data Space Ecosystem initiative and continues to evolve to meet global user standards. 

This paper presents the process of creating the STAC Copernicus Data Space Ecosystem catalog—the largest and most comprehensive STAC catalog in terms of metadata globally. It details the workflow, starting from the development of a metadata model for Sentinel data, through efficient indexing based on the original metadata files accompanying the products, to result validation and backend system ingestion (via database DSN). A particular highlight is that this entire process is executed using a single tool, eometadatatool, initially developed by DLR, further enhanced, and released as open-source software by the CloudFerro team. The eometadatatool facilitates metadata extraction from the original files accompanying Copernicus program products and others (e.g., Landsat, Copernicus Contributing Missions) using a CSV file containing the metadata name, the file in which it occurs, and the path to the key within the file. Since the CDSE repository operates as an S3 resource offering users free access, the tool supports product access via S3 resources by default, configurable through environment variables. All the above characterizes eometadatatool as the most powerful stactool (a high-level command-line tool and Python library for working with STAC) package available, providing both valid STAC items and a method for uploading them to the selected backend. 

The standard specification itself has been influenced by the CDSE catalog development process, which contributed to the evolution of the standard by introducing version 1.1 and updated extensions (storage, eo, proj) that better meet user needs. The paper discusses the most significant modifications, their impact on the catalog’s functionality, and outlines the main differences. 

Particular attention is given to performance optimization due to the substantial data volume and high update frequency. The study examines the configuration and performance testing (using Locust) of the frontend layer (stac-fastapi-pgstac) and backend (pgstac). The stac-fastapi-pgstac implementation was deployed on a scalable Kubernetes cluster and underwent a product hydration process (specific to managing JSON data in pgstac), leveraging Python's native capabilities for this task. The pgstac schema was deployed on a dedicated bare-metal server with a PostgreSQL database, utilizing master-worker replication enabled through appropriate pgstac configuration. Both software tools are open source, and the achieved optimal configurations are documented and will be presented in detail. 

The presented solution empowers the community to fully utilize the new catalog, leverage its functionalities, and access open tools that enable independent construction of STAC catalogs compliant with ESA and community recommendations. 

How to cite: Niemyjski, M. and Musiał, J.: Building the Copernicus Data Space Ecosystem STAC Catalog: Methodologies, Optimizations, and Community Impact, EGU General Assembly 2025, Vienna, Austria, 27 Apr–2 May 2025, EGU25-17171, https://doi.org/10.5194/egusphere-egu25-17171, 2025.

EGU25-17172 | ECS | Orals | ESSI2.13

Neural Embedding Compression for Earth Observation Data – an Ablation Study 

Amelie Koch, Isabelle Wittmann, Carlos Gomez, Rikard Vinge, Michael Marszalek, Conrad Albrecht, and Thomas Brunschwiler

The exponential growth of Earth Observation data presents challenges in storage, transfer, and processing across fields such as climate modeling, disaster response, and agricultural monitoring. Efficient compression algorithms—either lossless or lossy—are critical to reducing storage demands while preserving data utility for specific applications. Conventional methods, such as JPEG and WebP, rely on hand-crafted base functions and are widely used. However, Neural Compression, a data-driven approach leveraging deep neural networks, has demonstrated superior performance by generating embeddings suitable for high levels of entropy encoding, enabling more accurate reconstructions at significantly lower bit rates.

In our prior work, we developed a Neural Compression pipeline utilizing a masked auto-encoder, embedding quantization, and an entropy encoder tailored for satellite imagery [1]. Instead of reconstructing original images, we evaluated the reconstructed embeddings for downstream tasks such as image classification and semantic segmentation. In this study, we conducted an ablation analysis to quantify the contributions of individual pipeline components—encoder, quantizer, and entropy encoder—toward the overall compression rate. Our findings reveal that satellite images achieve higher compression rates compared to ImageNet samples due to their lower entropy. Furthermore, we demonstrate the advantages of learned entropy models over hand-crafted alternatives, achieving better compression rates, particularly for datasets with seasonal or geospatial coherence. Based on these insights, we provide a list of recommendations for optimizing Neural Compression pipelines to enhance their performance and efficiency.

This work was conducted under the Embed2Scale project, supported by the Swiss State Secretariat for Education, Research and Innovation (SERI contract no. 24.00116) and the European Union (Horizon Europe contract no. 101131841).

[1] C. Gomes and T. Brunschwiler, “Neural Embedding Compression for Efficient Multi-Task Earth Observation Modelling,” IGARSS 2024, Athens, Greece, 2024, pp. 8268-8273, doi: 10.1109/IGARSS53475.2024.10642535.

How to cite: Koch, A., Wittmann, I., Gomez, C., Vinge, R., Marszalek, M., Albrecht, C., and Brunschwiler, T.: Neural Embedding Compression for Earth Observation Data – an Ablation Study, EGU General Assembly 2025, Vienna, Austria, 27 Apr–2 May 2025, EGU25-17172, https://doi.org/10.5194/egusphere-egu25-17172, 2025.

EGU25-17326 | Orals | ESSI2.13

The UK EO DataHub - a pathfinder programme to develop a data space for UK industry, public and academic sectors 

Philip Kershaw, Rhys Evans, Fede Moscato, Dave Poulter, Alex Manning, Jen Bulpett, Ed Williamson, John Remedios, Alastair Graham, Daniel Tipping, and Piotr Zaborowski

The EO DataHub is a new national data space which has been under development as part of a two-year pathfinder programme to facilitate the greater exploitation of EO data for UK industry, public sector and academia. The project has been led by the UK National Centre for Earth Observation partnered with public sector bodies, the UK Space Agency, Met Office, Satellite Applications Catapult and National Physical Laboratory and enlisting commercial suppliers for the development and delivery of the software.

The Hub joins a crowded space in this sector as it joins a growing number of similar such platforms. However, as a national platform (with government as an anchor tenant) it is seeking to provide a unique offering as a trusted source of data, integrating curated data products from the science community building on UK strengths in climate research.

The architecture can be considered as a three layer model. At the base layer, different data sources are integrated - both commercial (Airbus and Planet Labs) and academic providers - from the CEDA data archive (https://archive.ceda.ac.uk) hosted on the JASMIN supercomputer (https://jasmin.ac.uk). The data catalogue now includes high and very high resolution SAR and optical products, Sentinel, UK Climate Projections, CMIP (https://wcrp-cmip.org), CORDEX (https://cordex.org) and outputs from EOCIS (https://eocis.org) consisting of a range of satellite-derived climate data products.

The middle layer, the Hub Platform provides services and APIs including federated search which integrates the data from the various providers, image visualisation, a workflow engine, user workspaces and interactive analysis environments. These build on the work of ESA's EOEPCA (https://eoepca.org) and apply open standards from the Open Geospatial Consortium and STAC (https://stacspec.org/) for cataloguing. In providing this suite of services, the goal is to provide a toolkit to facilitate application developers and EO specialists in building new applications and tools to exploit the data. This forms the final layer in the architecture: as part of the programme, three example application scenarios have been funded, each partnered with a target set of users. These include 1) an application taking climate projections and land surface temperature datasets to provide risk assessments for land assets (led by SparkGeo); 2) a land cover application (Spyrosoft) and finally 3), rather than an application in its own right, a project to develop a client toolkit for use with Jupyter Notebooks and a plugin integrating the Hub’s functionality into the open source GIS desktop application QGIS (work led by Oxidian).

Over the course of the programme, running in parallel to the system development, a dedicated study has been undertaken to develop a model for future sustainability of the platform tackling engagement with potential users and cost models. At the beginning, a funding call seeded early pilots to investigate application scenarios that the platform could support. As this initial phase of the Hub completes, work is underway to engage with early adopters and provide training resources for new users.

How to cite: Kershaw, P., Evans, R., Moscato, F., Poulter, D., Manning, A., Bulpett, J., Williamson, E., Remedios, J., Graham, A., Tipping, D., and Zaborowski, P.: The UK EO DataHub - a pathfinder programme to develop a data space for UK industry, public and academic sectors, EGU General Assembly 2025, Vienna, Austria, 27 Apr–2 May 2025, EGU25-17326, https://doi.org/10.5194/egusphere-egu25-17326, 2025.

EGU25-17799 | Posters on site | ESSI2.13

Data Spaces and geodata workflows for environmental protection 

Matthes Rieke, Benjamin Proß, Simon Jikra, Sotiris Aspragkathos, Iasonas Sotiropoulos, Stamatia Rizou, and Lisa Pourcher

The concept of Data Spaces has gained traction in recent years. Major representatives emerged which have the technological maturity as well as support by relevant decision and policy makers (e.g.  the International Data Spaces Association (IDSA) or Gaia-X). These follow different architectural approaches. In this session we want to illustrate the challenges of integrating the Data Space architectures with established concepts of Spatial Data Infrastructure.

During the next 4 years, the ENFORCE project (Empower citizeNs to join Forces with public authORities in proteCting the Environment) is dedicated to fostering sustainable practices and ensuring environmental regulatory compliance by integrating citizen science with innovative technologies. By employing Living Labs and citizen science methodologies, ENFORCE will create innovative tools that bridge the gap between data reporting, monitoring, and policy enforcement. The project integrates data collection (e.g. Copernicus satellite data), analysis, and stakeholder participation to meet these goals. ENFORCE will leverage geospatial intelligence and explainable AI to enhance environmental governance. These tools and strategies will be tested and refined at eight pilot sites in seven countries, supplemented by capacity-building and policy recommendation efforts.

The design and development of a geospatial information infrastructure that supports the envisioned data workflows is a key challenge addressed by ENFORCE. This infrastructure will prioritize the integration of OGC API-driven systems into the Data Space ecosystem, forming a central component of the project’s agenda. Through development of a blueprint architecture for integration, the project will identify gaps and missing components in current systems, aligning with standards such as the FAIR principles and open data. The concepts will be facilitated in an ENFORCE “Tools Plaza”, an innovative platform providing data science and analytical capabilities for environmental compliance workflows.

How to cite: Rieke, M., Proß, B., Jikra, S., Aspragkathos, S., Sotiropoulos, I., Rizou, S., and Pourcher, L.: Data Spaces and geodata workflows for environmental protection, EGU General Assembly 2025, Vienna, Austria, 27 Apr–2 May 2025, EGU25-17799, https://doi.org/10.5194/egusphere-egu25-17799, 2025.

EGU25-19418 | Posters on site | ESSI2.13

Lossy Data Compression Exploration in an Online Laboratory and the Link to HPC Design Decisions 

Karsten Peters-von Gehlen, Juniper Tyree, Sara Faghih-Naini, Peter Dueben, Jannek Squar, and Anna Fuchs

It is apparent that the data amounts expected to be generated by current and upcoming Earth System Science research and operational activities stress the capabilities of HPC and associated data infrastructures. Individual research projects focusing on running global Earth System Models (ESMs) at spatial resolution of 5km or less can easily occupy several petabytes on disk. With multiple of such projects running on a single HPC infrastructure, the challenge of storing the data alone becomes apparent. Further, community-driven activities like model intercomparison projects – which are conducted for both conventional and high-resolution model setups – add to the aforementioned strain on storage systems. Hence, when planning for next-generation HPC systems, the storage requirements of state-of-the-art ESM-centered projects have to be clear so that systems are still fit-for-use 5 years down the road from the initial planning stage.

As computational hardware costs per performance unit (FLOP or Byte) are not decreasing anymore like they have in the past decades, HPC system key figures do not increase substantially anymore from one generation to the next. The mismatch between demands of research and what future systems can offer is therefore clear.

One apparent solution to this problem is to simply reduce the amount of data from ESM simulations stored on a system. Data compression is one candidate to achieve this. Current ESM projects already utilize application-side lossless compression techniques, which help reduce storage space. However, decompression may incur performance penalties, especially when read patterns misalign with the compression block sizes. Lossy compression offers the potential for higher compression rates, without access penalties for data retrieval. However, its suitability is highly content-dependent, raising questions about which lossy compression methods are best suited for specific datasets. On a large scale, applying lossy compression also prompts the consideration of how such data reduction could shape the design of next-generation HPC architectures.

With lossy compression not being very popular in the ESM-community so far, we present a key development of the ongoing ESiWACE3 project: an openly accessible Jupyter-based online laboratory for testing lossy compression techniques on ESM output datasets. This online tool currently comes with a set of notebooks allowing users to objectively evaluate the impact lossy compression has on analyses performed on the compressed compared to the input data. With some compressors promising compression ratios of 10x-1000x, providing such tools to ensure compression quality is essential. The motivation behind the online compression laboratory is to foster the acceptance of lossy compression techniques by conveying first-hand experience and immediate feedback of benefits or drawbacks of applying lossy compression algorithms. 

Going one step further, we illustrate the impacts that applying lossy-compression techniques on ESM data on large-scales can have on the design decisions made for upcoming HPC infrastructures. We illustrate, among others, that increased acceptance and application of lossy compression techniques enables more efficient resource utilization and allows for smarter reinvestment of funds saved from reduced storage demands, potentially leading to the acquisition of smaller systems and thus enabling increased research output per resource used.

How to cite: Peters-von Gehlen, K., Tyree, J., Faghih-Naini, S., Dueben, P., Squar, J., and Fuchs, A.: Lossy Data Compression Exploration in an Online Laboratory and the Link to HPC Design Decisions, EGU General Assembly 2025, Vienna, Austria, 27 Apr–2 May 2025, EGU25-19418, https://doi.org/10.5194/egusphere-egu25-19418, 2025.

EGU25-20188 | ECS | Posters on site | ESSI2.13

Creating TROPOMI superobservations for data assimilation and model evaluation 

Pieter Rijsdijk, Henk Eskes, Kazuyuki Miyazaki, Takashi Sekiya, and Sander Houweling

Satellite observations of tropospheric trace gases and aerosols are evolving rapidly. Recently launched instruments provide increasingly higher spatial resolutions with footprint diameters in the range of 2–8 km, with daily global coverage for polar orbiting satellites or hourly observations from geostationary orbit. Often the modelling system has a lower spatial resolution than the satellites used, with a model grid size in the range of 10–100 km. When the resolution mismatch is not properly bridged, the final analysis based on the satellite data may be degraded. Superobservations are averages of individual observations matching the resolution of the model and are functional to reduce the data load on the assimilation system. In this paper, we discuss the construction of superobservations, their kernels and uncertainty estimates. The methodology is applied to nitrogen dioxide tropospheric column measurements of the TROPOMI instrument on the Sentinel-5P satellite. In particular, the construction of realistic uncertainties for the superobservations is non-trivial and crucial to obtaining close to optimal data assimilation results. We present a detailed methodology to account for the representativity error when satellite observations are missing due to e.g. cloudiness. Furthermore, we account for systematic errors in the retrievals leading to error correlations between nearby individual observations contributing to one superobservation. Correlation information is typically missing in the retrieval products where an error estimate is provided for individual observations. The various contributions to the uncertainty are analysed: from the spectral fitting, the estimate of the stratospheric contribution to the column and the air-mass factor. The method is applied to TROPOMI data but can be generalised to other trace gases such as HCHO, CO, SO2 and other instruments such as OMI, GEMS and TEMPO. The superobservations and uncertainties are tested in the ensemble Kalman filter chemical data assimilation system developed by JAMSTEC. These are shown to improve forecasts compared to thinning or compared to assuming fully correlated or uncorrelated uncertainties within the superobservation. The use of realistic superobservations within model comparisons and data assimilation in this way aids the quantification of air pollution distributions, emissions and their impact on climate.

How to cite: Rijsdijk, P., Eskes, H., Miyazaki, K., Sekiya, T., and Houweling, S.: Creating TROPOMI superobservations for data assimilation and model evaluation, EGU General Assembly 2025, Vienna, Austria, 27 Apr–2 May 2025, EGU25-20188, https://doi.org/10.5194/egusphere-egu25-20188, 2025.

EGU25-20430 | Orals | ESSI2.13

Compression and Aggregation: a CF data model approach 

David Hassell, Sadie Bartholomew, Bryan Lawrence, and Daniel Westwood

The CF (Climate and Forecast) metadata conventions for netCDF datasets describe means of "compression-by-convention", i.e. methods for compressing and decompressing data according to algorithms that are fully described within the conventions themselves. These algorithms, which can be lossless or lossy, are not applicable to arbitrary data, rather the data have to exhibit certain characteristics to make the compression worthwhile, or even possible.

Aggregation, available in CF-1.13, provides the utility of being able to view, as a single entity, a dataset that has been partitioned across multiple other independent datasets on disk, whilst taking up very little extra space on disk since the aggregation dataset contains no copies of the data in each component dataset. Aggregation can facilitate a range of activities such as data analysis, by avoiding the computational expense of deriving the aggregation at the time of analysis; archive curation, by acting as a metadata-rich archive index; and the post-processing of model simulation outputs, by spanning multiple datasets written at run time that together constitute a more cohesive and useful product. CF aggregation currently has cf-python and xarray implementations.

The conceptual CF data model does not recognise compression nor aggregation, choosing to view all CF datasets as if they were uncompressed and containing all of their own data. As a result, the cf-python data analysis library, that is built exactly on the CF data model, also presents datasets lazily to the user in this manner, without decompressing or re-combining the data in memory until the user actually accesses the data, at which time it occurs automatically. This approach allows the user to interact with their data in an intuitive and efficient manner; and also removes the need for the user to have to assimilate large parts of the CF conventions and having to create their own code for dealing with the compression and aggregation algorithms.

We will introduce compression by ragged arrays (as used by Discrete Sampling Geometry features, such as timeseries and trajectories) and dataset aggregation, with cf-python examples to demonstrate the ease of use that arises from using the CF data model interpretation of the data.

How to cite: Hassell, D., Bartholomew, S., Lawrence, B., and Westwood, D.: Compression and Aggregation: a CF data model approach, EGU General Assembly 2025, Vienna, Austria, 27 Apr–2 May 2025, EGU25-20430, https://doi.org/10.5194/egusphere-egu25-20430, 2025.

Integrating High-Performance Computing (HPC) and cloud computing in climate sciences is difficult, due to intricate hardware/software, compatibility, performance and reproducibility issues. Here, we address these challenges in a user-friendly way by leveraging the Conda ecosystem and containers.

Containerization allows to match or exceed native performance on HPC while ensuring bit-for-bit reproducibility for deterministic algorithms and similar processor architectures. This approach simplifies deploying climate models across different platforms; for example, CESM 2.2.2 (Community Earth System Model) provides on various clusters throughputs in simulated years per computational day within +/- 1% of bare-metal performance for simulations spanning thousands of processors.

Exclusively using generic Conda packages for MPI (Message Passing Interface) applications was challenging in HPC. Although OpenMPI included UCX (Universal Communication X) and OFI (Open Fabric Interface), it lacked UCC (Unified Collective Communication) and wasn't optimized by default for high-performance networks like InfiniBand, RoCE (Remote Direct Memory Access over Converged Ethernet) and HPE (Hewlett Packard Enterprise) Slingshot-11, often defaulting to TCP/IP (Transmission Control Protocol/Internet Protocol) or failing. 
 
After updating Conda-Forge’s OpenMPI and MPICH feedstocks, we are adding MVAPICH and ParaStationMPI support to PnetCDF, HDF5, NetCDF-C, NetCDF-Fortran and ESMF (Earth System Modeling Framework) libraries critical for modellers, alongside libFabric and openPMIx (Process Management Interface - Exascale). This incidentally exposed ABI (Application Binary Interface) compatibility issues. Now, MPI toolchains featuring major UCX/OFI/PMIx versions ensure consistent operation across different hosts without affecting numerical results. Using the same Conda environment inside a container, and no hardware-specific optimization, preserves bitwise reproducibility. OMB (Ohio State University Micro-Benchmark) tests for latency, bandwidth and other metrics help confirm if optimal performance can be achieved or not. 

Such developments enable climate scientists to focus on addressing scientific questions rather than sorting out software dependencies and technical problems. One can write code on a laptop then effortlessly scale to cloud or supercomputers, and seamlessly run climate simulations somewhere then continue these wherever compute resources are available without worrying about discontinuities. This also releases expensive HPC resources for production instead of wasting them for training, learning, development or testing which can be performed comfortably elsewhere, without job scheduling constraints, in the very same software environment.

Conda has primarily been developed with a focus on compatibility which limits its suitability in highly performance-sensitive applications where locally optimized builds of specific key components are paramount, typically in climate modeling. Additionally, instead of relying on local engineers to install and maintain host software, Conda users can benefit from the work of thousands of open-source contributors who continuously update and test the entire ecosystem.

This strategy fits the session's theme by providing a framework where cloud resources can be utilized for big data without compromising the performance or rigor of HPC environments. Conda and container technologies ought to change how climate scientists approach software management, focusing on ease of use, scalability and reproducibility, thereby potentially altering practices within the field to improve usage of computational resources and leverage community efforts to remain at the forefront.

How to cite: Iaquinta, J., Fouilloux, A., and Ragan-Kelley, B.: Climate Modeling with Conda and Containers to Improve Computational Resource Usage while Achieving Native Performance and Reproducibility, EGU General Assembly 2025, Vienna, Austria, 27 Apr–2 May 2025, EGU25-2605, https://doi.org/10.5194/egusphere-egu25-2605, 2025.

EGU25-6798 | Orals | ESSI2.15

Advancing Geophysical Data Analysis: HEALML for Efficient Sphere-Based Statistics on Pangeo-EOSC 

Jean-Marc Delouis, Erwan Allys, Justus Mangin, Louise Mousset, and Tina Odaka

A significant challenge in data integration and ML methodologies on cloud infrastructures is accurately determining correlated statistics. Initially, aligning data to a consistent pixel grid is essential, motivating the use of Discrete Global Grid Systems (DGGS). In geophysical studies, data reside on a sphere, and approximating with tangent planes can distort results. Our solution is the HEALPix pixelization as our DGGS framework, standardizing data on a common grid for consistent statistical analysis. HEALPix's unique features, such as its iso-latitude layout and uniform pixel areas, enable the use of spin-weighted spherical harmonics in managing vector fields. This enables the accurate calculation of  correlation statistics, such as between velocity and scalar fields on the sphere, while minimizing biases due to spherical approximations. By utilizing the HEALPix framework, known in cosmology, with TensorFlow or PyTorch as backends, we created the: HEALML library. This library facilitates gradient computations of all derived statistics for AI optimization, and has been validated on the Pangeo-EOSC platform. This library parallelizes the computation of localized spherical harmonics and includes features like scattering covariance calculations, allowing the extraction of more complex nonlinear statistics beyond the power spectrum. We compare these results to traditional 2D planar methods, demonstrating the advantages of sphere-based statistics on platforms like Pangeo-EOSC. Furthermore, we demonstrate: HEALML's ability to emulate using a substantially smaller dataset. This demonstration emphasizes the ways in which incorporating spherical statistical methods into Pangeo-EOSC fosters innovative and efficient statistical analysis within geophysical research.

How to cite: Delouis, J.-M., Allys, E., Mangin, J., Mousset, L., and Odaka, T.: Advancing Geophysical Data Analysis: HEALML for Efficient Sphere-Based Statistics on Pangeo-EOSC, EGU General Assembly 2025, Vienna, Austria, 27 Apr–2 May 2025, EGU25-6798, https://doi.org/10.5194/egusphere-egu25-6798, 2025.

EGU25-8127 | ECS | Posters on site | ESSI2.15

Seamless Upscaling Research from Cloud to HPC using eWaterCycle 

Mark Melotto, Rolf Hut, and Bart Schilperoort

The eWaterCycle platform provides hydrologists with a platform that allows them to work with each other's models and data without having to become a computer scientist in the process. The eWaterCycle platform supports existing hydrological models and makes them available for scientists using the BMI model interface as a communication layer. Models run in containers for reproducibility and dependency control. Popular hydrological models are readily available (PCRGLobWB, WFLOW, HBV, etc.). Scientists develop their analyses or experiments in the widely known JupyterHub environment. 

While in theory eWaterCycle can be installed and run on any hardware, in practice most users interact with it on the SURF Research Cloud, a cloud computing infrastructure available to the Dutch academic ecosystem. Until recently upscaling from Cloud to HPC infrastructure for larger model runs required extensive knowledge of the HPC system. Here we will present our work on building a seamless workflow that allows scientists to upscale their cloud based work to the Snellius supercomputer and the Spider grid computer without having to worry about technical issues like mounting points for (large) datasets and container engines.

Our workflow opens up the possibility for more scientists to benefit from HPC and Grid resources while focussing on their domain science. We present the workflow in such a format that it should be easily portable to other hybrid cloud - HPC infrastructures, including the DestinE systems.

How to cite: Melotto, M., Hut, R., and Schilperoort, B.: Seamless Upscaling Research from Cloud to HPC using eWaterCycle, EGU General Assembly 2025, Vienna, Austria, 27 Apr–2 May 2025, EGU25-8127, https://doi.org/10.5194/egusphere-egu25-8127, 2025.

We present recent progress around the EERIE cloud data server (https://eerie.cloud.dkrz.de) and its software stack “cloudify”. The EERIE cloud provides efficient open access to prominent climate datasets stored on disk at the German Climate Computing Center (DKRZ).

A new kerchunk-plugin enables data access to raw model output as-is to enable verifiable data transfer with better latency. STAC (Spatio Temporal Assets Catalog) catalogs are deployed and displayed through the EERIE cloud to make the provided DKRZ datasets findable and accessible. Two in-browser apps can be started, pre-configured for each dataset, by just clicking buttons: (1) the data visualization app “gridlook” as well as a (2) jupyterlite for interactive analysis and monitoring. 

We leverage the python package xpublish, a plugin for Pangeo's central analysis package Xarray. Its main feature is to provide ESM output by mapping any input data to virtual zarr datasets. Users can retrieve these datasets as if they were cloud-native and cloud-optimized.

How to cite: Wachsmann, F.: The EERIE cloud: Apps and Catalogs for Cloudified Earth System Model Output, EGU General Assembly 2025, Vienna, Austria, 27 Apr–2 May 2025, EGU25-8591, https://doi.org/10.5194/egusphere-egu25-8591, 2025.

EGU25-8754 | ECS | Orals | ESSI2.15

Leveraging Cloud, Earth Observation and In-Situ Sensors for Agri-Environmental Monitoring and Policy Decision-Making  

Georgios Charvalis, Panagiota Louka, Vassileios Gkoles,  Thanasis Manos, Nikos Kalatzis, Dionysios Solomos, Anastasios Trypitsidis, and Odysseas Sekkas

Cloud infrastructures play a significant role in delivering secure, scalable and efficient data processing for Earth Observation (EO) and agricultural management applications. As part of the ScaleAgData project, we present a hierarchical Agri-Environmental Monitoring Tool running on a private cloud infrastructure. The system combines data from EO, in-situ sensors and farm management information systems (FMIS), including parcel calendars, to provide farmers and policymakers multi-scale insights.  

The solution is cloud-based and designed with an underlying architecture that ensures both scalability and interoperability, leveraging OGC-compliant data formats where applicable. EO and in-situ data streams can be processed and analyzed efficiently with the help of containerized apps and microservices to facilitate modular development and simplify deployment. By using a web-based dashboard with hierarchical design, stakeholders can navigate from overviews at the municipal level to individual parcels. Aggregated summaries that comply with Common Agricultural Policy (CAP) criteria are useful to policymakers and farmers can get comprehensive parcel-level metrics to optimize irrigation, pesticide use and other agro-related activities.  

Specifically, the tool combines EO data to derive vegetation indices (e.g., NDVI, EVI) and other parameters requiring advanced processing for crop type classification. Furthermore, these datasets are enriched with in-situ sensor measurements (e.g. soil moisture, weather data) and farm logs managed within FMIS (irrigation schedule, pesticide usage). Parcel-level data (L1) is processed to generate statistics, which are then calibrated with nearby parcels data with similar properties and crop type(L2), serving as control level, and finally extrapolated to the municipal level (L3) using spatial averaging techniques  to provide indicators related to irrigation water, pesticide, fertilizer usage, etc.  Farm calendars stored within FMIS provide a reliable source of ground-truth data, enhancing the tool’s ability to validate aggregated metrics. The aggregation at L2 and L3 allows for the identification of regional trends and patterns in agricultural practices, empowering policymakers and stakeholders to implement targeted interventions at both levels, thereby promoting sustainable agriculture.   

This work showcases the potential of private cloud infrastructures to enhance agri-environmental monitoring by processing and integrating heterogeneous data streams (EO, in-situ sensors and farm log data) into a unified system. The system is being applied in diverse agricultural regions of Greece (Crete, Thessaly, Macedonia) with ongoing validation efforts aimed at refining its accuracy and adaptability. Future work includes the integration of cloud-based machine learning models and EO-derived evapotranspiration data to enhance the efficiency of extrapolating parcel-level (L1) and regional (L2) metrics into policy-level indicators (L3). Additionally, alternative aggregation methods, such as model-based approaches, spatial regression, and interpolation techniques like Kriging, will be tested to improve the accuracy and reliability of aggregated insights. 

How to cite: Charvalis, G., Louka, P., Gkoles, V., Manos,  ., Kalatzis, N., Solomos, D., Trypitsidis, A., and Sekkas, O.: Leveraging Cloud, Earth Observation and In-Situ Sensors for Agri-Environmental Monitoring and Policy Decision-Making , EGU General Assembly 2025, Vienna, Austria, 27 Apr–2 May 2025, EGU25-8754, https://doi.org/10.5194/egusphere-egu25-8754, 2025.

EGU25-9432 | Posters on site | ESSI2.15

Co-Creating Cloud-Based Tools for Urban Climate-Resilience: The CLIMRES Project 

Claudio Pisa, Marica Antonacci, Vasileios Baousis, Sotirios Aspragkathos, Iasonas Sotiropoulos, and Stamatia Rizou

Europe faces a growing frequency of extreme weather events, from heatwaves and floods to wildfires and earthquakes, increasingly threatening urban environments. Unusually warm winters are becoming progressively common, destabilizing ecosystems and altering traditional weather dynamics. 

Addressing these crucial changes, the CLIMRES project aims to foster a “Leadership for Climate-Resilient Buildings” by identifying and categorizing vulnerabilities within the built environment and assessing their effects within urban systems. This effort integrates diverse data sources, including Copernicus services, IoT networks, and municipal datasets, and considers hazard warnings and weather forecasts. Moreover, a liaison with the Destination Earth initiative enhances the project with the capacity to leverage extreme weather predictions and future climate models. 

CLIMRES aims to deliver vulnerability assessment and impact evaluation methodologies, along with a “hub of measures” inventory for cost-effective building design and materials against climate risks, as well as decision support tools, to aid building owners, policymakers and stakeholders in planning effective interventions and to address vulnerabilities, targeting three levels of decision making at strategic, tactical and operational levels. The project deploys cloud technologies like OpenStack and Kubernetes to host an interoperable platform for vulnerability analysis, data harmonization, and decision-making. Its solutions will be tested and validated on 3 Large Scale Pilots in Spain, Greece, Italy, and Slovenia, addressing hazards such as heatwaves, flooding, fires, and earthquakes. A multi-hazard replication pilot in France will further evaluate the scalability and versatility of these approaches across diverse contexts. 

Insights from these pilots will feed into a replication roadmap and a capacity-building program designed to train future leaders in climate-resilient urban development. By fostering co-creation with local stakeholders and communities, CLIMRES ensures its innovative solutions are practical, cost-effective, and replicable, targeting Technology Readiness Levels (TRL) 6-8. 

CLIMRES aims to bridge innovation with actionable solutions, equipping building owners, policymakers, and communities with the tools needed to enhance urban climate resilience. This presentation highlights the project’s interdisciplinary approach, outputs and technological underpinnings, offering insights into scalable solutions for climate adaptation in urban settings. 

How to cite: Pisa, C., Antonacci, M., Baousis, V., Aspragkathos, S., Sotiropoulos, I., and Rizou, S.: Co-Creating Cloud-Based Tools for Urban Climate-Resilience: The CLIMRES Project, EGU General Assembly 2025, Vienna, Austria, 27 Apr–2 May 2025, EGU25-9432, https://doi.org/10.5194/egusphere-egu25-9432, 2025.

EGU25-10683 | Orals | ESSI2.15

Copernicus data and services uptake with EO4EU platform: an AI-augmented ecosystem for Earth Observation data accessibility and exploitation. 

Federico Fornari, Vasileios Baousis, Mohanad Albughdadi, Marica Antonacci, Tolga Kaprol, Claudio Pisa, Charalampos Andreou, Kakia Panagidi, and Stathes Hadjiefthymiades

The Copernicus program has fostered Earth Observation (EO) and Earth Modeling by offering extensive data and services to European Citizens. Sentinel satellites’ data is accessible  through platforms like the Copernicus Open Access Hub and the Copernicus Data Space Ecosystem, which provide a wide range of information on land, ocean and atmospheric conditions. Complementing these resources, six specialized Copernicus services deliver data in domains such as the atmosphere, marine environment, land monitoring, climate change, security and emergency response. To streamline access and usability, cloud-based Copernicus Data and Information Access Services (DIAS) offer centralised platforms equipped with cloud infrastructure and processing tools. Building on these efforts, the Copernicus Data Space Ecosystem (https://dataspace.copernicus.eu/) enhances existing DIAS services with advanced functionalities like improved search capabilities, virtualizations and APIs. Meanwhile, the Destination Earth (DestinE) initiative led by ECMWF, EUMETSAT and ESA, aims to develop high-precision digital Earth models - or digital twins - that simulate natural and human activities. These models mainly focus on weather-induced extremes and climate change adaptation, generating valuable Earth Modeling data. Furthermore, European Data Spaces integrate datasets across diverse domains, including agriculture, health, energy, and environmental monitoring, creating opportunities to combine these resources with Copernicus and DestinE data through advanced technologies like artificial intelligence (AI) and machine learning (ML). This integration paves the way for innovative solutions and public-facing products and services. Despite the volume and richness of Copernicus and related EO data, its accessibility remains limited, with most users being experts or scientists. For broader industry adoption and the development of impactful applications that benefit society and the enviroment, significant barriers must be addressed. EO data is often fragmented, complex, and difficult to process, requiring domain expertise for tasks such as data discovery, pre-processing, storage, and conversion into formats suitable for analytics and Geographic Information Systems (GIS).

The EO4EU platform (https://www.eo4eu.eu/), showcased in this presentation, introduces a multi-cloud ecosystem designed for holistic management of EO data. Its primary objective is to bridge the gap between domain experts and end users, leveraging technological advancements to broaden the adoption of EO data across diverse markets. By enhancing the accessibility and usability of EO data, EO4EU supports market growth through advanced data modeling, dynamic annotation, and state-of-the-art processing, powered by European cloud infrastructures such as WEkEO/DIAS and CINECA. EO4EU provides a suite of innovative tools and methodologies to assist a wide range of users, from professionals and domain experts to general citizens, in benefiting from EO data. Its key features include:

  • Knowledge Graph-based Decision Making: Facilitates insightful feature extraction from diverse repositories, enabling a more comprehensive understanding of datasets.
  • AI/ML Marketplace: A centralized hub for AI & ML models, algorithms, techniques, and metadata.
  • Big Data Processing Engines: Optimized for cloud environments to efficiently manage large-scale datasets.
  • User-friendly Interfaces: GUI, CLI, APIs, and immersive VR experiences, targeting both technical and non-technical users.
  • Workflow Engine: Simplifies the definition and execution of recurring tasks for EO data retrieval and processing.

How to cite: Fornari, F., Baousis, V., Albughdadi, M., Antonacci, M., Kaprol, T., Pisa, C., Andreou, C., Panagidi, K., and Hadjiefthymiades, S.: Copernicus data and services uptake with EO4EU platform: an AI-augmented ecosystem for Earth Observation data accessibility and exploitation., EGU General Assembly 2025, Vienna, Austria, 27 Apr–2 May 2025, EGU25-10683, https://doi.org/10.5194/egusphere-egu25-10683, 2025.

EGU25-10977 | Posters on site | ESSI2.15

Cloud-Powered Earth Observation Tools for Urban Resilience: The BUILDSPACE Project 

Marica Antonacci, Vasileios Baousis, Claudio Pisa, Stamatia Rizou, and Iasonas Sotiropoulos

The BUILDSPACE project harnesses the transformative potential of cloud computing to evolve urban development and resilience practices. By integrating advanced Earth Observation (EO) data with state-of-the-art satellite and cloud technologies, BUILDSPACE addresses critical urban challenges, including climate adaptation, energy efficiency, and disaster resilience, while contributing to the European Green Deal’s objectives of sustainability and carbon neutrality. 

Central to BUILDSPACE are five innovative services designed to support urban decision-making. At the building scale, the project facilitates the generation and visualization of detailed digital twins through interactive displays, virtual reality (VR), and augmented reality (AR) interfaces. These digital twins enable precise simulations for energy optimization, operational efficiency, and climate impact assessment. At the city scale, BUILDSPACE provides tools to address climate scenarios, such as urban heat islands and flooding, empowering municipalities and urban planners with actionable insights through interactive, map-based platforms. 

The project’s technical foundation lies in a robust, cloud-native architecture built on Kubernetes and OpenStack, combined with a DevOps methodology to streamline both infrastructure services and application deployment. Kubernetes orchestrates containerised workloads, enabling efficient automated deployment, scaling and management of applications, while OpenStack provides a flexible infrastructure for managing compute, storage, and networking resources. Through the DevOps approach, we ensure continuous integration and delivery (CI/CD), fostering rapid development cycles and operational agility. By adopting open-source cloud platforms, the project ensures interoperability, reproducibility and automation across diverse environments, driving consistency and efficiency throughout the lifecycle of both infrastructure and applications. 

The project’s services are being validated across four European cities representing diverse climatic conditions, namely Warsaw, Riga, Piraeus and Ljubljana. These validations focus on two scenarios: construction companies monitoring building processes with advanced digital tools, and municipalities analysing the impacts of climate change on urban infrastructure. 

By advancing from TRL 5-6 to TRL 7-8, BUILDSPACE aims to deliver market-ready solutions that align with the European GNSS and Copernicus initiatives and to synchronise with the advances, concerning Digital Twin technologies and data federation mechanisms, of the Destination Earth initiative, while paving the way for a broader adoption of cloud technologies in EO-based urban resilience applications. 

How to cite: Antonacci, M., Baousis, V., Pisa, C., Rizou, S., and Sotiropoulos, I.: Cloud-Powered Earth Observation Tools for Urban Resilience: The BUILDSPACE Project, EGU General Assembly 2025, Vienna, Austria, 27 Apr–2 May 2025, EGU25-10977, https://doi.org/10.5194/egusphere-egu25-10977, 2025.

EGU25-11810 | Orals | ESSI2.15

DeployAI Earth Observation Services: Enabling Environmental Insights on the European AI-on-Demand Platform 

Antonis Troumpoukis, Mohanad Albughdadi, Martin Welß, Vasileios Baousis, and Iraklis Klampanos

The DeployAI project [1] designs and delivers a fully operational European AI-on-Demand Platform (AIoDP) to empower the European industry with access to cutting-edge AI technology, and to promote trustworthy, ethical, and transparent European AI solutions, with a focus on SMEs and the public sector. To achieve this, the platform enables the development and deployment of AI solutions through the following core solutions: (i) AI Builder [2], which allows the assembling of reusable AI modules into AI pipelines; (ii) seamless access to Cloud and HPC infrastructures (e.g., MeluXina and LUMI); (iii) a marketplace for the listing and distribution of ready-to-use AI products; (iv) an expansive and growing library of diverse AI-driven use cases.

As part of its domain-driven solutions, AIoDP seeks to empower Environmental Scientists, AI Engineers, Developers, Researchers, and SMEs via the DeployAI Earth Observation Services. These services will accelerate the development of AI-driven environmental applications, by providing pre-trained models that simplify satellite imagery processing, land usage classification, and image segmentation. Key models available as modules within the DeployAI’s AI Builder include:

  • Leaf Area Index (LAI) Model: Enables precise monitoring of vegetation health and ecological dynamics by calculating leaf area per unit ground [3]. 
  • Object Detection Model: Identifies specific objects in high-resolution satellite images, supporting applications such as  infrastructure monitoring, pollution tracking, and deforestation assessment [4].
  • Segment Anything Model (SAM): Simplifies analysis across diverse environmental applications through the capabilities of SAM that allows flexible, prompt-based image segmentation for new datasets, with zero-shot and few-shot learning [5].

These models, along with the broader functionalities of AI Builder, enable users to create custom AI pipelines that address their specific environmental challenges in several environmental areas, including vegetation health monitoring, water balance analysis, climate modeling, urban planning, traffic management, pollution monitoring, and infrastructure maintenance. Users can leverage the visual pipeline editor to easily assemble pipelines from reusable AI modules without needing to write code. Once created, these pipelines can be deployed as AI applications on various execution environments. DeployAI facilitates seamless transitions between these environments by providing connectors to a host of target infrastructures, including Cloud platforms and HPC systems. This empowers users to leverage the most suitable computational resources for their specific needs.

By providing a user-friendly platform with access to cutting-edge AI technology and Cloud/HPC resources, DeployAI empowers users to address critical environmental challenges and unlock new possibilities for sustainable development.

[1] https://deployaiproject.eu
[2] https://gitlab.eclipse.org/eclipse/graphene
[3] https://github.com/DeployAI-Environmental-Services/depai-lai
[4] https://github.com/DeployAI-Environmental-Services/depai-yolov8-obb
[5] https://github.com/DeployAI-Environmental-Services/depai-sam-interactive

This work has received funding from the European Union’s Digital Europe Programme (DIGITAL) under grant agreement No 101146490.

How to cite: Troumpoukis, A., Albughdadi, M., Welß, M., Baousis, V., and Klampanos, I.: DeployAI Earth Observation Services: Enabling Environmental Insights on the European AI-on-Demand Platform, EGU General Assembly 2025, Vienna, Austria, 27 Apr–2 May 2025, EGU25-11810, https://doi.org/10.5194/egusphere-egu25-11810, 2025.

EGU25-12070 | ECS | Orals | ESSI2.15

Performance Benchmarking and Energy monitoring for Climate Modelling 

Sergi Palomas, Mario Acosta, Gladys Utrera, Okke Lennart, Daniel Beltran, Miguel Castrillo, Niclas Schroeter, and Ralf Mueller

The computational intensity of climate models makes them among the most energy-demanding applications in High-Performance Computing (HPC), resulting in significant computational costs and carbon emissions. Addressing the dual challenge of improving climate predictions —by running higher resolution, more accurate and complex models— and ensuring sustainability requires innovative tools to evaluate both computational efficiency and energy consumption across diverse HPC architectures. To address this, and in the context of the Center of Excellence in Simulation of Weather and Climate in Europe (ESiWACE), we have extended the High-Performance Climate and Weather Benchmark (HPCW) framework to incorporate a standardised set of Climate Performance Metrics for Intercomparison Projects (CPMIPs) and energy consumption monitoring.

HPCW, originally designed to maintain a set of relevant and realistic, near-operational weather forecast workloads to benchmark HPC sites, can provide insights beyond generic benchmarks like High-Performance Linpack (HPL) or High-Performance Conjugate Gradients (HPCG) by focusing on domain-specific workloads.

The inclusion of CPMIPs into HPCW brings a widely accepted set of metrics specifically tailored to the particularities of climate workflows. These metrics, already recognized by the scientific community, are key to better understanding climate model performance and allow us to keep the results from the framework relevant for research and operational runs, as well as improving our capacity for multi-model multi-platform performance comparisons.

By integrating energy monitoring, HPCW enables users to evaluate how critical computational kernels in climate models perform in terms of energy consumption. Our review of energy profiling tools across EuroHPC pre-exascale systems, including MareNostrum 5, LUMI, and Leonardo, highlights a fragmented landscape. Current tools offer varying granularity and portability, but limitations such as system configurations, administrative restrictions, and hardware compatibility often hinder their application. Low-level interfaces like Running Average Power Limit (RAPL) and Performance Application Programming Interface (PAPI) counters offer precise energy measurements but are constrained by accessibility issues.

These advancements aim to improve the allocation of climate experiments, such as those conducted for the Intergovernmental Panel on Climate Change (IPCC) in Coupled Model Intercomparison Projects (CMIPs), to the most suitable HPC resources, while also identifying architectural bottlenecks before running production experiments. Additionally, by enhancing energy consumption quantification, this work contributes to ongoing efforts to measure and reduce the carbon footprint of the climate research community. Furthermore, these analyses are expected to be particularly valuable for climate researchers, especially in the context of upcoming large-scale initiatives like CMIP7, enabling them to make informed resource requests and facilitate robust multi-platform comparisons of climate model performance which were not possible in the past. We anticipate that HPC vendors can also benefit from the outcomes of our work in optimising the systems for climate modelling workloads. By combining performance and energy metrics within a unified framework, we provide critical insights that align computational advancements with sustainability goals, ensuring efficient and environmentally conscious use of HPC resources for climate research.

How to cite: Palomas, S., Acosta, M., Utrera, G., Lennart, O., Beltran, D., Castrillo, M., Schroeter, N., and Mueller, R.: Performance Benchmarking and Energy monitoring for Climate Modelling, EGU General Assembly 2025, Vienna, Austria, 27 Apr–2 May 2025, EGU25-12070, https://doi.org/10.5194/egusphere-egu25-12070, 2025.

EGU25-12918 | ECS | Orals | ESSI2.15

Enhancing Pangeo-Fish with HEALPix Convolution: Impact Evaluation and Benefits 

Etienne Cap, Tina Odaka, Jean-Marc Delouis, Justus Magin, and Mathieu Woillez

The Pangeo-Fish project processes biologging data to analyze fish movement and migration patterns.  While SciPy’s convolution methods are robust, they are not optimized for handling spherical datasets inherent to Earth system science. To address this limitation, we propose the integration of HEALPix convolution, a method designed for spherical operations, into Pangeo-Fish.

HEALPix convolution offers distinct advantages for geophysical data analysis, particularly when dealing with spherical datasets in Earth system science. It uses the HEALPix pixelization as a core Discrete Global Grid System (DGGS), which ensures equally-sized pixels globally, removing distortions common in flat projections. This consistency is crucial for maintaining the physical relevance of convolutions across locations. Additionally, HEALPix’s dyadic property supports flexible, multiscale resolution adjustments, allowing for downscaling while preserving accuracy. Such scalability is essential for studying oceanic environments where areas of interest, like coastal zones and basins, are often resolution-dependent.

Our approach evaluates the performance of HEALPix convolution in comparison to traditional SciPy methods, focusing on its ability to enhance the accuracy of habitat mapping and migration pathway modeling for fish. 

This integration is particularly relevant within the Global Fish Tracking System (GFTS), which operates under the European Union’s Destination Earth (DestinE) initiative. GFTS utilizes datasets from Copernicus Marine Services and the European Tracking Network (ETN) to model fish habitats, spawning grounds, and migration swimways. HEALPix convolution strengthens the pangeo-fish’s capacity for studying Species such as tuna and eel that exhibit large-scale, transoceanic migrations.    

In conclusion, this work highlights the transformative potential of HEALPix convolution in spherical data processing. By integrating this innovative method, Pangeo-Fish can provide more accurate, scalable, and actionable insights into fish behaviors and habitats, contributing to sustainable management practices and conservation strategies globally.


How to cite: Cap, E., Odaka, T., Delouis, J.-M., Magin, J., and Woillez, M.: Enhancing Pangeo-Fish with HEALPix Convolution: Impact Evaluation and Benefits, EGU General Assembly 2025, Vienna, Austria, 27 Apr–2 May 2025, EGU25-12918, https://doi.org/10.5194/egusphere-egu25-12918, 2025.

EGU25-13725 | Posters on site | ESSI2.15

Cloud-based platform for the management of hydrogeological risks in the Po Basin  

Marco Zazzeri and the PARACELSO team

In recent years, technological advances in the use of geospatial data (such as satellite images, anthropogenic and/or environmental raster and vector open data, etc.) for hydrogeological risk assessment, combined with advanced analysis techniques (e.g., machine learning), have become increasingly valuable. These technologies can be utilized by local and national authorities for land planning and emergency management to better understand the dynamics associated with climate change. This understanding can help guide actions aimed at safeguarding not only environmental resources but also socio-economic assets and citizens’ lives.

In pursuit of this goal, a partnership has been established between the Po River Basin District Authority (AdBPo), the Italian Space Agency (ASI), and academic and research institutions such as the University of Bologna (UNIBO), the University of Modena and Reggio Emilia (UNIMORE), the University of Padova (UNIPD), and the Institute of Environmental Geology and Geoengineering of the National Research Council of Italy (CNR-IGAG). The aim is to implement a downstream service for monitoring landscape evolution related to fluvial systems (geomorphological classification), and slope dynamics (including landslides and rock glaciers) and to quantitatively evaluate the exposed assets.

The PARACELSO project (Predictive Analysis, MonitoRing, and mAnagement of Climate change Effects Leveraging Satellite Observations) aims to develop a modular and interoperable cloud-based platform that supports the analysis of natural phenomena (such as fluvial hydrodynamics, landslides, and rock glaciers) using satellite images provided by:

  • DIAS platforms deployed by the Copernicus Programme (e.g., Sentinel 1-2);
  • ASI missions such as CosmoSkyMed, PRISMA, and SAOCOM.

Furthermore, a methodology integrating Earth Observation and geospatial data analysis has been implemented using open-source libraries.

To facilitate this, the MarghERita supercomputer, named in honor of the scientist Margherita Hack, has been made available by the Emilia-Romagna region. It is used both to store the downloaded satellite images and to run the algorithms developed in the project for studying the temporal evolution of river and slope systems. Finally, it enables the sharing and visualization of processed data.

The project has received funding from ASI through the “I4DP_PA (Innovation for Downstream Preparation for Public Administrations)” Call for Ideas.

How to cite: Zazzeri, M. and the PARACELSO team: Cloud-based platform for the management of hydrogeological risks in the Po Basin , EGU General Assembly 2025, Vienna, Austria, 27 Apr–2 May 2025, EGU25-13725, https://doi.org/10.5194/egusphere-egu25-13725, 2025.

EGU25-13873 | Orals | ESSI2.15

UXarray: Extending Xarray for Enhanced Support of Unstructured Grids 

John Clyne, Hongyu Chen, Philip Chmielowiec, Orhan Eroglu, Cecile Hannay, Robert Jacob, Rajeev Jain, Brian Medeiros, Paul Ullrich, and Colin Zarzycki

Over the past decade, weather and climate models have rapidly adopted unstructured meshes to better leverage high-performance computing systems and approach kilometer-scale resolutions. Output from this new generation of models presents many challenges for their subsequent analysis, largely due to a lack of community tools supporting unstructured grid data. Last year, we introduced UXarray, a class extension of Xarray that provides native support for unstructured meshes. UXarray readily runs in a Jupyter Notebook and offers parallelized execution through its compatibility with Dask, demonstrating its flexibility as both a tool for lightweight exploration and communication, and for supporting intensive calculations applied to vast data volumes. Over the past year, UXarray has matured significantly and is now capable of supporting many real-world analysis workflows applied to outputs from a growing number of high-resolution models and dynamical cores, including ICOsahedral Non-hydrostatic (ICON) atmosphere model, the Finite-Element/volumE Sea ice-Ocean Model (FESOM), NSF NCAR’s Model for Prediction Across Scales (MPAS), and the U.S. DOE’s Energy Exascale Earth System Model (E3SM). This presentation will provide an overview of the UXarray’s current capabilities, which include extensive support for plotting and many foundational analysis operators; demonstrate examples in Jupyter Notebooks; present plans for the future;  and discuss ways for Pangeo and the broader earth system science community to help guide new developments. 

How to cite: Clyne, J., Chen, H., Chmielowiec, P., Eroglu, O., Hannay, C., Jacob, R., Jain, R., Medeiros, B., Ullrich, P., and Zarzycki, C.: UXarray: Extending Xarray for Enhanced Support of Unstructured Grids, EGU General Assembly 2025, Vienna, Austria, 27 Apr–2 May 2025, EGU25-13873, https://doi.org/10.5194/egusphere-egu25-13873, 2025.

EGU25-14306 | ECS | Orals | ESSI2.15

Navigating New Grids: Evaluating DGGS Configurations for Marine Spatial Analysis 

Kayziel Martinez, Alexander Kmoch, Lőrinc Mészáros, Andrew Nelson, and Evelyn Uuemaa

Accurate and efficient spatial analysis is crucial for the mapping and sustainable management of marine environments, where large-scale and diverse datasets present significant analytical challenges. Traditional latitude-longitude methods, while widely used, often encounter limitations in data integration and handling distortion caused by Earth’s curvature. Discrete Global Grid Systems (DGGS) have emerged as a promising solution, offering a hierarchical, global, and equal-area framework for geospatial analysis. Despite their potential, the performance in marine spatial analysis remains underexplored.

This study evaluates the impact and suitability of DGGS-based spatial analysis by comparing its performance with the traditional latitude-longitude approaches. Using marine datasets representing point and raster data formats, the workflow begins with quantization, converting the data into DGGS cells.The implementation utilizes open-source Python tools from the Pangeo ecosystem, including xarray-xdggrid, to enable seamless integration and efficient analysis of large geospatial datasets. Three DGGS configurations – ISEA7H, HEALPIX, and ISEA3H are compared alongside traditional latitude-longitude grid for computational efficiency (processing time and memory usage) and their ability to preserve spatial patterns. Spatial analysis methods include density estimation, nearest neighbor evaluation, and clustering for point data, as well as zonal statistics, spatial autocorrelation, and resampling for raster data.

To further illustrate the application of DGGS-based methods, the study includes a case study on estuary characterization. This characterization relies on spatial analysis methods, integrating physical oceanographic parameters from Delft3D-FM, biogeochemical and optical data products, and in-situ point measurements from the Copernicus Marine Environment Monitoring Service (CMEMS). Representing these diverse datasets within the DGGS framework highlights its ability to manage varying data types and scales, offering insights into estuarine environments and demonstrating its scalability for addressing complex marine spatial challenges.

Results indicate that DGGS frameworks deliver comparable computational performance while offering consistent spatial representation. Configuration-specific trade-offs influence their effectiveness, emphasizing the importance of aligning DGGS configurations with specific analytical tasks and applications. Findings suggest that DGGS-based methods offer a promising alternative to traditional analysis techniques, providing greater flexibility in adapting to datasets, scale, and resolution. This contributes to more efficient mapping, sustainable marine environmental management, and advancing geospatial applications through open-source tools from the Pangeo ecosystem.

How to cite: Martinez, K., Kmoch, A., Mészáros, L., Nelson, A., and Uuemaa, E.: Navigating New Grids: Evaluating DGGS Configurations for Marine Spatial Analysis, EGU General Assembly 2025, Vienna, Austria, 27 Apr–2 May 2025, EGU25-14306, https://doi.org/10.5194/egusphere-egu25-14306, 2025.

EGU25-14400 | ECS | Orals | ESSI2.15

A community oriented approach to enabling open science with Earth science data at scale 

Max Jones, Aimee Barciauskas, Jonas Sølvsteen, Brian Freitag, Yuvi Panda, Kyle Barron, Julia Signell, Alex Mandel, Chuck Daniels, Nathan Zimmerman, Sean Harkins, Henry Rodman, Zac Deziel, Slesa Adhikari, Anthony Boyd, Alexandra Kirk, David Bitner, and Vincent Sarago

To enable wider participation in open science with geospatial data at scale, we need to reduce the effort and custom approaches required for setting up scalable scientific data analysis environments and computing workflows. We have made great strides in this pursuit by evolving and promoting community-developed open source frameworks, tools, and libraries for cloud-native data access and analysis, making them the default for scientists on the public cloud and local systems.

Many of our achievements have been supported by the NASA Visualization, Exploration, and Data Analysis (VEDA) project which seeks to proliferate cloud-native approaches for open science on Earth science data from NASA’s rich archives and many other providers. Our presentation highlights how we have engaged with communities like Pangeo, OpenScapes, Earth Science Information Partners, and the Cloud Native Geospatial Forum to build joint initiatives, target development, and ensure uptake of new solutions. We present key results from working groups, community showcases, and hackdays and hackweeks organized by VEDA team members, as well as specific contributions to the open source ecosystem, including the eoAPI platform for quickly and easily deploying an open-source Earth Observation stack, JupyterHub fancy profiles (with BinderHub) for seamless environment building, and Lonboard for fast, interactive vector visualization.

How to cite: Jones, M., Barciauskas, A., Sølvsteen, J., Freitag, B., Panda, Y., Barron, K., Signell, J., Mandel, A., Daniels, C., Zimmerman, N., Harkins, S., Rodman, H., Deziel, Z., Adhikari, S., Boyd, A., Kirk, A., Bitner, D., and Sarago, V.: A community oriented approach to enabling open science with Earth science data at scale, EGU General Assembly 2025, Vienna, Austria, 27 Apr–2 May 2025, EGU25-14400, https://doi.org/10.5194/egusphere-egu25-14400, 2025.

EGU25-14610 | Orals | ESSI2.15

Weather Data Streaming with Kerchunk: Strengthening Early Warning Systems  

Nishadh Kalladath, Masilin Gudoshava, Shruti Nath, Jason Kinyua, Fenwick Cooper, Hannah Kimani, David Koros, Christine Maswi, Zacharia Mwai, Asaminew Teshome, Samrawit Abebe, Isaac Obai, Jesse Mason, Ahmed Amdihun, and Tim Palmer

The Ensemble Prediction System (EPS) provided by global weather forecast centres generates vast amounts of data that is crucial for early warnings of extreme weather and climate. However, regional and national meteorological services often face challenges in processing this data efficiently, particularly during regional downscaling and post-processing. Conventional methods of downloading and storing GRIB-format data have become increasingly inefficient and unsustainable. The Strengthening Early Warning Systems for Anticipatory Actions (SEWAA) project aims to address these challenges by exploring the use of cloud native operations and GenAI-cGAN driven post-processing systems.   

Kerchunk provides a groundbreaking solution for real-time weather data streaming, catering to the transition towards open and free to use cloud-based object storage from global weather forecasting centres. Kerchunk, in conjunction with GRIB index files, enables efficient, real-time access to weather data, fostering more sustainable workflows in weather and climate services, thus strengthening early warning systems.  

This study developed a workflow for streaming forecast data using Kerchunk with two primary objectives:  

1. Using GRIB index files to reduce redundant readings and generate Kerchunk reference files.  

2. Through streaming-like access, convert the reference files into virtual Zarr datasets and utilise Dask compute for scalable data handling   

The methodology utilised recent improvements in the Kerchunk library that integrate GRIB scanning with its index files. This allowed the system to sample subsets of the GRIB corpus instead of processing entire Forecast Model Run Collections (FMRC), significantly optimising performance.  

The workflow was implemented using cloud-based compute operations via Coiled python library and its service on the Google Cloud Platform. Dask cluster, managed through Coiled, enabled the creation of Zarr virtual datasets for analysis and visualisation. This streaming approach efficiently loads weather data into memory on demand, avoiding unnecessary data downloads and duplication.   

We validated the solution with NOAA GFS/GEFS datasets stored in AWS S3 bucket as open datasets. The optimised workflow demonstrated remarkable efficiency, requiring only <5% of the original GRIB data to be read, with the rest replaced by index files as input for reference file creation. This is followed by the step of Kerchunk reference files to virtual Zarr conversion by Dask clusters to process on a regional scale, such as East Africa’s in minutes supporting near real-time applications across spatial and temporal scales.  

This approach significantly enhances post processing workflows for EPS weather forecast, bolstering early warning systems and anticipatory action. Future work will focus on using the method to scaling training datasets and improving the cost efficiency of cGAN training to advance operational early warning systems. This innovative solution directly addresses the challenges faced by meteorological services in processing massive weather datasets, providing a scalable, cost-effective, development foundation for applying GenAI based post-processing and improving early warning systems. 

How to cite: Kalladath, N., Gudoshava, M., Nath, S., Kinyua, J., Cooper, F., Kimani, H., Koros, D., Maswi, C., Mwai, Z., Teshome, A., Abebe, S., Obai, I., Mason, J., Amdihun, A., and Palmer, T.: Weather Data Streaming with Kerchunk: Strengthening Early Warning Systems , EGU General Assembly 2025, Vienna, Austria, 27 Apr–2 May 2025, EGU25-14610, https://doi.org/10.5194/egusphere-egu25-14610, 2025.

EGU25-15406 | Orals | ESSI2.15

Platform Engineering for Earth Observation: A Unified Approach to HPC and Cloud Systems 

Armagan Karatosun and Vasileios Baousis

The growing volume of Earth Observation (EO) and Earth modeling data makes it increasingly impractical to download and analyze it locally. Furthermore, as cloud-native data formats and AI/ML-driven models gain popularity, the community requires powerful computing and storage solutions to efficiently process and analyze EO data. High-performance computing (HPC) and cloud infrastructures can help accomplish this, but both bring significant challenges in maintaining those resources, putting additional workloads on the scientists and developers.

In this paper, we will present our solution, which uses cloud-native technologies and a “Control Plane” approach to seamlessly interact with HPC scheduling endpoints like SLURM and PBS, as well as cloud infrastructure resources, allowing HPC jobs to be submitted and monitored directly from a Kubernetes-based infrastructure. In contrast to traditional IT architecture, Platform Engineering is concerned with lowering operational complexity by introducing control planes to provide self-service capabilities. By abstracting away the complexities of the underlying infrastructure, this method gives teams a customized, scalable, and dependable environment to suit their unique requirements. We will thoroughly analyze existing technologies, including their methodologies, strengths, limits, and potential as universal solutions. Furthermore, we will assess their adaptation to various cloud and HPC infrastructures, providing insights into their suitability for larger applications. 

We will conclude our discussion with practical examples showing how the technical benefits of these two computing paradigms, combined with the Platform Engineering approach, may be effectively used in real-world EO data processing scenarios.

How to cite: Karatosun, A. and Baousis, V.: Platform Engineering for Earth Observation: A Unified Approach to HPC and Cloud Systems, EGU General Assembly 2025, Vienna, Austria, 27 Apr–2 May 2025, EGU25-15406, https://doi.org/10.5194/egusphere-egu25-15406, 2025.

High-resolution regional climate model datasets, such as those produced within the Coordinated Regional Downscaling Experiment (CORDEX) framework, are critical for understanding climate change impacts at local and regional scales. These datasets, with their high spatial and temporal resolution, provide detailed insights into region-specific climate phenomena, including urban heat islands, mountainous climates, and extreme weather events. However, their accessibility and usability are often constrained by technical challenges such as fragmented data storage, inconsistent formats, and limited interoperability.

To address these barriers, we are developing the Climate Service Database (CSD) - a centralized data warehouse designed to streamline the temporal and spatial aggregation of CORDEX datasets for climate service applications. The CSD ingests raw CORDEX datasets and applies automated extraction, transformation, and loading (ETL) workflows to produce analysis-ready datasets tailored to user needs. By leveraging cloud-based infrastructure and adhering to Climate and Forecast (CF) conventions, the CSD ensures consistent, interoperable data products that are optimized for scalable access and analysis.

A core functionality of the CSD is its ability to aggregate datasets at multiple spatial and temporal scales, ranging from daily extremes to decadal averages, and across diverse spatial resolutions (e.g., countries, administrative regions, or watersheds). This capability enables the generation of climate indicators (e.g., hot summer days, heavy precipitation events) that are directly relevant for local decision-making and impact assessments. By providing data in cloud-optimized, analysis-ready formats (ARCO) and offering Software as a Service (SaaS), the CSD significantly lowers the technical barriers for researchers, businesses, and policymakers seeking to access user-tailored climate service datasets.

By centralizing and optimizing the processing of regional climate model datasets, the CSD fosters collaboration across research institutions, public agencies, and climate-tech startups. It enables users to efficiently access consistent and up-to-date data while eliminating the redundancies of localized data storage and processing. This approach also opens new opportunities for applying AI-driven analytics and machine learning models to CORDEX data, paving the way for innovative climate services and applications.

Through its focus on regional climate model datasets, the CSD exemplifies how modern data infrastructures can enhance the usability of high-resolution climate data, empowering stakeholders to develop robust, data-driven adaptation and mitigation strategies in response to the challenges of climate change.

How to cite: Buntemeyer, L.: Advancing Regional Climate Data Accessibility through a Cloud-native Climate Service Database, EGU General Assembly 2025, Vienna, Austria, 27 Apr–2 May 2025, EGU25-16230, https://doi.org/10.5194/egusphere-egu25-16230, 2025.

EGU25-17137 | Orals | ESSI2.15

The Sentinels EOPF Toolkit: Community Notebooks and Plug-ins for using Copernicus Sentinel Data in Zarr format 

Dr. Julia Wagemann, Sabrina Szeto, Emmanuel Mathot, and James Banting

Zarr is a key component of the Pangeo ecosystem and instrumental for effectively accessing and processing multi-dimensional Earth data in cloud-based systems. More and more leading satellite data providers are exploring the transition of their data archives to a cloud environment. 

As part of the ESA Copernicus Earth Observation Processor Framework (EOPF), ESA is in the process of providing access to “live” sample data from the Copernicus Sentinel missions -1, -2 and -3 in the new Zarr data format. This set of reprocessed data allows users to try out accessing and processing data in the new format and experiencing the benefits thereof with their own workflows.

To help Sentinel data users to experience and adopt the new data format, a set of resources called the Sentinels EOPF Toolkit is being developed. Development Seed, SparkGeo and thriveGEO, together with a group of champion users (early-adopters), are creating a set of Jupyter Notebooks, plug-ins and libraries that showcase the use of Sentinel data in Zarr for applications across multiple domains for different user communities, including users of Python, Julia, R and QGIS.

This presentation will give a demo of the first set of notebooks and plugins of the Sentinels EOPF toolkit that were developed and that facilitate the adoption of the Zarr data format for Copernicus Sentinel data users. Additionally, we will give an overview of toolkit developments and community activities that are planned throughout the project period.

How to cite: Wagemann, Dr. J., Szeto, S., Mathot, E., and Banting, J.: The Sentinels EOPF Toolkit: Community Notebooks and Plug-ins for using Copernicus Sentinel Data in Zarr format, EGU General Assembly 2025, Vienna, Austria, 27 Apr–2 May 2025, EGU25-17137, https://doi.org/10.5194/egusphere-egu25-17137, 2025.

EGU25-18285 | ECS | Posters on site | ESSI2.15

Regridding Satellite and Model Data to DGGS (HEALPix) Using the Pangeo Ecosystem 

Justus Magin, Jean-Marc Delouis, Lionel Zawadski, Julien Petiton, Max Jones, and Tina Odaka

Regridding data from diverse sources, such as satellite observations and numerical models, is a critical task in Earth system sciences. Proper interpolation methods are essential to ensure data fidelity when combining or comparing datasets on different grids. This becomes especially relevant in the context of emerging grid systems like Discrete Global Grid Systems (DGGS), specifically HEALPix.

DGGS are spatial reference systems designed to partition the Earth’s surface into a hierarchy of equal-area cells. Unlike traditional latitude-longitude grids, DGGS uses tessellations, such as hexagons, to represent the Earth’s curved surface with minimal distortion. This grid system is particularly suited for handling global-scale geospatial data by providing uniform coverage and resolution, enabling efficient storage, processing, and analysis.

HEALPix (Hierarchical Equal Area isoLatitude Pixelation) is a specific implementation of DGGS widely used in astronomy and Earth sciences. HEALPix divides the sphere into equal-area cells following an iso-latitude structure, making it computationally efficient for operations such as spherical harmonics and multi-resolution analysis. Originally developed for astrophysical applications, it has become increasingly popular in the Earth sciences for representing satellite data, model outputs, and other geospatial datasets in a way that preserves area integrity and facilitates seamless multi-resolution data integration.

By leveraging these grid systems, particularly HEALPix, we can achieve a more accurate and efficient representation of geospatial data.

The Pangeo ecosystem includes an array of powerful regridding tools, each tailored to specific grid types and applications. However, navigating this ecosystem to identify the most suitable tool and workflow can be challenging.

In this presentation, we will show an overview of regridding solutions within Pangeo, highlighting their capabilities and limitations, as well as  their application. We will also demonstrate a practical regridding workflow using model outputs or simulated satellite data such as the Odysea dataset (Aviso+ Altimetry. (n.d.). Simulated Level-2 Odysea Dataset. Retrieved from https://www.aviso.altimetry.fr/en/data/products/value-added-products/simulated-level-2-odysea-dataset.html on January 14, 2025), to the HEALPix grid. This workflow will make use of recent advances in technology to make it reproducible to make it efficient and reproducible, such as virtualizarr for fast metadata access and dask for scalable operations, with the output saved as chunked zarr files for seamless integration with downstream analysis.

How to cite: Magin, J., Delouis, J.-M., Zawadski, L., Petiton, J., Jones, M., and Odaka, T.: Regridding Satellite and Model Data to DGGS (HEALPix) Using the Pangeo Ecosystem, EGU General Assembly 2025, Vienna, Austria, 27 Apr–2 May 2025, EGU25-18285, https://doi.org/10.5194/egusphere-egu25-18285, 2025.

EGU25-18336 | Posters on site | ESSI2.15

Advancing Earth System Science through collaboration: An overview of ECMWF Special Projects 

Milana Vuckovic and Becky Hemingway

ECMWF has been providing resources on its operational high-performance computing (HPC) and cloud facilities (European Weather Cloud) to researchers and institutions through the Special Projects framework. This framework has been established almost 50 years ago as part of the creation of ECMWF. ECMWF's HPC facility is specifically designed to support both operational time-critical production of global weather forecasts and typical research workflows, therefore through Special Projects, researchers can get access not only to a top high-performance computing and cloud facility and one of the largest meteorological archives in the world, but also full user support.
Special Projects are defined as experiments or investigations of a scientific or technical nature, undertaken by one or more ECMWF Member States, likely to be of interest to general scientific community. The main aim of this initiative is to facilitate collaboration, enabling the development of innovative methodologies and tools for numerical weather prediction, climate and environmental modelling, and other disciplines within Earth System Sciences. All Special Project applications undergo a review process by ECMWF and its Scientific Advisory Committee (SAC), as well as ECMWF Member State's meteorological services and are ranked primarily by their scientific quality.
This poster will describe the Special Projects framework and showcase three recent Special Projects that illustrate collaborative nature of the initiative using ECMWF's HPC and European Weather Cloud facilities, including validating ICON model on ECMWF systems, the development of next-generation European Earth System Model (EC-EARTH4) and mapping the yet uncharted continuum of cyclone dynamics for the Euro Atlantic domain.
Through these examples, the poster will demonstrate how ECMWF Special Projects foster international collaboration, resource sharing, and innovation, enabling advancement in Earth System Science. 

How to cite: Vuckovic, M. and Hemingway, B.: Advancing Earth System Science through collaboration: An overview of ECMWF Special Projects, EGU General Assembly 2025, Vienna, Austria, 27 Apr–2 May 2025, EGU25-18336, https://doi.org/10.5194/egusphere-egu25-18336, 2025.

EGU25-20590 | Posters on site | ESSI2.15

Dhemeter: Data Hub for Environmental and METEorological Resources 

Cédric Pénard, Nathan Amsellem, Boris Gratadoux, Bastien Barthet, Jean Christophe Pere, Johannes Staufer, Laure Chaumat, and Alexia Mondot

Dhemeter is a weather and environmental data aggregator. It is developed using a microservices architecture to handle a wide variety of data from various providers, such as NOAA, ECMWF, Eumetsat, Météo-France, DWD, and Copernicus. The implementation of aggregation, concatenation, and consistency functionalities has been successfully executed for meteorological data. This versatile tool accommodates numerical model data, in-situ observations, remote sensing data, and reanalyses, allowing for online data retrieval from multiple sources.

Key features of the aggregator include:

  • Concatenation of Multiple Data Sources: Users can combine data according to selected categories such as Observations, Forecasts, and Reanalyses.
  • Standardization of Physical Data: This involves spatial and temporal interpolation as well as geographical selections to ensure uniformity.
  • Storage of Resulting Data Structures: The data is stored in a pivot format that facilitates access and distribution of scientific data, specifically in the NetCDF format.

The microservices architecture of the aggregator allows for the extensibility of the offered data catalog, and an API is available for users to make direct queries to chosen data sources.

In the short to medium term, the goal is to enhance the tool further, evolving it into a comprehensive data distribution and aggregation system that centralizes and simplifies access to various types of data, including meteorological, oceanographic, and air quality data.

Dhemeter focuses on ease of use, extensibility, scalability, and customization, offering users capabilities for data fusion and harmonization.

How to cite: Pénard, C., Amsellem, N., Gratadoux, B., Barthet, B., Pere, J. C., Staufer, J., Chaumat, L., and Mondot, A.: Dhemeter: Data Hub for Environmental and METEorological Resources, EGU General Assembly 2025, Vienna, Austria, 27 Apr–2 May 2025, EGU25-20590, https://doi.org/10.5194/egusphere-egu25-20590, 2025.

EGU25-20676 | Orals | ESSI2.15

Integrated geospatial Python libraries for efficient analysis of modern elevation measurements 

Scott Henderson, David Shean, Jack Hayes, and Shashank Bhushan

NASA established the Surface Topography and Vegetation (STV) Incubation program to develop and mature the next-generation measurement approaches to precisely map Earth’s changing surface and overlying vegetation structure, and prepare for a dedicated satellite mission within the next decade. Over the past two decades, large archives of 3D surface elevation measurements by airborne and satellite instruments including LiDAR, altimeters, Synthetic Aperture Radar, and stereo optical imagery have been systematically collected, though not always in a coordinated way. Yet, many of these datasets are fortuitously acquired over the same location within a short temporal window (e.g., <1-14 days) and many are now publicly available and hosted on the cloud. In theory, this is a great opportunity to synthesize myriad elevation measurements for STV researchers, but in practice merging these datasets accurately for scientific analysis requires dealing with numerous data formats, complex 4D coordinate reference systems, and securing access to significant computational resources.

We are developing an open-source Python library to identify, curate, and efficiently process coincident elevation measurements spanning the last several decades. This work would not be possible without well-integrated geospatial libraries (e.g. Geopandas, Xarray, Dask), as well as emerging cloud-native data and metadata formats such as Cloud-Optimized Geotiff and STAC-GeoParquet. We will describe our work to-date and reflect on the process of collaborative development across libraries, on our increasing reliance on Cloud resources, and current and future research directions.

How to cite: Henderson, S., Shean, D., Hayes, J., and Bhushan, S.: Integrated geospatial Python libraries for efficient analysis of modern elevation measurements, EGU General Assembly 2025, Vienna, Austria, 27 Apr–2 May 2025, EGU25-20676, https://doi.org/10.5194/egusphere-egu25-20676, 2025.

EGU25-21202 | Orals | ESSI2.15

From SAFE to Zarr: The EOPF Sample Service Initiative 

Christian Briese, Christoph Reimer, Christian Briese, Christoph Reck, Dimitrios Papadakis, Michele Claus, Gunnar Brandt, Anne Fouilloux, and Tina Odaka

Over the past decade, the operational Copernicus Sentinels Data Processors have generated vast amounts of Earth observation data, supporting various scientific and commercial applications. However, the current format used by ESA to provide Copernicus data, known as SAFE (Standard Archive Format for Europe), has become outdated. To address this, ESA has initiated the transition to a new Zarr-based data format. The Earth Observation Processing Framework (EOPF) Sample Service is ESA’s official initiative to support this transition by providing early access to the new format for users. This shift is essential for creating a cloud-native and interoperable solution that enhances data accessibility and integration with modern processing frameworks. The primary goal is to standardize data formats across Sentinel missions, enable scalable processing on cloud platforms, and ensure compatibility with contemporary data science tools. This initiative is crucial for minimizing disruption and ensuring continuity for users, applications, and services built around existing data formats.

The EOPF Sample Service comprises several key components. The EOPF Core Platform re-formats ingested SAFE data products into the new cloud-optimized EOPF Zarr data products and provides data access via STAC API and S3 API. To ensure timely conversion, the platform utilizes Argo Events and the Copernicus Data Space Ecosystem's subscription service. This platform is maintained by experts from EODC and DLR. The EOPF User Platform offers additional user services, including JupyterHub (BinderHub), Dask, and a STAC Browser, which are essential for supporting user adoption by lowering the entrance barrier to cloud applications and data discovery capabilities. The service is designed to make use of advanced technologies such as Kubernetes for container orchestration and Dask for parallel computing. User and identity management is achieved in cooperation with the Copernicus Data Space Ecosystem.

User adoption is further facilitated through Jupyter Notebooks designed by experts within the consortium, including members from the Pangeo community. These notebooks showcase the use of the new format within the community and are continuously improved by incorporating user feedback. In addition, enhancements are made to widely-used software tools like GDAL to support the new format, with practical demonstrations available through Jupyter Notebooks. The consortium selected by ESA to carry out this implementation includes experts from Brockmann Consult, DLR, Ifremer, EURAC, Evenflow, Simula, and EODC, each contributing their specialized knowledge in Earth observation, data management, and user engagement.

This contribution aims to present the EOPF Sample Service initiative and the current status of its implementation. The first Jupyter Notebooks demonstrating the new format will also be showcased, providing users with an intuitive and user-friendly interface for accessing and processing sample data in the new EOPF format.

How to cite: Briese, C., Reimer, C., Briese, C., Reck, C., Papadakis, D., Claus, M., Brandt, G., Fouilloux, A., and Odaka, T.: From SAFE to Zarr: The EOPF Sample Service Initiative, EGU General Assembly 2025, Vienna, Austria, 27 Apr–2 May 2025, EGU25-21202, https://doi.org/10.5194/egusphere-egu25-21202, 2025.

EGU25-21279 | Orals | ESSI2.15

Advancing Cloud-Native Data Analysis and Publishing with Pangeo Tools in EarthCODE 

Deyan Samardzhiev, Anne Fouilloux, Tina Odaka, and Benjamin Ragan-Kelley

EarthCODE (Earth Science Collaborative Open Development Environment) is a platform that leverages cloud-native tools to empower Earth system researchers in accessing, analyzing, and sharing data across distributed infrastructures, such as the Copernicus Data Space Ecosystem and Deep Earth System Data Laboratory (DeepESDL). By integrating Pangeo ecosystem tools—including Xarray, Dask, and Jupyter—EarthCODE supports scalable, FAIR-aligned workflows tailored to the challenges of Earth system science.

EarthCODE streamlines cloud-based data analysis and publishing by enabling collaborative research through interoperable workflows for analyzing complex datasets, including satellite observations, climate models, and in-situ measurements. Researchers can publish their analyses and workflows as reusable, executable resources in EarthCODE’s science catalog, fostering alignment with open science principles.

Through its integration of Pangeo tools, EarthCODE offers an intuitive environment for reproducibility, scalability, and collaboration, bridging the gap between data analysis and actionable insights. This presentation will demonstrate EarthCODE’s capabilities, including live, executable Jupyter notebooks that highlight its potential for sharing workflows and engaging diverse user groups. EarthCODE exemplifies the transformative power of cloud-native research, promoting open science and advancing the accessibility of Earth system data.

How to cite: Samardzhiev, D., Fouilloux, A., Odaka, T., and Ragan-Kelley, B.: Advancing Cloud-Native Data Analysis and Publishing with Pangeo Tools in EarthCODE, EGU General Assembly 2025, Vienna, Austria, 27 Apr–2 May 2025, EGU25-21279, https://doi.org/10.5194/egusphere-egu25-21279, 2025.

EGU25-21603 | ECS | Orals | ESSI2.15 | Highlight

The Pangeo Ecosystem Supporting Climate Change Adaptation: The FAIR2Adapt RiOMar Case Study 

Even Moa Myklebust, Ola Formo Kihle, and Justus Magin

The RiOMar (River dominated Ocean Margins) case study, part of the FAIR2Adapt (FAIR to Adapt to Climate Change) project (EU funded project grant agreement No 101188256), focuses on supporting science-based climate change adaptation strategies for coastal water quality and marine ecosystem management. The case study uses large environmental datasets, such as sea temperature, salinity, and other marine parameters, to assess and model the impacts of climate change on coastal ecosystems. As part of the FAIR2Adapt project, which aims to enhance the shareability, accessibility, interoperability, and reusability of environmental data through the FAIR (Findable, Accessible, Interoperable, and Reusable) principles, the RiOMar case study emphasizes the use of cutting-edge data processing and analysis methods to support adaptive strategies for climate resilience.

In this presentation, we present our approach to reading the RiOMar large environmental datasets in netCDF format, creating VirtualZarr archives for efficient data handling, transforming them into a Discrete Global Grid System (DGGS) using the Healpix grid.Leveraging the Pangeo ecosystem, we use tools such as Kerchunk to create simpler access to multiple data sources, parallelize dataset processing using Dask or Cube, enabling scalable analysis of these complex, multi-dimensional data. We will show a comparison of performance between traditional cube-based approaches and Dask, highlighting the advantages of parallelized processing. Furthermore, we will showcase how to interactively visualize these datasets using tools like XDGGs and Lonboard, facilitating seamless exploration and analysis of the underlying environmental patterns. This work underscores the potential of open-source tools, scalable computing techniques, and the Pangeo ecosystem to enhance the accessibility and usability of large geospatial datasets in climate adaptation research.

How to cite: Moa Myklebust, E., Formo Kihle, O., and Magin, J.: The Pangeo Ecosystem Supporting Climate Change Adaptation: The FAIR2Adapt RiOMar Case Study, EGU General Assembly 2025, Vienna, Austria, 27 Apr–2 May 2025, EGU25-21603, https://doi.org/10.5194/egusphere-egu25-21603, 2025.

EGU25-487 | ECS | Posters on site | OS1.1

Oceanic heat transport along the Norwegian Atlantic Current and the role of eddies 

Dong Jian, Xiaoming Zhai, Ian Renfrew, and David Stevens

The warm and saline Atlantic Water in the Nordic Seas serves as a conduit for poleward oceanic heat transport and plays  a crucial role in regulating the Northern Hemisphere climate. However, the impact of mesoscale eddies on this heat transport remains unclear, owing to a lack of in situ observations and numerous ocean modeling challenges. Our study aims to improve  the model representation of eddies and investigate their role in  oceanic heat transport in the Nordic Seas. Using a novel configuration of the MITgcm ocean-ice model,  with a resolution ranging from 1 to 4 km, we analyze 21 years of simulation. We show that oceanic heat transport anomalies are predominantly driven by velocity variations along Norwegian Atlantic Current, while lateral eddies play a significant role in leaking heat westward along a few key pathways, most notably near the Lofoten Escarpment. Further investigation on the linkage between ocean's temporal variability with the atmosphere is underway. Our study emphasizes the significant role of eddies in modulating poleward heat transport toward the Arctic by diverting heat laterally. 

How to cite: Jian, D., Zhai, X., Renfrew, I., and Stevens, D.: Oceanic heat transport along the Norwegian Atlantic Current and the role of eddies, EGU General Assembly 2025, Vienna, Austria, 27 Apr–2 May 2025, EGU25-487, https://doi.org/10.5194/egusphere-egu25-487, 2025.

EGU25-1303 | ECS | Posters on site | OS1.1

A Dataset of Arctic Ocean Water Masses from 40 Years of Hydrographic Observations 

Kate Oglethorpe, Joshua Lanham, Rafael Reiss, Emma Boland, and Ali Mashayek

The Arctic Ocean is changing significantly and rapidly in a warming climate. To monitor these changes, it is useful to classify the Arctic Ocean into water masses containing waters of same origin and similar physical and biogeochemical properties. However, there are significant barriers to Arctic Ocean water mass classification: observations of seawater properties are sparsely and heterogeneously sampled in space and time, and traditional water mass classification relies on extensive knowledge of water mass characteristics and circulation and mixing. We propose a tool for estimating relative fractions of Arctic Ocean water masses (0-1) from observations of seawater temperature and salinity, and share the classification tool and water mass dataset. Our estimates of relative fractions of water masses broadly reproduce the spatial and temporal distribution of Arctic Ocean water masses reported in the literature, most notably the key Atlantic Water (AW) and Pacific Water (PW) pathways within the Arctic Ocean and the increasing influence of AW and PW in the Arctic Ocean over the last few decades. Our classification tool and water mass dataset will help improve understanding of Arctic Ocean dynamics and changes, and provides an accessible framework for assessing the accuracy of models in representing Arctic Ocean properties.

How to cite: Oglethorpe, K., Lanham, J., Reiss, R., Boland, E., and Mashayek, A.: A Dataset of Arctic Ocean Water Masses from 40 Years of Hydrographic Observations, EGU General Assembly 2025, Vienna, Austria, 27 Apr–2 May 2025, EGU25-1303, https://doi.org/10.5194/egusphere-egu25-1303, 2025.

EGU25-1425 | Orals | OS1.1

The Arctic Subpolar gyre sTate Estimate (ASTE): A Gateway to Understanding Ice-Ocean Dynamics 

Kirstin Schulz, An Nguyen, Helen Pillar, and Patrick Heimbach

State estimates like the Arctic Subpolar gyre sTate Estimate (ASTE, Nguyen et al., 2021) are powerful tools that combine observational data and numerical models to reconstruct the ice and ocean’s physical state over time. Unlike sequential data-assimilated reanalysis products, state estimates minimize misfit to a large set of various observations by adjusting model input and parameters rather than altering the model’s physical state, thereby consistently obeying physical laws and ensuring all source and sink terms can be identified. 

In this talk, I will explain the methodology behind a state estimate and present the first release of ASTE, which provides complete estimates of the Arctic sea ice and ocean states spanning 2002-2017 at a spatial resolution of about 15 km. I will highlight how ASTE has informed studies ranging from the analysis of Atlantic Water properties in the Arctic to the characterization of beneficial environmental conditions for high-latitude benthic habitats, and how ASTE’s adjoint model, i.e., the capability of running the model backwards in time to track which processes have influenced a chosen variable, provides a powerful method to unambiguously identify causal connections in the coupled Arctic system.

Towards the next release of ASTE, I will present a study of the impact of tides on Arctic sea ice, based on a higher, 3.5 km resolution version of ASTE that has been run for one full seasonal cycle, in a configuration including and excluding tides. While the study shows an overall decrease in sea ice volume in the presence of tides associated with increased vertical mixing and the upward flux of heat from deeper layers of the Arctic Ocean in line with previous findings, it also reveals an unexpected result, pointing to a new mechanism resulting in delayed sea ice melt in summer.

How to cite: Schulz, K., Nguyen, A., Pillar, H., and Heimbach, P.: The Arctic Subpolar gyre sTate Estimate (ASTE): A Gateway to Understanding Ice-Ocean Dynamics, EGU General Assembly 2025, Vienna, Austria, 27 Apr–2 May 2025, EGU25-1425, https://doi.org/10.5194/egusphere-egu25-1425, 2025.

EGU25-2008 | ECS | Posters on site | OS1.1

 Future projection of the Ocean Dynamic Sea Level over the Irish-Nordic-Arctic Seas under different global warming thresholds 

Emmanuel Eresanya, Gerard D. McCarthy, Veeranjaneyulu Chinta, and Hyacinth C. Nnamchi

The Arctic is a complex system in which ocean, sea ice, land, and atmosphere all interact. Poleward energy transport is crucial for climate variability in the Arctic and is controlled by atmospheric transport at the middle-high latitudes. The ocean has been rising non-uniformly under global warming. The future state of the ocean on a regional scale is uncertain. Coupled Model Intercomparison Project Phase 6 (CMIP6) provides different scenarios (SSPs 1.26, 2.45, 5.85) that give insights into this uncertainty across the chosen regions under different global warming thresholds. Here, we show that with every degree change in the global warming threshold, there is a corresponding change in the ocean dynamic sea level (DSL). The Arctic, Irish and Norwegian coasts respond at different scales under the global warming thresholds. This study provides insight into the Irish-Nordic-Arctic Sea's future state, which is necessary for policy formulation and planning.

How to cite: Eresanya, E., McCarthy, G. D., Chinta, V., and Nnamchi, H. C.:  Future projection of the Ocean Dynamic Sea Level over the Irish-Nordic-Arctic Seas under different global warming thresholds, EGU General Assembly 2025, Vienna, Austria, 27 Apr–2 May 2025, EGU25-2008, https://doi.org/10.5194/egusphere-egu25-2008, 2025.

The Arctic Ocean has increasingly drawn widespread attention in global climate change system. However, due to the high-latitude air-sea characteristics and the seasonal distribution of sea ice, the on-site marine environment surveys are more challenging than other oceans.

To understand the ice‒sea thermal dynamic processes, we built the in-situ observation dataset based on a series of international in-situ observation plans carried out in the Arctic Ocean and Chinese Arctic Research Expedition. With the support of polar icebreakers Xuelong and Xuelong-2, China has carried out a series of scientific investigations in Arctic Ocean for special phenomena, and accumulated many first-hand in-situ observations.

We used quality control and data processing methods to analyze and re-arrange the data mentioned above and obtained nearly a million thermohaline profiles from1983 to 2023. Meanwhile, a monthly climatology dataset is established with a horizontal resolution of 0.25×0.25° and 57 vertical layers. The datasets can serve as a standard reference for future observation data quality control, and can also be used to correct the thermohaline results of existing ice-ocean coupled models.

In order to evaluate the quality of the in-situ observations dataset, we selected typical water exchange areas for water mass analysis and partial thermohaline profile analysis,the result shows a significant seasonal variation and has a high quality and effectively reflects the overall hydrological characteristics of the Arctic Ocean. Meanwhile we compared the climatology datasets with WOA18, and find out there is clearly positive feedback by using Chinese Arctic Research Expedition data in the climatology datasets we built. And the thermohaline has stronger continuity and more stable structure. In the key of Chinese Arctic Research Expedition area, the analysis can reflect the high temperature Pacific water flowing into the Arctic Ocean, with a clear meridional temperature stratification, and temperature gradually decreasing from south to north.

Evaluating Ocean Heat Content (OHC) with in-situ observations climatology datasets show that the climatology dataset reflects the accurate state of the OHC, and can be used to verify and evaluate the OHC calculated from different model.

Next step, for studying the thermohaline structure of the Arctic ocean, we will use AI models for training with reanalysis data to get the prediction field by using the observation datasets we built.

How to cite: Wu, X. and Li, J.:  Construction and Evaluation of In-situ Observation Dataset and Its Climatology in Arctic Ocean, EGU General Assembly 2025, Vienna, Austria, 27 Apr–2 May 2025, EGU25-2085, https://doi.org/10.5194/egusphere-egu25-2085, 2025.

EGU25-2262 | ECS | Posters on site | OS1.1

Integrated Retrieval of Surface and Atmospheric Variables in the Arctic From FY-3D MWRI With a Time-Constraint Optimal Estimation Method 

Ziyu Yan, Yufang Ye, Georg Heygster, Xin Zhang, Zhuoqi Chen, and Cheng Xiao

Integrated retrieval using the optimal estimation (OE) method iteratively finds a set of geographical parameters that best match the observations. However, this method becomes more challenging over the ice surface due to the highly sensitive parameters such as sea ice concentration (SIC) and multiyear ice concentration (MYIC). In this study, a new time constraint that captures the distinct temporal characteristics of SIC and MYIC is incorporated into the OE method. The integrated retrievals, using both the original and time-constraint OE method (referred to as OE and OE-Z, respectively), were conducted based on FengYun-3D (FY-3D) microwave radiation imager (MWRI) data. Compared to other radiometer-based SIC and MYIC products, OE-Z outperforms OE, with the correlations increasing from 0.91 to 0.96 for SIC and from 0.41 to 0.49 for MYIC. The time constraint in OE-Z effectively mitigates the anomalous retrievals in SIC and MYIC, resulting in smoother and more reasonable time series than OE. Improvements in SIC and MYIC lead to enhanced simulation of surface microwave emission, thus improving the retrieval of atmospheric parameters. In comparison with the MOSAiC total water vapor (TWV) measurements, the RMSE in OE-Z reduces from 1.72 to 1.66 kg/m2, and the correlation increases from 0.46 to 0.50. The simulated brightness temperature (TB) biases in OE-Z reduce from 0.71 to 0.31 K at 36 GHz and from −8.95 to −7.72 K at 89 GHz. This emphasizes the importance of imposing suitable constraints on highly sensitive parameters in integrated retrieval.

How to cite: Yan, Z., Ye, Y., Heygster, G., Zhang, X., Chen, Z., and Xiao, C.: Integrated Retrieval of Surface and Atmospheric Variables in the Arctic From FY-3D MWRI With a Time-Constraint Optimal Estimation Method, EGU General Assembly 2025, Vienna, Austria, 27 Apr–2 May 2025, EGU25-2262, https://doi.org/10.5194/egusphere-egu25-2262, 2025.

EGU25-3482 | ECS | Posters on site | OS1.1

Sub-Pixel Precision Image Matching for Sea Ice Drift Retrieval Using Maximum Cross-Correlation 

Xue Wang and Zhizhuo Xu

Sea ice drift has significant impacts on climate change and navigation safety. Currently, various approaches have been employed to address quantization error and achieve subpixel precision in sea ice drift extraction using maximum cross-correlation (MCC). However, limited research has been conducted to compare these approaches. This study compares the performance of three approaches: image oversampling, subpixel similarity estimation, and the combination of both, for MCC-based Arctic sea ice drift extraction with subpixel precision at different time intervals. The research findings indicate that the combined approach of image oversampling and subpixel similarity estimation outperforms any single approach in terms of the accuracy of extracted sea ice drift. Additionally, this study provides recommended combinations of spatial resolutions (achieved through image oversampling) and subpixel similarity estimation methods for retrieving sea ice drift based on Fengyun-3D (FY-3D) Microwave Radiation Imager (MWRI) data at different time intervals.

How to cite: Wang, X. and Xu, Z.: Sub-Pixel Precision Image Matching for Sea Ice Drift Retrieval Using Maximum Cross-Correlation, EGU General Assembly 2025, Vienna, Austria, 27 Apr–2 May 2025, EGU25-3482, https://doi.org/10.5194/egusphere-egu25-3482, 2025.

EGU25-3536 | ECS | Orals | OS1.1

Large-scale destratification in the Eurasian Basin thermocline driving Atlantic Water shoaling 

François Challet, Christophe Herbaut, Marie-Noëlle Houssais, and Gianluca Meneghello

The stratification of the Arctic Ocean plays a central role in regulating the impact of climate change on the Arctic. Though the stratification in the eastern Eurasian Basin halocline is known to have weakened since the 2000s, the variability over the full AW depth range in the whole Eurasian Basin has been little explored.

Our analysis aims to combine available in-situ observations to characterize the regional changes in stratification in the Eurasian Arctic Ocean over the past four decades. We find that, in both the Nansen and Amundsen basins, the variability of the temperature and salinity is most pronounced in the thermocline that separates the Atlantic Water (AW) core from the stratified halocline. This variability is affected by both warm and salty pulses entering through the Fram Strait, and by long-term trends. Positive temperature and salinity anomalies in the thermocline are associated with a destratification of the thermocline down to the AW core. In these layers, the stratification is estimated to have decreased by up to 50% across the Eurasian Arctic over the past 40 years, implying the possibility of enhanced vertical salt and heat fluxes up to the base of the halocline. In contrast, the stratification of the halocline has remained approximately constant or increased. Using a conceptual advective-diffusive model which takes into account the impact of stratification changes on vertical diffusion, we further show that the observed structure of changes is well reproduced by vertical diffusion of anomalies travelling from the Fram Strait around the Eurasian Basin. Our approach, using clustering techniques to divide the Eurasian Basin into several regions with coherent temperature, salinity and stratification profiles, provides new insights on the regional evolution of the Eurasian Arctic stratification, in particular in regions where few long-term studies are available like the Amundsen Basin.

How to cite: Challet, F., Herbaut, C., Houssais, M.-N., and Meneghello, G.: Large-scale destratification in the Eurasian Basin thermocline driving Atlantic Water shoaling, EGU General Assembly 2025, Vienna, Austria, 27 Apr–2 May 2025, EGU25-3536, https://doi.org/10.5194/egusphere-egu25-3536, 2025.

EGU25-4070 | ECS | Posters on site | OS1.1

Unpacking fjord ice in Hornsund, Svalbard 

Zuzanna Swirad, Malin Johansson, and Eirik Malnes

Fjord ice, that includes both sea and glacier ice, is an important part of the fjord microclimate that impacts e.g. water-atmosphere energy transfer, habitat conditions, ocean wave transformation and coastal processes. It also plays a role in ship and snowmobile operations. Understanding the trends in fjord ice extent, duration and timing aids understanding the impact of changing climate on the magnitude of natural hazards (such as coastal flooding and erosion) and improving future predictions.

Satellite images provide high-frequency large-area information on the state of the fjord ice, with Synthetic Aperture Radar (SAR) imagery being unaffected by polar night and weather conditions. Few studies have attempted automating fjord ice detection from satellite imagery, likely due to problems related to the topography influence on the sea state, mixed land/water pixels, presence of rocks and islands and wave breaking in the nearshore.

This study builds on the recent progress of Johansson et al. (2020) who adapted the semi-automated binary ice/open water classification method of Cristea et al. (2020) to Svalbard fjord environment, and Swirad et al. (2024a) who created a near-daily dataset of binary ice/open water maps at 50 m resolution for Hornsund fjord from the entire Sentinel-1 A/B dataset spanning Oct 2014 – Jun 2023. Swirad et al. (2024a) did not find direct relationships between fjord-scale ice coverage and air and water temperatures. Nonetheless, temporal peaks in ice coverage existed in March for the main basin, April for the inner bays and locally in October. The authors associated these with the arrival of pack ice from the Greenland Sea, formation of in situ fast ice and intensification of tidewater glacier calving, respectively.

Speculating that stronger relationships can be found between climate and ice coverage if fjord ice is unpacked into ‘drift ice’, ‘fast ice’ and ‘glacier ice’ we developed an algorithm that splits the ‘ice’ from the binary classification into the three classes using pixel and polygon properties such as continuity in time, location, size, shape and timing. We then explored relationships between ice, meteorological and hydrographic conditions. The dataset was also extended back to Jan 2012 using RADARSAT-2 imagery (Swirad et al., 2024b).

References:

Cristea, A., van Houtte, J., and Doulgeris, A. P.: Integrating Incidence Angle Dependencies Into the Clustering-Based Segmentation of SAR Images, IEEE J. Sel. Top. Appl., 13, 2925–2939, https://doi.org/10.1109/JSTARS.2020.2993067, 2020.

Johansson, A. M., Malnes, E., Gerland, S., Cristea, A., Doulgeris, A. P., Divine, D. V., Pavlova, O., and Lauknes, T. R.: Consistent ice and open water classification combining historical synthetic aperture radar satellite images from ERS-1/2, Envisat ASAR, RADARSAT-2 and Sentinel-1A/B, Ann. Glaciol., 61, 40–50, https://doi.org/10.1017/aog.2019.52, 2020.

Swirad, Z. M., Johansson, A. M., and Malnes, E.: Extent, duration and timing of the sea ice cover in Hornsund, Svalbard, from 2014–2023, The Cryosphere, 18, 895–910, https://doi.org/10.5194/tc-18-895-2024, 2024a.

Swirad, Z. M., Johansson, A. M., and Malnes, E.: Ice distribution in Hornsund fjord, Svalbard from RADARSAT-2 (2012-2016) [dataset], PANGAEA, https://doi.org/10.1594/PANGAEA.969031, 2024b.

How to cite: Swirad, Z., Johansson, M., and Malnes, E.: Unpacking fjord ice in Hornsund, Svalbard, EGU General Assembly 2025, Vienna, Austria, 27 Apr–2 May 2025, EGU25-4070, https://doi.org/10.5194/egusphere-egu25-4070, 2025.

EGU25-4579 | ECS | Orals | OS1.1

Using Noble Gases to Constrain Parameterizations of Arctic Air-Sea-Ice Gas Exchange Processes 

Chiara-Marlen Hubner, Stanley Scott, Yannis Arck, and Werner Aeschbach

The Arctic Ocean plays an important role in the global climate system as it acts, for example, as major reservoir of anthropogenic carbon. Despite its global significance, data on physical parameters and tracers in the Arctic Ocean are still sparse and thus carbon inventory estimates only weakly constrained, for which insights into Arctic air-sea-ice gas exchange and ventilation need to be enhanced. Noble gases, with their biological and chemical inertness and constant atmospheric abundance history, fill this gap, as their concentrations in water are set by the conditions of last atmospheric contact. In light of this, water samples taken during the Synoptic Arctic Survey (SAS) expedition to the Central Arctic Ocean with the Swedish icebreaker Oden in summer 2021 (SAS-Oden 2021) at six stations from the surface to the seafloor were analyzed for their noble gas content. This first application of the full set of the five stable noble gases (helium, neon, argon, krypton and xenon) to the Arctic Ocean marks a new step towards a comprehensive understanding of Arctic Ocean dynamics.

The measured profiles show a strong influence of rapid cooling, excess air injection and brine rejection from sea ice formation, which affect the light and heavy noble gases differently, depending on their size, solubility and diffusivity. Building upon work from groundwater hydrology and extensions to cave calcites, as well as previous ocean applications of noble gases, the concepts of recharge temperatures, excess air terms and ice fractions or freezing rates are transferred to the Arctic Ocean, enabling the development of new parameterizations of the air-sea-ice exchange processes. We present two “static” model approaches, differing in the sea ice parameterization, and a “dynamic” mixed reactor-type model for two limits (steady state and quasi-steady state), resulting in different parameterizations of rapid cooling. The fit results from a least-squares regression for all four models are able to reproduce the measured concentrations both accurately and precisely and thus allow for predictions for other gases. In our study, these are the anthropogenic transient tracers sulfur hexafluoride (SF6) and dichlorodifluoromethane (CFC-12), which were also measured during the SAS-Oden 2021 expedition and are used to determine water ages, a task for which the intitial surface saturations need to be known. We suggest a relative oversaturation of around 6% of SF6 to CFC-12 due to the deviating impact of excess air, compatible with previous estimates from noble gas measurements.

How to cite: Hubner, C.-M., Scott, S., Arck, Y., and Aeschbach, W.: Using Noble Gases to Constrain Parameterizations of Arctic Air-Sea-Ice Gas Exchange Processes, EGU General Assembly 2025, Vienna, Austria, 27 Apr–2 May 2025, EGU25-4579, https://doi.org/10.5194/egusphere-egu25-4579, 2025.

Starting from May 2023, a global anomaly event led to the highest recorded sea surface temperature (SST) in history, underscoring the urgency of understanding how warming oceans impact polar and subpolar regions. Against this backdrop, our study focuses on the Sea of Okhotsk, where data from the U.S. National Snow and Ice Data Center and sea surface height measurements revealed an unprecedented, ice-free zone—measuring 50 to 80 kilometers in radius—near the Gulf of Patience (たらいかわん), east of Sakhalin Island, during Feb. – Mar. 2023. This phenomenon stands in stark contrast to observations in previous years and appears closely linked to sea surface height anomalies (SSHA). The role of such localized oceanic features, including eddies, in shaping late-spring sea ice melting patterns is of interest.

During the SOYA cruise in February 2023, National Central University (Taiwan) and Hokkaido University deployed eleven Taiwan-made drifting wave buoys. These buoys captured high-resolution data on waves, ocean currents, and sea temperatures, revealing robust mesoscale ocean eddy activity within the region. This study integrates buoy-based observations, satellite remote sensing, and numerical model outputs to explore the dynamic relationship between mesoscale eddies and the rapid formation of the ice-free zone. It is the aim to investigate how eddies influence springtime sea ice melting and distribution in the Okhotsk Sea. The preliminary findings may have implications for climate modeling, marine ecosystems, and regional socioeconomic activities, and will be shown in detail in the poster.

How to cite: Chien, H., Wang, A.-S., and Lin, L.-C.: Observations of an Emerging Ice-Free Zone in the Sea of Okhotsk during the Spring Sea-Ice Melting Period amid the 2023 Global SST Warming, EGU General Assembly 2025, Vienna, Austria, 27 Apr–2 May 2025, EGU25-4756, https://doi.org/10.5194/egusphere-egu25-4756, 2025.

EGU25-4891 | ECS | Orals | OS1.1

Anthropogenic amplification of the Arctic near-surface wind speed 

Kaiqiang Deng, Wanlei Liu, Song Yang, and Deliang Chen

The near-surface wind speed in the Arctic plays an increasingly critical role in shaping local air-sea interactions and ensuring the safety of trans-Arctic shipping. However, its potential changes under a warming climate and the underlying mechanisms driving these changes remain unclear. By analyzing reanalysis data and model simulations, we demonstrate that Arctic surface wind speed has significantly increased since the 1960s, with the most pronounced acceleration occurring over the Arctic Ocean basins adjacent to the North Atlantic and the North Pacific. Historical simulations from CMIP6 models indicate that this acceleration is primarily driven by greenhouse gas induced warming, which is particularly prominent during the cold seasons. On one hand, the rapid surface warming in the Arctic disrupts the temperature inversion over sea ice, reducing atmospheric stability in the lower troposphere and enhancing thermal turbulence in the Arctic boundary layer. On the other hand, Arctic warming raises the height of the boundary layer, allowing stronger turbulence to mix high-altitude wind speed down to the surface, thereby intensifying near-surface wind speeds. Furthermore, CMIP6 models project a robust increase in Arctic NWS under various warming scenarios throughout the 21st century. This increase is especially prominent near the Kara Sea and the Beaufort Sea, with stronger wind speeds projected under higher SSP scenarios.

How to cite: Deng, K., Liu, W., Yang, S., and Chen, D.: Anthropogenic amplification of the Arctic near-surface wind speed, EGU General Assembly 2025, Vienna, Austria, 27 Apr–2 May 2025, EGU25-4891, https://doi.org/10.5194/egusphere-egu25-4891, 2025.

EGU25-5304 | Posters on site | OS1.1

Reassessing primary production in polar ocean: A novel approach using mooring systems 

Jisoo Park, Eunho Ko, Younjoo Lee, and Eun Jin Yang

Rapid changes in the polar marine environment, driven by climate change, are altering the variability of nutrient and light distribution, with significant impacts on primary producer growth. However, access to polar regions is limited, and satellite data from high-latitude areas are typically available only during the summer, complicating the acquisition of continuous in-situ data. To address this, we collected year-round chlorophyll-a (Chl-a) concentration data in polar regions using a mooring system and compared the results with reanalysis data. Unlike previous satellite-based studies that rely on surface measurements, we applied the annual vertical distribution of Chl-a to the Vertically Generalized Production Model (VGPM) to estimate annual primary production more accurately. Our findings reveal that phytoplankton exhibited a subsurface chlorophyll maximum (SCM) as sea ice retreated, with the SCM layer persisting for approximately four months—contrary to the gradually deepening SCM distribution predicted by model-based reanalysis data. This suggests that light and nutrient conditions within the SCM remained stable, supporting continuous phytoplankton growth. The estimated annual primary production, based on this vertical distribution of Chl-a, was 6.85 gC m−2 yr−1, which is more than ten times higher than estimates based on satellite data alone, highlighting significant underestimation by satellite-based approaches. Furthermore, this value was comparable to the average satellite-derived primary production of surrounding coastal and shelf areas (15.80 ± 10.65 6.85 gC m−2 yr−1). These results emphasize the importance of incorporating vertical distribution of phytoplankton and light in polar marine ecological models to enhance our understanding of carbon cycling and food web dynamics in these regions.

How to cite: Park, J., Ko, E., Lee, Y., and Yang, E. J.: Reassessing primary production in polar ocean: A novel approach using mooring systems, EGU General Assembly 2025, Vienna, Austria, 27 Apr–2 May 2025, EGU25-5304, https://doi.org/10.5194/egusphere-egu25-5304, 2025.

EGU25-5349 | Posters on site | OS1.1

Turbulent heat fluxes in the North Water Polynya and ice estimated based on ASRv2 data and their impact on cloud 

Fengming Hui, Haiyi Ren, Mohammed Shokr, Tianyu Zhang, Zhilun Zhang, and Xiao Cheng

The presence or absence of sea ice introduces a substantial perturbation to surface‒atmosphere energy exchanges. Comprehending the effect of varying sea ice cover on surface‒atmosphere interactions is an important consideration for understanding the Arctic climate system. The recurring North Water Polynya (NOW) serves as a natural laboratory for isolating cloud responses to a rapid, near-step perturbation in sea ice. In this study, we employed high-resolution Arctic System Reanalysis version 2 (ASRv2) data to estimate turbulent heat fluxes over the NOW and nearby sea ice (NSI) area between 2005/2006 and 2015/2016. The results indicate that the average turbulent heat fluxes in the polynya are about 87% and 86% higher than in the NSI area over the 10 years during the entire duration of the polynya and during polar night, respectively. Enhanced turbulent heat fluxes from the polynya tend to produce more low-level clouds. The relationship between the polynya and low cloud in winter was examined based on Cloud‒Aerosol Lidar and Infrared Pathfinder Satellite Observations (CALIPSO). The low-cloud fraction (0–2 km) was about 7–34% larger over the polynya than the NSI area, and the ice water content below 200 m was about 250%–413% higher over the former than the latter. The correlation between cloud fraction and turbulent heat fluxes in the polynya peaks around the altitude of 200–300 m. These results suggest that the NOW affects the Arctic boundary layer cloudiness and structure in wintertime. Furthermore, higher horizontal resolution reanalysis data can advance our understanding of the cloud-polynya response.

How to cite: Hui, F., Ren, H., Shokr, M., Zhang, T., Zhang, Z., and Cheng, X.: Turbulent heat fluxes in the North Water Polynya and ice estimated based on ASRv2 data and their impact on cloud, EGU General Assembly 2025, Vienna, Austria, 27 Apr–2 May 2025, EGU25-5349, https://doi.org/10.5194/egusphere-egu25-5349, 2025.

EGU25-5642 | Posters on site | OS1.1

The Arctic Beaufort Gyre in CMIP6 Models: Present and Future 

Marylou Athanase, Raphael Köhler, Céline Heuzé, Xavier Lévine, and Ryan Williams

The Beaufort Gyre is an important feature of the Arctic Ocean. By accumulating or releasing freshwater, it influences ocean properties both within the Arctic and as far as the North Atlantic. Yet, its future remains uncertain: the gyre could strengthen as sea ice declines and allows increased wind stress on the ocean, or weaken along with the Beaufort High pressure system. Here, we provide a first evaluation of the Beaufort Gyre in historical and climate-change simulations from 27 available global climate models. We find that the vast majority of models overestimate the gyre area, strength, and northward extent. After discarding the models with too inaccurate a gyre and its drivers – namely, the sea ice cover and Beaufort High – we quantify changes in the Beaufort Gyre under two emission scenarios: the intermediate SSP2–4.5 and the high-warming SSP5–8.5. By the end of the 21st century, most models simulate a significant decline or even disappearance of the Beaufort Gyre, especially under SSP5–8.5. We show that this decline is mainly driven by a simulated future weakening of the Beaufort High, whose influence on the Beaufort Gyre variations is enhanced by the transition to a thin-ice Arctic. The simulated gyre decline is associated with an expected decrease in freshwater storage, with reduced salinity contrasts between the gyre and both Arctic subsurface waters and freshwater outflow regions. While model biases and unresolved processes remain, such possible stratification changes could shift the Atlantic-Arctic Meridional Overturning Circulation northward.

How to cite: Athanase, M., Köhler, R., Heuzé, C., Lévine, X., and Williams, R.: The Arctic Beaufort Gyre in CMIP6 Models: Present and Future, EGU General Assembly 2025, Vienna, Austria, 27 Apr–2 May 2025, EGU25-5642, https://doi.org/10.5194/egusphere-egu25-5642, 2025.

EGU25-6241 | Posters on site | OS1.1

An assessment of the CMIP6 performance in simulating Arctic sea ice volume flux via Fram Strait 

Yufang Ye, Huiyan Kuang, Shaozhe Sun, Shaoyin Wang, Haibo Bi, Zhuoqi Chen, and Xiao Cheng

Numerical models serve as an essential tool to investigate the causes and effects of Arctic sea ice changes. Evaluating the simulation capabilities of the most recent CMIP6 models in sea ice volume flux provides references for model applications and improvements. Meanwhile, reliable long-term simulation results of the ice volume flux contribute to a deeper understanding of the sea ice response to global climate change.

In this study, the sea ice volume flux through six Arctic gateways over the past four decades (1979–2014) were estimated in combination of satellite observations of sea ice concentration (SIC) and sea ice motion (SIM) as well as the Pan-Arctic Ice-Ocean Modeling and Assimilation System (PIOMAS) reanalysis sea ice thickness (SIT) data. The simulation capability of 17 CMIP6 historical models for the volume flux through Fram Strait were quantitatively assessed. Sea ice volume flux simulated from the ensemble mean of 17 CMIP6 models demonstrates better performance than that from the individual model, yet IPSL-CM6A-LR and EC-Earth3-Veg-LR outperform the ensemble mean in the annual volume flux, with Taylor scores of 0.86 and 0.50, respectively. CMIP6 models display relatively robust capability in simulating the seasonal variations of volume flux. Among them, CESM2-WACCM performs the best, with a correlation coefficient of 0.96 and a Taylor score of 0.88. Conversely, NESM3 demonstrates the largest deviation from the observation/reanalysis data, with the lowest Taylor score of 0.16. The variability of sea ice volume flux is primarily influenced by SIM and SIT, followed by SIC. The extreme large sea ice export through Fram Strait is linked to the occurrence of anomalously low air temperatures, which in turn promote increased SIC and SIT in the corresponding region. Moreover, the intensified activity of Arctic cyclones and Arctic dipole anomaly could boost the southward sea ice velocity through Fram Strait, which further enhance the sea ice outflow.

How to cite: Ye, Y., Kuang, H., Sun, S., Wang, S., Bi, H., Chen, Z., and Cheng, X.: An assessment of the CMIP6 performance in simulating Arctic sea ice volume flux via Fram Strait, EGU General Assembly 2025, Vienna, Austria, 27 Apr–2 May 2025, EGU25-6241, https://doi.org/10.5194/egusphere-egu25-6241, 2025.

The Arctic Ocean is undergoing rapid transformations due to the loss of sea ice, shifts in its heat budget and physical structure, and the “greening” of the polar surface ocean. These changes have profound implications for ocean biogeochemistry, the carbon cycle, and ocean acidification (OA). As part of the U.S. Synoptic Arctic Survey (SAS), we conducted a transect from the Chukchi Sea shelf to the North Pole during late summer 2022, enabling comprehensive sampling of the ocean carbon cycle in the seldom-sampled high Arctic. Discrete samples of Dissolved Inorganic Carbon (DIC) and Total Alkalinity (TA) were collected from CTD-hydrocasts spanning surface to deep waters, complemented by higher-frequency underway measurements of DIC, TA, and pH. These observations establish a critical baseline for tracking future changes in Arctic carbon dynamics, biogeochemistry, and acidification. Additionally, the 2022 US SAS dataset allows for comparison with earlier observations, including the 1994 Arctic Ocean Section (AOS), the 2005 Beringia expedition, and the 2015 GEOTRACES Arctic cruise. Our synthesis reveals significant and ongoing changes in the Arctic Ocean carbon cycle, including: (1) substantial uptake of anthropogenic CO₂; (2) alterations in the driving force for air-sea CO₂ exchange; (3) a decreasing capacity of the Arctic Ocean to absorb atmospheric CO₂; and (4) intensified impacts on surface pH and ocean acidification. These findings underscore the accelerating pace of carbon cycle changes in the high Arctic and highlight the importance of sustained monitoring.

How to cite: Garley, R. and Bates, N.: Arctic Ocean inorganic carbon and acidification changes from 1994 to 2022 across the Chukchi Sea to the North Pole: A US contribution to the International Synoptic Arctic Survey Program, EGU General Assembly 2025, Vienna, Austria, 27 Apr–2 May 2025, EGU25-6782, https://doi.org/10.5194/egusphere-egu25-6782, 2025.

EGU25-6867 | ECS | Posters on site | OS1.1

Ocean-to-Ice Heat Flux in the Central Arctic: Results from the MOSAiC Expedition (2019-2020) 

Yeon Choi, Torsten Kanzow, Benjamin Rabe, and Simon Reifenberg

 The Arctic is a hot spot of climate change. Sea ice and snow, in particular, act as an insulator that prevent heat exchange between the ocean and the atmosphere and have been an important factor in mitigating temperature increases in the Arctic. However, the reduction of sea ice over the past 40 years has led to an increase in ocean-atmosphere heat exchange, contributing to Arctic Amplification. Despite its importance, obtaining observational data beneath sea ice in the Arctic during winter has been challenging due to the unique conditions of ice coverage, especially in winter. Several studies have been able to make use of recent advances in autonomous instrumentation to calculate wintertime ocean to ice heat flux (OHF). However, there remain considerable discrepancies in OHF estimates, even when examining the same time periods and research areas, primarily due to variations in calculation methods.

 In this study, we used observational data from the Multidisciplinary drifting Observatory for the Study of Arctic Climate (MOSAiC) to calculate OHF from October 2019 to May 2020. The observations were made by Woods Hole Oceanographic Institution Ice-tethered Profilers and Microstructure profilers drifting with sea ice along the Transpolar Drift. Here, we assess the applicability of an OHF parameterization from observational data, relying on the temperature difference between the mixed layer and the freezing temperature.

 The results in winter predominantly show negative (downward) OHF. We consider those results physically implausible, and they seem to be related to the ubiquitous presence of supercooled water in the mixed layer. When applying near surface temperature rather than freezing temperature to assess the heat content in the boundary layer, the wintertime OHF values are closed to zero until mid-March 2020. This result is in line with direct (dissipation based) measurements of OHF from the stratified ocean into the mixed layer during the same period. This study, therefore, suggests limitations in the applicability of the OHF parameterization in supercooled conditions. By opting for ocean surface temperature observations from the Arctic winter of 2019-2020, which were consistently lower than the freezing temperature, we anticipate that these refined calculation methods will yield more accurate results for assessing heat flux in future Arctic winters.

 From mid-March to early May, the OHF increased significantly, and so did the upward heat flux into the mixed layer. Our results suggest this shift occurred once the sea ice had drifted southward across the Gakkel Ridge toward Fram Strait. Analyzing the hydrographic properties of the upper ocean, we conclude that not only seasonal but also regional changes contributed to this shift.  

How to cite: Choi, Y., Kanzow, T., Rabe, B., and Reifenberg, S.: Ocean-to-Ice Heat Flux in the Central Arctic: Results from the MOSAiC Expedition (2019-2020), EGU General Assembly 2025, Vienna, Austria, 27 Apr–2 May 2025, EGU25-6867, https://doi.org/10.5194/egusphere-egu25-6867, 2025.

EGU25-7121 | ECS | Posters on site | OS1.1

First look at Arctic eddies in a kilometric NEMO5 simulation 

Stefanie Rynders, Yevgeny Aksenov, Andrew Coward, and James Harle

Arctic eddies are important for mixing and heat exchange between sea ice and ocean. The effect carries over to the ecosystem to cause spatial patterns of primary production up to fish distribution. Strong stratification makes the Rossby radius of eddies on Arctic shelve very small resulting in spatial gradients in eddy sizes over the Arctic. Limited resolution of models in the past has been preventing correct representation. We present eddy statistics in a kilometric Arctic Ocean NEMO-SI3 model, using NEMO version 5.0 with the RK3 advection scheme and the TKE mixing scheme. The sea ice rheology is aEVP. We aim to validate the number of eddies as well as eddy sizes with available data from satellite and moorings. This simulation was done as part of the CANARI project, which includes examination of future sea ice loss impact on mixing and the possibility of accelerated sea ice decline. This work was funded by the Natural Environment Research Council (NERC) project CANARI NE/W004984/1. This work used the ARCHER2 UK National Supercomputing Service (https://www.archer2.ac.uk).

How to cite: Rynders, S., Aksenov, Y., Coward, A., and Harle, J.: First look at Arctic eddies in a kilometric NEMO5 simulation, EGU General Assembly 2025, Vienna, Austria, 27 Apr–2 May 2025, EGU25-7121, https://doi.org/10.5194/egusphere-egu25-7121, 2025.

EGU25-7127 | ECS | Posters on site | OS1.1

Mapping of sea and glacier ice distribution in 2018-2023 in the Hornsund fjord, Svalbard with PlanetScope imagery 

Elizabeth Makhotina, Gareth Rees, Zuzanna Swirad, and Olga Tutubalina

Understanding the distribution and variations of sea and glacier ice coverage is critically important for assessing both the impacts and drivers of climate change, particularly in the Arctic. Sea ice responds dynamically to both ocean and atmospheric motion, implying variability on very short timescales which is challenging to monitor. In this study we assess the ability of PlanetScope satellite imagery, offering both high spatial and temporal resolutions, to analyse temporal variability. The study area is Isbjørnhamna-Hansbukta area in north-western Hornsund, Svalbard -  a fjord characterised by both in situ formed sea ice (fast ice and drift ice broken from the fast ice e.g. by waves), pack ice drifting into the fjord from south-west with Sørkapp Current that brings cold water masses from Barents Sea, and glacier ice from calving Hansbeen. 

We selected cloud-free images over a 4.5 ✕ 4.9 km AOI, large enough to depict the spread of sea ice to ensure accuracy in the analysis. From ten images captured in 2023, we collected sample reflectance data for three categories: thin ice, thick ice, and water. Thin ice in the AOI is typically grey and grey-white sea ice (10-30 cm) as well as brash ice and growlers, while thick ice is often snow-covered young and first-year sea ice (>30cm) as well as bergy bits and icebergs. Using these data, we calculated normalised difference spectral indices for both 8-band and 4-band imagery. Coastal Blue-Green 1 and Blue-Red indices were determined to be the most effective for discriminating between the different categories, and optimum thresholds were identified. Applying these indices and thresholds in QGIS, we generated 233 maps covering the months of March to August for the years 2018 to 2023.

From  the initial visual interpretation, the results showed credible classification of the images and revealed continuous seasonal patterns for all years of the study, with minimal ice coverage observed in March, May, and July through August, a peak in sea ice coverage in April, and a resurgence of thin ice in June. However, no observable multi-year trends could be identified from a preliminary analysis of the maps, other than a sharp decline in ice coverage in 2023. Quantitative analysis of the maps allows estimates of the sea and glacier ice extent within the AOI to be made. 

This research enhances our understanding of seasonal and interannual sea and glacier ice distribution in the nearshore and coastal zone of Svalbard. These findings have the potential to inform future studies about sea ice distribution, with the PlanetScope Imagery maps to be made publicly available through the Svalbard Integrated Arctic Earth Observing System data portal at the end of the study. Future research will compare the relative advantages of PlanetScope and SAR imagery.

How to cite: Makhotina, E., Rees, G., Swirad, Z., and Tutubalina, O.: Mapping of sea and glacier ice distribution in 2018-2023 in the Hornsund fjord, Svalbard with PlanetScope imagery, EGU General Assembly 2025, Vienna, Austria, 27 Apr–2 May 2025, EGU25-7127, https://doi.org/10.5194/egusphere-egu25-7127, 2025.

EGU25-7556 | Orals | OS1.1

Research Progress and Applications of Polar Sea Ice Products Based on Multi-Source Remote Sensing Payloads of Fengyun Satellites 

Xiaochun Zhai, Shengrong Tian, Cong Yin, Kunlin Huang, Guangzhen Cao, Zhaojun Zheng, Jian Shang, Shengli Wu, Lin Chen, and Xiuqing Hu

Fengyun satellites have now developed the capability to retrieve multiple polar sea ice parameters based on active and passive microwave payloads. This includes the operational production and release of four types of polar sea ice products, including the FY-3 MWRI radiometer sea ice concentration, the FY-3E WindRAD scatterometer sea ice edge and type, and the FY-3 GNOS-R sea ice thickness. The monitoring capabilities of Fengyun satellites in the polar regions are continuously improving. This study will systematically introduce the inversion and validation of polar sea ice parameters mentioned above, focusing on the research of sea ice edge and type inversion from the WindRAD scatterometer, which is the world's first dual-frequency, dual-polarization, fan-beam rotating scanning system. The release and application of operational sea ice parameter products from Fengyun satellites can further enhance the polar sea ice monitoring capabilities and provide a scientific and reliable new data source for research related to polar and global climate change, such as climate numerical models and the monitoring of extreme climate events.

How to cite: Zhai, X., Tian, S., Yin, C., Huang, K., Cao, G., Zheng, Z., Shang, J., Wu, S., Chen, L., and Hu, X.: Research Progress and Applications of Polar Sea Ice Products Based on Multi-Source Remote Sensing Payloads of Fengyun Satellites, EGU General Assembly 2025, Vienna, Austria, 27 Apr–2 May 2025, EGU25-7556, https://doi.org/10.5194/egusphere-egu25-7556, 2025.

EGU25-7857 | Posters on site | OS1.1

Ocean heat flux and a buoy data map with noise eliminated 

Ikjun Hwang and Woosok Moon

The rise in air temperature due to global warming has significantly reduced the extent and thickness of sea ice, a phenomenon with profound implications. Sea ice loss results from complex factors, including changes in heat and momentum fluxes and internal feedbacks within the Arctic air-ocean system. This loss influences atmospheric circulation and mid-latitude weather patterns. Declining sea ice volume increases seasonal variability in ocean-atmosphere heat exchange, emphasizing the need to accurately estimate ocean heat flux at the sea ice base. Ocean heat flux, crucial for sea ice formation and melting, is challenging to measure directly. This study addresses this by using observational data to estimate ocean heat flux through the interplay of conduction (analyzed using Fourier series to reduce noise) and latent heat. The resulting Arctic buoy data map enhances predictions of sea ice dynamics.

How to cite: Hwang, I. and Moon, W.: Ocean heat flux and a buoy data map with noise eliminated, EGU General Assembly 2025, Vienna, Austria, 27 Apr–2 May 2025, EGU25-7857, https://doi.org/10.5194/egusphere-egu25-7857, 2025.

EGU25-9085 | ECS | Orals | OS1.1

Constraining Arctic Climate Projections: A Process-Based Approach to Model Weighting 

Susanna Winkelbauer, Michael Mayer, and Leopold Haimberger

Significant uncertainties in projections of various ocean and sea ice variables stem from a variety of sources, including different modeling approaches, imperfect representations of physical processes, and natural variability. Multi-model ensembles like CMIP6 are essential for assessing the range of uncertainty, however they rely on "model democracy," which assumes all models are equally plausible and independent of one-another.

Various constraining and weighting approaches are in use to minimize model uncertainties. Most of these approaches focus on state quantities, often relying solely on historical simulations of the target variable itself as the primary diagnostic. Here, we want to use more process-based diagnostics to incorporate physical mechanisms and interactions that govern the system dynamics. Previous assessments of the historical Arctic's energy budget in CMIP6 have shown tight connections between oceanic heat transports and key Arctic state quantities like sea ice and the ocean's warming rate, with substantial biases prevailing from the ocean to the Arctic surface. Using our new StraitFlux tools, which enable fast and precise calculations of oceanic transports for diverse climate models, we can quite efficiently incorporate oceanic transports into existing model weighting algorithms. By evaluating model performance against observational data and assessing their independence of one-another, we aim to identify and mitigate biases in Arctic projections. We use this approach to weight and constrain key Arctic variables, such as sea ice, for a large ensemble of CMIP6 models. For example, weighting the Arctic September sea ice extent ensemble reduces the spread in the first year of an ice-free Arctic and indicates a general tendency to an earlier ice-free Arctic than when using model democracy. Those results agree very well with past studies using different weighting diagnostics, demonstrating the robustness of the weighting approach. 

How to cite: Winkelbauer, S., Mayer, M., and Haimberger, L.: Constraining Arctic Climate Projections: A Process-Based Approach to Model Weighting, EGU General Assembly 2025, Vienna, Austria, 27 Apr–2 May 2025, EGU25-9085, https://doi.org/10.5194/egusphere-egu25-9085, 2025.

EGU25-9800 | Posters on site | OS1.1

Strong winter-time deep-water formation during the Little Ice Age in subarctic semi-enclosed formerly glaciated marginal seas (Baltic Sea and Eastern Canadian coastal waters)  

Matthias Moros, Aarno Kotilainen, Thomas Neumann, Henriette Kolling, Svenja Papenmeier, Kerstin Brembach, Kai-Frederik Lenz, Anne De Vernal, Patrick Lajeunesse, Guillaume St-Onge, Stephanie S. Kienast, Jaap S. Damste, H.E. Markus Meier, and Ralph Schneider

New hydroacoustic measurements combined with old data reveal the widespread occurrence of contourite drift deposits - indicative of persistent strong bottom currents -  at rather great water depths in the northern Baltic Sea and  Eastern Canadian coastal waters (Foxe Basin, Hudson Bay, Gulf of St. Lawrence). In addition, lag deposits suggest that strong bottom currents temporary eroded sediments most likely during the cold Little Ice Age. For example, the Little Ice Age lag deposits are found to a water depth of  ~ 300 m in Foxe Basin and to ~ 150 m in the Baltic Sea. In all ecosystems the depositional environment changed drastically with the onset of climate warming after the Little Ice Age: calm conditions prevailed leading to the accumulation of fine-grained sediments. A possible mechanism to explain the strong bottom currents during the Little Ice Age is an enhanced deep-water formation caused by accelerated convection and/or brine formation (Eastern Canadian waters) during colder winter conditions. Attempts to model the enhanced winter-time deep-water formation / convection remain inconclusive and do not match the hydroacoustic and sedimentological evidence. However, solving this issue is critical as it could allow to, e.g., reconstruct past winter temperatures based on sedimentological grain-size studies. Yet, most proxies used in paleo-oceanographic temperature reconstructions only relate to spring and summer (growing season) conditions. Our results indicate that winter temperature changes (strength and length of sea-ice season) are of critical importance for the depositional environment and bottom water ventilation in the Eastern Canadian and Baltic Sea ecosystems.

How to cite: Moros, M., Kotilainen, A., Neumann, T., Kolling, H., Papenmeier, S., Brembach, K., Lenz, K.-F., De Vernal, A., Lajeunesse, P., St-Onge, G., Kienast, S. S., Damste, J. S., Meier, H. E. M., and Schneider, R.: Strong winter-time deep-water formation during the Little Ice Age in subarctic semi-enclosed formerly glaciated marginal seas (Baltic Sea and Eastern Canadian coastal waters) , EGU General Assembly 2025, Vienna, Austria, 27 Apr–2 May 2025, EGU25-9800, https://doi.org/10.5194/egusphere-egu25-9800, 2025.

EGU25-10639 | ECS | Orals | OS1.1

The seasonal cycle of the Arctic Ocean in a summer ice-free climate : changes, driving processes and consequences. 

Camille Le Gloannec, Rym Msadek, and Camille Lique

The Arctic Ocean is a hot spot of climate change, with enhanced warming and freshening of near-surface waters and a rapid decline of sea ice in recent decades. Climate model projections suggest that the Arctic Ocean may be ice-free in summer as early as 2030-2050, accompanied by an intensified seasonal cycle of sea ice characterized by earlier melting and later growth seasons. This transition will enhance interactions between the ocean, atmosphere and sea ice, likely altering the stratification of the Arctic Ocean during summer. The projected retreat of summer sea ice in the coming decades raises the question of how the seasonal cycle of the ocean may change, which is critical in regulating chemical, biological and physical processes in the region. Given the non-uniformity of sea ice loss across the Arctic, pan-Arctic averages fail to capture the spatial variability of these changes. In this study, we analyze 36 climate models from the Coupled Model Intercomparison Project Phase 6 (CMIP6) under the SSP5-8.5 scenario to characterize regional changes in the Arctic Ocean seasonal cycle in the near future. Our results reveal an intensified seasonal cycle of sea surface temperature and a weakened seasonal cycle of sea surface salinity with significant regional variability and model dependence. Changes at depth are primarily confined to the mixed layer. By analyzing the mixed layer temperature and salinity budget for each region, we identify the key processes driving these changes. These insights enhance our understanding of the evolving seasonal dynamics of the Arctic Ocean and their broader implications in a rapidly changing climate.

How to cite: Le Gloannec, C., Msadek, R., and Lique, C.: The seasonal cycle of the Arctic Ocean in a summer ice-free climate : changes, driving processes and consequences., EGU General Assembly 2025, Vienna, Austria, 27 Apr–2 May 2025, EGU25-10639, https://doi.org/10.5194/egusphere-egu25-10639, 2025.

EGU25-10970 | ECS | Posters on site | OS1.1

Impacts of Seasonal and Interannual Sea Ice Changes on Arctic Ocean Stratification 

Haohao Zhang, Andrea Storto, Xuezhi Bai, and Chunxue Yang

Seasonal and interannual variations in Arctic Ocean stratification significantly influence the vertical exchange of heat, salt, nutrient fluxes and the surface ice cover. On the seasonal scale, Arctic stratification is mainly influenced by ice melting/freezing processes. We used a one-dimensional (1D) coupled sea ice-ocean model to understand the effects of ice melting/freezing processes on stratification and their feedback on the ice itself. This 1D model can accurately simulate observed seasonal changes in the vertical structure of the upper Arctic Ocean. Then, we prevent the model from releasing meltwater into the ocean or maintaining a constant ice cover during the melting season, in a series of decoupling experiments, which reveal the following points: In summer, meltwater has negative feedback on ice melting by insulating a portion of the solar radiation into the Near Surface Temperature Maximum (NSTM); sea ice changes primarily manifest as the well-known albedo feedback. In winter, meltwater has minimal impact in strongly stratified regions, however, in weakly stratified regions, meltwater promotes freezing by hindering the heat upward mixing from Atlantic warm water (AWW); In regions with less ice cover, if there is no meltwater to counteract the stronger mixing due to the winter atmosphere-ocean energy exchange, the AWW can mix dramatically upwards, and even melt the ice in winter. In contrast, if there is enough ice cover to insulate the atmosphere from the ocean, strong mixing will not occur, even without meltwater. The 1D-model study demonstrates that, as Arctic sea ice diminishes and Atlantification intensifies in the future, the impact of meltwater on the ice-ocean system will become increasingly significant. For multiyear scales, we utilized CIGAR historical ocean reanalysis (1961-2022) data and extensive in situ observations from the Arctic Ocean to investigate the long-term variations in Arctic Ocean stratification. The results show a strong correlation between stratification strength and freshwater content in the Arctic Ocean. However, over the past decade, while the freshwater content in the Beaufort Sea has remained regionally stable, stratification strength has shown a decline. This suggests that, with the retreat of sea ice, atmospheric energy input is becoming increasingly significant in influencing stratification.

How to cite: Zhang, H., Storto, A., Bai, X., and Yang, C.: Impacts of Seasonal and Interannual Sea Ice Changes on Arctic Ocean Stratification, EGU General Assembly 2025, Vienna, Austria, 27 Apr–2 May 2025, EGU25-10970, https://doi.org/10.5194/egusphere-egu25-10970, 2025.

EGU25-11030 | Posters on site | OS1.1

Arctic to the North Atlantic connectivity using Montgomery Potential on neutral density surfaces 

Yevgeny Aksenov, Stefanie Rynders, George, A.J. Nurser, Alex Megan, Stephen Kelly, and Andrew Coward

How Arctic waters end up in the North Atlantic? We have examined ocean connectivity for neutral density surfaces by developing Montgomery Potential for the NEMO ocean model. The method is coded in Python, enabling calculating geostrophic flow on pseudo-neutral density surfaces. We have analysed global NEMOv4.2 at 1/12 degree runs for the 2008-2021 period for ocean connectivity from the Arctic to the North Atlantic. We have also mapped water-mass pathways by releasing on neutral density surfaces 25.8-28.2 in the Laptev Sea, in the Denmark and Davis Straits, near the Flemish Cap and on the West European Shelf, then by tracking particles forward and backward. The transient times from the Laptev Sea to the Great Banks are of about 6 years; across the Atlantic – another 6 yrs; and the Laptev Sea to the West European Shelf is of about 16 years in total. The model transient times were compared to those from the observed Technetium spread to the Western Barents Sea and to the regions around Greenland. This presented work has been funded from the European Union's project EPOC, EU grant 101059547 and UKRI grant 10038003, EC Horizon Europe project OptimESM “Optimal High Resolution Earth System Models for Exploring Future Climate Changes”, grant 101081193 and UKRI grant 10039429, and from the UK NERC projects LTS-M BIOPOLE (NE/W004933/1), CANARI (NE/W004984/1) and UK LTS-S Atlantic Climate & Environment Strategic Science –ATLANTIS. For the EU projects the work reflects only the authors' view; the European Commission and their executive agency are not responsible for any use that may be made of the information the work contains. We acknowledge the use of ARCHER UK National Supercomputing and JASMIN.

How to cite: Aksenov, Y., Rynders, S., Nurser, G. A. J., Megan, A., Kelly, S., and Coward, A.: Arctic to the North Atlantic connectivity using Montgomery Potential on neutral density surfaces, EGU General Assembly 2025, Vienna, Austria, 27 Apr–2 May 2025, EGU25-11030, https://doi.org/10.5194/egusphere-egu25-11030, 2025.

EGU25-12218 | ECS | Posters on site | OS1.1

Arctic spin-up under melting sea ice  

Xiaoyan Wei, Chris Wilson, and Sheldon Bacon

The Arctic sea ice has been rapidly declining due to climate change, with significant impacts on subpolar ocean dynamics and mid-latitude regional weather patterns. However, climate models (e.g., CMIP5 and CMIP6) show a large inter-model spread in projected sea ice changes, often underestimating the observed decline. This discrepancy may result from the poor representation of key ocean heat transport processes in the Arctic Ocean. Using a high-resolution global ocean-sea ice model (NEMO-SI3) with a 1/12° grid, forced at the surface by the Earth System Model UKESM1.1, we explored how atmospheric forcings, boundary currents, energetics, and horizontal/vertical mixing change with the declining Arctic sea ice from 1990 to 2100 under the SSP3-7.0 scenario. We investigated how these changes in the Arctic Ocean drive upward heat fluxes from Atlantic Water (AW) beneath the halocline to the ocean surface, and quantified their contribution to the ocean surface heat budget in an increasingly energetic Arctic. Finally, we demonstrated the critical role of enhanced upward AW heat flux in accelerating sea ice decline under a warming climate. Our study underscores the potential importance of processes linked to Arctic spin-up in the facilitation of heat transfer from the warm, sub-surface Atlantic Water to the cold, fresh Arctic Ocean surface, accelerating sea ice melt and influencing the global climate system. 

How to cite: Wei, X., Wilson, C., and Bacon, S.: Arctic spin-up under melting sea ice , EGU General Assembly 2025, Vienna, Austria, 27 Apr–2 May 2025, EGU25-12218, https://doi.org/10.5194/egusphere-egu25-12218, 2025.

EGU25-12510 | Orals | OS1.1

Future Changes in Arctic River Runoff and its Impact on the Ocean 

Tahya Weiss-Gibbons, Clark Pennelly, Tricia Stadnyk, and Paul Myers

Freshwater plays an important role in the Arctic Ocean, where stratification and circulation are dominated by salinity. River runoff is an important piece of the Arctic freshwater budget, and it is changing rapidly with climate change. River runoff into the Arctic Ocean has been increasing in both amount and temperature, a trend which is expected to continue into the future. We look at forcing a state of the art ocean model with future runoff projections for the Arctic Ocean, to understand how this increase in runoff temperature and flow impacts the changing Arctic. Runoff projections are produced using the A-HYPE hydrological model, over the Arctic drainage basin, giving both runoff and river temperature data. These are used to force a regional configuration of the Nucleus for European Modelling of the Ocean (NEMO) framework 4.2, with a nested 1/12 degree Arctic Ocean. As opposed to traditional methods of linearly scaling runoff for future projections, combining hydrological model output with ocean models gives a more complete spatially and temporally varying picture of runoff. Changes in river runoff has implications for sea ice futures, circulation patterns, freshwater storage and release of freshwater to lower latitudes.

How to cite: Weiss-Gibbons, T., Pennelly, C., Stadnyk, T., and Myers, P.: Future Changes in Arctic River Runoff and its Impact on the Ocean, EGU General Assembly 2025, Vienna, Austria, 27 Apr–2 May 2025, EGU25-12510, https://doi.org/10.5194/egusphere-egu25-12510, 2025.

EGU25-13327 | Posters on site | OS1.1

Estimated Transport of Atlantic Water to the Arctic Ocean Using Observed and Simulated Radionuclides 

Yanchun He, Mu Lin, and Emil Jeansson

The pathways and time scales of Atlantic Water (AW) transport to the Arctic Ocean (AO), and its subsequent return to the North Atlantic, are critical for understanding the ocean’s role in modulating heat, salinity, and the sequestration of anthropogenic trace gases.

To quantify the time scales of AW transport by advective and diffusive processes, we applied the Inverse-Gaussian Transit-Time Distribution (IG-TTD) method, utilizing a suite of radionuclide datasets. The IG-TTD parameters—mean transit time (Γ), representing advection, and width (Δ), characterizing diffusion—were derived from radionuclides such as Iodine-129 (I-129), Technetium-99 (Tc-99), and Uranium-236 (U-236). These radionuclides originate primarily from two European nuclear reprocessing facilities. To complement observational data, idealized tracers from an ocean general circulation model (OGCM) were incorporated, including Boundary Impulse Response (BIR) tracers and dilution tracers. BIR tracers constrained the mixing ratio (Δ/Γ) in the IG-TTD, while the dilution tracer refined source functions for improved accuracy.

Preliminary results indicate a transit time of approximately 25 years from the Iceland-Scotland Ridge to the central Arctic Ocean, with mixing ratios (Δ/Γ) ranging between 0.2 and 0.4—significantly lower than the typical value of ~1 observed for CFCs/SF6 tracers transitioning from surface ventilation to the ocean interior. A dilution factor on the order of 1000 was necessary to scale source functions and avoid unrealistically high mean ages. Transit times showed substantial variability within the same region, depending on radionuclide type and sampling period, highlighting the impact of strong synoptic variability in ocean currents on measurement uncertainties. Additionally, dual-tracer constraints on mixing ratios, comparisons of transit times derived from radionuclides versus ventilation tracers, and assessments against model-simulated BIR tracers are discussed.

How to cite: He, Y., Lin, M., and Jeansson, E.: Estimated Transport of Atlantic Water to the Arctic Ocean Using Observed and Simulated Radionuclides, EGU General Assembly 2025, Vienna, Austria, 27 Apr–2 May 2025, EGU25-13327, https://doi.org/10.5194/egusphere-egu25-13327, 2025.

In the Arctic, ocean surface waves are becoming more energetic. This is due to the larger wind fetch caused by decreased sea ice cover in summer and delayed sea ice formation in fall. These changes, driven by global climate change and regional warming, are projected to be more extreme in the future. Surface gravity waves are a key factor in coastal erosion and flooding, which are already negatively affecting coastlines in the Arctic (Casas-Prat & Wang 2020). Understanding and quantifying surface waves evolution is therefore particularly important for the communities that live along the coasts of the Canadian Arctic Archipelago (CAA), yet it has not been investigated with modeling.

We used the spectral wave model Wavewatch III® (Tolman 1997, 1999a, 2009) to simulate gravity waves formation and propagation for the entire Arctic and the North Atlantic over 2002-2022, using output from a regional 1/4° NEMO simulation. Simulations reveal a positive wave height trend in Baffin Bay and locations near the sea ice margin in the Barents, Kara and East Greenland Seas. A positive trend is found in Baffin Bay from June to October (max 0.25 m/y), where peak wave heights of 4-6 m are also observed during fall, in the second decade of the run. This highlights the importance of combined delay in seasonal sea ice formation and storm activity in the CAA, with storms more likely to produce high waves conditions during fall.

Further ongoing work will: 1) analyze the impact of waves on coastal erosion; 2) project ocean and wave conditions under CMIP6 forcing: the numerical ocean model NEMO, at 1/4° resolution, and a nested grid over the CAA will allow WW3 wave simulations to be projected over 2100.

How to cite: Pochini, E. and Myers, P.: Simulated wave evolution and coastal erosion in the Arctic and the Canadian Arctic Archipelago (2002-2022), EGU General Assembly 2025, Vienna, Austria, 27 Apr–2 May 2025, EGU25-13701, https://doi.org/10.5194/egusphere-egu25-13701, 2025.

EGU25-16814 | ECS | Posters on site | OS1.1

Changing trends in Arctic sea ice volume 

Rebekka Jastamin Steene and Martin Rypdal

Arctic sea ice has undergone massive changes in the latest decades. Not only has the ice extent seen a great reduction over the satellite era, sea ice thickness is also strongly altered as a result of changing climate conditions. In this study, we look at sea ice volume in the Arctic and show how its response to increasing temperatures has changed in recent years. Using a Bayesian statistical framework, we look at reanalysis data of sea ice volume and detect changepoints in trends. We have identified an abrupt change in Arctic sea ice volume relative to global mean temperature. Spatial analysis shows that this signal of abrupt change primarily stems from loss of sea ice thickness in the Canadian Basin and Beaufort Gyre region. We compare these findings with CMIP6 Earth system models and find similar behaviour in several models. Further, we have conducted experiments with the NorESM model to better describe the mechanisms of this abrupt change, and to see how the sea ice volume behaves if global warming is later reversed.

How to cite: Steene, R. J. and Rypdal, M.: Changing trends in Arctic sea ice volume, EGU General Assembly 2025, Vienna, Austria, 27 Apr–2 May 2025, EGU25-16814, https://doi.org/10.5194/egusphere-egu25-16814, 2025.

EGU25-17101 | ECS | Orals | OS1.1

How reversible are carbonate chemistry changes triggered by future Arctic sea ice loss? 

Eike E. Köhn, Lester Kwiatkowski, James C. Orr, Guillaume Gastineau, and Juliette Mignot

The ongoing rapid decline in Arctic sea ice is considered as a tipping element of our climate system. It is exposing a warmer and more acidified ocean directly to the atmosphere, permitting greater light penetration and enhanced exchange of heat, momentum, and gases across the air-sea interface. Earth system models project that these thermal and biogeochemical changes will dramatically perturb Arctic Ocean carbonate chemistry. As one of the consequences, the projections indicate that the seasonal maximum in surface ocean pCO2 generally shifts from winter to summer during this century. Yet, it is unknown whether such biogeochemical changes in the Arctic would be reversible, if we managed to reduce atmospheric carbon dioxide concentrations. Here we analyse the reversibility of Arctic biogeochemistry changes using idealised 1pctCO2-cdr simulations from six earth system models. These model experiments simulate a 140-year period of 1% annual atmospheric CO2 increase (rampup to 4x preindustrial levels), followed by a 140-year period of 1% annual CO2 decrease (rampdown). Our results indicate that the present day pCO2 cycle is largely recovered when atmospheric CO2 returns to preindustrial levels. However, most models exhibit substantial hysteresis, particularly during summer, where surface ocean pCO2 remains more elevated during the rampdown phase relative to the rampup phase (difference in Arctic average up to 60 𝜇atm pCO2 for the same atmospheric CO2 levels). Despite model differences, their projections consistently show pronounced regional variability in the pCO2 hysteresis, with high hysteresis occurring for example in the Nordic Seas and the Barents Sea. Our results indicate that the pCO2 hysteresis is particularly sensitive to sea surface temperature and net primary productivity, both of which show regionally varying hysteresis as well. These findings underscore the complex impacts of Arctic sea ice loss on biogeochemical cycles, emphasising the importance of accounting for hysteresis in CO2 overshoot scenarios and climate mitigation strategies.

How to cite: Köhn, E. E., Kwiatkowski, L., Orr, J. C., Gastineau, G., and Mignot, J.: How reversible are carbonate chemistry changes triggered by future Arctic sea ice loss?, EGU General Assembly 2025, Vienna, Austria, 27 Apr–2 May 2025, EGU25-17101, https://doi.org/10.5194/egusphere-egu25-17101, 2025.

EGU25-17889 | ECS | Orals | OS1.1

Changes in phytoplankton bloom dynamics in the future Arctic Ocean from a Regional Ecological Model 

Lucia Gutierrez-Loza and Siv K. Lauvset

In the Arctic, where the effects of the changing climate are occurring faster than anywhere else on Earth, warming, sea-ice decline and changes in ocean circulation have already resulted in an overall increase of the marine primary productivity. According to global climate projections, the increased productivity is expected to continue in this region due to greater open-water habitats and larger growing seasons. Significant shifts in phytoplankton composition and an increasingly unstable community structure are also expected through the 21st century in response to climate change. Nevertheless, high uncertainties still exist in future net primary productivity (NPP) and the overall response of phytoplankton to climate change in the Arctic and subarctic regions.

This study assesses the effect of changing physical characteristics in the Nordic and Barents Seas on nutrient distribution and phytoplankton dynamics over the 21st century using the high-resolution NORWegian ECOlogical Model system (NORWECOM.E2E). The results show two distinct pathways of the phytoplankton response, differentiating Arctic conditions (i.e., Barents Sea) and Atlantic conditions (i.e., Nordic Seas). The Barents Sea, a shallow and well-mixed basin with persistent nutrient supply from the deep ocean to the surface, experiences a gradual intensification of the phytoplankton blooms towards the end of the century. This response is consistent with increasing temperatures, sunlight availability due to reduced sea-ice extent and the intensification of the vertical mixing.

In contrast, the Nordic Seas experience an abrupt change in the phytoplankton dynamics, with a sudden shift in the phytoplankton communities from a diatom-dominated to a flagellate-dominated bloom, according to the simulations. The rapid change in phytoplankton bloom dynamics is caused by an interplay between a shallowing mixed layer depth and changing nutrient consumption patterns by phytoplankton. These changes are consistent across climate scenarios SSP2-4.5, SSP3-7.0 and SSP5-8.5. However, the timing and magnitude of the changes vary significantly, with SSP3-7.0 showing the most abrupt changes.

As Arctic conditions continue at an accelerated pace, major implications for local and regional ecosystems are expected. These impacts will, most probably, not be limited to the Arctic region given its crucial role in the Earth’s system. Changes in phytoplankton bloom dynamics have the potential to impact the global carbon cycle by altering primary productivity and carbon export into the deep ocean, ultimately affecting the global climate.

How to cite: Gutierrez-Loza, L. and Lauvset, S. K.: Changes in phytoplankton bloom dynamics in the future Arctic Ocean from a Regional Ecological Model, EGU General Assembly 2025, Vienna, Austria, 27 Apr–2 May 2025, EGU25-17889, https://doi.org/10.5194/egusphere-egu25-17889, 2025.

EGU25-18826 | ECS | Posters on site | OS1.1

Projected Increase of Phytoplankton Carbon Exudation and Particle Formation in the Arctic Ocean until the End of the Century 

Moritz Zeising, Laurent Oziel, and Astrid Bracher

The Arctic Ocean is projected to become ice-free by the middle of the century, accompanied by changes in freshwater input, stratification, and warming of the upper ocean. The marine ecosystem is predominantly influenced by the availability of light and nutrients for phytoplankton, which form the base of the food web. With the projected changes of the physical environment throughout the course of the century, CMIP6 models suggest a general increase in Arctic net primary production. It is anticipated that phytoplankton shift from a light-limited state to nutrient limitation across large areas of the Arctic Ocean, potentially leading to increased exudation of organic carbon into the water column.

We briefly discuss the mechanisms driving the dynamics of organic carbon in the upper Arctic Ocean before focusing on long-term trends in Arctic biogeochemistry projected until 2100. Using an ocean general circulation sea-ice biogeochemistry model based on the IPCC Shared Socio-economic Pathway high-emission scenario SSP3-7.0, we observe regionally varying increases in exuded organic carbon, alongside enhanced formation of particulate organic carbon in the upper water column. These particles can either be transferred from the ocean to the atmosphere, acting as precursors to primary marine organic aerosols, or sink in the water column, contributing to carbon export. Our findings align with other recent studies, showing a shift from light to nutrient limitation in phytoplankton growth, particularly in regions experiencing retreat of the marginal ice zone. Our simulation indicates that diatoms are the primary contributors to organic carbon exudation and subsequent particle aggregation. However, some regions do not exhibit an overall increase in particulate organic carbon due to elevated remineralization rates. Overall, our projection provides an assessment of the impact of changes in the physical environment on phytoplankton dynamics and, consequently, on organic carbon pools in the upper Arctic Ocean. This work is part of the DFG Transregional Collaborative Research Centre 172 on Arctic Amplification.

How to cite: Zeising, M., Oziel, L., and Bracher, A.: Projected Increase of Phytoplankton Carbon Exudation and Particle Formation in the Arctic Ocean until the End of the Century, EGU General Assembly 2025, Vienna, Austria, 27 Apr–2 May 2025, EGU25-18826, https://doi.org/10.5194/egusphere-egu25-18826, 2025.

EGU25-20584 | Orals | OS1.1 | Highlight

 Atlantification advances into the Amerasian Basin of the Arctic Ocean  

Igor Polyakov

Atlantification—the northward inflow of anomalous waters and biota from the Atlantic into the polar basins—has wide-ranging climatological ramifications.  Sustained observations demonstrated that, contrary to the global climate model projections, atlantification has already advanced into the Amerasian Basin of the Arctic Ocean, having a significant impact on the physical and ecological components of the climate system. The primary example is the rapidly diminishing sea ice in the Siberian Arctic Ocean (SAO), which is caused by the weakened ocean stratification and amplified heat fluxes. These sea ice thickness anomalies caused by atlantification persist across the Arctic region and are prevalent along the entirety of the Transpolar Drift. Furthermore, we observe the transition of the central SAO to conditions resembling those in the eastern SAO 5-7 years ago and the emergence of a powerful ocean-heat/ice-albedo feedback, which accelerates sea-ice losses. The eastern SAO is still strongly stratified but collaborative international observations demonstrate that the atlantification-driven shoaling of warm, salty, and nutrient-rich intermediate waters already has important ecological consequences there. Disentangling the role of atlantification in multiple and complex high-latitude changes should be a priority in future modeling and observational efforts.


How to cite: Polyakov, I.:  Atlantification advances into the Amerasian Basin of the Arctic Ocean , EGU General Assembly 2025, Vienna, Austria, 27 Apr–2 May 2025, EGU25-20584, https://doi.org/10.5194/egusphere-egu25-20584, 2025.

EGU25-20633 | Orals | OS1.1

On the importance of air-sea ice-ocean coupling in the Barents Sea 

Wieslaw Maslowski, Younjoo Lee, Robert Osinski, Jaclyn Clement Kinney, and Mark Seefeldt

Recent studies of Arctic Amplification (AA) suggest that the Arctic has been warming between three to four times faster compared to the global average. The loss of sea ice in the Arctic has been one of the most evident manifestations of the warming climate over the past several decades. This decline has been most pronounced in the Barents/Kara seas during winter and in the western Arctic during summer

Changes in the Arctic sea ice cover can be both a cause and a consequence of anomalous atmospheric and oceanic warming. In the case of the winter trend, some earlier studies have suggested that factors other than atmospheric forcing, e.g., ocean heat transport and storage, are responsible for the observed sea ice retreat. Moreover, results from models participating in Phase 6 of the Coupled Model Intercomparison Project (CMIP6) suggest an emergent constraint linking oceanic heat convergence to declining sea ice cover in the Arctic Ocean. At the same time, significant biases in individual simulated sea ice states persist, resulting in the continued large CMIP model spread. The limited skill in the historical simulations of the Arctic climate system hinders the interpretation of their results and affects the reliability of their future projections.


In this presentation, we will address some of these limitations, focusing on the importance of oceanic heat transport from the Nordic Seas, its convergence and impact on the sea ice over the Barents Sea, and the remaining outflow into the central Arctic. Results from the Regional Arctic System Model (RASM), at varying spatial resolutions and forced with an atmospheric reanalysis or fully coupled, will be evaluated to demonstrate a relatively wide range of the simulated volume fluxes into the Barents Sea. Apparent coupled linkages between oceanic volume and heat fluxes, sea ice cover, and the oceanic heat convergence over the Barents Sea will be demonstrated. The importance of spatial resolution in representing some critical processes related to ocean mesoscale, sea ice characteristics, and air-sea coupling in the region will be discussed. Finally, the need for expanded long-term measurements to reduce uncertainties in the observational estimates of oceanic fluxes in and out of the Barents Sea will be rationalized.

How to cite: Maslowski, W., Lee, Y., Osinski, R., Clement Kinney, J., and Seefeldt, M.: On the importance of air-sea ice-ocean coupling in the Barents Sea, EGU General Assembly 2025, Vienna, Austria, 27 Apr–2 May 2025, EGU25-20633, https://doi.org/10.5194/egusphere-egu25-20633, 2025.

EGU25-21413 | Orals | OS1.1

The Effects of Salinity and Stratification on Rapid Sea Ice Advance in the Arctic Ocean  

Julian Schanze, Scott Springer, Jessica Anderson, Michael Town, Ee Qi Lim, David Treadwell, Zhiwei Zhou, Sicheng Zhou, and Oleg Melnichenko

The annual sea ice minimum extent in the Arctic Ocean has decreased almost two-fold since the advent of satellite observations in the 1970s, leaving more open water before the fall freeze-up.  Here, we leverage a combined dataset from the 2022 NASA Salinity and Stratification at the Sea Ice Edge (SASSIE) field program to elucidate the central hypothesis that drove SASSIE: Does surface salinity stratification due to sea ice melt, precipitation, and riverine inputs lead to changes in the rates or extent of autumnal sea ice advance? The SASSIE study region in the Beaufort Sea is stratified both by melting sea ice in the summer and riverine discharge. We leverage measurements of oxygen isotopes as well as colored dissolved organic matter (CDOM) to trace the origins of fresher water at the surface.

In addition to an in-depth analysis of in situ data, we use the General Ocean Turbulence Model (GOTM) for individual profiles as well as the Regional Ocean Modeling System (ROMS) initialized and forced with observations from the SASSIE field campaign. These observations include temperature and salinity from the salinity snake instrument at 1-2cm depth, shipborne thermosalinograph (4m) and underway conductivity-temperature-depth (uCTD) measurements (5-100m), acoustic Doppler current profiler (ADCP) data, as well as meteorological and net heat flux observations. In realistically forced runs, we re-create the observations during the month-long cruise. We then modify the stratification to both increase and decrease salinity stratification to assess the importance of salinity stratification on the autumnal sea ice advance. We compare these model outputs to satellite-derived freeze-up data as well as in situ observations from autonomous platforms in the area. Preliminary results show a strong control of salinity on rapid sea ice advance, in which areas that are highly stratified freeze significantly faster than areas of deeper or weaker stratification.

Based on this hypothesis, we present a novel way of modelling the autumnal Arctic Sea Ice advance using a Convolutional Long-Short-Term Memory (LSTM) Neural Network model. In this machine learning approach, we demonstrate that the inclusion of the experimental merged salinity OISSS v3 dataset derived from the Soil Moisture and Ocean Salinity (SMOS) and Soil Moisture Active Passive (SMAP) satellites significantly improves forecast accuracy of sea ice concentration in our study area, which encompasses the East Siberian, Chukchi, and Beaufort Seas. The model is based on 8 years of training data and tested using 3 years of evaluation data. Using this 60-day forecast, we show that the spatial forecasting pattern of sea ice concentration is significantly improved. This is further illustrated in an ablation study, in which we find sea surface salinity to be the 4th most important predictive term after sea surface temperature, net heat flux, and sea ice concentration.

Through these studies, we show the connection between the terrestrial water cycle, oceanic freshwater fluxes, and sea ice formation in the Arctic, and present a novel technique of sea ice prediction that will become increasingly useful as the Arctic becomes more ice free.

How to cite: Schanze, J., Springer, S., Anderson, J., Town, M., Lim, E. Q., Treadwell, D., Zhou, Z., Zhou, S., and Melnichenko, O.: The Effects of Salinity and Stratification on Rapid Sea Ice Advance in the Arctic Ocean , EGU General Assembly 2025, Vienna, Austria, 27 Apr–2 May 2025, EGU25-21413, https://doi.org/10.5194/egusphere-egu25-21413, 2025.

EGU25-2164 | ECS | PICO | EOS1.6

Communicating uncertainty in extreme event attribution to the media 

Johanna Knauf, Theresa Zimmermann, Jonas Schröter, Miriam Tivig, and Frank Kreienkamp

This work examines the extent and form in which uncertainty of Extreme Event Attribution (EEA) results is best communicated to stakeholders. To achieve this, we develop communication materials in both text and graphics and test them for accuracy and accessibility through guided interviews with scientists and stakeholders.

Extreme weather events pose significant challenges for human civilization. Climate change can influence both the intensity and probability of specific extreme weather events, such as heatwaves or heavy rainfall. EEA has become an established tool to answer public questions about the contribution of climate change to such events. However, the results of EEA studies are often accompanied by considerable uncertainties. Communication of results, including an accessible representation of uncertainty, is therefore a fundamental necessity in this field of research, extending beyond the general effort to make scientific findings accessible to the public. Media representatives, who often bridge the gap between attribution scientists and the public, are therefore key stakeholders in this research.

We present the current state of research on communicating uncertainties in this field and outline our iterative approach to working with attribution scientists and media representatives alike to determine what should be communicated and how to communicate it effectively. Finally, we evaluate which communication materials are both relevant and accessible, and we reflect on the lessons learned for future communication efforts concerning EEA results.

This study is part of ClimXchange, which aims to enhance the usability of climate science for societal stakeholders. ClimXchange is embedded within the ClimXtreme research consortium, funded by the German Federal Ministry of Education and Research (BMBF), which focuses on extreme weather events in the context of climate change.

How to cite: Knauf, J., Zimmermann, T., Schröter, J., Tivig, M., and Kreienkamp, F.: Communicating uncertainty in extreme event attribution to the media, EGU General Assembly 2025, Vienna, Austria, 27 Apr–2 May 2025, EGU25-2164, https://doi.org/10.5194/egusphere-egu25-2164, 2025.

EGU25-4471 | PICO | EOS1.6

Communicating uncertainty in weather forecasts: the role of forecast changes 

Gabriele Messori, Stephen Jewson, and Sebastian Scher

Skilful weather forecasts help users make sound decisions when faced with potentially hazardous climatic conditions. However, this beneficial result may be reduced or negated in the absence of an effective communication of forecast uncertainty. On average, forecast skill improves for shorter lead times, which implies that we expect differences between successive forecasts. While there is a vast literature on the communication and visualisation of weather forecast uncertainty, little attention has been dedicated to communicating forecast changes to non-specialist audiences. Nonetheless, this is a key dimension of forecast uncertainty, and there are several user cases in which providing information about possible future changes in weather forecasts can improve their use.

An illustrative example is the situation in which a user has to decide whether to act now or wait for the next forecast. This can be as simple as a professional deciding whether to drive or not to a client on a day for which extremely heavy rainfall is forecasted, potentially leading to flash flooding. Cancelling well-ahead of time makes rescheduling easier, yet the forecast has a larger chance of being wrong. Cancelling on short notice minimises the chance of a false alarm, but poses greater logistical challenges for both the professional and the client. Something as simple as knowing how often the later forecast is better – for example knowing that 9 times out of 10 a heavy rainfall forecast issued one day ahead is better than one issued 5 days ahead – can qualitatively help the non-specialist users in this fictitious example to make a more informed decision.

In this contribution, we consider a variety of cases in which information on forecast changes may be of value. We then present a set of easily interpretable metrics making information on such changes accessible to non-specialist users.

How to cite: Messori, G., Jewson, S., and Scher, S.: Communicating uncertainty in weather forecasts: the role of forecast changes, EGU General Assembly 2025, Vienna, Austria, 27 Apr–2 May 2025, EGU25-4471, https://doi.org/10.5194/egusphere-egu25-4471, 2025.

Whether its memories of a cold, frosty Christmas or an August bank holiday beach trip interrupted by rain, many cultural, sporting, and social events in the United Kingdom have strong associations with particular weather conditions. As the average global temperature increases, the impacts of a changing climate are likely to be felt across many aspects of British life, including in the public’s experiences of these popular events. Several recent works conducted by the UK Met Office have sought to make the local day-to-day impacts of climate change more understandable for the public by exploring likely climatic conditions of popular events by the 2050s. These works have received strong engagement from the public, demonstrating the demand for relevant and understandable climate information.

We serve this demand by using the 2018 UK Climate Projections (UKCP18) and HadUK-Grid observations data to evaluate how climate change will affect the climatology of a diverse range of British social, cultural, and sporting events. To explore and communicate the uncertainties in UKCP18 due to inherent model biases, several bias correction methods are applied to the data and the resulting data is analysed together to give an improved uncertainty range. The research will focus on assessing changes to temperature variables at global warming levels of 1.5°C and 3.0°C to illustrate these two future scenarios and the uncertainty within each scenario.

We will show that some events are likely to have a significantly altered climatology which is likely to substantially change the nature of these events or force them to change when they occur during the year to give the best chance of having favourable climatic conditions. By assessing the impact of climate change on popular British events such as the London Marathon and Glastonbury Festival the findings of this research will prove useful in communicating the impacts of climate change in a way which will resonate with the British public.

How to cite: Woods, L., Pope, J., and Fung, F.: Impacting on our Lives: Using British sports and culture to explain uncertainty in climate projections, EGU General Assembly 2025, Vienna, Austria, 27 Apr–2 May 2025, EGU25-9081, https://doi.org/10.5194/egusphere-egu25-9081, 2025.

Flood frequency analysis is a cornerstone of hydrologic studies, providing a probabilistic framework to relate the magnitude of extreme events to their frequency of occurrence. This methodology is critical for designing flood-related infrastructure, conducting economic evaluations of flood control projects, and delineating floodplains. However, its utility depends heavily on data quality, model selection, and parameter estimation, each of which introduces uncertainties that become especially significant for rare events.

This presentation will address key sources of uncertainty, including model choice, parameter inference methods, and sample size limitations. Strategies for incorporating these uncertainties into engineering practice are discussed, with an emphasis on probabilistic representations and innovative design approaches. An exceptional flood, a "black swan" event, is used to illustrate the paradox of increased uncertainty despite improved information. This case underscores the importance of expanding flood analyses through historical records, regionalization, and causal modeling, particularly in the context of a changing climate.

The presentation will be designed to foster cross-discipline exchange in the quantification of uncertainty in Earth Sciences.

How to cite: Viglione, A.: Flood Frequency Hydrology: Navigating Uncertainty in Flood Design, EGU General Assembly 2025, Vienna, Austria, 27 Apr–2 May 2025, EGU25-11466, https://doi.org/10.5194/egusphere-egu25-11466, 2025.

EGU25-13135 | PICO | EOS1.6

Visualization of uncertainties in 2D images 

Peter Dietrich, Husain Najafi, Michael Pelzer, and Solmaz Mohadjer

Two-dimensional (2D) images are often used to communicate the results of scientific investigations and predictions. Examples are weather maps, earthquake hazard maps and MRI slices. In contrast to statistical analyses of individual variables or time series, there are currently no established methods for visualizing the uncertainties in the 2D images. However, this would be necessary to make the information in the 2D images clear to scientists as well as to the non-expert public audiences in order to avoid misinterpretation and over-interpretation.

In this study, we demonstrate the challenges and approaches to uncertainty visualization using the case study of drought forecasting, which is relevant for climate adaptations and mitigations. A drought is a deviation (anomaly) from the parameter value expected from long-term data. In our case, the parameter under consideration is soil moisture, which is an important parameter for various environmental processes. The soil moisture can be used in combination with soil type to estimate the amount of water available to plants in the topsoil. If the amount of water available to plants according to the so-called percentile approach deviates significantly from the value expected from long-term data, this is referred to as an agricultural drought.

The drought forecast is based on ensemble modelling. This means that the results of various weather forecast models are used to predict the development of soil moisture for the period of the weather forecast. For each weather model used, a possible soil moisture development is predicted. Each of these is used for a drought forecast. The result of the ensemble modelling is therefore several forecasts, which can differ significantly. Due to the use of different weather models and the consideration of uncertainties in the models, the result of ensemble modelling is therefore a large number of drought forecast maps. When visualising the results, often only a map of the mean values resulting from the predictions is shown. If only the mean value is displayed, however, the information about a possible difference and thus the uncertainty of the predictions is lost. In other words: If individual cases from the ensemble predict the possibility of drought, this will not be clearly visible in the mean value map.

In this presentation, we will demonstrate and discuss different approaches to visualize the uncertainty in the prediction.

How to cite: Dietrich, P., Najafi, H., Pelzer, M., and Mohadjer, S.: Visualization of uncertainties in 2D images, EGU General Assembly 2025, Vienna, Austria, 27 Apr–2 May 2025, EGU25-13135, https://doi.org/10.5194/egusphere-egu25-13135, 2025.

EGU25-13260 | PICO | EOS1.6

Non-expert understanding of hazard maps: Insights from an online survey 

Peter Dietrich, Michelle Dietrich, Michael Pelzer, and Solmaz Mohadjer

Uncertainties are an unavoidable part of scientific research. Practical limits with regard to the number, accuracy and precision of available observations as well as limitations in terms of methodological accuracy and modelling contribute to the fact that even the most elaborate and meticulous forecasts can never be deterministic and no completely reliable and accurate predictions for decision-making can be achieved. In concrete applications, a sufficient understanding of the accuracy and reliability of scientifically based predictions is important, for example in disaster prevention or resource planning. For example, natural hazard maps are primarily intended for those who have the necessary expertise to understand them. However, they are also used in their unaltered form by non-experts for decision-making, many of whom are unfamiliar with the scientific background and implications of the map.

We address this problem using an earthquake hazard map which can be relevant to non-expert audiences when seeking advice on purchasing a house or obtaining insurance. In order to understand how non-experts perceive a scientifically compiled earthquake hazard map, we conducted an online survey with 229 participants. This was done as part of the 2024 Science & Innovation Days (a public engagement event) in Tübingen, Germany. Participants were asked about their first impression of the map in terms of information content, any need for further explanation and possible actions to take. Other questions assessed participants’ previous experiences and self-assessment of hazard perceptions.

In this presentation, we will discuss the survey results and share lessons learned when communicating information that contains uncertainty with non-expert audiences.

How to cite: Dietrich, P., Dietrich, M., Pelzer, M., and Mohadjer, S.: Non-expert understanding of hazard maps: Insights from an online survey, EGU General Assembly 2025, Vienna, Austria, 27 Apr–2 May 2025, EGU25-13260, https://doi.org/10.5194/egusphere-egu25-13260, 2025.

Working with environmental data means dealing with complex processes, limited data (in space and/or time) and the impossibility of setting up controlled experiments, leading to uncertain predictions of system behaviour.

In the field of statistical hydrology, many efforts have been made during the last decades to provide methods to quantify uncertainty, but the common practice of infrastructure design has not yet incorporated them. This may be due to several reasons, including the complexity of the methods, which are often difficult to apply in most everyday cases, and regulations that "favour" well-established requirements.

Here we present the "uncertainty compliant design flood estimator" (UNCODE) method, which accounts for aleatory uncertainty in the estimation of the design flood value. The method provides a corrected design value and is easy to use for practical purposes as simplified formulae are provided to quantify the correction factor. However, in addition to its practical application, it can also be used to compare different models with different levels of uncertainty and to highlight the "cost" of uncertainty.

Finally, its mathematical formulation allows a direct link to be made between the classical approach to hydrological design, based on a fixed hazard level (or return period), and a risk-based design approach, which is widely recognised as a more flexible method but is not usually included in regulations.

How to cite: Ganora, D.: Uncertainty in flood frequency analysis and its implications for infrastructure design, EGU General Assembly 2025, Vienna, Austria, 27 Apr–2 May 2025, EGU25-15189, https://doi.org/10.5194/egusphere-egu25-15189, 2025.

EGU25-17779 | ECS | PICO | EOS1.6

Non-Expert Understanding of Hazard Maps: An Eye-Tracking Study  

Solmaz Mohadjer, Gökce Ergün, Sebastian G. Mutz, Max Schneider, Tom Schürmann, Michael Pelzer, and Peter Dietrich

Maps are the most commonly used means of visualizing and communicating natural hazard information to support decisions about risk mitigation. They are a product of hazard assessment studies which involve different input parameters with uncertainties relevant to decision making. This process is further complicated by the subjective uncertainties that arise in the audience when confronted with the visualization of hazard information. 

Natural hazard maps are primarily designed to be used by experts, but they are also used in their unaltered form to communicate with non-experts, many of whom are unfamiliar with the map’s scientific background and implications. Previous studies focus mainly on evaluating such maps with expert groups (e.g., directly involved stakeholders and authorities), with less attention on non-experts (e.g., the public audiences) who are confronted with these maps before purchasing a house, getting insurance or making other critical decisions. 

To address this gap, our study investigates how well hazard maps are understood and interpreted by non-expert audiences. We tested two earthquake hazard maps of Germany that differ in color palettes (rainbow vs. colorblind-friendly and perception-optimized yellow-orange-red-brown color palettes) and data classification schemes (algorithmic Fisher vs. quasi-logarithmic classification schemes). We showed both maps to 20 non-expert participants during the 2024 Science & Innovation Days (a public engagement event) in Tübingen, Germany. Participants answered map-reading and hazard perception questions (e.g., participants were asked to read off the hazard level for a given city, and to compare hazard levels between for a pair of cities) while their eye movements were monitored with eye-tracking software. 

To identify if either map improved map reading and hazard perception, participants’ responses were scored, analyzed and compared using a two-sample Mann–Whitney U and Fisher’s Exact tests. In general, the differences detected in participants’ responses were not statistically significant, perhaps due to the small sample size. Still, we observed that nearly all participants who used the redesigned map (8 out of 9) correctly read the hazard level for a city while only 33% (3 out of 9 participants) who used the rainbow color map responded correctly.

Eye-tracking data were used to analyze focus-metrics. Composite heatmaps accumulating the duration of eye fixations of all participants indicate that their eye movements were focused more on the high hazard zones and the corresponding values shown on map legend when answering questions using a hazard map redesigned to use best practices for hazard perception.

To quantify these differences, the ratio of fixations on high-hazard zones to total fixations on the map were calculated for both map versions. The data were tested for normality and the statistical significance of the differences were evaluated using Independent Samples t-tests for equal variances. While the results were not statistically significant, participants viewing the redesigned map showed a greater number of fixations on high-hazard zones compared to the participants viewing the original map, with a moderate effect size. We note tendencies in the data that encourage the repetition of the experiment with a larger sample size.

How to cite: Mohadjer, S., Ergün, G., Mutz, S. G., Schneider, M., Schürmann, T., Pelzer, M., and Dietrich, P.: Non-Expert Understanding of Hazard Maps: An Eye-Tracking Study , EGU General Assembly 2025, Vienna, Austria, 27 Apr–2 May 2025, EGU25-17779, https://doi.org/10.5194/egusphere-egu25-17779, 2025.

A presentation of emerging themes and lessons learnt from examples of best practice in uncertainty quantification and communication relevant to climate services.  Drawn from existing literature and reports, and from a community engagement workshop.

  • Consider the climate risks that are of most concern to the audience. 
  • Use language the audience is familiar with (don’t say uncertainty).
  • The precision of uncertainty information should be relevant to the situation.
  • Understand existing narratives about climate uncertainty.
  • Use communication about uncertainty to build trust.
  • Be aware of deep uncertainty.

Standardised approaches to uncertainty communication should consider not only the climate science component, but also the complexities regarding socio-economic vulnerability.

Climateurope2, is a Horizon Europe project with a consortium of 33 parties from 13 countries that includes intergovernmental institutions such as the World Meteorological Organisation, social sciences, humanities and STEM expertise, assurance providers, SMEs, and standardisation bodies. Together we are building a community of practice for the standardisation and support of climate services.

How to cite: Pascoe, C., Dankers, R., Domingo, X., and Pagé, C.: Don't say uncertainty: preliminary best practices and emerging themes for uncertainty quantification and communication in climate services from the Climateurope2 project., EGU General Assembly 2025, Vienna, Austria, 27 Apr–2 May 2025, EGU25-18364, https://doi.org/10.5194/egusphere-egu25-18364, 2025.

The recent COVID-19 pandemic highlighted the need to effectively communicate forecasts and their uncertainty. This is especially important if the aim is to minimize the risk of misinformation and poorly-informed decision-making. Both the IPCC and the Sendai Framework for Disaster Risk Reduction have identified risk communication, complexity and uncertainty as major challenges to decision-making, and call for better understanding of how existing risk communication practices are perceived by those affected and those making decisions.

Despite these calls, many geoscientists, especially early career researchers, lack opportunities to discuss scientific uncertainty and explore ways to communicate uncertainty to different audiences, including the non-scientific publics. To address this demand, we organize the international training school “Understanding the Unknowns: Communicating Uncertainty as a Driving Force for Geosciences”, which is co-sponsored by the EGU and set to take place at the University of Tübingen in Germany from March 17 to 19, 2025. This in-person, three-day training school aims to equip Early Career Researchers with knowledge and skills needed to effectively account for and communicate uncertainty in geosciences with their peers as well as public audiences.

Some of the biggest challenges of training programs on uncertainty relate to the interdisciplinary nature of the concept: understanding and effectively communicating uncertainties requires knowledge and skill sets typically taught and researched across a range of diverse fields. Highlighting this interdisciplinary background, we combine insights from geoscientific uncertainty assessment and outputs (e.g., maps, interpretations, models, simulations, time series) with approaches from (visual) rhetoric, science communication, presentation research, and multimedia competence. 

Building on existing good practice, the training strives to equip geoscientists with the tools and skills they need to communicate uncertainty, help reduce misinformation, and enhance future decision-making. This will be done collaboratively through an interdisciplinary partnership between the Department of Geosciences, the Research Center for Science Communication at the Department of General Rhetoric, and Global Awareness Education at the University of Tübingen. The new approaches and exercises developed for this training will not only be practically applied in the training school, but also reflected and evaluated, including a pre-workshop survey addressing expectations and needs identified by the participants and a concluding qualitative evaluation.

In this presentation, we will discuss our multifaceted practices and strategies applied to foster skills in communicating uncertainty in geosciences, present the results of the accompanying survey and evaluation used in this training, and conclude with lessons learned and best practices recommended to further develop similar opportunities in the future.

How to cite: Pelzer, M., Dietrich, P., and Mohadjer, S.: Fostering Skills in Communicating Uncertainty in the Geosciences: a review of concepts, strategies and approaches applied in the training school “Understanding the Unknowns: Communicating Uncertainty as a Driving Force for Geosciences”, EGU General Assembly 2025, Vienna, Austria, 27 Apr–2 May 2025, EGU25-18655, https://doi.org/10.5194/egusphere-egu25-18655, 2025.

Sub-seasonal weather forecasting is notoriously difficult, particularly for the extra-tropics. Predictions must be probabilistic, and from weeks 3 or 4 onwards forecast distributions are often very close to model-climate distributions. Together, these facts make conveying a meaningful forecast to customers extremely difficult, and those forecasts are then very vulnerable to misinterpretation. Standard map-based graphical output can show little more than whether the forecast mean is for average, or above average or below average conditions – ostensibly a 3-category classification. And indeed “average” in this scheme can be interpreted variously as a genuine forecast of average, or a “no-signal” prediction, which cannot both be right.

So ECMWF is working towards a new two-layer brand of map-based sub-seasonal forecast products, that succinctly represent both the mean anomaly and the forecast uncertainty. We plan to call these “quantile-based weekly guidance maps”. The overarching aim has been to exploit much better than hitherto the information content of the sub-seasonal forecast system in a compact format. Once these first go public they will be classed as an “experimental product”. We hope for wide-ranging uptake, providing greater outreach for our forecasts than hitherto, to benefit multiple sectors of society.

The new graphical output can be summarised in a 3-by-3 matrix form where one dimension represents the mean anomaly and the other relative spread. So for example a mean anomaly around zero can either represent a high confidence, narrow distribution forecast of average conditions (a true forecast of “average”), or more commonly a no-signal forecast where forecast and climate distributions are much the same (= “we don’t know”), or less often an odd scenario in which forecast spread exceeds climate spread (= “very uncertain indeed”). The graphical versions of the new system, and the 9 classes, will be demonstrated using real ECMWF forecast examples. These will highlight how translating appropriately chosen mathematical metrics into suitable graphics, and on into plain language text, can lie at the heart of successful uncertainty communication. Clear documentation for users is another key requirement.

How to cite: Hewson, T.: Making Uncertainty in Sub-seasonal Weather Forecasts Intelligible, EGU General Assembly 2025, Vienna, Austria, 27 Apr–2 May 2025, EGU25-19375, https://doi.org/10.5194/egusphere-egu25-19375, 2025.

EGU25-21809 | ECS | PICO | EOS1.6

Immersed in Uncertainty: Discussing Uncertainty in Science in a Planetarium 

Jakub Stepanovic, Sandy Claes, and Jan Sermeus
Uncertainty is an inherent part of the nature of science (NoS), and its communication is essential to maintain scientific transparency and credibility. Yet, current teaching on the topic is insufficient, leaving many with naïve views of NoS. Following calls to integrate uncertainty as a core component of science education and support NoS instruction with real-world examples, we designed an interactive learning experience conveying uncertainties in planetary science stemming from missing data and using artificial intelligence for a planetarium lecture. We were particularly interested in how interaction in the immersive planetarium settings impacts the audience's engagement with the lecture and, thus, uncertainty in science. The experience was presented to adolescents and adults attending the planetarium, and we collected feedback from 343 participants. Here, we share insights from the development, discuss interactive methods that significantly improved the audience's engagement, and share the participants' perspectives on uncertainty in science. We conclude by examining the pillars of NoS to clarify and define the presence of uncertainty and provide considerations for science communicators and educators. 

How to cite: Stepanovic, J., Claes, S., and Sermeus, J.: Immersed in Uncertainty: Discussing Uncertainty in Science in a Planetarium, EGU General Assembly 2025, Vienna, Austria, 27 Apr–2 May 2025, EGU25-21809, https://doi.org/10.5194/egusphere-egu25-21809, 2025.

CC BY 4.0